Embed Size (px)
Citation preview
USITC Publication 3162March 1999
OFFICE OF INDUSTRIESU.S. International Trade CommissionWashington, DC 20436
Flavor and FragranceMaterials
UNITED STATES INTERNATIONAL TRADE COMMISSION
Vern Simpson
Robert A. Rogowsky
Address all communications toSecretary to the Commission
United States International Trade CommissionWashington, DC 20436
Director of Operations
Director of Industries
COMMISSIONERS
Marcia E. Miller, Vice Chairman
Lynn M. Bragg, Chairman
Carol T. Crawford
This report was prepared principally by
Eric Land
Energy, Chemicals and Textiles Division Energy, Petroleum, Benzenoid Chemicals, and Rubber and Plastics and Plastics Branch
Jennifer A. HillmanStephen Koplan
Thelma J. Askey
1 The information and analysis provided in this report are for the purpose of this report only.Nothing in this report should be construed to indicate how the Commission would find in aninvestigation conducted under statutory authority covering the same or similar subject matter.
i
PREFACE
In 1991 the United States International Trade Commission initiated its current Industry and TradeSummary series of informational reports on the thousands of products imported into and exportedfrom the United States. Each summary addresses a different commodity/industry area and containsinformation on product uses, U.S. and foreign producers, and customs treatment. Also includedis an analysis of the basic factors affecting trends in consumption, production, and trade of thecommodity, as well as those bearing on the competitiveness of U.S. industries in domestic andforeign markets.1
This report on Flavor and Fragrance Materials covers the period 1993 through 1997. Listed beloware the individual summary reports published to date on the energy, chemicals, and textiles sectors.
USITCpublication Publicationnumber date Title
Energy and Chemicals:
2458 November 1991 . . . . . . . . . . . . Soaps, Detergents, andSurface-Active Agents
2509 May 1992 . . . . . . . . . . . . . . . . . Inorganic Acids2548 August 1992 . . . . . . . . . . . . . . . Paints, Inks, and Related
Items2578 November 1992 . . . . . . . . . . . . . Crude Petroleum 2588 December 1992 . . . . . . . . . . . . . Major Primary Olefins2590 February 1993 . . . . . . . . . . . . . . Polyethylene Resins in
Primary Forms2598 March 1993 . . . . . . . . . . . . . . . . Perfumes, Cosmetics, and
Toiletries2736 February 1994 . . . . . . . . . . . . . . Antibiotics2739 February 1994 . . . . . . . . . . . . . . Pneumatic Tires and Tubes2741 February 1994 . . . . . . . . . . . . . . Natural Rubber2743 February 1994 . . . . . . . . . . . . . . Saturated Polyesters in
Primary Forms2747 March 1994 . . . . . . . . . . . . . . . . Fatty Chemicals2750 March 1994 . . . . . . . . . . . . . . . . Pesticide Products and
Formulations2823 October 1994 Primary Aromatics2826 November 1994 . . . . . . . . . . . . . Polypropylene Resins in
Primary Formsi2845 March 1995 . . . . . . . . . . . . . . . . Polyvinyl Chloride Resins in
Primary Forms
ii
PREFACE–ContinuedUSITCpublication Publicationnumber date Title
Energy and Chemicals—Continued:
2846 December 1994 . . . . . . . . . . . . . . . . . . . . Medicinal Chemicals, except Antibiotics
2866 March 1995 . . . . . . . . . . . . . . . . . . . . . . . Hose, Belting, and Plastic Pipe
2943 December 1995 . . . . . . . . . . . . . . . . . . . . Uranium and Nuclear Fuel2945 January 1996 . . . . . . . . . . . . . . . . . . . . . . Coal, Coke, and Related Chemical
Products3014 February 1997 . . . . . . . . . . . . . . . . . . . . . Synthetic Rubber3021 February 1997 . . . . . . . . . . . . . . . . . . . . . Synthetic Organic Pigments3081 March 1998 . . . . . . . . . . . . . . . . . . . . . . . Explosives, Propellant Powders, and
Related Items3082 March 1998 . . . . . . . . . . . . . . . . . . . . . . . Fertilizers3093 March 1998 . . . . . . . . . . . . . . . . . . . . . . . Adhesives, Glues, and Gelatin
Textiles and apparel:
2543 August 1992 . . . . . . . . . . . . . . . . . . . . . . Nonwoven Fabrics2580 December 1992 . . . . . . . . . . . . . . . . . . . . Gloves2642 June 1993 . . . . . . . . . . . . . . . . . . . . . . . . Yarn2695 November 1993 . . . . . . . . . . . . . . . . . . . . Carpets and Rugs2702 November 1993 . . . . . . . . . . . . . . . . . . . . Fur Goods2703 November 1993 . . . . . . . . . . . . . . . . . . . . Coated Fabrics2735 February 1994 . . . . . . . . . . . . . . . . . . . . . Knit Fabric2841 December 1994 . . . . . . . . . . . . . . . . . . . . Cordage2853 January 1995 . . . . . . . . . . . . . . . . . . . . . . Apparel 2874 April 1995 . . . . . . . . . . . . . . . . . . . . . . . . Manmade Fibers
iii
CONTENTS Page
Preface . . . . . . . . . . . . . . . . . . . . . . . . . . . . . . . . . . . . . . . . . . . . . . . . . . . . . . . . . . . . . . . . . i
Abstract . . . . . . . . . . . . . . . . . . . . . . . . . . . . . . . . . . . . . . . . . . . . . . . . . . . . . . . . . . . . . . . 1
Introduction . . . . . . . . . . . . . . . . . . . . . . . . . . . . . . . . . . . . . . . . . . . . . . . . . . . . . . . . . . 3
U.S. industry profile . . . . . . . . . . . . . . . . . . . . . . . . . . . . . . . . . . . . . . . . . . . . . . . . 4
Industry structure . . . . . . . . . . . . . . . . . . . . . . . . . . . . . . . . . . . . . . . . . . . . . . . . . . . . . . . . . . 4
U.S. market . . . . . . . . . . . . . . . . . . . . . . . . . . . . . . . . . . . . . . . . . . . . . . . . . . . . . . . . . . . 8
Consumer characteristics and factors affecting demand . . . . . . . . . . . . . . . . . . . . . . . . . . . . . . 8Consumption . . . . . . . . . . . . . . . . . . . . . . . . . . . . . . . . . . . . . . . . . . . . . . . . . . . . . . . . . . . . . . 8Production . . . . . . . . . . . . . . . . . . . . . . . . . . . . . . . . . . . . . . . . . . . . . . . . . . . . . . . . . . . . . . . . 10
U.S. trade . . . . . . . . . . . . . . . . . . . . . . . . . . . . . . . . . . . . . . . . . . . . . . . . . . . . . . . . . . . . . . 11
Overview . . . . . . . . . . . . . . . . . . . . . . . . . . . . . . . . . . . . . . . . . . . . . . . . . . . . . . . . . . . . . . . . . 11U.S. imports . . . . . . . . . . . . . . . . . . . . . . . . . . . . . . . . . . . . . . . . . . . . . . . . . . . . . . . . . . . . . . 11Principal suppliers and import levels . . . . . . . . . . . . . . . . . . . . . . . . . . . . . . . . . . . . . . . . . . . . 11
U.S. trade measures . . . . . . . . . . . . . . . . . . . . . . . . . . . . . . . . . . . . . . . . . . . . . . . . . . . . . . 12U.S. exports . . . . . . . . . . . . . . . . . . . . . . . . . . . . . . . . . . . . . . . . . . . . . . . . . . . . . . . . . . . . . . 14
Principal markets and export levels . . . . . . . . . . . . . . . . . . . . . . . . . . . . . . . . . . . . . . . . . . 14Foreign trade measures . . . . . . . . . . . . . . . . . . . . . . . . . . . . . . . . . . . . . . . . . . . . . . . . . . . 20
Foreign Industry Profile . . . . . . . . . . . . . . . . . . . . . . . . . . . . . . . . . . . . . . . . . . . . . . . 20
Appendix A . . . . . . . . . . . . . . . . . . . . . . . . . . . . . . . . . . . . . . . . . . . . . . . . . . . . . . . . . . . . . . . . . A-1
Explanation of tariff and trade agreement terms . . . . . . . . . . . . . . . . . . . . . . . . . . . . . . . . . . . . . . . . . . . A-2
iv
CONTENTS–ContinuedPage
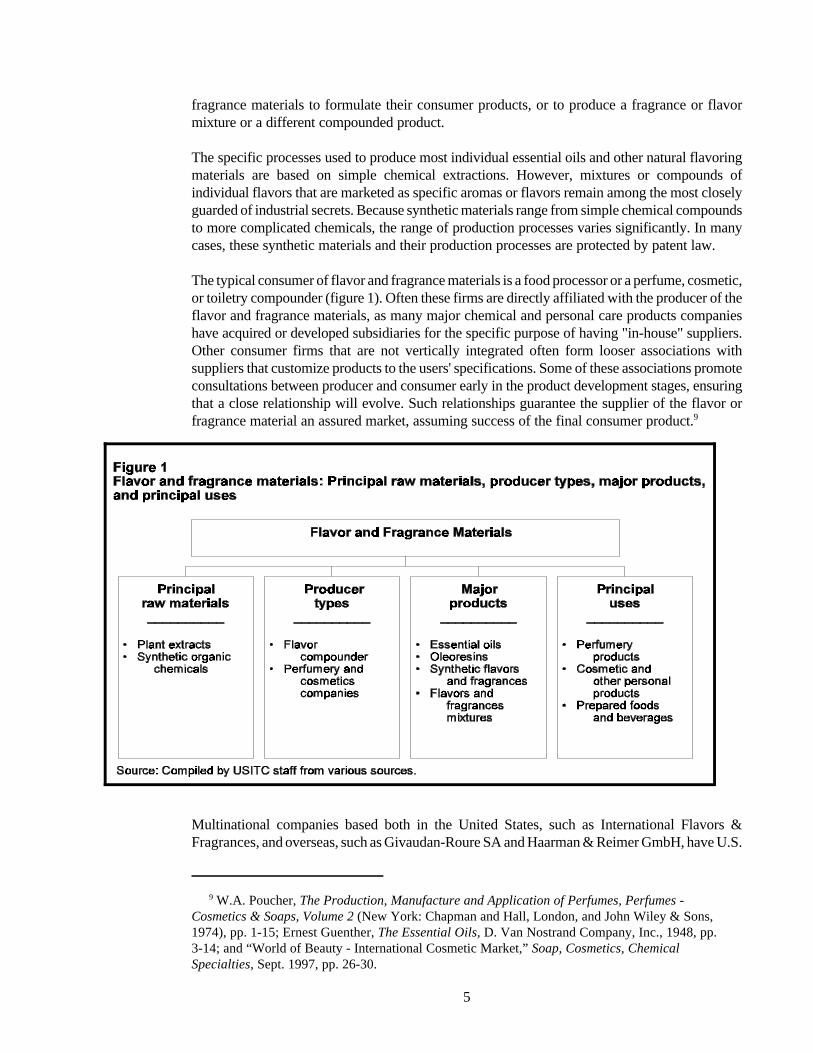
Figures1. Flavor and fragrance materials: Principal raw
materials, producer types, major products, and principal uses . . . . . . . . . . . . . . . . . . . . . . . 5
Tables
1. Flavor and fragrance materials: U.S. shipments, exports of domestic merchandise, imports for consumption, and apparent consumption, 1993-97 . . . . . . . . . . . 9
2. Flavor and fragrance materials: U.S. shipments, by type of material, 1993-97 . . . . . . . . . . . . . 103. Flavor and fragrance materials: U.S. exports of domestic merchandise,
imports for consumption, and merchandise trade balance, by selected countries and country groups, 1993-97 . . . . . . . . . . . . . . . . . . . . . . . . . . . . . . . . . . . . . . 13
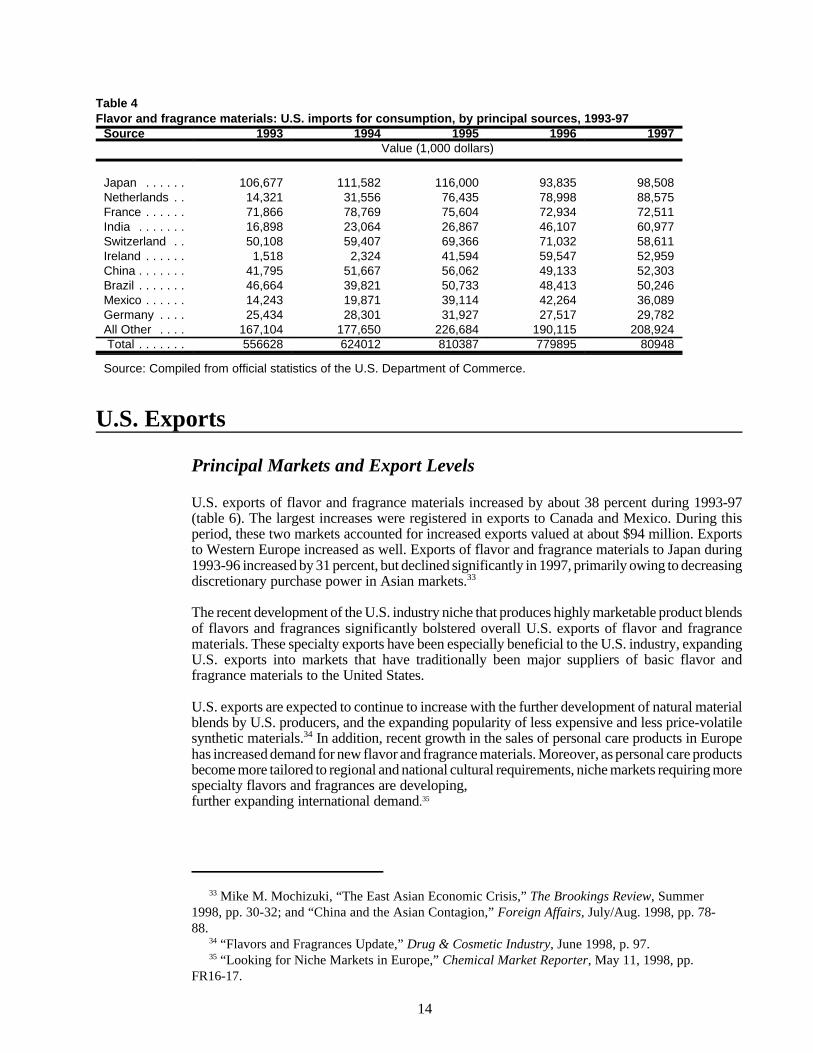
4. Flavor and fragrance materials: U.S. imports for consumption, by principal sources, 1993-97 . . . . . . . . . . . . . . . . . . . . . . . . . . . . . . . . . . . . . . . . . . . . . 14
5. Flavor and fragrance materials: Harmonized Tariff Schedule subheading; description; U.S. col. 1 rate of duty as of Jan. 1, 1998; U.S. exports and imports, 1997 . . . . . . . . . . . . . . . . . . . . . . . . . . . . . . . . . . . . . . . . . . . . 15
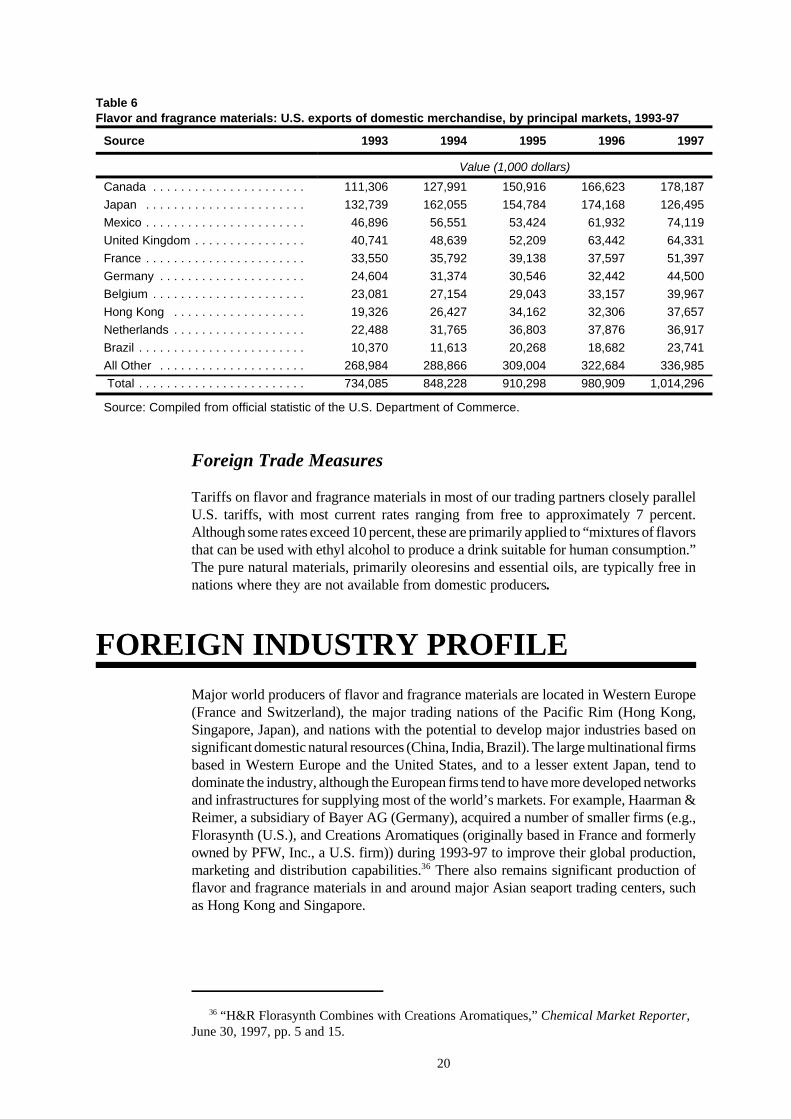
6. Flavor and fragrance materials: U.S. exports of domestic merchandise, by principal markets, 1993-97 . . . . . . . . . . . . . . . . . . . . . . . . . . . . . . . . . . . . . . . . . . . . . 20
1
ABSTRACT
This report addresses trade and industry conditions in the flavor andfragrance materials industry for the period 1993-97.
! U.S. producers of flavor and fragrance materials range fromlarge multinational firms that produce the majority of the high-volume materials to small producers that specialize in highervalue-added, lower volume materials. The major products ofthis industry are essential oils, oleoresins, synthetic flavors andfragrances, and flavor and fragrance mixtures.
! U.S. producers of flavor and fragrance materials had annualshipments averaging approximately $2.4 billion during 1993-97. The largest volume and value chemical produced by theU.S. industry is the non-caloric sweetener aspartame. Othermajor synthetic products of the U.S. flavor and fragranceindustry include geraniol, citral, ionones, and methylionones.Major natural products include certain essential oils, such asmint oils and cedarwood oil, and particularly citrus oils, whichare considered to be by-products by U.S. citrus fruit and juiceproducers. Also, specific products that are blends of syntheticsand various oils and/or other flavor extracts have become aspecialty of the U.S. industry during the 1990s.
! The U.S. duty level for a significant number of productscovered in this report from MFN countries is free, as many ofthese materials are not available domestically. Additionally,almost all of the products that do not have a column 1 duty rateof zero are eligible for duty-free treatment through theGeneralized System of Preferences.
! The primary U.S. consumers of these flavor and fragrancematerials are perfume, cosmetic, and toiletry compounders.Often these firms are directly affiliated with the producer of theflavor and fragrance materials, as many major chemical andpersonal care products companies have acquired or developedsubsidiaries for the specific purpose of having "in-house"suppliers. In general, flavor and fragrance materials areexpected to be among the fastest growing of all chemicalspecialties areas, with an annual growth rate through 2002anticipated to be about 5 percent.

2
1 The products of this digest are included in various North American Industry ClassificationSystem (NAICS) categories. Essential oils are classified under NAICS 325998 (All OtherMiscellaneous Chemical Product and Preparation Manufacturing). Other natural flavor andfragrance materials, synthetic flavor and fragrance materials, and mixtures of different flavor andfragrance materials are classified under NAICS 325199 (All Other Basic ChemicalManufacturing (pt)). 2 The two notable exceptions to this rule are saccharin and aspartame, which may bemarketed directly to consumers for personal use in other foods or drinks. 3 Synthetic flavor and fragrance materials are produced by identifying, isolating, and thensynthesizing as many of the individual chemical components determined to be contributorstoward the flavor and fragrance characteristics of the natural product. 4 For example, consumers that incorporate a natural material such as menthol in theirconsumer product will continue to use natural menthol even if price slightly exceeds that of asynthetic. However, as has occurred during the past decade, production of the natural product canbe disrupted by severe weather conditions, thereby escalating the price to a level as much as fivetimes higher. Such high costs and reduced availability have forced consumers to resort to
(continued...)
3
INTRODUCTION
This report contains information concerning production, consumption, and trade in the flavor andfragrance materials industry, both in the United States and throughout the world. Most informationin this report is provided for the 5-year period 1993-97.
The major products of this industry are either natural products, such as essential oils, oleoresins,and other natural plant extracts, or synthetic materials (synthetic organic chemicals with aromaticor odoriferous characteristics), or a combination of the two. These materials are used to impartthe flavors and aromas in prepared foods, as well as to create the fragrances in household andpersonal care products.1 In general, flavor and fragrance materials are marketed as industrialgoods and incorporated into their respective consumer products either by food processors orproducers of household or personal care products.2
The extraction processes used in the production of the natural flavors and fragrances arechemically simple operations, usually vacuum concentration followed by simple distillations, orsolvent extractions. Most of the natural products, other than the singular essential oils andoleoresins (which are basic pure materials), are marketed in the form of alcohol-based solutions.
There is a wide variety of natural products used as flavor and fragrance materials. These productsare differentiated according to the method of extraction and differences in the types of sourcematerial (e.g., various citrus peels, spices, plant leaf materials, other plant parts). By and large,most consumers of these products prefer natural flavor and fragrance materials to their chemicallyequivalent synthetic counterparts. Although flavor and fragrance chemists have labored for manyyears to exactly duplicate characteristic natural fragrances, there remain specific, discerniblesensory differences between the natural products and their synthetic substitutes.3 These sensorydifferences between natural and synthetic counterparts relate primarily to various "contaminating"materials routinely found in very small concentrations in natural products. These “contaminating”materials, found consistently in specific source materials, provoke slight sensory differencescompared with the purer, unblemished synthetic counterparts. However, economic or even climaticfactors may at times dictate the use of synthetic flavor and fragrance materials rather than thenatural product.4
4 (...continued)synthetic substitutes. 5 Spice oleoresins are a natural liquid combination of resins and oils, which are solvent-extracted from plants and parts of plants. 6 Brokers in the flavor and fragrance industry market a wide variety of products obtainedprimarily through purchases from various suppliers and, in some cases, their own production. 7 Flavor and fragrance houses usually produce the majority of their own product from localraw materials and materials historically traded in the area. These producers generally onlypurchase finished flavor or fragrance materials produced by other producers when necessary forspecialized products. These producers have been involved in the production of flavors andfragrances for many decades, often centuries, and are most often located in traditional Asian orEuropean centers of commerce. 8 Large multinationals based in the United States include International Flavors & Fragrances,Bush Boake Allen Inc., and Ungerer & Co. Smaller U.S.-based firms include Chemessence Inc.,Elias Fragrances Inc., and Texarome Inc. Cosmetics & Toiletries Cosmetics Bench Reference,1998, Allured Publishing Company, IL, 1998.
4
The flavor and fragrance materials industry was one of the first truly international industries, asthere are specific necessary components for major products throughout the industry that areavailable from very few locations around the world. Although U.S. demand for the commonlyavailable natural flavor and fragrance materials is generally satisfied by domestic production, anumber of significant natural flavor and fragrance materials, such as certain animal products andspecific essential oils and spice oleoresins5 derived from non-indigenous plant materials, must beobtained from foreign sources.
Unlike many industries where the primary foreign competitors active in the U.S. market are largemultinational firms, a large number of smaller foreign firms, many of which are brokers6 of flavorand fragrance materials, remain competitive. Although in recent years a move towardsconsolidation among the larger multinational firms producing flavors and fragrances has resultedin the absorption of some of the smaller firms, a significant number of relatively small flavor andfragrance operations remain independent.
Large flavor and fragrance product brokers and major “flavor and fragrance houses”7 functionboth as clearinghouses for local raw materials entering major world markets, and as producers ofsome flavor and fragrance materials from imported source materials.
U.S. INDUSTRY PROFILE
Industry Structure
Domestic firms supplying flavor and fragrance materials to the U.S. market range from largemultinational firms8 that produce the majority of the high-volume materials, to many smallerproducers that specialize in higher value-added, lower volume materials. The smaller firms, mostof which are not highly vertically integrated, each produce a number of products crucial toformulations of various types of consumer products. Purchasers of materials from these smallerfirms may also be dependent on multiple sources to provide all of the necessary flavor and
9 W.A. Poucher, The Production, Manufacture and Application of Perfumes, Perfumes -Cosmetics & Soaps, Volume 2 (New York: Chapman and Hall, London, and John Wiley & Sons,1974), pp. 1-15; Ernest Guenther, The Essential Oils, D. Van Nostrand Company, Inc., 1948, pp.3-14; and “World of Beauty - International Cosmetic Market,” Soap, Cosmetics, ChemicalSpecialties, Sept. 1997, pp. 26-30.
5
fragrance materials to formulate their consumer products, or to produce a fragrance or flavormixture or a different compounded product.
The specific processes used to produce most individual essential oils and other natural flavoringmaterials are based on simple chemical extractions. However, mixtures or compounds ofindividual flavors that are marketed as specific aromas or flavors remain among the most closelyguarded of industrial secrets. Because synthetic materials range from simple chemical compoundsto more complicated chemicals, the range of production processes varies significantly. In manycases, these synthetic materials and their production processes are protected by patent law.
The typical consumer of flavor and fragrance materials is a food processor or a perfume, cosmetic,or toiletry compounder (figure 1). Often these firms are directly affiliated with the producer of theflavor and fragrance materials, as many major chemical and personal care products companieshave acquired or developed subsidiaries for the specific purpose of having "in-house" suppliers.Other consumer firms that are not vertically integrated often form looser associations withsuppliers that customize products to the users' specifications. Some of these associations promoteconsultations between producer and consumer early in the product development stages, ensuringthat a close relationship will evolve. Such relationships guarantee the supplier of the flavor orfragrance material an assured market, assuming success of the final consumer product.9
Multinational companies based both in the United States, such as International Flavors &Fragrances, and overseas, such as Givaudan-Roure SA and Haarman & Reimer GmbH, have U.S.
10 U.S. Bureau of the Census, 1992 Census of Manufactures, Industrial Organic Chemicals, p.28F-14, and U.S. Bureau of the Census, 1992 Census of Manufactures, Miscellaneous ChemicalProducts, p. 28H-18. (Data were still being reported in terms of SIC categories). 11 Data specific to these items remains confidential. 12 U.S. Bureau of the Census, 1992 Census of Manufactures, Industrial Organic Chemicals, p.28F-16, and U.S. Bureau of the Census, 1992 Census of Manufactures, Miscellaneous ChemicalProducts, p. 28H-21.
6
facilities for producing flavor and fragrance materials for the U.S. market. Such large verticallyintegrated firms are typically involved in the entire production process, beginning as far back asthe cultivation of the flora from which many of the natural fragrances and oils used in the industryare obtained, and culminating in the production of final consumer products. The smaller"specialty" companies, such as The Essential Oil Company, Inc., compete by carving out veryspecific niches, often based on one or a very few specialized fragrances. Such firms typically seekto maintain their competitive position through product innovation or proprietary technologicaladvantage.
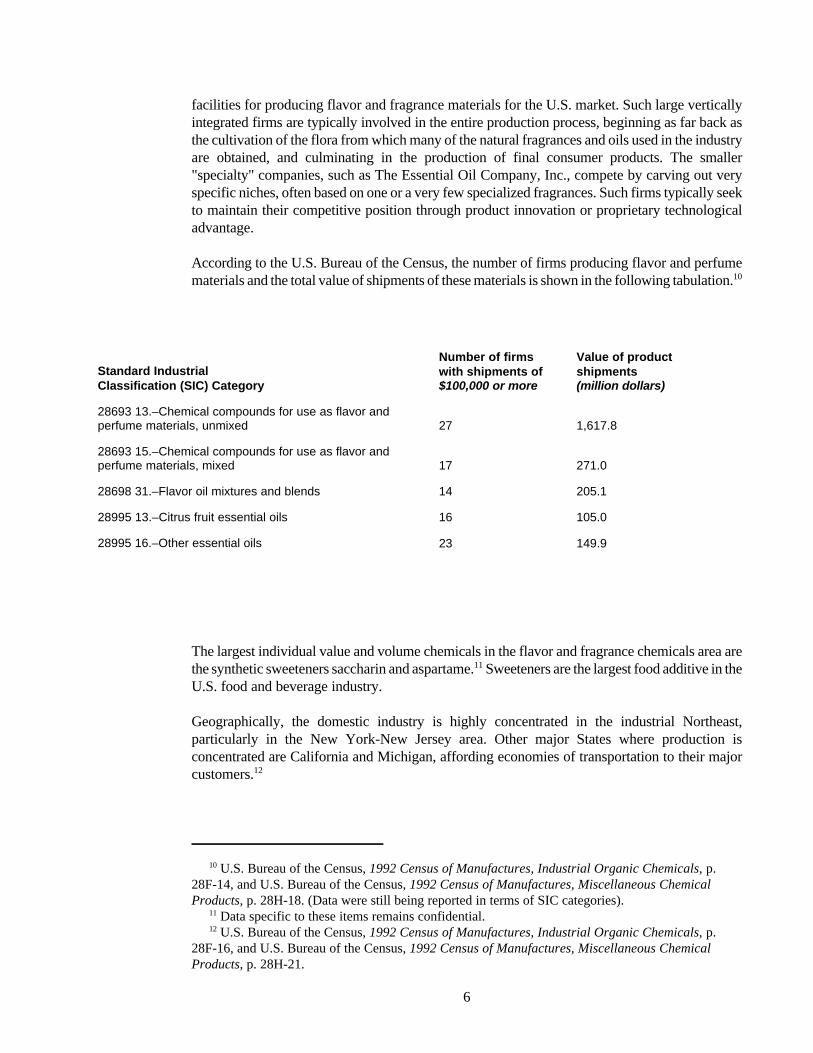
According to the U.S. Bureau of the Census, the number of firms producing flavor and perfumematerials and the total value of shipments of these materials is shown in the following tabulation.10
Standard Industrial Classification (SIC) Category
Number of firmswith shipments of$100,000 or more
Value of productshipments (million dollars)
28693 13.–Chemical compounds for use as flavor andperfume materials, unmixed 27 1,617.8
28693 15.–Chemical compounds for use as flavor andperfume materials, mixed 17 271.0
28698 31.–Flavor oil mixtures and blends 14 205.1
28995 13.–Citrus fruit essential oils 16 105.0
28995 16.–Other essential oils 23 149.9
The largest individual value and volume chemicals in the flavor and fragrance chemicals area arethe synthetic sweeteners saccharin and aspartame.11 Sweeteners are the largest food additive in theU.S. food and beverage industry.
Geographically, the domestic industry is highly concentrated in the industrial Northeast,particularly in the New York-New Jersey area. Other major States where production isconcentrated are California and Michigan, affording economies of transportation to their majorcustomers.12
13 Personal care and household products. 14 Estimated by the staff of the USITC based on information published in the 1992 Census ofManufactures. 15 “Menthol Continues Plunge; Pricing Floor is Uncertain,” Chemical Marketing Reporter,Apr. 3, 1995, p. 24; “Menthol Prices Soar Worldwide as China and India Square Off,” ChemicalMarket Reporter, Jan. 13, 1997, p. 20; and “Indian Producers Go on Strike, Halting MentholSupplies,” Chemical Market Reporter, June 16, 1997, p. 25. Note.–The name of the publicationChemical Market Reporter changed as of June 1996.
7
Employment in this industry remained fairly stable during 1993-97, because production of flavorand fragrance materials is dependent on demand from major consuming industries,13 which do notfluctuate significantly with economic trends. Employment in the flavor and fragrance materialsindustry in 1992 is estimated to have been about 3,000.14
The level of labor intensity for the flavor and fragrance materials industry varies from firm to firm.Domestically, the industry is highly capital intensive, even though there have been few significanttechnological advances during the last century, with the exception of those related to syntheticcompounds. In many foreign countries where exotic flora are available for use in production offlavors and fragrances, many of the extractions are still performed using the same productionequipment and techniques as were used before World War II.
The relationships that exist throughout the U.S. industry (and also certain foreign industries) arebased to a significant degree on the confidence of purchasers for the suppliers of the raw flavorand fragrance materials. Individual product success depends heavily on proprietary formulationsused to generate a special fragrance or aroma, thereby provoking a specific sensory response. Suchproprietary formulations are often incorporated into related "families" of products, such asperfumes and colognes, powders, shaving preparations, and other perfumed preparations. Sincethese formulations may be compounded from various types of materials purchased from flavor andfragrance companies, the ability to replicate the same product fragrance is dependent upon theconsistency and homogeneity of the raw materials used and the reliability of the supplier. As such,the marketing of the flavor and fragrance materials to consuming companies requires very littleadditional effort on the part of suppliers once relationships are established.
Purchase of flavor and fragrance materials is generally by long-term contract. Such contractsbenefit purchasers in two ways: (1) purchasers can be assured of product availability to the extentfeasible, and (2) purchasers are not exposed to spot market pricing, which can be extremelyvolatile. The pricing of flavor and fragrance materials is heavily dependent on factors external tothe industry, with the natural products that comprise a significant share of the industry oftenexperiencing wide price variations. For example, during 1994-97, natural menthol prices rangedfrom approximately $6 per pound to more than $40 per pound because of weather-induced cropfailures in China and worker strikes in Northern India.15
16 Oleoresins have a much longer shelf-life than spices, are more hygienic (free from bacteria),can be strength-standardized, and contain natural antioxidants. 17 “1997 Soft Drink Wrap Up,” Beverage Inustry, Aug. 1998, pp. 9-16, and “Outlook Rosy forFragrance,” Discount Store News, June 22, 1998, p. 35. 18 “Ace-K Gets Approval,” Chemical Market Reporter, July 6, 1998, p. 5. 19 Estimates provided by SRI International in “New and Established Products Vie for a Sharein a Growing Market,” Chemical Week, Jun. 11, 1997, p. 32.
8
U.S. MARKET
Consumer Characteristics and Factors Affecting Demand
Almost all of the products of the flavor and fragrance materials industry are intended for industrialconsumers; only synthetic non-caloric sweeteners (i.e., saccharin and aspartame) are marketeddirectly to the consuming public. The most significant factors that influence purchasing decisionsby the industrial consumers are the sensory characteristics that the materials contribute to the finalproduct, and the cost of the material.
As there is a strong correlation between the specific item used to impart a flavor or fragrance andthe sensory characteristics of the resulting product, most industrial users will maintain theirproducts’ integrity within reasonable limits. However, if costs for natural materials escalatedrastically (as in the previous example for menthol), synthetic materials that very closely mimicthe natural product may be substituted. Different types of flavor and fragrance materials havecertain distinctive properties that cause purchasers to favor their use. For example, spiceoleoresins maintain the integrity of the actual spices and generally are able to circumvent concernsrelated to the possible spoilage of the spice.16
Consumption
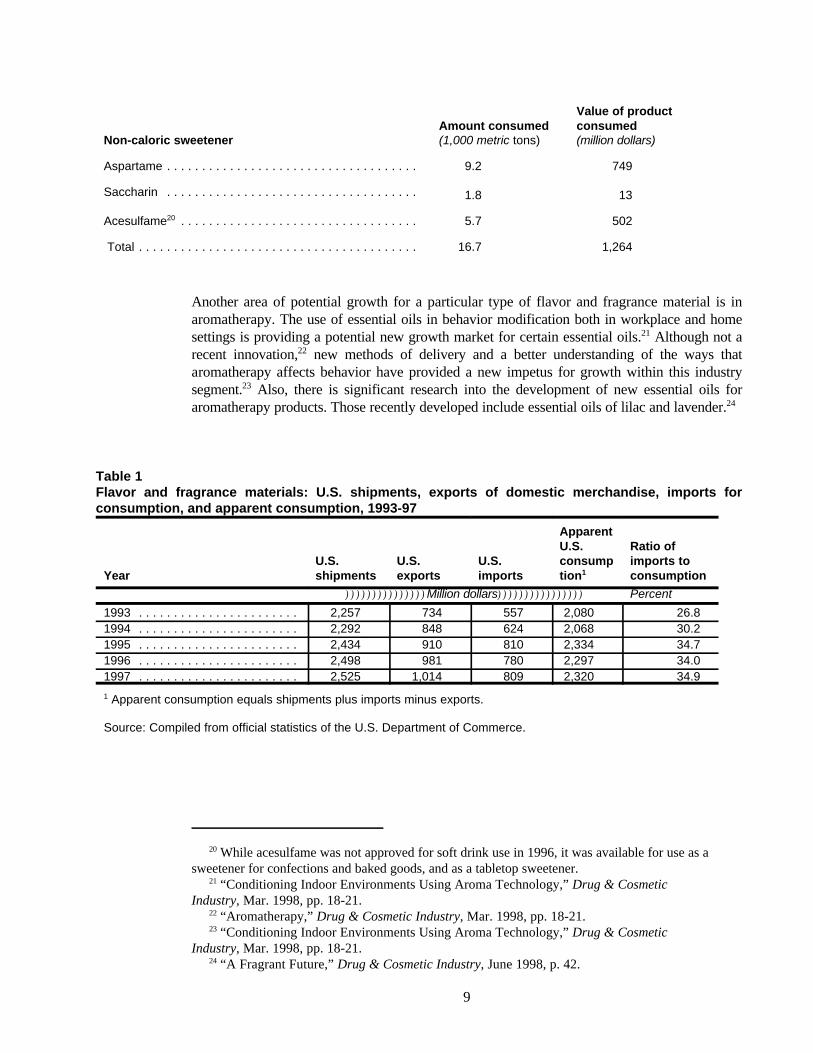
Apparent U.S. consumption of flavor and fragrance materials increased by 11.5 percent during1993-97, mostly as a result of steadily increasing consumption of the products that incorporatethese materials (table 1), particularly soft drinks and perfumery.17 Synthetic sweeteners aspartameand saccharin account for a large share of the domestic consumption of flavor and fragrancematerials. Estimates of the value of U.S. consumption of these low-calorie sweeteners range ashigh as $1 billion, which would be about 40 percent of all flavor and fragrance materialconsumption in 1997.18 The following tabulation shows an estimate of both the volume and valueof the non-caloric sweeteners available in the U.S. market in 1996.19
20 While acesulfame was not approved for soft drink use in 1996, it was available for use as asweetener for confections and baked goods, and as a tabletop sweetener. 21 “Conditioning Indoor Environments Using Aroma Technology,” Drug & CosmeticIndustry, Mar. 1998, pp. 18-21. 22 “Aromatherapy,” Drug & Cosmetic Industry, Mar. 1998, pp. 18-21. 23 “Conditioning Indoor Environments Using Aroma Technology,” Drug & CosmeticIndustry, Mar. 1998, pp. 18-21. 24 “A Fragrant Future,” Drug & Cosmetic Industry, June 1998, p. 42.
9
Non-caloric sweetenerAmount consumed (1,000 metric tons)
Value of productconsumed (million dollars)
Aspartame . . . . . . . . . . . . . . . . . . . . . . . . . . . . . . . . . . . . 9.2 749
Saccharin . . . . . . . . . . . . . . . . . . . . . . . . . . . . . . . . . . . . 1.8 13
Acesulfame20 . . . . . . . . . . . . . . . . . . . . . . . . . . . . . . . . . . 5.7 502
Total . . . . . . . . . . . . . . . . . . . . . . . . . . . . . . . . . . . . . . . . 16.7 1,264
Another area of potential growth for a particular type of flavor and fragrance material is inaromatherapy. The use of essential oils in behavior modification both in workplace and homesettings is providing a potential new growth market for certain essential oils.21 Although not arecent innovation,22 new methods of delivery and a better understanding of the ways thataromatherapy affects behavior have provided a new impetus for growth within this industrysegment.23 Also, there is significant research into the development of new essential oils foraromatherapy products. Those recently developed include essential oils of lilac and lavender.24
Table 1Flavor and fragrance materials: U.S. shipments, exports of domestic merchandise, imports forconsumption, and apparent consumption, 1993-97
YearU.S.shipments
U.S.exports
U.S.imports
ApparentU.S.consumption1
Ratio ofimports toconsumption
)))))))))))))))Million dollars)))))))))))))))) Percent
1993 . . . . . . . . . . . . . . . . . . . . . . . 2,257 734 557 2,080 26.81994 . . . . . . . . . . . . . . . . . . . . . . . 2,292 848 624 2,068 30.21995 . . . . . . . . . . . . . . . . . . . . . . . 2,434 910 810 2,334 34.71996 . . . . . . . . . . . . . . . . . . . . . . . 2,498 981 780 2,297 34.01997 . . . . . . . . . . . . . . . . . . . . . . . 2,525 1,014 809 2,320 34.9
1 Apparent consumption equals shipments plus imports minus exports.
Source: Compiled from official statistics of the U.S. Department of Commerce.
25 “Specialties Slated for Strong Growth According to New Kline Report,” Chemical MarketReporter, Apr. 27, 1998, p. 33. 26 “Flavor and Fragrances Update,” Drug & Cosmetic Industry, June 1998, p. 97. 27 Derived from official statistics of the U.S. Department of Commerce. 28 “Aspartame Is Pricing Driven,” Chemical Marketing Reporter, Nov. 20, 1995, p. 7.
10
In general, flavor and fragrance materials are expected to be one of the fastest growing of allchemical specialties areas, with the annual growth rate through 2002 anticipated to be about 5percent.25 Other estimates of market growth through 2002 range as high as 7.3 percent.26 Thegrowth rate was slightly less than 3 percent during 1993-97.27
Production
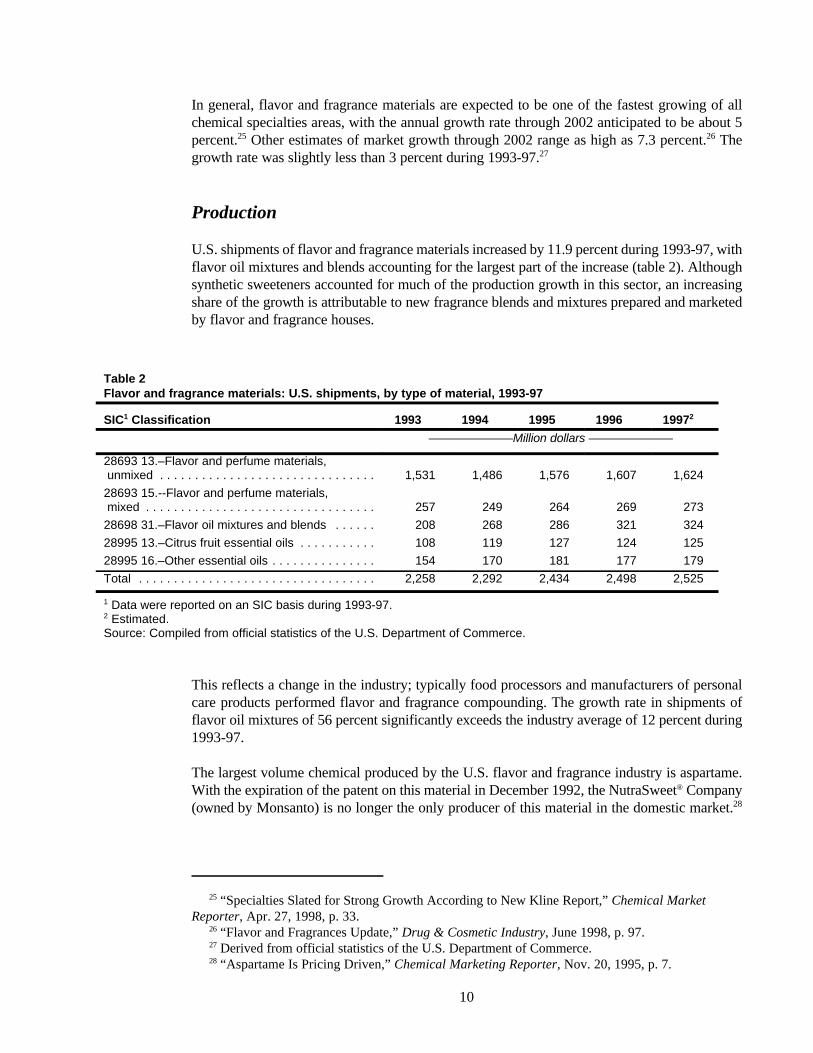
U.S. shipments of flavor and fragrance materials increased by 11.9 percent during 1993-97, withflavor oil mixtures and blends accounting for the largest part of the increase (table 2). Althoughsynthetic sweeteners accounted for much of the production growth in this sector, an increasingshare of the growth is attributable to new fragrance blends and mixtures prepared and marketedby flavor and fragrance houses.
Table 2Flavor and fragrance materials: U.S. shipments, by type of material, 1993-97
SIC1 Classification 1993 1994 1995 1996 19972
———————Million dollars ———————
28693 13.–Flavor and perfume materials, unmixed . . . . . . . . . . . . . . . . . . . . . . . . . . . . . . . 1,531 1,486 1,576 1,607 1,624
28693 15.--Flavor and perfume materials, mixed . . . . . . . . . . . . . . . . . . . . . . . . . . . . . . . . . 257 249 264 269 273
28698 31.–Flavor oil mixtures and blends . . . . . . 208 268 286 321 324
28995 13.–Citrus fruit essential oils . . . . . . . . . . . 108 119 127 124 125
28995 16.–Other essential oils . . . . . . . . . . . . . . . 154 170 181 177 179
Total . . . . . . . . . . . . . . . . . . . . . . . . . . . . . . . . . . 2,258 2,292 2,434 2,498 2,525
1 Data were reported on an SIC basis during 1993-97.2 Estimated.Source: Compiled from official statistics of the U.S. Department of Commerce.
This reflects a change in the industry; typically food processors and manufacturers of personalcare products performed flavor and fragrance compounding. The growth rate in shipments offlavor oil mixtures of 56 percent significantly exceeds the industry average of 12 percent during1993-97.
The largest volume chemical produced by the U.S. flavor and fragrance industry is aspartame.With the expiration of the patent on this material in December 1992, the NutraSweet® Company(owned by Monsanto) is no longer the only producer of this material in the domestic market.28
29 “New Ingredients Poised to Enter High-Intensity Sweeteners,” Chemical Market Reporter,June 22, 1998, pp. F6-F8. 30 The Holland Company has become a major international producer of aspartame. 31 “How Sweet It Isn’t at NutraSweet,” Business Week, Dec. 14, 1992, p. 42 and “A Heap ofCompetition to Come,” Chemical Week, Aug. 14, 1996, pp. 24-27.
11
However, Monsanto remains the world’s largest producer of aspartame.29 Other major syntheticproducts of the U.S. flavor and fragrance industry include geraniol, citral, ionones, andmethylionones. Major natural products include certain essential oils, such as mint oils andcedarwood oil, and particularly citrus oils, which are considered a by-product by U.S. citrus fruitand juice producers. Also, specific blends of synthetics and various oils and/or other flavorextracts have become a specialty of the U.S. industry during the 1990s.
U.S. TRADE
Overview
U.S. trade in flavor and fragrance materials reflects the international nature of the flavor andfragrance market. A significant share of U.S. imports is comprised of materials that are producedin limited supply by firms located in select regions of the world and that are in high demandthroughout the international industry. Restricted availability and high demand places significantpressure on U.S. consuming industries to maintain a guaranteed supply at a reasonable cost. Asa result, price fluctuations for these materials are much greater than those seen in most otherchemical trade areas.
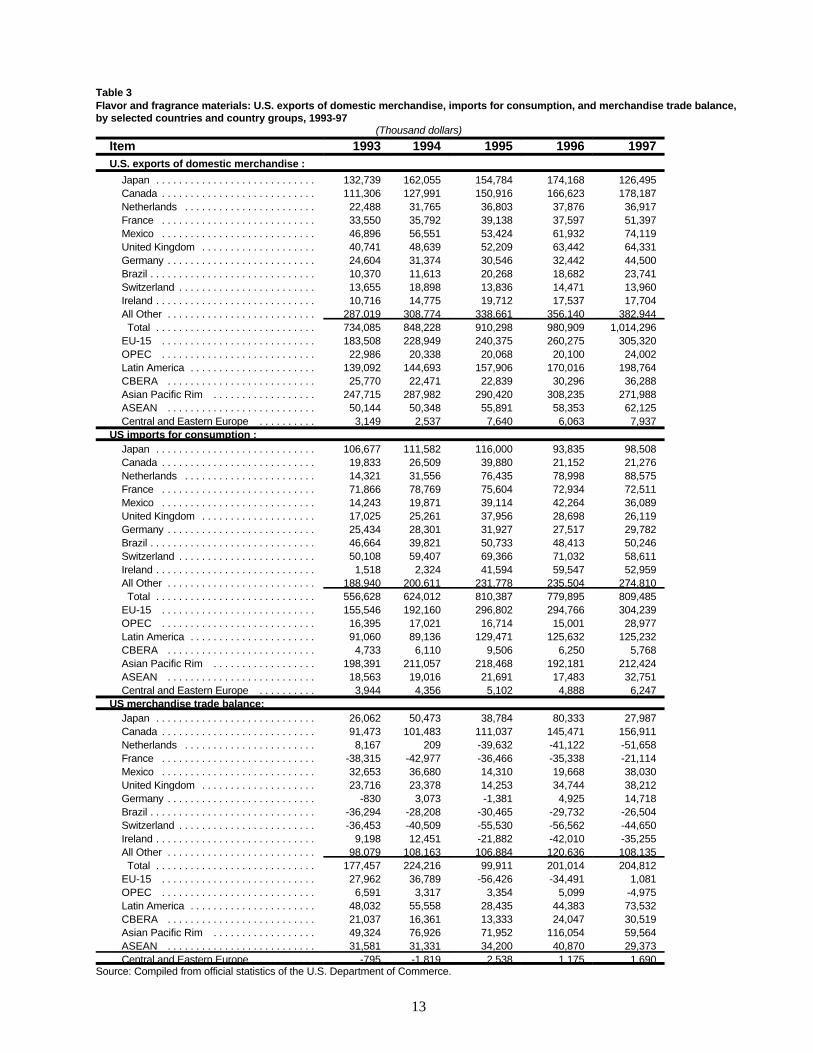
The United States has historically maintained a positive balance of trade in flavor and fragrancematerials, owing to its competitive strengths in production of certain endemic natural products(i.e., mint oils), and compounded flavors and fragrances that are in demand in the global market(table 3). The trade balance fluctuated during 1993-97, reaching a high of $224.2 million in 1994and a low of $99.9 million in 1995. The trade balance in 1997 was $204.8 million. Variations inthe trade balance primarily result from significantly increased U.S. imports of aspartame from theNetherlands and drink mixes from Ireland, which outstripped steady increases across a broadrange of U.S. flavor and fragrance material exports.
U.S. Imports
Principal Suppliers and Import Levels
Japan and France have historically been the principal suppliers of flavor and fragrance materialsto the U.S. market (table 4). However, since the expiration of the patent on aspartame, significantimports of the material have entered the United States from the Netherlands.30 These aspartameimports may account for as much as 17 percent of all flavor and fragrance imports.31 In addition,in 1995 there was an increase in imports of flavor and fragrance materials that can be attributedto the basket subheading of “mixtures of flavors for use in drinks” from Ireland.
32 Many of these items are unavailable domestically and have column 1 duty rates of free. Insome cases, the duty rates are free to maintain the competitiveness of domestic consumingindustries vis-a-vis possible competitors that can obtain necessary components for their productsfrom domestic sources.
12
U.S. imports increased significantly, by more than 45 percent, during 1993-97. The increase inaspartame imports contributed a large amount to this increase. Also, demand is increasing forcertain natural flavor and fragrance inputs needed for new natural/synthetic mixtures currently indemand in the United States. A great number of these materials enter the U.S. market duty freeaccording to their column 1 rates (table 5).32 Additionally, almost all of the products that do nothave a column 1 duty rate that is free are eligible for duty-free treatment under the GeneralizedSystem of Preferences.
Other than the recent changes in imports from Ireland and the Netherlands, the import product mixhas remained fairly stable during 1993-97. For example, U.S. imports from Europe havetraditionally been weighted toward higher value-added specialty products, such as compoundedfragrances, while imports from other major sources including Mexico, Brazil, India, and Chinahave been weighted toward natural products such as oleoresins, essential oils, and productsderived directly from these materials.
U.S. Trade Measures
Table 5 shows the column 1 rate of duty for each eight-digit HTS subheading included in thissummary; special rates, as applicable; and U.S. exports and imports for the latest full yearavailable.
13
Table 3Flavor and fragrance materials: U.S. exports of domestic merchandise, imports for consumption, and merchandise trade balance,by selected countries and country groups, 1993-97
(Thousand dollars)
Item 1993 1994 1995 1996 1997U.S. exports of domestic merchandise :
Japan . . . . . . . . . . . . . . . . . . . . . . . . . . . . 132,739 162,055 154,784 174,168 126,495Canada . . . . . . . . . . . . . . . . . . . . . . . . . . . 111,306 127,991 150,916 166,623 178,187Netherlands . . . . . . . . . . . . . . . . . . . . . . . 22,488 31,765 36,803 37,876 36,917France . . . . . . . . . . . . . . . . . . . . . . . . . . . 33,550 35,792 39,138 37,597 51,397Mexico . . . . . . . . . . . . . . . . . . . . . . . . . . . 46,896 56,551 53,424 61,932 74,119United Kingdom . . . . . . . . . . . . . . . . . . . . 40,741 48,639 52,209 63,442 64,331Germany . . . . . . . . . . . . . . . . . . . . . . . . . . 24,604 31,374 30,546 32,442 44,500Brazil . . . . . . . . . . . . . . . . . . . . . . . . . . . . . 10,370 11,613 20,268 18,682 23,741Switzerland . . . . . . . . . . . . . . . . . . . . . . . . 13,655 18,898 13,836 14,471 13,960Ireland . . . . . . . . . . . . . . . . . . . . . . . . . . . . 10,716 14,775 19,712 17,537 17,704All Other . . . . . . . . . . . . . . . . . . . . . . . . . . 287,019 308,774 338,661 356,140 382,944 Total . . . . . . . . . . . . . . . . . . . . . . . . . . . . 734,085 848,228 910,298 980,909 1,014,296EU-15 . . . . . . . . . . . . . . . . . . . . . . . . . . . 183,508 228,949 240,375 260,275 305,320OPEC . . . . . . . . . . . . . . . . . . . . . . . . . . . 22,986 20,338 20,068 20,100 24,002Latin America . . . . . . . . . . . . . . . . . . . . . . 139,092 144,693 157,906 170,016 198,764CBERA . . . . . . . . . . . . . . . . . . . . . . . . . . 25,770 22,471 22,839 30,296 36,288Asian Pacific Rim . . . . . . . . . . . . . . . . . . 247,715 287,982 290,420 308,235 271,988ASEAN . . . . . . . . . . . . . . . . . . . . . . . . . . 50,144 50,348 55,891 58,353 62,125Central and Eastern Europe . . . . . . . . . . 3,149 2,537 7,640 6,063 7,937
US imports for consumption : Japan . . . . . . . . . . . . . . . . . . . . . . . . . . . . 106,677 111,582 116,000 93,835 98,508Canada . . . . . . . . . . . . . . . . . . . . . . . . . . . 19,833 26,509 39,880 21,152 21,276Netherlands . . . . . . . . . . . . . . . . . . . . . . . 14,321 31,556 76,435 78,998 88,575France . . . . . . . . . . . . . . . . . . . . . . . . . . . 71,866 78,769 75,604 72,934 72,511Mexico . . . . . . . . . . . . . . . . . . . . . . . . . . . 14,243 19,871 39,114 42,264 36,089United Kingdom . . . . . . . . . . . . . . . . . . . . 17,025 25,261 37,956 28,698 26,119Germany . . . . . . . . . . . . . . . . . . . . . . . . . . 25,434 28,301 31,927 27,517 29,782Brazil . . . . . . . . . . . . . . . . . . . . . . . . . . . . . 46,664 39,821 50,733 48,413 50,246Switzerland . . . . . . . . . . . . . . . . . . . . . . . . 50,108 59,407 69,366 71,032 58,611Ireland . . . . . . . . . . . . . . . . . . . . . . . . . . . . 1,518 2,324 41,594 59,547 52,959All Other . . . . . . . . . . . . . . . . . . . . . . . . . . 188,940 200,611 231,778 235,504 274,810 Total . . . . . . . . . . . . . . . . . . . . . . . . . . . . 556,628 624,012 810,387 779,895 809,485EU-15 . . . . . . . . . . . . . . . . . . . . . . . . . . . 155,546 192,160 296,802 294,766 304,239OPEC . . . . . . . . . . . . . . . . . . . . . . . . . . . 16,395 17,021 16,714 15,001 28,977Latin America . . . . . . . . . . . . . . . . . . . . . . 91,060 89,136 129,471 125,632 125,232CBERA . . . . . . . . . . . . . . . . . . . . . . . . . . 4,733 6,110 9,506 6,250 5,768Asian Pacific Rim . . . . . . . . . . . . . . . . . . 198,391 211,057 218,468 192,181 212,424ASEAN . . . . . . . . . . . . . . . . . . . . . . . . . . 18,563 19,016 21,691 17,483 32,751Central and Eastern Europe . . . . . . . . . . 3,944 4,356 5,102 4,888 6,247
US merchandise trade balance: Japan . . . . . . . . . . . . . . . . . . . . . . . . . . . . 26,062 50,473 38,784 80,333 27,987Canada . . . . . . . . . . . . . . . . . . . . . . . . . . . 91,473 101,483 111,037 145,471 156,911Netherlands . . . . . . . . . . . . . . . . . . . . . . . 8,167 209 -39,632 -41,122 -51,658France . . . . . . . . . . . . . . . . . . . . . . . . . . . -38,315 -42,977 -36,466 -35,338 -21,114Mexico . . . . . . . . . . . . . . . . . . . . . . . . . . . 32,653 36,680 14,310 19,668 38,030United Kingdom . . . . . . . . . . . . . . . . . . . . 23,716 23,378 14,253 34,744 38,212Germany . . . . . . . . . . . . . . . . . . . . . . . . . . -830 3,073 -1,381 4,925 14,718Brazil . . . . . . . . . . . . . . . . . . . . . . . . . . . . . -36,294 -28,208 -30,465 -29,732 -26,504Switzerland . . . . . . . . . . . . . . . . . . . . . . . . -36,453 -40,509 -55,530 -56,562 -44,650Ireland . . . . . . . . . . . . . . . . . . . . . . . . . . . . 9,198 12,451 -21,882 -42,010 -35,255All Other . . . . . . . . . . . . . . . . . . . . . . . . . . 98,079 108,163 106,884 120,636 108,135 Total . . . . . . . . . . . . . . . . . . . . . . . . . . . . 177,457 224,216 99,911 201,014 204,812EU-15 . . . . . . . . . . . . . . . . . . . . . . . . . . . 27,962 36,789 -56,426 -34,491 1,081OPEC . . . . . . . . . . . . . . . . . . . . . . . . . . . 6,591 3,317 3,354 5,099 -4,975Latin America . . . . . . . . . . . . . . . . . . . . . . 48,032 55,558 28,435 44,383 73,532CBERA . . . . . . . . . . . . . . . . . . . . . . . . . . 21,037 16,361 13,333 24,047 30,519Asian Pacific Rim . . . . . . . . . . . . . . . . . . 49,324 76,926 71,952 116,054 59,564ASEAN . . . . . . . . . . . . . . . . . . . . . . . . . . 31,581 31,331 34,200 40,870 29,373Central and Eastern Europe . . . . . . . . . . -795 -1,819 2,538 1,175 1,690
Source: Compiled from official statistics of the U.S. Department of Commerce.
33 Mike M. Mochizuki, “The East Asian Economic Crisis,” The Brookings Review, Summer1998, pp. 30-32; and “China and the Asian Contagion,” Foreign Affairs, July/Aug. 1998, pp. 78-88. 34 “Flavors and Fragrances Update,” Drug & Cosmetic Industry, June 1998, p. 97. 35 “Looking for Niche Markets in Europe,” Chemical Market Reporter, May 11, 1998, pp.FR16-17.
14
Table 4Flavor and fragrance materials: U.S. imports for consumption, by principal sources, 1993-97
Source 1993 1994 1995 1996 1997Value (1,000 dollars)
Japan . . . . . . 106,677 111,582 116,000 93,835 98,508Netherlands . . 14,321 31,556 76,435 78,998 88,575France . . . . . . 71,866 78,769 75,604 72,934 72,511India . . . . . . . 16,898 23,064 26,867 46,107 60,977Switzerland . . 50,108 59,407 69,366 71,032 58,611Ireland . . . . . . 1,518 2,324 41,594 59,547 52,959China . . . . . . . 41,795 51,667 56,062 49,133 52,303Brazil . . . . . . . 46,664 39,821 50,733 48,413 50,246Mexico . . . . . . 14,243 19,871 39,114 42,264 36,089Germany . . . . 25,434 28,301 31,927 27,517 29,782All Other . . . . 167,104 177,650 226,684 190,115 208,924 Total . . . . . . . 556628 624012 810387 779895 80948
Source: Compiled from official statistics of the U.S. Department of Commerce.
U.S. Exports
Principal Markets and Export Levels
U.S. exports of flavor and fragrance materials increased by about 38 percent during 1993-97(table 6). The largest increases were registered in exports to Canada and Mexico. During thisperiod, these two markets accounted for increased exports valued at about $94 million. Exportsto Western Europe increased as well. Exports of flavor and fragrance materials to Japan during1993-96 increased by 31 percent, but declined significantly in 1997, primarily owing to decreasingdiscretionary purchase power in Asian markets.33
The recent development of the U.S. industry niche that produces highly marketable product blendsof flavors and fragrances significantly bolstered overall U.S. exports of flavor and fragrancematerials. These specialty exports have been especially beneficial to the U.S. industry, expandingU.S. exports into markets that have traditionally been major suppliers of basic flavor andfragrance materials to the United States.
U.S. exports are expected to continue to increase with the further development of natural materialblends by U.S. producers, and the expanding popularity of less expensive and less price-volatilesynthetic materials.34 In addition, recent growth in the sales of personal care products in Europehas increased demand for new flavor and fragrance materials. Moreover, as personal care productsbecome more tailored to regional and national cultural requirements, niche markets requiring morespecialty flavors and fragrances are developing,further expanding international demand.35
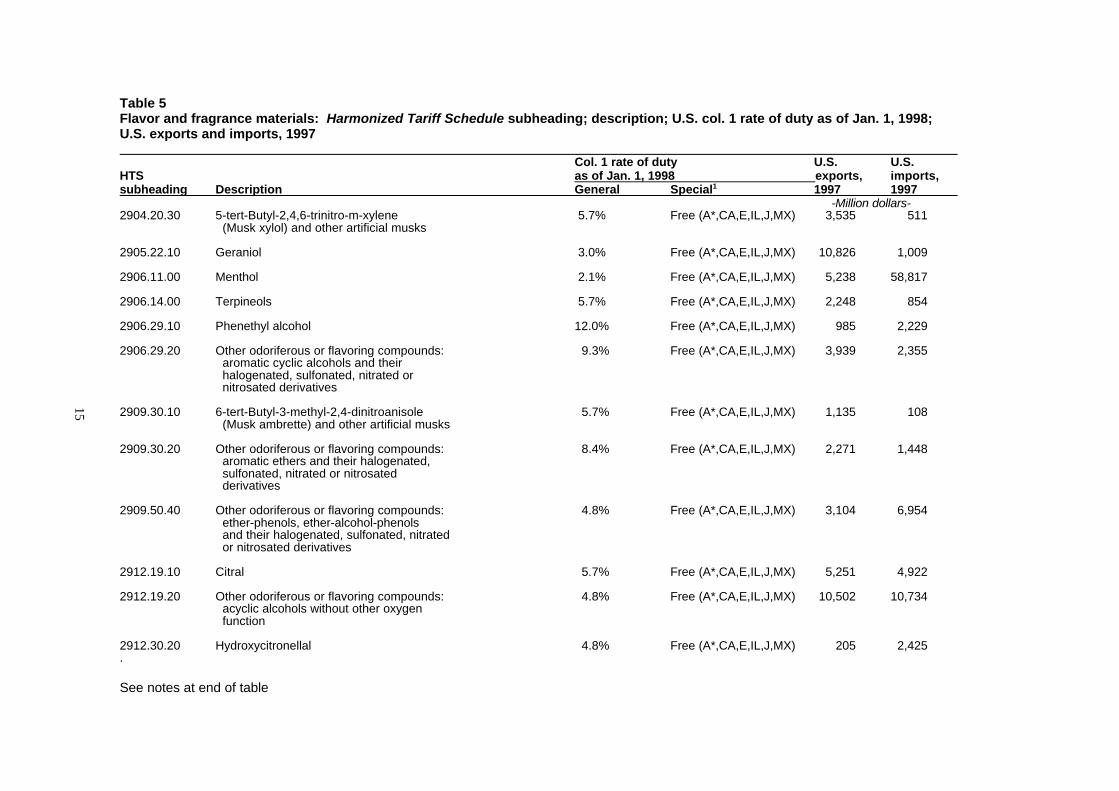
Table 5Flavor and fragrance materials: Harmonized Tariff Schedule subheading; description; U.S. col. 1 rate of duty as of Jan. 1, 1998; U.S. exports and imports, 1997
Col. 1 rate of duty U.S. U.S.HTS as of Jan. 1, 1998 exports, imports,subheading Description General Special1 1997 1997
-Million dollars-2904.20.30 5-tert-Butyl-2,4,6-trinitro-m-xylene 5.7% Free (A*,CA,E,IL,J,MX) 3,535 511
(Musk xylol) and other artificial musks
2905.22.10 Geraniol 3.0% Free (A*,CA,E,IL,J,MX) 10,826 1,009
2906.11.00 Menthol 2.1% Free (A*,CA,E,IL,J,MX) 5,238 58,817
2906.14.00 Terpineols 5.7% Free (A*,CA,E,IL,J,MX) 2,248 854
2906.29.10 Phenethyl alcohol 12.0% Free (A*,CA,E,IL,J,MX) 985 2,229
2906.29.20 Other odoriferous or flavoring compounds: 9.3% Free (A*,CA,E,IL,J,MX) 3,939 2,355 aromatic cyclic alcohols and their halogenated, sulfonated, nitrated or nitrosated derivatives
2909.30.10 6-tert-Butyl-3-methyl-2,4-dinitroanisole 5.7% Free (A*,CA,E,IL,J,MX) 1,135 108 (Musk ambrette) and other artificial musks
2909.30.20 Other odoriferous or flavoring compounds: 8.4% Free (A*,CA,E,IL,J,MX) 2,271 1,448 aromatic ethers and their halogenated, sulfonated, nitrated or nitrosated derivatives
2909.50.40 Other odoriferous or flavoring compounds: 4.8% Free (A*,CA,E,IL,J,MX) 3,104 6,954 ether-phenols, ether-alcohol-phenols and their halogenated, sulfonated, nitrated or nitrosated derivatives
2912.19.10 Citral 5.7% Free (A*,CA,E,IL,J,MX) 5,251 4,922
2912.19.20 Other odoriferous or flavoring compounds: 4.8% Free (A*,CA,E,IL,J,MX) 10,502 10,734 acyclic alcohols without other oxygen function
2912.30.20 Hydroxycitronellal 4.8% Free (A*,CA,E,IL,J,MX) 205 2,425.
See notes at end of table
15
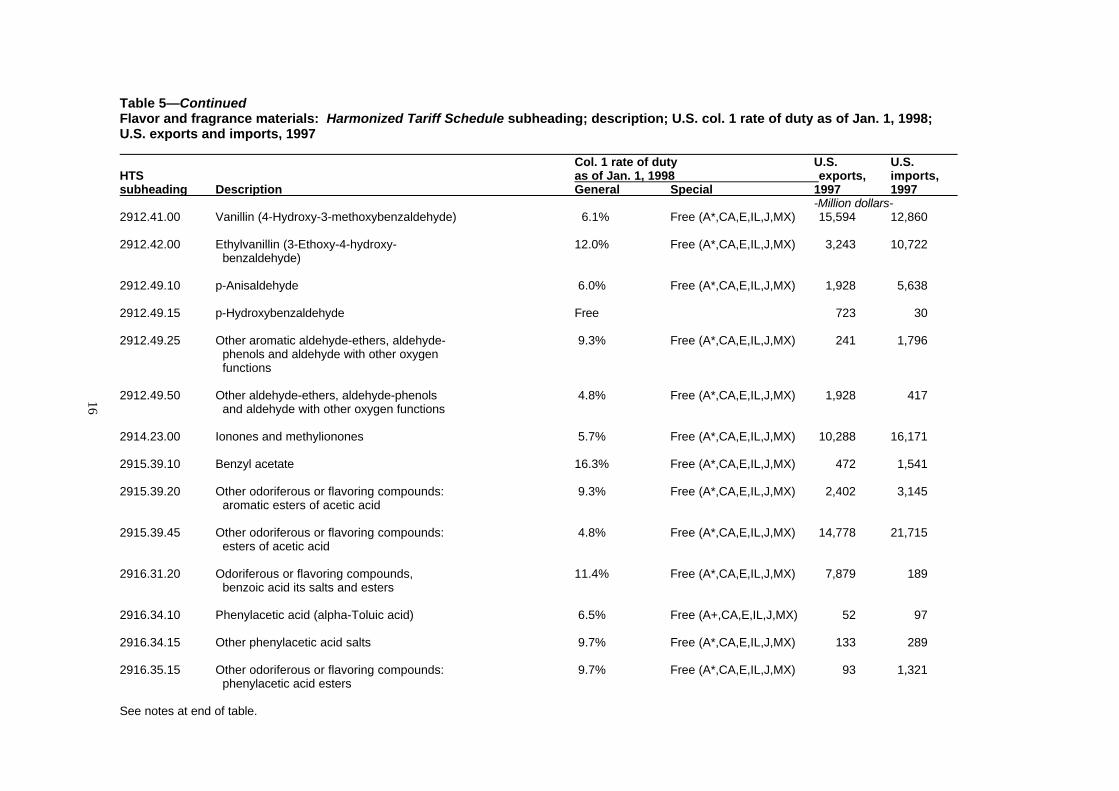
Table 5—ContinuedFlavor and fragrance materials: Harmonized Tariff Schedule subheading; description; U.S. col. 1 rate of duty as of Jan. 1, 1998; U.S. exports and imports, 1997
Col. 1 rate of duty U.S. U.S.HTS as of Jan. 1, 1998 exports, imports,subheading Description General Special 1997 1997
-Million dollars-2912.41.00 Vanillin (4-Hydroxy-3-methoxybenzaldehyde) 6.1% Free (A*,CA,E,IL,J,MX) 15,594 12,860
2912.42.00 Ethylvanillin (3-Ethoxy-4-hydroxy- 12.0% Free (A*,CA,E,IL,J,MX) 3,243 10,722 benzaldehyde)
2912.49.10 p-Anisaldehyde 6.0% Free (A*,CA,E,IL,J,MX) 1,928 5,638
2912.49.15 p-Hydroxybenzaldehyde Free 723 30
2912.49.25 Other aromatic aldehyde-ethers, aldehyde- 9.3% Free (A*,CA,E,IL,J,MX) 241 1,796 phenols and aldehyde with other oxygen functions
2912.49.50 Other aldehyde-ethers, aldehyde-phenols 4.8% Free (A*,CA,E,IL,J,MX) 1,928 417 and aldehyde with other oxygen functions
2914.23.00 Ionones and methylionones 5.7% Free (A*,CA,E,IL,J,MX) 10,288 16,171
2915.39.10 Benzyl acetate 16.3% Free (A*,CA,E,IL,J,MX) 472 1,541
2915.39.20 Other odoriferous or flavoring compounds: 9.3% Free (A*,CA,E,IL,J,MX) 2,402 3,145 aromatic esters of acetic acid
2915.39.45 Other odoriferous or flavoring compounds: 4.8% Free (A*,CA,E,IL,J,MX) 14,778 21,715
esters of acetic acid
2916.31.20 Odoriferous or flavoring compounds, 11.4% Free (A*,CA,E,IL,J,MX) 7,879 189 benzoic acid its salts and esters
2916.34.10 Phenylacetic acid (alpha-Toluic acid) 6.5% Free (A+,CA,E,IL,J,MX) 52 97
2916.34.15 Other phenylacetic acid salts 9.7% Free (A*,CA,E,IL,J,MX) 133 289
2916.35.15 Other odoriferous or flavoring compounds: 9.7% Free (A*,CA,E,IL,J,MX) 93 1,321 phenylacetic acid esters
See notes at end of table.
16
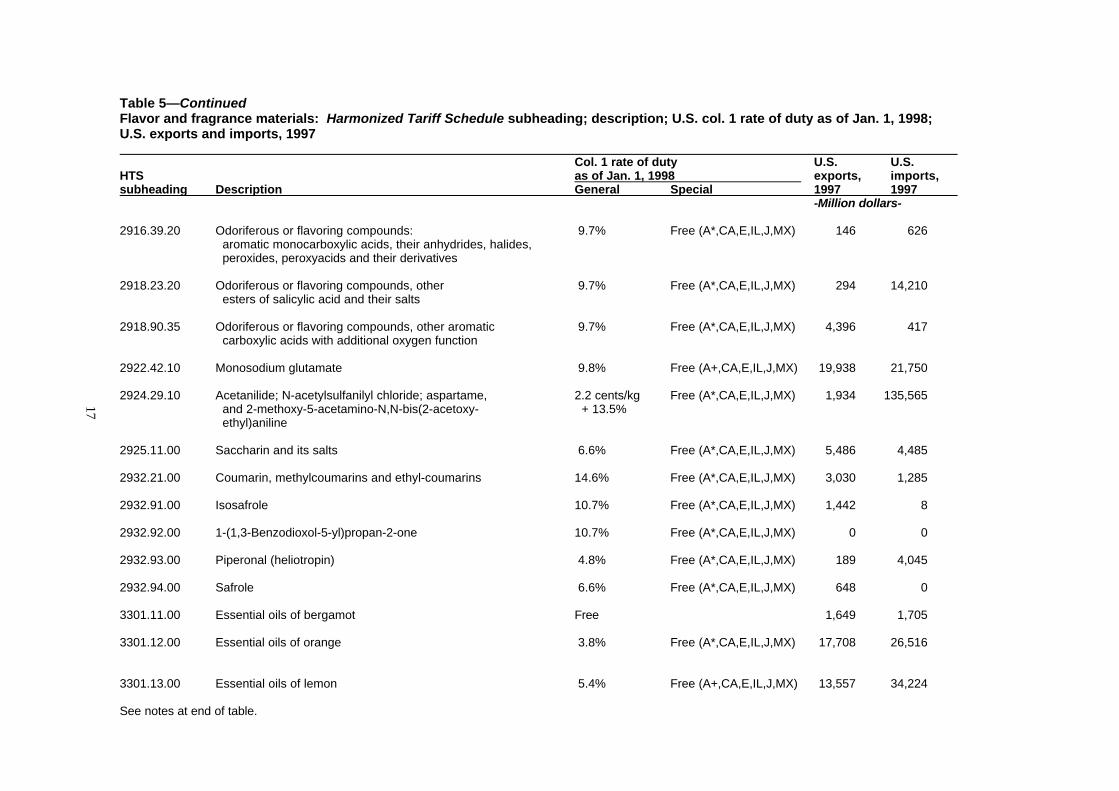
Table 5—ContinuedFlavor and fragrance materials: Harmonized Tariff Schedule subheading; description; U.S. col. 1 rate of duty as of Jan. 1, 1998; U.S. exports and imports, 1997
Col. 1 rate of duty U.S. U.S.HTS as of Jan. 1, 1998 exports, imports,subheading Description General Special 1997 1997
-Million dollars-
2916.39.20 Odoriferous or flavoring compounds: 9.7% Free (A*,CA,E,IL,J,MX) 146 626 aromatic monocarboxylic acids, their anhydrides, halides, peroxides, peroxyacids and their derivatives
2918.23.20 Odoriferous or flavoring compounds, other 9.7% Free (A*,CA,E,IL,J,MX) 294 14,210 esters of salicylic acid and their salts
2918.90.35 Odoriferous or flavoring compounds, other aromatic 9.7% Free (A*,CA,E,IL,J,MX) 4,396 417 carboxylic acids with additional oxygen function
2922.42.10 Monosodium glutamate 9.8% Free (A+,CA,E,IL,J,MX) 19,938 21,750
2924.29.10 Acetanilide; N-acetylsulfanilyl chloride; aspartame, 2.2 cents/kg Free (A*,CA,E,IL,J,MX) 1,934 135,565 and 2-methoxy-5-acetamino-N,N-bis(2-acetoxy- + 13.5% ethyl)aniline
2925.11.00 Saccharin and its salts 6.6% Free (A*,CA,E,IL,J,MX) 5,486 4,485
2932.21.00 Coumarin, methylcoumarins and ethyl-coumarins 14.6% Free (A*,CA,E,IL,J,MX) 3,030 1,285
2932.91.00 Isosafrole 10.7% Free (A*,CA,E,IL,J,MX) 1,442 8
2932.92.00 1-(1,3-Benzodioxol-5-yl)propan-2-one 10.7% Free (A*,CA,E,IL,J,MX) 0 0
2932.93.00 Piperonal (heliotropin) 4.8% Free (A*,CA,E,IL,J,MX) 189 4,045
2932.94.00 Safrole 6.6% Free (A*,CA,E,IL,J,MX) 648 0
3301.11.00 Essential oils of bergamot Free 1,649 1,705
3301.12.00 Essential oils of orange 3.8% Free (A*,CA,E,IL,J,MX) 17,708 26,516
3301.13.00 Essential oils of lemon 5.4% Free (A+,CA,E,IL,J,MX) 13,557 34,224
See notes at end of table.
17
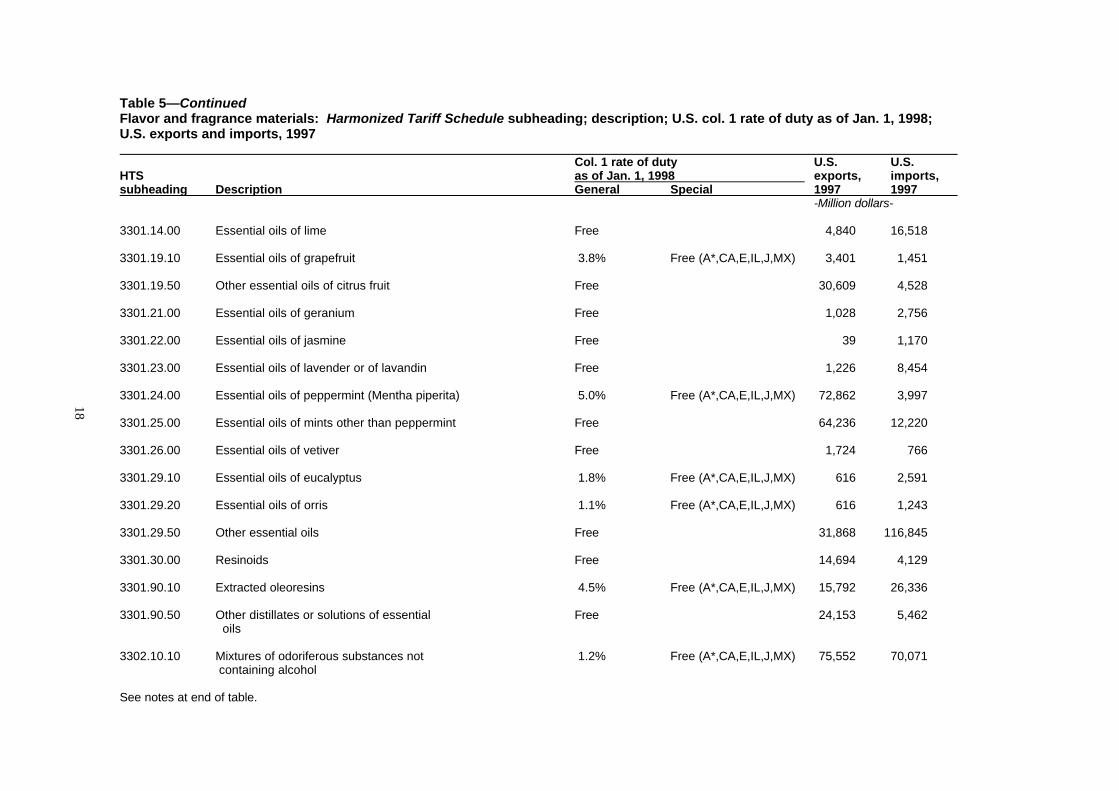
Table 5—ContinuedFlavor and fragrance materials: Harmonized Tariff Schedule subheading; description; U.S. col. 1 rate of duty as of Jan. 1, 1998; U.S. exports and imports, 1997
Col. 1 rate of duty U.S. U.S.HTS as of Jan. 1, 1998 exports, imports,subheading Description General Special 1997 1997
-Million dollars-
3301.14.00 Essential oils of lime Free 4,840 16,518
3301.19.10 Essential oils of grapefruit 3.8% Free (A*,CA,E,IL,J,MX) 3,401 1,451
3301.19.50 Other essential oils of citrus fruit Free 30,609 4,528
3301.21.00 Essential oils of geranium Free 1,028 2,756
3301.22.00 Essential oils of jasmine Free 39 1,170 3301.23.00 Essential oils of lavender or of lavandin Free 1,226 8,454
3301.24.00 Essential oils of peppermint (Mentha piperita) 5.0% Free (A*,CA,E,IL,J,MX) 72,862 3,997
3301.25.00 Essential oils of mints other than peppermint Free 64,236 12,220
3301.26.00 Essential oils of vetiver Free 1,724 766
3301.29.10 Essential oils of eucalyptus 1.8% Free (A*,CA,E,IL,J,MX) 616 2,591
3301.29.20 Essential oils of orris 1.1% Free (A*,CA,E,IL,J,MX) 616 1,243
3301.29.50 Other essential oils Free 31,868 116,845
3301.30.00 Resinoids Free 14,694 4,129
3301.90.10 Extracted oleoresins 4.5% Free (A*,CA,E,IL,J,MX) 15,792 26,336
3301.90.50 Other distillates or solutions of essential Free 24,153 5,462 oils
3302.10.10 Mixtures of odoriferous substances not 1.2% Free (A*,CA,E,IL,J,MX) 75,552 70,071 containing alcohol
See notes at end of table.
18
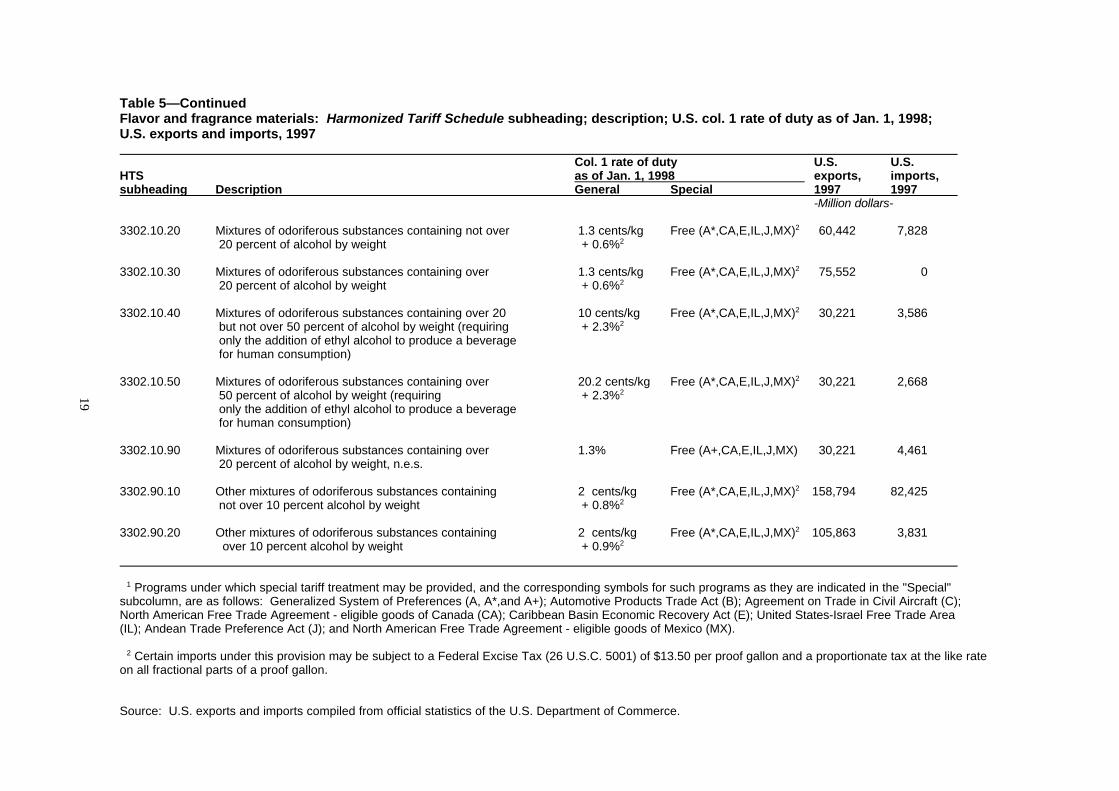
Table 5—ContinuedFlavor and fragrance materials: Harmonized Tariff Schedule subheading; description; U.S. col. 1 rate of duty as of Jan. 1, 1998; U.S. exports and imports, 1997
Col. 1 rate of duty U.S. U.S.HTS as of Jan. 1, 1998 exports, imports,subheading Description General Special 1997 1997
-Million dollars-
3302.10.20 Mixtures of odoriferous substances containing not over 1.3 cents/kg Free (A*,CA,E,IL,J,MX)2 60,442 7,828 20 percent of alcohol by weight + 0.6%2
3302.10.30 Mixtures of odoriferous substances containing over 1.3 cents/kg Free (A*,CA,E,IL,J,MX)2 75,552 0 20 percent of alcohol by weight + 0.6%2
3302.10.40 Mixtures of odoriferous substances containing over 20 10 cents/kg Free (A*,CA,E,IL,J,MX)2 30,221 3,586 but not over 50 percent of alcohol by weight (requiring + 2.3%2 only the addition of ethyl alcohol to produce a beverage for human consumption)
3302.10.50 Mixtures of odoriferous substances containing over 20.2 cents/kg Free (A*,CA,E,IL,J,MX)2 30,221 2,668 50 percent of alcohol by weight (requiring + 2.3%2 only the addition of ethyl alcohol to produce a beverage for human consumption)
3302.10.90 Mixtures of odoriferous substances containing over 1.3% Free (A+,CA,E,IL,J,MX) 30,221 4,461 20 percent of alcohol by weight, n.e.s.
3302.90.10 Other mixtures of odoriferous substances containing 2 cents/kg Free (A*,CA,E,IL,J,MX)2 158,794 82,425 not over 10 percent alcohol by weight + 0.8%2
3302.90.20 Other mixtures of odoriferous substances containing 2 cents/kg Free (A*,CA,E,IL,J,MX)2 105,863 3,831
over 10 percent alcohol by weight + 0.9%2
1 Programs under which special tariff treatment may be provided, and the corresponding symbols for such programs as they are indicated in the "Special" subcolumn, are as follows: Generalized System of Preferences (A, A*,and A+); Automotive Products Trade Act (B); Agreement on Trade in Civil Aircraft (C);North American Free Trade Agreement - eligible goods of Canada (CA); Caribbean Basin Economic Recovery Act (E); United States-Israel Free Trade Area(IL); Andean Trade Preference Act (J); and North American Free Trade Agreement - eligible goods of Mexico (MX).
2 Certain imports under this provision may be subject to a Federal Excise Tax (26 U.S.C. 5001) of $13.50 per proof gallon and a proportionate tax at the like rate on all fractional parts of a proof gallon.
Source: U.S. exports and imports compiled from official statistics of the U.S. Department of Commerce.
19
36 “H&R Florasynth Combines with Creations Aromatiques,” Chemical Market Reporter,June 30, 1997, pp. 5 and 15.
20
Table 6Flavor and fragrance materials: U.S. exports of domestic merchandise, by principal markets, 1993-97
Source 1993 1994 1995 1996 1997
Value (1,000 dollars)
Canada . . . . . . . . . . . . . . . . . . . . . . 111,306 127,991 150,916 166,623 178,187
Japan . . . . . . . . . . . . . . . . . . . . . . . 132,739 162,055 154,784 174,168 126,495
Mexico . . . . . . . . . . . . . . . . . . . . . . . 46,896 56,551 53,424 61,932 74,119
United Kingdom . . . . . . . . . . . . . . . . 40,741 48,639 52,209 63,442 64,331
France . . . . . . . . . . . . . . . . . . . . . . . 33,550 35,792 39,138 37,597 51,397
Germany . . . . . . . . . . . . . . . . . . . . . 24,604 31,374 30,546 32,442 44,500
Belgium . . . . . . . . . . . . . . . . . . . . . . 23,081 27,154 29,043 33,157 39,967
Hong Kong . . . . . . . . . . . . . . . . . . . 19,326 26,427 34,162 32,306 37,657
Netherlands . . . . . . . . . . . . . . . . . . . 22,488 31,765 36,803 37,876 36,917
Brazil . . . . . . . . . . . . . . . . . . . . . . . . 10,370 11,613 20,268 18,682 23,741
All Other . . . . . . . . . . . . . . . . . . . . . 268,984 288,866 309,004 322,684 336,985
Total . . . . . . . . . . . . . . . . . . . . . . . . 734,085 848,228 910,298 980,909 1,014,296
Source: Compiled from official statistic of the U.S. Department of Commerce.
Foreign Trade Measures
Tariffs on flavor and fragrance materials in most of our trading partners closely parallelU.S. tariffs, with most current rates ranging from free to approximately 7 percent.Although some rates exceed 10 percent, these are primarily applied to “mixtures of flavorsthat can be used with ethyl alcohol to produce a drink suitable for human consumption.”The pure natural materials, primarily oleoresins and essential oils, are typically free innations where they are not available from domestic producers.
FOREIGN INDUSTRY PROFILEMajor world producers of flavor and fragrance materials are located in Western Europe(France and Switzerland), the major trading nations of the Pacific Rim (Hong Kong,Singapore, Japan), and nations with the potential to develop major industries based onsignificant domestic natural resources (China, India, Brazil). The large multinational firmsbased in Western Europe and the United States, and to a lesser extent Japan, tend todominate the industry, although the European firms tend to have more developed networksand infrastructures for supplying most of the world’s markets. For example, Haarman &Reimer, a subsidiary of Bayer AG (Germany), acquired a number of smaller firms (e.g.,Florasynth (U.S.), and Creations Aromatiques (originally based in France and formerlyowned by PFW, Inc., a U.S. firm)) during 1993-97 to improve their global production,marketing and distribution capabilities.36 There also remains significant production offlavor and fragrance materials in and around major Asian seaport trading centers, suchas Hong Kong and Singapore.
37 “BBA Broadens Global Reach with Addition of Indian Plant,” Chemical MarketReporter, Nov. 24, 1997, pp. 1 and 15; and “F&F Firms Solidify Positions with Spate ofExpansion Moves,” Chemical Market Reporter, Dec. 1, 1997, p. 16. 38 “F&F Firms Solidify Positions with Spate of Expansion Moves,” Chemical MarketingReporter, Dec. 1, 1997, p. 16. 39 Ibid.
21
In general, participants in the flavor and fragrances industry are seeking to expand acrossinternational boundaries both by acquisition and through development of new enterprisesin both major markets and in areas where raw materials are available.37 Several majormultinational firms are planning on developing new production facilities in India over thenext several years to serve the emerging Asia-Pacific market.38 At the same time, thesefirms are also planning plant expansions in U.S. and European markets in anticipation ofprojected growth in demand for flavor and fragrance materials.39

APPENDIX ATARIFF AND TRADE AGREEMENTTERMS
A-2
TARIFF AND TRADE AGREEMENTTERMS
In the Harmonized Tariff Schedule of the United States (HTS), chapters 1 through 97 coverall goods in trade and incorporate in the tariff nomenclature the internationally adoptedHarmonized Commodity Description and Coding System through the 6-digit level of productdescription. Subordinate 8-digit product subdivisions, either enacted by Congress orproclaimed by the President, allow more narrowly applicable duty rates; 10-digitadministrative statistical reporting numbers provide data of national interest. Chapters 98 and99 contain special U.S. classifications and temporary rate provisions, respectively. The HTSreplaced the Tariff Schedules of the United States (TSUS) effective January 1, 1989.
Duty rates in the general subcolumn of HTS column 1 are most-favored-nation (now referredto as normal trade relations) rates, many of which have been eliminated or are being reducedas concessions resulting from the Uruguay Round of Multilateral Trade Negotiations.Column 1-general duty rates apply to all countries except those listed in HTS general note3(b) (Afghanistan, Cuba, Laos, North Korea, and Vietnam), which are subject to the statutoryrates set forth in column 2. Specified goods from designated general-rate countries may beeligible for reduced rates of duty or for duty-free entry under one or more preferential tariffprograms. Such tariff treatment is set forth in the special subcolumn of HTS rate of dutycolumn 1 or in the general notes. If eligibility for special tariff rates is not claimed orestablished, goods are dutiable at column 1-general rates. The HTS does not enumerate thosecountries as to which a total or partial embargo has been declared.
The Generalized System of Preferences (GSP) affords nonreciprocal tariff preferences todeveloping countries to aid their economic development and to diversify and expand theirproduction and exports. The U.S. GSP, enacted in title V of the Trade Act of 1974 for 10years and extended several times thereafter, applies to merchandise imported on or afterJanuary 1, 1976 and before the close of June 30, 1999. Indicated by the symbol "A", "A*",or "A+" in the special subcolumn, the GSP provides duty-free entry to eligible articles theproduct of and imported directly from designated beneficiary developing countries, as set forthin general note 4 to the HTS.
The Caribbean Basin Economic Recovery Act (CBERA) affords nonreciprocal tariffpreferences to developing countries in the Caribbean Basin area to aid their economicdevelopment and to diversify and expand their production and exports. The CBERA, enactedin title II of Public Law 98-67, implemented by Presidential Proclamation 5133 of November30, 1983, and amended by the Customs and Trade Act of 1990, applies to merchandiseentered, or withdrawn from warehouse for consumption, on or after January 1, 1984.Indicated by the symbol "E" or "E*" in the special subcolumn, the CBERA provides duty-freeentry to eligible articles, and reduced-duty treatment to certain other articles, which are theproduct of and imported directly from designated countries, as set forth in general note 7 tothe HTS.
Free rates of duty in the special subcolumn followed by the symbol "IL" are applicable toproducts of Israel under the United States-Israel Free Trade Area Implementation Act of1985 (IFTA), as provided in general note 8 to the HTS.
A-3
Preferential nonreciprocal duty-free or reduced-duty treatment in the special subcolumnfollowed by the symbol "J" or "J*" in parentheses is afforded to eligible articles the productof designated beneficiary countries under the Andean Trade Preference Act (ATPA), enactedas title II of Public Law 102-182 and implemented by Presidential Proclamation 6455 of July2, 1992 (effective July 22, 1992), as set forth in general note 11 to the HTS.
Preferential free rates of duty in the special subcolumn followed by the symbol "CA" areapplicable to eligible goods of Canada, and rates followed by the symbol "MX" are applicableto eligible goods of Mexico, under the North American Free Trade Agreement, as providedin general note 12 to the HTS and implemented effective January 1, 1994 by PresidentialProclamation 6641 of December 15, 1993. Goods must originate in the NAFTA region underrules set forth in general note 12(t) and meet other requirements of the note and applicableregulations.
Other special tariff treatment applies to particular products of insular possessions (generalnote 3(a)(iv)), products of the West Bank and Gaza Strip (general note 3(a)(v)), goodscovered by the Automotive Products Trade Act (APTA) (general note 5) and the Agreementon Trade in Civil Aircraft (ATCA) (general note 6), articles imported from freelyassociated states (general note 10), pharmaceutical products (general note 13), andintermediate chemicals for dyes (general note 14).
The General Agreement on Tariffs and Trade 1994 (GATT 1994), pursuant to theAgreement Establishing the World Trade Organization, is based upon the earlier GATT 1947(61 Stat. (pt. 5) A58; 8 UST (pt. 2) 1786) as the primary multilateral system of disciplinesand principles governing international trade. Signatories' obligations under both the 1994 and1947 agreements focus upon most-favored-nation treatment, the maintenance of scheduledconcession rates of duty, and national treatment for imported products; the GATT alsoprovides the legal framework for customs valuation standards, "escape clause" (emergency)actions, antidumping and countervailing duties, dispute settlement, and other measures. Theresults of the Uruguay Round of multilateral tariff negotiations are set forth by way ofseparate schedules of concessions for each participating contracting party, with the U.S.schedule designated as Schedule XX. Pursuant to the Agreement on Textiles and Clothing(ATC) of the GATT 1994, member countries are phasing out restrictions on imports underthe prior "Arrangement Regarding International Trade in Textiles" (known as the MultifiberArrangement (MFA)). Under the MFA, which was a departure from GATT 1947 provisions,importing and exporting countries negotiated bilateral agreements limiting textile and apparelshipments, and importing countries could take unilateral action in the absence or violation ofan agreement. Quantitative limits had been established on imported textiles and apparel ofcotton, other vegetable fibers, wool, man-made fibers or silk blends in an effort to prevent orlimit market disruption in the importing countries. The ATC establishes notification andsafeguard procedures, along with other rules concerning the customs treatment of textile andapparel shipments, and calls for the eventual complete integration of this sector into the GATT1994 over a ten-year period, or by Jan. 1, 2005.