Embed Size (px)
Citation preview
Flat Clustering
Slides are mostly from Hinrich Schutze
March 27, 2017
1 / 79
Overview
1 Recap
2 Clustering: Introduction
3 Clustering in IR
4 K -means
5 Evaluation
6 How many clusters?
2 / 79
Outline
1 Recap
2 Clustering: Introduction
3 Clustering in IR
4 K -means
5 Evaluation
6 How many clusters?
3 / 79
Take-away today
What is clustering?
Applications of clustering in information retrieval
K -means algorithm
Evaluation of clustering
How many clusters?
4 / 79
Outline
1 Recap
2 Clustering: Introduction
3 Clustering in IR
4 K -means
5 Evaluation
6 How many clusters?
5 / 79
Clustering: Definition
(Document) clustering is the process of grouping a set ofdocuments into clusters of similar documents.
Documents within a cluster should be similar.
Documents from different clusters should be dissimilar.
Clustering is the most common form of unsupervised learning.
Unsupervised = there are no labeled or annotated data.
6 / 79
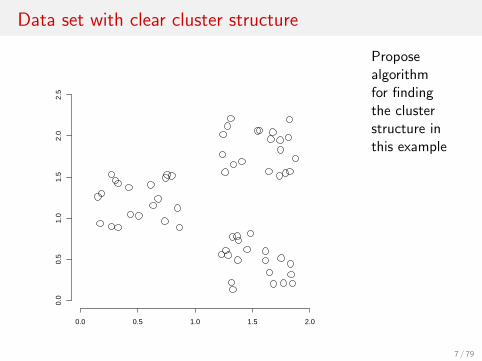
Data set with clear cluster structure
0.0 0.5 1.0 1.5 2.0
0.0
0.5
1.0
1.5
2.0
2.5
Proposealgorithmfor findingthe clusterstructure inthis example
7 / 79
Classification vs. Clustering
Classification: supervised learning
Clustering: unsupervised learning
Classification: Classes are human-defined and part of theinput to the learning algorithm.
Clustering: Clusters are inferred from the data without humaninput.
Many ways of influencing the outcome of clustering:
number of clusters,similarity measure,representation of documents,. . .
8 / 79
Outline
1 Recap
2 Clustering: Introduction
3 Clustering in IR
4 K -means
5 Evaluation
6 How many clusters?
9 / 79
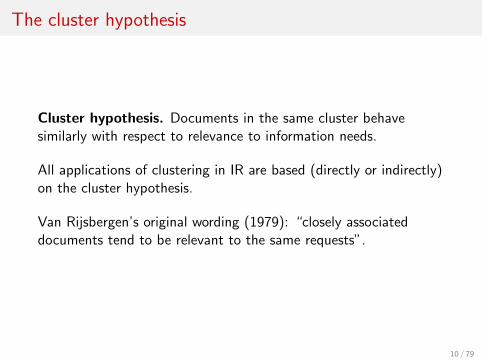
The cluster hypothesis
Cluster hypothesis. Documents in the same cluster behavesimilarly with respect to relevance to information needs.
All applications of clustering in IR are based (directly or indirectly)on the cluster hypothesis.
Van Rijsbergen’s original wording (1979): “closely associateddocuments tend to be relevant to the same requests”.
10 / 79
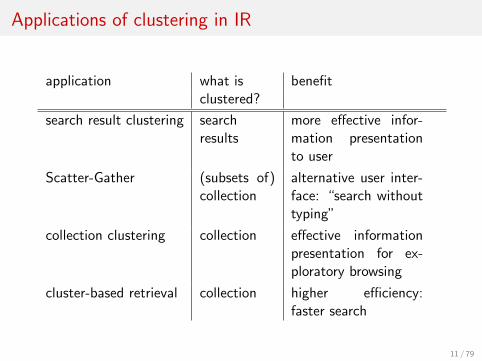
Applications of clustering in IR
application what is benefitclustered?
search result clustering searchresults
more effective infor-mation presentationto user
Scatter-Gather (subsets of)collection
alternative user inter-face: “search withouttyping”
collection clustering collection effective informationpresentation for ex-ploratory browsing
cluster-based retrieval collection higher efficiency:faster search
11 / 79

Search result clustering for better navigation
12 / 79
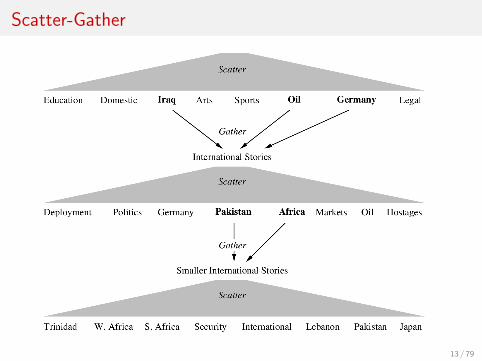
Scatter-Gather
13 / 79

Global navigation: Yahoo
14 / 79
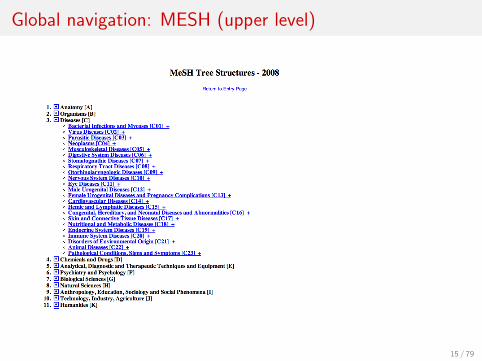
Global navigation: MESH (upper level)
15 / 79
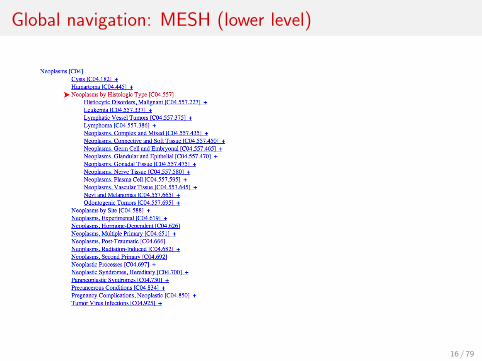
Global navigation: MESH (lower level)
16 / 79
Navigational hierarchies: Manual vs. automatic creation
Note: Yahoo/MESH are not examples of clustering.
But they are well known examples for using a global hierarchyfor navigation.
Some examples for global navigation/exploration based onclustering:
CartiaThemescapesGoogle News
17 / 79
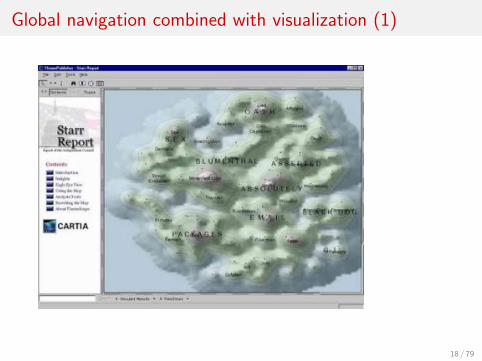
Global navigation combined with visualization (1)
18 / 79
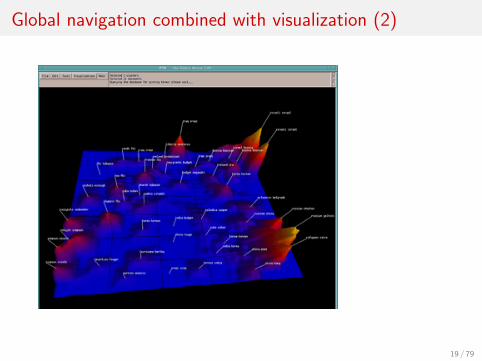
Global navigation combined with visualization (2)
19 / 79

Global clustering for navigation: Google News
http://news.google.com
20 / 79
Clustering for improving recall
To improve search recall:
Cluster docs in collection a prioriWhen a query matches a doc d , also return other docs in thecluster containing d
Hope: if we do this: the query “car” will also return docscontaining “automobile”
Because the clustering algorithm groups together docscontaining “car” with those containing “automobile”.Both types of documents contain words like “parts”, “dealer”,“mercedes”, “road trip”.
21 / 79

Data set with clear cluster structure
0.0 0.5 1.0 1.5 2.0
0.0
0.5
1.0
1.5
2.0
2.5
Proposealgorithmfor findingthe clusterstructure inthis example
22 / 79
Desiderata for clustering
General goal: put related docs in the same cluster, putunrelated docs in different clusters.
We’ll see different ways of formalizing this.
The number of clusters should be appropriate for the data setwe are clustering.
Initially, we will assume the number of clusters K is given.Later: Semiautomatic methods for determining K
Secondary goals in clustering
Avoid very small and very large clustersDefine clusters that are easy to explain to the userMany others . . .
23 / 79
Flat vs. Hierarchical clustering
Flat algorithms
Usually start with a random (partial) partitioning of docs intogroupsRefine iterativelyMain algorithm: K -means
Hierarchical algorithms
Create a hierarchyBottom-up, agglomerativeTop-down, divisive
24 / 79
Hard vs. Soft clustering
Hard clustering: Each document belongs to exactly onecluster.
More common and easier to do
Soft clustering: A document can belong to more than onecluster.
Makes more sense for applications like creating browsablehierarchiesYou may want to put sneakers in two clusters:
sports apparelshoes
You can only do that with a soft clustering approach.
25 / 79
Flat algorithms
Flat algorithms compute a partition of N documents into aset of K clusters.
Given: a set of documents and the number K
Find: a partition into K clusters that optimizes the chosenpartitioning criterion
Global optimization: exhaustively enumerate partitions, pickoptimal one
Not tractable
Effective heuristic method: K -means algorithm
26 / 79
Outline
1 Recap
2 Clustering: Introduction
3 Clustering in IR
4 K -means
5 Evaluation
6 How many clusters?
27 / 79
K -means
Perhaps the best known clustering algorithm
Simple, works well in many cases
Use as default / baseline for clustering documents
28 / 79
Document representations in clustering
Vector space model
relatedness between vectors can be measured by Euclideandistance, cosine similarity, etc.
29 / 79
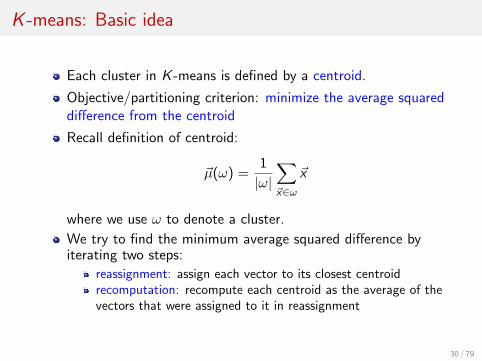
K -means: Basic idea
Each cluster in K -means is defined by a centroid.
Objective/partitioning criterion: minimize the average squareddifference from the centroid
Recall definition of centroid:
µ(ω) =1
|ω|∑x∈ω
x
where we use ω to denote a cluster.
We try to find the minimum average squared difference byiterating two steps:
reassignment: assign each vector to its closest centroidrecomputation: recompute each centroid as the average of thevectors that were assigned to it in reassignment
30 / 79
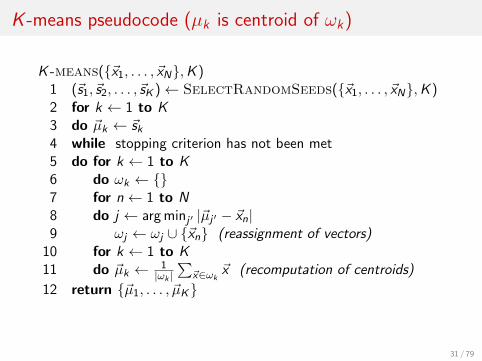
K -means pseudocode (µk is centroid of ωk)
K -means(x1, . . . , xN,K )1 (s1, s2, . . . , sK )← SelectRandomSeeds(x1, . . . , xN,K )2 for k ← 1 to K3 do µk ← sk4 while stopping criterion has not been met5 do for k ← 1 to K6 do ωk ← 7 for n← 1 to N8 do j ← argminj ′ |µj ′ − xn|9 ωj ← ωj ∪ xn (reassignment of vectors)
10 for k ← 1 to K11 do µk ← 1
|ωk |∑
x∈ωkx (recomputation of centroids)
12 return µ1, . . . , µK
31 / 79
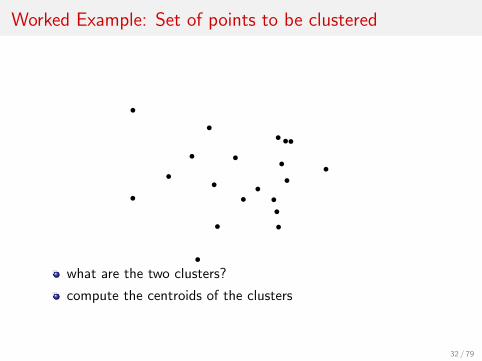
Worked Example: Set of points to be clustered
b
b
b
b
b
b
b bb
b
b
b
b
bb
b
bb
b b
what are the two clusters?
compute the centroids of the clusters
32 / 79
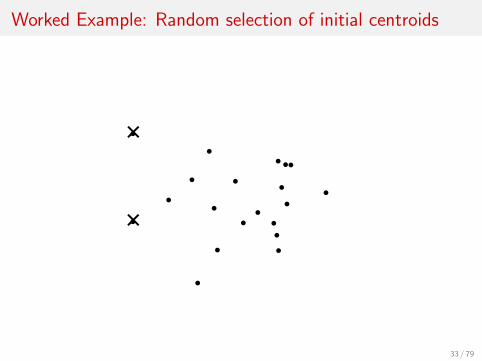
Worked Example: Random selection of initial centroids
b
b
b
b
b
b
b bb
b
b
b
b
bb
b
bb
b b
×
×
33 / 79
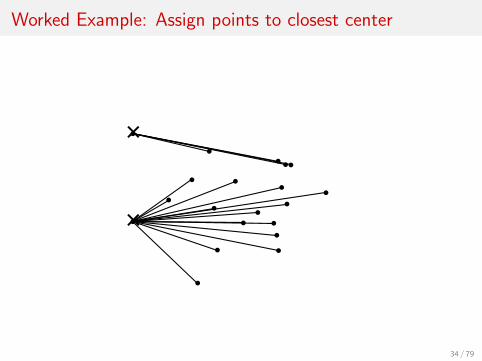
Worked Example: Assign points to closest center
b
b
b
b
b
b
b bb
b
b
b
b
bb
b
bb
b b
×
×
34 / 79
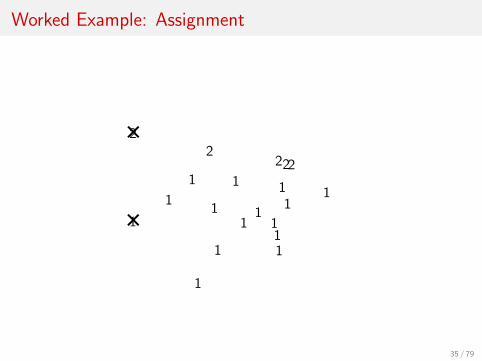
Worked Example: Assignment
2
1
1
2
1
1
1 111
1
1
1
11
2
11
2 2
×
×
35 / 79
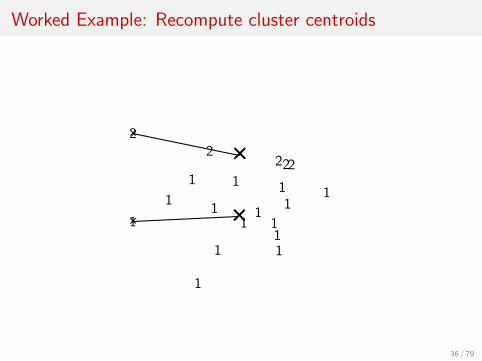
Worked Example: Recompute cluster centroids
2
1
1
2
1
1
1 111
1
1
1
11
2
11
2 2
×
×
×
×
36 / 79
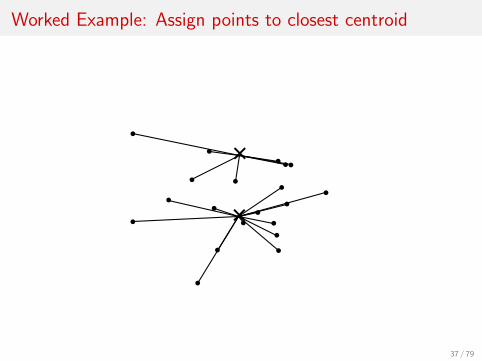
Worked Example: Assign points to closest centroid
b
b
b
b
b
b
b bb
b
b
b
b
bb
b
bb
b b
×
×
37 / 79
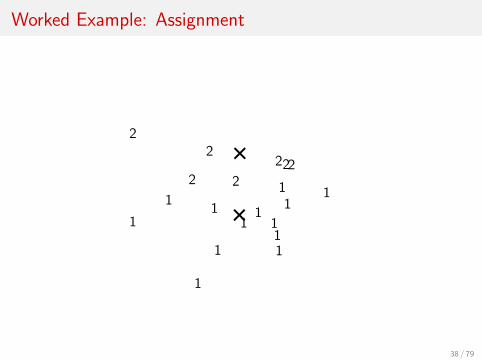
Worked Example: Assignment
2
2
1
2
1
1
1 111
1
2
1
11
2
11
2 2
×
×
38 / 79
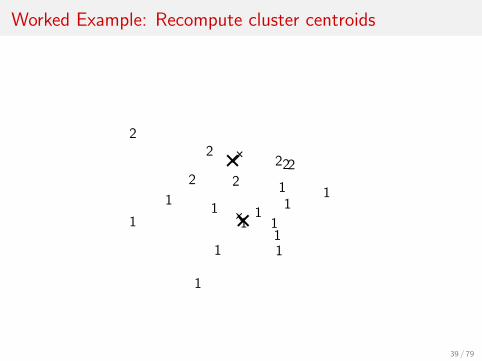
Worked Example: Recompute cluster centroids
2
2
1
2
1
1
1 111
1
2
1
11
2
11
2 2
×
×
×
×
39 / 79
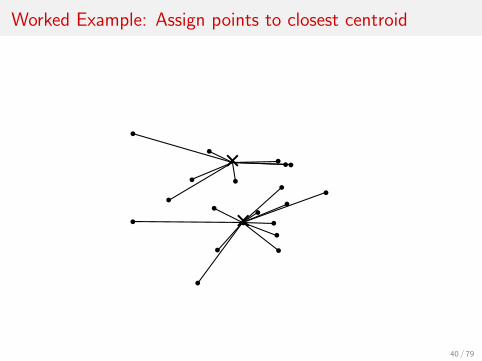
Worked Example: Assign points to closest centroid
b
b
b
b
b
b
b bb
b
b
b
b
bb
b
bb
b b
×
×
40 / 79
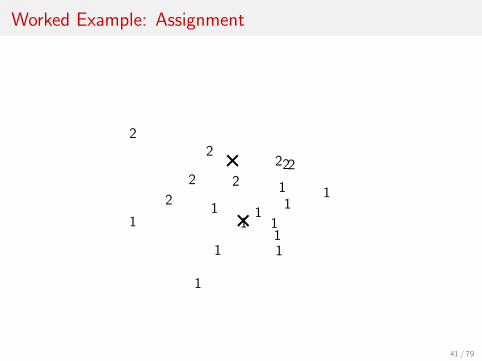
Worked Example: Assignment
2
2
2
2
1
1
1 111
1
2
1
11
2
11
2 2
×
×
41 / 79
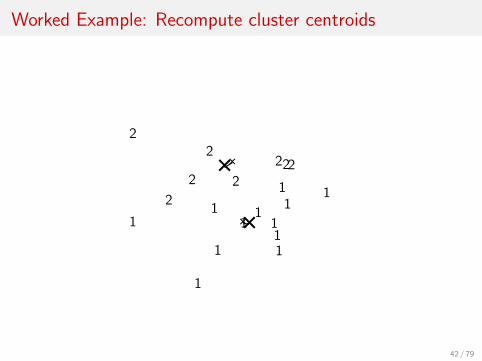
Worked Example: Recompute cluster centroids
2
2
2
2
1
1
1 111
1
2
1
11
2
11
2 2
×
×
×
×
42 / 79
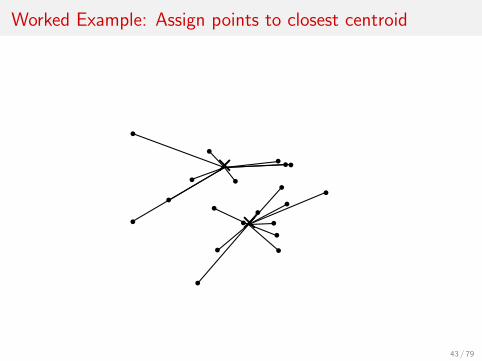
Worked Example: Assign points to closest centroid
b
b
b
b
b
b
b bb
b
b
b
b
bb
b
bb
b b
×
×
43 / 79
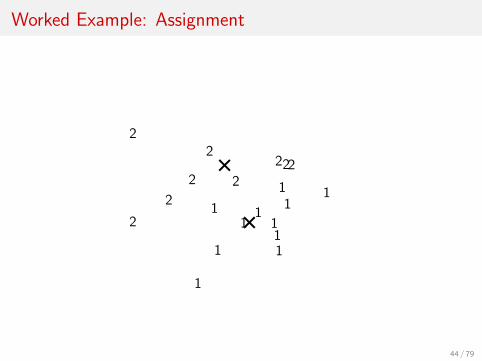
Worked Example: Assignment
2
2
2
2
1
1
1 121
1
2
1
11
2
11
2 2
×
×
44 / 79
Worked Example: Recompute cluster centroids
2
2
2
2
1
1
1 121
1
2
1
11
2
11
2 2
×
×
×
×
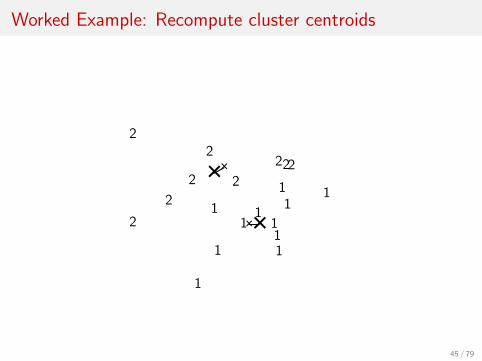
45 / 79
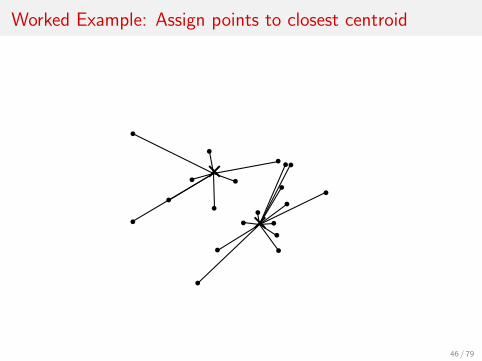
Worked Example: Assign points to closest centroid
b
b
b
b
b
b
b bb
b
b
b
b
bb
b
bb
b b
×
×
46 / 79
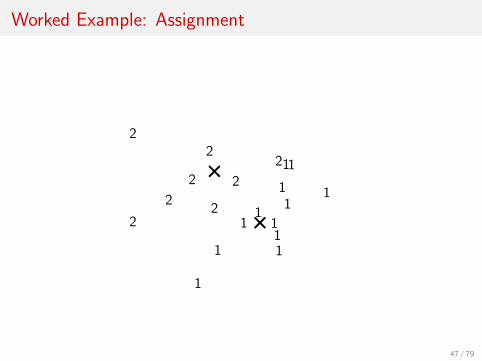
Worked Example: Assignment
2
2
2
2
1
1
1 122
1
2
1
11
1
11
2 1
×
×
47 / 79
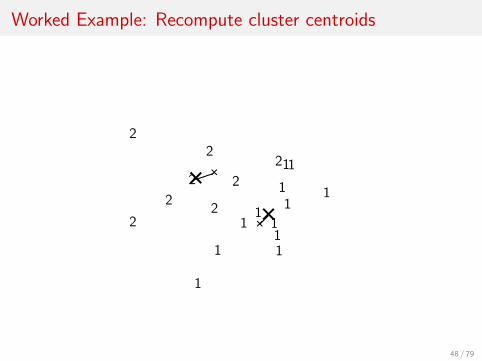
Worked Example: Recompute cluster centroids
2
2
2
2
1
1
1 122
1
2
1
11
1
11
2 1
××
×
×
48 / 79
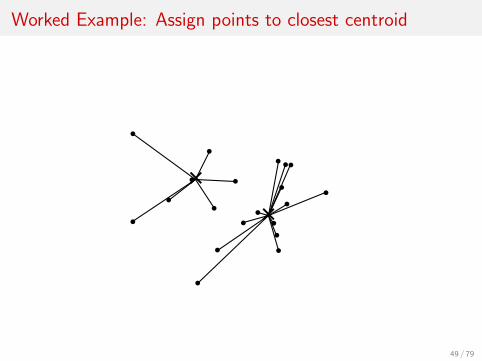
Worked Example: Assign points to closest centroid
b
b
b
b
b
b
b bb
b
b
b
b
bb
b
bb
b b
××
49 / 79
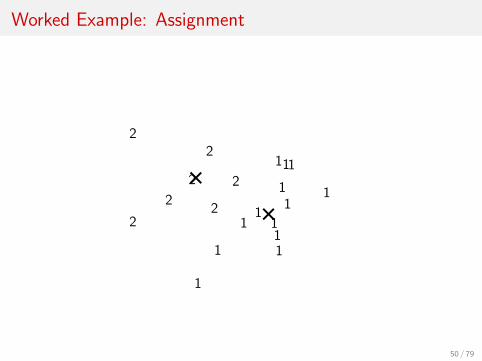
Worked Example: Assignment
2
2
2
2
1
1
1 122
1
2
1
11
1
11
1 1
××
50 / 79
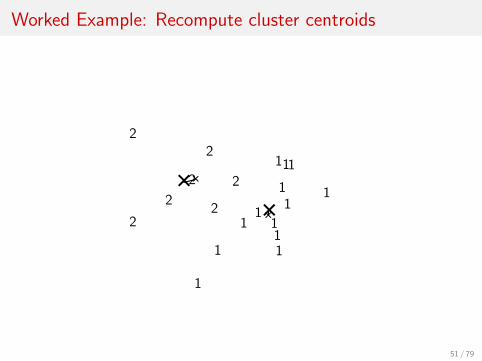
Worked Example: Recompute cluster centroids
2
2
2
2
1
1
1 122
1
2
1
11
1
11
1 1
××
×
×
51 / 79
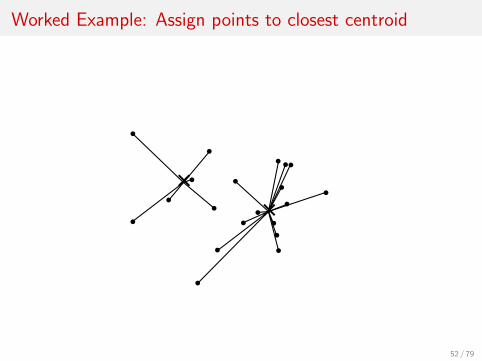
Worked Example: Assign points to closest centroid
b
b
b
b
b
b
b bb
b
b
b
b
bb
b
bb
b b
××
52 / 79
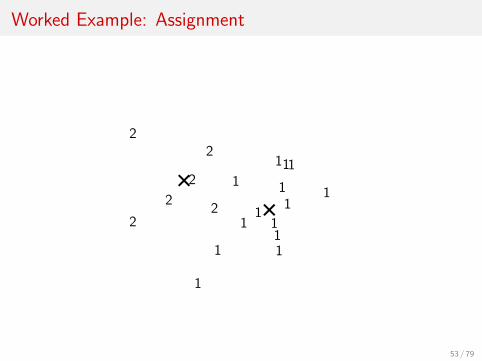
Worked Example: Assignment
2
2
2
2
1
1
1 122
1
1
1
11
1
11
1 1
××
53 / 79
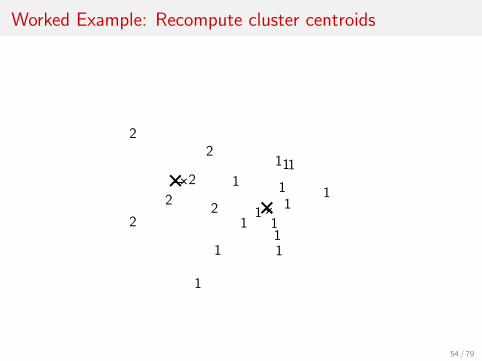
Worked Example: Recompute cluster centroids
2
2
2
2
1
1
1 122
1
1
1
11
1
11
1 1
××
×
×
54 / 79
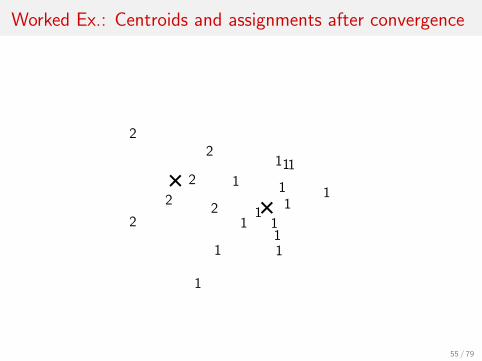
Worked Ex.: Centroids and assignments after convergence
2
2
2
2
1
1
1 122
1
1
1
11
1
11
1 1
××
55 / 79
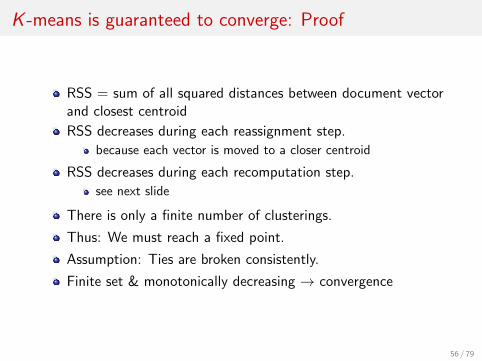
K -means is guaranteed to converge: Proof
RSS = sum of all squared distances between document vectorand closest centroid
RSS decreases during each reassignment step.
because each vector is moved to a closer centroid
RSS decreases during each recomputation step.
see next slide
There is only a finite number of clusterings.
Thus: We must reach a fixed point.
Assumption: Ties are broken consistently.
Finite set & monotonically decreasing → convergence
56 / 79
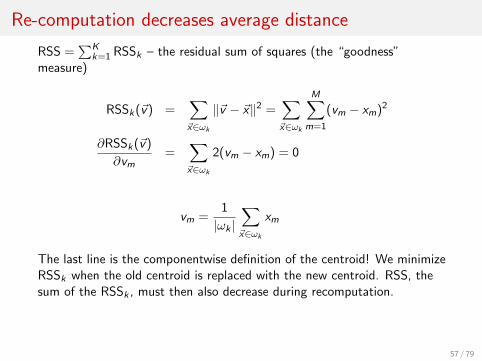
Re-computation decreases average distance
RSS =∑K
k=1 RSSk – the residual sum of squares (the “goodness”measure)
RSSk(v) =∑x∈ωk
∥v − x∥2 =∑x∈ωk
M∑m=1
(vm − xm)2
∂RSSk(v)
∂vm=
∑x∈ωk
2(vm − xm) = 0
vm =1
|ωk |∑x∈ωk
xm
The last line is the componentwise definition of the centroid! We minimizeRSSk when the old centroid is replaced with the new centroid. RSS, thesum of the RSSk , must then also decrease during recomputation.
57 / 79
K -means is guaranteed to converge
But we don’t know how long convergence will take!
If we don’t care about a few docs switching back and forth,then convergence is usually fast (< 10-20 iterations).
However, complete convergence can take many moreiterations.
58 / 79
Optimality of K -means
Convergence = optimality
Convergence does not mean that we converge to the optimalclustering!
This is the great weakness of K -means.
If we start with a bad set of seeds, the resulting clustering canbe horrible.
59 / 79
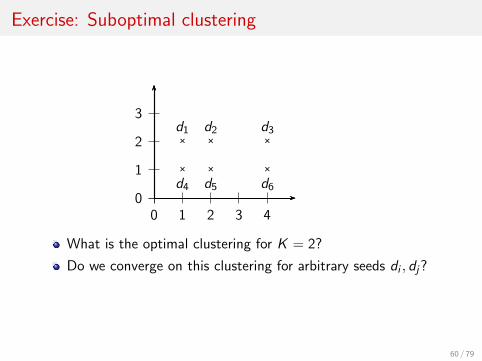
Exercise: Suboptimal clustering
0
1
2
3
0 1 2 3 4
×
×
×
×
×
×d1 d2 d3
d4 d5 d6
What is the optimal clustering for K = 2?
Do we converge on this clustering for arbitrary seeds di , dj?
60 / 79
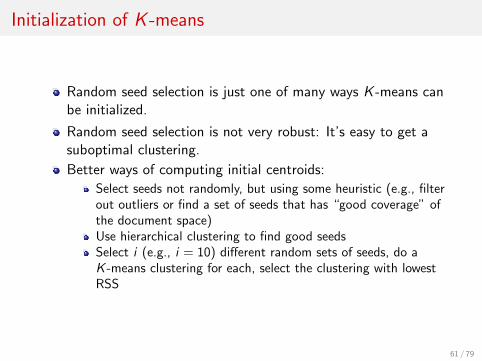
Initialization of K -means
Random seed selection is just one of many ways K -means canbe initialized.
Random seed selection is not very robust: It’s easy to get asuboptimal clustering.
Better ways of computing initial centroids:
Select seeds not randomly, but using some heuristic (e.g., filterout outliers or find a set of seeds that has “good coverage” ofthe document space)Use hierarchical clustering to find good seedsSelect i (e.g., i = 10) different random sets of seeds, do aK -means clustering for each, select the clustering with lowestRSS
61 / 79
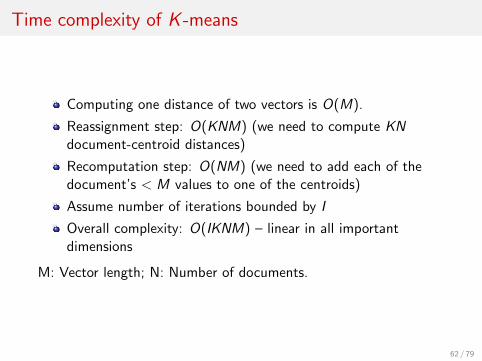
Time complexity of K -means
Computing one distance of two vectors is O(M).
Reassignment step: O(KNM) (we need to compute KNdocument-centroid distances)
Recomputation step: O(NM) (we need to add each of thedocument’s < M values to one of the centroids)
Assume number of iterations bounded by I
Overall complexity: O(IKNM) – linear in all importantdimensions
M: Vector length; N: Number of documents.
62 / 79
Outline
1 Recap
2 Clustering: Introduction
3 Clustering in IR
4 K -means
5 Evaluation
6 How many clusters?
63 / 79
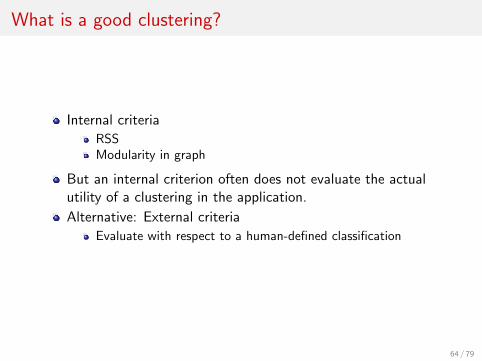
What is a good clustering?
Internal criteria
RSSModularity in graph
But an internal criterion often does not evaluate the actualutility of a clustering in the application.
Alternative: External criteria
Evaluate with respect to a human-defined classification
64 / 79
External criteria for clustering quality
Based on a gold standard data set, e.g., the Reuters collectionwe also used for the evaluation of classification
Goal: Clustering should reproduce the classes in the goldstandard
(But we only want to reproduce how documents are dividedinto groups, not the class labels.)
First measure for how well we were able to reproduce theclasses: purity
65 / 79
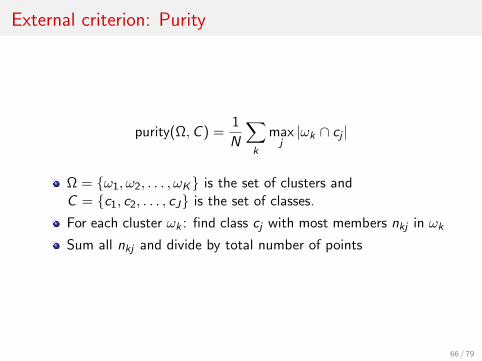
External criterion: Purity
purity(Ω,C ) =1
N
∑k
maxj|ωk ∩ cj |
Ω = ω1, ω2, . . . , ωK is the set of clusters andC = c1, c2, . . . , cJ is the set of classes.
For each cluster ωk : find class cj with most members nkj in ωk
Sum all nkj and divide by total number of points
66 / 79
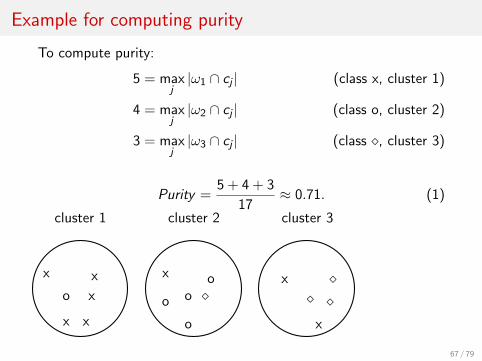
Example for computing purity
To compute purity:
5 = maxj|ω1 ∩ cj | (class x, cluster 1)
4 = maxj|ω2 ∩ cj | (class o, cluster 2)
3 = maxj|ω3 ∩ cj | (class ⋄, cluster 3)
Purity =5 + 4 + 3
17≈ 0.71. (1)
x
o
x x
x
x
o
x
o
o ⋄o x
⋄ ⋄⋄
x
cluster 1 cluster 2 cluster 3
67 / 79
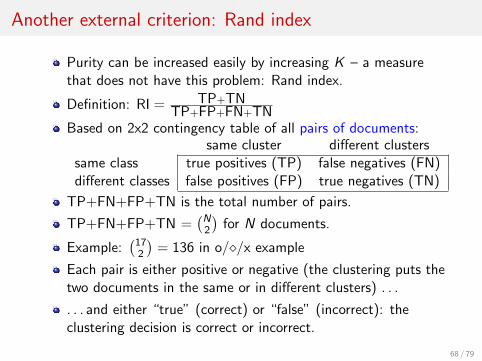
Another external criterion: Rand index
Purity can be increased easily by increasing K – a measurethat does not have this problem: Rand index.
Definition: RI = TP+TNTP+FP+FN+TN
Based on 2x2 contingency table of all pairs of documents:same cluster different clusters
same class true positives (TP) false negatives (FN)different classes false positives (FP) true negatives (TN)
TP+FN+FP+TN is the total number of pairs.
TP+FN+FP+TN =(N2
)for N documents.
Example:(172
)= 136 in o/⋄/x example
Each pair is either positive or negative (the clustering puts thetwo documents in the same or in different clusters) . . .
. . . and either “true” (correct) or “false” (incorrect): theclustering decision is correct or incorrect.
68 / 79
Rand Index: Example
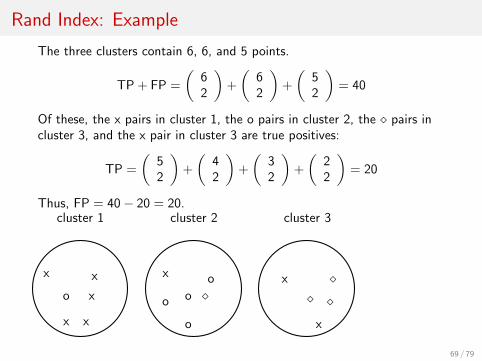
The three clusters contain 6, 6, and 5 points.
TP + FP =
(62
)+
(62
)+
(52
)= 40
Of these, the x pairs in cluster 1, the o pairs in cluster 2, the ⋄ pairs incluster 3, and the x pair in cluster 3 are true positives:
TP =
(52
)+
(42
)+
(32
)+
(22
)= 20
Thus, FP = 40− 20 = 20.
x
o
x x
x
x
o
x
o
o ⋄o x
⋄ ⋄
⋄
x
cluster 1 cluster 2 cluster 3
69 / 79
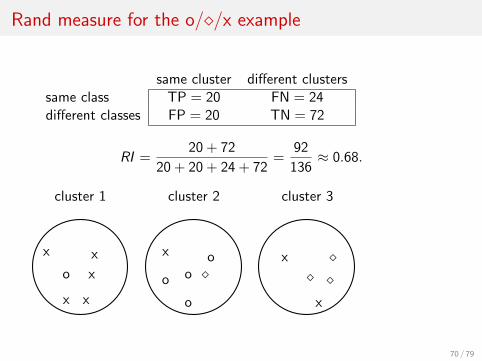
Rand measure for the o/⋄/x example
same cluster different clusterssame class TP = 20 FN = 24different classes FP = 20 TN = 72
RI =20 + 72
20 + 20 + 24 + 72=
92
136≈ 0.68.
x
o
x x
x
x
o
x
o
o ⋄o x
⋄ ⋄⋄
x
cluster 1 cluster 2 cluster 3
70 / 79
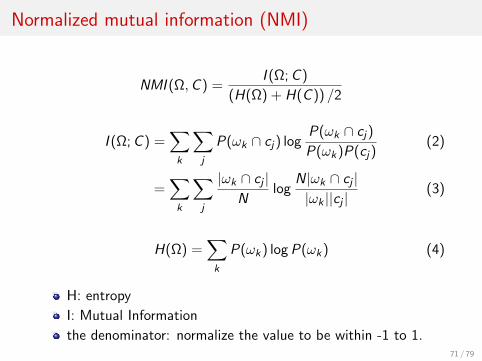
Normalized mutual information (NMI)
NMI (Ω,C ) =I (Ω;C )
(H(Ω) + H(C )) /2
I (Ω;C ) =∑k
∑j
P(ωk ∩ cj) logP(ωk ∩ cj)
P(ωk)P(cj)(2)
=∑k
∑j
|ωk ∩ cj |N
logN|ωk ∩ cj ||ωk ||cj |
(3)
H(Ω) =∑k
P(ωk) logP(ωk) (4)
H: entropy
I: Mutual Information
the denominator: normalize the value to be within -1 to 1.71 / 79
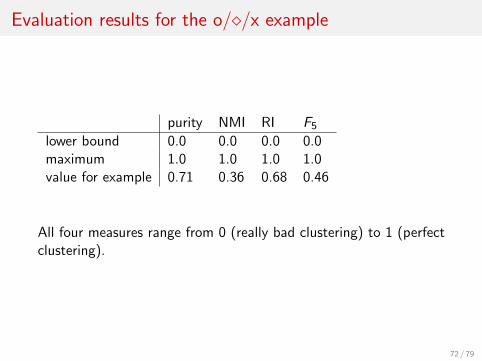
Evaluation results for the o/⋄/x example
purity NMI RI F5lower bound 0.0 0.0 0.0 0.0maximum 1.0 1.0 1.0 1.0value for example 0.71 0.36 0.68 0.46
All four measures range from 0 (really bad clustering) to 1 (perfectclustering).
72 / 79
Outline
1 Recap
2 Clustering: Introduction
3 Clustering in IR
4 K -means
5 Evaluation
6 How many clusters?
73 / 79
How many clusters?
Number of clusters K is given in many applications.
E.g., there may be an external constraint on K . Example: Inthe case of Scatter-Gather, it was hard to show more than10–20 clusters on a monitor in the 90s.
What if there is no external constraint? Is there a “right”number of clusters?
One way to go: define an optimization criterion
Given docs, find K for which the optimum is reached.What optimization criterion can we use?We can’t use RSS or average squared distance from centroidas criterion: always chooses K = N clusters.
74 / 79
Exercise
Your job is to develop the clustering algorithms for acompetitor to news.google.com
You want to use K -means clustering.
How would you determine K?
75 / 79
Simple objective function for K : Basic idea
Start with 1 cluster (K = 1)
Keep adding clusters (= keep increasing K )
Add a penalty for each new cluster
Then trade off cluster penalties against average squareddistance from centroid
Choose the value of K with the best tradeoff
76 / 79
Simple objective function for K : Formalization
Given a clustering, define the cost for a document as(squared) distance to centroid
Define total distortion RSS(K) as sum of all individualdocument costs (corresponds to average distance)
Then: penalize each cluster with a cost λ
Thus for a clustering with K clusters, total cluster penalty isKλ
Define the total cost of a clustering as distortion plus totalcluster penalty: RSS(K) + Kλ
Select K that minimizes (RSS(K) + Kλ)
Still need to determine good value for λ . . .
77 / 79
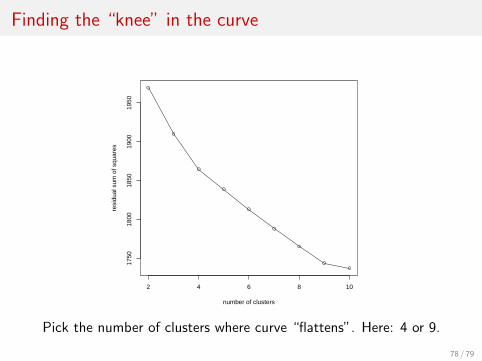
Finding the “knee” in the curve
2 4 6 8 10
1750
1800
1850
1900
1950
number of clusters
resi
dual
sum
of s
quar
es
Pick the number of clusters where curve “flattens”. Here: 4 or 9.
78 / 79

Take-away today
What is clustering?
Applications of clustering in information retrieval
K -means algorithm
Evaluation of clustering
How many clusters?
79 / 79