Embed Size (px)
Citation preview
Flash Crash of May 6, 2010 Why Did It Happen? Can It Happen Again?
Ali N. Akansu Department of Electrical and Computer Engineering
New Jersey Institute of Technology Newark, NJ 07102 USA
SKYPE: akansu1111 Direct: (908) 601-2622
http://web.njit.edu/~akansu
May 13, 2016
Turkish Capital Markets Association (Turkiye Sermaye Piyasalari Birligi)
Algoritmik İşlemler: Teori ve Pratik Paneli
Istanbul, Turkey
Outline
I. Introduction: NYSE
II. Financial Industry & Big Picture
III. Electronic Trading
IV. Market Makers
V. Limit Order Book (LOB)
VI. High Frequency Trading (HFT)
VII. Flash Crash of May 6, 2010
VIII.The Dude
IX. Looking Forward & Concluding Remarks
2
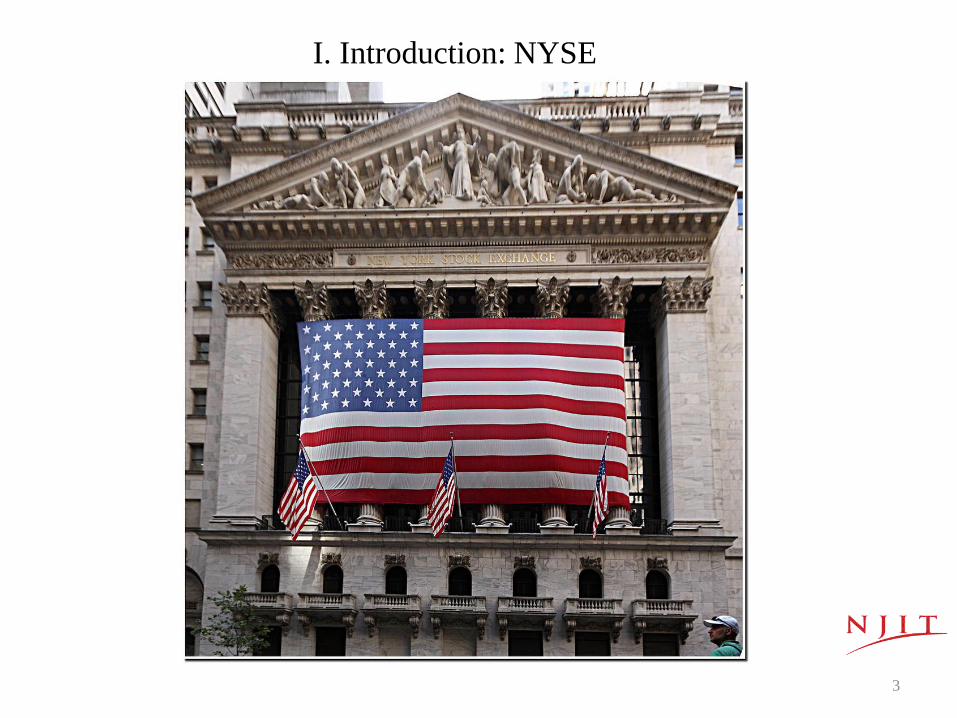
I. Introduction: NYSE
3
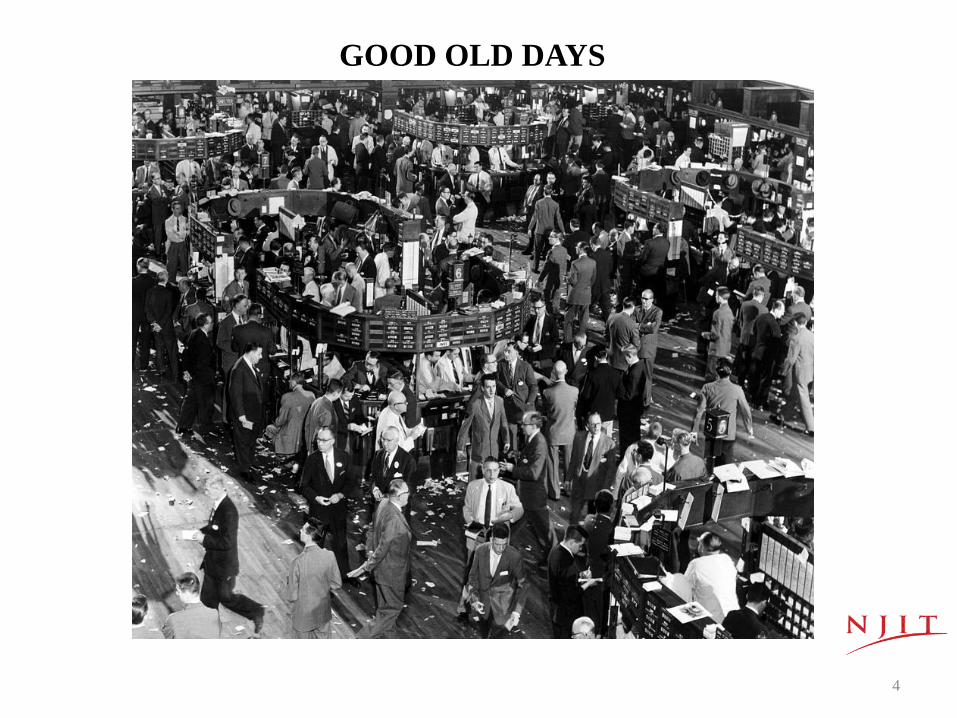
GOOD OLD DAYS
4
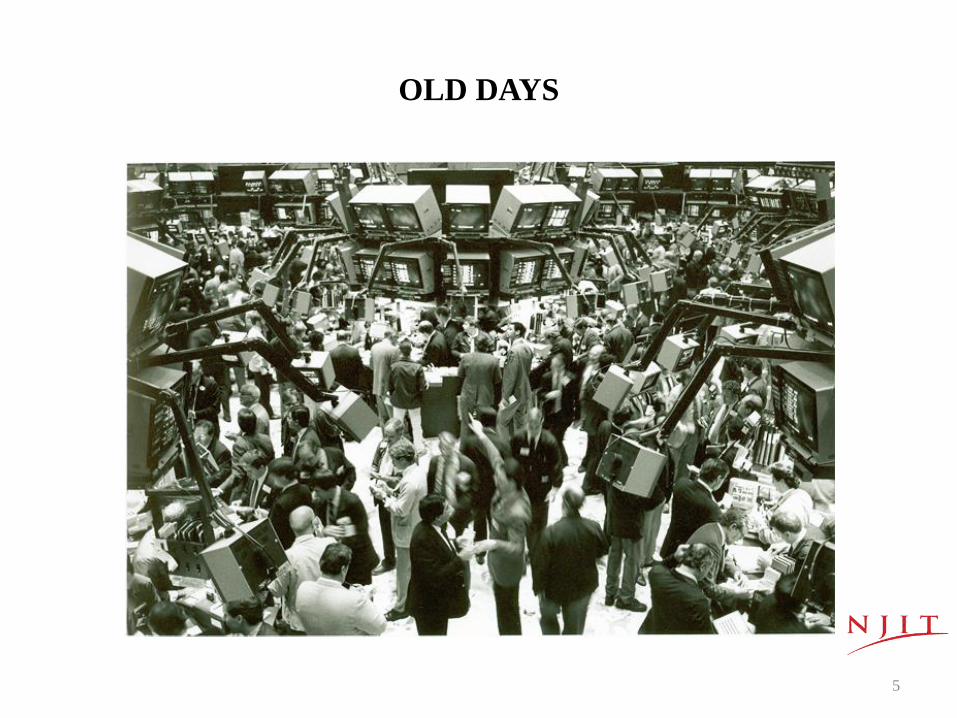
OLD DAYS
5
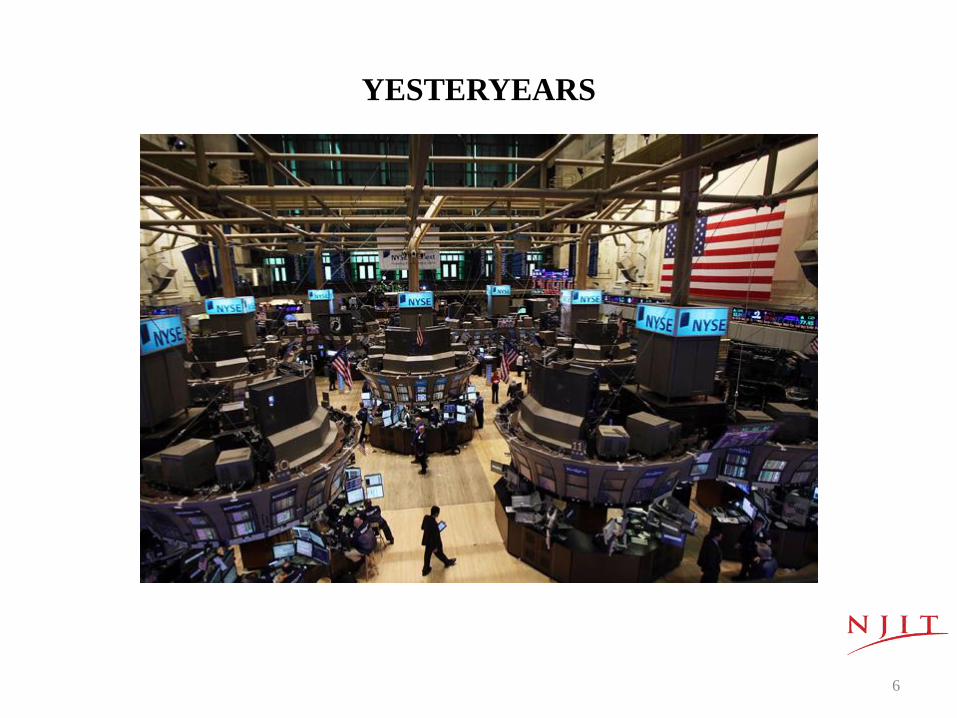
YESTERYEARS
6
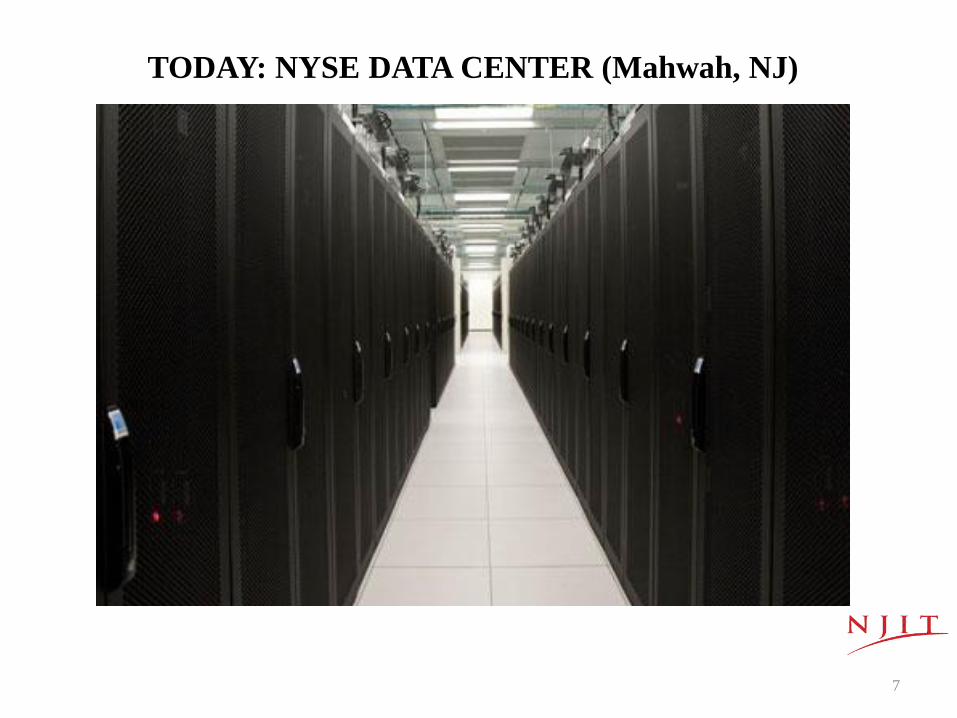
TODAY: NYSE DATA CENTER (Mahwah, NJ)
7
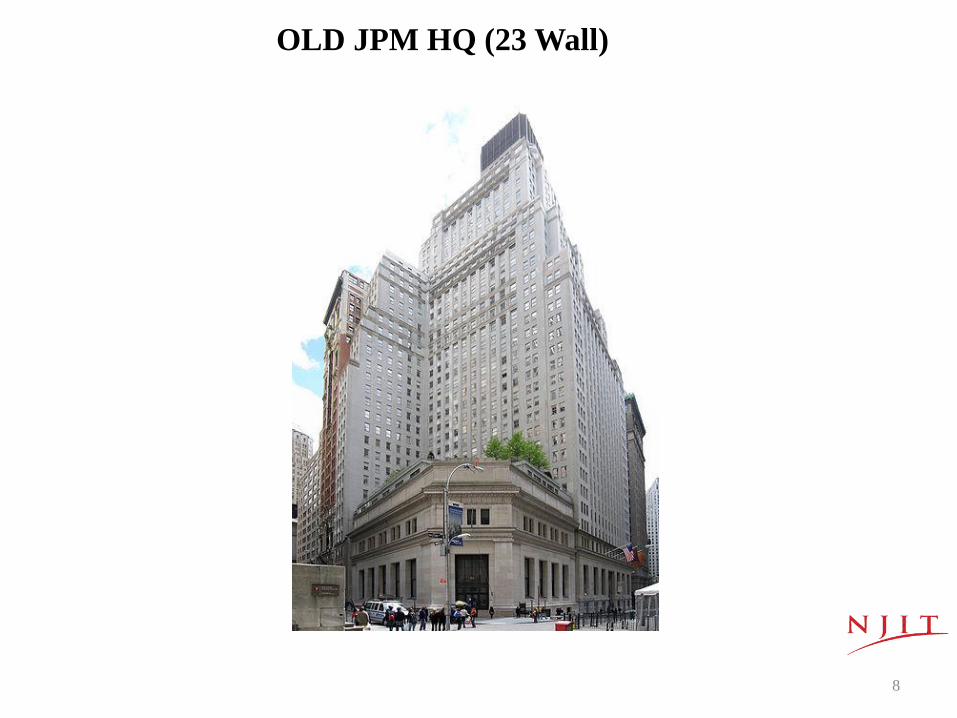
OLD JPM HQ (23 Wall)
8
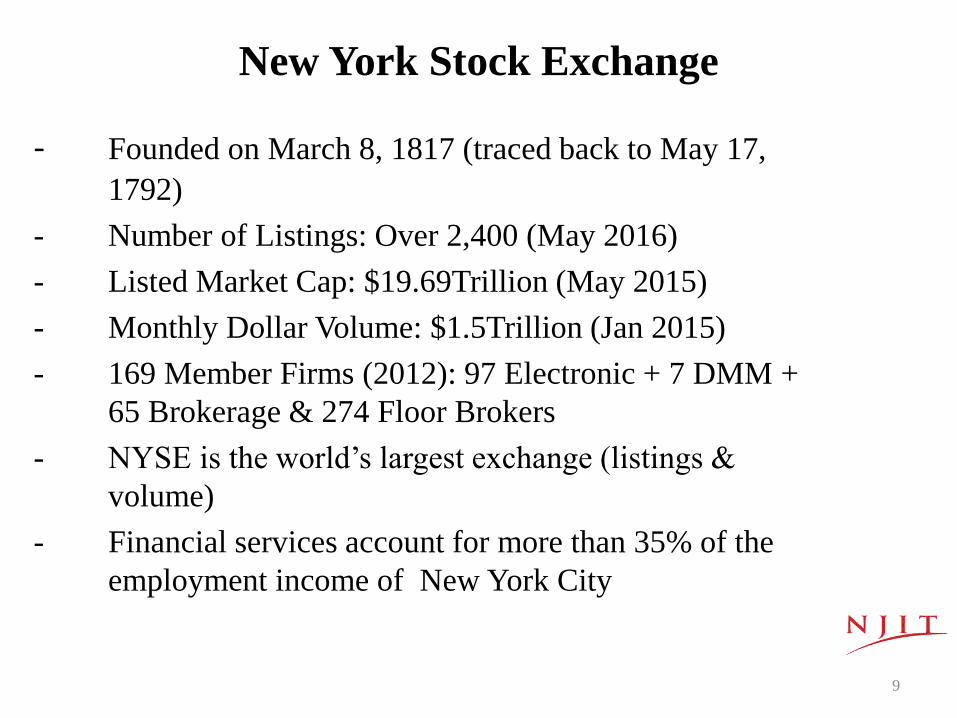
New York Stock Exchange
- Founded on March 8, 1817 (traced back to May 17,
1792)
- Number of Listings: Over 2,400 (May 2016)
- Listed Market Cap: $19.69Trillion (May 2015)
- Monthly Dollar Volume: $1.5Trillion (Jan 2015)
- 169 Member Firms (2012): 97 Electronic + 7 DMM +
65 Brokerage & 274 Floor Brokers
- NYSE is the world’s largest exchange (listings &
volume)
- Financial services account for more than 35% of the
employment income of New York City
9
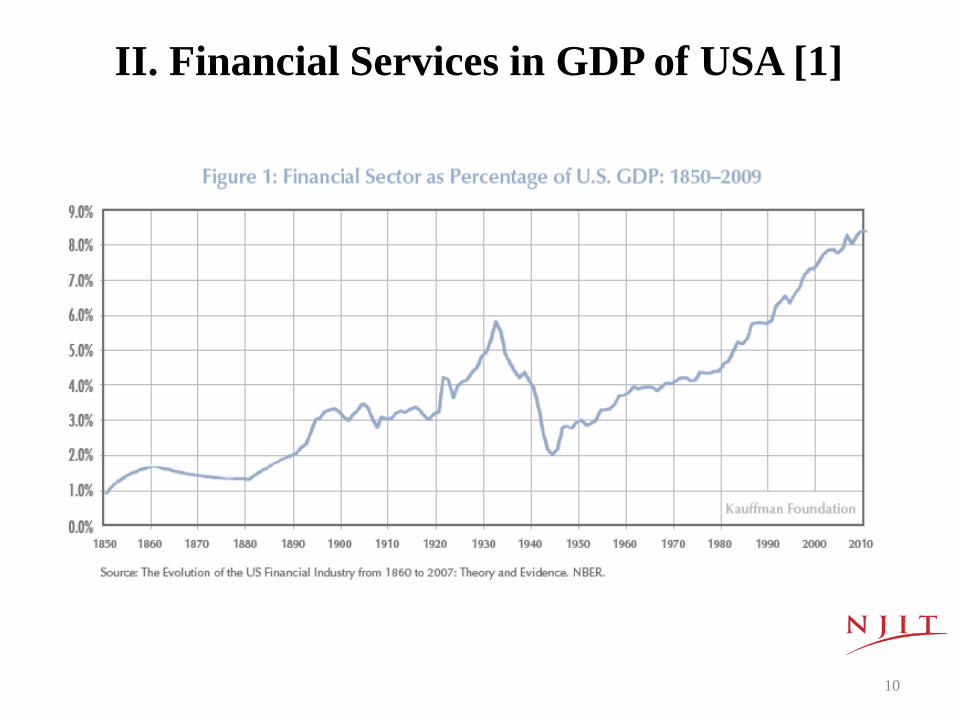
II. Financial Services in GDP of USA [1]
10
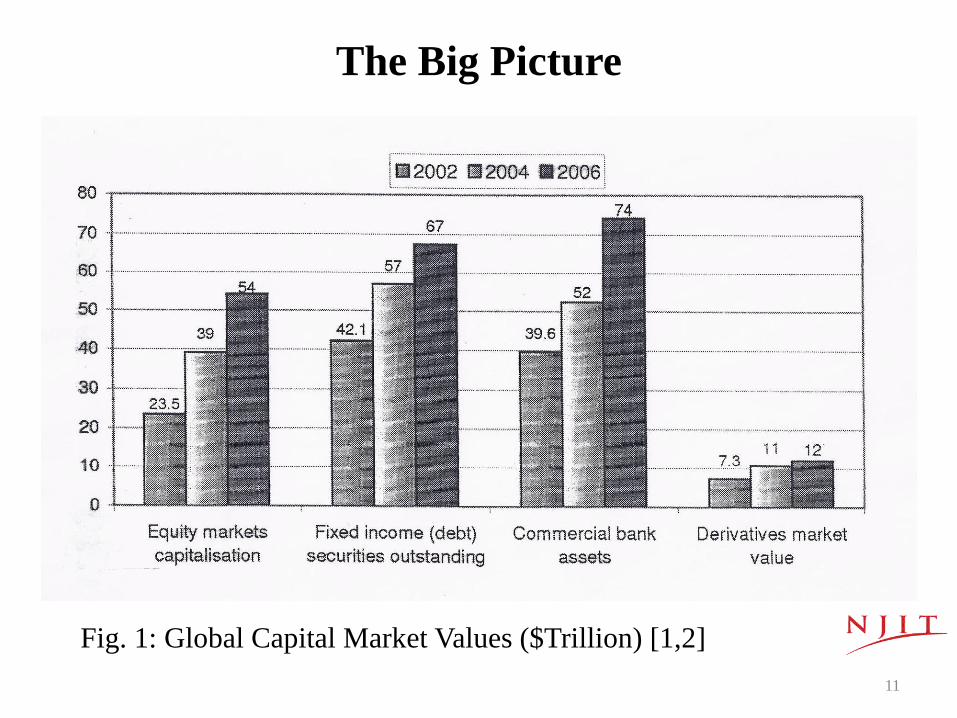
The Big Picture
Fig. 1: Global Capital Market Values ($Trillion) [1,2]
11
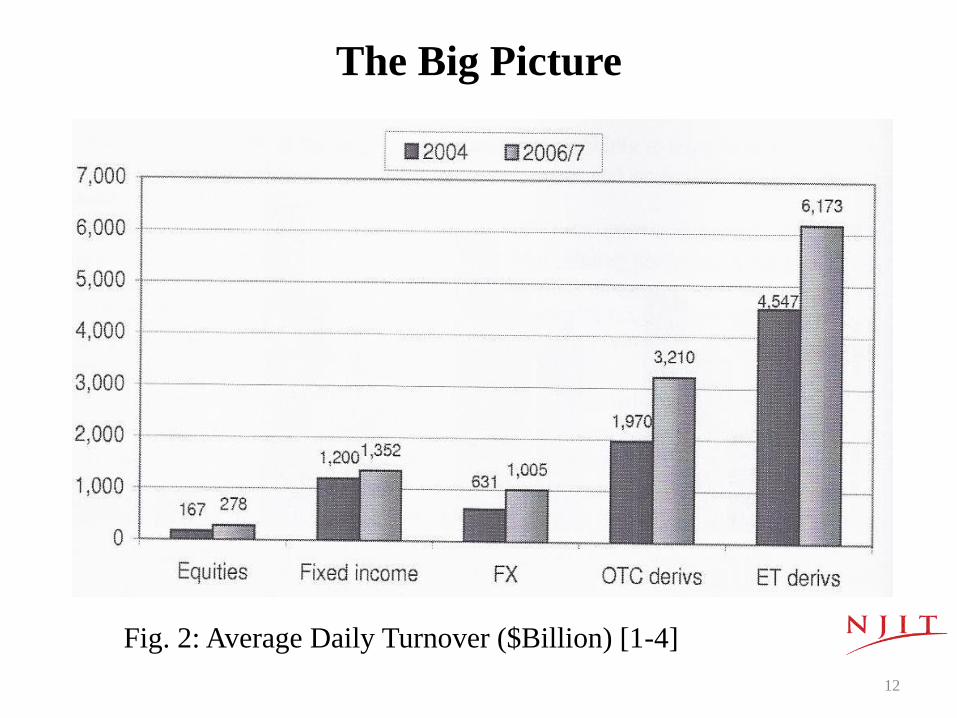
The Big Picture
Fig. 2: Average Daily Turnover ($Billion) [1-4]
12
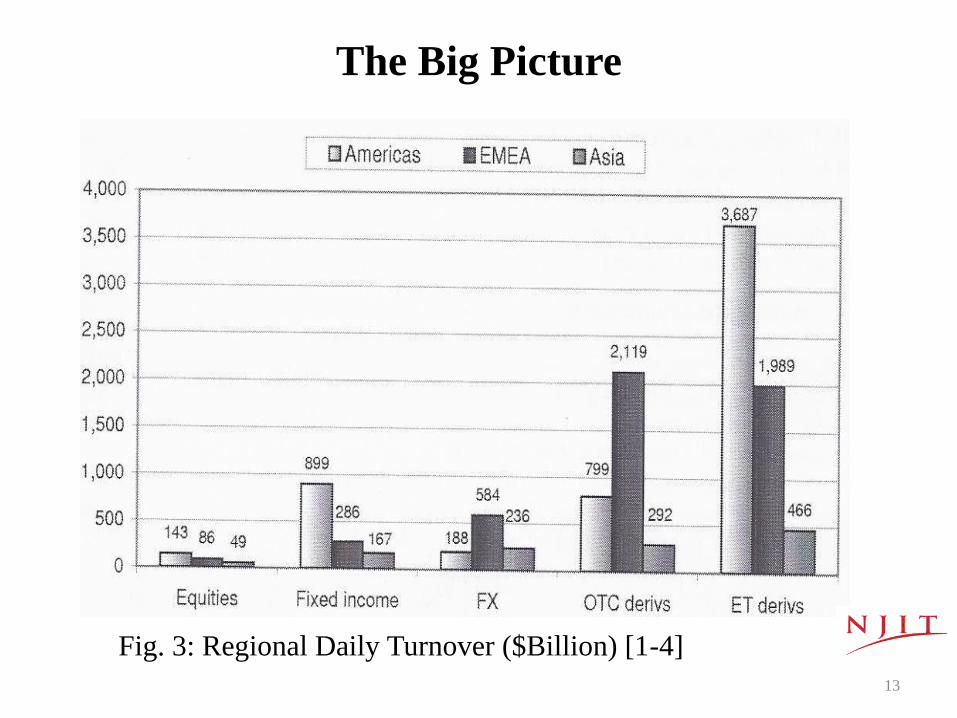
The Big Picture
Fig. 3: Regional Daily Turnover ($Billion) [1-4]
13
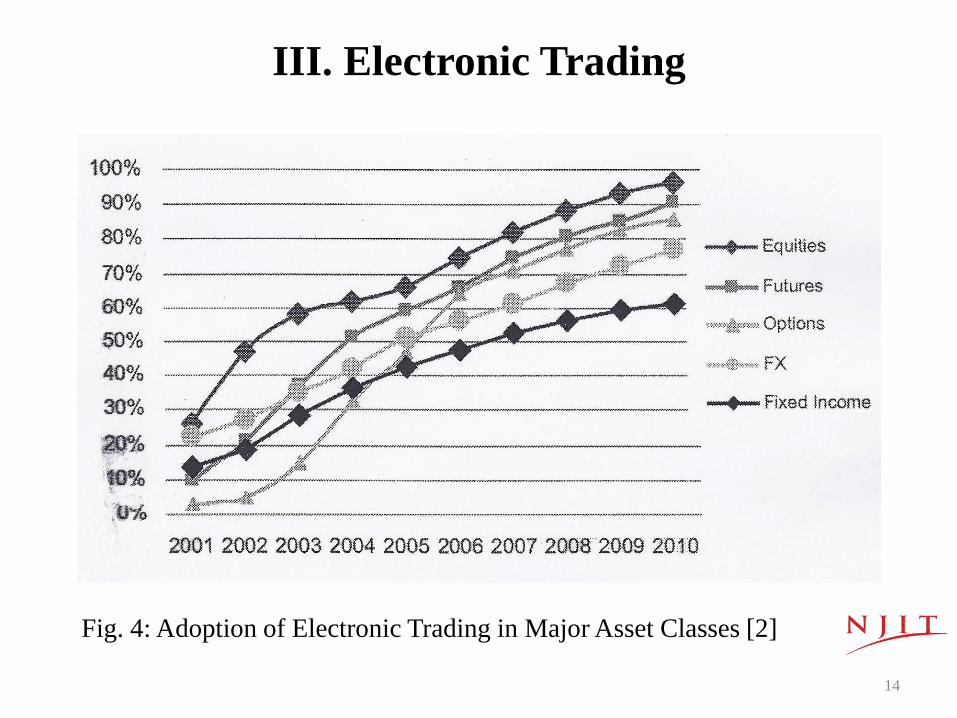
III. Electronic Trading
Fig. 4: Adoption of Electronic Trading in Major Asset Classes [2]
14
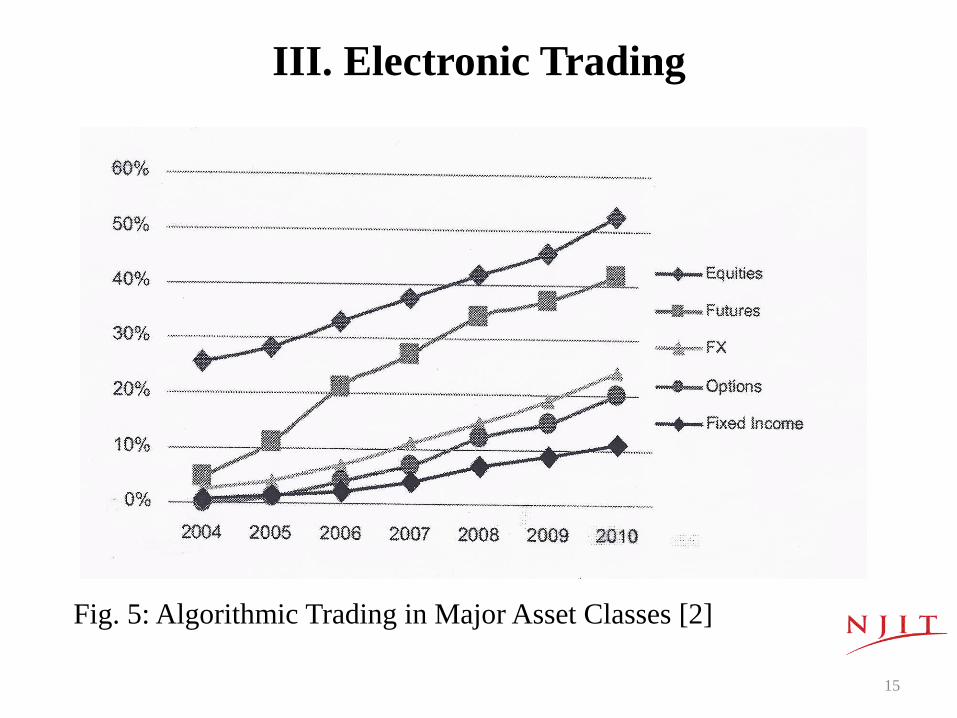
III. Electronic Trading
Fig. 5: Algorithmic Trading in Major Asset Classes [2]
15
Order
Book
Market
Impact
Risk
Models
Alpha
Models
Portfolio
Optimization
Signal Generation
&
Optimal Execution
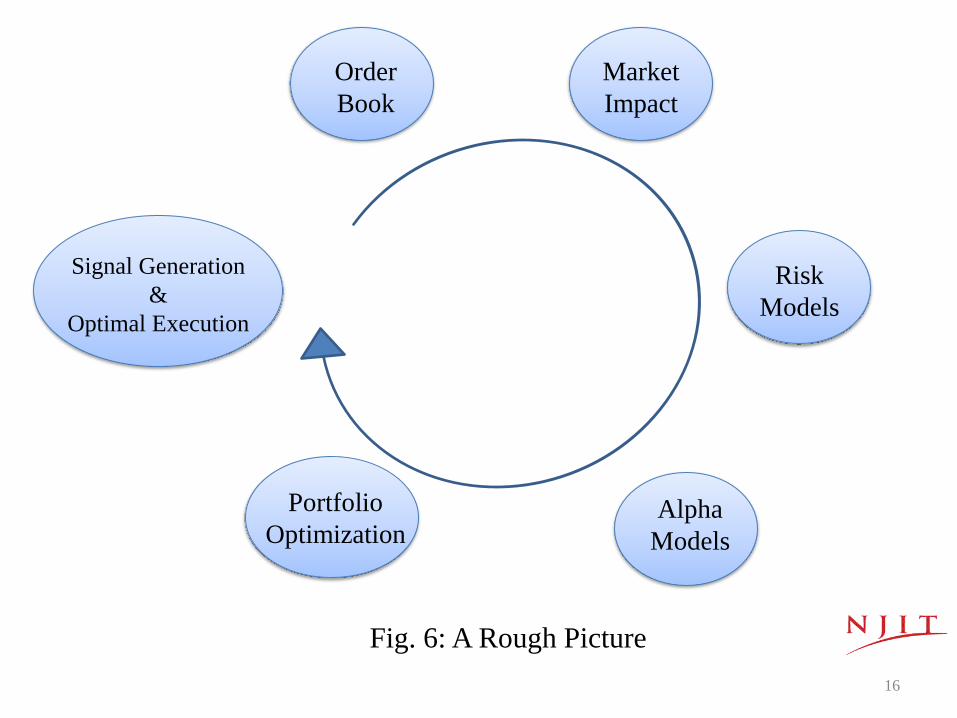
Fig. 6: A Rough Picture
16
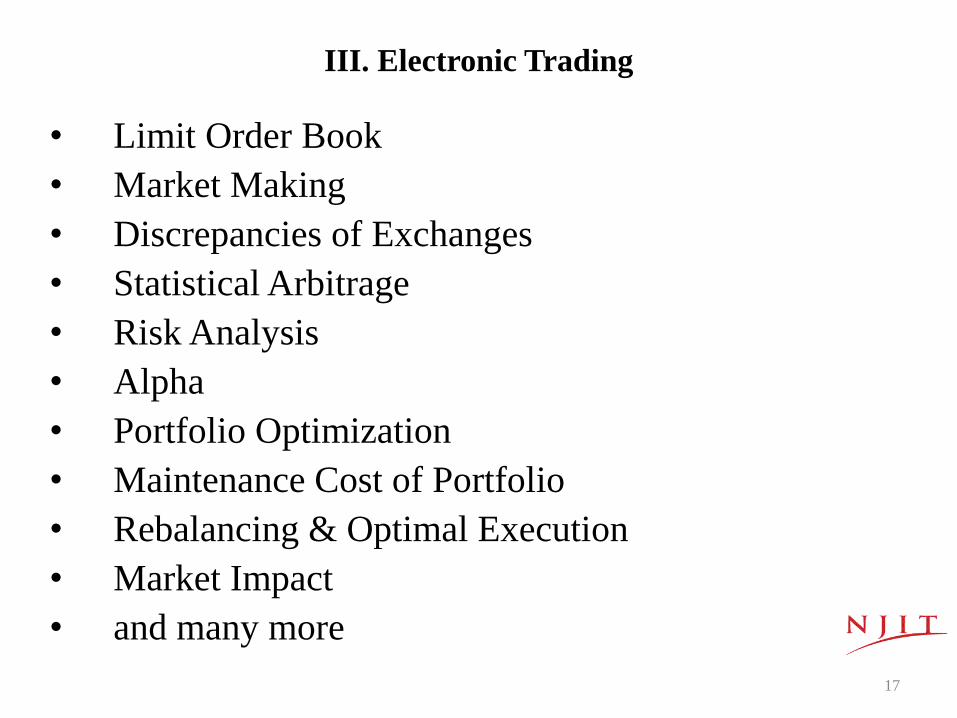
III. Electronic Trading
• Limit Order Book
• Market Making
• Discrepancies of Exchanges
• Statistical Arbitrage
• Risk Analysis
• Alpha
• Portfolio Optimization
• Maintenance Cost of Portfolio
• Rebalancing & Optimal Execution
• Market Impact
• and many more
17
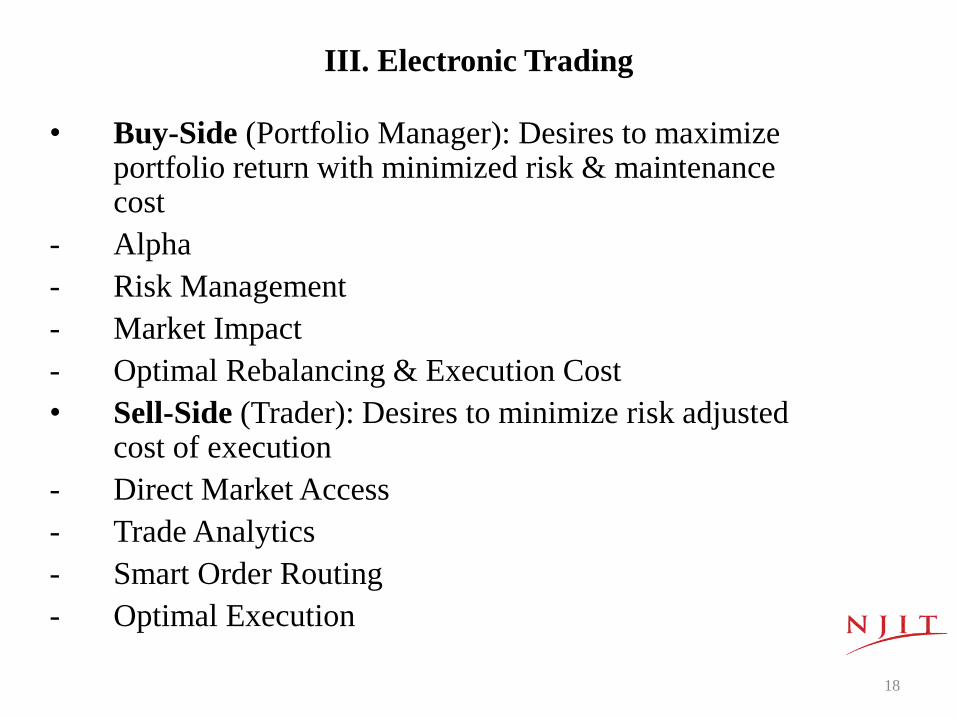
III. Electronic Trading
• Buy-Side (Portfolio Manager): Desires to maximize portfolio return with minimized risk & maintenance cost
- Alpha
- Risk Management
- Market Impact
- Optimal Rebalancing & Execution Cost
• Sell-Side (Trader): Desires to minimize risk adjusted cost of execution
- Direct Market Access
- Trade Analytics
- Smart Order Routing
- Optimal Execution
18
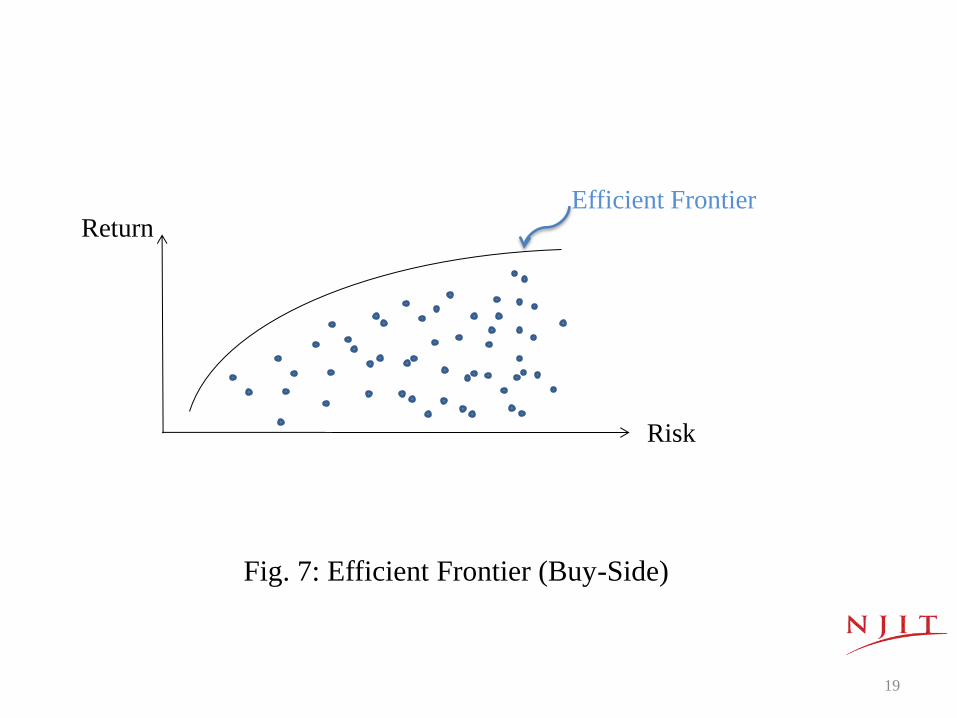
Return
Risk
Efficient Frontier
Fig. 7: Efficient Frontier (Buy-Side)
19
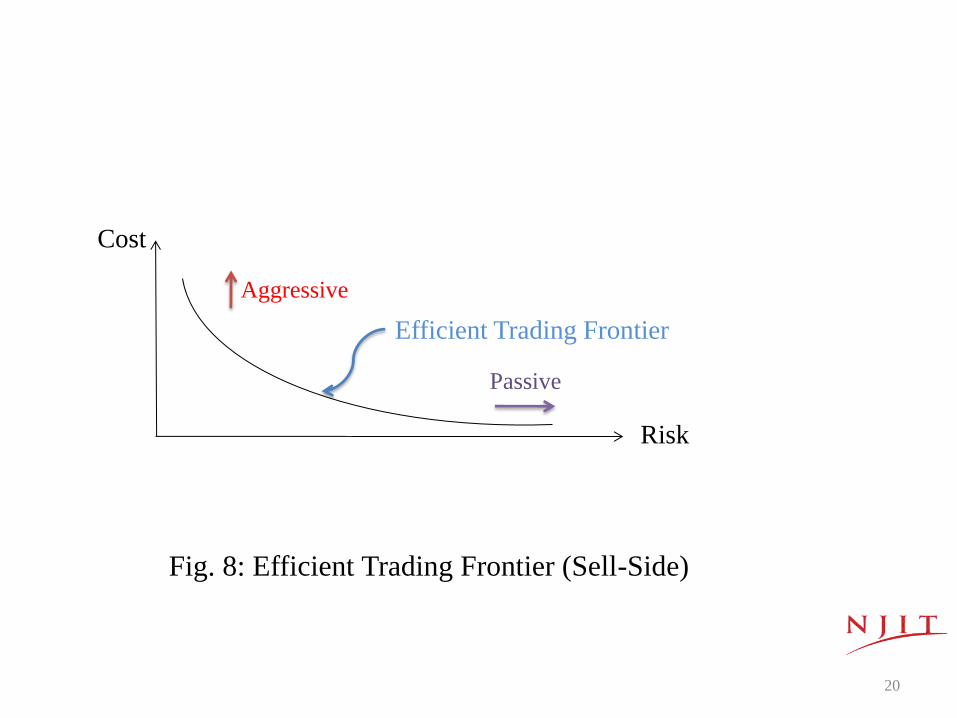
Fig. 8: Efficient Trading Frontier (Sell-Side)
Risk
Cost
Aggressive
Passive
Efficient Trading Frontier
20
IV. Market Makers
• A market maker quotes both a buy and a
sell price in a financial instrument in
inventory
• Market maker makes a profit from the
ask-bid spread
• Exchanges have Designated Market
Makers (specialists) acting as the
official market maker for a given
security
21
IV. Market Makers
• Market makers take other side of trades
when there are short-term imbalances in
buy-side & sell-side orders
• Market makers have various
informational and trade execution
privileges
• There are over 2,000 market makers in
USA
22
V. Limit Order Book
• What is a Market Order? [7]
- A market order is an order to buy or sell a stock at the
best available price.
- Generally, this type of order will be executed
immediately. However, the price at which a market order
will be executed is not guaranteed.
http://www.sec.gov/answers/limit.htm
23
V. Limit Order Book
• What is a Limit Order? [7]
- A limit order is an order to buy or sell a stock at a specific price or better. A buy limit order can only be executed at the limit price or lower, and a sell limit order can only be executed at the limit price or higher.
- A limit order is not guaranteed to execute.
- A limit order can only be filled if the stock’s market price reaches the limit price.
- While limit orders do not guarantee execution, they help ensure that an investor does not pay more than a pre-determined price for a stock.
http://www.sec.gov/answers/limit.htm
24
V. Limit Order Book
• A record of unexecuted limit orders which is
maintained by specialists. These orders are treated the
same as other orders in terms of priority of execution.
• Limit orders provide information about public
intentions of traders
• Actual intensions and publicly stated intensions of
traders are not always in accord as expected
• Dynamics of Limit Order Book is extremely
sophisticated even for a simple case
• High Frequency Trading is a form of techno-quant arts
25
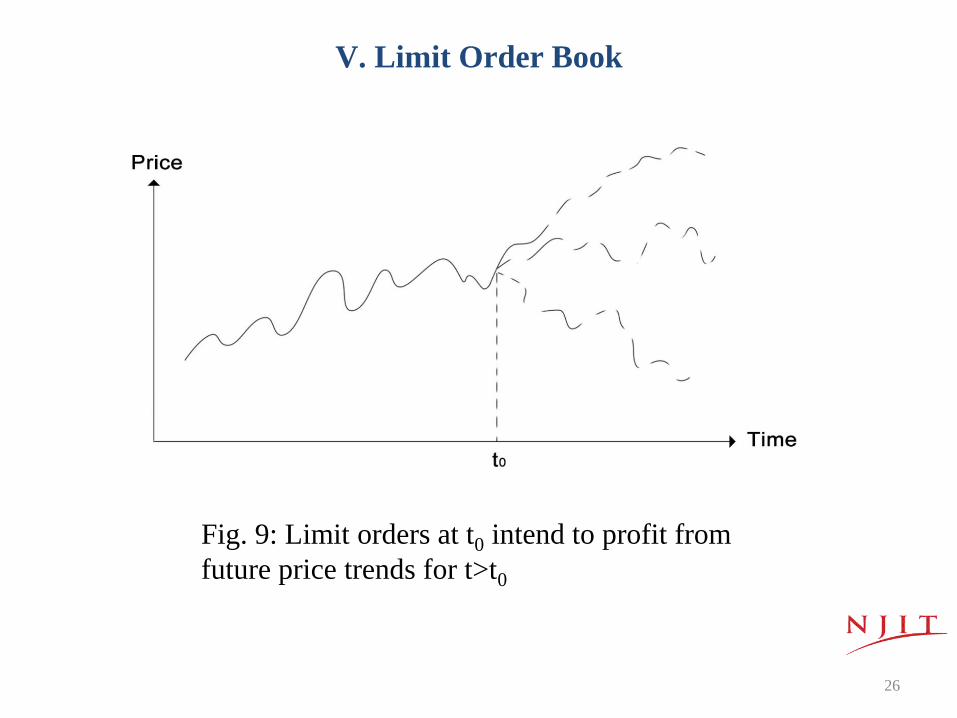
Fig. 9: Limit orders at t0 intend to profit from
future price trends for t>t0
V. Limit Order Book
26
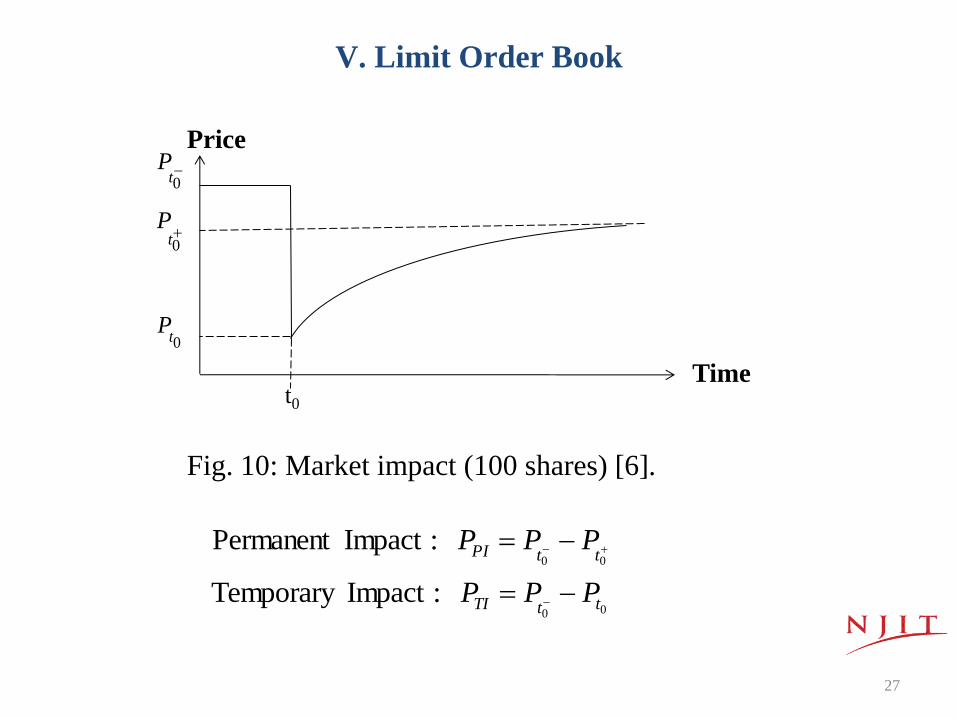
Fig. 10: Market impact (100 shares) [6].
Price
Time t0
0t
P
0t
P
0tP
00
00
:ImpactTemporary
:ImpactPermanent
ttTI
ttPI
PPP
PPP
V. Limit Order Book
27
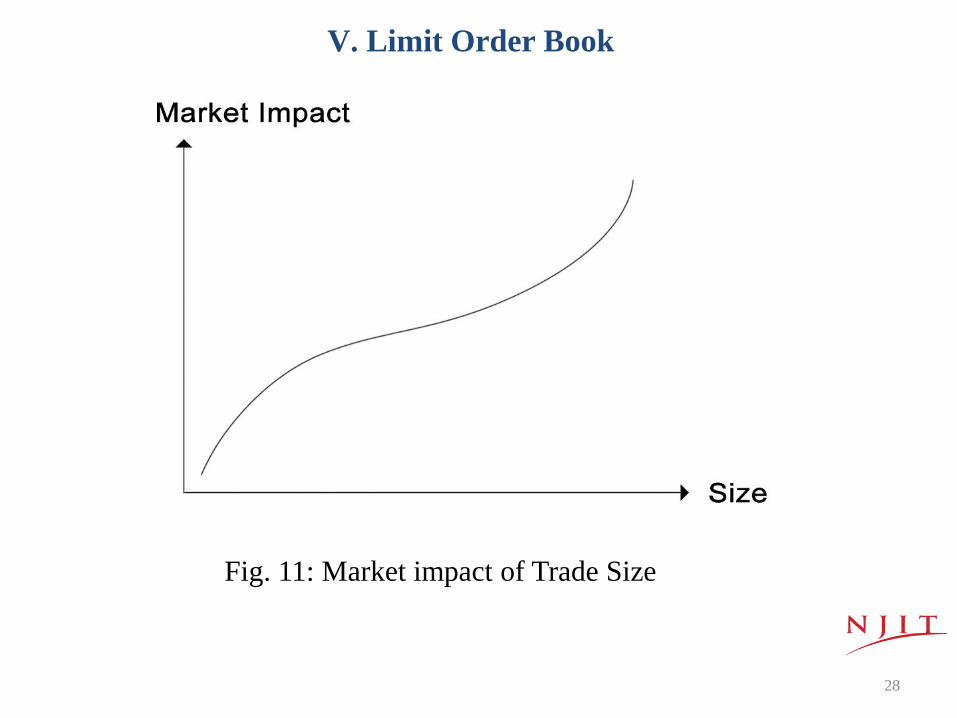
Fig. 11: Market impact of Trade Size
V. Limit Order Book
28
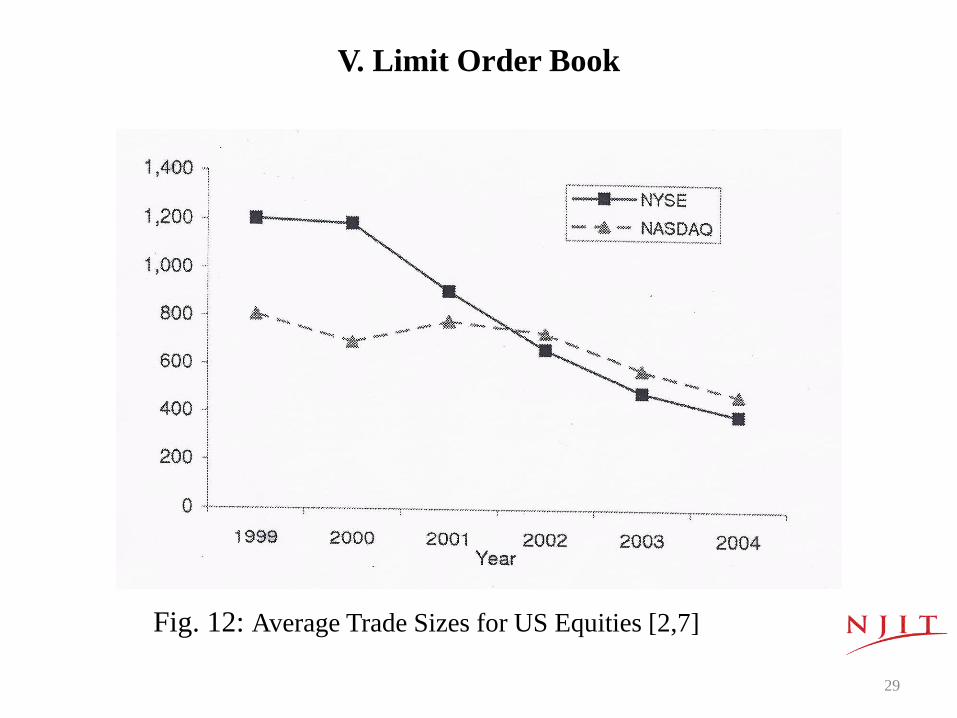
V. Limit Order Book
Fig. 12: Average Trade Sizes for US Equities [2,7]
29
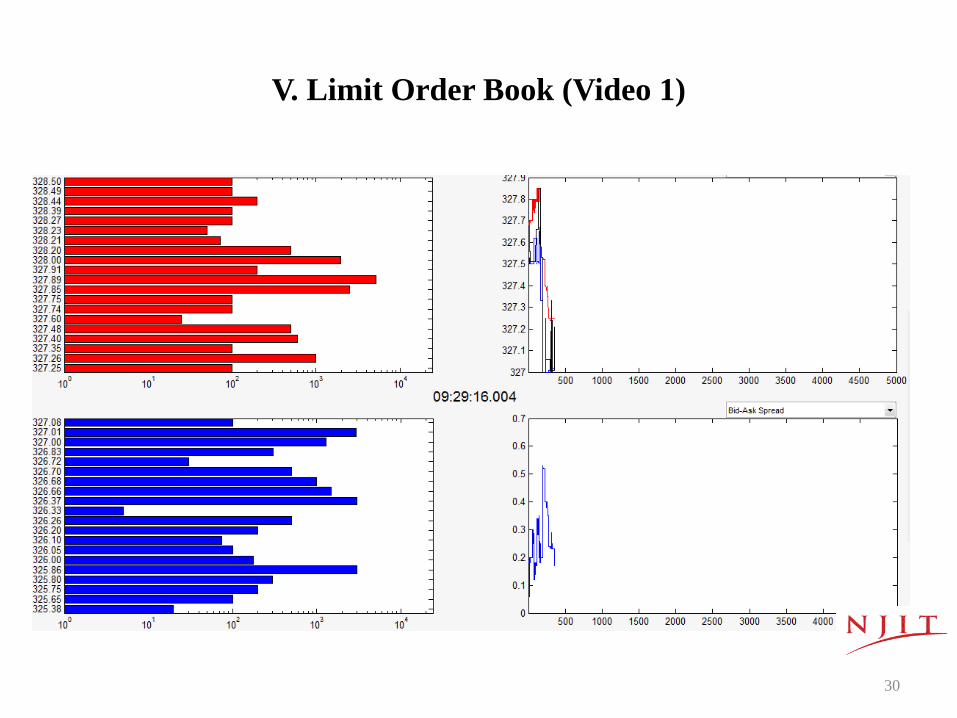
V. Limit Order Book (Video 1)
30
VI. HIGH FREQUENCY TRADING (HFT)
• HFT is not possible without Technology &
Infrastructure (Typical tick-to-trade times are between
15-100 microseconds. Although some report 200
nanoseconds or less)
• Some HFT Strategies
- Market Making
- Latency Arbitrage
- Arbitrage (Statistical & Information)
- Market Structure Based Trading
• Street saying: 1 millisecond (microsecond) reduction in
latency is worth about $100M/year for a brokerage
firm
31
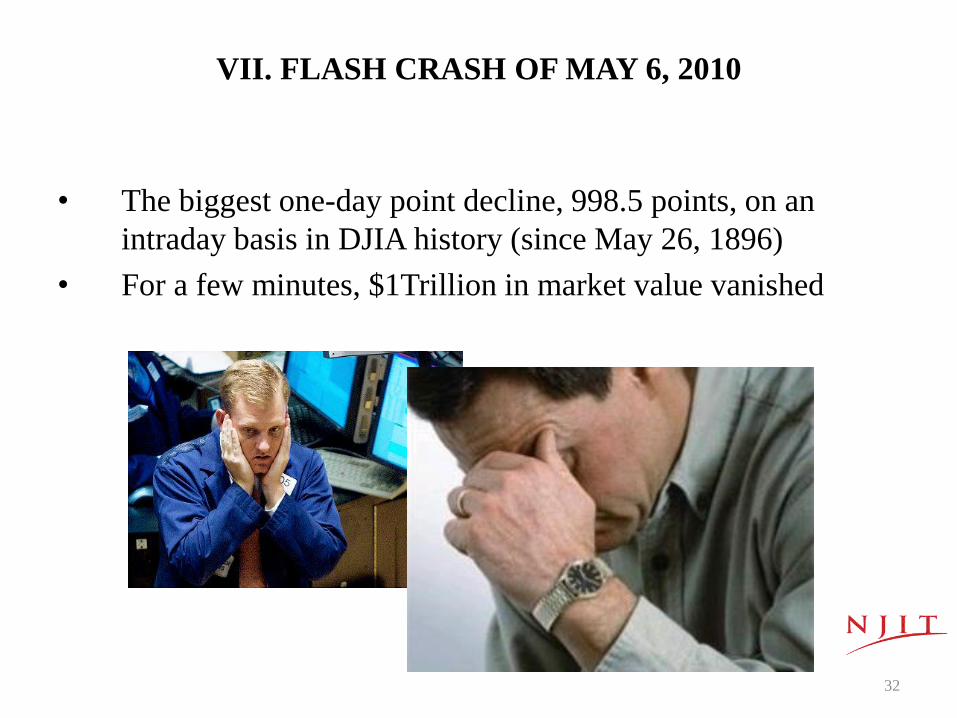
VII. FLASH CRASH OF MAY 6, 2010
• The biggest one-day point decline, 998.5 points, on an
intraday basis in DJIA history (since May 26, 1896)
• For a few minutes, $1Trillion in market value vanished
32
VII. FLASH CRASH OF MAY 6, 2010
• The combined selling pressure from the Sell
Algorithm, HFTs and other traders drove the price of
the E-Mini down approximately 3% in just four
minutes from the beginning of 2:41 p.m. through the
end of 2:44 p.m.
• During this same time cross-market arbitrageurs who
did buy the E-Mini, simultaneously sold equivalent
amounts in the equities markets, driving the price of
SPY [an exchange-traded fund (ETF) which represents
the S&P 500 index] also down approximately 3%.
33
VII. FLASH CRASH OF MAY 6, 2010
• Still lacking sufficient demand from fundamental
buyers or cross-market arbitrageurs, HFTs began to
quickly buy and then resell contracts to each other –
generating a “hot-potato” volume effect as the same
positions were rapidly passed back and forth.
• Between 2:45:13 and 2:45:27, HFTs traded over
27,000 contracts, which accounted for about 49
percent of the total trading volume, while buying only
about 200 additional contracts net.
34
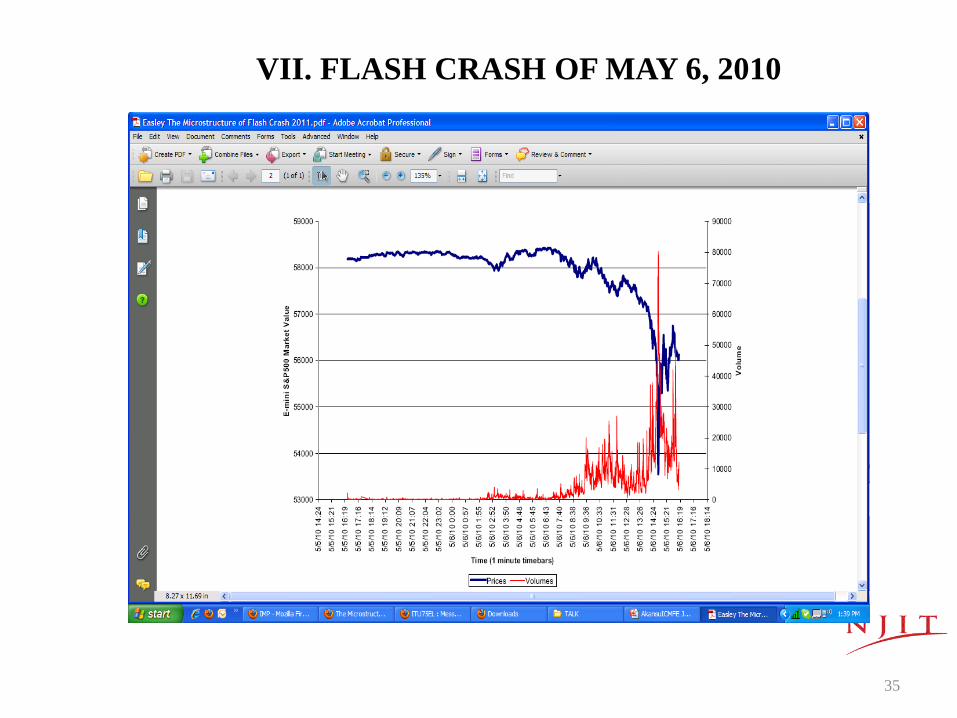
VII. FLASH CRASH OF MAY 6, 2010
35
IMPACT OF FLASH CRASH
• It created tremendous public backlash for HFT
• Regulators recognized their lack of attendance to the
issue
• HFT has become an expertise area within trading
• Academics got involved to study the impact of speed
trading
• All big players in the market accepted HFT as “the
new normal” and have been making their business
moves
36
CAN WE HAVE ANOTHER FLASH CRASH?
• The technical answer is “Yes”
• There have been “Baby Crashes” since the issue is
more judiciously handled by all now
• Flash Crashes will stay with us and all players need to
have their strong expertise on market microstructure
and its inner-workings
37
VII. FLASH CRASH OF MAY 6, 2010
• ANOTHER LOOK AT ORDER BOOK OF
MAY 6, 2010 (Video 2)
38
VIII. THE DUDE
• Let’s remember the Dude (Video 3)
39
WHAT DID DUDE DO?
• I did not study what happened in detail.
• It is guessed that the Dude arbitraged various Brokers
since there is only one exchange in Turkey
• In such a scenario, Brokers are treated like exchanges
and BIST functions as National Best Bid and Offer
(NBBO)
• Easily traceable trading strategy
40
IX. LOOKING FORWARD
LOB MUST BE WATCHED FOR HEALTHY MARKETS
- Limit Order Book (LOB) is the center of trading activity
for each asset (ticker)
- LOB is organically linked to the publicly traded
company of the ticker
- The robustness of ticker’s LOB dictates the health of its
trading activity
- The depth of LOB (strength of ticker) is the source of
volatility and must be monitored closely for healthy
markets
41
Market Structure Requirements [8]
- Transparency
- Low latency
- Designated Market Makers (DMM) affirmative
obligations
- Price improvement
- Deep liquidity
- Competitive pricing/quoting
42
Designated Market Makers [8]
- The cornerstone of the NYSE market model is the
Designated Market Maker (DMM). Formerly known as “Specialists”
- DMMs have obligations for maintaining fair and orderly markets for their assigned securities.
- They operate both manually and electronically to facilitate price discovery during market openings, closings and during periods of substantial trading imbalances or instability.
- DMMs apply keen judgment to knowledge of dynamic trading systems, macroeconomic news and industry specific intelligence, to make their trading decisions.
43
Designated Market Makers [8]
- Have true obligations to maintain a fair and orderly
market in their stocks, quote at the NBBO a specified
percentage of the time, and facilitate price discovery
throughout the day as well as at the open, close and in
periods of significant imbalances and high volatility
- Provide price improvement and match incoming orders
based on a pre-programmed Capital Commitment
Schedule, which has been added to the NYSE Display
Book, minimizing order latency. DMMs and their
algorithms do not receive a “look” at incoming orders.
This ensures that an intermediary does not see orders
first, and that DMMs compete as a market participant
44
Designated Market Makers [8]
- Are on parity with quotes from floor brokers and those
on the Display Book, encouraging DMM participation
and higher market quality.
45
Designated Market Makers [8]
- It is a serious business to be DMM
- Exchanges cannot function without DMMs
- DMM Rights & Responsibilities must be thoroughly
described
- DMMs are the backbone of trading sector
46
DMM: A Case Study [8]
- DMMs regularly commit capital to add liquidity to the
market to reduce the gap between supply & demand.
- For example, on the close of a recent Russell rebalancing
day (a Friday), a DMM published to the market 13
million shares of a large cap DJIA stock to buy.
- Just prior to the close, an influx of sell orders caused the
imbalance to swing to a 4 million share sell imbalance.
- In this situation, the DMM decided to commit $63
million in capital to support the stock at the close,
avoiding a 2% drop in the price and $3 billion loss in
market cap.
47
Supplemental Liquidity Providers (SLPs) [8]
- SLPs are electronic, high volume members incented to
add liquidity on the They are primarily found in more
liquid stocks with greater than 1 million shares of
average daily volume.
- SLPs trade only for their proprietary accounts, not for
public customers or on an agency basis.
- SLPs that post liquidity in an assigned security that
executes against incoming orders are awarded a financial
rebate by the exchange.
48
Circuit Breakers [8]
- NYSE instituted circuit breakers to reduce volatility and
promote investor confidence.
- By implementing a pause in trading, investors are given
time to assimilate incoming information and the ability to
make informed choices during periods of high market
volatility.
- DJIA with the S&P 500 as the benchmark index for
measuring a market decline.
49
Circuit Breakers [8]
- the circuit-breaker halt for a Level 1 (7%) or Level 2
(13%) decline occurring after 9:30 a.m. Eastern and up to
and including 3:25 p.m. Eastern, or in the case of an
early scheduled close, 12:25 p.m. Eastern, would result
in a trading halt in all stocks for 15 minutes.
- If the market declined by 20%, triggering a Level 3
circuit-breaker, at any time, trading would be halted for
the remainder of the day.
- A Level 1 or Level 2 halt can only occur once per trading
day.
50
CONCLUDING REMARKS [9,10]
• Financial sector will continue to reinvent itself by
adopting State-of-the-Art Technologies to harvest
global market data
• The term Big Data Finance is already coined
• Currently, Financial Intelligence & Analytics and
Electronic Trading are at their infancy
• Technology-centric Major Exchanges will continue to
acquire local exchanges to boost Efficiency of Global
Markets to facilitate trading anything anywhere anytime
• Information-centric Hedging will progress to its next
level of sophistication
• Exciting opportunities for bankers, finance
professionals, technologists, social engineers & policy
makers and academics
51
REFERENCES
[1] SIFMA, Securities Industry and Financial Markets Global Addendum, 2007
(www.sifma.org).
[2] B. Johnson, Algorithmic Trading & DMA. Myeloma Press, 2010.
[3] World Federation of Exchanges, WFE Annual Reports
(www.world-exchanges.org).
[4] Bank for International Settlements (www.bis.org).
[5] Aite Group (http://www.aitegroup.com).
[6] R. Almgren and N. Chriss, Optimal Execution of Portfolio Transactions,
Journal of Risk, pp. 5-39, vol. 3, 2000.
[7] Securities Markets: Decimal Pricing Has Contributed to Lower Trading
Costs and a More Challenging Trading Environment, United States
Accountability Office Report to Congressional Requesters, May 2005.
[8] https://www.nyse.com/markets/nyse/trading-info
[9] A.N. Akansu and M.U. Torun, A Primer for Financial Engineering: Financial
Signal Processing and Electronic Trading. Elsevier, 2015.
[10] A.N. Akansu, S.R. Kulkarni and D. Malioutov, Eds., Financial Signal
Processing and Machine Learning. Wiley-IEEE Press, 2016.
52