Embed Size (px)
Citation preview

FLAMMABILITY CHARACTERISTICS OF PURE HYDROCARBONS
Tareq A. Albahri
Chemical Engineering Dept. - Kuwait University
P.O.Box 5969 - Safat 13060, Kuwait Introduction
The flammability characteristics of chemical substances are very important for safety considerations in storage, processing, and handling. These characteristics which include the flash point temperature (FPT), the auto ignition temperature (AIT), and the upper and lower flammability limits (UFL, LFL) are some of the most important safety specifications that must be considered in assessing the overall flammability hazard potential of a chemical substance, defined as the degree of susceptibility to ignition or release of energy under varying environmental conditions. Experimental values of these properties are always desirable, however, they are scars and expensive to obtain. When experimental values are not available and determining them by experimental means is not practical, a prediction method which is desirably convenient and fast must be used to estimate them. Technical Development
When the flammability characteristics cannot be determined experimentally, empirical equations for their determination are available. However, these methods available in the literature for estimation of the flash point1,2,3,4,5,6, the autoignition temperature7, the upper and lower flammability limits1,8,9,10,
11 are not very accurate and
sometimes produce serious errors. Here we develop a structural group contribution (SGC) method12 to predict the FPT, AIT, UFL, and LFL of pure hydrocarbons with higher accuracy than the above methods that can be applied with less difficulty using only the molecular structure of the compound. The method is notable for the absence of any theoretical procedure which has previously been used to estimate the AIT of pure substances from only their molecular structure.
The structural groups derived from the Joback group contribution approach12, with some modification, and their contribution values are shown in Table 1 for calculating the flash point as an example. Other structural groups and their contribution values have been developed for the AIT, LFL, and UFL. The target property are calculated using the following non-linear equation13,
Φ (1) 2 3
i i ii i i i
= a + b + c + d + e ( ) ( ) ( ) ( ) Φ Φ Φ Φ∑ ∑ ∑ ∑
4
i
Table 3. SGC values for estimation of the flash point temperature.
HC type Serial no.
Group (FPT)i
1 −CH3 0.4832 2 >CH2 0.5603 3 α- >CH− 0.5275 4 β- >CH− 0.5499 5 g- >CH− 0.4778 6 δ- >CH− 0.4543 7 α- >C< 0.4008 8 β- >C< 0.5281
Paraffins
9 −C2H5 (branch) 1.0370 10 =CH2 0.4078 11 =CH− 0.6037 12 =CH− (cis) 0.5913 13 =CH− (trans) 0.6216 14 α- >C= 0.7135 15 β- >C= 0.6550 16 =C= 0.8659 17 ≡CH 0.4475
Olefins
18 ≡C− 0.8387 19 >CH2 0.6080 20 >CH− 0.4217 21 α- >CH− (cis) 0.7148 22 α- >CH− (trans) 0.6986 23 β- >CH− (cis) 0.6518 24 β- >CH− (trans) 0.4601 25 g- >CH− (cis) 0.7167 26 g- >CH− (trans) 0.5899 27 >C< 0.1847
Cyclic
28 =CH− 0.5287 29 =CH− 0.6205 30 >CH2 1.5159 31 >C= (fused) 0.8898 32 >C= 0.6150 33 >C= (ortho) 0.7535 34 >C= (meta) 0.7384
Aromatics
35 >C= (para) 0.7675 Groups 32 through 35 are all non-fused. In non-cyclic compounds, α-, β-, g-, and δ- refer to the second, third, fourth, and fifth positions along the HC chain, respectively. In cyclic compounds, α-, β-, and g- refer to the second, third, and fourth position along the cyclic ring with respect to group 20, respectively.
Table 2. Coefficients for Equation (1). Property a b c d e
FPT 84.65 64.18 -5.6345 0.360 -0.0101 AIT 780.42 26.78 -2.5887 -0.3195 -0.007825 UFL 18.14 3.4135 0.3587 0.01747 3.403E-04 LFL 4.174 0.8093 0.0689 0.00265 3.76E-05
where Φ is FPT, AIT, UFL, or LFL, ∑(Φ)i is the sum of the molecular structure group contributions for FPT (Table 1), AIT, UFL, or LFL (not shown), and a, b, c, d, and e are constants from Table 2.
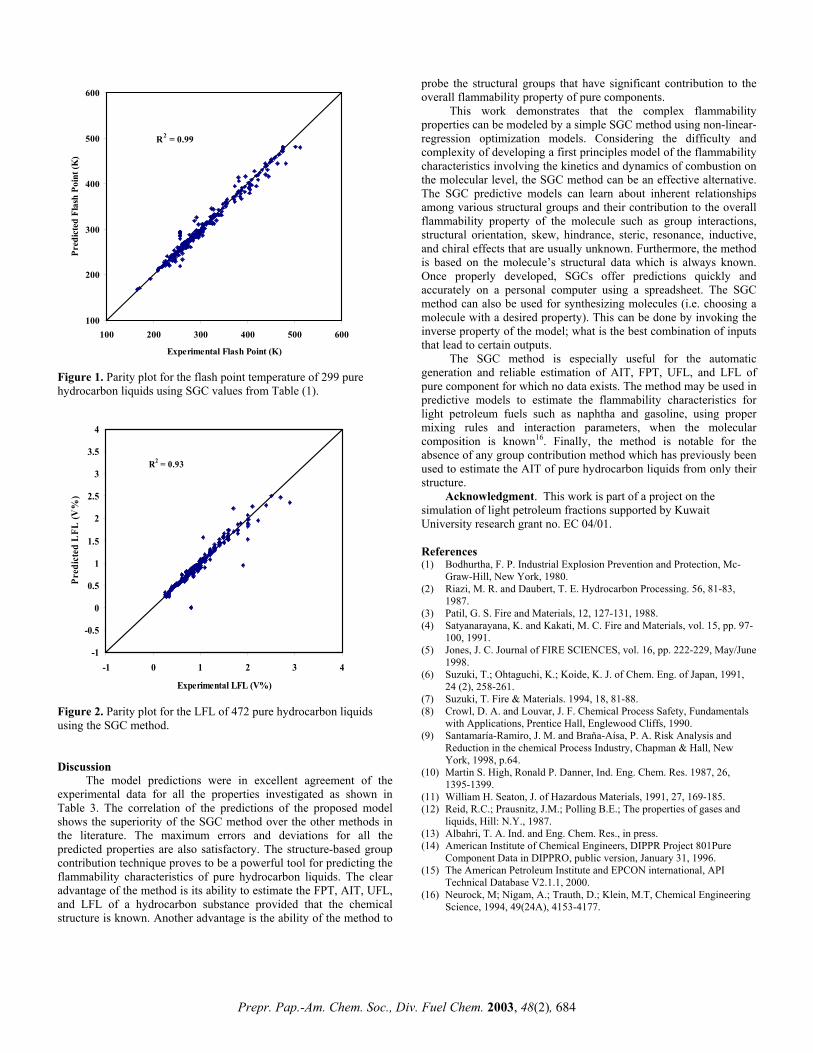
The data on the flammability properties of more than 500 pure substances were obtained from the property databanks of the AIChE-DIPPR14 on the AIT and the API-TDB15 on the FPT, UFL, and LFL. An optimization algorithm based on the least square method was used to probe the structural groups and calculate their contribution values to the target property. The nonlinear regression algorithm minimizes the sum of the difference between the calculated and experimental values of the target properties using the solver function in Microsoft Excel. Convergence was always achieved in less than one minute on a Pentium IV-1.7GHz PC. The average deviations in the predicted properties for all types of hydrocarbons are shown in Table 3. The accuracy of the model predictions are shown in Figures 1 and 2 as examples.
Table 3. Statistical analysis for the flammability predictions of Equation (1)
Property
No. of data points
Property Range
R2 Average deviation
FPT 287 165 - 511 K 0.99 1.68 % a AIT 131 473 - 828 K 0.92 4.20 % a UFL 464 4 - 100 V% 0.96 1.25 V%b LFL 454 0.11 - 6 V% 0.93 0.04 V%b
a Ave. % error, b Difference between experimental and calculated values.
Prepr. Pap.-Am. Chem. Soc., Div. Fuel Chem. 2003, 48(2), 683
100
200
300
400
500
600
100 200 300 400 500 600
Experimental Flash Point (K)
Pred
icte
d Fl
ash
Poin
t (K
).
R2 = 0.99
Figure 1. Parity plot for the flash point temperature of 299 pure hydrocarbon liquids using SGC values from Table (1).
-1
-0.5
0
0.5
1
1.5
2
2.5
3
3.5
4
-1 0 1 2 3
Experimental LFL (V%)
Pred
icte
d L
FL (V
%)
R2 = 0.93
4
Figure 2. Parity plot for the LFL of 472 pure hydrocarbon liquids using the SGC method. Discussion
The model predictions were in excellent agreement of the experimental data for all the properties investigated as shown in Table 3. The correlation of the predictions of the proposed model shows the superiority of the SGC method over the other methods in the literature. The maximum errors and deviations for all the predicted properties are also satisfactory. The structure-based group contribution technique proves to be a powerful tool for predicting the flammability characteristics of pure hydrocarbon liquids. The clear advantage of the method is its ability to estimate the FPT, AIT, UFL, and LFL of a hydrocarbon substance provided that the chemical structure is known. Another advantage is the ability of the method to
probe the structural groups that have significant contribution to the overall flammability property of pure components.
This work demonstrates that the complex flammability properties can be modeled by a simple SGC method using non-linear-regression optimization models. Considering the difficulty and complexity of developing a first principles model of the flammability characteristics involving the kinetics and dynamics of combustion on the molecular level, the SGC method can be an effective alternative. The SGC predictive models can learn about inherent relationships among various structural groups and their contribution to the overall flammability property of the molecule such as group interactions, structural orientation, skew, hindrance, steric, resonance, inductive, and chiral effects that are usually unknown. Furthermore, the method is based on the molecule’s structural data which is always known. Once properly developed, SGCs offer predictions quickly and accurately on a personal computer using a spreadsheet. The SGC method can also be used for synthesizing molecules (i.e. choosing a molecule with a desired property). This can be done by invoking the inverse property of the model; what is the best combination of inputs that lead to certain outputs.
The SGC method is especially useful for the automatic generation and reliable estimation of AIT, FPT, UFL, and LFL of pure component for which no data exists. The method may be used in predictive models to estimate the flammability characteristics for light petroleum fuels such as naphtha and gasoline, using proper mixing rules and interaction parameters, when the molecular composition is known16. Finally, the method is notable for the absence of any group contribution method which has previously been used to estimate the AIT of pure hydrocarbon liquids from only their structure.
Acknowledgment. This work is part of a project on the simulation of light petroleum fractions supported by Kuwait University research grant no. EC 04/01. References (1) Bodhurtha, F. P. Industrial Explosion Prevention and Protection, Mc-
Graw-Hill, New York, 1980. (2) Riazi, M. R. and Daubert, T. E. Hydrocarbon Processing. 56, 81-83,
1987. (3) Patil, G. S. Fire and Materials, 12, 127-131, 1988. (4) Satyanarayana, K. and Kakati, M. C. Fire and Materials, vol. 15, pp. 97-
100, 1991. (5) Jones, J. C. Journal of FIRE SCIENCES, vol. 16, pp. 222-229, May/June
1998. (6) Suzuki, T.; Ohtaguchi, K.; Koide, K. J. of Chem. Eng. of Japan, 1991,
24 (2), 258-261. (7) Suzuki, T. Fire & Materials. 1994, 18, 81-88. (8) Crowl, D. A. and Louvar, J. F. Chemical Process Safety, Fundamentals
with Applications, Prentice Hall, Englewood Cliffs, 1990. (9) Santamaría-Ramiro, J. M. and Braňa-Aísa, P. A. Risk Analysis and
Reduction in the chemical Process Industry, Chapman & Hall, New York, 1998, p.64.
(10) Martin S. High, Ronald P. Danner, Ind. Eng. Chem. Res. 1987, 26, 1395-1399.
(11) William H. Seaton, J. of Hazardous Materials, 1991, 27, 169-185. (12) Reid, R.C.; Prausnitz, J.M.; Polling B.E.; The properties of gases and
liquids, Hill: N.Y., 1987. (13) Albahri, T. A. Ind. and Eng. Chem. Res., in press. (14) American Institute of Chemical Engineers, DIPPR Project 801Pure
Component Data in DIPPRO, public version, January 31, 1996. (15) The American Petroleum Institute and EPCON international, API
Technical Database V2.1.1, 2000. (16) Neurock, M; Nigam, A.; Trauth, D.; Klein, M.T, Chemical Engineering
Science, 1994, 49(24A), 4153-4177.
Prepr. Pap.-Am. Chem. Soc., Div. Fuel Chem. 2003, 48(2), 684