Embed Size (px)
Citation preview
This is a repository copy of Fixing the cracks in the crystal ball : A maturity model for quantitative risk assessment.
White Rose Research Online URL for this paper:http://eprints.whiterose.ac.uk/83503/
Version: Accepted Version
Article:
Rae, Andrew John, Alexander, Rob orcid.org/0000-0003-3818-0310 and McDermid, John Alexander orcid.org/0000-0003-4745-4272 (2014) Fixing the cracks in the crystal ball : A maturity model for quantitative risk assessment. Reliability Engineering and System Safety. pp. 67-81. ISSN 0951-8320
https://doi.org/10.1016/j.ress.2013.09.008
[email protected]://eprints.whiterose.ac.uk/
Reuse
Items deposited in White Rose Research Online are protected by copyright, with all rights reserved unless indicated otherwise. They may be downloaded and/or printed for private study, or other acts as permitted by national copyright laws. The publisher or other rights holders may allow further reproduction and re-use of the full text version. This is indicated by the licence information on the White Rose Research Online record for the item.
Takedown
If you consider content in White Rose Research Online to be in breach of UK law, please notify us by emailing [email protected] including the URL of the record and the reason for the withdrawal request.
- 1 -
Fixing the Cracks in the Crystal Ball: a Maturity Model for Quantitative Risk Assessment
Andrew Raea, Rob Alexandera*, John McDermida, aDepartment of Computer Science, University of York, York, UNITED KINGDOM
Abstract
Quantitative Risk Assessment (QRA) is widely practiced in system safety, but there is insufficient evidence that QRA in general is fit for purpose. Defenders of QRA draw a distinction between poor or misused QRA and correct, appropriately used QRA, but this distinction is only useful if we have robust ways to identify the flaws in an individual QRA. In this paper we present a comprehensive maturity model for QRA which covers all the potential flaws discussed in the risk assessment literature and in a collection of risk assessment peer reviews. We provide initial validation of the completeness and realism of the model.
Our risk assessment maturity model provides a way to prioritise both process development within an organisation and empirical research within the QRA community.
Keywords: quantitative risk assessment; probabilistic risk assessment; evaluation; validity; process maturity; QRA, PRA
Corresponding author: Rob Alexander, Department of Computer Science, University of York, Deramore Lane, YO10 5GH, UNITED KINGDOM.
Tel: +44 1904 325474 / +44 7813 134 388
Email: [email protected]
Illustrations: colour on the web only please
- 2 -
1 Introduction Quantitative risk assessment (QRA) is widely used to support system safety decision making by industry, regulators and government. QRA has been heavily criticised by academics ([1][2][3][4]), working engineers ([5][6]) and public welfare campaigners ([7][8]). Attempts to rebut the criticisms (e.g. Apostolakis [9]) rely on distinguishing “good” QRA from “bad” QRA, a review task which is itself a black art. Our perception is that QRA remains widely practiced because of inertia and uncertainty (benefit of the doubt), not because of justified belief in its validity. Our aims in this paper are to argue in support of this perception and to provide a maturity model that shows a path to justifiable QRA practice.
QRA is used in many domains for many different purposes; in this paper we are solely concerned with its use in safety. We do not make claims about the utility or otherwise of QRA in other domains. Due to our focus on safety we are concerned with risk associated with hazards – states of the system which can cause harm, especially loss of life or injury, without anything else needing to go wrong. In some domains the term “risk scenario” is used; because of our focus on safety we use the term “hazard” throughout.
In terms of years, QRA is a mature discipline – fault tree analysis has been in use since the Minuteman Missile and Boeing 747 development projects in the 1960s [10], and probabilistic nuclear safety assessment began at a similar time [11]. Actual maturity of science, however, does not come from age; it comes from revision and correction as weaknesses in theories and methods are identified and resolved. In this respect, QRA has led a charmed life – it has been subject to little empirical evaluation and little critical review. Empirical studies do not seem to have influenced the actual conduct of QRA [12]. Many instances of QRA are never tested: QRA is most important for assessing safety-critical behaviour in circumstances where we are very unwilling for the top event to happen even once (we do not tolerate nuclear meltdowns). When a QRA predicts that an accident will occur only every million years, not having that accident in a plant’s forty-year lifetime is negligible evidence that the QRA was correct. We thus have the combination of little empirical study with little natural feedback – a situation which leaves us in almost total darkness as to the validity and efficacy of QRA.
An important question is thus “how can we make things better?” A key first step is to understand the flaws – to systematically understand the full breadth of ways in which QRA can go wrong. A second step is to understand the relative importance of those flaws so that we can prioritise research into them.
In this paper, we first summarise the empirical evidence on the validity of QRA, and we show that it is inadequate given the strong claims that QRA users are making. We then present a comprehensive classification of possible flaws in QRA, drawing on those described in a wide range of published sources. We have assessed the validity of this error set by noting whether the flaws occur in a set of peer reviews of real-world risk assessments, or in our own industrial experience. While there are many previous “most important errors” or “most common error” lists (e.g. [7][13][14][15]), we are aware of no previous classification that even claims to be comprehensive.
Our goal in this paper is not to add to the criticism of QRA. We provide instead a constructive way forward – a maturity model for assessing and improving QRA. In order to qualify for a given level, a QRA process and report must be free of the flaws in all levels below. By organising the flaws in this
- 3 -
way, our maturity model provides a roadmap both for organisations to develop their QRA practices and for researchers to target the most important real-world problems.
2 There is Inadequate Empirical Support for Quantitative Risk Assessment
2.1 We Believe that QRA is Valuable, but We Cannot Show It
We will start by setting out some of our (the authors’) views on QRA, in order to set our assessment of practices in context. We believe that QRA, done well, probably helps people design safer systems. Furthermore, assessing the absolute size of risk is a necessary part of a well-regulated safety process, and by definition this activity is “QRA”. Therefore we cannot say “do not do QRA”; we can, however, say “be sceptical about the validity and hence value of any instance of QRA”.
We will spell out in detail, through the rest of this section, what the evidence for and against QRA says. In summary, it suggests that:
a) Effort should be placed on improving the quality of QRA performance, in particular on providing tools and mechanisms for review of QRA
b) QRA should be used in ways that match its strengths - the focus of analysis should be on finding ways to manage risk
c) QRA should not be used in ways that place excessive reliance on its accuracy d) We need more research into the quality and attributes of QRA as it is practiced
Many of the flaws in QRA are equally applicable (and probably prevalent) in non-quantitative (qualitative) risk assessment. It is not our intent here to promote a qualitative alternative to QRA.
In order to investigate QRA, we need to distinguish between several different concepts.
1. The properties QRA has as a set of practices 2. The properties of any specific instance of QRA (e.g. “the QRA performed on a proposed
expansion of chemical plant X by safety consultancy Y between June and September 2009”) 3. The properties shared by sets of specific examples of QRA (e.g. “large-scale QRAs in the UK
chemical process industry between 2008 and 2013”)
In order to investigate QRA, we will need to examine instances of QRA. Some QRA instances will be better than others, and specific criticisms levelled at QRA may be true for some instances but not for others.
QRA, however, has a very definite existence beyond individual instances. There are frequent arguments about the benefits and drawbacks of QRA as a practice. QRA may be mandated or not mandated by standards and regulations. Empirically, there may be patterns and trends in the properties of QRA examples. There are statements which, if not necessarily true for “QRA” can be shown to be true for most or all instances of QRA.
In these cases, the main question of concern from a big-picture perspective is “If people set out to do a QRA, are they likely to do it well in terms of the claims they will want to make?” If a claim cannot be shown to be true for QRA generally, or to be predominantly true in an identifiable set of QRA examples, then it is an unsupported claim.
- 4 -
QRA practices vary according to the competency of QRA practitioners and between industry sectors. At present there is no research which examines properties common to QRA instances in specific sectors. One of the goals of this paper is to facilitate such research by allowing QRA instances to be measured against a common framework.
2.2 There are Strong Claims Made about QRA
There is no academic or industrial source which spells out all the properties that QRA as a tool must have in order to be fit for purpose. Guidance is available on the form and content of that individual QRA examples should follow, and on errors to be avoided, but this falls short of stating clearly what QRA should achieve. However, we can infer the required properties by looking at how QRA is used and what people say about QRA, and then capture these properties in the form of the claims that users make about QRA. Sometimes these claims are explicit, but often they are implicit. For example, if a risk assessment report states that a QRA was presented to a public focus group and that the group found the risk distribution acceptable, then it is making the implicit claim that the focus group could understand the QRA well enough to make that judgement. Once we have a clearly-defined set of claims, we can examine whether they are supported or refuted by the available evidence, and thereby assess whether the use of QRA is actually justified.
To identify suitable claims we surveyed a collection of real-world risk assessment reports [16] and noted the self-identified purpose of the reports. Activities making use of QRA include:
1. Classifying risk (usually for the purpose of regulating a substance or technology)
2. Reacting to public concern regarding a known or suggested risk
3. Identifying ways to improve a design 4. Selecting between competing designs 5. Comparing risk with pre-defined targets 6. Trading-off risk against other concerns 7. Tracking changes in risk over time 8. Accepting or declining risk as a public policy decision
Of course, QRA are rarely used alone – they are typically used in tandem with qualitative analyses, operational experience reports, and expert judgement. The value of a given QRA partly depends on this context; it also depends on its suitability to benefit from the context – for example, if a QRA has weaknesses that other methods can compensate for, that potentially enables that QRA to be used effectively, but it needs to be clear from the QRA artefacts and activities that it does indeed have those weaknesses. If the weaknesses are not clear, the complementary activities may never be performed, or their results never checked for those issues.
For example, in activity 4 (“Selecting between competing designs”), analysts might proceed by building a quantitative model (such as a set of fault trees) for each competing design, then calculating the safety risk posed by each of them. These quantitative models would seldom be the sole basis for the decision. For example, a qualitative common-cause analysis could explore issues of inter-dependence and systematic failure, and design reviews could examine compliance with standards and regulations. These analyses would feed into the decision-making process, where safety would be one factor to be weighted and considered against competing concerns such as cost, time to market, and non-safety performance.
Similarly, in activity 5 (“Comparing risk with pre-defined targets”), analysts would model in an appropriate quantitative form and analyse the model to determine the overall risk. They could then
- 5 -
compare the estimated risk with the defined target(s). The target might be a fixed system risk criteria such as “1 × 10⁻⁶ fatal accidents per hour” or a more complex criterion that would require further analysis (e.g. the ALARP criterion in the UK, whereby overall risk must be below some target and reduced by any means that is reasonably practicable). Quantitative targets are seldom the sole risk acceptance criterion; QRA informs but does not fully determine risk acceptability.
Although any individual use of QRA cannot be considered in isolation of other engineering activities, in order to provide a useful assessment of QRA and to develop our maturity model, for the rest of this paper we will focus on the properties of QRA itself. We start by considering the claims made for QRA.
We have identified the following set of important claims, ordered from the strongest to the weakest, in terms of claimed contribution of QRA to safety:
1. The Real-world Accuracy Claim – the aggregated estimate of total system risk (the “top number” in fault tree terminology) is sufficiently accurate and precise to allow correct decisions to be made (for example by comparing estimated risk against acceptable levels or targets). This claim arises from the use of QRA to support activities 1, 2, 4, 5 and 8.
2. The Cost-effective Usefulness Claim – performing QRA provides a safety benefit that is measurably better than that provided by similar non-quantified risk assessment activities (e.g. greater insight into the dangerous behaviour of the system). This claim arises from the use of QRA to support activities 3, 4, 6, and 7.
3. The Usefulness Claim – QRA provides a benefit, but we can’t say that it’s more important than non-quantified “rivals”. (This is the fall-back claim, which leaves QRA with some value, but no special status amongst safety techniques.)
Our claims are not the only way to evaluate QRA. There is a rich vein of literature theorising about what it means for QRA to be valid; Aven [17] provides a useful summary of the different perspectives. For example, Aven and Heide [18] discuss the requirements QRA must meet to be considered a “scientific method”. Aven and Heide’s “V1” definition of risk assessment validity – “the degree to which the produced risk numbers are accurate compared to the underlying true risk” – corresponds to our first claim. There are ways, however, that QRA can be scientific without making accurate predictions of real world risk. For example, under Aven and Heide’s “V2” criterion, scientific validity can arise because the “assigned probabilities adequately describe the assessor’s uncertainties of the unknown quantities considered”. The claims we address here consider QRA as an engineering method, rather than a scientific method. Engineering methods are equally subject to scientific investigation, but are evaluated according to their usefulness in achieving engineering goals. Thus, although we share with Aven and Heide a concern with claims of real-world accuracy, we then move on to explicit usefulness claims rather than alternative claims of scientific validity. For all of the claims, the benefit provided by QRA is ultimately to help make better decisions. For Real-World Accuracy, this is a simple “value of information” proposition – accurate knowledge of risk allows much better decisions in many of the activities listed earlier. For the other two claims, there are a variety of ways in which QRA can potentially improve decisions, such as facilitating
- 6 -
communication between stakeholders or highlighting areas of uncertainty. These are discussed further in sections 2.4 and 2.5. We carried out an organized search for literature that empirically addresses the above claims. We did this in two stages. First, we searched the web for paired keywords: in each search one keyword was “QRA” or the name of a specific QRA technique, and the second keyword referred to one of the claims or to evidence gathering and evaluation (e.g. “validation”, “empirical”, “effectiveness”). Second, we conducted a manual search by using queries on mailing lists and by following citations from papers that advocated QRA or specific QRA techniques.
Our previous work on system safety research validation [19] suggested that there was very little research on the fitness-for-purpose of safety techniques generally. This was borne out in this more structured search – there is very little direct evidence that speaks for or against QRA meeting the claims. In fact, the little work directly on the topic just discusses the lack of evidence rather than providing evidence in either direction. Manion [20] discusses the evidence basis for Fault Tree Analysis (FTA), but he makes only one direct statement about FTA performance – he claims that that fault trees underestimate risk “often by many orders of magnitude”. This turns out to be a hypothetical assertion from Mauri [21] rather than an evidenced claim. McDermid [22] observes that loss events in large-scale information technology systems are seldom anticipated by risk assessment. Danielsson [23] discusses quantitative models for financial risk assessment, and comes to similar conclusions to us; the paucity of evidence for QRA is not confined to system safety, so it appears that problems with QRA are not purely the product of unique challenges of the safety domain.
In the following three sections we discuss each claim in turn, identify how each claim might be supported by evidence, and compare the extant evidence compares with that standard.
2.3 The Real-World Accuracy Claim is False
2.3.1 The Nature of the Accuracy Claim
To establish the Real-world Accuracy Claim, we need to address the question “How accurate must the risk estimate be?”
A quantified risk is (or at least should be) a probability distribution. A typical presentation includes a mean with confidence intervals above and below that mean. For example, we might say that the probability of a reactor leak is 1 x 10⁻⁶ per operating year, with 95% confidence that the upper bound is 1 x 10⁻⁵ per operating year. In cases where the distribution is not stated, it may still be implied (albeit weakly) by the number of significant figures used to state the mean.
Aven and Heide [18] point out that wide confidence intervals are incompatible with high validity, but caution that determining what constitutes an acceptable confidence interval is context dependent. The way QRA is used can provide this context. In the case where QRA is used to justify that the risk posed by a system is less than some target, the total error must be less than the margin between the estimated risk and the risk limit. For example, if an aircraft system must exhibit a dangerous fault less than 1 x 10⁻⁶ per flight hour, and is estimated to exhibit such faults at a rate of 8 x 10⁻⁷ per flight hour, then the error must be less than 2 x 10⁻⁷ per flight hour. Otherwise, the QRA could appear to show that an unsatisfactory system met the target.
The U.S. Nuclear Regulatory Commission NUREG 1150 [24] evaluated five reactors against a target probability for an “individual early fatality per reactor year” of 5 x 10⁻⁶. Using 95% confidence
- 7 -
intervals, the probability estimate for two of the reactors was 5 x 10⁻⁷. This required the estimate to be precise within one order of magnitude to avoid false re-assurance that the target was met.
The earlier WASH-1400 report [25] included frequencies for some events of 9 x 10⁻⁷ per reactor per year. No threshold comparison was made, but there was an implied claim in stating the 9 x 10⁻⁷ figure that the methods used were capable of measuring the risk so precisely.
Not all quantitative risk assessments use a probability as the top number. For example, the environmental impact of chemicals is typically estimated as an expected population dose. If the expected dose approaches the level likely to cause harm to some portion of the population, the risk is unacceptable. The question of precision applies equally in this case. The estimate of expected dose must be more accurate than the distance between it and the dangerous level.
2.3.2 Support for the Accuracy Claim
The nature of QRA does make it very difficult to evaluate risk estimates empirically. Ideally, we would want to perform controlled trials with many replications of the same project in parallel, with an independent way of measuring the actual associated risk (perhaps by operating each resulting system for 30 years and monitoring the accidents and incidents that occur). If the risk estimates from QRA were tolerably close to the risk inferred from our monitoring, we could conclude that the real-world accuracy claim broadly holds.
It is of course not practical to do such experiments, at least not for real projects on real systems. As Weinberg, quoted in Aven and Heide [18] puts it “one of the most powerful methods of science – experimental observations – is inapplicable to the estimation of overall risk”. This is not, of itself, an argument against using QRA, but it does show the difficulty of directly evaluating the accuracy of claims.
In the case of accuracy, there is fortunately a necessary (but not sufficient) precondition which can and has been empirically investigated. Before any method can be accurate, it must first be precise – QRA is not useful if the correct answer lies somewhere within a very wide band of probabilities. Before any method can be precise, it must first be reliable: the same method applied by different people or at different times should give very similar results (Aven and Heide describe this as “R2” reliability [18]). If such multiple applications give significantly different results, this places an upper bound on how accurate that method can be. Studies of the reliability of QRA can thus rebut (but not confirm) the accuracy claim.
The benchmark exercises reported by Amendola [26], Markert [27] and Fabbri [28] involved multiple teams assessing the risk of reference plants and scenarios. The purpose of all of these studies was to examine how QRA application varied between countries, and to identify sources of variability, with the extent of variability revealed as a by-product of each investigation. These exercises consistently showed variations over multiple orders of magnitude (as many as six orders, with differences over three orders of magnitude common) for teams with the same source data analysing the likelihood of the same top event (civilian deaths from gas release). Teams in these studies used common data, but had a choice of which QRA methods they used.
This is strong evidence that QRA is not reliable, and therefore not accurate. We were unable to find any studies that contradict the outcomes of the benchmark exercises.
There are a small number of studies that address accuracy directly, comparing estimations with outcomes. These are necessarily high-frequency outcomes, typically sub-system events as part of a
- 8 -
larger QRA exercise. Examples include the United States Nuclear Regulatory Commission reliability updates [29], and the NASA space shuttle probabilistic risk assessment [30]. The NRC studies explicitly use the outcomes as inputs into larger QRA calculations, and so cannot be considered stand-alone evidence of QRA accuracy.
Our conclusions above are consistent with the theoretical analysis of Aven and Heide [18], which concludes that the real-world accuracy claim (in their terms, “V1 validity”) is unlikely to be met in practice for the traditional relative-frequency approach in which the claim is couched. Aven and Heide also observe that it will definitely not be met by alternative probability of frequency approaches.
2.4 The Cost-Effective Usefulness Claim is Unsupported
2.4.1 Establishing a Cost-Effective Usefulness Claim
The core question here is “Does QRA Lead to Safer Systems Even When the Top Number is Not Accurate?” Using numbers could be useful, even if the numbers themselves are not accurate. In 2004, Apostolakis presented an enthusiastic defence of QRA in response to popular press scepticism [9]. Notably, he chose specifically not to defend the quantification of aggregate risk, instead pointing to the improvements in safety that may arise from performing the analysis. This is not to say that safety improvement is a side-effect of quantification – it may be the direct and most important result of trying to quantify safety. Apostolakis suggests that quantification was necessary:
to appropriately prioritise risk from different scenarios; to facilitate communication between stakeholders; to integrate information from different academic disciplines; and to highlight areas of uncertainty where more information or research is necessary.
We can note that the reliability requirement from section 2.3.2 only applies to the real-world accuracy claim discussed in that section – there may be many valid ways to perform a given QRA, and for any given system there could be several quite different quantitative models where each provides valuable safety insights. In a set of QRAs for the same system that produced wildly varying overall risk estimates, each QRA might provide useful information to the safety process. Indeed, commissioning multiple QRAs from practitioners with varying backgrounds and expertise might be a cost-effective way to gain safety knowledge.
How would we know if QRA was cost-effectively useful? To support this claim we would need a way to measure the usefulness and costs of risk-assessment relative to other safety activities. Measuring the usefulness of risk-assessment is not straightforward, particularly in the absence of measurements for absolute safety. If we could trust QRA to tell us how safe a system is, then we could also measure whether particular activities or design changes increased or decreased safety. It is the responsibility of those making claims of usefulness to provide mechanisms for measuring those claims.
An example of good practice in this regard is Alexander and Kelly [31], which proposes enumeration of unique causal chains as a measure of the effectiveness of hazard analysis. Demonstrating that it is the method (rather than the skill of the risk assessor) delivering the benefit would require application of methods in controlled circumstances.
2.4.2 Support for the Cost-Effective Usefulness Claim
Whilst cost-effective usefulness is plausible for the reasons given above, it has not been scientifically tested. Practitioners of QRA perceive value arising from the quantification, but this is in the absence
- 9 -
of any control that would allow their perception to be tested. In other words the cost-effective usefulness claim is not proven, but it is not refuted either. As we have rejected the real-world accuracy claim above, this is the strongest claim that might be made for QRA.
QRA may, of course, be cost-effective in terms of non-safety benefits, but that is beyond the scope of this paper.
2.5 The (Mere) Usefulness Claim is Plausible, but Unhelpful
To establish that QRA provides some value but is unremarkable amongst safety techniques, we merely need to identify means by which it can and does contribute to safety knowledge. Possible mechanisms for this were listed in section 2.4.1 above.
Usefulness without cost-effectiveness is of limited value, since a technique with poor return on investment can reduce the overall effectiveness of a safety program. QRA techniques are elaborate, time-consuming and expensive; if mere usefulness were the only claim about QRA that could be supported, the practice of QRA would be difficult to defend.
2.6 Standards are Useful but Insufficient for Supporting Claims about QRA
As noted in Section 2.1 above, if any of the claims about QRA in general (real-world accuracy, cost-effective usefulness, usefulness) were true, this would not necessarily mean that any given QRA report had these properties. Contrariwise, identification of flaws in QRA in general does not mean that any specific QRA is flawed. In fact, many of the criticisms of QRA are based on errors in the practice of QRA, and many of the defences of QRA blame misuse of QRA for perceived problems; Apostolakis [9] and Aven [32] are simultaneously defenders of appropriate QRA and critics of QRA misuse.
How can we tell if a particular QRA is a “good QRA” or a “bad QRA”? Apostolakis argues for the central role of quality review [9]; Alexander and Kelly make a similar argument [33]. This raises important questions about the effectiveness of risk assessment review. The nature of QRA means that we cannot check its results directly; we need results in advance of events, and indeed we need estimates for events that will probably never occur. We therefore have to rely on process claims – claims that we have performed QRA in such a way that it will give trustworthy results. When we rely on process claims, we are justifying our risk estimates on the basis of arguments about QRA in general and experience with QRA on projects in the past. We thus need confidence that we have conducted QRA well.
There are a number of sources we can turn to for quality review of QRA. ASME RA-S2008 provides technical requirements for nuclear power plant risk assessments [34]. With a few exceptions these requirements are generic – that is, they could be applied to QRAs beyond the nuclear power industry. The focus of the requirements is ensuring that the QRA is documented in enough detail to support expert peer review. The Swiss nuclear standard ENSI-A05e [35] is more nuclear-specific, providing detailed guidance on power plant failure scenarios. Both of these standards implicitly consider what can go wrong with risk assessment – the choice of topics for requirements indicate concerns about flaws such as incorrect scope, incomplete hazard identification, poor elicitation of expert opinion, poor choice of component data, and unsupported estimates of human error.
The European Rail Common Safety Method [36] creates a requirement for explicit risk assessment, and provides some guidance on the conduct of risk assessment. This guidance is at a very high level –
- 10 -
it provides basic instruction as to risk assessment should be performed rather than warning against specific flaws.
QRA for offshore oil and gas installations is supported by the Centre for Marine and Petroleum Technology (CMPT) guide [37]. This guidance focuses on estimating risk for specific scenarios such as blowouts, leaks, fires and evacuations. Some detailed quality information is included, particularly with respect to uncertainty analysis.
Following high-quality guidance material is likely to result in higher-quality instances of QRA. This is particularly the case when guidance is tailored to the concerns and common errors of a particular industry. However, complying with guidance is not in itself sufficient to ensure that a QRA is free of major flaws. All of the guidance described here emphasises the importance of expert peer review as a quality-control measure. Whether a particular instance of QRA satisfies the requirements and intent of ASMI RA-S2008, for example, can only be determined as a matter of expert judgement.
Such judgement is difficult because risk assessment is prone to subtle error. The textbook “Misconceptions of Risk” by Terje Aven [38] details nineteen fundamental misunderstandings capable of undermining an assessment. These misconceptions are not straw men – we have witnessed many of these misunderstandings in industrial practice. Hansson [13] reports similar misconceptions from his own experience.
Distinguishing between good QRA and bad QRA is the primary motivation for our maturity model for risk assessments.
3 We Have Built a Maturity Model for QRA To address the concerns raised in the last section, we can make three pertinent observations. First, we can make most effective progress with the problem if we can prioritise the research that is needed. If we find different levels of empirical evidence of specific problems, we will then, similarly, need to prioritise improvements to fix those problems which occur most often (or with the greatest negative impact).
Second, much empirical research on QRA will necessarily involve examining and evaluating real risk assessments. We therefore need ways to judge risk assessments when we review them.
Finally, many general concerns about the validity of QRA can be assuaged for a single risk assessment. A risk assessor can state “My risk assessment doesn’t have that problem”, and argue their case. To support this, however, we need a comprehensive list of problems to look for.
We could benefit, therefore, from a comprehensive classification of possible flaws in QRA. Such a classification could be arranged into levels of importance, thus allowing researchers and practitioners to prioritise their remedial actions. We have developed just such a scheme, and present it in this section.
3.1 There is a common set of processes used in QRA
In order to describe what can go wrong with risk assessment, we first describe what a risk assessment should be. Our description of the risk assessment processes is taken from a combination of sources. These include the National Academy’s “Reference Manual on Scientific Evidence” [39], the Swiss Nuclear Safety Inspectorate standard for Probabilistic Safety Analysis [35], the European Rail Common Safety Method (CSM) [36], and the EuroControl ESARR 4 [40].
- 11 -
There are eight primary processes making up a typical risk assessment, each with several sub-processes. All of the processes must be present and correct for a complete risk assessment. The processes are:
Provide resources (manage competency, select participants, select tools) Establish context (define scope, define system boundary, determine evaluation criteria) Identify dangerous outcomes (select identification methods, determine significant events and
states) Build models (select modelling paradigm, build system-specific models, validate qualitative
dynamics of models) Estimate risk (select data sources, evaluate data quality, populate models with data,
execute/analyse models, capture results, describe risk (including uncertainties)) Evaluate risk (characterise decision, select preferred option) Plan actions (fulfil assumptions, monitor estimates, reduce uncertainty, plan updates) Communicate results (record process, report residual risk, report limitations)
This is not a stage model – it is a list of processes that will be performed somewhat in parallel. It intentionally says nothing about necessary ordering – there are many possible orderings, interleavings and repetitions, and in any case knowledge of ordering is not needed for our purposes. All we need is a list of activities so that we can identify the flaws that can emerge from each of the activities. Our identification of flaws does not follow this list of activities; instead we used it as a prompt for organising the maturity model, for example by showing how to group cognate issues.
3.2 We can derive a maturity model by identifying the possible flaws in
each process
Critiques of the practice (as opposed to the in-principle effectiveness) of QRA fall into four broad categories:
1. Failure to develop appropriate causal models (see for example Manion [20]) 2. Failure to determine appropriate input parameters (see for example Gadd [15]) 3. Failure to appropriately communicate and apply the results of QRA, particularly with respect
to uncertainty in the results (see for example Montague [41]) 4. Failure to ensure that the results of the QRA stay valid throughout the period it is used for
(see for example Rae and Nicholson [42])
We derived the basics of our maturity model by applying these concerns to the needs of each QRA process step. We then decomposed these broad concerns into more specific flaws by an iterative process, drawing on standards and guidelines for the conduct of risk assessment, academic literature describing errors in risk assessments, published peer reviews of risk assessments, and our combined experience in review of risk assessments.
Flaws are assigned to levels based on our assessment of their power to undermine a risk assessment exercise. The levels are akin to the maturity levels of CMM or SPICE from software engineering management, in that increasing level indicates a better risk assessment, and that attaining a higher level requires avoiding the flaws at lower levels. We do not intend, however, to align this model directly with the CMM or SPICE scheme – our purposes are different to theirs. At this stage the maturity model is a hypothesis; in the same way that the adequacy of QRA has been evaluated in this paper, our maturity model will need evaluation (see Section 3.4).
- 12 -
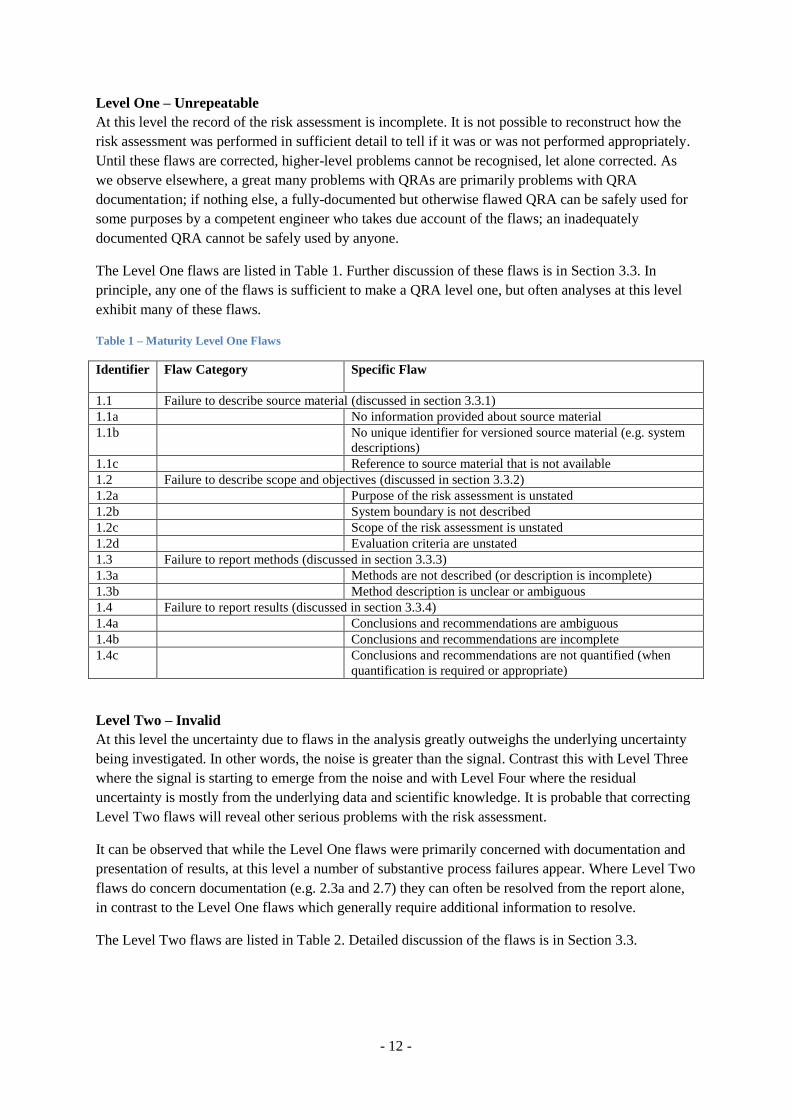
Level One – Unrepeatable At this level the record of the risk assessment is incomplete. It is not possible to reconstruct how the risk assessment was performed in sufficient detail to tell if it was or was not performed appropriately. Until these flaws are corrected, higher-level problems cannot be recognised, let alone corrected. As we observe elsewhere, a great many problems with QRAs are primarily problems with QRA documentation; if nothing else, a fully-documented but otherwise flawed QRA can be safely used for some purposes by a competent engineer who takes due account of the flaws; an inadequately documented QRA cannot be safely used by anyone.
The Level One flaws are listed in Table 1. Further discussion of these flaws is in Section 3.3. In principle, any one of the flaws is sufficient to make a QRA level one, but often analyses at this level exhibit many of these flaws.
Table 1 – Maturity Level One Flaws
Identifier Flaw Category Specific Flaw
1.1 Failure to describe source material (discussed in section 3.3.1) 1.1a No information provided about source material 1.1b No unique identifier for versioned source material (e.g. system
descriptions) 1.1c Reference to source material that is not available 1.2 Failure to describe scope and objectives (discussed in section 3.3.2) 1.2a Purpose of the risk assessment is unstated 1.2b System boundary is not described 1.2c Scope of the risk assessment is unstated 1.2d Evaluation criteria are unstated 1.3 Failure to report methods (discussed in section 3.3.3) 1.3a Methods are not described (or description is incomplete) 1.3b Method description is unclear or ambiguous 1.4 Failure to report results (discussed in section 3.3.4) 1.4a Conclusions and recommendations are ambiguous 1.4b Conclusions and recommendations are incomplete 1.4c Conclusions and recommendations are not quantified (when
quantification is required or appropriate)
Level Two – Invalid At this level the uncertainty due to flaws in the analysis greatly outweighs the underlying uncertainty being investigated. In other words, the noise is greater than the signal. Contrast this with Level Three where the signal is starting to emerge from the noise and with Level Four where the residual uncertainty is mostly from the underlying data and scientific knowledge. It is probable that correcting Level Two flaws will reveal other serious problems with the risk assessment.
It can be observed that while the Level One flaws were primarily concerned with documentation and presentation of results, at this level a number of substantive process failures appear. Where Level Two flaws do concern documentation (e.g. 2.3a and 2.7) they can often be resolved from the report alone, in contrast to the Level One flaws which generally require additional information to resolve.
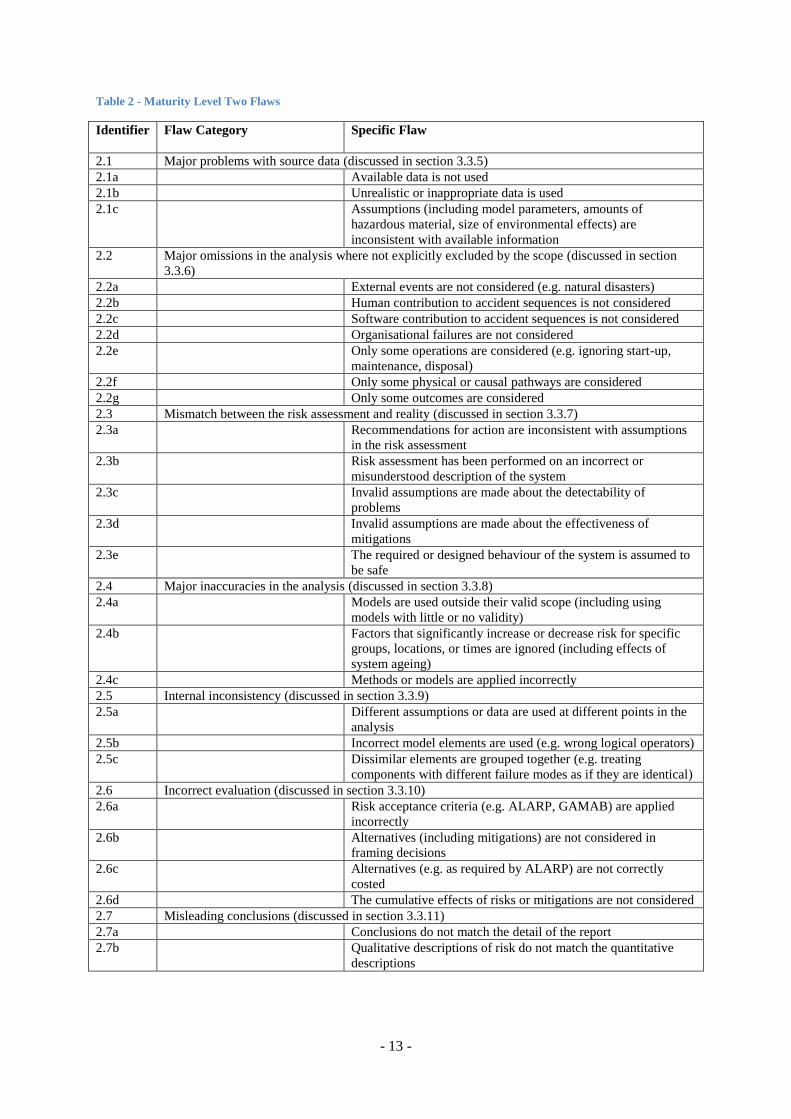
The Level Two flaws are listed in Table 2. Detailed discussion of the flaws is in Section 3.3.
- 13 -
Table 2 - Maturity Level Two Flaws
Identifier Flaw Category Specific Flaw
2.1 Major problems with source data (discussed in section 3.3.5) 2.1a Available data is not used 2.1b Unrealistic or inappropriate data is used 2.1c Assumptions (including model parameters, amounts of
hazardous material, size of environmental effects) are inconsistent with available information
2.2 Major omissions in the analysis where not explicitly excluded by the scope (discussed in section 3.3.6)
2.2a External events are not considered (e.g. natural disasters) 2.2b Human contribution to accident sequences is not considered 2.2c Software contribution to accident sequences is not considered 2.2d Organisational failures are not considered 2.2e Only some operations are considered (e.g. ignoring start-up,
maintenance, disposal) 2.2f Only some physical or causal pathways are considered 2.2g Only some outcomes are considered 2.3 Mismatch between the risk assessment and reality (discussed in section 3.3.7) 2.3a Recommendations for action are inconsistent with assumptions
in the risk assessment 2.3b Risk assessment has been performed on an incorrect or
misunderstood description of the system 2.3c Invalid assumptions are made about the detectability of
problems 2.3d Invalid assumptions are made about the effectiveness of
mitigations 2.3e The required or designed behaviour of the system is assumed to
be safe 2.4 Major inaccuracies in the analysis (discussed in section 3.3.8) 2.4a Models are used outside their valid scope (including using
models with little or no validity) 2.4b Factors that significantly increase or decrease risk for specific
groups, locations, or times are ignored (including effects of system ageing)
2.4c Methods or models are applied incorrectly 2.5 Internal inconsistency (discussed in section 3.3.9) 2.5a Different assumptions or data are used at different points in the
analysis 2.5b Incorrect model elements are used (e.g. wrong logical operators) 2.5c Dissimilar elements are grouped together (e.g. treating
components with different failure modes as if they are identical) 2.6 Incorrect evaluation (discussed in section 3.3.10) 2.6a Risk acceptance criteria (e.g. ALARP, GAMAB) are applied
incorrectly 2.6b Alternatives (including mitigations) are not considered in
framing decisions 2.6c Alternatives (e.g. as required by ALARP) are not correctly
costed 2.6d The cumulative effects of risks or mitigations are not considered 2.7 Misleading conclusions (discussed in section 3.3.11) 2.7a Conclusions do not match the detail of the report 2.7b Qualitative descriptions of risk do not match the quantitative
descriptions
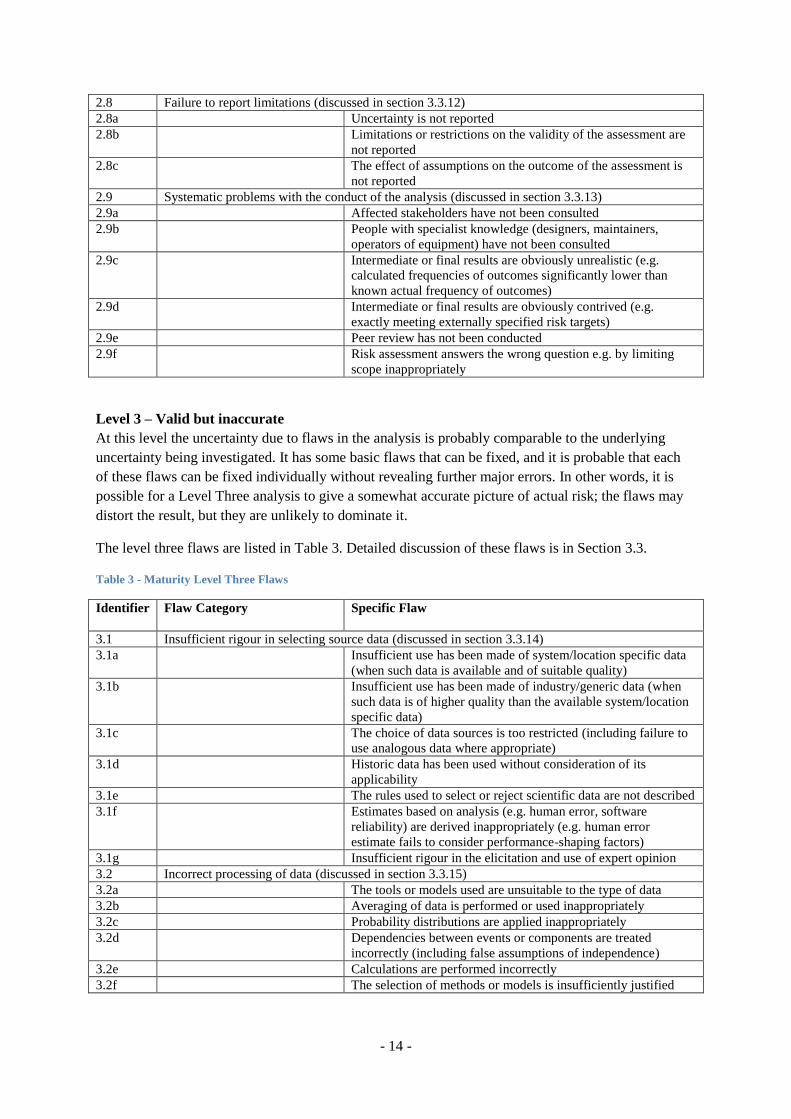
- 14 -
2.8 Failure to report limitations (discussed in section 3.3.12) 2.8a Uncertainty is not reported 2.8b Limitations or restrictions on the validity of the assessment are
not reported 2.8c The effect of assumptions on the outcome of the assessment is
not reported 2.9 Systematic problems with the conduct of the analysis (discussed in section 3.3.13) 2.9a Affected stakeholders have not been consulted 2.9b People with specialist knowledge (designers, maintainers,
operators of equipment) have not been consulted 2.9c Intermediate or final results are obviously unrealistic (e.g.
calculated frequencies of outcomes significantly lower than known actual frequency of outcomes)
2.9d Intermediate or final results are obviously contrived (e.g. exactly meeting externally specified risk targets)
2.9e Peer review has not been conducted 2.9f Risk assessment answers the wrong question e.g. by limiting
scope inappropriately
Level 3 – Valid but inaccurate At this level the uncertainty due to flaws in the analysis is probably comparable to the underlying uncertainty being investigated. It has some basic flaws that can be fixed, and it is probable that each of these flaws can be fixed individually without revealing further major errors. In other words, it is possible for a Level Three analysis to give a somewhat accurate picture of actual risk; the flaws may distort the result, but they are unlikely to dominate it.
The level three flaws are listed in Table 3. Detailed discussion of these flaws is in Section 3.3.
Table 3 - Maturity Level Three Flaws
Identifier Flaw Category Specific Flaw
3.1 Insufficient rigour in selecting source data (discussed in section 3.3.14) 3.1a Insufficient use has been made of system/location specific data
(when such data is available and of suitable quality) 3.1b Insufficient use has been made of industry/generic data (when
such data is of higher quality than the available system/location specific data)
3.1c The choice of data sources is too restricted (including failure to use analogous data where appropriate)
3.1d Historic data has been used without consideration of its applicability
3.1e The rules used to select or reject scientific data are not described 3.1f Estimates based on analysis (e.g. human error, software
reliability) are derived inappropriately (e.g. human error estimate fails to consider performance-shaping factors)
3.1g Insufficient rigour in the elicitation and use of expert opinion 3.2 Incorrect processing of data (discussed in section 3.3.15) 3.2a The tools or models used are unsuitable to the type of data 3.2b Averaging of data is performed or used inappropriately 3.2c Probability distributions are applied inappropriately 3.2d Dependencies between events or components are treated
incorrectly (including false assumptions of independence) 3.2e Calculations are performed incorrectly 3.2f The selection of methods or models is insufficiently justified
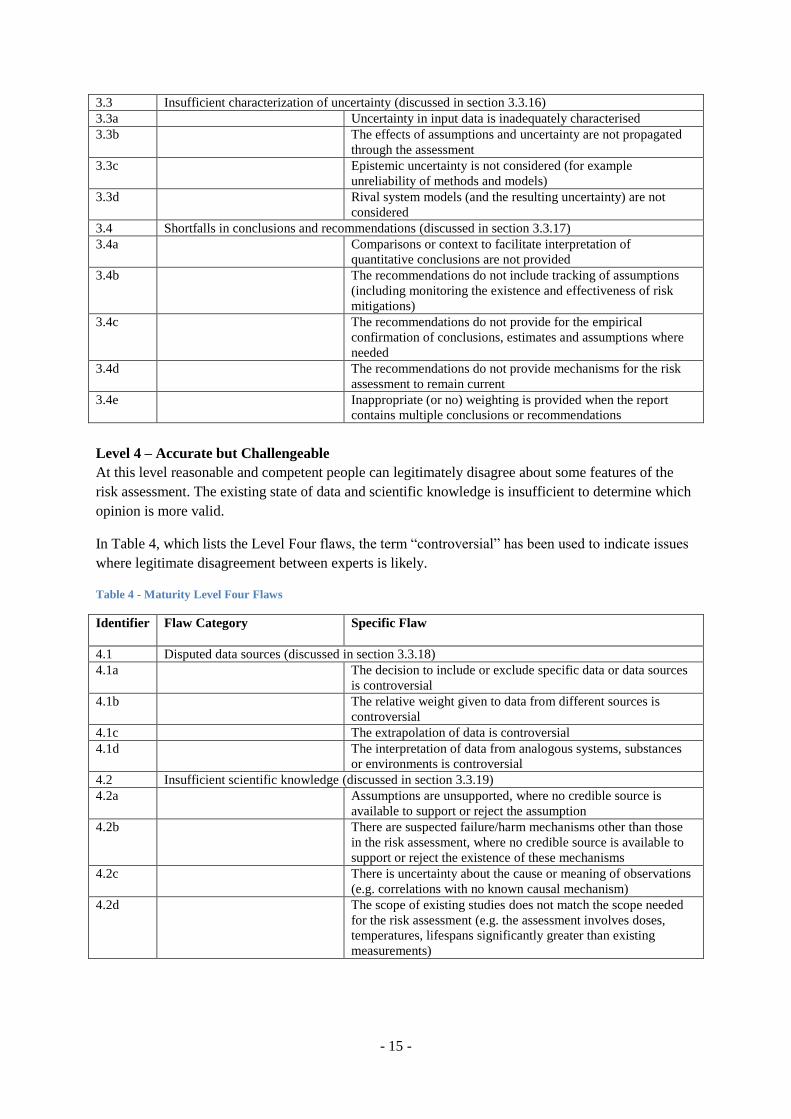
- 15 -
3.3 Insufficient characterization of uncertainty (discussed in section 3.3.16) 3.3a Uncertainty in input data is inadequately characterised 3.3b The effects of assumptions and uncertainty are not propagated
through the assessment 3.3c Epistemic uncertainty is not considered (for example
unreliability of methods and models) 3.3d Rival system models (and the resulting uncertainty) are not
considered 3.4 Shortfalls in conclusions and recommendations (discussed in section 3.3.17) 3.4a Comparisons or context to facilitate interpretation of
quantitative conclusions are not provided 3.4b The recommendations do not include tracking of assumptions
(including monitoring the existence and effectiveness of risk mitigations)
3.4c The recommendations do not provide for the empirical confirmation of conclusions, estimates and assumptions where needed
3.4d The recommendations do not provide mechanisms for the risk assessment to remain current
3.4e Inappropriate (or no) weighting is provided when the report contains multiple conclusions or recommendations
Level 4 – Accurate but Challengeable At this level reasonable and competent people can legitimately disagree about some features of the risk assessment. The existing state of data and scientific knowledge is insufficient to determine which opinion is more valid.
In Table 4, which lists the Level Four flaws, the term “controversial” has been used to indicate issues where legitimate disagreement between experts is likely.
Table 4 - Maturity Level Four Flaws
Identifier Flaw Category Specific Flaw
4.1 Disputed data sources (discussed in section 3.3.18) 4.1a The decision to include or exclude specific data or data sources
is controversial 4.1b The relative weight given to data from different sources is
controversial 4.1c The extrapolation of data is controversial 4.1d The interpretation of data from analogous systems, substances
or environments is controversial 4.2 Insufficient scientific knowledge (discussed in section 3.3.19) 4.2a Assumptions are unsupported, where no credible source is
available to support or reject the assumption 4.2b There are suspected failure/harm mechanisms other than those
in the risk assessment, where no credible source is available to support or reject the existence of these mechanisms
4.2c There is uncertainty about the cause or meaning of observations (e.g. correlations with no known causal mechanism)
4.2d The scope of existing studies does not match the scope needed for the risk assessment (e.g. the assessment involves doses, temperatures, lifespans significantly greater than existing measurements)
- 16 -
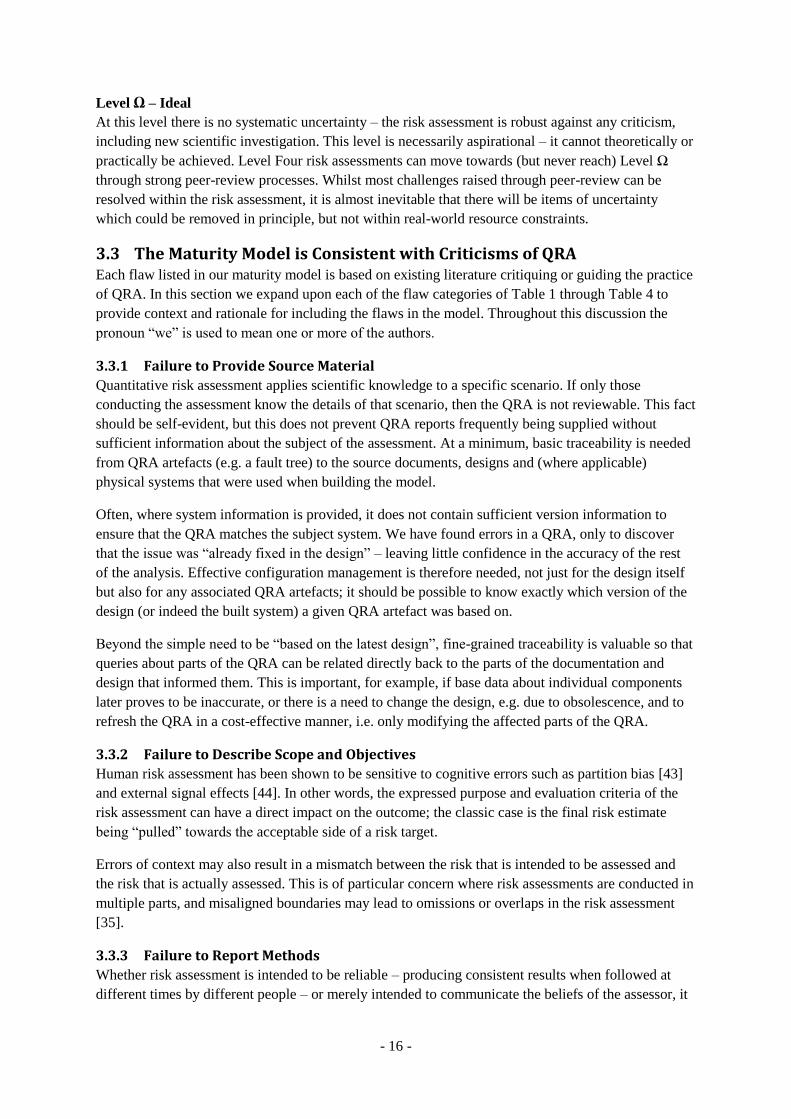
Level Ω – Ideal At this level there is no systematic uncertainty – the risk assessment is robust against any criticism, including new scientific investigation. This level is necessarily aspirational – it cannot theoretically or practically be achieved. Level Four risk assessments can move towards (but never reach) Level Ω through strong peer-review processes. Whilst most challenges raised through peer-review can be resolved within the risk assessment, it is almost inevitable that there will be items of uncertainty which could be removed in principle, but not within real-world resource constraints.
3.3 The Maturity Model is Consistent with Criticisms of QRA
Each flaw listed in our maturity model is based on existing literature critiquing or guiding the practice of QRA. In this section we expand upon each of the flaw categories of Table 1 through Table 4 to provide context and rationale for including the flaws in the model. Throughout this discussion the pronoun “we” is used to mean one or more of the authors.
3.3.1 Failure to Provide Source Material
Quantitative risk assessment applies scientific knowledge to a specific scenario. If only those conducting the assessment know the details of that scenario, then the QRA is not reviewable. This fact should be self-evident, but this does not prevent QRA reports frequently being supplied without sufficient information about the subject of the assessment. At a minimum, basic traceability is needed from QRA artefacts (e.g. a fault tree) to the source documents, designs and (where applicable) physical systems that were used when building the model.
Often, where system information is provided, it does not contain sufficient version information to ensure that the QRA matches the subject system. We have found errors in a QRA, only to discover that the issue was “already fixed in the design” – leaving little confidence in the accuracy of the rest of the analysis. Effective configuration management is therefore needed, not just for the design itself but also for any associated QRA artefacts; it should be possible to know exactly which version of the design (or indeed the built system) a given QRA artefact was based on.
Beyond the simple need to be “based on the latest design”, fine-grained traceability is valuable so that queries about parts of the QRA can be related directly back to the parts of the documentation and design that informed them. This is important, for example, if base data about individual components later proves to be inaccurate, or there is a need to change the design, e.g. due to obsolescence, and to refresh the QRA in a cost-effective manner, i.e. only modifying the affected parts of the QRA.
3.3.2 Failure to Describe Scope and Objectives
Human risk assessment has been shown to be sensitive to cognitive errors such as partition bias [43] and external signal effects [44]. In other words, the expressed purpose and evaluation criteria of the risk assessment can have a direct impact on the outcome; the classic case is the final risk estimate being “pulled” towards the acceptable side of a risk target.
Errors of context may also result in a mismatch between the risk that is intended to be assessed and the risk that is actually assessed. This is of particular concern where risk assessments are conducted in multiple parts, and misaligned boundaries may lead to omissions or overlaps in the risk assessment [35].
3.3.3 Failure to Report Methods
Whether risk assessment is intended to be reliable – producing consistent results when followed at different times by different people – or merely intended to communicate the beliefs of the assessor, it
- 17 -
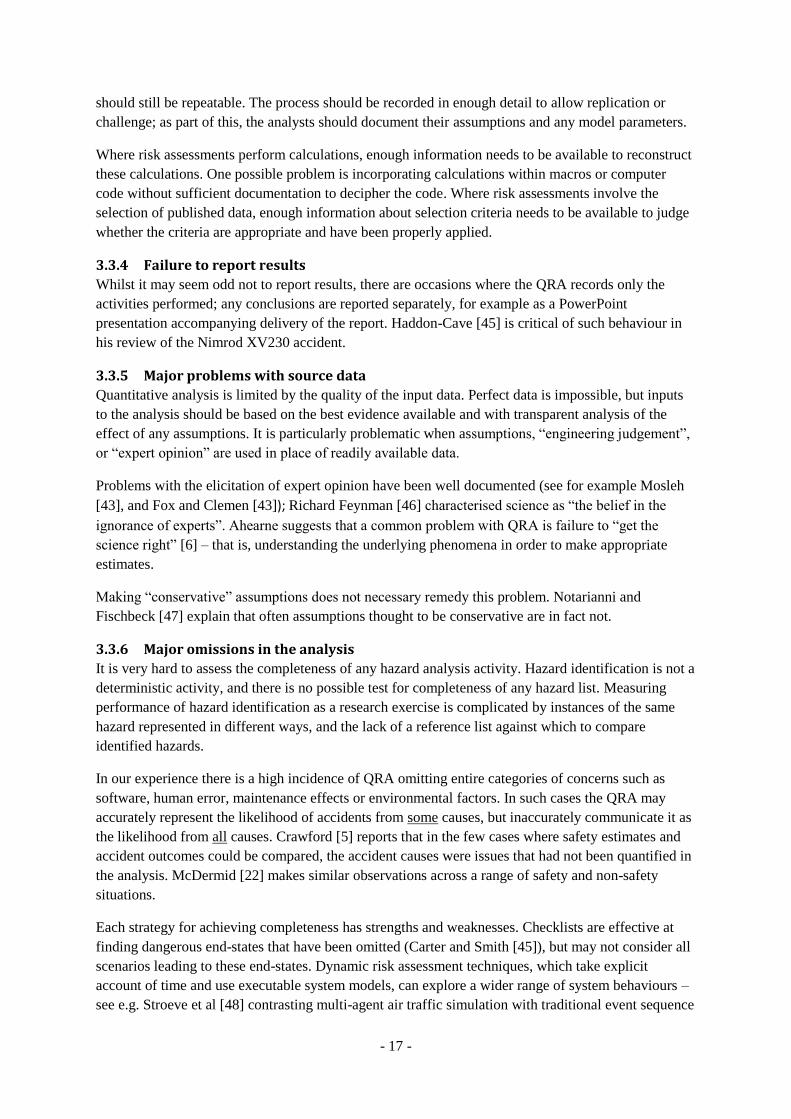
should still be repeatable. The process should be recorded in enough detail to allow replication or challenge; as part of this, the analysts should document their assumptions and any model parameters.
Where risk assessments perform calculations, enough information needs to be available to reconstruct these calculations. One possible problem is incorporating calculations within macros or computer code without sufficient documentation to decipher the code. Where risk assessments involve the selection of published data, enough information about selection criteria needs to be available to judge whether the criteria are appropriate and have been properly applied.
3.3.4 Failure to report results
Whilst it may seem odd not to report results, there are occasions where the QRA records only the activities performed; any conclusions are reported separately, for example as a PowerPoint presentation accompanying delivery of the report. Haddon-Cave [45] is critical of such behaviour in his review of the Nimrod XV230 accident.
3.3.5 Major problems with source data
Quantitative analysis is limited by the quality of the input data. Perfect data is impossible, but inputs to the analysis should be based on the best evidence available and with transparent analysis of the effect of any assumptions. It is particularly problematic when assumptions, “engineering judgement”, or “expert opinion” are used in place of readily available data.
Problems with the elicitation of expert opinion have been well documented (see for example Mosleh [43], and Fox and Clemen [43]); Richard Feynman [46] characterised science as “the belief in the ignorance of experts”. Ahearne suggests that a common problem with QRA is failure to “get the science right” [6] – that is, understanding the underlying phenomena in order to make appropriate estimates.
Making “conservative” assumptions does not necessary remedy this problem. Notarianni and Fischbeck [47] explain that often assumptions thought to be conservative are in fact not.
3.3.6 Major omissions in the analysis
It is very hard to assess the completeness of any hazard analysis activity. Hazard identification is not a deterministic activity, and there is no possible test for completeness of any hazard list. Measuring performance of hazard identification as a research exercise is complicated by instances of the same hazard represented in different ways, and the lack of a reference list against which to compare identified hazards.
In our experience there is a high incidence of QRA omitting entire categories of concerns such as software, human error, maintenance effects or environmental factors. In such cases the QRA may accurately represent the likelihood of accidents from some causes, but inaccurately communicate it as the likelihood from all causes. Crawford [5] reports that in the few cases where safety estimates and accident outcomes could be compared, the accident causes were issues that had not been quantified in the analysis. McDermid [22] makes similar observations across a range of safety and non-safety situations.
Each strategy for achieving completeness has strengths and weaknesses. Checklists are effective at finding dangerous end-states that have been omitted (Carter and Smith [45]), but may not consider all scenarios leading to these end-states. Dynamic risk assessment techniques, which take explicit account of time and use executable system models, can explore a wider range of system behaviours – see e.g. Stroeve et al [48] contrasting multi-agent air traffic simulation with traditional event sequence
- 18 -
analysis, and Metzroth [49] contrasting dynamic event tree analysis with the classical event tree approach. All such techniques still rely on matching observed behaviours against previously-identified dangerous outcomes; their main advantage is that they can express a wider range of system dynamics, and hence identify more paths to those outcomes.
Proving a hazard list to be incomplete is much easier, requiring only examples of hazards which are real but have not been identified. Suokas and Pyy [50] compared the hazard analyses for several chemical process plants against the accident and incident records for those plants over the following years. They found significant gaps between hazards that were identified during the analysis and those that were identified during operation. Similarly, Carter and Smith [51] reviewed hazard analyses for several construction projects against the set of all hazards that could have reasonably foreseen (using a large database of industry-wide experience), and found significant gaps. Suokas and Pyy drew the further conclusion that hazard identification was strongest in the case of physical failures, and weakest in the case of management and design problems.
Omitting a category of concern is not a fatal flaw if the scope of the risk assessment is adequately described. Apostolakis [9] notes the omission of software in some QRAs, but considers this to be a positive feature due to the lack of validity of software failure models.
3.3.7 Mismatch between the risk assessment and reality
This category covers the case where the risk analyst has failed to understand the system, or has performed the analysis on an incorrect (or outdated) representation of the system. It also covers cases where as-designed behaviour is assumed safe, but is not. Joyce and Wong [52] describe the problem of system behaviours which are “not non-conformant” i.e. they do not strictly contradict any identified requirement, but are still undesirable. A typical example is where requirements are silent on a particular topic, such as how to process invalid input data. They point out that behaviours which are consistent with requirements but also unsafe can occur even in the presence of structured safety programs, and therefore that merely testing against safety requirements is insufficient for safety assurance.
Leveson [53] describes the Ariane 501 launch failure, the loss of the Mars Polar Lander and a United Kingdom chemical plant accident as industrial instances where all individual components behaved exactly as specified, and yet their combined behaviour led to a dangerous system state.
A specific cause of unanticipated system behaviour is where a system behaves “as-designed” but in an unanticipated environment. The Fukushima loss of cooling accident [54] is an example of credible environmental circumstances beyond the design-basis used for QRA. The plant was designed to withstand a tsunami of 5.7 metres. Modelling suggested that a tsunami of 15.7 metres was credible, and a 14 metre tsunami caused the accident [55].
3.3.8 Major inaccuracies in the analysis
Inaccuracy is an issue beyond selection of source data. Errors can be introduced during the calculations themselves. This is particularly the case when complex tools or models are used to perform quantitative analysis.
Notarianni and Fischbeck [47], in the context of fire safety, discuss the fact that models are often used when “fundamental requirements for the model’s validity” are not understood. If a model is used far outside its valid scope, its results may be worthless.
- 19 -
3.3.9 Internal inconsistency
QRAs may contain hundreds of pages of text and diagrams [16], with contributions from many people. “The analysis” may in fact be a composition of multiple specific analyses. This introduces many opportunities for inconsistency.
A typical example from our experience involves cross-referencing of information about hazards and mitigations. One section of the report described a hazard made acceptable through mitigation, referring to another section for more detail on the implementation of the mitigation. That second section in fact said that the mitigation had been abandoned due to technical problems, with no alternative proposed.
3.3.10 Incorrect evaluation
Risk evaluation is not universally part of risk assessment, but most risk assessments implicitly communicate the acceptability or unacceptability of risk [16]. Evaluation can be in error through inappropriate framing, in particular in not explicitly listing the alternatives being considered. A typical example is framing risk acceptance as a “yes/no” decision, where alternatives such as further information gathering or risk mitigation would also be within the scope of the analysis.
We have not considered here the selection of risk evaluation criteria. This is a judgement which may be incorrect with respect to the legal context of a risk assessment, but cannot be determined to be correct or incorrect with respect to the risk assessment process model. However, given any evaluation criteria, it is possible to misapply those criteria. For example, it is possible to evaluate single hazard risks against targets when cumulative risk is specified by the criteria, or to exaggerate the cost of mitigations and thus bias the outcome of option comparisons.
3.3.11 Misleading conclusions
QRA conclusions – in particular the executive summary – must necessarily omit detail contained in the main body of the report. It is appropriate and useful, for example, to present the results of calculations whilst referring to the main body for how those results were determined. It is not appropriate to over-simplify the results themselves, by ignoring uncertainty or exceptions to the headline figures.
An example from our experience involved a conclusion that all risks were tolerable due to available mitigations. In fact the main body of the report discussed mitigations only for some of the hazards. Whilst it may have been possible to argue that the hazards were acceptable without mitigation, this is not what the conclusions said – they misrepresented the detail of the report.
3.3.12 Failure to report limitations
Watson [56] suggests that the usable product of QRA is an expressed relationship between input and output estimates. The QRA report then constitutes an argument that the risk posed by a system is indeed the output estimate; this is similar to how a safety case argues that acceptable safety has been achieved. He argues, rightly, that there is no certain method by which accurate estimates can be derived, but that QRA can structure arguments which can then be reviewed and challenged. The audience of QRA thus needs to do this reviewing and challenging; if they merely accept the output estimates, there is no reason for confidence that they will make a good decision.
This approach is internally consistent, and overcomes many of the epistemological problems with risk estimates and QRA methods. It requires, however, that QRA users communicate their results in this fashion, and that QRA stakeholders have the skills to interpret them properly. This expectation is not necessarily practicable. To take a simple example: a risk practitioner might say “the risk of an
- 20 -
accident is 1 × 10⁻⁸ per year if the estimated failure rates hold and the model is correct”, meaning that significant work is required to monitor the failure rates and validate the model. Their audience might simply hear “the risk of an accident is 1 × 10⁻⁸ per year”.
3.3.13 Systematic problems with the conduct of the analysis
It is possible for a QRA to have appropriate language, structure, and argument, but invalid content. This category of flaws is included in our model to account for cases where the clearest evidence of flaws in the QRA is the competency of those performing the analysis.
Competency is particularly important in risk assessment because there is no inbuilt error-detection or correction process. Flaws can typically only be found by expert review, and there is limited evidence on the efficacy of such review [12]. Ahearne asserts that “the number of mathematical errors in risk reports is frequently based on misunderstanding how to treat uncertainty and how to calculate probabilities for complex interactions” [6]. Similarly, Ahearne also considers it problematic if personnel are unfamiliar with the physical phenomena involved, as they are more likely to misapply techniques for estimation and approximation. Notarianni and Fischbeck [47] report that specialist knowledge is particularly important when assumptions are made to support risk modelling (for example, as noted earlier, they show how “conservative” assumptions may in fact be wildly optimistic). Ferkl and Dix [14] consider expert insight essential for identifying dependencies between apparently independent equipment or events.
In addition to competency regarding methods, there is a need to include appropriate stakeholders. Montague considers that the socially-constructed nature of risk assessment demands participation by those most affected by the risk [41]. Proponents of the idea that risk is a scientific absolute (see for example the National Academy of Sciences “Red Book” [57]) may reject the idea that ignoring the views of those subject to the risk is an “error”. If we accept that, however, then including any evaluation within a risk assessment is an error – evaluation cannot be part of the Red Book “risk assessment” process; it instead belongs to the “political” risk acceptance process.
Stakeholders aside, proper conduct of QRA requires participation of operators and maintainers to gain a full appreciation of the risk.
Systematic problems in the conduct of QRA can sometimes be obvious from the outputs. Crawford [5] describes many analyses producing results that “seemed incredible, or at best to venture into the unknowable”. His “record” observation is a system with estimated failure probability of 1 × 10-44. This figure is exceeded in our own experience (our collective record is a 1 × 10-72 estimate for failure-on-demand of a mechanical containment system).
Outputs need not be ludicrous to be suspicious. Estimates which are close to targets should also be questioned. The Lewis Committee [58] refers to this phenomenon as “a pervasive regulatory influence in the choice of uncertain parameters”.
3.3.14 Insufficient rigor in selecting source data
Poor source data is a serious threat to QRA validity, and sceptical critiques of quantitative risk assessment often emphasize the poor pedigree of the source data in practice (see Manion [20], Hansson [13], Apostolakis [9], and Peter [41]). Unless divergent data sources are used to triangulate probabilities (a rare practice in QRA), combining uncertain sources can only increase the associated uncertainty. The common use of single-point data instead of more appropriate probability distributions compounds the use of poor source data.
- 21 -
Historical data may be poorly recorded, lack applicability, or have insufficient sample size for the claims made. A typical trade-off is between industry-wide data, which has greater sample size, and local data which has greater applicability. Favouring either could be the wrong decision.
3.3.15 Incorrect processing of data
Ferkl and Dix [14] refer specifically to software such as spread sheets which are designed primarily for financial calculations and do not process very small numbers accurately. They also highlight the problem of using a mean to represent a small number of data points. Ahearne [6] considers mathematical errors, particularly with probability calculations, to be a common problem.
Our own experience is that inappropriate treatment of dependencies between events is the most common flaw in probability calculations. Performing QRA calculations requires either statistically independent basic events (e.g. in Fault Tree Analysis) or known conditional probabilities (e.g. when using Bayesian Belief Networks). If the technique assumes independence but this assumption is not true, top event probabilities are not valid. Violations of independence can be viewed more intuitively as “common-cause failures” (CCFs) – a single unidentified basic event which couples two identified events. The “1 × 10-72” probability in Section 3.3.13 arose from the false assumption that twelve restraining bolts would fail independently.
Beer [59] reviewed 609 aircraft accident and incident reports and found that common-cause failures were present in 11% of the reports. The 11% included only cases where Beer could positively confirm the existence of CCF. Unfortunately accident reports seldom refer back to the original risk assessment, so this is only circumstantial evidence of weakness in the conduct of QRA.
3.3.16 Insufficient characterisation of uncertainty
Treatment of uncertainty goes beyond merely acknowledging uncertainties. The sensitivity of the final results to each uncertainty is an important part of risk assessment, and should consider all sources of uncertainty. In our experience this analysis is rarely presented.
3.3.17 Shortfalls in conclusions and recommendations
QRA is a “snapshot” of system risk at a particular time. If the system risk varies significantly over time, QRA can be very misleading about the actual risk of a system. Factors which threaten the validity of QRA as a system is used are detailed in Rae and Nicholson [42]. Of particular concern are:
divergence between the modelled system and the as-built system; interactions between social and technical parts of the system which invalidate technical
assumptions [60]; and
changes in effectiveness of mitigations over time.
It is also inappropriate to assume that the state of knowledge over time will remain constant, particularly when the recommendations of the QRA themselves have the ability to shape further investigation.
3.3.18 Disputed data sources
If a QRA appropriately sources data and describes its methods clearly and explains the rules used for selection and rejection of data sources, a reviewer is in a position to comment on specific choices made using those rules.
Instances of this are found in the details of the European Food Safety Authority Peer Review Report on Glufosinate [61], and the Food and Drug Administration report on gluten in food [62] where the
- 22 -
quality and relevance of particular studies are debated. Such examples are rare and commendable. It should be noted that we have had to go outside the traditional realm of “system safety” to find such examples.
3.3.19 Insufficient scientific knowledge
Risk assessment is shaped by our current scientific understanding of the physical world. Some gaps in scientific knowledge can be well defined, for example the fact that many studies into the effects of methyl-mercury on neurodevelopment have small sample sizes [63]. Other gaps may be unrecognised until we start to fill them, for example our understanding of organisational contribution to accidents [64].
Elsewhere in our maturity model we have addressed the problem of failure to locate and make appropriate use of available data. Once these flaws are resolved there remains the possibility that a risk assessment remains flawed because the current state of scientific knowledge prevents better characterisation of the risk. Such flaws are far less serious than failing to engage with existing evidence – identifying these gaps may in fact be a positive outcome from a QRA exercise [9].
3.4 We Have (Initial) Empirical Validation of our Model
3.4.1 Our Maturity Model Should be Complete, Realistic and Appropriate
The three important properties of a maturity model for risk assessment are completeness, realism and appropriateness.
The model is complete if it covers all types of errors made in risk assessments. Perfect completeness is unlikely, but a more complete model is a correspondingly better guide.
The model is realistic if the types of errors it describes closely match those actually made in the performance of risk assessment. If it contains a large number of hypothetical but unrealistic errors, this will reduce the usefulness of the model. There is an unavoidable tension between completeness and realism – including all possible errors requires including errors that may never be made.
The model is appropriate if the levels are sensible; that is, if Level One errors are worse than Level Two errors and so forth. Including flaws that are not relevant to the usefulness of the risk assessment reduces appropriateness – for example, we have omitted cosmetic flaws such as spelling errors from our model.
3.4.2 Testing Completeness
We tested whether the set of flaws was complete by checking it against three sources. For completeness, whenever a flaw in a risk assessment was reported in any source, we checked that it was covered by a flaw in our set. The sources were:
1. Academic literature describing errors made in risk assessments
2. Published peer reviews of risk assessments
3. The authors’ combined experience in review of risk assessments
The academic sources are referenced throughout Section 3.3.
The published peer reviews are:
1. A National Academy of Sciences review of a Bio-Hazard Facility QRA [65]
- 23 -
2. A Radioactive Waste Management Associates review of a mixed-waste landfill Corrective Measures Study [66]
3. An external peer review of an Office of Food Safety risk assessment of Melamine [67] 4. An external peer review of an Office of Food Safety risk assessment of Gluten [62] 5. The “Lewis Committee” review of the WASH 1400 Reactor Safety Study [58] 6. The Science Advisory Board review of the Environment Protection Agency risk assessment
of radon in drinking water [68] 7. The Science Advisory Board review the Environment Protection Agency risk assessment of
stratospheric modification [69] 8. The European Food Safety Authority peer review of a QRA for glusofinate [70] 9. The Post-Challenger Evaluation of Space Shuttle Risk Assessment and Management by the
National Academy of Sciences [71]
Matching statements in these sources to flaws within our maturity model is necessarily a subjective coding exercise. Primary coding was performed by Rae, with a subset of the reviews independently coded by Alexander to guard against excessive subjectivity.
We assert that our model is complete with respect to our sources– that there are no errors made in risk not covered by our model. This is based on our coding of errors of risk assessment – whenever we found an error reported in the literature or in a peer review, we expanded the set of errors to accommodate it. One caveat – there may be errors which are not in our set and which cannot be detected by peer review, or that rarely are detected and were not detected by the set of nine peer reviews we studied.
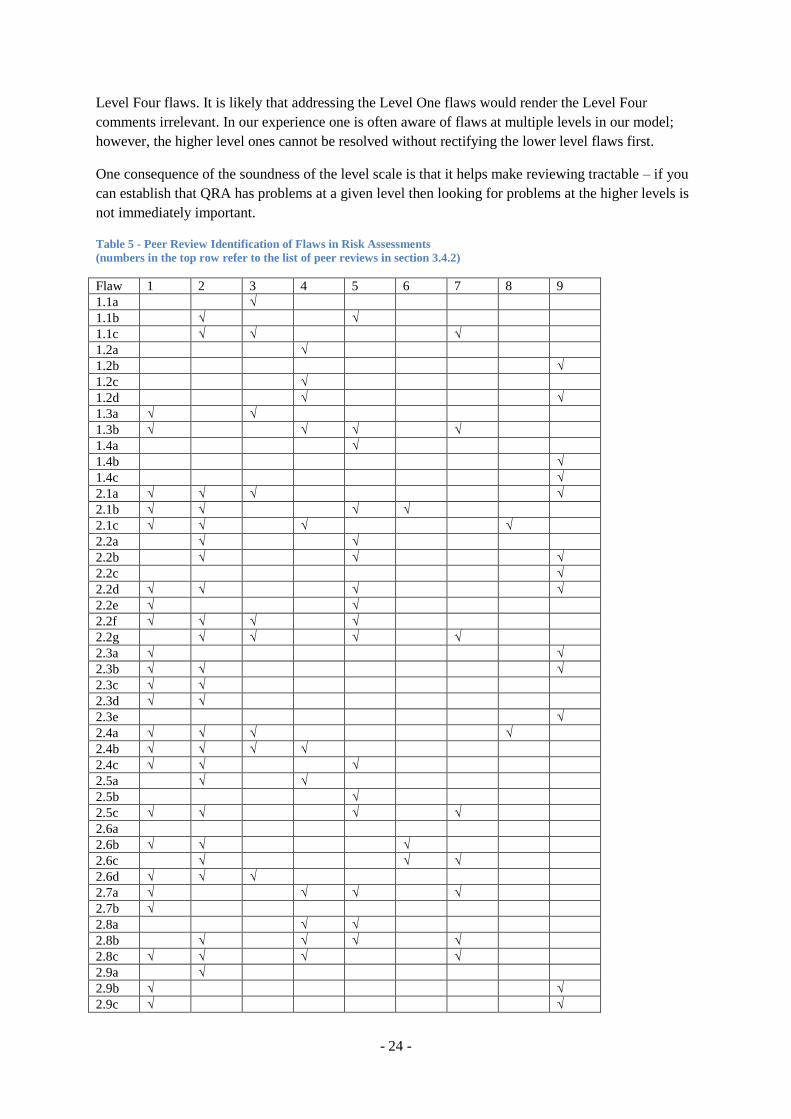
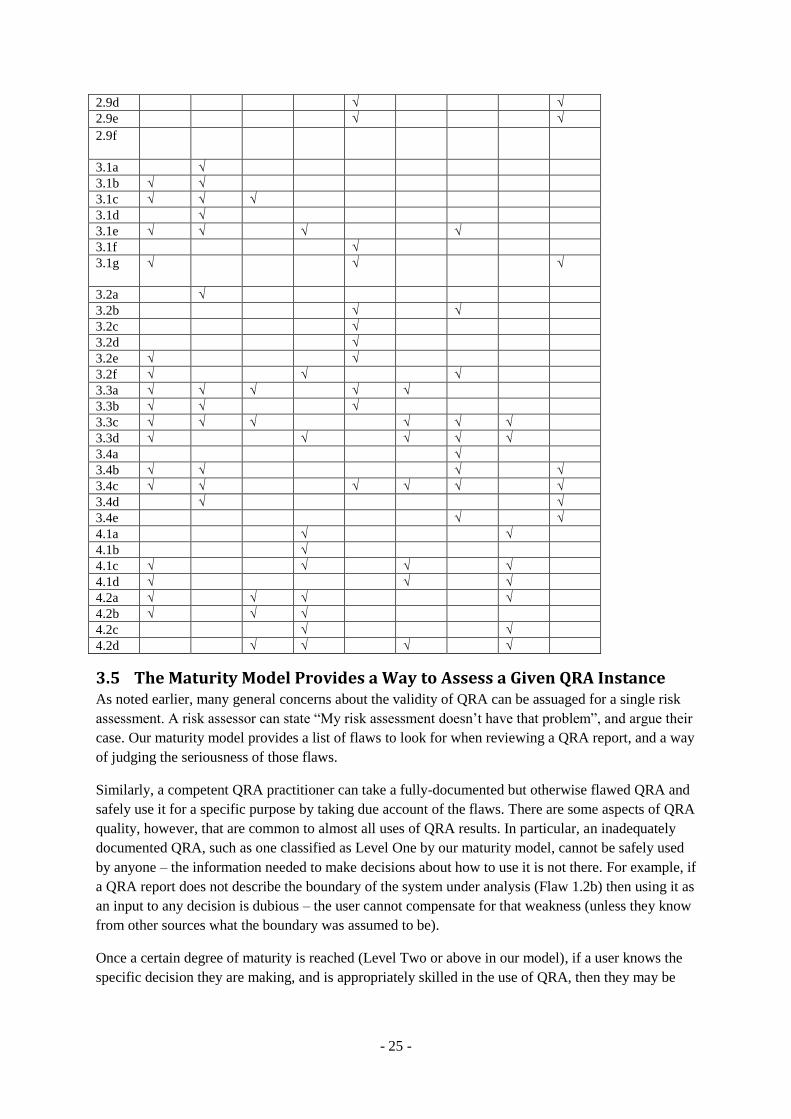
3.4.3 Testing Realism
To test whether the set of flaws was realistic (that it did not contain any flaws that never occurred in practice) we checked each flaw in our set against source type 2 above (the peer reviews). The results of this are shown in Table 5 – a tick indicates the flaw corresponding to the row was reported in the source corresponding to the column. We have also collectively encountered most of the flaws ourselves in instances of quantitative risk assessment.
We assert that our model is indeed realistic – that these are all errors that real people make when conducting real risk assessments. All flaws were identified by at least one peer review, with two exceptions (2.6a and 2.9f). 2.6a is “Risk acceptance criteria (e.g. ALARP, GAMAB) are applied incorrectly.” None of the peer reviews was conducted in a regulatory environment which applied non-quantitative criteria such as ALARP. Our own observations of misapplication of ALARP, however, lead us to believe that this is a realistic flaw. 2.9f is “Risk assessment answers the wrong question e.g. by limiting scope inappropriately”. This flaw is also one we have observed.
3.4.4 Testing Appropriateness
Finally, we assert that our model is appropriate. In particular, it can be seen that the Level One flaws are sufficient to prevent a reviewer commenting sensibly on the Level Two flaws – the Level One flaws include failures to document context, assumptions and goals, and thus render the whole risk assessment unreviewable (except insofar as we can say “it has fundamental problems”).
This assertion may appear to be challenged by Table 5, which shows that some peer reviews found flaws across all levels. Most of these cases arose from multiple peer reviewers with dissimilar views on the target risk assessment. For example the peer review of the FDA gluten risk assessment [62] included one reviewer who found mainly Level One flaws, and another reviewer who found mainly
- 24 -
Level Four flaws. It is likely that addressing the Level One flaws would render the Level Four comments irrelevant. In our experience one is often aware of flaws at multiple levels in our model; however, the higher level ones cannot be resolved without rectifying the lower level flaws first.
One consequence of the soundness of the level scale is that it helps make reviewing tractable – if you can establish that QRA has problems at a given level then looking for problems at the higher levels is not immediately important.
Table 5 - Peer Review Identification of Flaws in Risk Assessments (numbers in the top row refer to the list of peer reviews in section 3.4.2)
Flaw 1 2 3 4 5 6 7 8 9 1.1a √ 1.1b √ √ 1.1c √ √ √ 1.2a √ 1.2b √ 1.2c √ 1.2d √ √ 1.3a √ √ 1.3b √ √ √ √ 1.4a √ 1.4b √ 1.4c √ 2.1a √ √ √ √ 2.1b √ √ √ √ 2.1c √ √ √ √ 2.2a √ √ 2.2b √ √ √ 2.2c √ 2.2d √ √ √ √ 2.2e √ √ 2.2f √ √ √ √ 2.2g √ √ √ √ 2.3a √ √ 2.3b √ √ √ 2.3c √ √ 2.3d √ √ 2.3e √ 2.4a √ √ √ √ 2.4b √ √ √ √ 2.4c √ √ √ 2.5a √ √ 2.5b √ 2.5c √ √ √ √ 2.6a 2.6b √ √ √ 2.6c √ √ √ 2.6d √ √ √ 2.7a √ √ √ √ 2.7b √ 2.8a √ √ 2.8b √ √ √ √ 2.8c √ √ √ √ 2.9a √ 2.9b √ √ 2.9c √ √
- 25 -
2.9d √ √ 2.9e √ √ 2.9f
3.1a √ 3.1b √ √ 3.1c √ √ √ 3.1d √ 3.1e √ √ √ √ 3.1f √ 3.1g √ √ √
3.2a √ 3.2b √ √ 3.2c √ 3.2d √ 3.2e √ √ 3.2f √ √ √ 3.3a √ √ √ √ √ 3.3b √ √ √ 3.3c √ √ √ √ √ √ 3.3d √ √ √ √ √ 3.4a √ 3.4b √ √ √ √ 3.4c √ √ √ √ √ √ 3.4d √ √ 3.4e √ √ 4.1a √ √ 4.1b √ 4.1c √ √ √ √ 4.1d √ √ √ 4.2a √ √ √ √ 4.2b √ √ √ 4.2c √ √ 4.2d √ √ √ √
3.5 The Maturity Model Provides a Way to Assess a Given QRA Instance
As noted earlier, many general concerns about the validity of QRA can be assuaged for a single risk assessment. A risk assessor can state “My risk assessment doesn’t have that problem”, and argue their case. Our maturity model provides a list of flaws to look for when reviewing a QRA report, and a way of judging the seriousness of those flaws.
Similarly, a competent QRA practitioner can take a fully-documented but otherwise flawed QRA and safely use it for a specific purpose by taking due account of the flaws. There are some aspects of QRA quality, however, that are common to almost all uses of QRA results. In particular, an inadequately documented QRA, such as one classified as Level One by our maturity model, cannot be safely used by anyone – the information needed to make decisions about how to use it is not there. For example, if a QRA report does not describe the boundary of the system under analysis (Flaw 1.2b) then using it as an input to any decision is dubious – the user cannot compensate for that weakness (unless they know from other sources what the boundary was assumed to be).
Once a certain degree of maturity is reached (Level Two or above in our model), if a user knows the specific decision they are making, and is appropriately skilled in the use of QRA, then they may be
- 26 -
able to make good use of a flawed QRA. This is particularly true at Level Three and above, where the nature of the flaws is such that the inaccuracy they introduce can often be bounded.
As the audience for a given result becomes wider (e.g. if it is presented in a public policy document) and the set of uses becomes broader (e.g. if it used for a wide variety of decisions about plant design, staffing, and maintenance arrangements) the range of properties that it must have increases. This corresponds to an increasing maturity level – at each higher level, the range of valid users and uses grows.
At the (unattainable) Level Ω, a QRA could be used as if the real-world accuracy claim were true. At Level Four, we can approximate that, and know (from the QRA results as documented) what ways of doing that are valid for this particular QRA.
3.6 The Maturity Model is a Roadmap for Research
The maturity model may be useful at an organisational level. When improving QRA processes, reviewing the work of teams, or generally evaluating the cultural standards for risk assessment, the priority should be to get from Level One to Level Two before worrying greatly about the Level Four problems. There is also an analogy here with the software engineering maturity models CMM and SPICE, which are concerned with organisational capability – it is likely that an organisation which produces one or two Level One QRAs will typically produce QRAs of this quality. Put another way, it is likely to be more cost-effective to correct the underlying factors which lead to an organisation producing Level One QRAs rather than “fixing” each QRA independently.
The model may also be useful at a scientific, discipline-wide level. It can help to prioritise empirical study of what processes/techniques/social structures reduce errors, increase quality, or merely make practitioners more critically aware of where they stand on the maturity scale. In particular, we can prioritise expensive empirical work such that it addresses the lowest level problems where the solution is not obvious.
For example, we can easily state that documenting the method used to conduct a QRA is essential; this is uncontroversial, and doesn’t need research. On the other hand, we might want to study the value of using checklists for common flaws in fault trees, as opposed to only standard guidance for producing the tree. This could shed light on the extent to which the checklists shape and enhance the effectiveness of the method. Similarly, there are more subtle issues to do with how the system boundary and scope of analysis affects analysis performance – intuitively, being precise about the system boundary will improve analysis, but it is less clear that bounding the scope of analysis will be advantageous:
will it focus the analysts’ minds and help them to identify hazards or risks, and to do so efficiently? or
will it narrow their horizons, and lead them to miss hazards and risks in the broader context?
It will not be straightforward to investigate such questions. The “classical” experimental method of comparing approaches (perhaps using groups of students) may shed some light on the issues, but will not provide convincing answers for complex real-world problems. Insight into the above questions about bounding might, however, come from reviewing hazard logs, and seeing at what stage of a project hazards are identified, and to what extent risk estimates change during the development lifecycle. This suggests that future QRA researchers will need to adopt their research practice from the social sciences at least as much as from the natural sciences.
- 27 -
4 Conclusions – QRA is Inadequately Validated, But We Have Defined a Path to Improvement
QRA is widely used. Several strong claims are made about QRA, and are implicit if not explicit in every use of QRA, yet there is not adequate evidence that these claims are sound. Indeed, there is evidence that the strongest claim (the accuracy claim) is not true. Good evidence regarding the other claims could potentially be acquired, but it has not been acquired yet. Rigorous empirical study is needed if the claims about QRA are to be shown to be scientifically valid (or refuted). In addition to generic problems with QRA, each individual QRA may have its own weaknesses.
QRA currently plays an important role in safety management. The work reported in this paper suggests that more scepticism about QRA is justified; more careful use of the outputs of QRA is needed. We raise questions about the relative utility of QRA because answering these questions will allow safety practitioners to improve their practice and justify allocation of resources. We are not arguing that QRA should not be used or that other forms of analysis should be preferred, and the empirical aspect of our work does not support such conclusions. We believe that QRA has an important role to play in system safety engineering, but to realise its benefit it needs to be conducted effectively and appropriately. Individual QRAs are not very amenable to empirical study, so they need to be evaluated by a variety of indirect means that are process- and document-based.
To this end, we have built a maturity model for QRA, based on a comprehensive classification of how individual QRAs can be flawed. We have given our model some initial validation, and the version presented in this paper holds up well in terms of completeness and realism. The presentation of the model as a series of levels draws attention to the most important flaws to be prioritised, in particular those failures of documentation and reporting that prevent skilled QRA practitioners from working around the limitations of a particular analysis.
Now that we have this maturity model, we can use it to efficiently direct process improvement and empirical research, and thus maybe start moving from superstition to a real science of safety risk. It provides a scale against which individual applications of QRA can be measured, and we can investigate how the maturity level by sector, by system risk level, or by the safety experience level of the organisations involved.
One specific path forward will be to examine existing guidance and standards for QRA in the context of our maturity model. Understanding which flaws they protect against will encourage improvement and support standards-based claims about QRA quality.
We do not claim, and could not demonstrate, that this maturity model will prove definitive. We hope and believe, however, that it will provide a stepping stone to improving one of the core practices on which safety engineering depends, and thus contribute to the maturing of the discipline.
Acknowledgements An earlier version of this paper appeared as “The Science and Superstition of Quantitative Risk Assessment” at PSAM-ESREL 2012 in Helsinki. The authors are grateful for the contribution of those who reviewed and commented on the earlier paper, along with the anonymous reviewers for this version of the paper.
- 28 -
5 References [1] W. K. Viscusi and J. T. Hamilton, ‘Are Risk Regulators Rational? Evidence from Hazardous
Waste Cleanup Decisions’, The American Economic Review, vol. 89, no. 4, pp. 1010–1027, 1999.
[2] D. Lochbaum, ‘Nuclear Plant Risk Studies: Failing the Grade’, Union of Concerned Scientists, Aug. 2000.
[3] P. Slovic, ‘Trust, Emotion, Sex, Politics, and Science: Surveying the Risk-Assessment Battlefield’, Risk Analysis, vol. 19, no. 4, pp. 689–701, 1999.
[4] D. Crosby, ‘Risk Assessment - And Why You Stink at It’, Risk Management Magazine, vol. 58, 01-Sep-2011.
[5] J. Crawford, ‘What’s Wrong with the Numbers? A Questioning Look at Probabilistic Risk Assessment’, Journal of System Safety, vol. 37, no. 3, Mar. 2001.
[6] J. F. Ahearne, ‘The Responsibilities of a Probabilistic Safety Analyst’, Journal of Risk Research, vol. 2, no. 4, p. 295, 1999.
[7] B. Commoner, ‘The Hazards of Risk Assessment’, Colum. J. Envtl. L., vol. 14, p. 365, 1989. [8] E. K. Silbergeld, ‘Risk Assessment: The Perspective and Experience of U.S. Environmentalists’,
Environmental Health Perspectives, vol. 101, pp. 100–104, Jun. 1993. [9] G. E. Apostolakis, ‘How Useful Is Quantitative Risk Assessment?’, Risk Analysis, vol. 24, no. 3,
pp. 515–520, Jun. 2004. [10] C. A. Ericson II, Hazard Analysis Techniques for System Safety. Wiley-Blackwell, 2005. [11] J. N. Stannard and R. W. Baalman (Jr), Radioactivity and Health: A History. 1988. [12] A. J. Rae, J. McDermid, and R. D. Alexander, ‘The Science and Superstition of Quantitative
Risk Assessment’, presented at the Annual European Safety and Reliability Conference, Helsinki, 2012.
[13] S. O. Hansson, ‘Seven Myths of Risk’, Risk Management, vol. 7, no. 2, pp. 7–17, Jan. 2005. [14] L. Ferkl and A. Dix, ‘Risk Analysis - From the Garden of Eden to its Seven Most Deadly Sins’,
presented at the 14th International Symposium on Aerodynamics and Ventilation of Tunnels, Dundee, Scotland, 2011.
[15] S. A. Gadd, D. M. Keeley, and H. F. Balmforth, ‘Pitfalls in Risk Assessment: Examples from the UK’, Safety Science, vol. 42, no. 9, pp. 841–857, Nov. 2004.
[16] A. Rae and R. Hawkins, ‘Risk Assessment in the Wild’, presented at the Australian Safety Critical Systems Conference, Brisbane, 2012.
[17] T. Aven, Quantitative Risk Assessment: The Scientific Platform. Cambridge; New York: Cambridge University Press, 2011.
[18] T. Aven and B. Heide, ‘Reliability and Validity of Risk Analysis’, Reliability Engineering & System Safety, vol. 94, no. 11, pp. 1862–1868, Nov. 2009.
[19] A. J. Rae, M. Nicholson, and R. D. Alexander, ‘The State of Practice in System Safety Research Evaluation’, presented at the IET System Safety Conference, Manchester, 2010.
[20] M. Manion, ‘The Epistemology of Fault Tree Analysis: An Ethical Critique’, International Journal of Risk Assessment and Management, vol. 7, no. 3, 2007.
[21] G. Mauri, ‘Integrating Safety Analysis Techniques, Supporting Identification of Common Cause Failures’, PhD, University of York, 2000.
[22] J. A. McDermid, ‘The Risks of LSCITS: The Odds Are Stacked against Us’, in Large-Scale Complex IT Systems: Development, Operation and Management, vol. 7539, R. Calinescu and D. Garlan, Eds. Berlin: Springer, 2012, pp. 94–117.
[23] Jon Danielsson, ‘Blame the Models’, Journal of Financial Stability, vol. 4, no. 4, Dec. 2008. [24] Office of Nuclear Regulatory Research, ‘Severe Accident Risks: An Assessment for Five U.S.
Nuclear Power Plants - Final Summary Report’, United States Nuclear Regulatory Commission, NUREG-1150, Dec. 1990.
[25] United States Nuclear Regulatory Commission, ‘Reactor Safety Study: An Assessment of Accident Risks in U.S. Commercial Nuclear Power Plants (WASH 1400)’, Oct. 1975.
[26] A. Amendola, S. Contini, and I. Ziomas, ‘Uncertainties in Chemical Risk Assessment: Results of a European Benchmark Exercise’, Journal of Hazardous Materials, vol. 29, no. 3, pp. 347–363, Feb. 1992.
- 29 -
[27] F. Markert, Z. Nivolianitou, and M. Christou, ‘ASSURANCE-A Benchmark Exercise on Risk Analysis of Chemical Installations’, presented at the 2nd Internet Conference on Process Safety, 2000.
[28] L. Fabbri and S. Contini, ‘Benchmarking on the Evaluation of Major Accident-Related Risk Assessment’, Journal of Hazardous Materials, vol. 162, no. 2–3, pp. 1465–1476, Mar. 2009.
[29] J. P. Poloski, J. K. Knudsen, W. J. Galyean, and C. L. Atwood, ‘Reliability Study Update: High-Pressure Coolant Injection (HPCI) System (1987-1997)’, Office of Nuclear Regulatory Research, NUREG/CR-5500 Vol 9, Oct. 2000.
[30] E. Paté-Cornell and R. Dillon, ‘Probabilistic Risk Analysis for the NASA Space Shuttle: A Brief History and Current Work’, Reliability Engineering & System Safety, vol. 74, no. 3, pp. 345–352, Dec. 2001.
[31] R. Alexander and T. Kelly, ‘Supporting Systems of Systems Hazard Analysis Using Multi-Agent Simulation’, Safety Science, vol. 51, no. 1, pp. 302–318, Jan. 2013.
[32] T. Aven, ‘Foundational Issues in Risk Assessment and Risk Management’, Risk Analysis, vol. 32, no. 10, pp. 1647–1656, 2012.
[33] R. D. Alexander and T. P. Kelly, ‘Escaping the Non-Quantitative Trap’, presented at the 27th International System Safety Conference, 2009.
[34] Committee on Nuclear Risk Management, ‘Standard for Level 1 / Large Early Release Frequency Probabilistic Risk Assessment for Nuclear Power Plant Applications’, ASME, RA-S2008.
[35] ENSI, ‘A05/e Probabilistic Safety Analysis (PSA): Quality and Scope’. Swiss Federal Nuclear Safety Inspectorate, Mar-2009.
[36] European Union, ‘Common Safety Method’, Official Journal of the European Union, Apr. 2009. [37] J. Spouge, A Guide to Quantitative Risk Assessment for Offshore Installations. The Centre for
Marine and Petroleum Technology (CMPT), 1999. [38] T. Aven, Misconceptions of Risk. Wiley-Blackwell, 2010. [39] National Research Council, Reference Manual on Scientific Evidence: Third Edition.
Washington, D.C.: The National Academies Press, 2011. [40] Safety Regulation Commission, ‘Risk Assessment and Mitigation in ATM’, Safety Regulatory
Requirement ESARR 4, Apr. 2001. [41] P. Montague, ‘Reducing the Harms Associated with Risk Assessments’, Environmental Impact
Assessment Review, vol. 24, no. 7–8, pp. 733–748, Oct. 2004. [42] A. J. Rae and M. Nicholson, ‘Making Robust ALARP Decisions for In-Service Systems’,
presented at the IET System Safety Conference, 2009. [43] C. R. Fox and R. T. Clemen, ‘Subjective Probability Assessment in Decision Analysis: Partition
Dependence and Bias toward the Ignorance Prior’, Management Science, vol. 51, no. 9, pp. 1417–1432, 2005.
[44] J. A. List, ‘Do Explicit Warnings Eliminate the Hypothetical Bias in Elicitation Procedures? Evidence from Field Auctions for Sportscards’, The American Economic Review, vol. 91, no. 5, pp. 1498–1507, Dec. 2001.
[45] C. Haddon-Cave, ‘The Nimrod Review: An Independent Review into the Broader Issues Surrounding the Loss of the RAF Nimrod MR2 Aircraft XV230 in Afghanistan in 2006’, 28 2009.
[46] R. P. Feynman, ‘What is Science?’, The Physics Teacher, vol. 7, no. 6, 1969. [47] K. Notarianni and P. S. Fischbeck, ‘Dealing with Uncertainty to Improve Regulation’, presented
at the Second Fire Safety Design in the 21st Century Conference, Worcester, MA, 1999. [48] S. H. Stroeve, H. A. P. Blom, and G. J. (Bert) Bakker, ‘Contrasting Safety Assessments of a
Runway Incursion Scenario: Event Sequence Analysis Versus Multi-Agent Dynamic Risk Modelling’, Reliability Engineering & System Safety, vol. 109, pp. 133–149, Jan. 2013.
[49] K. G. Metzroth, ‘A Comparison of Dynamic and Classical Event Tree Analysis for Nuclear Power Plant Probabilistic Safety/Risk Assessment’, PhD Thesis, Ohio State University, 2011.
[50] J. Suokas and P. Pyy, ‘Evaluation of the Validity of Four Hazard Identification Methods with Event Descriptions’, 1988.
[51] G. Carter and S. D. Smith, ‘Safety Hazard Identification on Construction Projects’, Journal of Construction Engineering and Management, vol. 132, no. 2, pp. 197–205, Feb. 2006.
- 30 -
[52] J. Joyce and K. Wong, ‘Hazard-Driven Testing of Safety-Related Software’, presented at the 21st International System Safety Conference, Ottawa, 2003.
[53] N. Leveson, ‘A New Accident Model for Engineering Safer Systems’, Safety Science, vol. 42, no. 4, pp. 237–270, 2004.
[54] C. Perrow, ‘Fukushima, Risk, and Probability: Expect the Unexpected’, Bulletin of the Atomic Scientists, 01-Apr-2011.
[55] K. Hasegawa, ‘Facing Nuclear Risks: Lessons from the Fukushima Nuclear Disaster’, International Journal of Japanese Sociology, vol. 21, no. 1, pp. 84–91, 2012.
[56] S. R. Watson, ‘The Meaning of Probability in Probabilistic Safety Analysis’, Reliability Engineering & System Safety, vol. 45, no. 3, pp. 261–269, 1994.
[57] National Research Council, Understanding Risk: Informing Decisions in a Democratic Society. National Academies Press, 1996.
[58] H. W. Lewis, R. J. Budnitz, W. D. Rowe, H. J. C. Kouts, F. von Hippel, W. B. Loewenstein, and F. Zachariasen, ‘Risk Assessment Review Group Report to the U. S. Nuclear Regulatory Commission’, IEEE Trans. Nucl. Sci., vol. 26, no. 5, pp. 4686–4690, 1979.
[59] J. A. Beer, ‘The True Significance of Common Cause Failures in Accidents’, Masters Thesis, University of York, United Kingdom, 2011.
[60] C. Perrow, Normal Accidents: Living with High-Risk Technologies. Princeton University Press, 1999.
[61] European Food Safety Authority, ‘Conclusion on the peer review of the pesticide risk assessment of confirmatory data submitted for the active substance glufosinate’, EFSA Journal, vol. 10, no. 3, 2012.
[62] Office of Food Safety, ‘External Peer Review of the FDA/CFSAN Draft Health Hazard Assessment for Gluten in Individuals with Celiac Disease: Determination of Tolerable Daily Intake Levels and Levels of Concern for Gluten’, United States Food and Drug Administration, Dec. 2010.
[63] Office of Food Safety, ‘Report of Quantitative Risk and Benefit Assessment of Commercial Fish Consumption, Focusing on Fetal Neurodevelopmental Effects (Measured by Verbal Development in Children) and on Coronary Heart Disease and Stroke in the General Population’, United States Food and Drug Administration, Jan. 2009.
[64] J. Rasmussen, ‘Risk Management in a Dynamic Society: a Modelling Problem’, Safety Science, vol. 27, no. 2–3, pp. 183–213, 1997.
[65] Committee on the Evaluation of a Site-Specific Risk Assessment for the Department of Homeland Security’s Planned National Bio-and Agro-Defense Facility in Manhattan, Kansas; National Research Council, Evaluation of a Site-Specific Risk Assessment for the Department of Homeland Security’s Planned National Bio- and Agro-Defense Facility in Manhattan, Kansas. Washington, D.C.: The National Academies Press, 2010.
[66] A. Schneider and M. Resnikoff, ‘Independent Evaluation of the Corrective Measures Study, Mixed Waste Landfill, Sandia National Laboratories’, Radioactive Waste Management Associates, Mar. 2004.
[67] Office of Food Safety, ‘Interim Melamine and Analogues Safety/Risk Assessment Peer Review Report’, United States Food and Drug Administration, Jun. 2007.
[68] Science Advisory Board, ‘Review of Multimedia Risk and Cost Assessment of Radon in Drinking Water’, United States Environmental Protection Agency, EPA-SAB-EC-LTR-93-010, Jul. 1993.
[69] Science Advisory Board, ‘Review of An Assessment of the Risks of Stratospheric Modification’, United States Environmental Protection Agency, SAB-EC-87-025, Mar. 1987.
[70] European Food Safety Authority, ‘Conclusion on the peer review of the pesticide risk assessment of the active substance Helicoverpa armigera nucleopolyhedrovirus’, EFSA Journal, vol. 10, no. 9, p. 2865, 2012.
[71] Committee on Shuttle Criticality Review and Hazard Analysis Audit, ‘Post-Challenger Evaluation of Space Shuttle Risk Assessment and Management’, National Academy of Sciences, Jan. 1988.