Embed Size (px)
Citation preview

Fixed Income Presentation March 2017

2
Legal Disclaimers
Forward Looking Statements. This presentation may contain “forward-looking statements” within the meaning of Section 27A of the Securities Act of 1933, as amended, and Section 21E of the Securities Exchange Act of 1934, as amended. The words “believe,” “expect,” “project,” “will,” “should,” “could” and similar expressions are intended to identify such forward-looking statements. These forward-looking statements reflect the Company’s best judgment based on current information, and although we base these statements on circumstances that we believe to be reasonable when made, there can be no assurance that future events will not affect the accuracy of such forward-looking information. As such, the forward-looking statements are not guarantees of future performance, and actual results may vary materially from the projected results and expectations discussed in this report. Factors that might cause the Company’s actual results to differ materially from those anticipated in forward-looking statements include, but are not limited to: (1) competitive pressure on sales and pricing, including pressure from imports and substitute materials; (2) U.S. and foreign trade policies affecting steel imports or exports; (3) the sensitivity of the results of our operations to prevailing steel prices and changes in the supply and cost of raw materials, including pig iron, iron ore and scrap steel; (4) availability and cost of electricity and natural gas which could negatively affect our cost of steel production or could result in a delay or cancelation of existing or future drilling within our natural gas working interest drilling programs; (5) critical equipment failures and business interruptions; (6) market demand for steel products, which, in the case of many of our products, is driven by the level of nonresidential construction activity in the U.S.; (7) impairment in the recorded value of inventory, equity investments, fixed assets, goodwill or other long-lived assets; (8) uncertainties surrounding the global economy, including the severe economic downturn in construction markets and excess world capacity for steel production; (9) fluctuations in currency conversion rates; (10) significant changes in laws or government regulations affecting environmental compliance, including legislation and regulations that result in greater regulation of greenhouse gas emissions that could increase our energy costs and our capital expenditures and operating costs or cause one or more of our permits to be revoked or make it more difficult to obtain permit modifications; (11) the cyclical nature of the steel industry; (12) capital investments and their impact on our performance; and (13) our safety performance. These and other factors are discussed in Nucor's regulatory filings with the Securities and Exchange Commission, including those in Nucor's fiscal 2016 Annual Report on Form 10-K, Item 1A. Risk Factors. We do not undertake any obligation to update or publicly release any revisions to our forward-looking statements to reflect subsequent events, changed circumstances or changes in our expectations after the date of a particular forward-looking statement, except as required by applicable law.
Non-GAAP Financial Information. This presentation includes financial measures that do not conform to U.S. generally accepted accounting principles (“GAAP”). Non-GAAP financial measures are defined and reconciled to the most comparable GAAP financial measures at the end of this presentation. These measures are provided as a supplement to, and not as a substitute for, GAAP measures of performance. Furthermore, these measures may not be consistent with similar measures provided by other companies.
No Offer or Solicitation. This document is not a prospectus or a prospectus equivalent document. This document is not intended to and does not constitute, or form part of, any offer, invitation to the solicitation of any offer to purchase, acquire, subscribe for, sell or otherwise dispose of any securities, or the solicitation of any vote or approval in any jurisdiction, issuance or transfer of securities of Nucor.
Disclaimer. Nucor believes the information contained in this material to be reliable but does not warrant its accuracy or completeness. Data and information provided by the unaffiliated third parties has not been independently verified.
Fixed Income Presentation | March 2017

3
Table of Contents
Business Overview & Investment Highlights
Financial Results II.
I.
Fixed Income Presentation | March 2017

4
I. Business Overview & Investment Highlights
5
Nucor Business Overview
• North America’s most diversified steel and steel products company
• Nucor (Baa1/A-) is the largest steel producer in the United States, operating 24 scrap-based steel mills that have an annual production capacity of approximately 26.7 million tons. Nucor is North America’s largest recycler.
• Market Capitalization of ~$20bn
• Primary business segments: Steel mills, Steel products, Raw Materials
• Operations throughout the value chain, supported by a sustainable raw materials division
• Nucor, through The David J. Joseph Company, also brokers ferrous and nonferrous metals, pig iron and HBI/DRI; supplies ferro-alloys; and processes ferrous and nonferrous scrap
• Products produced include:
• Carbon and alloy steel; steel piling; hollow structural section (HSS) tubing; electrical conduit; steel joists and joist girders; steel deck; fabricated concrete reinforcing steel; cold finished steel; steel fasteners; metal building systems; steel grating and expanded metal; and wire and wire mesh
• Key Acquisitions include:
• Tubular Acquisitions: Independence Tube: 2016 - $430mm (HSS), Southland Tube: 2017 - $130mm (HSS), Republic Conduit: 2017 - $335mm (electrical conduit)
• Gallatin Steel: 2014, $770mm (flat-rolled steel mill)
• Skyline Steel: 2012, $675mm (steel piling distribution)
• David J. Joseph: 2008, $1.44bn (scrap processing & brokerage)
• Harris Steel: 2007, $1.1bn (rebar fabrication, cold-finish steel, steel trading & distribution)
Steel Mills Production 21.3 million tons
Facilities Over 200 locations
2016 Net Sales $16.2 billion
2016 Net Earnings $796 million
2016 Cash, Cash Equivalents & Short-Term Investments
$2.2 billion
2016 Fortune 500 Rank 170
Employees 23,900
2016 Net Sales Per Employee US$678k
Source: Company filings; Fortune 500 website and Bloomberg as of March 1, 2017
Fixed Income Presentation | March 2017

6
Key Nucor Highlights
Nucor’s Culture and Management Team Drive Strategy for Profitable Growth
Most Diversified US Producer of Steel and Steel Products
Sustainable Profitability and Highly Variable Cost Structure Protects Margin Spread
Recent Strategic Investments Yielding Higher and Less Volatile Returns
Market Leadership in North America with Leverage to Growing End Markets
1
2
6
7
3
Consistent Cash Flow Generation and Strong Liquidity Position 4
Long Term Commitment to Investment Grade rating and Lowest Sector leverage 5
Fixed Income Presentation | March 2017

7
Best-in-Class, Experienced Management Team
John J. Ferriola Chairman, Chief Executive Officer and President • Chief Executive Officer since January 2013 and Chairman of the Board since January 2014 • Mr. Ferriola joined Nucor in 1991. He was named Executive VP in 2002, then Chief Operating
Officer of Steelmaking Operations in 2007. In January 2011, the Board of Directors appointed him Nucor’s President and Chief Operating Officer and elected him to the Board
James D. Frias Chief Financial Officer, Treasurer and Executive Vice President • Chief Financial Officer since January 2010 • Mr. Frias began his Nucor career in 1991 as controller of Nucor Building Systems-Indiana. In
1994 he became controller of Nucor Steel-Indiana. Mr. Frias was promoted to Corporate Controller in 2001 and Vice President in 2006
R. Joseph Stratman Chief Digital Officer and Executive Vice President of Raw Materials • Executive Vice President since September 2007; Began his career with the Company in 1981
James Darsey Executive Vice President of Merchant and Rebar Products • Executive Vice President since September 2010; Began his career with the Company in 1979
Ladd R. Hall Executive Vice President of Flat Rolled and Tubular Products • Executive Vice President since September 2007; Began his career with the Company in 1981
Raymond S. Napolitan, Jr. Executive Vice President of Fabricated Construction Products • Executive Vice President since June 2013; Began his career with the Company in 1996
David A. Sumoski Executive Vice President of Engineered Bar Products • Executive Vice President since September 2014; Began his career with the Company in 1995
D. Chad Utermark Executive Vice President of Beam & Plate Products and DRI • Executive Vice President since May 2014; Began his career with the Company in 1992
Fixed Income Presentation | March 2017
1

8
Nucor’s People & Culture
Fixed Income Presentation | March 2017
1

9
Five Drivers to Profitable Growth
1. Low Cost Producer
2. Market Leadership
3. Move Up The Value Chain
4. Expand Channels To Market
5. Commercial Excellence
Fixed Income Presentation | March 2017
1

10
Sheet37%
Bar22%
Structural10%
Plate8%
Finished products(1)
11%
Other12%
Sheet58%
Bars and Structure
21%
Finished Products(1)
9%
Other12%
Sheet72%
Bars and Structure
28%
Sheet67%
U.S.Steel Europe30%
Tubular3%
Most Diversified U.S. Producer of Steel and Steel Products
Source: Company Filings. 2016 data except for ArcelorMittal’s breakout by product type (2015)
Nucor Volumes Sold to External Customers ArcelorMittal
U.S. Steel
Steel Dynamics
2
(1) Finished products consist of Steel Joists, Steel Deck, Cold finished Steel and Rebar Fabrication Products for Nucor. Sections and Semis for ArcelorMittal
Total Tons Sold in 2016: 24,309kt
Total Tons Sold in 2016: 76,144kt
Total Tons Sold in 2016: 14,990kt
Total Tons Sold in 2016: 9,246kt
Fixed Income Presentation | March 2017

11
Market Leadership in North America
Source: SEC Filings, Industry Data, First River Consulting
Structural Steel
Rebar Steel
Merchant Bar Steel
Cold Finished Bar Steel
Sheet Steel (hot + cold + galvanized)
Plate Steel
SBQ Bar Steel
#1 North American
Market Leader
Steel Joist & Deck
Rebar Fab & Distribution
Steel Piling Distribution
Metal Buildings
#2 North American
Market Leader
#3 North American
Market Leader
Hollow Structural Section (HSS) Steel Tubing
Steel Electrical Conduit Pipe
Fixed Income Presentation | March 2017
3

12
North American Footprint Levered to Strong End Markets
9
11
13
15
17
19
2013 2014 2015 2016 2017P 2018P
Nu
mb
er o
f V
ehic
les
Bu
ilds
(in
mill
ion
s)
Non-Residential Construction
45%
Heavy Equipment / Ag / Transportation /
Industrial Goods 25%
Auto / Consumer Durables
12%
Power & Energy 10%
Other 8%
N.A. Light Vehicle Production
Nucor’s Operating Footprint
$300,000
$400,000
$500,000
$600,000
$700,000
$800,000
2013 2014 2015 2016 2017P 2018P
An
nu
al V
alu
e o
f C
on
stru
ctio
n (
in m
illio
ns)
U.S. Non-Residential Construction Put in Place
Steel Mills
Steel Products
Raw Materials
Steel Products Joint Ventures
Approx. Shipments by End Market
Source: U.S. Census, Dodge Analytics AIA
Source: Bloomberg, Ward’s AutoInfoBank, LMC Automotive, IHS Automotive, CAAM, AutoData, ACEA,
Fixed Income Presentation | March 2017
3

13
Consistent Cash Flow Generation
Source: Company Filings
$-
$0.5
$1.0
$1.5
$2.0
$2.5
$3.0
2000 2001 2002 2003 2004 2005 2006 2007 2008 2009 2010 2011 2012 2013 2014 2015 2016
(in
bill
ion
s o
f d
olla
rs)
$495 Million Average ‘01-‘03
$1.3 Billion Average ‘09-‘16
Cyclical Trough to Cyclical Trough
Fixed Income Presentation | March 2017
4

14
• Only North American steel producer with an investment grade credit rating; Baa1/A- (Stable Outlook)
• Weighted Average Fixed Coupon: 5.3%; Weighted Average Time to Maturity: 12.6 years
• Strong liquidity position of ~$3.7bn supported by $1.5bn revolving credit facility (undrawn); target liquidity of $2.5bn
• Operated with average cash balance of $1.5bn (2000-2016); YE 2016 ~$2.2bn
$500
5.20% Senior Note due
8/1/43
4.125% Senior Note due 9/15/22
6.40% Senior Note due 12/1/37
5.85% Senior Note due
6/1/18
5.75% Senior Note due 12/1/17 4.00% Senior
Note due 8/1/23
IRB Debt
Strong Liquidity Position
$20 $1
$337
$28 $25
$600 $600
$500
$600
$500
$650
$500
2017 2018 2019 2020 2021 2022 2023 2037 2038 2040 2043
Fixed Income Presentation | March 2017
Source: Company Filings
4

15
Long Term Commitment to IG Rating
Nucor’s Net Debt, EBITDA and Leverage since 2009
Note: EBITDA calculated as Earnings before Income Taxes and Noncontrolling Interests plus Net Interest Expense plus Depreciation and Amortization. Net debt calculated as Short Term Debt plus Long Term Debt minus Cash, Cash Equivalents, Restricted Cash, and Short Term Investments. See Appendix for Reconciliation Source: Company Filings
Fixed Income Presentation | March 2017
5
846
1,216 1,133
2,205
2,869
3,434
2,349 2,161
-
0.5x
1.0x
1.5x
2.0x
2.5x
3.0x
3.5x
4.0x
4.5x
-
500
1,000
1,500
2,000
2,500
3,000
3,500
4,000
2009 2010 2011 2012 2013 2014 2015 2016
Net D
ebt / E
BIT
DA
(x)
US
$m
m
Net Debt EBITDA Net Debt / EBITDA
Successful deleveraging

16
3.6x 3.2x 3.1x
2.2x 1.6x
1.3x 1.0x
-
1.0x
2.0x
3.0x
4.0x
5.0x
AK Steel US Steel Gerdau CommercialMetals
Company
ArcelorMittal
SteelDynamics
Nucor
Net Debt 2016A / EBITDA 2016A
Lowest Sector Leverage
Note: EBITDA calculated as Earnings before Income Taxes and Noncontrolling Interests plus Net Interest Expense plus Depreciation and Amortization adjusted for Impairment and restructuring charges. Net debt calculated as Short Term Debt plus Long Term Debt minus Cash, Cash Equivalents, Restricted Cash, and Short Term Investments. See Appendix for Reconciliation Source: Company Filings
Fixed Income Presentation | March 2017
5

17
Sustainable Profitability and Highly Variable Cost Structure Protects Margin Spread
Note: EBITDA calculated as Earnings before Income Taxes and Noncontrolling Interests plus Net Interest Expense plus Depreciation and Amortization. See Appendix for Reconciliation Source: Company Filings
1.0 2.0 1.5 1.6 2.0 1.1 2.2
6.3%
10.0%
7.6% 8.2% 9.7%
6.8%
13.3%
0%
5%
10%
15%
20%
-
$0.5
$1.0
$1.5
$2.0
$2.5
2010 2011 2012 2013 2014 2015 2016
EB
ITD
A M
arg
in (
%)
EB
ITD
A U
S$b
n
Stable EBITDA and Margin 2010 - 2016
EBITDA EBITDA Margin
689 832 792 751 788 651 601 351 439 407 376 381 270 228
338 393 385 375 407 381 373
$-
$200
$400
$600
$800
$1,000
2010 2011 2012 2013 2014 2015 2016
Av
g.
Sale
s p
rices /
to
n Stable Spread 2010 - 2016
Avg. Sales Price Steel Mills Segment Avg. Scrap & Scrap Substitute Cost / ton Spread
Fixed Income Presentation | March 2017
6

18
Recent Strategic Investments
Strategic Investments Completion/ Startup
$ Spent (millions)
Nucor Steel Berkeley sheet mill adding 7th mill to produce wider and lighter hot rolled
Q1 2014 $98
Gallatin Steel acquisition adds ~1.6 million tons of flat-rolled capacity and increases Nucor’s total flat-rolled capacity to ~12 million tons annually
Q4 2014 $770
Nucor-Yamato expansion of sheet piling product to wider sizes 2014 $115
SBQ & Wire Rod expansion into higher value-added product at Tennessee, Nebraska & South Carolina mills (Combined annual capacity increase of 1 million tons)
2015 $290
Nucor-Yamato Quench & Self-Temper (QST) process for high-strength, low-alloy beams
Q3 2016 $75
Longview, TX plate mill acquisition adds 125,000 tons of higher value-added carbon and alloy plate products
Q3 2016 $29
Tubular Products acquisitions adds ~1 million tons of tubular product shipments (hollow structural section tubing and electrical conduit)
Q4 2016 / Q1 2017 $900
Nucor Steel Arkansas Cold Mill Complex expansion adds 500,000 tons capacity to produce advanced high-strength, high strength low-alloy, and motor lamination steel products
Q1 2019 $230
Low Risk & High Return
Fixed Income Presentation | March 2017
7

19
Expanding Channels to Market
8%
16%
20%
0%
5%
10%
15%
20%
25%
2006 2016 2017 pro forma
Downstream Steel Usage
Fixed Income Presentation | March 2017
7

20
27.0% 26.6%32.3%
22.5%18.5%
(1.7%)
2.4%7.8%
4.8% 5.0% 6.9%2.3%
7.8%
(5%)
5%
15%
25%
35%
2004 2005 2006 2007 2008 2009 2010 2011 2012 2013 2014 2015 2016
RO
IC
Return on Invested Capital Performance
Source: Company Filings; ROIC = EBIT(1-.35)/(Total Debt + Equity). See Appendix for Reconciliation
Up-Cycle
“Great Recession”
2.3% 4.2%
7.2% 7.2% 7.9% 10.4%
12.5%
-
5%
10%
15%
AK Steel U.S. Steel Gerdau Arcelor Mittal CMC Steel Dynamics Nucor
RO
IC
Average ROIC 2004 - 2016
Fixed Income Presentation | March 2017
7

21
II. Financial Results

22
Fiscal Year Results Summary
Note: EBITDA calculated as Earnings before Income Taxes and Noncontrolling Interests plus Net Interest Expense plus Depreciation and Amortization. Net debt calculated as Short Term Debt plus Long Term Debt minus Cash, Cash Equivalents, Restricted Cash, and Short Term Investments. See Appendix for Reconciliation Source: Company Filings
Fixed Income Presentation | March 2017
Key Metric Units 2012 2013 2014 2015 2016
Volume Sold Million tons 23.1 23.7 25.4 22.7 24.3
Sales US$ billion $19.4 $19.1 $21.1 $16.4 $16.2
EBITDA US$ billion $1.5 $1.6 $2.0 $1.1 $2.2
EBITDA Margin % 7.6% 8.2% 9.7% 6.8% 13.3%
Cash from Operations US$ billion $1.2 $1.1 $1.3 $2.2 $1.7
Net Debt US$ billion $2.2 $2.9 $3.4 $2.3 $2.2
Net Debt / EBITDA (x) 1.5x 1.8x 1.7x 2.1x 1.0x

23
Financial History
Source: Company Filings Note: EBITDA calculated as Earnings before Income Taxes and Noncontrolling Interests plus Net Interest Expense plus Depreciation and Amortization. Net debt calculated as Short Term Debt plus Long Term Debt minus Cash, Cash Equivalents, Restricted Cash, and Short Term Investments. See Appendix for Reconciliation
Sales (US$ billion) Net Debt / EBITDA
Cash from Operations (US$ billion) Debt to Capital
4.6 4.3 4.8 6.3
11.4 12.7
14.8 16.6
23.7
11.2
15.8
20.0 19.4 19.1 21.1
16.4 16.2
$-
$5
$10
$15
$20
$25
$30
2000
2001
2002
2003
2004
2005
2006
2007
2008
2009
2010
2011
2012
2013
2014
2015
2016
0.8
0.5 0.5 0.5
1.0
2.1 2.3
1.9
2.5
1.2
0.9 1.0 1.2 1.1
1.3
2.2
1.7
-
$0.5
$1.0
$1.5
$2.0
$2.5
$3.0
2000
2001
2002
2003
2004
2005
2006
2007
2008
2009
2010
2011
2012
2013
2014
2015
2016
16% 16%
26% 26% 20%
17% 15%
30% 28% 29%
37% 36% 30%
34% 34% 36% 35%
0%
10%
20%
30%
40%
50%
60%
70%
2000
2001
2002
2003
2004
2005
2006
2007
2008
2009
2010
2011
2012
2013
2014
2015
2016
Debt / Capital Debt / Capital Limit
Fixed Income Presentation | March 2017
0.0
0.0
1.2 1.2
0.1
-0.4 -0.4
0.3 0.3
3.7
1.2
0.6
1.5 1.8 1.7
2.1
1.0
(1.00)x
-
1.00x
2.00x
3.00x
4.00x
2000
2001
2002
2003
2004
2005
2006
2007
2008
2009
2010
2011
2012
2013
2014
2015
2016

Questions
24

Appendix
25
26
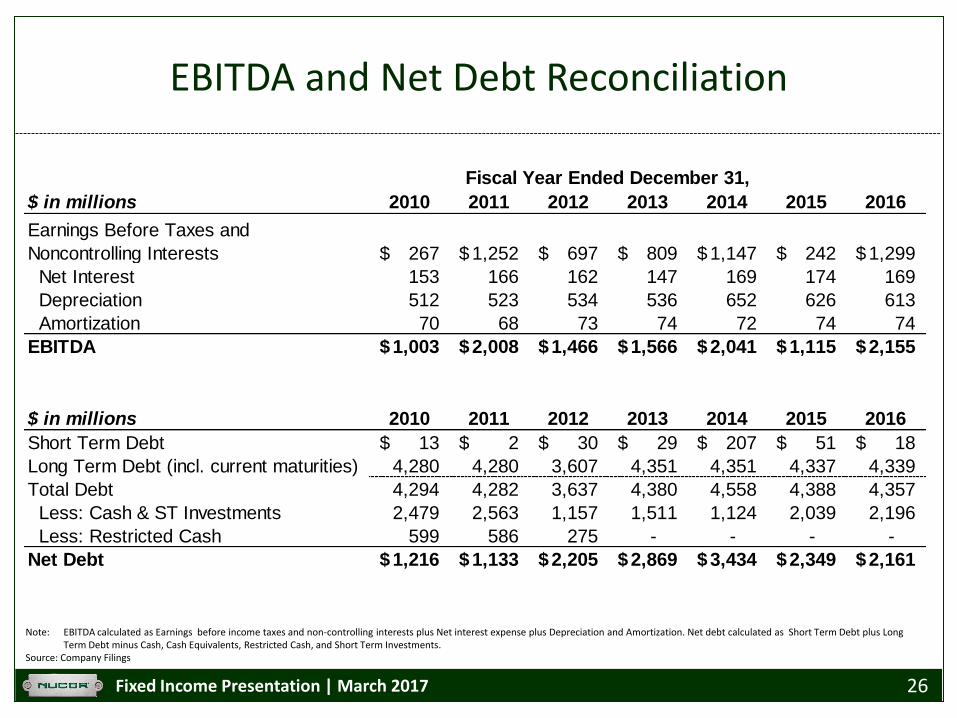
EBITDA and Net Debt Reconciliation
Note: EBITDA calculated as Earnings before income taxes and non-controlling interests plus Net interest expense plus Depreciation and Amortization. Net debt calculated as Short Term Debt plus Long Term Debt minus Cash, Cash Equivalents, Restricted Cash, and Short Term Investments. Source: Company Filings
Fixed Income Presentation | March 2017
$ in millions 2010 2011 2012 2013 2014 2015 2016
Earnings Before Taxes and
Noncontrolling Interests 267$ 1,252$ 697$ 809$ 1,147$ 242$ 1,299$
Net Interest 153 166 162 147 169 174 169
Depreciation 512 523 534 536 652 626 613
Amortization 70 68 73 74 72 74 74
EBITDA 1,003$ 2,008$ 1,466$ 1,566$ 2,041$ 1,115$ 2,155$
$ in millions 2010 2011 2012 2013 2014 2015 2016
Short Term Debt 13$ 2$ 30$ 29$ 207$ 51$ 18$
Long Term Debt (incl. current maturities) 4,280 4,280 3,607 4,351 4,351 4,337 4,339
Total Debt 4,294 4,282 3,637 4,380 4,558 4,388 4,357
Less: Cash & ST Investments 2,479 2,563 1,157 1,511 1,124 2,039 2,196
Less: Restricted Cash 599 586 275 - - - -
Net Debt 1,216$ 1,133$ 2,205$ 2,869$ 3,434$ 2,349$ 2,161$
Fiscal Year Ended December 31,

27
Nucor ROIC Reconciliation
Note: ROIC Calculated as EBIT (1-.35) / (Total Debt + Equity) Source: Company Filings
Fixed Income Presentation | March 2017
Nucor 2004 2005 2006 2007 2008 2009 2010 2011 2012 2013 2014 2015 2016
2004-
2016
AVG
EBIT 1,829,083 2,141,934 2,874,191 2,552,285 3,194,874 (279,226) 420,208 1,417,906 859,379 955,463 1,316,544 415,397 1,467,903
NOPAT 1,188,904 1,392,257 1,868,224 1,658,985 2,076,668 (181,497) 273,135 921,639 558,596 621,051 855,754 270,008 954,137
Total Debt 923,550 923,550 922,300 2,250,300 3,266,600 3,086,200 4,280,200 4,280,200 3,607,156 4,350,902 4,350,558 4,337,145 4,357,100
Equity 3,481,281 4,312,049 4,857,351 5,112,917 7,929,204 7,390,526 7,120,070 7,474,885 8,002,692 8,018,250 8,110,342 7,477,816 7,879,865
Total Capital 4,404,831 5,235,599 5,779,651 7,363,217 11,195,804 10,476,726 11,400,270 11,755,085 11,609,848 12,369,152 12,460,900 11,814,961 12,236,965
ROIC 27.0% 26.6% 32.3% 22.5% 18.5% -1.7% 2.4% 7.8% 4.8% 5.0% 6.9% 2.3% 7.8% 12.5%