Embed Size (px)
Citation preview
1
Fixed Income Attribution Analysis
Institute for International Research6th Annual Investment Performance Measurement,
Risk and Attribution Analysis Conference
Andrew [email protected]
Sydney, AustraliaFebruary 25th & 26th, 2004
2
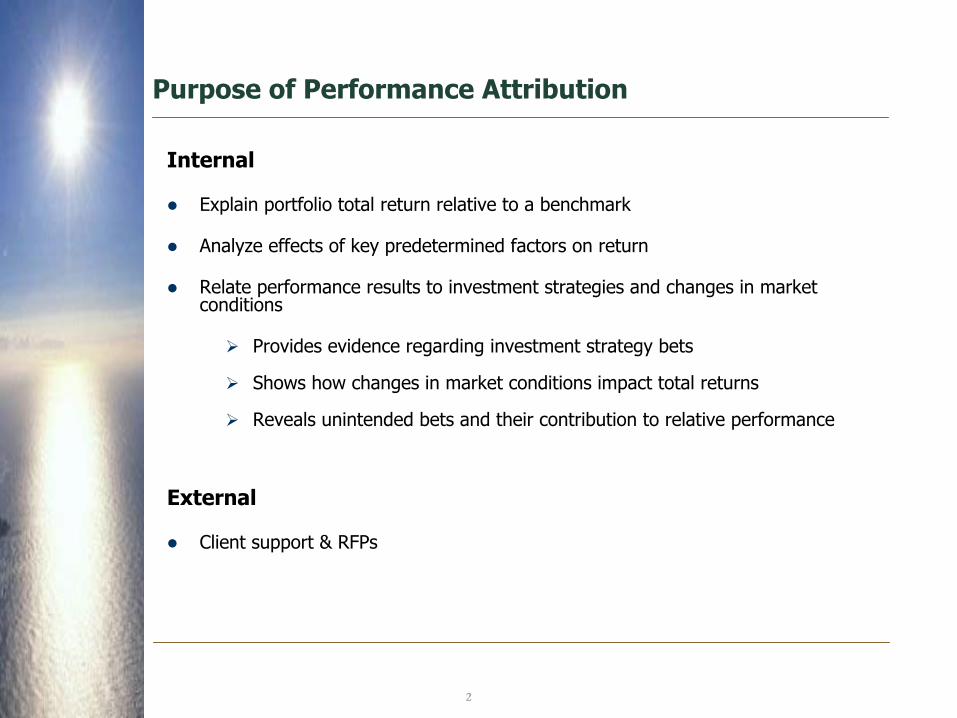
Purpose of Performance Attribution
Internal
Explain portfolio total return relative to a benchmark
Analyze effects of key predetermined factors on return
Relate performance results to investment strategies and changes in market conditions
Provides evidence regarding investment strategy bets
Shows how changes in market conditions impact total returns
Reveals unintended bets and their contribution to relative performance
External
Client support & RFPs
3
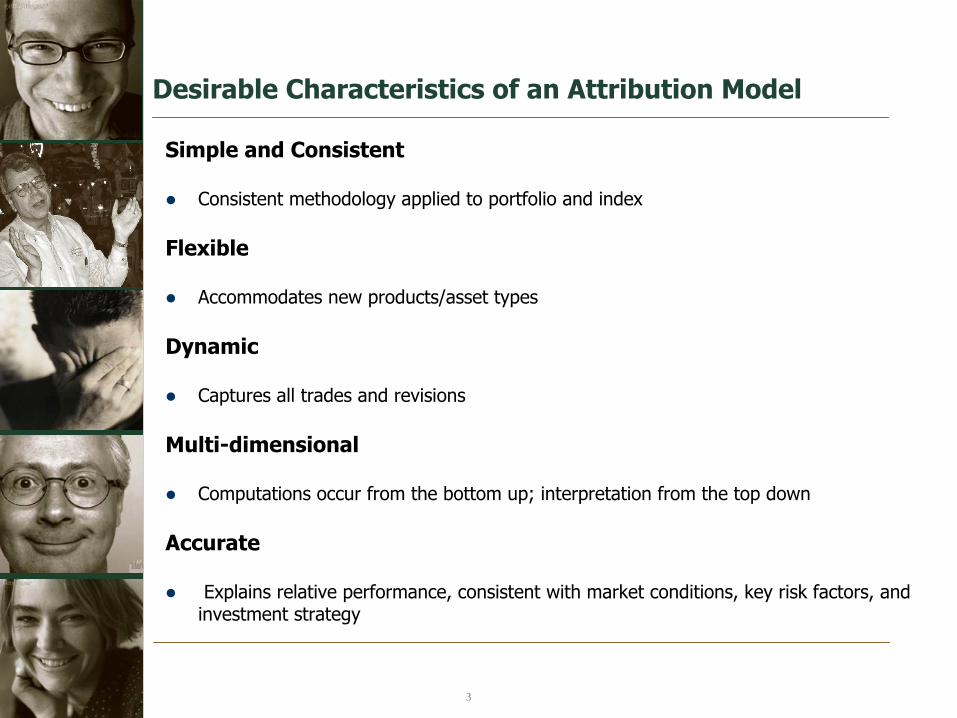
Desirable Characteristics of an Attribution Model
Simple and Consistent
Consistent methodology applied to portfolio and index
Flexible
Accommodates new products/asset types
Dynamic
Captures all trades and revisions
Multi-dimensional
Computations occur from the bottom up; interpretation from the top down
Accurate
Explains relative performance, consistent with market conditions, key risk factors, and investment strategy
4
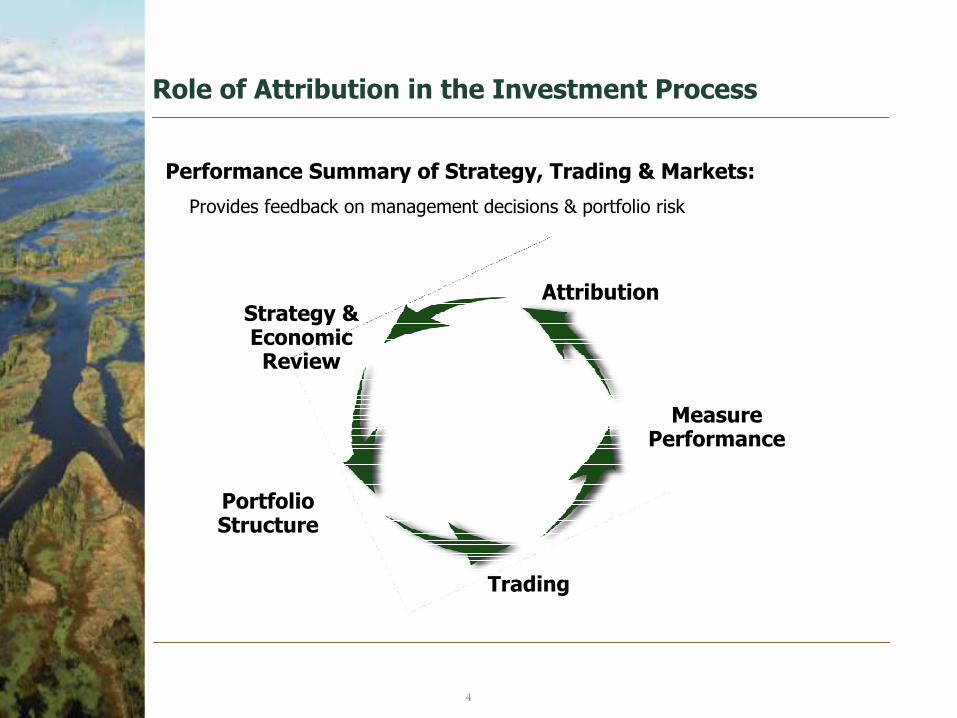
Role of Attribution in the Investment Process
Performance Summary of Strategy, Trading & Markets:
Provides feedback on management decisions & portfolio risk
Attribution
Measure Performance
Trading
Portfolio Structure
Strategy & Economic Review

5
Attribution Factors used in Equity & Fixed Income
Yield Curve & Duration Effect
• Measures impact of duration and yield curve posture over measurement period
• Duration return broken out into shift and twist components
Allocation Effect
• Measures pay-off due to over-weights / under-weights
• Bucketed by sector, industry, quality, coupon & maturity or other dimensions
Selection Effect
• Measures ability to choose desirable securities and avoid blow-ups
• Defined relative to chosen buckets
Currency EffectManagement style determines relevance and priority of each factor

6
Fixed Income Attribution Model
Each security’s total return consists of a duration return and an excess return
Portfolio and index returns are a weighted average of constituent issue returns
Duration Yield CurveDistribution
SectorAllocation
SecuritySelection
AttributionFactors
StrategyVariables
Total ReturnTotal Return
Duration/Curve ReturnDuration/Curve Return Excess ReturnExcess Return
ShiftShift TwistTwist AllocationAllocation SelectionSelection
Fixed Equity

7
Duration Return
Portion of Total Return due to duration and curve
Create synthetic Duration-Matched-Treasury (DMT) from yield curve
All portfolio holdings are assigned equivalent DMTs
DMT measures price return due to changes in the yield curve
Duration Yield CurveDistribution
AttributionFactors
StrategyVariables
Total ReturnTotal Return
Duration/Curve ReturnDuration/Curve Return Excess Return
ShiftShift TwistTwist Allocation Selection
8
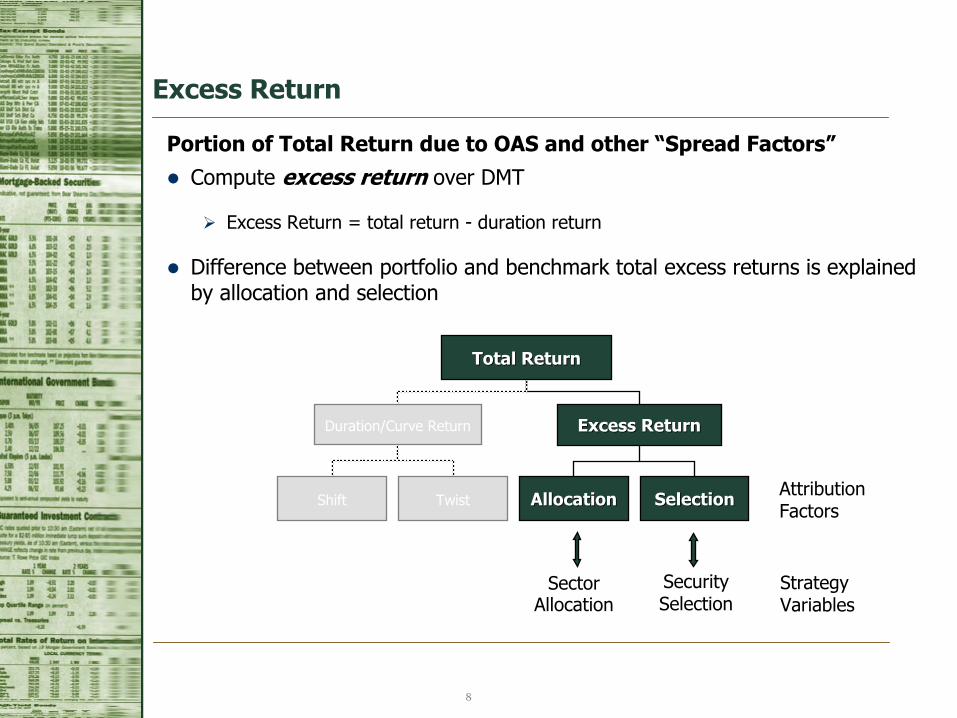
Excess Return
Portion of Total Return due to OAS and other “Spread Factors”Compute excess return over DMT
Excess Return = total return - duration return
Difference between portfolio and benchmark total excess returns is explained by allocation and selection
SectorAllocation
SecuritySelection
StrategyVariables
AttributionFactors
Total ReturnTotal Return
Duration/Curve Return Excess ReturnExcess Return
Shift Twist AllocationAllocation SelectionSelection

9
Yield Curve Shifts (referenced to 5yr Treasury)
2.0%
4.0%
6.0%
Beg End Shift
-2.0%
-1.0%
0.0%
Change
2 Yr
.
5 Yr
.
10 Y
r.
30 Y
r.
Yie
ldSp
read
( )yrDMT YY 5∆−∆
yrY5∆DMTY∆
5.0%
3.0%
1.0%

10
Attribution Equations: Shift and Twist
Total Return = Duration Return + Excess Return
Shift Twist
yrYD 5∆×− ( )yrDMT YYD 5∆−∆×−
DMTYD ∆×−

11
Issue Name = First Energy 6.45% 11/15/11
Duration = 6.87
Total return = 3.79%
Change 5yr = -0.513%
Change 6.87yr = -0.408%
Duration Return = = -6.87 x -.408% = 2.80%
Shift Return = = -6.87 x -.513% = 3.52%
Twist Return = = -6.87 x .105% = -0.72%
Excess Return =Total Ret – Duration Ret = 3.79% - 2.80% = 0.99%
Duration Return Example (December 2002)
DMTYD ∆×−
yrYD 5∆×−
( )yrDMT YYD 5∆−∆×−

12
Aggregate to Higher Dimensions (Sector Example)
Sector Weight Duration Total Return Shift Return Twist Return Excess ReturnTotal 100.00% 3.90 2.23% 2.00% -0.28% 0.50%
20.00% 5.05 2.37% 2.59% -0.50% 0.27%GOV 10.00% 6.05 2.70% 3.10% -0.71% 0.31%GOV 10.00% 4.05 2.03% 2.08% -0.28% 0.24%
40.00% 1.60 1.04% 0.82% -0.07% 0.30%MBS 15.00% 1.58 1.04% 0.81% -0.08% 0.31%MBS 15.00% 1.76 1.10% 0.90% -0.04% 0.24%MBS 10.00% 1.40 0.97% 0.72% -0.12% 0.37%
30.00% 6.02 3.64% 3.09% -0.47% 1.03%CORP 10.00% 6.87 3.79% 3.53% -0.72% 0.99%CORP 10.00% 5.65 3.24% 2.90% -0.48% 0.82%CORP 10.00% 5.54 3.89% 2.84% -0.22% 1.27%
10.00% 4.45 2.46% 2.28% -0.05% 0.22%HY 5.00% 4.61 3.41% 2.37% -0.12% 1.16%HY 5.00% 4.29 1.50% 2.20% 0.02% -0.72%
By computing duration and excess return at the cusip level, the data can be
aggregated to any higher dimension-sector, quality, coupon, etc.
13
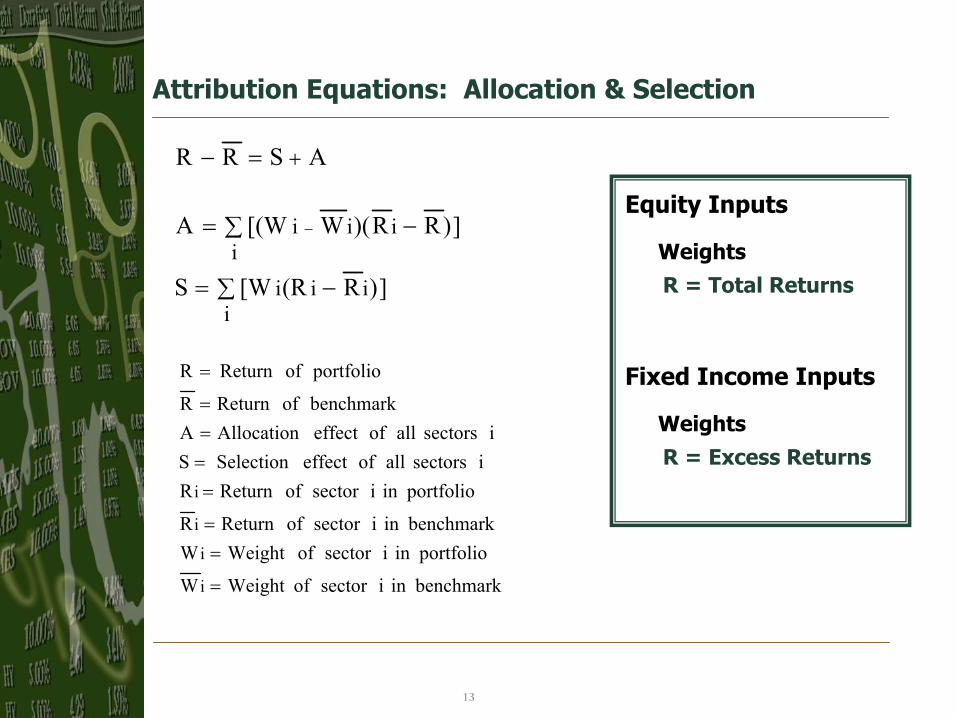
Attribution Equations: Allocation & Selection
])R(R[WS
])RR)(W[(WA
ASRR
iiii
iiii
∑ −=
∑ −=
=−
−
+
Equity Inputs
WeightsR = Total Returns
Fixed Income Inputs
WeightsR = Excess Returns
benchmarkinisectorofWeightW
portfolioinisectorofWeightWbenchmarkinisectorofReturnR
portfolioinisectorofReturnRisectorsallofeffectSelectionS
isectorsallofeffectAllocationAbenchmarkofReturnR
portfolioofReturnR
i
i
i
i
=
==
====
=
14
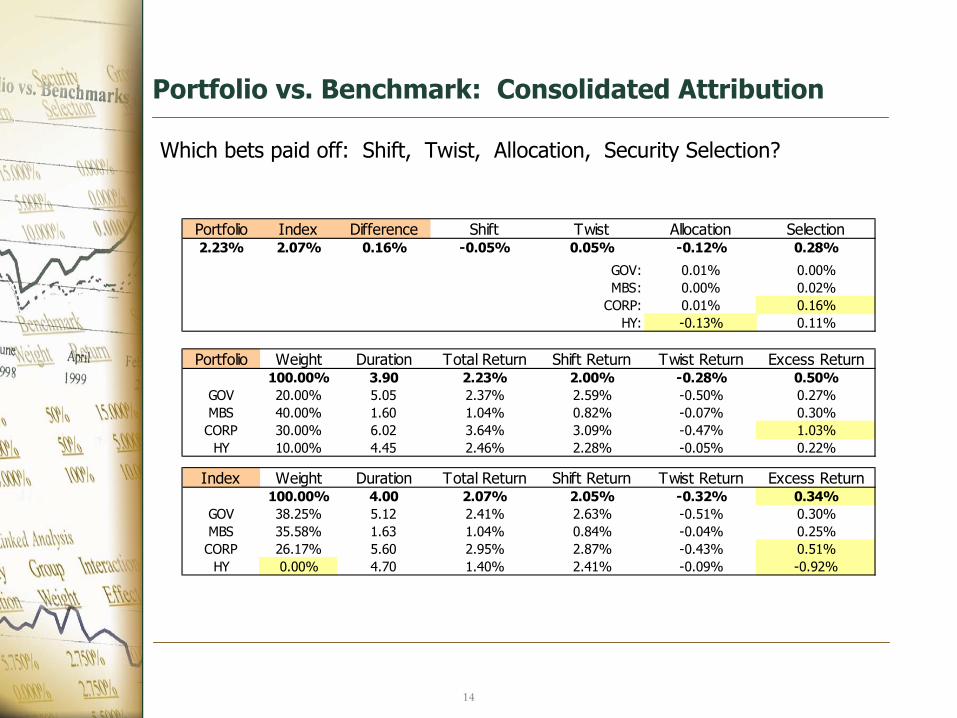
Portfolio vs. Benchmark: Consolidated Attribution
Portfolio Index Difference Shift Twist Allocation Selection2.23% 2.07% 0.16% -0.05% 0.05% -0.12% 0.28%
GOV: 0.01% 0.00%MBS: 0.00% 0.02%
CORP: 0.01% 0.16%HY: -0.13% 0.11%
Portfolio Weight Duration Total Return Shift Return Twist Return Excess Return100.00% 3.90 2.23% 2.00% -0.28% 0.50%
GOV 20.00% 5.05 2.37% 2.59% -0.50% 0.27%MBS 40.00% 1.60 1.04% 0.82% -0.07% 0.30%CORP 30.00% 6.02 3.64% 3.09% -0.47% 1.03%
HY 10.00% 4.45 2.46% 2.28% -0.05% 0.22%
Index Weight Duration Total Return Shift Return Twist Return Excess Return100.00% 4.00 2.07% 2.05% -0.32% 0.34%
GOV 38.25% 5.12 2.41% 2.63% -0.51% 0.30%MBS 35.58% 1.63 1.04% 0.84% -0.04% 0.25%CORP 26.17% 5.60 2.95% 2.87% -0.43% 0.51%
HY 0.00% 4.70 1.40% 2.41% -0.09% -0.92%
Which bets paid off: Shift, Twist, Allocation, Security Selection?
15
Variations/Enhancements Around this Simple Model
Time Effects on DMT Income
Time Effects on DMT Price
Key Rate Durations
Cash Flow Decomposition
Principle Components
Daily Calculations
16
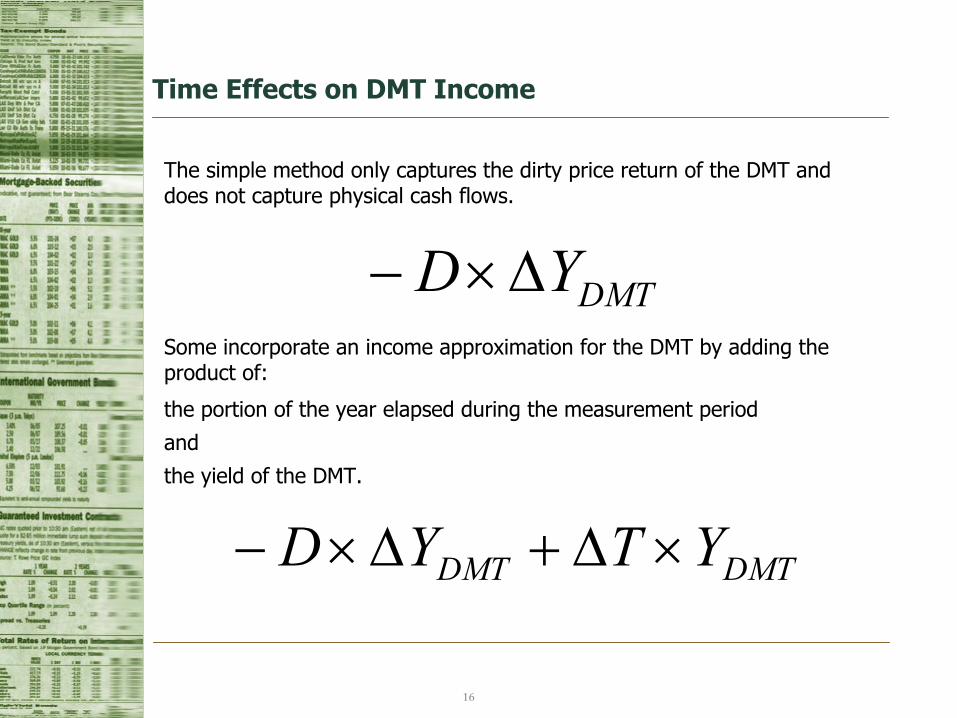
Time Effects on DMT Income
The simple method only captures the dirty price return of the DMT and does not capture physical cash flows.
Some incorporate an income approximation for the DMT by adding the product of:
the portion of the year elapsed during the measurement period
and
the yield of the DMT.
DMTYD ∆×−
DMTDMT YTYD ×∆+∆×−
17
Time Effects on DMT Price
Rolldown Effect
As a bond matures, its DMT reference point on the yield curve will rolldown to the left.
In a steep yield curve environment, bond prices will increase as the bonds age and fall into portion of the yield curve with lower yields.
Accretion Effect (often though of as income)
As a bond reaches maturity, its price will move towards par.
This results in accretion for discount bonds or amortization for premium bonds.
18
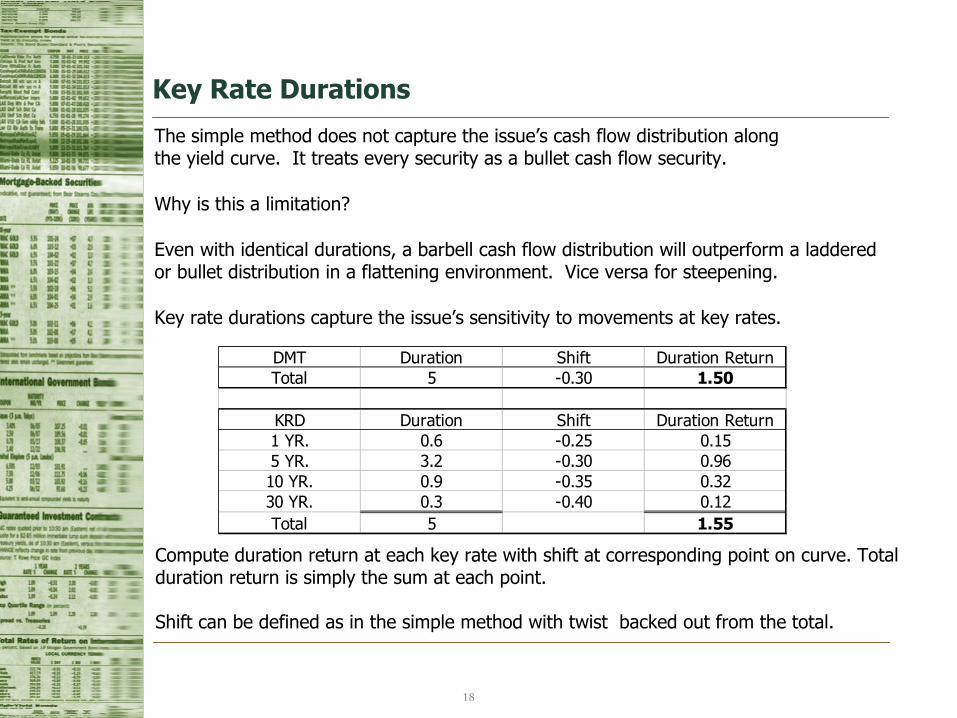
Key Rate Durations
The simple method does not capture the issue’s cash flow distribution alongthe yield curve. It treats every security as a bullet cash flow security.
Why is this a limitation?
Even with identical durations, a barbell cash flow distribution will outperform a laddered or bullet distribution in a flattening environment. Vice versa for steepening.
Key rate durations capture the issue’s sensitivity to movements at key rates.
Compute duration return at each key rate with shift at corresponding point on curve. Total duration return is simply the sum at each point.
Shift can be defined as in the simple method with twist backed out from the total.
DMT Duration Shift Duration ReturnTotal 5 -0.30 1.50
KRD Duration Shift Duration Return1 YR. 0.6 -0.25 0.155 YR. 3.2 -0.30 0.9610 YR. 0.9 -0.35 0.3230 YR. 0.3 -0.40 0.12Total 5 1.55

19
Cash Flow Decomposition
Identical to the simple method except
all cash flows are broken out of each issue and treated as bullet bonds!
Pros Ideal. Most accurate measure of duration return attainable.
Cons Data intensive. Doesn’t add much value over KRD approach.

20
In the simple model the yield curve is described by shift & twist.
Popular principal components include
•Shift - The parallel component of the yield curve movement
•Twist – The movement of the ends defined around a static pivot.
•Butterfly – The movement of the ends relative to the center movement.
Other principal components include
•Snake – Large sine curve to model other curve movement
•Worm – Smaller sine curve and/or other residual to explain rest of curve.
Be careful not to model things you can’t actively manage or manage against.
Principal Components
21
Daily Calculations
Equity and Fixed Income attribution both benefit from daily calculations.
However, this benefit is greater in the fixed income world!
Why?
Duration statistics change everyday.
A fresh measure of duration will lead to accurate duration returns.
A stale measure of duration will lead to erroneous duration returns.
Capture a fresh duration every day to avoid this problem.
Questions?