Embed Size (px)
Citation preview

WP/16/133
Fixed Base Year vs. Chain Linking in National Accounts: Experience of Sub-Saharan African Countries
by Robert Dippelsman, Venkat Josyula, and Eric Métreau
IMF Working Papers describe research in progress by the author(s) and are published
to elicit comments and to encourage debate. The views expressed in IMF Working
Papers are those of the author(s) and do not necessarily represent the views of the IMF, its
Executive Board, or IMF management.

© 2016 International Monetary Fund WP/16/133
IMF Working Paper
Statistics Department
Fixed Base Year vs. Chain Linking in National Accounts:
Experience of Sub-Saharan African Countries
Prepared by Robert Dippelsman, Venkat Josyula, and Eric Métreau
Authorized for distribution by Claudia Dziobek
July 2016
Abstract
There are two approaches for producing volume estimates of GDP, fixed base year and
annual chaining. While most advanced economies have adopted the chain-linked approach in
the past twenty years, some African countries are hesitant to do so, in part because of the
computation and data requirements, and resource constraints. What difference does this make
for the accuracy of the growth rates? From detailed data provided by three Sub-Saharan
African countries we run simulations and conclude that the differences of GDP growth using
the two approaches are small and do not behave in the consistent way found in advanced
countries. We also show that weak deflation techniques and overly aggregated classifications
used to derive volume measures can lead to large distortions. We conclude that improved
deflation techniques and detailed classification should be addressed before adopting chain
linking.
JEL Classification Numbers: B40, C10, E20
Keywords: System of National Accounts, chain linking, volume measures, fixed base year
Author’s E-Mail Address: [email protected]; [email protected]; [email protected]
IMF Working Papers describe research in progress by the author(s) and are published to
elicit comments and to encourage debate. The views expressed in IMF Working Papers are
those of the author(s) and do not necessarily represent the views of the IMF, its Executive Board,
or IMF management.

3
Contents Page
Abstract ......................................................................................................................................2
I. Introduction ............................................................................................................................4
II. Experience of Advanced Countries .......................................................................................5
III. GDP Volume Measures in Sub-Saharan African Countries ................................................8
IV. Data Analysis of chain linking in three Sub-Saharan African countries ...........................10
V. Simulation analysis of deflation techniques and detailed level of classifications ..............15
VI. Conclusions........................................................................................................................19
References ................................................................................................................................20
Figures
1. Country A: Differences in Growth Rates of GDP and Components ...................................12
2. Country B: Differences in Growth Rates of GDP and Components ...................................13
3. Country C: Differences in Growth Rates of GDP and Components ...................................15
4. Difference in Growth Rates for Country B (Single minus Double Deflation) ....................17
5. Country C: Comparison of Growth Rates for Manufacturing .............................................18
Tables
1. Differences in Growth Rates of Selected Advanced Countries .............................................8
2. Share of Agriculture and Mining in GDP for Selected SSA Countries (2013) .....................9
3. Sub-Saharan African Countries: CPI and PPI: Weights Vintage and Coverage .................10
Appendices
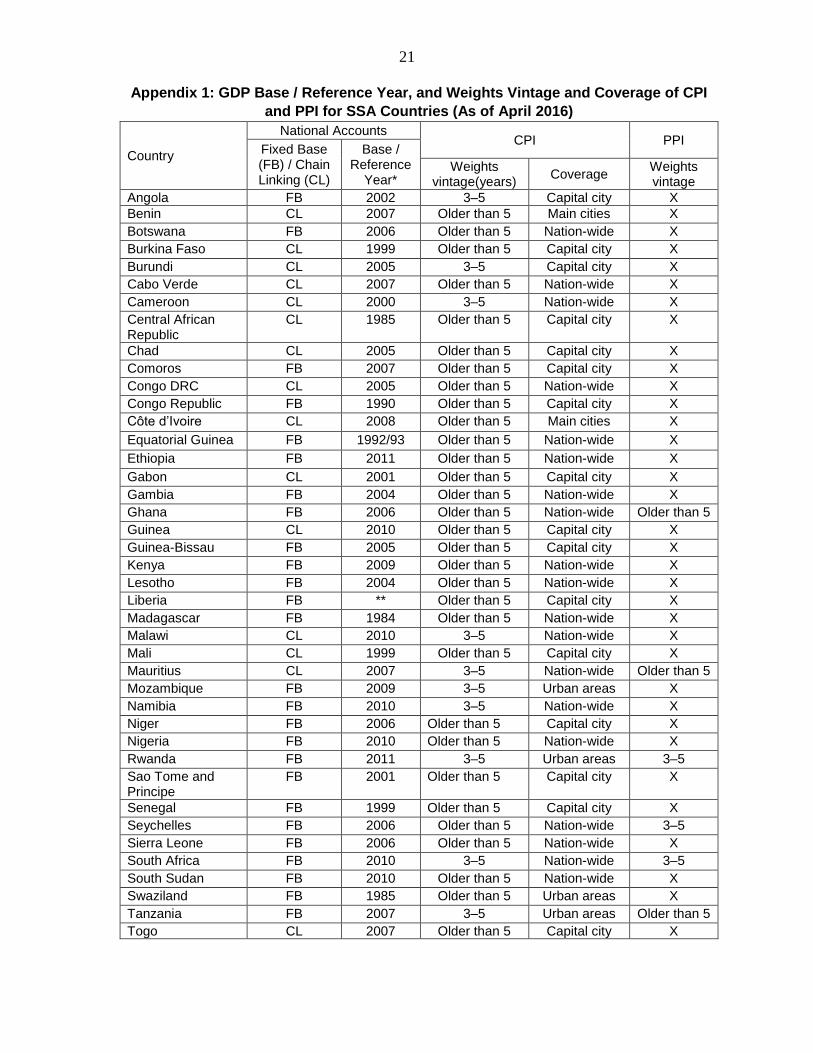
Appendix 1: GDP Base / Reference Year, and Weights Vintage and Coverage of CPI and PPI
for SSA Countries ....................................................................................................................21

4
I. INTRODUCTION1
This paper investigates whether chain-linked volume measures of GDP yield superior results
than a fixed-base year method in three Sub-Saharan African (SSA) countries. While similar
assessments have been conducted for advanced countries, this is the first such study for SSA
countries. This study has become possible with detailed source data and compilation
worksheets on GDP volume measures provided by three SSA countries with the
understanding that only the results will be published without disclosing the countries. The
IMF’s statistics advisors in African Regional Technical Assistance Centers coordinated with
country authorities to facilitate the collection of required data. These detailed data also
allowed us to undertake simulations to assess the impact of deflation techniques and level of
classification on volume growth from fixed-base and chain-linked approaches. The
simulations involved a complete recalculation of the data, using the most detailed
components.
Periodic changes in the values of macroeconomic aggregates such as output, investment,
consumption expenditure, and gross domestic product (GDP), reflect a combination of price
and volume changes of the underlying products (goods and services). Volume changes refer
to changes in quantity and quality of products over time. Macroeconomic analysis requires
information on both of these components and the System of National Accounts 2008 (2008
SNA) refers to two alternative methods for separating volume and price changes. The
traditional method is to determine a fixed base year. Volume changes in subsequent periods
are aggregated using the price structures and weights of that year. Annual chain linking was
introduced in the 1993 edition of the SNA and it requires updating of the base year annually
and linking the year-on-year changes. If the linked series are expressed in index number form
with reference year t=100, the index is called chained volume index with reference year “t.”
To obtain accurate estimates of volume changes, the above approaches need to be applied at
a detailed level of goods and services that make up these aggregates. Detailed level means
that the volume estimates of GDP by production should be obtained from volume estimates
ofeconomic activitieswith at least 2-digit level of International Standard Industrial
Classification (ISIC). The 2008 SNA suggests that the ideal way of producing volume
estimates of macroeconomic aggregates is to work at a very detailed level, preferably using
the supply and use tables (SUT) framework, and deflating each component by a strictly
appropriate price index. For example, typically diversified advanced economy would use 50
1 The authors would like to thank Louis Marc Ducharme, Roberto Rosales, Maria Mantcheva, Thomas
Alexander, Marco Marini, Chris Hinchcliffe, Michael Stanger, Michael Andrews, Niall O’ Hanlon, Phil Stokoe,
Nataliya Ivanyk, and other participants of the Brown Bag Seminar of the Statistics Department for their helpful
comments. Special thanks to Claudia Dziobek for extensive discussions and detailed comments on earlier drafts
of the paper. We also thank Jemma Dridi, Deidre Daly, Fabien Nsengiyumva, and Sébastien Walker, all from
the IMF African Department, for their very useful comments. We are grateful to real sector statistics advisors in
African Regional Technical Assistance Centers for continuous support and anonymous country’s authorities for
supply of essential data to undertake this study. We express our gratitude to Liliya Nigmatullina for her superb
administrative support.

5
different price indices to produce a volume measure. Without high quality price indices at the
detailed level of expenditures and/or outputs, no overall measure of economic growth will be
of high quality.
The pros and cons of the two methods have been well researched for advanced economies
and the general consensus is that chain linking produces superior results when economies are
characterized by significant structural changes and movements of relative prices with a
relatively consistent trend. For example, this is the case in countries where new technologies
play an important role. The SNA also recognizes that chain linking may not be suitable in all
circumstances. If prices and quantities of underlying products fluctuate and relative price and
quantity changes of earlier periods are reversed in later periods, chain linking will produce
inferior estimates of growth compared to the fixed-base approach. Therefore, it is essential to
assess whether the economic structure of a particular country over time is favorable for
implementation of chain-linked volume measures or not.
Many advanced economies introduced chain-linked volume measures in their national
accounts during the 1990s following in-depth testing. In recent years, other countries have
adopted chain linking including about a third of the SSA countries.2 This paper considers
whether the intended goal of improving the estimates of GDP growth rates has been
achieved. Our comparison of the fixed-base and the chain-linked approaches was carried out
with recent fixed bases, compatible with a revised base at five-year intervals.3
The paper is structured as follows: Section II provides an overview of the theoretical
background of chain-linked and fixed-base approaches and experiences of some advanced
countries. Section III looks at the prevailing practices of volume measures of SSA countries.
Section IV provides a detailed comparison of growth using the fixed-base and chain-linked
approaches for three selected countries, and a simulation analysis to assess the impact of
deflation techniques and level of classification details on volume growth from fixed-base and
chain-linked approaches. Section V concludes.
II. EXPERIENCE OF ADVANCED COUNTRIES
In the fixed-base approach, weights are derived from a specific year (fixed-base year). The
often-used Laspeyres fixed-base index allocates higher weights to products whose relative
prices have decreased and volumes increased faster (e.g., electronic devices). Over time, this
approach produces higher growth rates which have upward bias as weights become outdated.
In contrast, the chain-linked approach uses more up-to-date weights and, therefore,
eliminates the bias in growth rates for such items. Therefore, in countries with large portions
2 Table 3 provides a list of 15 SSA countries that use chain linking. The majority of developing countries and
some G-20 countries continue to derive their volume measure estimates of GDP using the fixed-base approach.
GDP volume measures of the following six G-20 countries are derived using the fixed base method: Argentina
(2004), China (2010), India (2011/12), Indonesia (2010), Saudi Arabia (2010), South Africa (2010) and Turkey
(1998). Figures in the brackets indicate the fixed-base year used by these countries.
3 While five-yearly rebasing avoids volatility, very old base years fail to capture long term trends and could be
misleading.

6
of their economies influenced by products with systematic trends in relative prices and
quantities, chain linking is the preferred approach. As noted in the SNA, “if individual prices
and quantities fluctuate so that the relative price and quantity changes occurring in earlier
periods are reversed in later periods, chaining will produce worse results than a simple
index4” (2008 SNA para 15.43).
Even though the 2008 SNA cautioned that chain linking could lead to distortions when
product prices and volumes oscillate, it is generally interpreted as favoring chain linking.
“On balance, situations favorable to the use of chain Laspeyres over time seem more likely
than those that are unfavorable. The underlying economic forces that are responsible for the
observed long-term changes in relative prices and quantities, technological progress and
increasing incomes, do not often go into reverse. Hence, it is generally recommended that
annual indices be chained” (2008 SNA para 15.44). The recommendation was mainly tested
using data from advanced countries.
Chain-linked indices are computationally difficult and demand additional resources. The
2008 SNA notes that the computing requirements of deriving annual chain indices are greater
than those for fixed-weighted indices and should not be attempted without adequate, tailored
software. This highlights that implementation of chain linking is more complex and needs
additional resources for development of suitable price deflators and software which could be
important factors to consider in developing Africa. Another known disadvantage of chain-
linked growth estimates is non-additivity.5 The non-additivity associated with chain linking
needs to be suitably explained to the user community, which also requires additional
resources.
Most of the advanced countries introduced chain-linked volume measures during 1990s. The
Netherlands was one of the first in the early 1980s. Other advanced economies including
Australia, Canada, Japan, New Zealand, and the United States implemented chain linking
during late 1990s or early 2000s. Most European Union member states adopted the chain-
linked approach around 2005.6
Volume measures are compiled at a very detailed level of classifications in advanced
countries. For example, in Canada, volume measures of expenditure GDP are based on 435
series of expenditure components (out of which 130 for household final expenditure, 24 for
4 In the present context, simple index refers to Laspeyres fixed-base volume index.
5 Non-additivity means that when the current price values in the reference year are extrapolated backwards or
forwards using a chain-index, the extrapolated values of the components of an aggregate do not, in general, sum
exactly to the extrapolated value of the aggregate. For further details, please refer to Chapter 15 (“Price and
Volume Measures”) of the 2008 SNA.
6 Implementation of chain-linked volume measures in European Union member states derives from the
European Union Commission decision of November 1998 clarifying annex to Council Regulation (EC) No.
2223/96 on the European system of national and regional accounts in the Community as concerns the principles
for measuring prices and volumes (notified under document number C (1998) 3685).

7
government final consumption expenditure, 69 for exports, and 68 for imports). In the Dutch
national accounts, the estimates of volume measures are compiled with 250 industries, 850
commodities, and 10 final demand categories. The value at current prices, the value in prices
of the previous year, the volume index and the deflator are available for every cell of the
supply and use table (SUT). For European Union countries, volume measures must be
implemented at least as detailed as the P60 level (which approximates the two- digit industry
level), for output as well as intermediate and final use categories. The UK implemented chain
linking at the four-digit level of the ISIC which required additional resources relative to the
fixed base year method. In the UK the results for the study period (1995–99) showed some
significant growth differences with the four-digit level implementation producing the lowest
estimates of growth (lower by 0.5 percentage points) for the year (1999) farthest from the
fixed base year (Tuke, 2001). More than 300 input series at broadly four-digit level were
used, compared to less than 60 series at broadly two-digit level. Other advanced countries
also follow detailed levels of classification for their chain volume measures. Implementation
of GDP volume measures at such detailed levels of classification require availability of
detailed price deflators and these countries have supporting statistical systems and resources
in place.
Studies from France, Netherlands, UK, and the United States showed that the use of chain-
linked indices provided GDP growth rates with improved accuracy compared to growth rates
based on the fixed-base method.7 For the United States, the estimates of GDP volume growth
from the chain-linked approach are consistently lower than the fixed-base growth estimates
around the mid-nineties. For the year (1995) farthest from the fixed base year 1987, the
difference is around one percentage point, mostly driven by changes in prices of computer
equipment relative to prices of other goods and services during the study period. The
computer industry valued at fixed-base year prices provides a higher share in total output
than the output estimate valued under the chain-weighted approach. In addition, larger
growth contributions from other industries could not compensate for the drastically reduced
contribution of computers to growth (Steindel, 1995).
For other countries, the differences are significant, but less pronounced. For France, GDP
growth rates are also generally lower from chain linking compared to the fixed-base
approach (over the period 1980–1997). The difference is generally small, less than 0.2
percentage points. Overall, the analysis shows that chain linking yields better results for all
industries. This is less true for agriculture where high fluctuation in quantities and prices
makes this method not desirable (Berthier, 2002). Dutch results also underscore that chain
linking provided a significantly higher growth for agriculture, especially for the years farthest
from the fixed-base year (0.7 and 0.9 percentage points for the last two years respectively).
The Dutch and French studies emphasize that the impact of chain linking on agriculture
significantly differ from other industries given the fluctuating nature of agriculture prices and
quantities. Dutch results also underline that the impact of chain linking on output and value
7 Most of these studies are available for the periods of 1990s / early 2000s. See Table 1 for details.

8
added could be considerably different, which signifies the importance of deflation
techniques.8 Table 1 provides a summary of differences in overall GDP growth rates for four
advanced countries showing growth rates from chain linking minus growth rate for fixed-
base for the last year of the study period when fixed weights are likely to be out of date.
Table 1: Differences in Growth Rates of Selected Advanced Countries
(Chain Linking minus Fixed Base)
Country Fixed Base Year Study Period Difference in GDP Growth
Rate* (Year)
Australia 1989/90 1989/90-1996/97 0.2 (1996/97)
Netherlands 1986 1986-93 -0.5 (1993)
United Kingdom 1994 1994-99 -0.5 (1999)
United States 1987 1987-95 -1.0 (1995) * Difference in growth rate = Growth rate from chain-linked – Growth rate from fixed-base approach, for the last year of the
study period
Source: Australian Bureau of Statistics, 1998; Boer, Dalen, Verbiest, 1997; Tuke, Reed, 2001; Steindel, 1995
However, there are some exceptions. Australian GDP growth rates obtained from the chain-
linked approach showed higher growth rates than fixed-base approach growth rates
(Australian Bureau of Statistics, 1998). The cumulative growth for the period (1989–90 to
1996–97) following the fixed-base approach is 0.4 percentage points lower than chain
indices. Annual GDP growth rates from the fixed-base approach are consistently lower or
equal to the growth rates based on the chain-linked approach. Australian output has a
relatively larger share of commodities, both minerals and farm output. This result is relevant
for many SSA countries that are mainly commodity producers and have larger shares of
commodities in their output than Australia. Even though empirical results showed that chain
linking offered gains only for some components and not for total GDP, Australia
implemented chain-linked volume measures of GDP. The decision is based on index number
theory and it is argued that constant price estimates may get worse as new technologies
appear and ensuing price and volume relatives continue.
III. GDP VOLUME MEASURES IN SUB-SAHARAN AFRICAN COUNTRIES
About a third of SSA countries apply an annual chain-linked approach starting in the early
2000s. Most Francophone countries and some others in the SSA implemented chain-linked
volume measures in the overall context of harmonization of national accounts compilation
8 For example, for agriculture, growth rates of output from fixed-base and chain-linked approach for the year
1993 (the year farthest from the fixed-base year 1986) are 0.5 percent and 0.8 percent respectively. However,
value added growth rates using fixed-base and chain-linked approach for the same year (1993) are 1.6 percent
and 2.5 percent respectively.

9
methods in their regions.9 Most of these are either low-income or fragile countries. Out of the
eight oil- exporting SSA countries, Cameroon and Gabon use chain linking.
SSA countries are typically commodity producers of agricultural and mining products with
the characteristics that tend to make chain linking a less suitable approach for volume
measures. For about one-third of the SSA countries, more than 40 percent of GDP comes
from agriculture and mining products, and for more than two-thirds of countries, more than
one quarter of GDP is contributed by agricultural and mining.10 Table 2 provides shares of
agriculture and mining value added in GDP of selected SSA countries.
Table 2: Share of Agriculture and Mining in GDP for Selected SSA Countries (2013)
Country
Share of agriculture and mining in GDP
(percent)
Country Share of agriculture and mining in GDP
(percent)
Equatorial Guinea 89 Ethiopia 46
Congo 68 Togo 45
Liberia 67 Mali 42
Sierra Leone 65 Chad 42
Angola 65 Burkina Faso 40
Central African Republic 53 Nigeria 36
Niger 47 Ghana 27
Guinea-Bissau 47 Mauritius 3
Gabon 46 Seychelles 2 Source: African Development Bank - Statistical Yearbook 2014
As discussed earlier, availability of proper price and volume indices is fundamental for
producing good quality volume measures. Most SSA countries lack appropriate price and
volume indicators. In terms of price deflators, while most of the SSA countries compile CPIs
with monthly frequency, producer price indices (PPI) are compiled by only eight countries.
In the absence of PPIs, reliance on CPIs as a deflator for goods and services outside the scope
of consumers is a major weakness of GDP volume measures. However, the quality of CPIs is
also a concern for many countries. Only five countries update the CPI weights in five years
or less.
Table 3 shows the status of CPI and PPI data in the SSA countries that implemented chain
linking. Annex I provides details of the GDP base / reference years and weights vintage and
coverage of CPI and PPI for all SSA countries. For the countries that implemented chain
linking the coverage of CPI is complete in only five countries and weights vintage is less
than five years old in two countries and PPI is not compiled in most of the countries. The use
9 Benin, Burkina Faso, Burundi, Cameroon, Côte d’Ivoire, Gabon, Guinea, Mali, Mauritania, and Togo. Cabo
Verde also introduced annual chain-linked approach during the recent base year revision in 2013.
10 31 SSA countries derive more than 25 percent of their GDP from agriculture and mining.

10
of such CPI data could lead to biased GDP volume measures, irrespective of the approach
used for GDP volume measures.
Table 3: Sub-Saharan African Countries: CPI and PPI: Weights Vintage and Coverage (As of April 2016)
Country
CPI PPI
Weights vintage(years)
Coverage Weights vintage
Benin Older than 5 Main cities
X (not compiled)
Burkina Faso Older than 5 Capital city
Burundi Older than 5 Main cities
Cape Verde Older than 5 Nation-wide
Cameroon 3–5 Nation-wide
Central African Republic Older than 5 Capital city
Chad Older than 5 Capital city
Congo DRC Older than 5 Nation-wide
Côte d’Ivoire Older than 5 Main cities
Gabon Older than 5 Capital city
Guinea Older than 5 Capital city
Malawi 3–5 Nation-wide
Mali Older than 5 Capital city
Mauritius 3–5 Nation-wide Older than 5
Togo Older than 5 Capital city X
Source: IMF Data Dissemination Bulletin Board (http://dsbb.imf.org); International Labor Organization (http://laborsta.ilo.org/apple8/data/SSM1_NEW/E/SSM1.html)
IV. DATA ANALYSIS OF CHAIN LINKING IN THREE SUB-SAHARAN AFRICAN COUNTRIES
Three SSA countries (referred to as country A, B, and C) with different economic structures
and income levels are investigated to assess the impact of chain linking on volume GDP
growth rates. Country A is mainly a commodity producer, whereas country C has a higher
proportion of services. Country B’s structure is somewhere in between these two. In addition,
these countries are characterized by varied levels of statistical standards measured in terms of
statistical capacity indicators.11 Two of these countries apply chain linking, and the third
follows the fixed-base approach for measuring the GDP volume measures.
We compare volume growth rates from the fixed-base and chain-linked approaches at the
overall GDP level. We compiled volume estimates of GDP from both approaches at a
detailed level, specifically the level at which deflation is carried out by countries under the
existing compilation systems. The number of years and the periods for which this assessment
is undertaken differs given data availability. For Country A, the assessment is based on data
for eight years (2006–13), Country B six years (2005–10), and Country C seven years (2007–
13). Our compilations are based on detailed source data from these countries, and cover
production GDP and components. We did not undertake our analysis for expenditure GDP
11 Available through internet (http://databank.worldbank.org/data/reports.aspx?source=Statistical-capacity-
indicators)

11
and components because in most of the SSA countries the estimates of GDP are compiled
using the production approach. The quality of GDP expenditure data at current prices and
volumes are considered weak as most of the countries derive their household final
consumption expenditure as a residual, and estimates for private capital formation are not
reliable.12
Country A
The primary sector accounts for about half of GDP for most of the years of the study period.
This country has highly volatile GDP growth rates driven by volatile agricultural production
resulting from climatic shocks. This underscores the dominance of primary products,
particularly crops and animal farming activities, in overall GDP. Such volatility in
agricultural production highlights that chain linking may not be suitable for measuring the
volume growth of GDP. As expected, the chain-linked approach shows a significantly higher
volume growth than the fixed-base growth rate for agriculture. The difference in agriculture
growth is most pronounced (about 1 percentage point) for the year farthest from the fixed
base year.13 The difference in the growth for agriculture for the year 2013 is the highest
compared to any of the activities. In addition, for manufacturing and total services, the fixed
base reduces growth by 0.5 and 0.1 percentage points respectively for the year 2013.
However, for the overall GDP, chain linking reduces growth in the last two years (2012 and
2013) by about 0.7 and 0.2 percentage points respectively, mostly driven by a surge in
production of primary products. Such upward effect is also observed in advanced economies.
The difference in GDP growth rates for different years is higher for Country A than the two
countries. In addition, the differences are highly volatile. This suggests that changes in signs
cancel out. This is evident from the same volume index for the year 2013 from both
approaches (taking volume index for 2007=100). In general, results show that chain linking
is not essential for important components such as agriculture, manufacturing, and services.
For GDP, the difference in the last year is small. Additionally, for the whole period 2006–13,
cumulative growth is almost the same from both the approaches (Figure 1).
We examine whether the differences in growth rates truly reflect the underlying economic
structure or are perhaps outcomes of statistical techniques used? As noted above, for
agriculture, manufacturing, and services, chain-linked growth rates show an upward drift
compared to fixed base. There are differences in the compilation of volume measures for
these sectors. In Country A agriculture estimates are largely compiled at a detailed product
12 In most of the SSA countries, a direct estimate of household final consumption expenditure (HHFCE) is
available for the benchmark year only. For other years, HHFCE is calculated as a residual taking the GDP by
production as the firm figure or extrapolating the base year estimates using the growth rate of population and
CPI.
13 In this paper, difference in growth rates for year t = growth rate from annual chain-linked approach for year t
– growth rate from fixed-base approach for year t. In this paper, we present differences and not actual growth
rates to maintain confidentiality of the data.

12
level using single deflation, whereas estimates for manufacturing are compiled at two-digit
level of ISIC through extrapolation.
Figure 1: Country A: Differences in Growth Rates of GDP and Components
(Chain Linking minus Fixed Base)
Source: Staff calculations
About 75 percent of the volume measures of services are based on single indicator methods
(extrapolation or deflation) generally at a higher level of ISIC. The CPI covers only the
capital city and uses outdated weights. Empirically, single indicator methods (deflation and
extrapolation of value added) provide the same growth rates from the fixed-base and the
chain-linked approaches at the level of their application. As a result, use of single indicator
methods tends to reduce the differences in growth rates at the aggregate level. In addition,
improper deflators and higher classification levels of implementation of deflation techniques
have the potential to introduce bias in the volume growth estimates of underlying economic
activities from both the approaches. This highlights that the insignificant difference in growth
rate for 2013 with minor upward drift for chain-linked services estimates may not reflect the
changes in underlying economic structure. For manufacturing, there are no differences in
growth rates at two-digit level, however, differences are observed at the aggregate level. It is
likely that improvements through double deflation at two-digit level may improve the growth
estimates from both the approaches and bring out an accurate picture of difference in growth
rates. We will investigate the potential impact of improper deflation techniques and
classification level of implementation on chain linking in Section V.
Country B
This country has a relatively high proportion of services. For Country B, the differences in
annual GDP growth rates are very small for all years and, for the year farthest from the fixed
base year, there is no difference at all. Even though chain linking reduced the growth for total
-0.2
0.0
0.2
0.4
0.6
0.8
1.0
1.2
-2.0
-1.5
-1.0
-0.5
0.0
0.5
1.0
1.5
2.0
2.5
2007 2008 2009 2010 2011 2012 2013
Dif
fere
nce
in c
um
ula
tive
gro
wth
of
GD
P (
%)
Dif
fere
nce
in g
row
th r
ate
s (%
)
Year
GDP (left axis) Primary (left axis) Secondary (left axis)
Services (left axis) Cum. growth (right axis)

13
services in the last year, the combined effect of all other activities appear to counteract this
growth. The estimates of cumulative growth for the six year period (2005–10) shows that
chain linking produces only a slightly smaller cumulative growth rate (Figure 2).
Figure 2: Country B: Differences in Growth Rates of GDP and Components (Chain Linking minus Fixed Base)
Source: Staff calculations
The volume estimates of GDP for this country are compiled at a very detailed level using
double indicator method in the Supply and Use Tables (SUT) framework.14 For activities
where detailed intermediate consumption data are available at current prices, double deflation
is used to get value added at previous year prices. Each item (product) of intermediate
consumption in the production account is deflated by the relevant price index from the SUTs
related to that product. Activities where intermediate consumption is known at current prices
are the formal sector (retrieved from detailed financial statements) and the general
government. For activities where detailed data are not known at current prices, single
extrapolation is used, using the volume index of the output. These activities are related to the
informal sector, and some activities performed by nonprofit institutions serving households.
As the estimates of volume measures are compiled in the SUT framework, we consider that
the differences in growth rates could be largely attributed to underlying economic reality. In
view of this, nil difference in the growth rate for 2010 (invisible blue bar), and an
14 In this method, a volume measure of value added is obtained as the difference between volume measures of
output and intermediate consumption (each of which derived by direct revaluation, deflation, or volume
extrapolation). This method is often referred to as double deflation.
-0.4
-0.3
-0.3
-0.2
-0.2
-0.1
-0.1
0.0
-1.0
-0.8
-0.6
-0.4
-0.2
0.0
0.2
0.4
0.6
0.8
1.0
2006 2007 2008 2009 2010
Dif
fere
nce
in c
um
ula
tive
gro
wth
of
GD
P (
%)
Dif
fere
nce
in g
row
th r
ate
s (%
)
Year
GDP (left axis) Primary (left axis) Secondary (left axis)
Services (left axis) Cum. growth (right axis)

14
insignificant difference in the cumulative growth rate up to 2010 bring out an important point
regarding the impact of chain linking. In general, growth rates for this country are not
impacted by the approach used for volume measures estimation.
Country C
This country is a relatively services dominant economy among the three countries. The
differences in GDP growth rates are rather small for all the years and mostly positive. The
highest difference is 0.2 percentage points observed in two years (2010 and 2012). For the
year farthest from the fixed base year, the difference is 0.1. Except for transportation and
storage, all other activities showed either positive differences or no difference for 2013. We
see higher cumulative growth from chain linking than the fixed-base approach for the period
2006–13 (Figure 3).
Manufacturing is a major contributor to the GDP in this country. As the estimates are
obtained through extrapolation at two-digit level of manufacturing, no differences in growth
rates are observed at that level. However, there are significant differences at aggregate level.
This significant upward drift in volume growth estimates of value added from chain linking
could be partly attributed to volatility in sub-sectors of manufacturing. For services,
empirical considerations influenced the growth estimates from both the approaches. First, use
of single indicator methods at higher classification levels mean that there is almost no
difference for most of the services. Second, the lower growth estimates for transportation and
storage from chain linking were offset by the combined effect of other services and resulted
in no difference to the services growth. Overall, it appears that the differences in growth
estimates for services largely depict the statistical method rather than economic structure.

15
Figure 3: Country C: Differences in Growth Rates of GDP and Components
(Chain Linking minus Fixed Base)
Source: Staff calculations
Results of Data Analysis
Overall, our study shows insignificant difference in growth rates for the farthest year, volatile
differences in growth rates, and negligible or even zero difference in cumulative growth for
the respective study periods. Our results are in contrast with results for advanced economies.
As seen in our analysis, the cumulative growth over a period of five to six years, which is
normally an ideal period between two base years, is not significantly affected by the
approach for producing volume measures of GDP in these countries. Our results also indicate
that deflation techniques and classification levels of implementation may have an impact on
the growth rates. We conclude that an assessment of the potential impact of deflation
techniques and level of classification details need to be investigated further. These may
significantly affect the impact of chain linking.
V. SIMULATION ANALYSIS OF DEFLATION TECHNIQUES AND DETAILED LEVEL OF
CLASSIFICATIONS
As noted in Section II, the 2008 SNA recommends that the volume estimates of GDP be
obtained at a very detailed level preferably using the SUT framework, deflating each
-0.1
0.0
0.1
0.2
0.3
0.4
-1.0
-0.8
-0.6
-0.4
-0.2
0.0
0.2
0.4
0.6
0.8
1.0
2008 2009 2010 2011 2012 2013
Dif
fere
nce
in c
um
ula
tive
gro
wth
of
GD
P (
%)
Dif
fere
nce
in g
row
th r
ate
s (%
)
Year
GDP (left axis) Primary (left axis) Secondary (left axis)
Services (left axis) Cum. growth (right axis)

16
component by a strictly appropriate price index.15 This implies that compilation of volume
measures obtained at a detailed classification level would improve the accuracy of growth
rates irrespective of the approach (fixed-base or chain-linked).
The detailed data obtained for this project allowed us to undertake two different simulations.
The first simulation uses single deflation rather than double deflation. The second simulation
uses overly-aggregated classification levels instead of detailed classification levels. These
simulations provide useful insights to understand how deflation techniques and classification
levels affect the volume measures of GDP when chain linking is used.
The simulation on the impact of single deflation was carried out using the data for Country B
and overly-aggregated classification levels using Country C’s data.
The results of the simulation analysis provide the following key conclusions:
Use of improper deflation techniques and overly-aggregated classifications can lead
to significant distortions in growth rates and provide wrong conclusions regarding the
efficacy of the approach (fixed-base or chain- linked) appropriate for obtaining GDP
volume measures; and
Chain linking has limited influence in correcting the bias that improper deflation
techniques and overly-aggregated classifications can introduce.
The impact of single deflation using data for Country B is presented first followed by the
results on overly-aggregated classifications for Country C.
Impact of Deflation Technique
For Country B, in the existing compilation system, a large portion of volume measures of
GDP is compiled through double deflation. To assess the impact that single deflation would
have had on Country B, volume measures were obtained through single deflation in the place
of double deflation. The results indicate significant differences in the growth rates obtained
from using double deflation rather than single deflation.
In Figure 4, ‘yellow bars’ represent differences in GDP growth rates for Country B obtained
from single and double deflation using the fixed-base approach. Positive yellow bars indicate
that growth rate from single deflation is higher and negative yellow bars convey that growth
rate using single deflation is lower in the respective years. We note that the use of single
deflation reduces the growth rate for three years, and increases it for two years. While the
differences are large (around 0.5 percent in four of the five years and by 1.5 percent for
15 In the absence of suitable price deflators, volume extrapolation is the second best alternative. For an
introduction to these techniques, please see the Eurostat’s Handbook on Price and Volume Measures in
National Accounts.

17
2009), no consistent pattern is observed. Single deflation produced a much higher growth
rate for 2009.
These results for Country B suggest that the failure of single deflation to take into account
changes in the relative prices of inputs and output is not just a theoretical weakness, but are
significant in practice. Therefore, compilers may consider replacement of single deflation as
a relatively high priority.
Figure 4: Difference in Growth Rates for Country B (Single minus Double Deflation)
Source: Staff calculations
Interaction Between Deflation Technique and Chain Linking
Looking at the combined effect of the deflation technique (single deflation or double
deflation) with the fixed-base or chained approach, the difference in the growth rates between
chain-linked and fixed-base approaches did not change significantly. In Figure 4, ‘red bars’
present differences in GDP growth rates obtained from single and double deflation using the
chain linking.
Impact of Overly Aggregated Classifications
For Country C, in the existing compilation system, volume estimates of manufacturing are
compiled at sub-activity levels (which are referred to as divisions in the ISIC) and aggregated
to obtain volume measure of manufacturing. The sub-activity level value added estimates are
extrapolated using the index of industrial production (IIP) sub-components to obtain volume
-1.0
-0.5
0.0
0.5
1.0
1.5
2.0
2006 2007 2008 2009 2010
Dif
fere
nce
in G
DP
gro
wth
rat
es
(%)
YEAR
Fixed Base (Single -Double Deflation) Chain Linking (Single -Double Deflation)

18
measures. 16 To understand the impact of overly aggregated classifications on the volume
estimates, we undertook a simulation using the volume measures of manufacturing value
added at the highest classification level.
In Figure 5, ‘yellow bars’ represent the difference in growth rates for manufacturing value
added using a higher classification level and a detailed classification level following the
fixed-base approach. Similarly, ‘red bars’ represent the difference in growth rates for
manufacturing value added using a higher classification level and a detailed classification
level following the chain-linked approach.
Figure 5: Country C: Comparison of Growth Rates for Manufacturing
(HCL–Higher Classification Level minus DCL-–Detailed Classification level)
Source: Staff calculations
The classification level made significant differences to manufacturing growth rates in two out
of six years. For the year 2013, the difference is 2.8 percentage points using fixed-base
approach (yellow bar) and 1.9 percentage points (red bar) using chain-linked approach. In
2010, the use of higher classification level reduces the manufacturing growth rates by 2.8
percentage points from chain-linked and 2 percentage points for fixed-base approach.
16 Empirically, extrapolation and single deflation of GVA create no differences in growth rates from the fixed
base and chain-linked approaches. Difference in growth rates comes only at the level of aggregation.
-4.0
-3.0
-2.0
-1.0
0.0
1.0
2.0
3.0
4.0
2008 2009 2010 2011 2012 2013
Dif
fere
nce
in g
row
th r
ate
s (%
)
Year
Fixed base (HCL-DCL) Chain linked (HCL-DCL)

19
Interaction Between Classification Levels and Chain Linking
The interaction between chain linking and classification levels are examined using the
simulation results for Country C. From Figure 5, we note that the fixed-base approach
provides higher growth rates in two years (2012 and 2013) and chain linking in two years
(2010 and 2011). Overall, there is no consistent pattern. This signifies that implementation of
overly aggregated classification has significant impact on growth rates and chain linking
apparently has no influence in correcting this.
The above results underscore the importance of obtaining volume measures at a very detailed
classification level using appropriate deflation techniques. Therefore, we suggest that the
implementation of a good system of double deflation at a very detailed classification level be
given priority over chain linking. We noted in Section III that most of the SSA countries lack
appropriate price and volume indicators. We suggest that the SSA countries should improve
price and volume indices and to develop new indices such as the PPI which are more
appropriate for output GDP activities. This will lead to substantial improvements in the
volume measures of these countries in the first instance. Once suitable price and volume
indices are available for all the activities (at least at two-digit level of ISIC) and the resources
are in place for their regular update, the suitability of chain linking can be assessed.
VI. CONCLUSIONS
There is a perception among national accounts compilers that implementation of chain
linking provides superior estimates of volume measures of GDP under all conditions.
However, this paper concludes that chain linking provides no substantial gains vis-à-vis the
fixed-base approach in terms of providing accurate growth rates for the three SSA countries.
Implementation of fixed-base approach at a detailed level (at least two-digit level of ISIC)
using appropriate deflation techniques, and regular base year revisions yield more significant
improvements in volume measures of GDP for SSA countries. The paper suggests that the
quality of price and volume indices and the classification level of implementation should be
given priority in countries with limited resources. They lead to major improvements in
growth estimates irrespective of the approach used for aggregation. Also, chain linking
should be undertaken following assessment as highlighted in this paper.
The results from this paper may provide useful guidance to national accounts compilers and
managers. Implementation of chain linking should be driven by the economic structure of a
particular county and the availability and timeliness of the required underlying detailed data.
Conversely, countries that are not applying chain-linked volume measures should not be
judged as lagging in implementation of an important recommendation of the 2008 SNA.
Finally, we suggest further research and assessments for developing countries from other
regions of the world to see if these results can be generalized for other countries.

20
REFERENCES
African Development Bank Group, African Union Commission, and Economic Commission
for Africa, 2014, African Statistical Year book 2014.
Australian Bureau of Statistics, 1998. “Introduction of Chain Volume Measures in the
Australian National Accounts,” Information Paper, March 1998.
Berthier, J-P., 2002. “Thoughts on different notions of volume in national accounts”, INSEE,
2002 (available in French only).
Boer, S.de, J.V.Dalen, and P.Verbiest, 1997. “Chain Indices in The National Accounts: The
Dutch Experience,” Statistics Netherlands, Division Presentation and Integration,
NA-087.
Bureau of Labor statistics, 2015, CPI for televisions, computers, software, and related items
(December 1997=100), available through internet at
http://www.bls.gov/opub/ted/2015/long-term-price-trends-for-computers-tvs-and-
related-items.htm
Chevalier, M., 2003. “Chain Fisher Volume Index Methodology,” Income and Expenditure
Accounts Technical Series, Catalogue no. 13-604-MIE no.42, November 2003.
Commission of the European Communities, IMF, OECD, United Nations and World Bank,
System of National Accounts 1993.
European Commission, IMF, OECD, United Nations and World Bank, System of National
Accounts 2008.
Eurostat, 2001, Handbook on Price and Volume Measures in National Accounts,
Luxembourg.
International Labor Organization, Sources and Methods: Labour Statistics, Volume 1:
Consumer Price Indices, available through internet at
(http://laborsta.ilo.org/applv8/data/SSM1_NEW/E/SSM1.html)
International Monetary Fund, 2013. “Annex 1.1.Statistical Challenges for Africa and the
Way Forward,” Regional Economic Outlook, Sub-Saharan Africa, October 2013.
Shreyer, P., 2004. “Chain Index Number Formula in the National Accounts,” paper presented
at the 8th OECD-NBS Workshop on National Accounts, 6-10 December 2004, OECD
Headquarters, Paris.
Steindel, C., 1995. “Chain-Weighting: The New Approach to Measuring GDP,” Current
Issues in Economics and Finance, Volume 1, No.9, December 1995.
Tuke, A., and G.Reed, 2001. “The Effects of Annual Chain-Linking on the Output Measure
of GDP,” Economic Trends, No. 575, October 2001.
21
Appendix 1: GDP Base / Reference Year, and Weights Vintage and Coverage of CPI
and PPI for SSA Countries (As of April 2016)
Country
National Accounts CPI PPI
Fixed Base (FB) / Chain Linking (CL)
Base / Reference
Year* Weights
vintage(years) Coverage
Weights vintage
Angola FB 2002 3–5 Capital city X
Benin CL 2007 Older than 5 Main cities X
Botswana FB 2006 Older than 5 Nation-wide X
Burkina Faso CL 1999 Older than 5 Capital city X
Burundi CL 2005 3–5 Capital city X
Cabo Verde CL 2007 Older than 5 Nation-wide X
Cameroon CL 2000 3–5 Nation-wide X
Central African Republic
CL 1985 Older than 5 Capital city X
Chad CL 2005 Older than 5 Capital city X
Comoros FB 2007 Older than 5 Capital city X
Congo DRC CL 2005 Older than 5 Nation-wide X
Congo Republic FB 1990 Older than 5 Capital city X
Côte d’Ivoire CL 2008 Older than 5 Main cities X
Equatorial Guinea FB 1992/93 Older than 5 Nation-wide X
Ethiopia FB 2011 Older than 5 Nation-wide X
Gabon CL 2001 Older than 5 Capital city X
Gambia FB 2004 Older than 5 Nation-wide X
Ghana FB 2006 Older than 5 Nation-wide Older than 5
Guinea CL 2010 Older than 5 Capital city X
Guinea-Bissau FB 2005 Older than 5 Capital city X
Kenya FB 2009 Older than 5 Nation-wide X
Lesotho FB 2004 Older than 5 Nation-wide X
Liberia FB ** Older than 5 Capital city X
Madagascar FB 1984 Older than 5 Nation-wide X
Malawi CL 2010 3–5 Nation-wide X
Mali CL 1999 Older than 5 Capital city X
Mauritius CL 2007 3–5 Nation-wide Older than 5
Mozambique FB 2009 3–5 Urban areas X
Namibia FB 2010 3–5 Nation-wide X
Niger FB 2006 Older than 5 Capital city X
Nigeria FB 2010 Older than 5 Nation-wide X
Rwanda FB 2011 3–5 Urban areas 3–5
Sao Tome and Principe
FB 2001 Older than 5 Capital city X
Senegal FB 1999 Older than 5 Capital city X
Seychelles FB 2006 Older than 5 Nation-wide 3–5
Sierra Leone FB 2006 Older than 5 Nation-wide X
South Africa FB 2010 3–5 Nation-wide 3–5
South Sudan FB 2010 Older than 5 Nation-wide X
Swaziland FB 1985 Older than 5 Urban areas X
Tanzania FB 2007 3–5 Urban areas Older than 5
Togo CL 2007 Older than 5 Capital city X

22
Uganda FB 2009/10 Older than 5 Urban areas Older than 5
Zambia FB 2010 Older than 5 Nation-wide X
Zimbabwe FB 2009 3–5 Nation-wide Older than 5
Source: Websites of statistical offices, GDDS, SDDS, ILO, WEO database, etc.; X- indicates that PPI is not compiled for this
country;
* Base year applies to countries using fixed base approach and reference year for countries using chain linking.
** Liberia has no official GDP data


![COMPARATIVE STUDY ON FIXED BASE AND BASE ...(2012)“Comparative Study on Fixed base and Base Isolated Buildings on Sloping Ground”. [2]. Singh Y ,(2013) “the seismic behavior](https://img.pdfslide.us/doc/110x75/5f7a33cf9b9f0f5fba387d85/comparative-study-on-fixed-base-and-base-2012aoecomparative-study-on-fixed.jpg)