Embed Size (px)
Citation preview
9/13/2013
1
Five Steps for Successful 2014
Business Planning
Edward Marshall, GM, Services Vertical
NetSuite
Jeanne Urich, Managing Director
Service Performance Insight
Richard Curzi, Vice President, Operations
Collaborative Consulting
Edward Marshall
General Manager, Services Vertical
NetSuite
Today’s Agenda
Welcome & Introductions
NetSuite – Company and Product Overview
Services Performance Insight – Business Planning: Empty
Ritual or Catalyst for Growth?
Collaborative Consulting – Business Planning Process
Audience Q&A
NetSuite: World’s #1 Cloud SRP & PSA
16,000+ organizations
#1 provider of cloud SRP & PSA for services organizations
Fastest growing top 10 FMS for 3 years - Gartner
Used across 100+ countries
NetSuite runs global business and PS organization on NetSuite
Top 10 Cloud Companies to Watch
#1 Cloud Business Suite Industry Recognition
Background High Growth
Best Financial Management
Fastest Growing Top 10 FMS Vendor
3rd Year Running
Founded 1998
Publicly traded on NYSE: “N”
$308M+ revenue FY12
Offices in 10 countries
1,700+ employees
World’s most deployed cloud business suite
NetSuite Professional Services Automation Solution
Project
management
Resource
management Time &
expense
tracking
Billing &
invoicing
Reporting
functionality
NetSuite Services Resource Planning (SRP)
Key performance indicators
Sales and
marketing
Project
delivery Financial
9/13/2013
2
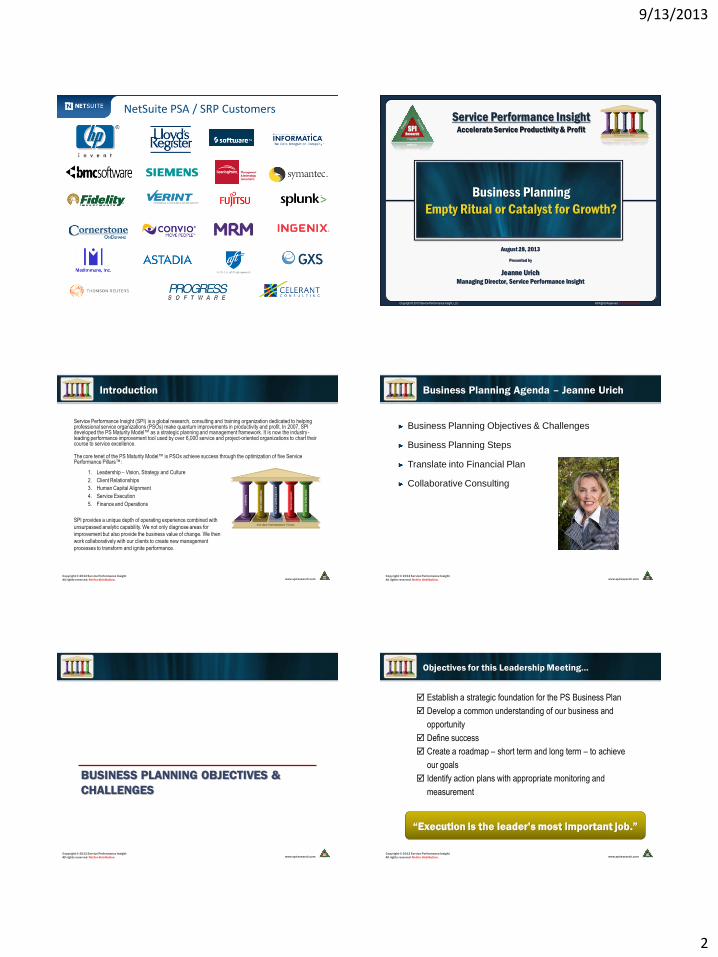
NetSuite PSA / SRP Customers
www.spiresearch.com SPISPI
ResearchResearch
People
People
Pro
cess
Pro
cess
CapitalCapital
Copyright © 2013 Service Performance Insight
All rights reserved. Not for distribution.
Business Planning
Empty Ritual or Catalyst for Growth?
SPISPIResearchResearch
People
People
Pro
cess
Pro
cess
CapitalCapital
Service Performance Insight Accelerate Service Productivity & Profit
Copyright © 2013 Service Performance Insight, LLC All Rights Reserved. Not for Distribution.
August 28, 2013
Presented by
Jeanne Urich Managing Director, Service Performance Insight
www.spiresearch.com SPISPI
ResearchResearch
People
People
Pro
cess
Pro
cess
CapitalCapital
Copyright © 2013 Service Performance Insight
All rights reserved. Not for distribution.
Introduction
Service Performance Insight (SPI) is a global research, consulting and training organization dedicated to helping professional service organizations (PSOs) make quantum improvements in productivity and profit. In 2007, SPI developed the PS Maturity Model™ as a strategic planning and management framework. It is now the industry -leading performance improvement tool used by over 6,000 service and project-oriented organizations to chart their course to service excellence.
The core tenet of the PS Maturity Model™ is PSOs achieve success through the optimization of five Service Performance Pillars™:
1. Leadership – Vision, Strategy and Culture
2. Client Relationships
3. Human Capital Alignment
4. Service Execution
5. Finance and Operations
SPI provides a unique depth of operating experience combined with
unsurpassed analytic capability. We not only diagnose areas for
improvement but also provide the business value of change. We then
work collaboratively with our clients to create new management
processes to transform and ignite performance.
www.spiresearch.com SPISPI
ResearchResearch
People
People
Pro
cess
Pro
cess
CapitalCapital
Copyright © 2013 Service Performance Insight
All rights reserved. Not for distribution.
Business Planning Agenda – Jeanne Urich
Business Planning Objectives & Challenges
Business Planning Steps
Translate into Financial Plan
Collaborative Consulting
www.spiresearch.com SPISPI
ResearchResearch
People
People
Pro
cess
Pro
cess
CapitalCapital
Copyright © 2013 Service Performance Insight
All rights reserved. Not for distribution.
BUSINESS PLANNING OBJECTIVES &
CHALLENGES
www.spiresearch.com SPISPI
ResearchResearch
People
People
Pro
cess
Pro
cess
CapitalCapital
Copyright © 2013 Service Performance Insight
All rights reserved. Not for distribution.
Objectives for this Leadership Meeting…
Establish a strategic foundation for the PS Business Plan
Develop a common understanding of our business and
opportunity
Define success
Create a roadmap – short term and long term – to achieve
our goals
Identify action plans with appropriate monitoring and
measurement
“Execution is the leader’s most important job.”
9/13/2013
3
www.spiresearch.com SPISPI
ResearchResearch
People
People
Pro
cess
Pro
cess
CapitalCapital
Copyright © 2013 Service Performance Insight
All rights reserved. Not for distribution.
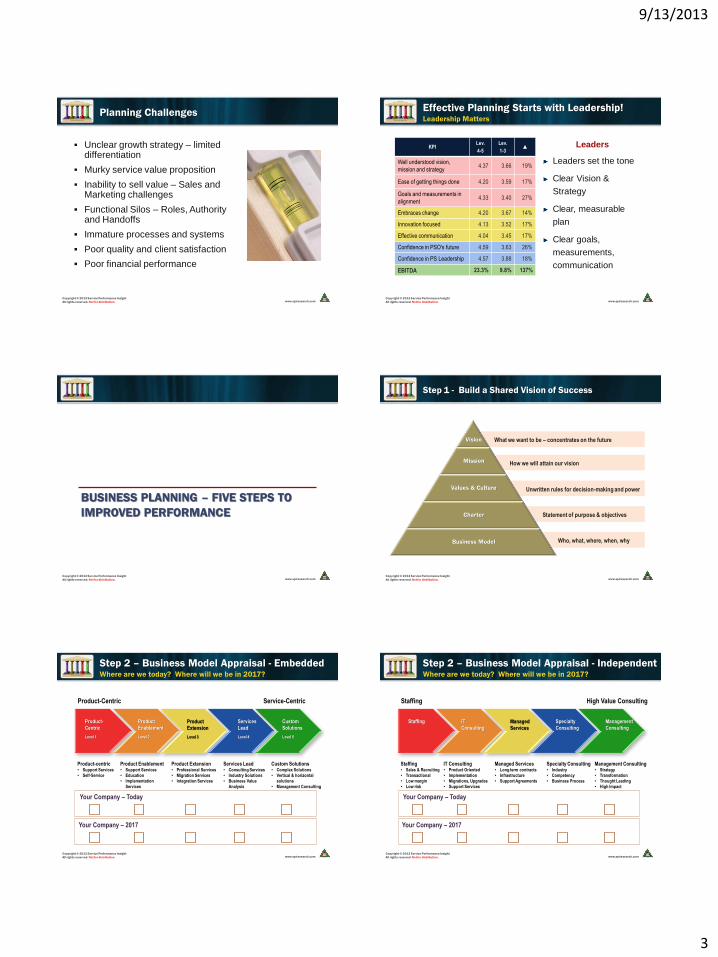
Planning Challenges
Unclear growth strategy – limited differentiation
Murky service value proposition
Inability to sell value – Sales and Marketing challenges
Functional Silos – Roles, Authority and Handoffs
Immature processes and systems
Poor quality and client satisfaction
Poor financial performance
www.spiresearch.com SPISPI
ResearchResearch
People
People
Pro
cess
Pro
cess
CapitalCapital
Copyright © 2013 Service Performance Insight
All rights reserved. Not for distribution.
Effective Planning Starts with Leadership! Leadership Matters
KPI Lev.
4-5
Lev.
1-3 ▲
Well understood vision,
mission and strategy 4.37 3.66 19%
Ease of getting things done 4.20 3.59 17%
Goals and measurements in
alignment 4.33 3.40 27%
Embraces change 4.20 3.67 14%
Innovation focused 4.13 3.52 17%
Effective communication 4.04 3.45 17%
Confidence in PSO's future 4.59 3.63 26%
Confidence in PS Leadership 4.57 3.88 18%
EBITDA 23.3% 9.8% 137%
Leaders
Leaders set the tone
Clear Vision &
Strategy
Clear, measurable
plan
Clear goals,
measurements,
communication
www.spiresearch.com SPISPI
ResearchResearch
People
People
Pro
cess
Pro
cess
CapitalCapital
Copyright © 2013 Service Performance Insight
All rights reserved. Not for distribution.
BUSINESS PLANNING – FIVE STEPS TO
IMPROVED PERFORMANCE
www.spiresearch.com SPISPI
ResearchResearch
People
People
Pro
cess
Pro
cess
CapitalCapital
Copyright © 2013 Service Performance Insight
All rights reserved. Not for distribution.
What we want to be – concentrates on the future
How we will attain our vision
Unwritten rules for decision-making and power
Statement of purpose & objectives
Who, what, where, when, why
Step 1 - Build a Shared Vision of Success
Vision
Mission
Values & Culture
Charter
Business Model
www.spiresearch.com SPISPI
ResearchResearch
People
People
Pro
cess
Pro
cess
CapitalCapital
Copyright © 2013 Service Performance Insight
All rights reserved. Not for distribution.
Step 2 – Business Model Appraisal - Embedded Where are we today? Where will we be in 2017?
Product-Centric Service-Centric
Product-centric • Support Services
• Self-Service
Product-
Centric
Level 1
Product Enablement • Support Services
• Education
• Implementation
Services
Product
Enablement
Level 2
Product Extension • Professional Services
• Migration Services
• Integration Services
Product
Extension
Level 3
Services Lead • Consulting Services
• Industry Solutions
• Business Value
Analysis
Services
Lead
Level 4
Custom Solutions • Complex Solutions
• Vertical & horizontal
solutions
• Management Consulting
Custom
Solutions
Level 5
Your Company – Today
Your Company – 2017
www.spiresearch.com SPISPI
ResearchResearch
People
People
Pro
cess
Pro
cess
CapitalCapital
Copyright © 2013 Service Performance Insight
All rights reserved. Not for distribution.
Step 2 – Business Model Appraisal - Independent Where are we today? Where will we be in 2017?
Staffing High Value Consulting
Staffing • Sales & Recruiting
• Transactional
• Low margin
• Low risk
Staffing
IT Consulting • Product Oriented
• Implementation
• Migrations, Upgrades
• Support Services
IT
Consulting
Managed Services • Long term contracts
• Infrastructure
• Support Agreements
Managed
Services
Specialty Consulting • Industry
• Competency
• Business Process
Specialty
Consulting
Management Consulting • Strategy
• Transformation
• Thought Leading
• High Impact
Management
Consulting
Your Company – Today
Your Company – 2017
9/13/2013
4
www.spiresearch.com SPISPI
ResearchResearch
People
People
Pro
cess
Pro
cess
CapitalCapital
Copyright © 2013 Service Performance Insight
All rights reserved. Not for distribution.
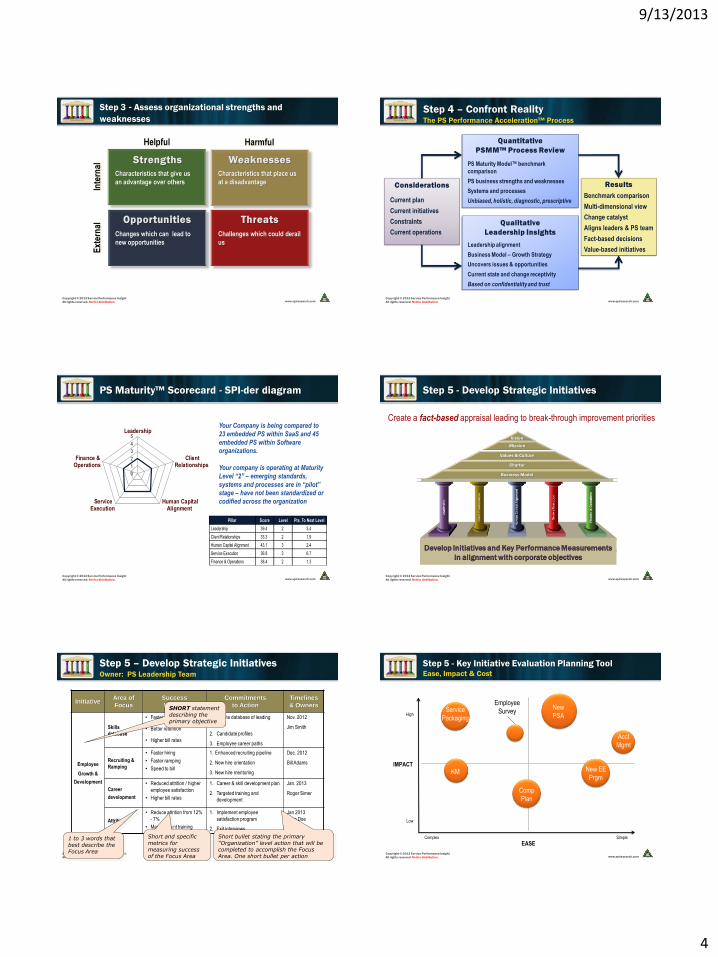
Step 3 - Assess organizational strengths and
weaknesses
Characteristics that give us
an advantage over others
Characteristics that place us
at a disadvantage
Changes which can lead to
new opportunities
Challenges which could derail
us
www.spiresearch.com SPISPI
ResearchResearch
People
People
Pro
cess
Pro
cess
CapitalCapital
Copyright © 2013 Service Performance Insight
All rights reserved. Not for distribution.
Step 4 – Confront Reality The PS Performance Acceleration™ Process
Current plan
Current initiatives
Constraints
Current operations
Leadership alignment
Business Model – Growth Strategy
Uncovers issues & opportunities
Current state and change receptivity
Based on confidentiality and trust
PS Maturity Model™ benchmark
comparison
PS business strengths and weaknesses
Systems and processes
Unbiased, holistic, diagnostic, prescriptive Benchmark comparison
Multi-dimensional view
Change catalyst
Aligns leaders & PS team
Fact-based decisions
Value-based initiatives
www.spiresearch.com SPISPI
ResearchResearch
People
People
Pro
cess
Pro
cess
CapitalCapital
Copyright © 2013 Service Performance Insight
All rights reserved. Not for distribution.
PS Maturity™ Scorecard - SPI-der diagram
0
1
2
3
4
5 Leadership
ClientRelationships
Human CapitalAlignment
ServiceExecution
Finance &Operations
Pillar Score Level Pts. To Next Level
Leadership 39.4 2 3.4
Client Relationships 33.3 2 1.9
Human Capital Alignment 43.1 3 2.4
Service Execution 36.8 3 6.7
Finance & Operations 38.4 2 1.3
Your Company is being compared to
23 embedded PS within SaaS and 45
embedded PS within Software
organizations.
Your company is operating at Maturity
Level “2” – emerging standards,
systems and processes are in “pilot”
stage – have not been standardized or
codified across the organization
www.spiresearch.com SPISPI
ResearchResearch
People
People
Pro
cess
Pro
cess
CapitalCapital
Copyright © 2013 Service Performance Insight
All rights reserved. Not for distribution.
Step 5 - Develop Strategic Initiatives
Develop Initiatives and Key Performance Measurements
in alignment with corporate objectives
Vision
Mission
Values & Culture
Charter
Business Model
Create a fact-based appraisal leading to break-through improvement priorities
www.spiresearch.com SPISPI
ResearchResearch
People
People
Pro
cess
Pro
cess
CapitalCapital
Copyright © 2013 Service Performance Insight
All rights reserved. Not for distribution.
Step 5 – Develop Strategic Initiatives Owner: PS Leadership Team
Initiative Area of
Focus
Success
Metrics
Commitments
to Action
Timelines
& Owners
Employee
Growth &
Development
Skills
database
• Faster recruiting
• Better retention
• Higher bill rates
1. Create database of leading
skills
2. Candidate profiles
3. Employee career paths
Nov. 2012
Jim Smith
Recruiting &
Ramping
• Faster hiring
• Faster ramping
• Speed to bill
1. Enhanced recruiting pipeline
2. New hire orientation
3. New hire mentoring
Dec. 2012
Bill Adams
Career
development
• Reduced attrition / higher
employee satisfaction
• Higher bill rates
1. Career & skill development plan
2. Targeted training and
development
Jan. 2013
Roger Simer
Attrition
• Reduce attrition from 12%
- 7%
• Management training
1. Implement employee
satisfaction program
2. Exit interviews
Jan 2013
John Doe
SHORT statement describing the primary objective
1 to 3 words that best describe the Focus Area
Short and specific metrics for measuring success of the Focus Area
Short bullet stating the primary “Organization” level action that will be completed to accomplish the Focus Area. One short bullet per action
www.spiresearch.com SPISPI
ResearchResearch
People
People
Pro
cess
Pro
cess
CapitalCapital
Copyright © 2013 Service Performance Insight
All rights reserved. Not for distribution.
Step 5 - Key Initiative Evaluation Planning Tool Ease, Impact & Cost
IMPACT
Low
High
EASE Complex Simple
Service
Packaging
KM New EE
Prgm
New
PSA
Comp
Plan
Acct
Mgmt
Employee
Survey
9/13/2013
5
www.spiresearch.com SPISPI
ResearchResearch
People
People
Pro
cess
Pro
cess
CapitalCapital
Copyright © 2013 Service Performance Insight
All rights reserved. Not for distribution.
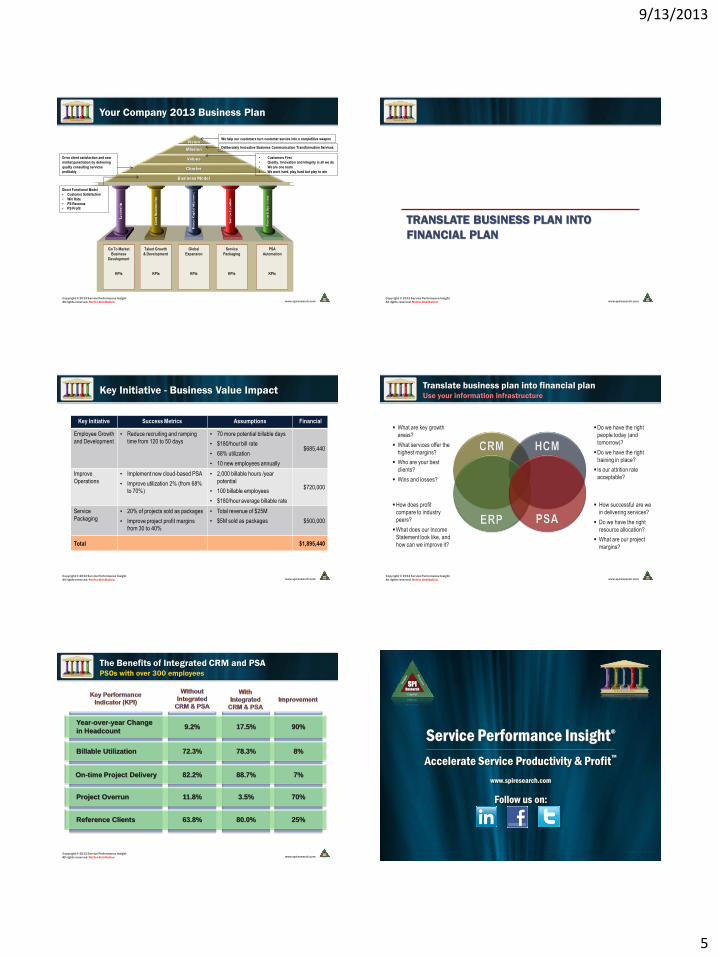
Your Company 2013 Business Plan
Vision
Mission
Values
Charter
Business Model
Talent Growth
& Development
KPIs
Global
Expansion
KPIs
Service
Packaging
KPIs
PSA
Automation
KPIs
Go To Market
Business
Development
KPIs
We help our customers turn customer service into a competitive weapon
Deliberately Innovative Business Communication Transformation Services
• Customers First
• Quality, Innovation and Integrity in all we do
• We are one team
• We work hard, play hard but play to win
Drive client satisfaction and new
market penetration by delivering
quality consulting services
profitably
Direct Functional Model
• Customer Satisfaction
• Win Rate
• PS Revenue
• PS Profit
www.spiresearch.com SPISPI
ResearchResearch
People
People
Pro
cess
Pro
cess
CapitalCapital
Copyright © 2013 Service Performance Insight
All rights reserved. Not for distribution.
TRANSLATE BUSINESS PLAN INTO
FINANCIAL PLAN
www.spiresearch.com SPISPI
ResearchResearch
People
People
Pro
cess
Pro
cess
CapitalCapital
Copyright © 2013 Service Performance Insight
All rights reserved. Not for distribution.
Key Initiative - Business Value Impact
Key Initiative Success Metrics Assumptions Financial
Employee Growth
and Development
• Reduce recruiting and ramping
time from 120 to 50 days
• 70 more potential billable days
• $180/hour bill rate
• 68% utilization
• 10 new employees annually
$685,440
Improve
Operations
• Implement new cloud-based PSA
• Improve utilization 2% (from 68%
to 70%)
• 2,000 billable hours /year
potential
• 100 billable employees
• $180/hour average billable rate
$720,000
Service
Packaging
• 20% of projects sold as packages
• Improve project profit margins
from 30 to 40%
• Total revenue of $25M
• $5M sold as packages
$500,000
Total $1,895,440
www.spiresearch.com SPISPI
ResearchResearch
People
People
Pro
cess
Pro
cess
CapitalCapital
Copyright © 2013 Service Performance Insight
All rights reserved. Not for distribution.
Translate business plan into financial plan Use your information infrastructure
What are key growth
areas?
What services offer the
highest margins?
Who are your best
clients?
Wins and losses?
Do we have the right
people today (and
tomorrow)?
Do we have the right
training in place?
Is our attrition rate
acceptable?
How does profit
compare to industry
peers?
What does our Income
Statement look like, and
how can we improve it?
How successful are we
in delivering services?
Do we have the right
resource allocation?
What are our project
margins?
www.spiresearch.com SPISPI
ResearchResearch
People
People
Pro
cess
Pro
cess
CapitalCapital
Copyright © 2013 Service Performance Insight
All rights reserved. Not for distribution.
The Benefits of Integrated CRM and PSA PSOs with over 300 employees
Billable Utilization 72.3% 78.3% 8%
Project Overrun 11.8% 3.5% 70%
82.2% On-time Project Delivery 88.7% 7%
Reference Clients 63.8% 80.0% 25%
Year-over-year Change
in Headcount 9.2% 17.5% 90%
www.spiresearch.com SPISPI
ResearchResearch
People
People
Pro
cess
Pro
cess
CapitalCapital
Copyright © 2013 Service Performance Insight
All rights reserved. Not for distribution.
SPISPIResearchResearch
People
People
Pro
cess
Pro
cess
CapitalCapital
Service Performance Insight®
Accelerate Service Productivity & Profit™
www.spiresearch.com
Follow us on:
9/13/2013
6
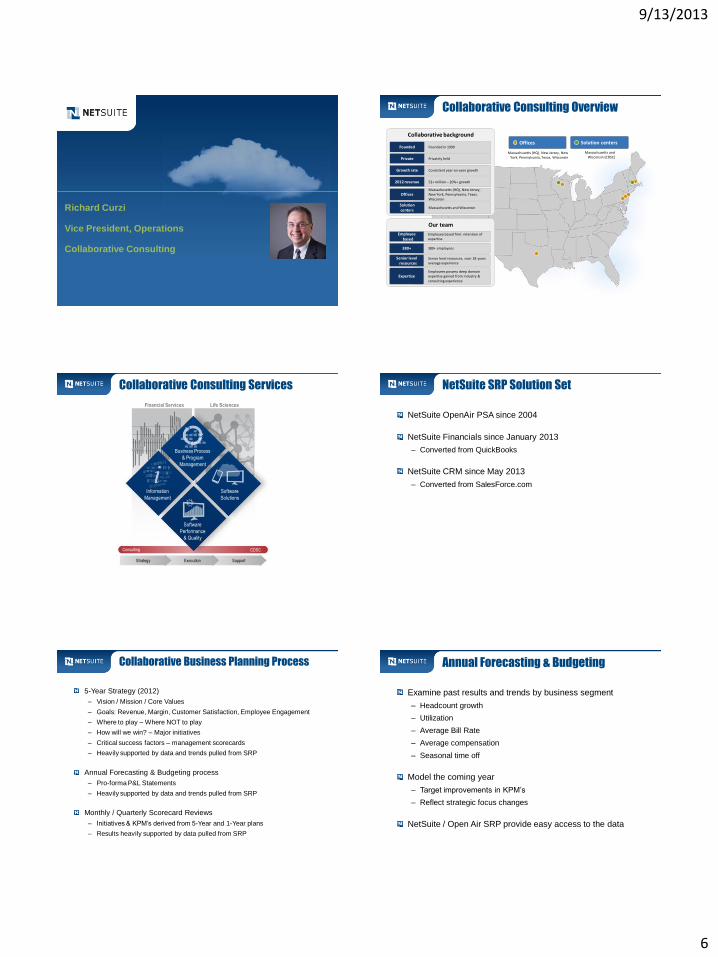
Richard Curzi
Vice President, Operations
Collaborative Consulting
Collaborative Consulting Overview
Offices Solution centers
Massachusetts (HQ), New Jersey, New York, Pennsylvania, Texas, Wisconsin
Massachusetts and Wisconsin (CDSC)
Our team
Collaborative background
Founded in 1999 Founded
Privately held Private
Consistent year-on-year growth Growth rate
52+ million – 20%+ growth 2012 revenue
Massachusetts (HQ), New Jersey, New York, Pennsylvania, Texas, Wisconsin
Offices
Massachusetts and Wisconsin Solution centers
Employee based firm: retention of expertise
Employee based
380+ employees 380+
Senior level resources, over 18 years average experience
Senior level resources
Employees possess deep domain expertise gained from industry &
consulting experience Expertise
Collaborative Consulting Services
Financial Services Life Sciences
Business Process
& Program
Management
Software
Solutions
Software
Performance
& Quality
Information
Management
Consulting CDSC
Strategy Execution Support
NetSuite SRP Solution Set
NetSuite OpenAir PSA since 2004
NetSuite Financials since January 2013
– Converted from QuickBooks
NetSuite CRM since May 2013
– Converted from SalesForce.com
Collaborative Business Planning Process
5-Year Strategy (2012)
– Vision / Mission / Core Values
– Goals: Revenue, Margin, Customer Satisfaction, Employee Engagement
– Where to play – Where NOT to play
– How will we win? – Major initiatives
– Critical success factors – management scorecards
– Heavily supported by data and trends pulled from SRP
Annual Forecasting & Budgeting process
– Pro-forma P&L Statements
– Heavily supported by data and trends pulled from SRP
Monthly / Quarterly Scorecard Reviews
– Initiatives & KPM’s derived from 5-Year and 1-Year plans
– Results heavily supported by data pulled from SRP
Annual Forecasting & Budgeting
Examine past results and trends by business segment
– Headcount growth
– Utilization
– Average Bill Rate
– Average compensation
– Seasonal time off
Model the coming year
– Target improvements in KPM’s
– Reflect strategic focus changes
NetSuite / Open Air SRP provide easy access to the data
9/13/2013
7
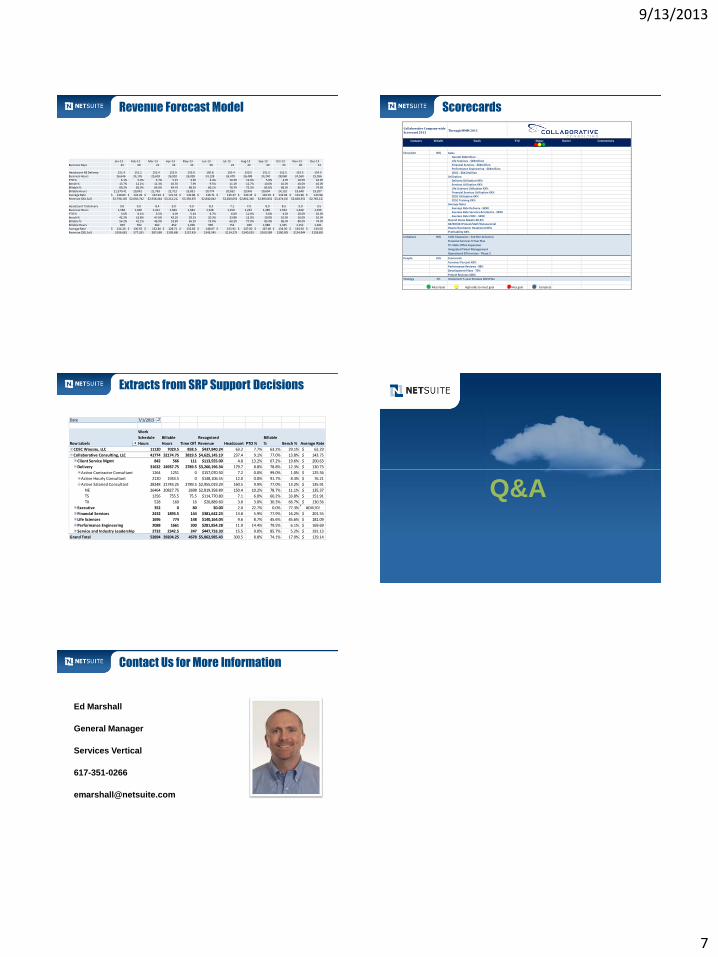
Revenue Forecast Model
Jan-13 Feb-13 Mar-13 Apr-13 May-13 Jun-13 Jul-13 Aug-13 Sep-13 Oct-13 Nov-13 Dec-13 Business Days 22 20 21 22 22 20 22 22 20 23 20 21 Headcount NE Delivery 151.4 151.1 152.4 152.9 153.0 150.8 150.4 150.5 151.5 152.5 153.5 154.5 Business Hours 26,646 24,176 25,603 26,910 26,928 24,128 26,470 26,488 24,240 28,060 24,560 25,956 PTO % 6.1% 5.0% 3.7% 5.1% 3.6% 4.4% 10.2% 12.0% 5.0% 4.0% 10.0% 16.0% Bench % 13.7% 12.1% 11.3% 10.5% 7.9% 9.5% 11.1% 12.7% 10.0% 10.0% 10.0% 10.0% Billable % 80.2% 82.9% 85.0% 84.4% 88.5% 86.1% 78.7% 75.3% 85.0% 86.0% 80.0% 74.0%
Billable Hours 21,370.41 20,042 21,763 22,712 23,831 20,774 20,832 19,945 20,604 24,132 19,648 19,207 Average Rate $ 130.84 $ 132.26 $ 134.93 $ 141.43 $ 140.86 $ 136.71 $ 135.37 $ 140.45 $ 140.45 $ 143.96 $ 143.96 $ 143.96 Revenue (DEL Sal) $2,796,105 $2,650,742 $2,936,444 $3,212,212 $3,356,874 $2,840,042 $2,820,056 $2,801,340 $2,893,832 $3,474,015 $2,828,551 $2,765,127
Headcount TS Delivery 9.0 9.0 8.4 9.0 9.0 8.3 7.1 7.0 8.0 8.5 9.0 9.5 Business Hours 1,584 1,440 1,411 1,584 1,584 1,328 1,250 1,232 1,280 1,564 1,440 1,596 PTO % 3.6% 6.1% 5.5% 4.0% 5.4% 6.7% 6.0% 11.0% 5.0% 4.0% 10.0% 16.0% Bench % 42.2% 52.8% 47.6% 42.2% 29.1% 20.3% 33.8% 12.0% 10.0% 10.0% 10.0% 10.0% Billable % 54.2% 41.1% 46.9% 53.8% 65.5% 73.0% 60.2% 77.0% 85.0% 86.0% 80.0% 74.0%
Billable Hours 859 592 662 852 1,038 969 752 949 1,088 1,345 1,152 1,181 Average Rate $ 124.26 $ 130.55 $ 132.46 $ 128.71 $ 132.83 $ 148.07 $ 151.91 $ 147.60 $ 147.60 $ 134.50 $ 134.50 $ 134.50 Revenue (DEL Sal) $106,681 $77,265 $87,669 $109,686 $137,814 $143,545 $114,276 $140,019 $160,589 $180,908 $154,944 $158,850
Scorecards
Through MMM 2013
Category Weight Goals YTD Status Owner Commentary
Execution 40% Sales
Overall $XXmillion
Life Sciences - $XXmillion
Financial Services - $XXmillion
Performance Engineering - $XXmillion
CDSC - $XX.Xmillion
Utilization
Delivery Utilization XX%
Services Utilization XX%
Life Sciences Utilization XX%
Financial Services Utilization XX%
CDSC Utilization XX%
CDSC Training XX%
Average Rates
Average Rate Delivery - $XXX
Average Rate Services & Industry - $XXX
Average Rate CDSC - $XXX
Overall Gross Margin XX.X%
XX/XX/XX (Project/Staff/Outsourcing)
Hourly/Contractor Headcount XX%
Profitability XX%
Initiatives 30% CDSC Expansion - 2nd Site Selection
Financial Services 5 Year Plan
Tri-State Office Expansion
Integrated Talent Management
Operational Efficiencies - Phase 2
People 25% Scorecards
Turnover Percent XX%
Performance Reviews - 98%
Development Plans - 75%
Project Reviews 100%
Strategy 5% Implement 5-year Strategy 2013 Plan
Meet Goal High odds to meet goal Miss goal Complete
Collaborative Company-wide
Scorecard 2013
Extracts from SRP Support Decisions
Date 7/1/2013
Row Labels
Work
Schedule
Hours
Billable
Hours Time Off
Recognized
Revenue Headcount PTO %
Billable
% Bench % Average Rate
CDSC Wausau, LLC 11120 7029.5 858.5 $437,840.24 63.2 7.7% 63.2% 29.1% 62.29$
Collaborative Consulting, LLC 41774 32174.75 3819.5 $4,625,145.19 237.4 9.1% 77.0% 13.8% 143.75$
Client Service Mgmt 842 566 111 $113,555.00 4.8 13.2% 67.2% 19.6% 200.63$
Delivery 31632 24937.75 2789.5 $3,260,196.34 179.7 8.8% 78.8% 12.3% 130.73$
Active Contractor Consultant 1264 1251 0 $157,070.50 7.2 0.0% 99.0% 1.0% 125.56$
Active Hourly Consultant 2120 1943.5 0 $148,106.55 12.0 0.0% 91.7% 8.3% 76.21$
Active Salaried Consultant 28248 21743.25 2789.5 $2,955,019.29 160.5 9.9% 77.0% 13.2% 135.91$
NE 26464 20827.75 2698 $2,819,358.89 150.4 10.2% 78.7% 11.1% 135.37$
TS 1256 755.5 75.5 $114,770.80 7.1 6.0% 60.2% 33.8% 151.91$
TX 528 160 16 $20,889.60 3.0 3.0% 30.3% 66.7% 130.56$
Executive 352 0 80 $0.00 2.0 22.7% 0.0% 77.3% #DIV/0!
Financial Services 2432 1893.5 144 $381,642.23 13.8 5.9% 77.9% 16.2% 201.55$
Life Sciences 1696 774 148 $140,164.04 9.6 8.7% 45.6% 45.6% 181.09$
Performance Engineering 2088 1661 300 $281,854.28 11.9 14.4% 79.5% 6.1% 169.69$
Service and Industry Leadership 2732 2342.5 247 $447,733.30 15.5 9.0% 85.7% 5.2% 191.13$
Grand Total 52894 39204.25 4678 $5,062,985.43 300.5 8.8% 74.1% 17.0% 129.14$
Q&A
Contact Us for More Information
Ed Marshall
General Manager
Services Vertical
617-351-0266