Embed Size (px)
Citation preview
ORIGINAL PAPER
Five methods to interpret field measurements of energy fluxesover a micro-sprinkler-irrigated mango orchard
A. H. de C. Teixeira • W. G. M. Bastiaanssen
Received: 30 October 2009 / Accepted: 13 December 2010� Springer-Verlag 2010
Abstract Energy balance measurements were carried outin a mango orchard during two growing seasons in thesemi-arid region of Brazil. The actual evapotranspiration(ET) was acquired by eddy correlation (EC) and Bowenratio energy balance (BR) techniques. The daily energybalance closure in the EC measurements showed an aver-age gap of 12%, with a root mean square error (RMSE) of1.7 MJ m-2 d-1. Three different correction procedureswere tested for closing the energy balance from the ECsystem: (1) the surface energy balance residual method(RES), (2) the Bowen ratio determined from the EC ßuxes,the combination approach (EC_BR), and (3) a newregression energy balance closure technique (REG). Allclosing energy balance methods presented good correlationwith the direct EC measurements, but the trends were notsimilar. The latent heat ßuxes estimated by the BRmethodÑkEBRÑwere higher than those from the directEC measurementsÑkEEC. When using the RES method,the half-hourkEEC measurements represented around 88%of thekERES values, as the uncertainties of net radiationÑRnÑand soil heat ßuxesÑG—are propagated into the RES
method. The latent heat ßux derived from the combinationapproachÑkEEC_BRÑalso brings these uncertainties, beingthe agreements comparable with those for RES method. Itwas therefore concluded that a single correction method forEC measurements considering only the latent and sensibleheat ßuxes does not exist. A new way to solve the lack ofenergy balance closure from EC techniques was tested bymeans of a curve Þtting, the REG method. Considering theREG corrections applied to the energy balance componentsinvolving all periods of the day and the average conditionsof the two growing seasons, half-hour values ofkEEC wereovermeasured by 18%,HEC was undermeasured by 17%,and G values required a correction of 466%. The REGmethod appeared promising because it considers differentweights for all energy balance components in the optimi-zation process. Taking the REG results for the drier secondgrowing season as a reference, it was concluded that sea-sonal ET values by the other methods in mango orchardranged from 7 to 28% higher, showing that turbulent ßuxmeasurements lack accuracy for executing on-farm water-saving programmes and calibrating transient soil waterßow models.
Introduction
Actual evapotranspiration (ET) from irrigated crops isreceiving renewed attention because of the increasingcompetition of crop water use with other sectors. Reductionin ET in irrigation systems is thought to be a viable solutionfor achieving water savings in overexploited river basins(Bastiaanssen et al.2008; Teixeira2009). DeÞcit irrigationexperiments saves water, enhances stream ßow and doesnot necessarily affect crop production (Fereres and Soriana2007).
Communicated by S. Ortega-Farias.
A. H. de C. Teixeira (&)Embrapa Semia«rido, P.O. Box 23, Petrolina,PE 56302-970, Brazile-mail: [email protected]
W. G. M. BastiaanssenWaterWatch, Generaal Foulkesweg 28,6703 BS Wageningen, The Netherlands
W. G. M. BastiaanssenDelft University of Technology, Stevinweg 1,2600 GA Delft, The Netherlands
123
Irrig SciDOI 10.1007/s00271-010-0256-y
The highest yield levels per unit of water use (kg m-3)are obtained at mild water stress conditions, and to estab-lish these conditions, it is Þrst necessary to know actual andpotential ET. Modelling of ET processes is therefore get-ting new impetus; hydrological, soil physical and remotesensing models are used to determine optimum levels ofwater use (Bastiaanssen et al.2007). All these advancedmodels require careful calibration and validation with Þelddata (e.g. Ahmad et al.2002; Droogers et al.2010). Stan-dardized and simpliÞed methods for crop ET computationssuch as described in FAO 56 (Allen et al.1998) requireexperiments over extend periods of time. Many of themhave shown accurate results in a wide range of agriculturalsituations. However, their application to sparse crops likeorchards is generally more difÞcult than for uniform Þeldcrops.
In the widely recognized energy balance non-closureproblem in eddy correlation (EC) systems, few intercom-parisons have focused on the role of data-processingschemes between EC measurements and the forcing clo-sure methods in irrigated orchards. Some research in dif-ferent kind of vegetation has shown that differences arereduced if the components of the energy balance areaveraged over longer time periods (Dugas et al.1991;Unland et al.1996; Spano et al.2000; Beringer and Tapper2000; Olejnik et al. 2001; Azevedo et al.2003; van Dijket al. 2004a, b; Ortega-Farias et al.2007; Simmons et al.2007). However, all components of the simpliÞed energybalance equation have their own source of errors, beingimportant to apply a method where the additional correc-tions for net radiation (Rn) and soil heat ßux (G) areincluded when considering short timescale (Allen2008).
Traditionally, ET has been measured with lysimetery(Doorenbos and Pruitt1977; Wright 1982; Jensen et al.1990; Allen et al.1998). For orchards, the size of the treesand the need to sample a representative area means thatlysimeters are not practical. Due to large rooting depths,the ET measurements in trees are very difÞcult to be madewith weighing lysimeters and soil water balance. There areconsiderable uncertainties related to the measurements ofthe soil depth affected by root water uptake, percolation,runoff and capillarity rise (Teixeira et al.2008a). Accord-ing to Rana et al. (2005), the use of the soil water balanceto determine ET is not ideal, especially in the case of sparsecrops and in regions subjected to semi-arid climates. Insome occasions, transpiration can be measured directlywith the heat pulse velocity-sap ßow technique, which hasbeen applied in vineyards (e.g. Yunusa et al.2004) andolive groves (e.g. Testi et al.2006). This method togetherwith soil evaporation measurements may give good results,but in orchards, it is affected by individual tree variabilityand the upscaling from trees to a stand or block isproblematic.
During the twenty-Þrst century, lysimeters have beenreplaced by several micro-meteorological techniques forET calculations, being the use of EC systems the mostcommon (Wilson et al.2002), which directly measure thelatent (kE) and sensible (H) heat ßuxes. Examples of theirapplications in agricultural and natural ecosystems arepublished by Oliver and Sene (1992), Sene (1994), Tram-bouze et al. (1998), Ohta et al. (2001), Cleverly et al.(2002), Wilson et al. (2002), Humphreys et al. (2003),Lund and Soegaard (2003), Prueger et al. (2004), Vilalol-obos et al. (2004), Testi et al. (2004), Simmons et al.(2007), Hiyama et al. (2007), Teixeira et al. (2008a, b).According to all these EC results, the energy balance isusually not closed, which poses a serious problem forachieving progresses in the general knowledge of crop ETvariability.
The lack of the energy balance closure in EC systemscan be related to malfunctions of the sensors during rainfallconditions; instrumental maintenance; neglected energysinks; heat storage in the top soil; loss of low and/or highfrequency contributions to the turbulent heat ßuxes;advection of scalars; different correction algorithms used toprocess the data; ßux divergence in the boundary layer;non-uniform footprint; non-representative sensing ofRn
and G; proper average times; and when neglecting of theenergy stored in the tree canopies for accounting for theavailable energy partitioning (Paw et al.2000; Baldocchiet al. 2001; Scott et al.2003a, b; Papale et al.2006; Wolfet al. 2008; Castellvi et al. 2008). Yet, after applyingalgorithms for general corrections tokEEC andHEC, energybalance closure errors still remain in the other energybalance components (Allen2008).
The Bowen ratio (BR) method forces the energy balanceclosure and requires cheaper instruments than EC systems.BR measurements are very useful whenkE and H cannotbe measured directly. Examples of applications of BRmethod are found in Heilman et al. (1996), Ahmad et al.(2002), Inman-Bamber and McGlinchey (2003), Lee et al.(2004), Teixeira et al. (Teixeira et al.2007, 2008b), andSavage et al. (2009). Other advantage of the BR methodover EC measurements is its ease of use, as the simpletheoretical basis requires relatively modest instruments.The BR ßuxes are obtained, however, from indirect mea-surements, and the high degree of turbulent mixing oversparse crops promotes small temperature and humiditygradients demanding high measurements resolution andaccuracy. Another important disadvantage is that theuncertainties ofRn and G measurements are propagatedinto the BR method.
The assumption of the similarity for the diffusion coef-Þcients for heat (Kh) and vapour (Kv) is implicitly imbeddedin the BR technology. An earlier study from Denmead andMcIlroy (1970) showed that the assumption ofKh = Kv is
Irrig Sci
123

acceptable for neutral to moderately unstable conditionsover smooth surfaces; however, Verma et al. (1978)reported data evidencingKh[ Kv for stable conditions. Atnight or under advective conditions, the negative values forBowen ratio promote large relative error in the energyßuxes resulting in inaccuracies of ET values. In addition,the BR technique is not suitable for dry areas, and thesimpliÞed energy balance equation, frequently used, statesthat Rn is redistributed overHBR, kEBR andG, consideringonly vertical ßuxes, ignoring the net rate at which energy isbeing transferred horizontally by advection and the heatstored or released in the canopies. These terms can besigniÞcant near the edges of tall trees, mainly in irrigatedcrops in semi-arid regions (Teixeira2009).
According to Tanaka et al. (2008), estimation errors inenergy balance components due to fetch problem or foot-print discrepancy have been reduced with the advances indiagnostic procedures and technology. The measurementsare usually done at one location that must be sufÞcientlydownwind of any signiÞcant changes in the surface char-acteristics to allow development of the internal boundarylayer to a depth greater than the top measurement heightand to smooth out the effect of local surface heterogeneity.More essential sources of error might be the large-scaleatmosphere mixing due to the night-time ßux drainage andthe daytime turbulent organized structure, although night-time drainage being less important because of the smallinput of Rn. During the night, as the air temperature andvapour pressure gradients are small, it is expected thatlarger errors occur when using BR systems than for day-time periods.
Alternative ways to force the energy balance closure inEC measurements have been studied in this paper withadditional measurements ofRn andG: the residual (RES);the combination (EC_BR); and the regression (REG)methods. In the case of RES method,kE is obtained as aresidual in the energy balance equation after measuringdirectly H (Simmons et al.2007; Castellvi et al.2008). Theadvantage of the RES method is thatkEREScan be obtainedwithout expensive instrumentation for water vapour mea-surements, such as the application of the surface renewalmethod (Castellvi et al.2008). By using the EC_BRmethod, after the EC measurements ofkE andH, the Þrstenergy ßux is recomputed by the Bowen ratio of the ßuxes(Twine et al. 2000; Chehbouni et al.2006). The REGmethodÑto our knowledge Þrst introduced by Allen(2008)Ñis based on a regression equation betweenRn andthe other energy balance terms providing weighting foreach energy balance component.
One EC and one BR systems were set up to measure theenergy ßuxes in a micro-sprinkler-irrigated mango orchardin the Brazilian North-east. Growing of irrigated fruit cropsin the semi-arid conditions of this region is important for
the livelihoods of rural communities where water resourcesare strained. This paper compares Þve different energybalance interpretation and measurements, and the overallaccuracy of the measured and estimated ET ßuxes isinvestigated for different rainfall conditions. The perfor-mances of EC and BR techniques are evaluated, and thereasons for the lack of energy balance closure in the ECsystem and adjustments are discussed. The effects offorcing the latent and sensible heat ßuxes from the ECsystem to match the available energy are examined. It isdemonstrated that ET ßuxes from the different methodsand measurements are associated with considerableuncertainty.
Materials and methods
Measurement site and orchard conditions
A Þeld measurement campaign was carried out from 2003to 2005 in a mango orchard located in the semi-arid regionof the Pernambuco State, Brazil, in Petrolina city (09�220S,40�340W). The area at 370 m above the sea level has anaverage value for the total annual precipitation (P) and panevaporation of 570 and 2,700 mm, respectively, at a meanair temperature (Ta) of 26.5�C. The warmest month isNovember (averageTa of 28.2�C) when the sun is in thezenith position at low cloud cover conditions. The coldestmonth is July (averageTa of 24.2�C) at winter solstice inthe southern hemisphere. Despite the relatively smallthermal annual amplitude, due to the proximity of theequator, the increase inTa together with higher levels ofglobal solar radiation (RG) during the hottest periods of theyear affects crop ET. The annual thermal homogeneitystrongly contrasts with the spatial and temporal heteroge-neity of the rainfall regime. The rainy period is concen-trated from January to April, representing 68% of theannual amount, with water deÞcits in the climatic waterbalance along the year (Teixeira2009).
The mango cultivar isTommy Atkins, 18 years old in2003, with the trees spaced in a regular square pattern of10 m 9 10 m. The trees presented an average height of5.5 m, a mean leaf area index (LAI) of 5.6 and were prunedto a pyramidal and erect canopy, over an area of 11.92 habordered on all sides by other mango crops with similarheight that matches fetch requirements. The mango treesundergone vegetative growth between November andJanuary, followed by branch maturation from January toMay, ßowering from May to July, with fruit initiationbetween June and July. Fruit growth occurred from July toAugust, maturing during August and September beingharvested between September and October. The sandy soilis classiÞed as Latossoil Red-Yellow with low water
Irrig Sci
123

retention capacity, with the groundwater depth approximately2.5 m, and the farm is located 5,500 m away from the banks ofthe Sa÷o Francisco River (Teixeira et al.2008a).
The orchard was daily micro-sprinkler-irrigated withone in-line micro-sprinkler between two trees on theground and a discharge rate of 44 l h-1, which wetted 70%of the soil surface. The irrigation water requirements werecalculated based on reference evapotranspiration and cropcoefÞcients yielding to seasonal totals of 675 and1,195 mm (1.7 and 3.2 mm d-1) during the Þrst and sec-ond growing seasons, respectively. The differences inwater applications were due to different rainfall amountsfor the growing seasons. The study comprised two growingseasons including the previous post-harvest stage. Theduration of the Þrst period was 390 days, from 01 October2003 (Day 274) to 24 October 2004 (Day 298). The mea-surements continued into a second period of 370 days,from 25 November 2004 (Day 299) to 29 November 2005(Day 302).
Orchard energy balance
The sensors were installed at the centre of the study plot.All energy balance components were measured. Both ECand BR systems were used simultaneously (Fig.1).
The EC system used determines the sensible (HEC) andlatent (kEEC) heat ßuxes by a three-axis sonic anemometer(Model CSAT3, Campbell ScientiÞc, Logan, UT, USA)and a krypton hygrometer (Model KH20, Campbell Sci-entiÞc, Logan, UT, USA), respectively, both connected to adatalogger (model CR10X, Campbell ScientiÞc, Logan,UT, USA). The EC sensors were installed at a height of8.5 m from the ground above the crowns of a row of trees,with a horizontal separation of 0.15 m and a samplingfrequency of 16 Hz. The ßuxes were computed for 30 minperiods and later summed to give daily totals.
For the BR method, the gradients of air temperature andvapour pressure were calculated using wet and dry
thermocouples of copper/constantan at 1.0 and 3.0 mabove the canopy positioned to the predominant south-westwind directions (Fig.1). Rn was acquired with one netradiometer (model NR-Lite, Kipp & Zonnen, Delft, TheNetherlands) above a row of trees at a height of 7.5 m.Previous experiments with fruit crops have shown that nobig differences arise by using one sensor or two above andbetween rows for determination ofRn in row crops(Teixeira et al.2007). G was measured by two soil heat ßuxplates (model NR-Lite, Kipp & Zonnen, Delft, The Neth-erlands) at 2 cm soil depth and below the projected treecrown at 100 cm from the trunk. The plates were buried atthe west and east sides of a row of trees, and the values ofG were taken as the average of the two measurements,being not corrected for the heat storage above the plates.Heusinkveld et al. (2004) have shown that when the ßuxplates are close to the surface, corrections for heat storageare not necessary. Additional routine measurements ofRG,Ta, P, relative humidity (RH) and wind speed (u) were alsodone over grass by an agro-meteorological station located500 m from the orchard.
Rn, G andTa in the experimental plot were measured ateach 5-s interval, and averages of 10 min were stored in adatalogger (model CR10X, Campbell ScientiÞc, Logan,UT, USA) equipped with a multiplexer (model AM416,Campbell ScientiÞc, Logan, UT).
The energy ßuxes can be expressed by the simpliÞedenergy balance equation:
Rn � kE � G� H ¼ 0 ð1Þ
where all terms of Eq.1 can be in W m-2 or MJ m-2 d-1
being either positive or negative. PositiveRn means energyßux to the surface and positiveG, kE andH indicate ßuxesof energy from the surface.
Using data from the EC system, the latent (kEEC) andsensible (HEC) heat ßuxes were calculated, respectively, bythe following equations:
kEEC ¼ kw0q0v ð2Þ
HEC ¼ qacpw0T 0a ð3Þ
wherekEEC and HEC are in W m-2, k is the vaporizationlatent heat (J kg-1), w0 is the instantaneous deviation ofvertical wind speed in relation to mean value (m s-1), qv
0 isthe instantaneous deviation of water vapour density inrelation to the mean value (kg m-3), qa is the air density(kg m-3), cp is the air speciÞc heat at constant pressure(J kg-1 K-1) and Ta
0 is the instantaneous deviation of airtemperature in relation to mean value (�C). The quantitiesw0T 0a andw0q0vare the covariances between the vertical windspeed and air temperature and the vertical wind speed andwater vapour density, respectively. The bars indicateaverages (Stull1998).
Fig. 1 Energy balance measurement systems in mango orchard,Petrolina-PE, Brazil
Irrig Sci
123

A number of corrections to EC data have been proposedin literature. For this research, the ECPack from Wagen-ingen University was applied (van Dijk et al.2004a, b),which includes the following corrections:
1. Coordinate rotation of the 3D sonic wind speed vectors.Covariance is rotated to a natural coordinate system topartially consider the assumption that the measurementsrepresent the ßux perpendicular to the surface out of anominal control volume deÞned at its top by the sensorand neglecting horizontal divergence so that the systembecomes one-dimensional. The planar Þt method isapplied by the software (Wilczak et al.2001).
2. Corrections due to density variations introduced byßuctuations of temperature and moisture content of airin updrafts and downdrafts which create spuriousßuxes when air is measured volumetrically (Webbet al. 1980).
3. Oxygen absorption. Krypton hygrometers are used tomeasure the water vapour content of the air byabsorption of H2O molecules in the ultraviolet spec-trum. Due to the used wave length, there is a cross-sensitivity to O2 molecules, which is corrected (Tanneret al. 1993).
4. Frequency losses. The turbulent ßux density can bemeasured using eddy correlation, provided that ßuctua-tions in the frequency range in which turbulent transporttakes place are all sensed. In practice, this condition ishardly met due to a limited frequency response of thesensors and the data acquisition system; averaging over apath rather than taking a point value; separation betweensensors for different quantities; and Þltering applied. Foreach of these effects, a theoretical co-spectral transferfunction is computed (Moore1986).
The latent heat ßux according to the BR method (kEBR)was calculated as follows:
kEBR ¼Rn � G
1þ bð4Þ
The related sensible heat ßux in the BR method (HBR)was computed as:
HBR ¼Rn � G
1þ 1=bð5Þ
wherekEBR, HBR, Rn andG are in W m-2, and assumingthat the eddy diffusivities for heat (KH) and water vapour(Kv) are equal,b, the Bowen ratio, can be expressed as:
b ¼ cDT
De
� �ð6Þ
andc is the psychometric constant (kPa�C-1), DT (�C) thevertical temperature gradient measured by the dry ther-mocouples andDe (kPa) is the vertical water vapour
pressure gradient measured by the difference between dryand wet thermocouples over the height interval above thecanopy surface.
In addition to these ÔstandardÕ measurements, twoforcing energy balance closure methods were employed toestimate the latent heat ßux from EC data: the residual(kERES) and the combination (kEEC_BR) methods:
kERES¼ Rn � HEC� G ð7Þ
kEEC BR ¼Rn � G
1þ bEC; bEC ¼
HEC
kEECð8Þ
where all energy ßuxes are in W m-2.The daily actual evapotranspiration ET24 (mm d-1) was
obtained from the 24-h average latent heat ßuxkE24
(W m-2), the latent heat of vaporizationk (J kg-1) and thedensity of waterqw (kg m-3), throughout the differentmethods:
ET24 ¼ 8:64� 107kE24
kqw
ð9Þ
Quality control for the energy balance data
The deviation of BR, RES and EC_BR results from directEC measurements can be ascribed to inaccuracies inRn andG data. In irrigated areas under semi-arid conditions,Rn ismost likely to be accurate.G measurements can affectconsiderably the energy balance for short timescale but donot inßuencekE values in direct EC measurements.
Missing EC-basedkE data from the krypton hygrometerand missing BR-basedkE data from instrumental problemsand small temperature gradients during the rainy periodswere Þlled by the relationship between (HEC ? kEEC) andthe available energy (Rn ? G) for the lack ofkEEC mea-surements and by the relation ofkEBR with (Rn ? G) to ÞllkEBR data gaps (Teixeira et al.2008a). Footprint modelswere not necessary because the energy ßuxes at 8.5 melevation were surrounded by more than 850 m of hom-ogenously irrigated mango plantations in all directions (i.e.1:100 rule applies), as the plot of 11.92 ha was in the centreof a big commercial farm with 140 ha of mango orchardsand with a predominant south-east wind direction, therewas an upwind fetch of about 1.5 km. After gap Þlling, thecomplete energy balances for the entire growing seasonscould be derived.
Many research tried to explain and solve the problem ofthe lack of energy balance closure in EC systems. Wilsonet al. (2002) summarized results from 22 ßux sites ofmeasurements and indicated a general lack at most of thesites, with a mean imbalance of about 20%. This problemwas also reported by Twine et al. (2000), Pacüo et al. (2006)and Testi et al. (2006), which can be associated withinaccurate measurements ofRn andG, but not completely
Irrig Sci
123

explained by these inaccuracies, because EC systems havetheir own sources of error (Twine et al.2000). FollowingAllen (2008), the lack of the closure in EC data can besolved by using a simple regression method that accountsfor all sources of errors, assuming thatRn is the mostaccurate energy balance component in the semi-arid con-ditions. This approach does not favour one particularmethod and contains less assumptions; it just creates acorrection on the basis of the best Þt of independentlycollected Þeld data:
Rn ¼ c0 þ c1Gþ c2kEECþ c3HEC ð10Þ
Equation10 (all components in W m-2) was applied tohalf-hour EC data with speciÞc coefÞcients for daytimesand night-times, being an attractive solution based on thebest statistical agreements of all ßuxes, which ensures theenergy balance closure providing unequal weighting of differentmeasurements, depending on the variable uncertainty of eachenergy ßux term.
Results and discussion
Weather conditions
Figure2 shows the daily averaged weather variables duringthe two growing seasons of the mango orchard studied. Theroutine data collected by an automatic agro-meteorologicalstation includeRG, Ta and relative humidity (RH), andwind speed (u) above an irrigated grass surface for thereference evapotranspiration (ET0) calculations.
The Þrst growing seasonÑGS1Ñwith an averageRG of21.8 MJ m-2 d-1, presented higher atmospheric demandthan the second oneÑGS2 (20.2 MJ m-2 d-1). AlthoughGS1 was wetter than GS2,RG was larger outside the rainyperiod for the Þrst growing season than for the second.
The mean 24 hTa reached its maximum value fromOctober to December at approximately 29.5�C. Minimumvalues occurred during JuneÐJuly (around 22.5�C). Thevalues for vapour pressure deÞcit (D) calculated for eachhalf hour, and averaged for 24 h, presented the sametemporal behaviour asTa throughout the growing seasons.
Average values of u at 3 m above the grass Þeld at theagro-meteorological station were highest from July toNovember (around 3.6 m s-1) and lowest from January toApril (around 0.8 m s-1) for both growing seasons. The uvalues from the sonic anemometer over the mango orchardwere 12% greater than over grass due to the aerodynamicproperties of the tall mango trees.
Precipitation in the region is concentrated in the periodfrom January to April with a long-term annual value of570 mm. The year 2004 was, however, unusually wet. Theaccumulated rainfall from October 2003 to October 2004was 887 mm, while from November 2004 to November2005, it was only 380 mm.
Energy balance closure
The closure of the EC system measurements was analysedfor the two growing seasons of the mango orchard at adaily timescale (Fig.3). At this timescale analyses, theerrors in G measurements due to the variation in soil
20.0
22.4
24.8
27.2
29.6
32.0
0.0
7.0
14.0
21.0
28.0
35.02003-04 2004-05
0.0
0.6
1.2
1.8
2.4
3.0
Oct Jan Apr Jul Oct Oct Jan Apr Jul Oct0.0
0.8
1.6
2.4
3.2
4.0
Months of the year
Glo
bal s
olar
rad
iatio
n (M
J m
-2d-
1 )
Mea
n ai
r te
mpe
ratu
re (
oC
)
Wat
er v
apou
r pr
essu
re (
kPa)
Win
d sp
eed
(m s
-1)
)b((a)
)d()c(
(b)
(d)(c)
Fig. 2 Daily values of weathervariables during the studyperiod 2003 to 2005:a globalsolar radiationÑRG, b mean airtemperatureÑTa; c watervapour pressureÑD, d windspeedÑu
Irrig Sci
123

moisture and shadows of the canopy are reduced. The ratioof turbulent energy ßuxes to the available energy was 88%on average, with a root mean square error (RMSE) of1.7 MJ m-2 d-1, which is close to the lower limit of therange of 10Ð30% commonly found in the literature. As aÞrst guess, eitherHEC or kEEC (or a combination of them)could not be so reliable, because the EC measurementsreßect errors from the system itself, mainly caused by rain;however, uncertainties also arise onRn and G measure-ments. Another aspect is that the energy storage in thecanopies was not accounted in the available energy, whichcan be a source of error in mango tress which present largeamount of branches and leaves. Depending on the timescales, the positive and negative values during days andnights of the energy ßuxes can also inßuence these errors,making it important to analyse the effect of differentmethods of measurements and interpretation on thesevariations.
Comparison of methods and data quality
The sensible heat ßuxes as obtained from the EC mea-surements and BR method were Þrstly compared. The
relation for half-hour values involving all periods of theday during the two growing seasons of the mango orchardis shown in Fig.4. The agreement was moderately good forboth seasons, with general lower values for the BR method,but a considerable scatter is noticed. Lower scatter wasobserved in Fig.3, and as a Þrst guess, it is therefore likelythat the BR measurements could be less reliable.
Considering both growing seasons, half-hourHEC valueswere 25% higher than those forHBR. An underestimationof HBR could be ascribed to inaccuracies inRn and/orG measurements, however, as the sonic anemometer is alsonot free of errors; an overmeasurement ofHEC could alsobe possible, mainly in conditions of high wind speed whichby advection brings the hotter air from the dry areas at thevicinities of the mango orchards. On the other hand, theclosure ratio, being 0.88 on average, can suggest thatHEC
could be higher to meet the available energy, which rein-forces a possible systematic underestimation inHBR values,mainly for the Þrst growing season due to more densecloud cover and rainfall inducing lower temperature gra-dients. For the drier second growing season, it is evidentthat the scatter of the sensible heat ßuxes from EC and BRsystemsÕ relation is larger for the higher values, which
HEC EEC = 0.90(Rn + G)
R2 = 0.92
0
4
8
12
16
20HEC EEC = 0.86(Rn + G)
R2 = 0.85
0 4 8 12 16 20 0 4 8 12 16 20H
EC
+
EE
C(M
J m
-2d-1
)
1:1 1:1HEC EEC = 0.90(Rn + G)
R2 = 0.92
HEC EEC = 0.86(Rn + G)
R2 = 0.85
1:1 1:1
50-400240-3002
HEC EEC = 0.90(Rn + G)
R2 = 0.92
HEC EEC = 0.86(Rn + G)
R2 = 0.85
1:1 1:1HEC EEC = 0.90(Rn + G)
R2 = 0.92
HEC EEC = 0.86(Rn + G)
R2 = 0.85
1:1 1:1
50-400240-3002
Rn - G (MJ m -2 d-1)
Fig. 3 Relationship betweenlatent (kEEC) plus sensible(HEC) heat ßuxes from the eddycorrelation system and theavailable energy (Rn - G) atdaily timescales (24 h): Þrstgrowing season (2003Ð2004);second growing season(2004Ð2005)
Fig. 4 Comparison between thevalues of sensible heat ßuxesobtained by the eddy correlationsystem (HEC) and those from theBowen ratio method (BR): Þrstgrowing season (2003Ð2004);second growing season(2004Ð2005)
Irrig Sci
123

occur during daytime periods. As different errors existaccording to the time of the day, the diurnal behaviour wasalso analysed. Figure5 shows the variation ofHEC andHBR during different times of the day; half-hour averagedvalues over the Þrst and the second growing seasons of themango orchard were used.
Figure5 conÞrms the highest differences between thetwo systems around midday. The accuracy of BR methodincreases with more developed gradientsDT andDe, whichoccurred during the drier and hotter conditions. Duringrainfall periods,DT is difÞcult to measure andb becomesmore uncertain. While for the second growing season, thevalues ofHBR represented 73% ofHEC, in the Þrst one,HBR accounted for 63% ofHEC. The lower differencesbetween methods occur between 07.00 and 09.00 h in themorning and 15.00Ð17.00 h in the afternoon, situationswhen the surface is, respectively, receiving and releasingsolar energy. One reason for the less negativeHBR valuesduring the night could be situations ofKh[ Kv for stableand advective conditions, making the assumption of simi-larity between these coefÞcients to deviate (Verma et al.1978).
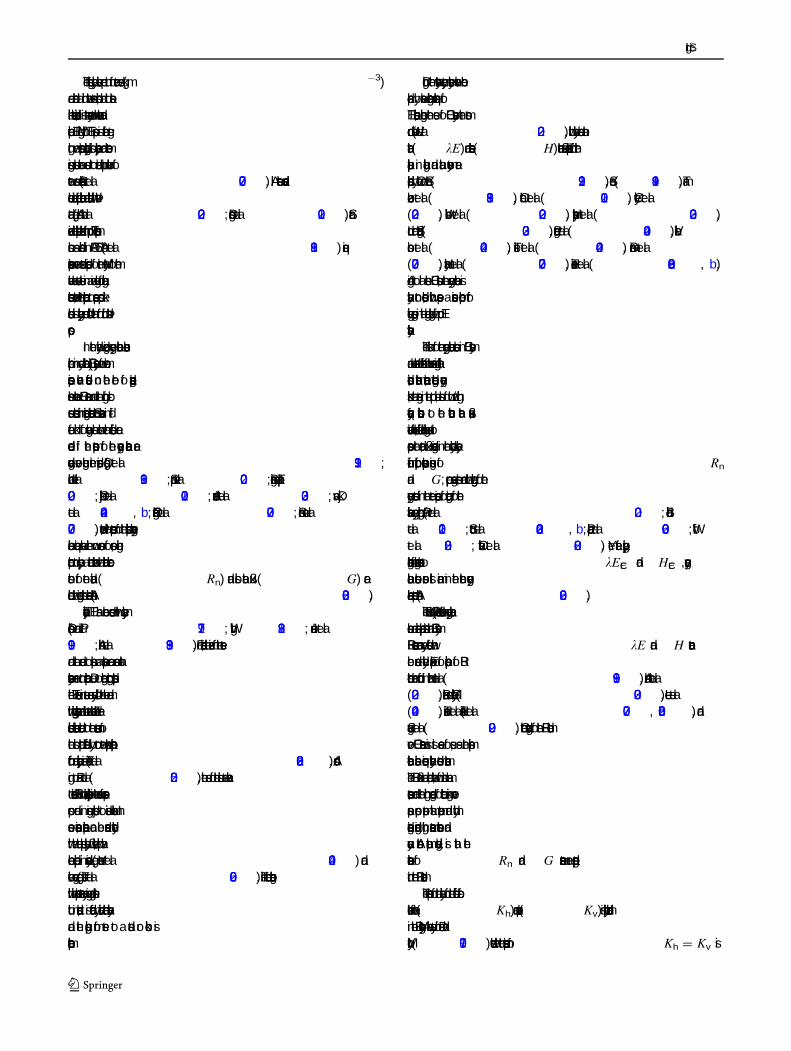
Figure6 shows that the agreement of latent heat ßuxesbetween EC measurements and BR method was moresatisfactory than for sensible heat ßuxes, even with an ECundermeasurement of 20% in relation to BR method. TheBR values were higher than those for EC measurementsdue to the complementary relationship betweenHBR andkEBR, with the correlation between the two techniques(R2 = 0.95) being substantially higher than for the sensibleheat ßux (R2 = 0.78). Since bothkEBR andHBR are basedon b that close the energy balance, there is the possibilitythatHEC could be overmeasured andkEEC undermeasured.The high correlation betweenkEBR and kEEC suggests,however, thatkEEC is less wrong thanHEC, and it couldpossibly pinpoint thatHEC is one of the uncertain param-eters. As for the sensible heat ßuxes, different errors in theEC and BR systems for the latent heat ßux measurementsarise according to the time of the day, being evidenced by
the largest distances from the line 1:1 for the higher valuesof the relation depicted in Fig.6.
The diurnal behaviours ofkEEC andkEBR are shown inFig. 7. Half-hour averaged values over the Þrst and thesecond growing seasons of the mango orchard were used. Itis conÞrmed thatkEEC values agree very well withkEBR
values and that the largest differences occur during midday,whenkEBR is 35% greater thankEEC. As the temperatureand vapour pressure gradients used forb calculations (seeEq. 6) are most strongly developed during noon, this issomewhat unexpected as this parameter can be measuredwith more accuracy than during the early morning or lateafternoon. An overestimation ofkEBR at noon could be inpart a consequence of advective effects at this time of theday under well-irrigated conditions in a semi-arid region.As for the sensible heat ßuxes, the lowest differencesoccurred between 07.00 and 09.00 h in the morning and15.00Ð17.00 h in the afternoon.kEBR was 24 and 22%higher thankEEC, respectively, for the Þrst and secondgrowing seasons. Seasonal differences are mainly due tothe fact that in the BR method, the closure of the energybalance is forced in addition to the assumption of thesimilarity between sensible and latent heat turbulent dif-fusion coefÞcients in the energy balance equations.
Dugas et al. (1991) comparing four BR systems andthree EC systems in an irrigated wheat Þeld in Arizona(USA) foundedHEC values being 82 and 69% ofHBR,during 2 days of measurements, respectively, whilekEEC
values were 77 and 67% ofkEBR. The differences intheir latent heat ßux measurements were comparable withour results for the irrigated mango orchard, althoughthe inverse situation occurred for the sensible heat ßuxvalues, supporting a possible overestimation of ourHEC
measurements.In the case of using the RES method for forcing the
energy balance closure, the sensible heat ßuxes wereacquired with the sonic anemometer together with addi-tional measurements ofRn andG. kERESwas then obtainedas a residual in the energy balance (see Eq.7). Figure8
-100
-40
20
80
140
200
EC
BR
0 2 4 6 8 10 12 14 16 18 20 22 24 0 2 4 6 8 10 12 14 16 18 20 22 24
Sen
sibl
e he
at fl
ux (
W m
-2)
Local time
2SG1SG2003-04 2004-05
Fig. 5 Diurnal trend for thesensible heat ßux during the Þrst(2003Ð2004) and the second(2004Ð2005) growing seasonsfor the mango orchard.Averaged half-hour values forthe eddy correlation (EC) andthe Bowen ratio (BR) systemswere used
Irrig Sci
123
shows the results of the relationship forkEEC and kERES
values taking half hour measurements, which presentedlower scatter than for BR method. In agreement with thelack of the energy balance closure in the EC system, thekEEC represented around 88% ofkERES which could be anindication of an overestimation ofkERES or an undermea-surement ofkEEC. Whatever is right, this evidences the factthat both BR and RES methods, closing the energy balance,
provide an uncertainty of more than 10% in the Þnal ETmeasurements. Simmons et al. (2007), using EC measure-ments and the RES method over a ßood-irrigated pecanorchard during two growing seasons in New Mexico,reported that for the daily values there was an undermea-surement ofkEEC within 8% for both growing seasons. Intheir study, the method presented fewer problems inG accuracy at short timescale, because if the surface is
Fig. 6 Comparison betweenvalues of latent heat ßuxesobtained by eddy correlationmeasurements (kEEC) withthose from Bowen ratio method(kEBR): Þrst growing season(2003Ð2004); second growingseason (2004Ð2005). Halfhourly values are depicted
-120
0
120
240
360
480
EC
BR
0 2 4 6 8 10 12 14 16 18 20 22 24 0 2 4 6 8 10 12 14 16 18 20 22 24
Late
nt h
eat f
lux
(W m
-2)
Local time
2SG1SG2003-04 2004-05Fig. 7 Diurnal trend for thelatent heat ßux during the Þrst(2003Ð2004) and the second(2004Ð2005) growing seasonsfor the mango orchard:Averaged half-hour values forthe eddy correlation (EC) andthe Bowen ratio (BR)measurements are depicted
Fig. 8 Comparison between thevalues of latent heat ßuxesobtained by the eddy correlationmeasurements (kEEC) withthose from residual method(kERES): Þrst growing season(2003Ð2004); second growingseason (2004Ð2005). Halfhourly values are depicted
Irrig Sci
123

ßooded, the spatial distribution of this energy balancecomponent is more homogeneous.
Earlier and actual results for BR and RES methods aresomewhat disappointing if these Þeld values are to be usedto validate soil water balance models or remote sensingalgorithms. The uncertainties ofRn and G are propagatedinto both methods. EvenG accounting only for 10Ð30% ofRn, the hole ofG ßuxes in the closure problem has beenattempted for the surface energy balance in vegetated andnot vegetated surfaces (Heilman et al.1994; Heusinkveld etal.2004). The advantage of using these methods is thatkEBR andkEREScan be obtained without expensive instrumentation. Anexample ofapplication of the RES method in a cheapway isbyusing the surface renewal method to measure the sensible heatßux (Castellvi et al.2008).
The EC_BR combination approach applying the Eq.8was also compared with direct EC measurements. Themethod recomputes the latent heat ßuxes from EC systemby using the ratioHEC/kEEC and the measured availableenergy (Twine et al.2000). Figure9 shows the relationbetween the latent heat ßuxes obtained by EC measure-ments and by the EC_BR method. The results of thekEEC_BR and kERES are comparable. Chehbouni et al.(2006) also used this EC_BR method over irrigated wheatin the Yaqui Valley in Northwest Mexico. While the lackof energy balance closure could undermeasurekEEC, it isbelieved that forcing the closure by this combinationmethod (EC_BR), this undermeasurement should be cor-rected (e.g. Hoedjes et al.2002). However, the EC_BRmethod again brings the uncertainties ofRn and G as theBR and RES methods, being not necessarily better, unlessindependent water balance estimates conÞrm this. Inaddition, the advantages of direct measurements of ECsystems are incorporated into this combination method.
The methods discussed before have uncertainties in allmeasurements, and no overriding argument can be foundfor favouring a certain solution. A Þnal method was appliedto solve the lack of energy balance closure in the EC
system and to assess the data quality, by means of a curveÞtting involving all energy balance components (Allen2008). Equation10 was applied to half-hour periods byusing: (1) all data, (2) daytime data only and (3) night-timedata only. Systematic corrections were identiÞed for thetwo growing seasons of the mango orchard (Table1).
The regression coefÞcients (R2) were highest for all dataincluded, averaging 0.97 when used in association with anoffset c0, even though for night-time periods theR2 being0.65 for the second growing season. The high regressioncoefÞcients for all data included can be attributed to thelarge extremes and variations in the combined data set thatstrongly reduced the root mean square error (RMSE) inrelation to the situations when only daytime or night-timedata were used.
In both growing seasons,HEC appeared to be under-measured during the day and overmeasured during thenight, which supports an underestimation ofHBR duringdaytime periods in Fig.5. kEEC was overmeasured duringthe daytime periods, which supports an overestimation ofkEBR in Fig. 7 for this time of the day. For the growingseason of 2003Ð2004, the differences between the cor-rected and uncorrected values of latent and sensible heatßuxes were larger than those for the growing season of2004Ð2005 as a result of the unusual rains during 2004which affected both the sonic anemometer and the kryptonhygrometer measurements.G was highly undermeasuredduring all periods of the day, although the correctioncoefÞcients were much higher for daytime periods. Thiswas expected as the soil heat plates were buried near theirrigation system, because they could not be installedbetween the rows due to the path of machines. The verylow measuredG values are attributed to the high soilmoisture levels near the micro-sprinklers and the shadow-ing effects of the mango trees during daytime periodspromoting high thermal soil conductivity.
Taking all periods of the day and the average conditionsfor the two growing seasons, half-hourlykEEC was
Fig. 9 Comparison between thelatent heat ßuxes obtained bythe eddy correlationmeasurements (kEEC) withthose from the combinationmethod (kEEC_BR): Þrst growingseasonÑ(2003Ð2004); secondgrowing season (2004Ð2005).Half hourly values are depicted
Irrig Sci
123

overmeasured by 18%,HEC was undermeasured by 17%,and G measurements required the biggest correction of466%. Although the interceptc0 for daytime periods waslarge (average of 69 W m-2), a small improvement inR2
was achieved with its use. The REG method was thenapplied to the energy balance components for the Þrst andsecond growing seasons of the mango orchard at 30-minintervals with only the coefÞcientsc1, c2 and c3 fromTable1 for daytime and night-time separately.
As the biggest discrepancy was fromG values, ananalysis for the diurnal behaviour of this energy balancecomponent is provided by using half-hour averaged valuesover the Þrst (2003Ð2004) and the second (2004Ð2005)growing seasons of mango orchard (Fig.10). It can be seenfrom Fig. 10 and Table1 that bothG values and correc-tions coefÞcients were lower for the rainier growing seasonthan those for the drier one during the daytime periods. Thereason is that the rain keptG more homogeneous with ahigher thermal conductivity during the Þrst growing
season. Considering all periods of the day and bothgrowing seasons, the averaged correction coefÞcient of4.66 is too high because of the absence of measurementsbetween rows, showing the importance of the REG methodfor short timescales, which considers all energy balancecomponents to force the closure in situations of difÞcultreliableG measurements, as for sparse irrigated crops. Theeffect of the shadow of the trees is evident by the lowervalues around midday with midmorning and midafternoonpeaks, mainly during the drier conditions of 2004Ð2005(Heilman et al.1994, 1996; Teixeira et al.2007).
Despite the biggest correction for the half-hourG valuesin relation to the other energy balance components, theeffect of these measurement errors in the available energy(AE = Rn - G) is low (Fig. 11). The small differences inAE are due to thatG accounted only for a small portion ofRn (Heusinkveld et al.2004). When taking daily values,which are considered for irrigation management,G tends tozero and the correction becomes irrelevant at this time-scale. After applying the corrections forG, considering thecoefÞcients for day- and night-times from Table1 sepa-rately, the corrected values of AE represented 93% of theuncorrected ones. Hence, measurement errors inG werenot the main reason for the lack in the daily energy balanceclosure of the EC system.
Seasonal variations of the averaged daily values of netradiation and latent heat ßuxes from the different mea-surements and methods used during the two growing sea-sons of the mango orchard are portrayed in Table2.
Although the seasonal behaviour ofG is not shown inTable2, the average values of the evaporative fractions(EF = kE/AE) (Shuttleworth et al.1989) ranged from 0.71to 0.89, among the measurements and methods. The dif-ferences in EF between the methods were more modestthan those forkE. The meanDEF was 0.17 for 2003Ð2004and 0.14 for 2004Ð2005. The reason is the inclusion of AEin the deÞnition of EF, which, according to the Fig.11,presented small differences between the corrected anduncorrected values, mainly for periods of the day outsidethe noon time. During an earlier BR energy balance study
Table 1 Energy balance regression coefÞcients for 30-min energybalance measurements over mango orchard at Petrolina-PE, Brazil,during the growing seasons of 2003Ð2004 and 2004Ð2005
Data c0
(W m-2)c1
(G)c2
(kE)c3
(H)R2 RMSE
(W m-2)
2003Ð2004
All Ð 4.25 0.71 1.47 0.93 37.1
Daytime Ð 5.01 0.64 1.48 0.86 53.6
Night-time Ð 1.54 1.08 0.67 0.80 2.4
All 54.9 4.00 0.67 1.38 0.98 13.3
Daytime 76.9 6.54 0.54 1.25 0.90 69.4
Night-time -11.8 1.22 0.86 0.53 0.81 2.1
2004Ð2005
All Ð 5.06 0.93 0.87 0.93 25.2
Daytime Ð 5.21 0.73 1.40 0.91 36.0
Night-time Ð 1.54 0.88 0.58 0.46 4.8
All 40.2 4.80 0.88 0.82 0.96 14.9
Daytime 61.4 4.58 0.64 1.23 0.93 35.1
Night-time -17.4 1.05 0.60 0.40 0.65 3.7
-30
-4
22
48
74
100
G
Gc
0 2 4 6 8 10 12 14 16 18 20 22 24 0 2 4 6 8 10 12 14 16 18 20 22 24
Soi
l hea
t flu
x (W
m-2
)
Local time
2SG1SG2003-04 2004-05
Fig. 10 Diurnal averages formeasured (G) and corrected(Gc) soil heat ßuxes, during theÞrst (2003Ð2004) and thesecond (2004Ð2005) growingseasons for the mango orchard.Averaged half hour values aredepicted
Irrig Sci
123

in a mango orchard close to our study site, the EF valueswere found to be 0.73 in August, 0.86 in September, 0.78 inOctober and 0.80 during November (Lopes et al.2001),being inside the range of our actual study.
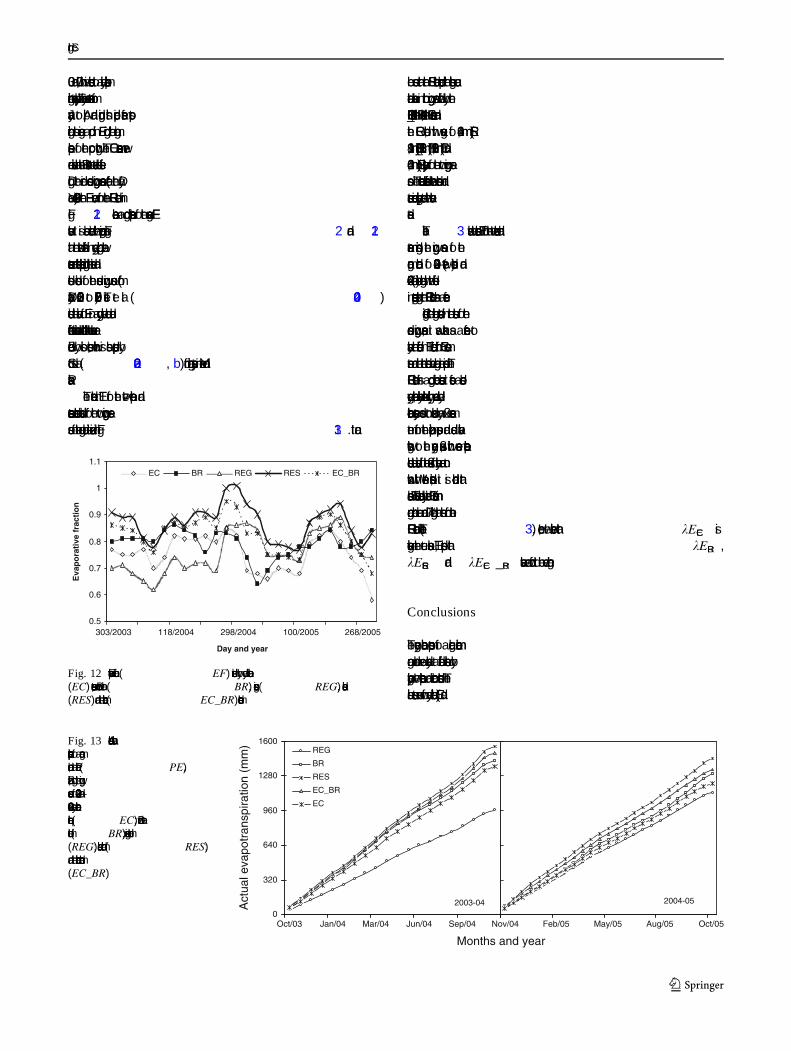
Figure12 presents the seasonal behaviour of EF for allmethods from 2003 to 2005, involving the two growingseasons of the mango orchard. In general, the EF valuesremained fairly constant with a standard deviation between
Ava
ilabl
e en
ergy
(W
m-2
)Local time
-120
24
168
312
456
600
AE
AEc
0 2 4 6 8 10 12 14 16 18 20 22 24 0 2 4 6 8 10 12 14 16 18 20 22 24
2003-04 2004-05
Fig. 11 Diurnal averages forthe measured (AE) andcorrected (AEc) availableenergy, during the Þrst(2003Ð2004) and the second(2004Ð2005) growing seasonsfor the mango orchard.Averaged half hour values aredepicted
Table 2 Daily averages of net radiation (Rn) and latent heat ßuxes (kE) in a mango orchard, using different measurements and methods
Day/year Rn (MJ m-2 d-1) kEEC (MJ m-2 d-1) kEBR (MJ m-2 d-1) kERES (MJ m-2 d-1) kEEC_BR (MJ m-2 d-1) kEREG (MJ m-2 d-1)
2003Ð2004
303/03 9.66 7.55 7.86 8.92 8.43 5.20
333/03 10.84 8.36 8.96 9.86 9.49 5.90
363/03 10.64 8.19 8.75 9.66 9.13 5.66
028/04 9.73 8.00 8.37 8.36 8.30 5.87
058/04 12.18 9.54 10.90 10.59 10.28 6.94
088/04 11.69 8.92 10.09 10.09 10.15 6.47
118/04 11.96 9.83 10.32 10.63 10.46 7.06
148/04 9.75 8.07 8.33 8.59 8.45 5.75
178/04 8.91 7.51 7.57 8.48 8.09 5.34
208/04 8.70 7.42 6.83 8.21 8.01 5.24
238/04 9.71 7.97 8.26 8.88 8.49 5.63
268/04 11.51 10.12 9.79 11.83 11.19 7.08
298/04 12.21 10.30 10.14 12.73 11.65 7.23
Mean 10.58 8.60 8.94 9.76 9.39 6.11
2004Ð2005
327/04 12.47 8.82 9.44 11.92 10.61 8.33
354/04 12.17 8.42 7.87 11.06 10.17 7.95
016/05 11.67 7.76 8.11 9.41 8.71 7.31
044/05 12.13 8.73 9.20 9.78 9.37 8.18
072/05 11.87 8.49 9.15 9.60 9.10 7.94
100/05 12.41 8.74 10.04 9.88 9.43 8.18
128/05 9.04 7.36 7.28 8.08 8.11 6.89
156/05 8.78 7.29 7.15 7.96 7.85 6.83
184/05 8.43 7.16 7.11 7.79 7.67 6.71
212/05 10.03 7.85 7.61 9.23 8.40 7.30
240/05 10.62 7.93 8.34 8.94 8.56 7.45
268/05 12.04 8.45 9.74 9.58 9.14 7.94
Data were collected during the growing seasons of 2003Ð2004 and 2004Ð2005
* The subscripts EC, BR, REG, RES and EC_BR mean the eddy correlation, Bowen ratio, regression, residual and the combination of EC andBR methods, respectively
Irrig Sci
123
0.03 and 0.07, which is ascribed to a daily micro-sprinklerirrigation water supply. The rainy season concentrates fromJanuary to April, and during this period, farmers stopirrigation, thus causing a drop in EF during the maturingphase of the crop growth. The EC measurements weremore sensitive than the BR estimates to detect such effects.During the drier second growing season (after the Day/Year 298/2004), the EF curve from the REG method inFig. 12 became a good representation of the average EFvalues. It is also evident when comparing Figs.2 and 12that the lowest differences in energy partitioning betweenmeasurements and methods happened during the driest andcoldest conditions of the second growing season (fromDay/Year 120/2005 to 270/2005). Testi et al. (2004)studied the variation of EF in a young olive orchard underdifferent water conditions and concluded that the values areinßuenced by soil moisture, which is also supported byScott et al. (2003a, b) for irrigation systems in Mexico andPakistan.
The accumulated ET for the Þve interpretation andmeasurements methods studied for the two growing sea-sons of the mango orchard is summarized in Fig.13. It can
be seen that the RES method produced the highest accu-mulated values in both growing seasons, followed by theEC_BR method, the BR method, the EC measurements andthe REG method, with averages of 1,496 mm (RES),1,419 mm (EC_BR), 1,362 mm (BR), 1,289 mm (EC) and1,046 mm (REG), respectively, for the two growing sea-sons. The accumulated differences between methods andmeasurements increased progressively towards the harvestdates.
Table3 shows the seasonal ET for the Þve methods andmeasurements considering the growing seasons of themango orchard of 2003Ð2004 (wetter conditions) and2004Ð2005 (drier conditions) together with the differencesin percentages taking the REG method as a reference.
Considering the higher conÞdence in the results of thesecond growing season, it was taken as a reference toanalyse the differences in ET obtained from EC measure-ments and the other methods over large time periods. TheREG method is a good choice because it forces a closedenergy balance; maximally utilizes highly advanced eddycorrelation systems; does not exclude any ßux measure-ment from the optimization process; and adds variableweights to the energy ßuxes, which seems acceptablebecause actual deviations of the ßuxes from reality are notknown. With these considerations, it is concluded thatseasonal ET values obtained by direct EC measurements inmango orchard are around 7% higher than those from theREG method (Table3). Hence, we believe thatkEEC isoverestimating the true seasonal ET, despite thatkEBR,kERES andkEEC_BR values were found to be even higher.
Conclusions
The energy balance components of a large commercialmango orchard were analysed at different timescales byapplying Þve interpretation and correction methods. Thebasic measurements were from eddy correlation (EC) and
0.5
0.6
0.7
0.8
0.9
1
1.1
303/2003 118/2004 298/2004 100/2005 268/2005
Day and year
Eva
po
rati
ve f
ract
ion
EC BR REG RES EC_BR
Fig. 12 Evaporative fraction (EF) determined by eddy correlation(EC) measurements; Bowen ratio (BR), regression (REG), residual(RES) and the combination (EC_BR) methods
0
320
640
960
1280
1600
Act
ual e
vapo
tran
spira
tion
(mm
) REG
BR
RES
EC_BR
EC
2003-04 2004-05
Months and year
REG
BR
RES
EC_BR
EC
2003-04
Oct/03 Jan/04 Mar/04 Jun/04 Sep/04 Nov/04 Feb/05 May/05 Aug/05 Oct/05
2004-05
Fig. 13 Accumulated actualevapotranspiration of a mangoorchard, at Petrolina (PE),Brazil, during the growingseasons of 2003Ð2004 and2004Ð2005: eddy correlationtechnique (EC); Bowen ratiomethod (BR); regression method(REG); residual method (RES);and the combination method(EC_BR)
Irrig Sci
123

Bowen ratio (BR) techniques. While EC systems areexpensive, BR method is cheaper and the instrumental iseasier to operate. The classical BR estimations showed 4and 15% more seasonal ET compared to the measurementsfrom the EC system for a wetter and a drier growing sea-son, respectively.
The EC system in the irrigated mango orchard showedan energy balance closure gap of 12% at daily timescale.This is low compared to the international literature. Manyexplanations for this problem exist, and it is reasonable toconclude that the EC system cannot be used as a highreliable way to measure the latent heat ßux in irrigatedcrops without adequate correction procedures. Evapo-transpiration research should therefore develop appropriateinterpretation and correction procedures. The current paperis a contribution in that respect, and much more research isneeded covering different irrigated surfaces.
The four methods, Bowen ratio (BR), residual (RES),combination (EC_BR), and Bowen ratio (BR), showed areasonable agreement with EC measurements, although theBR method was less sensitive to phenological changesthroughout the mango-growing seasons compared to thosewhich uses EC measurements. The simple multiple linearregression method appears to be very helpful in identifyingthe components of the energy balance that need adjust-ments to force the energy balance to close, mainly whenthe soil heat ßux is difÞcult to measure accurately. It is amore elegant solution than the Bowen ratio of EC ßuxesthat implicitly assumes that sensible and latent heat ßuxesmeasured with an EC system have the same level of con-Þdence and do not consider the accuracy of the otherenergy balance terms.
Since there is no consensus in the literature on denotingone particular ßux term as the source of error, we believethat the REG method is the most unbiased solution.Applying this last method for the drier season of the mangoorchard as a reference, the regression coefÞcients were0.93, 0.87 and 5.06 for latent, sensible and soil heat ßuxes,respectively, considering all periods of the day. This
suggests that the latent heat ßux from the kriptonhygrometer was measured with relatively more accuracythan the sensible heat ßux from the sonic anemometer inconditions of low precipitation. While there were soundreasons to move away from lysimeters to turbulent ßuxmeasurement systems in the eighties and nineties, thisstudy shows that the perfect method for direct Þeld mea-surement of the latent heat ßux does not exist yet. Thisshould be understood by the irrigation, hydrological, soilphysical, crop yield and remote sensing modelling com-munity, because it implies that modelled data of evapo-transpiration may be as appropriate as the measured onesfor speciÞc purposes.
Acknowledgments This research was supported by CAPES (Min-istry of EducationÑBrazil) and FACEPE (Science and TechnologyFoundation of Pernambuco state, Brazil). CAPES is acknowledgedfor granting a full scholarship for the Ph.D. of the Þrst author andFACEPE for the Þnancial support to the actual project on waterproductivity in the Low-Middle Sa÷o Francisco river basin, Brazil.
References
Ahmad MD, Bastiaanssen WGM, Feddes RA (2002) Sustainable useof groundwater for irrigation: a numerical analysis of subsoilwater ßux, John Wiley & Sons. Irrig Drain 51(3):227Ð241
Allen R (2008) Quality assessment of weather data and micromete-orological ßuxÑimpacts on evapotranspiration calculation.J Agric Meteorol 64(4):191Ð204
Allen RG, Pereira LS, Raes D, Smith M (1998) Crop evapotranspi-ration. Guidelines for computing crop water requirements. FAOIrrigation and Drainage Paper 56, Rome, Italy, 300 pp
Azevedo PV de, da Silva BB, da Silva VPR (2003) Waterrequirements of irrigated mango orchards in northeast Brazil.Agric Water Manage 58:241Ð254
Baldocchi D, Falge E, Gu L, Olson R, Hollinger D, Running S,Anthoni P, Bernhofer C, Davis K, Evans R, Fuentes J, GoldsteinA, Katul G, Law B, Lee X, Malhi Y, Meyers T, Munger W,Oechel W, Paw UKT, Pilegaard K, Schmid HP, Valentini R,Verma S, Vesala T, Wilson K, Wofsy S (2001) FLUXNET: anew tool to study the temporal and spatial variability ofecosystem-scale carbon dioxide, water vapour, and energy ßuxdensities. Bull Am Meteorol Soc 82(11):2415Ð2434
Bastiaanssen WGM, Allen RG, Droogers P, DÕurso G, Steduto P(2007) Twenty-Þve years modelling irrigated and drained soils:state of the art. Agric Water Manage 92(3):111Ð125
Bastiaanssen WGM, Bingfang W, Olson DC, Liping J (2008) Watersaving strategies on the northwest China plain. Stockholm WaterFront 1:12Ð13
Beringer J, Tapper NJ (2000) The inßuence of subtropical cold frontson the surface energy balance of a semi-arid site. J Arid Environ44:437Ð450
Castellvi F, Snyder RL, Baldocchi DD (2008) Surface energy-balanceclosure over rangeland grass using the eddy covariance methodand surface renewal analysis. Agric For Meteorol 148:1147Ð1160
Chehbouni A, Ezzahar J, Watts C, Rodriguez J-C, Garatuza-Payan J(2006) Estimating area-averaged surface ßuxes over contrastedagricultural patchwork in a semi-arid region. In: Hill J, Roder A(eds) Advances in remote sensing and geoinformation processingfor land degradation assessment. Taylor and Francis, London
Table 3 Seasonal evapotranspiration (ET) of a mango orchard atPetrolina-PE, Brazil, interpreted from Þve methods and measurementsduring the growing seasons of 2003Ð2004 and 2004Ð2005
GS/method
ETEC ETBR ETREG ETRES ETEC_BR
2003Ð2004 1,368 mm 1,422 mm 965 mm 1,552 mm 1,495 mm
142% 147% 100% 161% 155%
2004Ð2005 1,210 mm 1,302 mm 1,127 mm 1,440 mm 1,343 mm
107% 116% 100% 128% 119%
GS growing season,EC, BR measurements from eddy correlationtechnique and Bowen ratio method, respectively,REG, RES, EC_BRregression, residual and the combination methods, respectively
Irrig Sci
123

Cleverly JR, Dahm CN, Thibaut JR, Gilroy DJ, Coonrod JEA (2002)Seasonal estimates of actual evapotranspiration from Tamarixramosissima stands using three-dimensional eddy correlation.J Arid Environ 52:181Ð197
Denmead OT, McIlroy IC (1970) Measurement of non-potentialevaporation from wheat. Agric Meteorol 7:285Ð302
Doorenbos J, Pruitt WO (1977) Guidelines for predicting crop waterrequirements, 2nd edn. FAO, Rome (FAO Irrigation andDrainage Paper 24)
Droogers P, Immerzeel WW, Lorite IJ (2010) Estimating actualirrigation application by remotely sensed evapotranspirationobservations. Agric Water Manage 97(9):1351Ð1359
Dugas WA, Fritschen LJ, Gay LW, Held AA, Matthias AD, ReicoskyC, Steduto P, Steiner JL (1991) Bowen ratio, eddy correlationand portable chamber measurements of sensible and latent heatßux over irrigated spring wheat. Agric For Meteorol 56:1Ð20
Fereres E, Soriana MA (2007) DeÞcit irrigation for reducingagricultural water use. J Exp Bot 58(2):147Ð159
Heilman JL, Mcinnes KJ, Savage MJ, Gesh RW, Lascano RJ (1994)Soil and canopy energy balances in a west Texas vineyard. AgricFor Meteorol 71:99Ð114
Heilman JL, Mcinnes KJ, Gesh RW, Lascano RJ, Savage MJ (1996)Effects of trellising on the energy balance of the vineyard. AgricFor Meteorol 81:79Ð93
Heusinkveld BG, Jacobs AFG, Hotslag AAM, Berkowicz SM (2004)Surface energy balance closure in an arid region: role of soil heatßux. Agric For Meteorol 122:21Ð37
Hiyama T, Strunin MA, Tanaka H, Ohta T (2007) The developmentof local circulations around the Lena River and their effect ontower-observed energy imbalance. Hydrol Proc 21:2038Ð2048
Hoedjes JCB, Zuurbier RM, Watts CJ (2002) Large aperturescintillometer used over a homogeneous irrigated area, partlyaffected by regional advection. Bound Lay Meteorol 105:99Ð117
Humphreys ER, Black TA, Ethier GJ, Drewitt GB, Spittlehouse DL,Jork EM, Nesic Z, Livingston NJ (2003) Annual and seasonalvariability of sensible and latent heat ßuxes above a coastalDouglas-Þr forest, British Columbia, Canada. Agric For Mete-orol 115:109Ð125
Inman-Bamber NG, McGlinchey MG (2003) Crop coefÞcients andwater-use estimates for sugarcane based on long-term Bowenratio energy balance measurements. Field Crops Res 83:125Ð138
Jensen ME, Burman RD, Allen RG (ed) (1990) Evapotranspirationand irrigation water requirements. ASCE manuals and reports onengineering practices no. 70, American Social Civil Engineers,New York, NY, 360 p
Lee X, Yu Q, Sun X, Liu J, Min Q, Liu Y, Zhang X (2004)Micrometeorological ßuxes under the inßuence of regional andlocal advection: a revisit. Agric For Meteorol 122:11Ð124
Lopes PMO, da Silva BB, de Azevedo PV, da Silva VPR, TeixeiraAHC, Soares JM, Sobrinho JE (2001) Balancüo de energia numpomar de mangueiras irrigado. Rev Bras de Agrometeorol 9:1Ð8
Lund MR, Soegaard H (2003) Modelling of evaporation in a sparsemillet using a two source model including sensible heatadvection within the canopy. J Hydrol 280:124Ð144
Moore CJ (1986) Frequency response corrections for eddy correlationsystems. Bound Lay Meteorol 37:17Ð35
Ohta T, Hiyama T, Tanaka H, Kuwada T, Maximov TC, Ohata T,Fukushima Y (2001) Seasonal variation in the energy and waterexchanges above and below a larch forest in eastern Siberia.Hydrol Proc 15:1459Ð1476
Olejnik J, Eulenstein F, Kedziora A, Werner A (2001) Evaluation of awater balance model using data for bare soil and crop surfaces inMiddle Europe. Agric For Meteorol 106:105Ð116
Oliver HR, Sene KJ (1992) Energy and water balances of developingvines. Agric For Meteorol 61:167Ð185
Ortega-Farias S, Carrasco M, Olioso A, Acevedo C, Poblete C (2007)Latent heat ßux over cabernet sauvignon vineyard using theShuttleworth and Wallace model. Irrig Sci 25:161Ð170
Pacüo TA, Ferreira MI, Conceicüa÷o N (2006) Peach orchard evapo-transpiration in a sandy soil: comparison between eddy corre-lation measurements and estimates by the FAO 56 approach.Agric Water Manage 85(3):305Ð313
Papale D, Reichstein M, Aubinet M, Canfora E, Bernhofer C, KutschW, Longdoz B, Rambal S, Valentini R, Vesala T, Yakir D (2006)Towards a standardized processing of net ecosystem exchangemeasured with eddy covariance technique: algorithms anduncertainty estimation. Biogeosciences 3(4):571Ð583
Paw UKT, Baldocchi DD, Meyers TP, Wilson KB (2000) Correctionsof eddy correlation measurements incorporating both advectiveeffects and density ßuxes. Bound Lay Meteorol 97:487Ð511
Prueger JH, Kustas WP, Hipps LE, HatÞeld JL (2004) Aerodynamicparameters and sensible heat ßux estimates for a semi-aridecosystem. J Arid Environ 57:87Ð100
Rana G, Katerji N, de Lorenza F (2005) Measuring and modelling ofevapotranspiration of irrigated citrus orchard under Mediterra-nean conditions. Agric For Meteorol 128:199Ð209
Savage MJ, Everson CS, Metelerkamp BR (2009) Bowen ratioevaporation measurement in a remote montane grassland: dataintegrity and ßuxes. J Hydrol 376:249Ð260
Scott CA, Bastiaanssen WGM, Ahmad MD (2003a) Mapping rootzone soil moisture using remotely sensed optical imagery. ASCEJ Irrig Drain Eng 129:326Ð335
Scott RL, Watts C, Payan JG, Edwards E, Goodrich DC, Williams D,Shuttleworth WJ (2003b) The understory and overstory parti-tioning of energy and water ßuxes in an open canopy, semiaridwoodland. Agric For Meteorol 114:127Ð139
Sene KJ (1994) Parameterizations for energy transfers from a sparsevine crop. Agric For Meteorol 71:1Ð18
Shuttleworth WJ, Gurney RJ, Hsu AY, Ormsby JP (1989) FIFE: thevariation in energy partition at surface ßux sites. In: Proceedingsof the IAHS third international assembly, IAHS Publication No.186, pp 67Ð74
Simmons LJ, Wang J, Sammis TW, Miller DR (2007) An evaluationof two inexpensive energy-balance techniques for measuringwater use in ßood-irrigated pecans (Carya illioinensis). AgricWater Manage 88:181Ð191
Spano D, Snyder RL, Duce P, Paw UKT (2000) Estimating sensibleand latent heat ßux densities from grapevine canopies usingsurface renewal. Agric For Meteorol 104:171Ð183
Stull RB (1998) An introduction to boundary layer meteorology.Kluwer Academic Publishers, Boston
Tanaka H, Hiyama T, Kobayashi N, Yabuki H, Ishii Y, DesyatkinRV, Maximov TC, Ohta T (2008) Energy balance and its closureover a young larch forest in eastern Siberia. Agric For Meteorol148:1954Ð1967
Tanner BD, Swiatek E, Greene JP (1993) Density ßuctuations and useof the krypton hygrometer in surface ßux measurements. In:Proceedings of the national irrigation drainage engineering,21Ð23 July 1993, Park City, UT. ASCE, New York, NY
Teixeira AH de C (2009) Water productivity assessments from Þeldto large scale: a case study in the Brazilian semi-arid region.LAP Lambert Academic Publishing, Saarbru¬cken
Teixeira AH de C, Bastiaanssen WGM, Bassoi LH (2007) Crop waterparameters of irrigated wine and table grapes to support waterproductivity analysis in Sao Francisco River basin, Brazil. AgricWater Manage 94:31Ð42
Teixeira AH de C, Bastiaanssen WGM, Moura MSB, Soares JM,Ahmad MÐudÐD, Bos MG (2008a) Energy and water balancemeasurements for water productivity analysis in irrigated mangotrees, Northeast Brazil. Agric For Meteorol 148:1524Ð1537
Irrig Sci
123

Teixeira AH de C, Bastiaanssen WGB, Ahmad MÐudÐD, Bos MG(2008b) Analysis of energy ßuxes and vegetation-atmosphereparameters in irrigated and natural ecosystems of semi-aridBrazil. J Hydrol 362:110Ð127
Testi L, Villalobos FJ, Orgaz F (2004) Evapotranspiration of a youngolive orchard in southern Spain. Agric For Meteorol 121:1Ð18
Testi L, Orgaz F, Villalobos FJ (2006) Variations in bulk canopyconductance of an irrigated olive (Olea europaea L.) orchard.Environ Exp Bot 55:15Ð28
Trambouze W, Bertuzzi P, Voltz M (1998) Comparison of methodsfor estimating actual evapotranspiration in a row-croppedvineyard. Agric For Meteorol 81:193Ð208
Twine TE, Kustas WP, Norman JM, Cook DR, Houser PR, MeyersTP, Prueger JH, Starks PJ, Wesely ML (2000) Correcting eddy-correlation ßux estimates over grassland. Agric For Meteorol103:279Ð300
Unland HE, Houser PR, Shuttleworth WJ, Yand Z (1996) Surface ßuxmeasurement and modelling at a semi-arid Sonoran Desert site.Agric For Meteorol 82:119Ð153
van Dijk A, Moene AF, de Bruin R (2004a) The principles of surfaceßux physics: theory, practice and description of the Ecpacklibrary, Internal Report, Meteorology and Air Quality Group,Wageningen University, Wageningen, The Netherlands, 99 pp
van Dijk AIJM, Bruijnzeel LA, Schellekens J (2004b) Micromete-orology and water use of mixed crops in upland West Java.Indonesia Agric For Meteorol 124:31Ð49
Verma SB, Rosemberg NJ, Blad BL (1978) Turbulent exchangecoefÞcients for sensible heat and water vapour under advectiveconditions. J Appl Meteorol 17:330Ð338
Vilalolobos FJ, Testi L, Rizzalli R, Orgaz F (2004) Evapotranspira-tion and crop coefÞcients of irrigated garlic (Allium sativum L.)in a semi-arid climate. Agric Water Manage 64:233Ð249
Webb EK, Pearmen GL, Leuning R (1980) Correction of ßuxmeasurements for density effects due to heat and water vapourtransfer. Q J R Meteorol Soc 106:85Ð100
Wilczak JM, Oncley SP, Stage SA (2001) Sonic anemometer tiltcorrection algorithms. Bound-Lay Meteorol 99:127Ð150
Wilson K, Goldstein A, Falge E, Aubinet M, Baldocchi D, Berbigier P,Bernhofer C, Ceulemans R, Dolman H, Field C, Grelle A, Ibrom A,Law BE, KowalskiA,Meyers T,Moncrieff J,MonsonR,OechelW,Tenhunen J, Valentini R, Verma S (2002) Energy balance closure atFluxnet sites. Agric For Meteorol 113:223Ð243
Wolf A, Saliendra N, Akshalov K, Johnson DA, Laca E (2008)Effects of different eddy covariance correction schemes onenergy balance closure and comparisons with the modiÞedBowen ratio system. Agric For Meteorol 148:942Ð952
Wright JL (1982) New evapotranspiration crop coefÞcients. J IrrigDrain Div ASCE 108(IR2):57Ð74
Yunusa IAM, Walker RR, Lu P (2004) Evapotranspiration compo-nents from energy balance, sapßow and microlysimetry tech-niques for an irrigated vineyard in inland Australia. Agric ForMeteorol 127:93Ð107
Irrig Sci
123


![29 Pieces - Collection of easy pieces [(1st and 2nd grade)]...3 4 Ï Ï Ï Ï Ï Ï Ï Ï Ï Ï Ï Ï Ï Ï Ï Ï Ï Ï Ï Ï Ï Ï Ï Ï Ï HH. . H. HH. . 3. 3 F 4 4 2 1 & Ï Ï Ï](https://img.pdfslide.us/doc/110x75/607dfb30bfd4bb18cf1b3abb/29-pieces-collection-of-easy-pieces-1st-and-2nd-grade-3-4-.jpg)

![AudioKarma Database · Created Date: @u� 9� 9� �$ n���]��W���"O�����ë �u� $��u](https://img.pdfslide.us/doc/110x75/60cff17d06f07b16c0377a9d/audiokarma-created-date-u-9-9-nwo.jpg)


![29 Pieces - Collection of easy pieces [(1st and 2nd grade)] · PDF file3 4 Ï Ï Ï Ï Ï Ï Ï Ï Ï Ï Ï Ï Ï Ï Ï Ï Ï Ï Ï Ï Ï Ï Ï Ï Ï hh. . h. hh. . 3. 3 f 4 4 2 1](https://img.pdfslide.us/doc/110x75/5a74e1047f8b9ad22a8c2b1a/29-pieces-collection-of-easy-pieces-1st-and-2nd-grade-a-3-4-a-a.jpg)