Embed Size (px)
Citation preview

Fitting Lines to Data with Outliers and Errors in the Variables
Nahum Kiryati Freddy Bruckstein
TAU Technion
© Copyrighted material. All rights reserved.

Least Squares
• Maximum Likelihood• No errors in x• Errors in y• Errors are
– independent
– identically distributed
– Gaussian
• Analytic solution

From Maximum-Likelihood to Least-Squares (reminder)
),(|)},({ Probmaxarg),(
bmyx iibm
2
2
),( 2
)( expmaxarg
i
ii
ibm
bmxy
i i
ii
bm
bmxy2
2
),( 2
)(minarg
i
iibm
bmxy 2
),()(minarg
Maximum Likelihood:
Independent Gaussian errors:
log is a monotonic function:
Identically distributed errors:
... Least Squares

“Errors in the Variables”(errors in both x and y )

• Maximum Likelihood• Errors in x and y• Errors are
– independent & identically distributed
> between x and y (isotropic)
> between points– Gaussian
• Analytic solution

Heteroscedastic Errors
• Errors are independent
- between points
- between x and y
• Errors are not identically distributed
- between points
- between x and y
• No analytic solution
Possible reason: A different measurement device is used for each point.

Heteroscedastic & Correlated Errors
• Errors are independent between points
• Errors are correlated between x and y
• Errors are not identically distributed
• No analytic solution
Correlation can appear if the measurement instruments for x and y are both sensitive to a common environmental factor.

OutliersEven a single outlier can pull the line arbitrarily away from its “true” position
MATLAB “robustdemo”

Robust Approaches
• Least Median of Squares
• Robust M-estimation
• Reweighted Least-Squares
• etc...

Robust line fitting methods are far from ideal:
global optimization / local minima / computational complexity
Failure of Reweighted Least Squares (Matlab’s robustdemo)
(and forget about heteroscedasticity and correlation).

Detecting Lines in Edge Images
Unique characteristics:
• Many data points (~10,000)
Algorithm must be fast!
• Majority of outliers
Robustness is everything!
• Small location errors
Fitting the “good” points
is not a big issue.
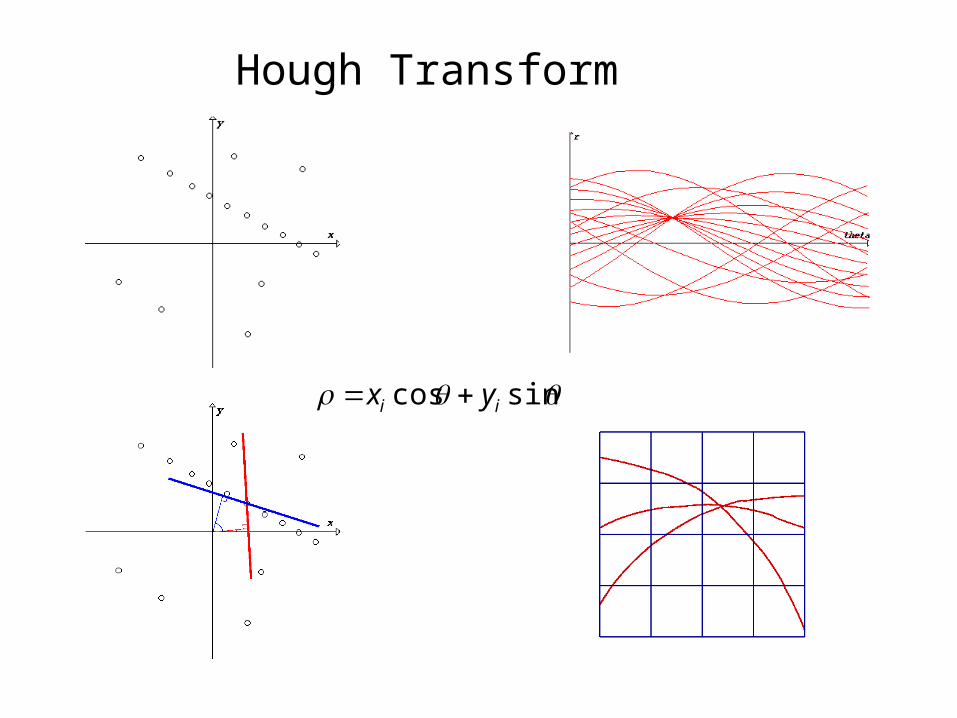
Hough Transform
sincos ii yx

Lines Tangent to a Circle
It is easy to assign a cost (in parameter space) to lines with isotropic fitting errors!

Total Least Squares via Parameter Space

M-Estimation
• A classical approach to robust regression
• Limits the influence of outliers
• Leads to a nasty global optimization problem
• Usually: local optimization from “a good initial guess”
• Look for a good initial guess…

M-Estimation via Parameter Space
… and look for minimum in paramater space
… and look for maximum in paramater space
save votings

M-Estimation via Parameter Space: Examples

Formally, once we have shown that
2
22
),(2 sincos
sincos s.t.
)()( min
,
ii
ii
iiiiii
yx
YX
yYxXYX
ir
any (nasty) line fitting problem with isotropic cost can be (nicely) solved in parameter space:
sincosminarg)],([minarg),(),(
iiii
yxiii CrC
e.g., TLS & robust TLS, via selection of Ci (.) :
(Distance between data point i and a given line)

Surprise! The (very ugly) correlated heteroscedastic case can also be beautified!
sincos s.t.
),(min
,
1
2
2
),(
2
ii
ii
ii
yxy
xyxiiii
ii
YX
yY
xXyYxX
ii
ii
YX
id
)(
),(
cossin2sincos
sincos
2
2222
2
i
i
xyyx
ii
v
ryx
iii
Nominator: standard TLS term! Denominator: Rho-independent term!
(effective distancebetween data point iand a given line)

Correlated, heteroscedastic, robust... and fast!

Robust, Heteroscedastic, Correlated Line Fitting
Robust TLS (isotropic)
Robust, heteroscedastic(uncorrelated)
Robust, heteroscedastic,correlated
•Ellipses/circles represent saturation (truncation) levels.
•The same algorithm/program was used for all examples.

Robust, Heteroscedastic, Correlated Line Fitting
•Ellipses/circles represent saturation (truncation) levels.
•The same algorithm/program was used for all examples.

ReferencesN. Kiryati and A.M. Brucktein, “Heteroscedastic Hough Transform (HtHT): An Efficient Method for Robust line Fitting in the `Errors in the Variables’ Problem, Computer Vision and Image Understanding, Vol. 78, pp. 69-83, 2000.
N. Kiryati and A.M. Bruckstein, “What’s in a Set of Points?”, IEEE Trans. Pattern Analysis Macine Intelligence, Vol. 14, pp. 496-500, 1992.
N. Kiryati and A.M. Bruckstein, “On Navigating between Friends and Foes”, IEEE Trans. Pattern Analysis Macine Intelligence, Vol. 13, pp. 602-606, 1991.