Embed Size (px)
Citation preview

Fitting Enhanced Cash
Into Your Investment Management Process
Presented By:Scott Prickett, CTP, Managing Director
Portfolio Manager
Patti Glock, Associate Vice PresidentClient Services Manager

2
Outline
The Current Environment Rate Levels Economy
Labor Housing Consumer
Government-Sponsored Enterprise-GSEs ~ (FNMA, FHLMC)
The “Big Picture”
Allocation of Your Operating Funds Tiers Historical Returns of Tier Groups
Enhanced Cash Management Tools
Summary

3
Market Dynamics and Rate Trends
What is the market/economic environment right now? Interest Rate Trends
Secular Perspective Analyze both long and short-term trends
Investment Economics Monetary Policy Fiscal Policy
Economic Indicators Labor Market Housing Consumer Sentiment

4
2 Year Treasury Historical Perspective
5
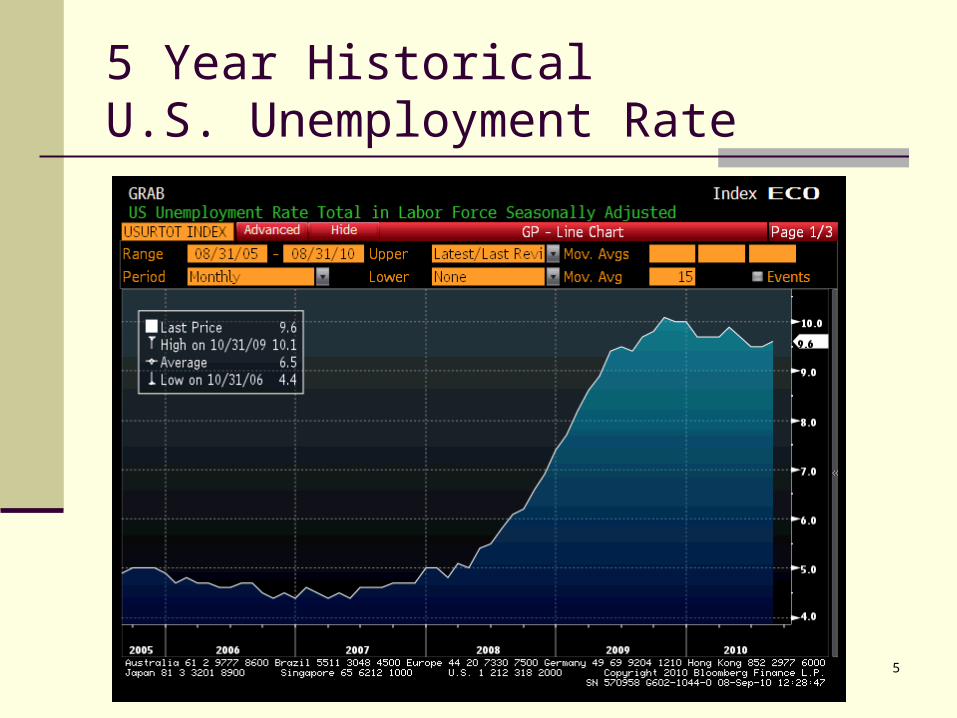
5 Year Historical U.S. Unemployment Rate

6
5 Year HistoricalChange in Non-Farm Payroll

7
5 Year S&P Case-Shiller 20 (YoY)

8
5 Year Housing Starts

9
5 Year Consumer Confidence (YoY)

10
GSE (Agency) Securities
FNMA (Fannie Mae) and FHLMC (Freddie Mac)
Recent Developments
Outlook

11
The Big Picture
Review investment statutes and solidify your investment policy.
Establish broker/dealer guidelines and perform due diligence.
Establish custody/safekeeping arrangements.
Create a cash flow forecast.
Identify liquid funds and core funds liquid funds and core funds. . (ALLOCATION)
Develop an investment strategyinvestment strategy. (ALLOCATION)
Monitor the markets and investment resultsinvestment results. (ALLOCATION)
Stay disciplined but adjust when needed.
Overview of the Operating Fund Investment Management Process
12
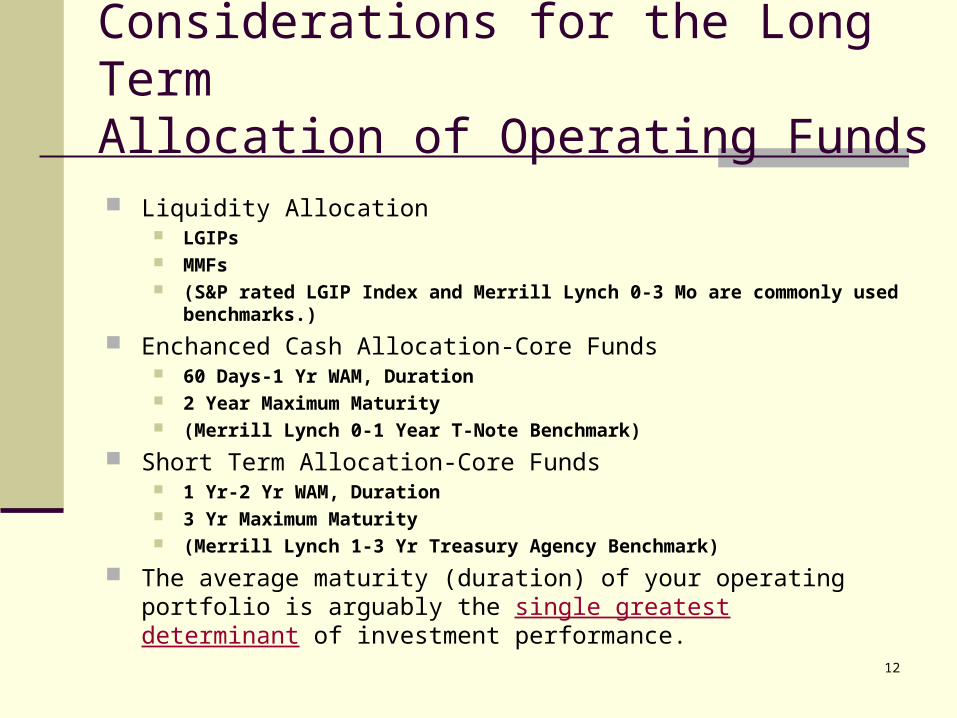
Considerations for the Long Term Allocation of Operating Funds
Liquidity Allocation LGIPs MMFs (S&P rated LGIP Index and Merrill Lynch 0-3 Mo are commonly used
benchmarks.)
Enchanced Cash Allocation-Core Funds 60 Days-1 Yr WAM, Duration 2 Year Maximum Maturity (Merrill Lynch 0-1 Year T-Note Benchmark)
Short Term Allocation-Core Funds 1 Yr-2 Yr WAM, Duration 3 Yr Maximum Maturity (Merrill Lynch 1-3 Yr Treasury Agency Benchmark)
The average maturity (duration) of your operating portfolio is arguably the single greatest determinant of investment performance.
13
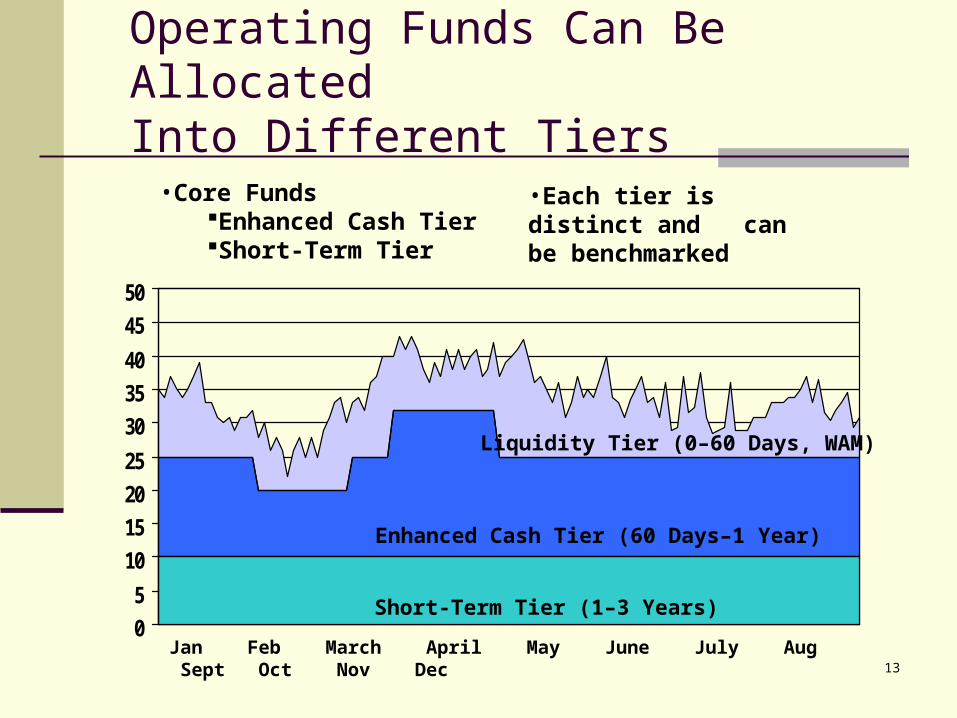
Operating Funds Can Be AllocatedInto Different Tiers
•Each tier is distinct and can be benchmarked
0
5
10
15
20
25
30
35
40
45
50
Short-Term Tier (1–3 Years)
Enhanced Cash Tier (60 Days–1 Year)
Liquidity Tier (0–60 Days, WAM)
Jan Feb March April May June July Aug Sept Oct Nov Dec
•Core FundsEnhanced Cash TierShort-Term Tier

14
Liquidity Allocation (Tier)
Provides the highest degree of principal protection. Designed to provide perfect liquidity (constant NAV). Maintain balances at a level to provide for daily
liquidity needs. Maintain an appropriate cushion (comfort level).
Liquidity Tier (0-60 Days, WAM)

15
Short-Term Allocation (Tier)
Designed for funds with holding periods of one to three years.
Comes with a higher degree of principal volatility.
Objective is to maximize returns.
Yield and total return should be used when evaluating the short-term allocation tier.
Historically a short-term portfolio allocation (Merrill Lynch 1-3 Year Treasury Index) has outperformed Money Market Funds (LGIP 30D Index) by 192 basis points over the past ten years.
Short-Term Tier (1-3 Years)

16
Return Expectations: A Look at Historical Returns for Commonly Used Benchmarks
Maturity Duration 10 Years
5 Years 1 Year
3 Month T-Bill .25 2.75 2.83 0.14
S&P Rated LGIP Index (LGIP30D) .16 2.97 3.16 0.51
1 Year T-Note (CMT) .95 3.03 3.07 0.47
Merrill Lynch 0-1 Year Treasury .51 3.33 3.36 0.49
2 Year T-Note (CMT) 1.94 3.30 3.19 0.95
Merrill Lynch 1-3 Year Index 1.88 4.89 4.45 2.17
December 31, 2009
Source: Bloomberg

17
Enhanced Cash Allocation (Tier)
An enhanced cash strategy is designed to improve on returns provided by typical Money Market Funds and LGIPs while still meeting the primary goals of safety, of principal and liquidity.
Historically an enhanced cash portfolio (Merrill Lynch 0-1 Year Note Index) has outperformed Money Market Funds (LGIP 30D Index) by 36 basis points over the past ten years.
Total return and yield should be used when evaluating enhanced cash strategies.
A longer duration results in slightly higher principal (price) volatility.
Enhanced Cash Tier (60 Days – 1 Year)

18
Enhanced Cash Allocation (Tier)
There is no industry recognized standard definition of Enhanced Cash Funds (maturities as well as credit quality may vary).
Typical duration (WAM) range is 6 Months to 1 Year with a maximum maturity of 2 Years.
Historically, incremental risk vs. the increase in returns is very low.
Enhanced Cash Tier (60 days -1 Year)
19
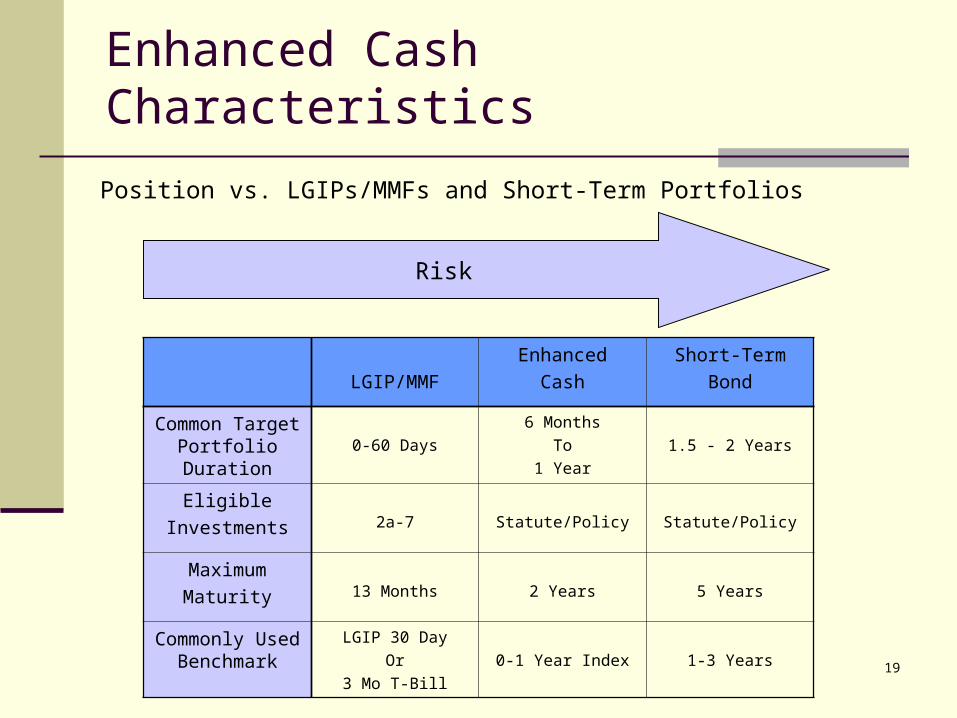
Enhanced Cash Characteristics
Position vs. LGIPs/MMFs and Short-Term Portfolios
LGIP/MMF
Enhanced
Cash
Short-Term
Bond
Common Target Portfolio Duration 0-60 Days
6 Months
To
1 Year
1.5 - 2 Years
Eligible
Investments 2a-7 Statute/Policy Statute/Policy
Maximum
Maturity 13 Months 2 Years 5 Years
Commonly Used Benchmark
LGIP 30 Day
Or
3 Mo T-Bill
0-1 Year Index 1-3 Years
Risk

20
Why Benchmark Short-Term Cash Portfolios?
The assessment of risk and return expectations Determination of opportunity costs Evaluate Investment Strategy
Allows performance attribution to Yield Curve Positioning Sector Selection Credit Decisions Communication of Variation from Benchmark/Strategy
Benchmark Selection Criteria Reflective of liquidity needs and risk tolerance Similar duration as portfolio Should have similar credit quality and eligible instruments Consistently calculated and will most often be obtained from a third party
21
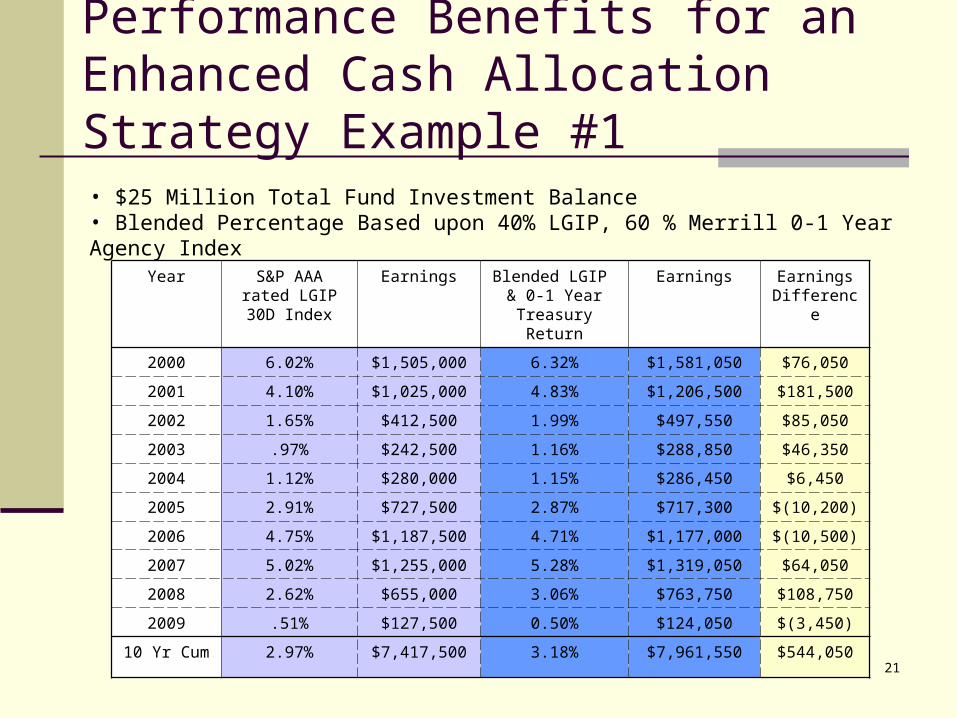
Performance Benefits for an Enhanced Cash Allocation Strategy Example #1
Year S&P AAA rated LGIP 30D Index
Earnings Blended LGIP & 0-1 Year
Treasury Return
Earnings Earnings Difference
2000 6.02% $1,505,000 6.32% $1,581,050 $76,050
2001 4.10% $1,025,000 4.83% $1,206,500 $181,500
2002 1.65% $412,500 1.99% $497,550 $85,050
2003 .97% $242,500 1.16% $288,850 $46,350
2004 1.12% $280,000 1.15% $286,450 $6,450
2005 2.91% $727,500 2.87% $717,300 $(10,200)
2006 4.75% $1,187,500 4.71% $1,177,000 $(10,500)
2007 5.02% $1,255,000 5.28% $1,319,050 $64,050
2008 2.62% $655,000 3.06% $763,750 $108,750
2009 .51% $127,500 0.50% $124,050 $(3,450)
10 Yr Cum 2.97% $7,417,500 3.18% $7,961,550 $544,050
• $25 Million Total Fund Investment Balance• Blended Percentage Based upon 40% LGIP, 60 % Merrill 0-1 Year Agency Index

22
Performance Benefits for an Enhanced Cash Allocation Strategy Example #2
$25 Million Total Fund Investment balance Blended Percentage Based upon 40% LGIP, 30 % 1 Year Treasuries, 30% Merrill 1-3 Year Agency
Index
Year S&P AAA rated LGIP 30D Index
Earnings Blended LGIP, 1 Yr Treas. &
1-3 Yr Agency Return
Earnings Earnings Difference
2000 6.02% $1,505,000 6.93% $1,732,325 $227,325
2001 4.10% $1,025,000 5.82% $1,455,875 $430,875
2002 1.65% $412,500 3.16% $789,600 $377,100
2003 .97% $242,500 1.43% $356,725 $114,225
2004 1.12% $280,000 1.15% $287,950 $7,950
2005 2.91% $727,500 2.55% $636,675 $(90,825)
2006 4.75% $1,187,500 4.66% $1,164,625 $(22,875)
2007 5.02% $1,255,000 5.66% $1,415,650 $160,650
2008 2.62% $655,000 4.17% $1,041,850 $386,850
2009 .51% $127,500 1.00% $249,975 $122,475
10 Yr Cum 2.97% $7,417,500 3.65% $9,131,250 $1,713,750

23
Risk/Return Profile of the 3 Tiers
Source: Bloomberg – Merrill Lynch Index
•Extending the term can add performance but also additional risk.
Risk/Return of Treasury Benchmarks
10 Years Ended 12/31/09
Index Duration Overall Return
Quarters With
Negative Returns
S&P Rated LGIP Index .18 2.96% 0 of 40
0-1 Year Treasury Index .51 3.30% 0 of 40
1-3 Year Treasury Index 1.72 4.47% 4 of 40
3-5 Year Treasury Index 3.80 6.00% 14 of 40
• Short-term portfolios minimize risk at the expense of return.
• Longer-term portfolios provide significant risks with marginal gain.
• Average 10 Year historical yield for the 2 Year Treasury = 3.26%.
• Average 10 Year historical yield for the 5 Year Treasury = 3.99%.

24
Management Tools Enhanced Cash Portfolios
Yield Curve Analysis
Spread Analysis
GAP Analysis
Credit Analysis
Security Selection

25
Yield Curve and Spread Analysis
Review of Basic Curve Types
Recent Yield Curve Trends
Analyze Specific Sector of the Yield Curve
Analyze Yield Curve for the Specific Security
Example of GAP (Breakeven) Analysis
Spread Analysis

26
Maturities
Yie
lds
Review of Basic Curve Types
Positive or “Normal”
Flat
Inverted

27
Historical Yield Curve
28
Spread Analysis
A systematic comparison of alternative securities.
Helps quantify investment decisions.
Spread analysis is not one dimensional.
Within market sectors
Between market sectors

29
Money Market Curves &Yield Spreads
30
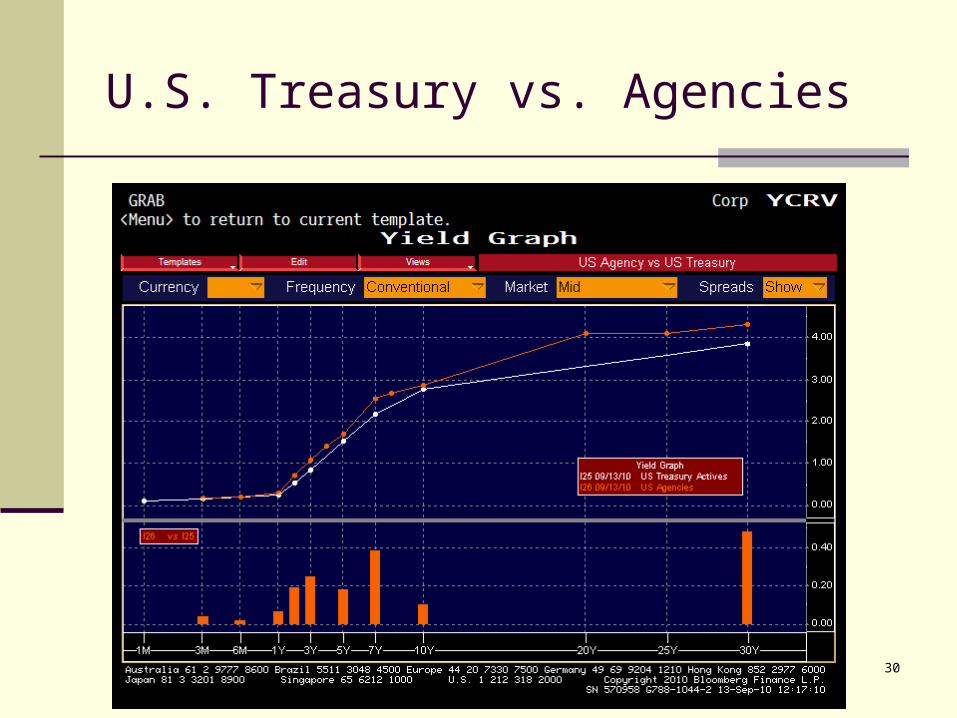
U.S. Treasury vs. Agencies

31
Securities Specific Spread AnalysisRelative Value

GAP (Breakeven) Analysis
Two Examples

33
GAP Analysis
GAP Analysis is a mathematical way to evaluate short-term strategies on a BREAKEVEN basis.
GAP Analysis compares two short-term investments VERSUS an equivalent longer term investment.

34
GAP Analysis Examples
Option A:
On September 10, 2010 you have the opportunity to buy a 14-month Agency Security yielding 0.35%.
Option B:
On September 10, 2010 you buy a 6-Month Agency Security yielding 0.21% and a 2nd 8-Month Agency when the 1st matures.
Calculate the rate you need to earn from the 2nd Agency security to break even. (Make up the yield difference.)

35
GAP Analysis 1st Example
0.35%
0.21%
?
(Head = 178 Days)
(Tail = 261 Days)
Sept 10, 2010 March 7, 2011 Nov 23, 2011
(Full Term = 439)
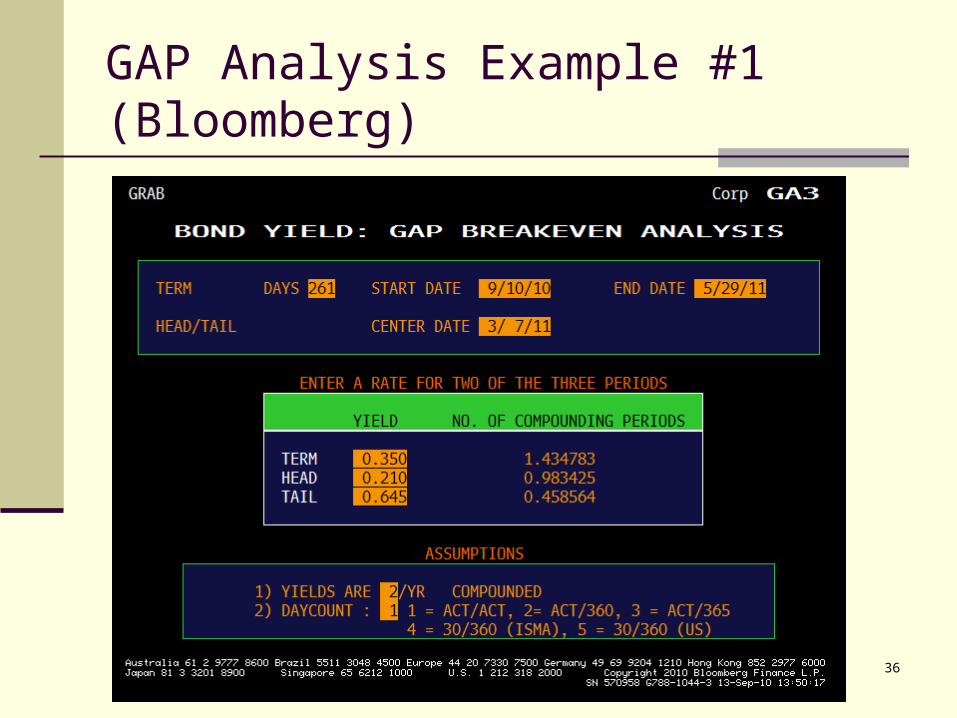
36
GAP Analysis Example #1 (Bloomberg)

37
GAP Analysis 1st Example
0.35%
0.21%
0.65%
(Head = 178 Days)
(Tail = 261 Days)
Sept 10, 2010 March 7, 2011 Nov 23, 2011
(Full Term = 439)
38
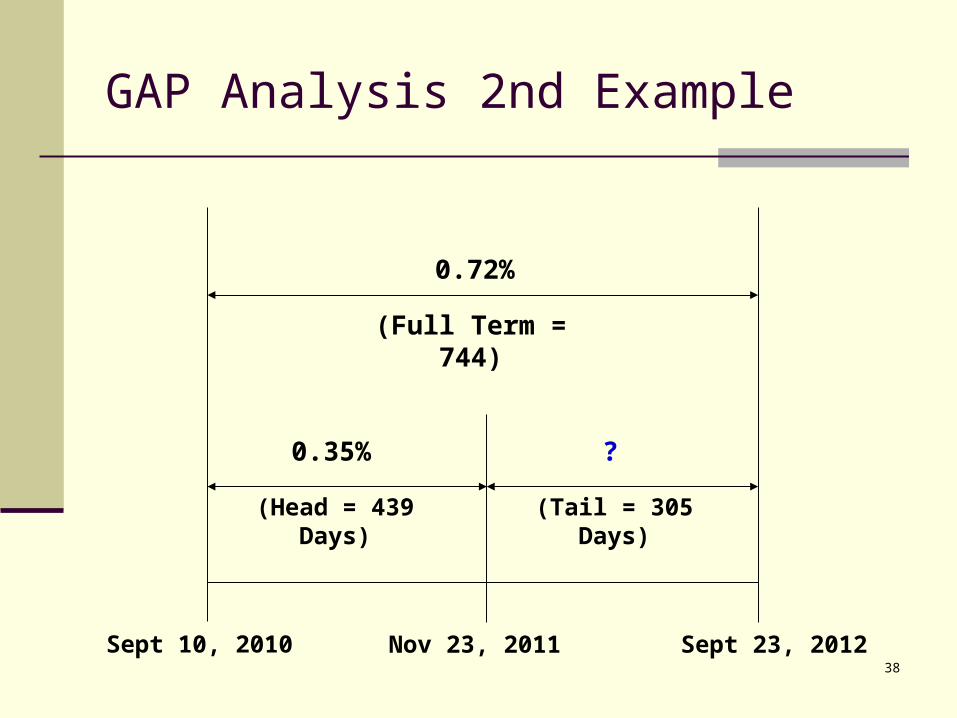
GAP Analysis 2nd Example
0.72%
0.35%
?
(Head = 439 Days)
(Tail = 305 Days)
Sept 10, 2010 Nov 23, 2011 Sept 23, 2012
(Full Term = 744)

39
GAP Analysis Example #2(Bloomberg)

40
GAP Analysis 2nd Example
0.72%
0.35%
1.25%
(Head = 439 Days)
(Tail = 305 Days)
Sept 10, 2010 Nov 23, 2011 Sept 23, 2012
(Full Term = 744)
41
Portfolio Management Summary
Review Recent Yield Curve Trends.
Analyze the Specific Portion of Curve you are Interested in.
Analyze Curve for Specific Maturity.
Use Spread Analysis to Compare Alternative Securities.
Use Gap Breakeven Analysis When Applicable.

42
Summary
Enhanced cash and or short-term allocation strategies are not designed to replace Money Market Funds.
Should be used to supplement an investor’s cash allocation to facilitate the pursuit of higher returns over time without sacrificing safety of principal or liquidity.
Inefficiencies embedded in the yield curve and security selection strategies provide the opportunity to be competitive with assigned benchmarks.
A combination of two or all three of these strategies, matching different liquidity and risk tolerance tiers can provide significant increases in the performance of your short-term funds.
The average maturity (duration) of your operating fund portfolio is arguably the single greatest determinant of investment performance.