Embed Size (px)
Citation preview
RESEARCH ARTICLE Open Access
Fitness to practise sanctions in UK doctorsare predicted by poor performance atMRCGP and MRCP(UK) assessments: datalinkage studyRichard Wakeford1, Kasia Ludka2, Katherine Woolf3 and I. C. McManus3*
Abstract
Background: The predictive validity of postgraduate examinations, such as MRCGP and MRCP(UK) in the UK, ishard to assess, particularly for clinically relevant outcomes. The sanctions imposed on doctors by the UK’s GeneralMedical Council (GMC), including erasure from the Medical Register, are indicators of serious problems with fitnessto practise (FtP) that threaten patient safety or wellbeing. This data linkage study combined data on GMC sanctionswith data on postgraduate examination performance.
Methods: Examination results were obtained for UK registered doctors taking the MRCGP Applied Knowledge Test(AKT; n = 27,561) or Clinical Skills Assessment (CSA; n = 17,365) at first attempt between 2010 and 2016 or takingMRCP(UK) Part 1 (MCQ; n = 37,358), Part 2 (MCQ; n = 28,285) or Practical Assessment of Clinical Examination Skills(PACES; n = 27,040) at first attempt between 2001 and 2016. Exam data were linked with GMC actions on a doctor’sregistration from September 2008 to January 2017, sanctions including Erasure, Suspension, Conditions on Practice,Undertakings or Warnings (ESCUW). Examination results were only considered at first attempts. Multiple logisticregression assessed the odds ratio for ESCUW in relation to examination results. Multiple imputation was used forstructurally missing values.
Results: Doctors sanctioned by the GMC performed substantially less well on MRCGP and MRCP(UK), with a meanCohen’s d across the five exams of − 0.68. Doctors on the 2.5th percentile of exam performance were about 12times more likely to have FtP problems than those on the 97.5th percentile. Knowledge assessments and clinicalassessments were independent predictors of future sanctions, with clinical assessments predicting ESCUW significantlybetter. The log odds of an FtP sanction were linearly related to examination marks over the entire range of performance,additional performance increments lowering the risk of FtP sanctions at all performance levels.
Conclusions: MRCGP and MRCP(UK) performance are valid predictors of professionally important outcomes thattranscend simple knowledge or skills and the GMC puts under the headings of conduct and trust. Postgraduateexaminations may predict FtP sanctions because the psychological processes involved in successfully studying,understanding and practising medicine at a high level share similar mechanisms to those underlying conductand trust.
Keywords: Fitness to practise, MRCGP, MRCP(UK), Knowledge assessments, Clinical assessments, Postgraduateexaminations, GMC sanctions
* Correspondence: [email protected] Department of Medical Education, UCL Medical School, UniversityCollege London, Gower Street, London WC1E 6BT, UKFull list of author information is available at the end of the article
© The Author(s). 2018 Open Access This article is distributed under the terms of the Creative Commons Attribution 4.0International License (http://creativecommons.org/licenses/by/4.0/), which permits unrestricted use, distribution, andreproduction in any medium, provided you give appropriate credit to the original author(s) and the source, provide a link tothe Creative Commons license, and indicate if changes were made. The Creative Commons Public Domain Dedication waiver(http://creativecommons.org/publicdomain/zero/1.0/) applies to the data made available in this article, unless otherwise stated.
Wakeford et al. BMC Medicine (2018) 16:230 https://doi.org/10.1186/s12916-018-1214-4
BackgroundPerhaps the most serious event in a UK doctor’s profes-sional life is to be investigated by the General MedicalCouncil (GMC) because of concerns about their fitnessto practise (FtP). FtP concerns are investigated in aquasi-legal fashion; the proceedings can be very stressful[1] and can result in sanctions, of which the most ser-ious are to be ‘struck off ’ (erased) or suspended from themedical register (LRMP; List of Registered Medical Prac-titioners). About 1% of doctors on the medical registerhave been sanctioned by the GMC for FtP issues at somepoint in their career [2]. There is considerable interestamong the profession and patients in understanding whydoctors are sanctioned and identifying these doctorsearly before personal, professional and patient harmsoccur. More generally, there are also current debatesabout the purpose and validity of large-scale medical ex-aminations. Postgraduate examinations in the UK trad-itionally have clinical assessments, although these areexpensive to run and there are concerns about reliability,whereas in the US, no postgraduate examination has aclinical component, being restricted to written, know-ledge assessments. At the undergraduate level, all UKmedical schools have clinical assessments as a part of fi-nals, and that will continue to be the case with the de-velopment by the GMC of the UK Medical LicensingAssessment (UKMLA)[3]. The format of licencing exam-inations, though, continues to be controversial [4]. Inthe US, the National Board of Medical Examiners(NBME), in 2004, introduced the Step 2 Clinical Skillsexamination into the United States Medical LicensingExamination (USMLE). That examination is controver-sial, a high-profile paper, supported by a petition with16,000 signatories, argued for its abolition, for multiplereasons, including excessive cost and the absence of evi-dence of improvements in patient safety or public trustin physicians [5].The GMC has a statutory duty to quality assure the
UK medical workforce by two mechanisms. Revalidationrequires all doctors to demonstrate on a regular basisthat they are up to date and fit to practise in theirchosen field and able to provide a good level of care [6].The fitness to practise (FtP) procedures are invoked fol-lowing a complaint about a doctor that raises a concernabout their fitness to practise. Complaints are firstly in-vestigated by the GMC, with the investigation results be-ing reviewed by two GMC Case Examiners, who refercases deemed sufficiently serious to the Medical Practi-tioners Tribunal Service (MPTS), sometimes by way ofthe GMC’s Investigation Committee. Although fundedby the GMC, the MPTS acts independently of it and re-ports to Parliament. The MPTS will decide whether ornot to impose a sanction, which include, in decreasingorder of severity, the doctor being erased or suspended
from the medical register, having conditions imposed ontheir registration, a doctor agreeing to undertakings or adoctor being given a warning. We refer to these sanc-tions collectively as ESCUW (Erasure, Suspension, Con-ditions, Undertakings or Warnings) [7]. The GMC FtPprocedures are governed by the Medical Act 1983 andthe GMC (Fitness to Practise) Rules 2004, under which adoctor’s fitness to practise can be impaired due to mis-conduct, deficient performance, a criminal conviction orcaution, adverse physical or mental health, determin-ation by regulatory bodies in the British Isles or overseasor not having the necessary knowledge of English [6].The fact that the FtP procedures are entirely inde-
pendent of Royal College postgraduate examinationsprovides an opportunity to assess whether a doctor’sknowledge, skills and professional behaviour assessedunder examination conditions relate to an entirely separ-ate assessment of a doctor’s performance in the entirecontext of their practice and professional behaviour. Inthis study, we use a data linkage study to show that doc-tors found to be impaired under FtP procedures alsoperform far less well in the various knowledge-basedand clinical examinations of the MRCGP (Membershipof the Royal College of General Practitioners) and theMRCP(UK) (Membership of the Royal Colleges of Physi-cians of the United Kingdom). A preliminary version ofthese analyses using more restricted data was presentedby Ludka [8] as a part of her PhD thesis [9].Postgraduate examinations in the UK are central to
ensuring the quality of trainees who become specialistsin hospital care or general practice, assessing high-levelknowledge, clinical skills and professional behaviours. Asurprisingly common informal critique of such examina-tions is that they ‘only assess knowledge’ and ‘only testthe ability to pass examinations’, and a recent Royal Col-lege of Anaesthetists report said that ‘Professional exam-inations were … felt to not always be relevant tocontemporary clinical practice’ [10]. The implication isthat postgraduate examinations, and medical examina-tions more generally, are somehow merely some form ofacademic game that bear little relationship to the realworld of clinical practice.If medical examinations are indeed worthwhile then, as
with all medical assessments, undergraduate and post-graduate, they need to have demonstrable validity [11–15], although definitions of validity are evolving. A ‘holygrail’ for postgraduate assessments is to relate examinationperformance to important outcomes in terms of patientmorbidity or to the censure (sanctioning) of doctors forunprofessional behaviour. The only study of exam per-formance in relation to patient outcomes is the 2014 studyby Norcini et al. [16] in the USA, showing that poorer per-formance on the US Medical Licensing Examination(USMLE) by international medical graduates (IMGs) was
Wakeford et al. BMC Medicine (2018) 16:230 Page 2 of 16
associated a decade later with a higher mortality in pa-tients treated by those doctors. Although the authors donot directly discuss the issue of causality, they implicitlysuggest a causal relationship by saying that the study pro-vides evidence for the validity of the exam, they emphasisethe long time interval between the exam and the clinicaloutcomes, they comment on the results being ‘consistentwith the growing literature suggestion that nationalhigh-stakes examinations have a positive relationship withpatient outcomes’, they say the findings ‘support the use ofthe examination as an effective screening strategy for li-censure’ and they comment that gathering validity evi-dence is ‘challenging … because it is not possible torandomise to treatment …’ [16]. Several other studies havelooked at the link between exam performance and FtP/censure outcomes for doctors. Poor performance in thecertification examination of the ABIM (American Boardof Internal Medicine), a knowledge examination, wasshown in 2008 to relate to higher risks of unprofessionalbehaviour [17]. A 2017 study of USMLE in US medicalgraduates found that lower performance on Step 1 (bio-medical sciences) and Step 2 CK (clinical knowledge)exams was associated with a higher likelihood of statemedical board sanctions [18]. These ABIM and USMLEstudies considered only knowledge assessments ratherthan clinical assessments. However, a study of USMLEStep 2 Data Gathering and Data Interpretation scores pre-dicted supervisor ratings of history taking and physicalexamination during residency [19]. In the UK, Tiffin et al.in 2017 found that lower scores on the PLAB examination(Professional and Linguistics Assessments Board examin-ation, the GMC’s licencing examination for IMGs wishingto work in the UK), particularly the clinical assessment(Part 2), predicted the likelihood of sanctioning by theGMC [20].Previous studies of FtP have therefore concentrated on
licencing assessments and mostly but not entirely haveconsidered knowledge assessments. In this study, we as-sess the association of poor performance on high-levelUK postgraduate exams with the likelihood of FtP sanc-tions, and in particular, we consider the separate roles ofboth clinical and knowledge assessments. The studytherefore differs from previous work in emphasising na-tional postgraduate examinations, in comparing thevalue of knowledge and clinical assessments in predict-ing poor performance and in considering both UK grad-uates and non-UK graduates.
MethodAnalyses were carried out separately for MRCGP andMRCP(UK), with examination performance being linkedto the FtP sanctions recorded on the publically availableversion of the LRMP. A small number of candidates takeboth MRCGP and MRCP(UK) [21], but analyses for
present purposes were conducted separately. For bothanalyses, examination performance was based on marksat the first attempt, which are the most useful predictorsof subsequent performance [22]. Marks at first attemptare approximately normally distributed, whereas marksat second and later attempts are difficult to interpret asa result of failure at first or other previous attempts. Passmarks vary between diets (sittings) of an exam due tovariation in question difficulty, and therefore, all markswere firstly expressed as marks above or below the passmark. They were then converted to z-scores (mean 0;SD 1), which allows a direct comparison of different ex-aminations which have different marking schemes. ForMRCP(UK) Parts 1 and 2, diets from 2009/1 to 2010/1onwards statistical equating were used for standard set-ting, with marks expressed relative to a fixed pass mark[23]. For earlier diets and other exams, the use ofz-scores does not provide a full and complete equatingbut in practical terms is a pragmatic approach.
MRCGPThe MRCGP examination is in two parts, typically takenin the second and third year of specialty training, whichare in the fourth and fifth year after qualification. TheAKT (Applied Knowledge Test) is assessed by a190-min, mainly multiple-choice, assessment with 200questions, largely in the one-from-five format, and theCSA (Clinical Skills Assessment) is an assessment ofclinical skills, assessed by means of a 3-h examinationinvolving cases played by simulated patients (actors)across 13 stations in a simulated surgery (clinic). Detailscan be seen on the RCGP website [24]. For the AKT, theprimary dataset was for 35,368 candidates who took theexam between 2007 and 2016, of whom 27,561 were attheir first attempt. For the CSA, the primary dataset wasfor 23,158 candidates taking the examination between2010 and 2016, of whom 17,365 were on their firstattempt.
MRCP(UK)The MRCP(UK) examination is in three parts, Part 1,Part 2 and PACES (Practical Assessment of Clinical andExamination Skills), which typically are taken in the sec-ond to fourth years after qualifying. Parts 1 and 2 duringthe study period were multiple-choice-based knowledgeassessments [23], lasting 6 and 9 h, with 200 and 270best-of-five questions. PACES and, its successor,nPACES introduced in 2009 [25] are clinical examina-tions assessing physical examination, diagnosis, manage-ment, history-taking and communication. The primarydataset contained results for 44,314 candidates of whom37,358 were taking Part 1 for the first time in the dietsfrom 2002/2 (i.e. the second diet [sitting] of 2002) to2016/3, for 28,285 candidates taking Part 2 for the first
Wakeford et al. BMC Medicine (2018) 16:230 Page 3 of 16
in the diets from 2002/3 to 2016/3 and 27,040 takingPACES for the first time. nPACES has a pass markwhich must be achieved on each of seven separate skills,and so for ease of analysis here, a single composite scorewas calculated which was equated to that in PACES.Equating was initially carried out linearly using data ac-quired at the piloting stage of nPACES when examinersassessed candidates using the marking schemes for bothPACES and nPACES and was subsequently validated byshowing that pass rates did not differ for the old andnew marking schemes.
LRMPThe complete LRMP is provided on subscription andwas downloaded at monthly intervals from Sept 2008 toJan 2017 and any practitioners with sanctions noted.Linkage to MRCGP and MRCP(UK) was by means ofthe GMC number, the unique reference number for alldoctors registered in the UK. Doctors were recorded ashaving any of the five ESCUW FtP sanctions at anypoint in the dataset, and the overall binary ESCUW vari-able recorded whether or not doctors had any sanctionsat any time. Detailed reasons for sanctions are not avail-able on the LRMP, nor does it contain information aboutwhether a doctor is currently under investigation, unlessthey have been suspended temporarily while the investi-gation takes place. Complaints and FtP issues are knownto be more frequent amongst male doctors, BME (Blackand minority ethnic) doctors and doctors who graduatedfrom a non-UK medical school [26].
Demographics of doctorsThe sex of doctors, along with whether they were gradu-ates of UK or non-UK medical schools, was obtainedfrom the LRMP. Ethnicity of doctors is not included inLRMP, but self-reported ethnicity is available for a ma-jority of doctors in the MRCGP and MRCP(UK) data-bases and for present purposes was coded as White vsBME. Variation in FtP sanctions by sex, ethnicity andplace of qualification is not immediately relevant toassessing the extent to which examination results predictFtP issues, since written examinations are marked inde-pendently of knowledge of sex, ethnicity or place ofqualification (although all three show a relationship toexamination performance [21]). However, our analysesof the relationship of FtP sanctions and performance onwritten and clinical examinations separately withingroups based on sex, ethnicity and place of qualificationwill show that confounding cannot explain the associ-ation that we find. Machine-marked knowledge assess-ments can show differential item functioning (DIF),whereby item performance relates to sex or ethnicity,and analyses of MRCP(UK) Part 1 suggest that differen-tial item performance in UK graduates in relation to sex
or ethnicity is extremely rare [27]. In contrast, DIF doesoccur when UK and non-UK graduates are compared[23], but probably relates to differential training andclinical experience.
Statistical methodsStatistical analysis used IBM SPSS v24.0 and R v3.4.4.Graphical analyses used IBM SPSS and the ggplot2 pack-age in R [28].Simple comparisons of the mean marks of doctors
with or without ESCUW used t tests, with effect sizescalculated as Cohen’s d and AUC, the area under theROC (receiver operating characteristic) curve. ROC ana-lyses are carried out to assess how effective the examin-ation results would be, were they to be used as adiagnostic test for subsequent ESCUW, i.e. to see the re-lationship between specificity (the true positive rate) and1-sensitivity (the false positive rate) as a result of usingdifferent thresholds. For ROCs, the area under the curve(AUC) is a measure of the effectiveness of a diagnostictest, greater areas indicating better ability to predict out-comes. Comparison of ROC curves and the calculationof AUCs and their standard errors, as well as compari-son of AUCs between assessments, were carried outusing the pROC() function in R [29].Logistic regressions were used to model the binary
outcome of ESCUW in relation to predictor variablesexpressed as standardised (z) scores with a mean of 0and standard deviation (SD) of 1, so that b values givethe increased loge(OR) [OR = odds ratio] for a 1 SDchange in an examination score. ORs for a particularexam were expressed as the increased odds of ESCUWfor a doctor on the 2.5th percentile of exam marks in re-lation to a doctor on the 97.5th percentile, other exami-nations being at mean performance.Multiple logistic regression assessed the loge(OR) of
ESCUW in relation to MRCGP AKT and CSA, and toMRCP(UK) Parts 1, 2 and PACES, to assess the relativeprediction from different examination types. Missingvalues were present for structural reasons, doctors whofailed one part of MRCP(UK) typically not taking laterparts, but results in both exams are also missing becauseof truncation within the time window used, some examsbeing taken outside of the time window, i.e. before datacollection began or in the future. Missing exam resultsfor the multiple regression were imputed 100 timesusing the Multiple Imputation package in IBM SPSSunder the assumption that data are missing at random(MAR).
A note on the interpretation of log odds ratiosRaw data can be expressed in terms of the probability, p,which is the proportion of cases having a sanction, andhence, the probability of not having a sanction is (1 − p).
Wakeford et al. BMC Medicine (2018) 16:230 Page 4 of 16
The odds of having a sanction is p/(1 − p). Logistic re-gression models logit(p) where logit(p) = loge(odds) =loge(p/(1 − p)), loge() indicates natural logarithms to basee (with e being Euler’s number, 2.71828…). Logistic re-gression is used because probabilities are bounded bythe values 0 and 1, and simple regression models withprobabilities as a dependent variable can predict non-sensical probabilities of greater than 1 or less than 0. Incontrast logit(p) has a range from minus infinity to plusinfinity. For similar reasons, it mostly makes little theor-etical sense to plot p against a predictor as the relation-ship is necessarily curvilinear, p being constrained to therange 0 to 1. Likewise, it rarely makes sense to plot oddsagainst a predictor variable, particularly when p valuesare low (the so-called rare disease case) since as p ap-proaches 0 and odds are calculated as p/(1 − p), so 1 − papproaches 1 and therefore odds ≈ p/1 = p, also makingcurvilinearity inevitable and difficult to interpret. Inter-preting loge(odds) is not always intuitive but is simplerwhen p values are small. Logistic regression equationssay that logit(p) = a + b.x, where a is a constant and b amultiplier of a predictor variable, x. For small p, theequation becomes log(p) = a + b.x, and b indicates themultiplicative change in p for a one-step change in b. Asa simple example, consider probabilities of 0.1, 0.01,0.001 and 0.0001, predictors of values 1, 2, 3 and 4, andlet logs be to base 10, so that log10(p) is − 1, − 2, − 3 and− 4. A one-step increase in x, e.g. from 1 to 2, results ina decrease in log(p) of − 1, and hence, p is reduced by afactor of 10. Because a + b.x is a linear model, then werean intervention to reduce x by 1 then all probabilitieswould be reduced by a factor of 10, whether they startedat 0.1 or 0.0001, indicating a common mechanism orprocess.
ResultsESCUWConsidering all the 380,583 doctors in the LRMP re-cords at 1 Jan 2017, there were 6158 doctors who hadESCUW during the study period (1.62%), 680 (0.23%)erased, 2250 (0.59%) suspended, 2871 (0.75%) with con-ditions, 1263 (0.33%) with undertakings and 1735(0.46%) with warnings. Three thousand eight hundredseventy-eight (63.0%) of the 6158 doctors with ESCUWhad only one FtP sanction, the remainder having two(1776; 28.8%), three (468; 7.6%), four (35; 0.6%) or five(1; 0.02%) sanctions. The loge(OR) of a doctor havingESCUW was analysed using a multiple logistic regres-sion on the entire LRMP in terms of a doctor’s sex, placeof qualification (UK vs others), years since qualificationand years since qualification not spent on the GMCRegister (presumably for IMGs due to time spent work-ing outside the UK before arrival in the UK). Doctorswho had been on the LRMP for longer were more likely
to have ESCUW, rising from 0.5% of doctors in the firstdecade after graduation to 1.3% in the second decade,2.0% in the third decade, 2.8% in the fourth decade and3.1% in the fifth decade, presumably due to increasingopportunity for problems to arise. The majority of doc-tors taking MRCGP or MRCP(UK) during the timeperiod of this study were in the first decade or two afterqualifying (median of 11 years since qualification).Multiple logistic regression showed that those with
ESCUW were 2.73× more likely to be male (loge(OR) =1.004, SE = 0.034, OR = 2.730×), to have been qualifiedlonger (loge(OR) = 0.065 per decade, SE = .008, OR =1.067× per decade), not to have qualified in the UK(loge(OR) = 0.304, SE = 0.033, OR = 1.355×) and to havespent more time not on the GMC Register (loge(OR) =0.206 per decade, SE = 0.023, OR = 1.228× per decade).Note that the vast majority of doctors who had spentlonger not on the GMC Register were those who hadqualified outside of the UK. It should also be emphasisedthat ethnicity is not available in the LRMP.
MRCGPMRCGP results were available for 27,561 doctors whohad taken AKT at the first attempt during the studyperiod, with the 423 (1.53%) having ESCUW scoring sig-nificantly lower on the exam than those withoutESCUW, the Cohen’s d effect size being − 0.734(Table 1). Similarly, of 17,365 doctors who had takenCSA at the first attempt, 238 (1.38%) had ESCUW andhad scored significantly lower on the exam, with aCohen’s d of − 0.805 (Table 1). Simple logistic regres-sions showed significant effects for both AKT and CSA(Table 2).Multiple logistic regression of ESCUW on both AKT
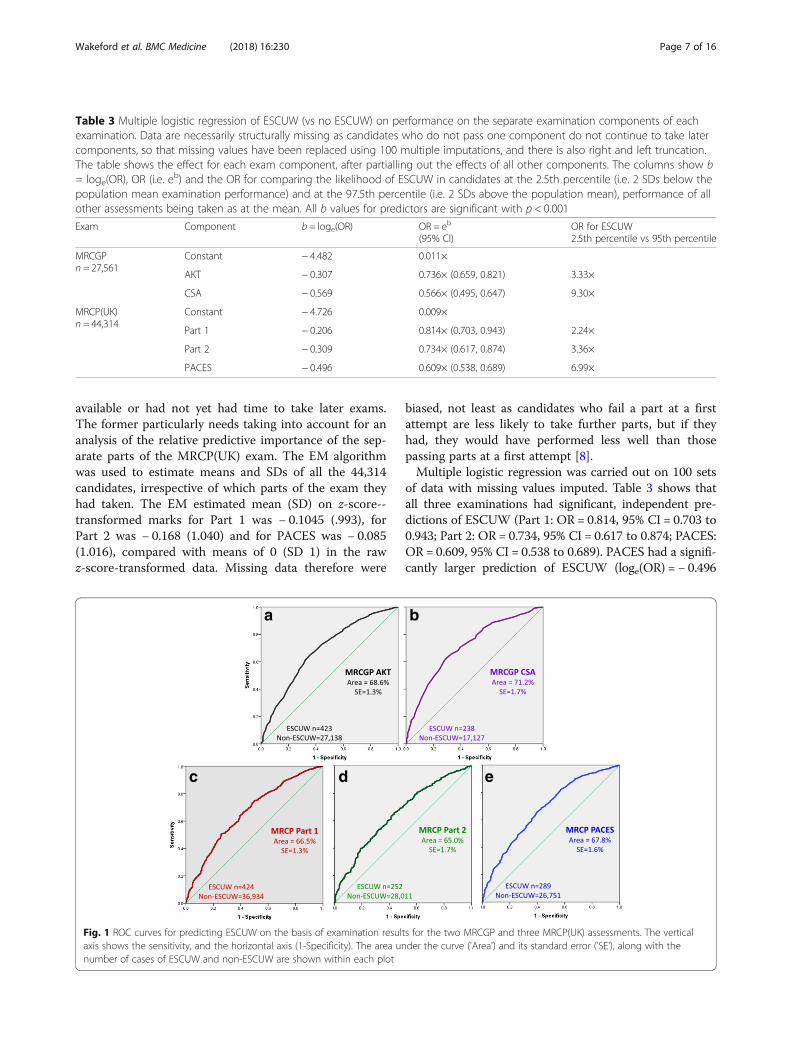
and CSA used 100 multiple imputations for the 27,651candidates. EM (expectation maximisation) estimationof means and SDs showed no difference in overall per-formance of imputed and non-imputed cases, missingCSA results being due to candidates not yet havingtaken the exam. The multiple logistic regression showedthat AKT and CSA both had independent predictive ef-fects after taking the other into account, with the effectof CSA being greater than that for AKT and the 95%confidence intervals for the ORs not overlapping(Table 3: AKT OR = 0.736: 95% CI 0.659 to 0.821; CSAOR = 0.566: 95% CI = 0.495 to 0.647). For completeness,the equivalent ORs on the raw, non-imputed datasetwere calculated (AKT OR = 0.774: 95% CI 0.678 to0.885; CSA OR = 0.576: 95% CI = 0.502 to 0.660) and arevery similar to the imputed results.Areas under the ROC curve were 68.6% (SE 1.3%) and
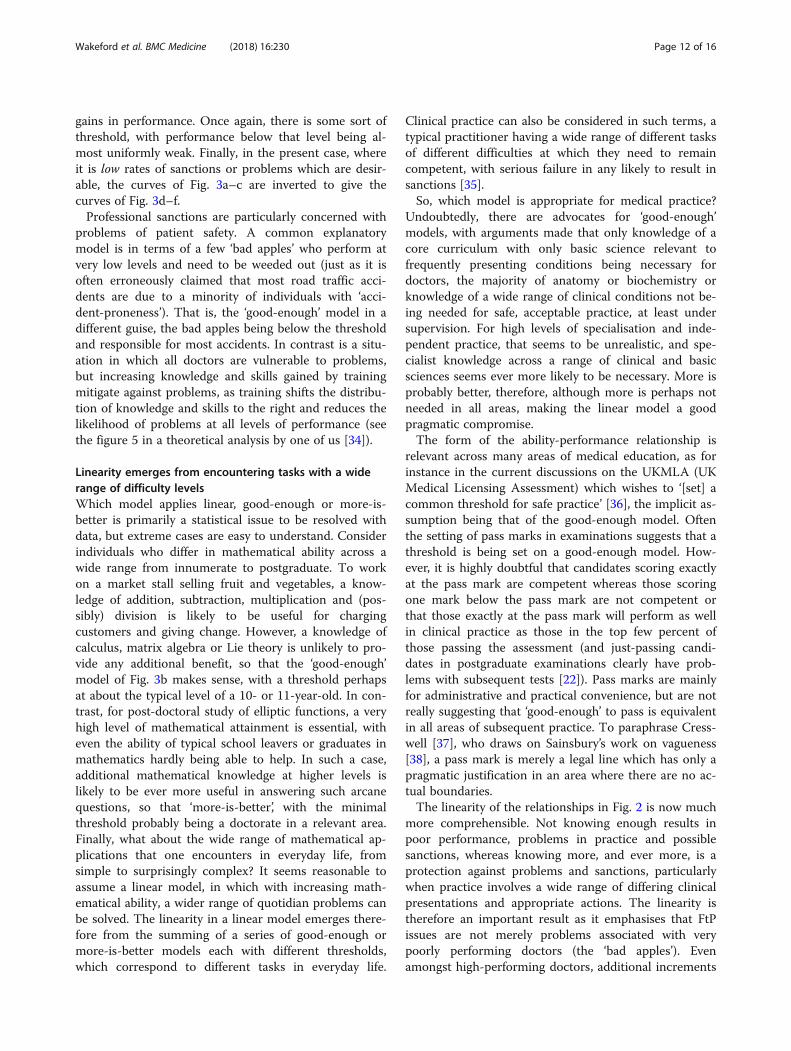
71.2% (SE 1.7%) for the AKT and CSA assessments, re-spectively (see Fig. 1a, b). A paired analysis of AUCsunder the AKT and CSA curves using the roc.test()
Wakeford et al. BMC Medicine (2018) 16:230 Page 5 of 16
function in pROC showed a significant difference (z =2.82, z = 0.0048), with AUC estimates in the paired dataof 0.666 and 0.713 for AKT and CSA, respectively, show-ing that the CSA better predicts ESCUW than AKT.
MRCP(UK)After merging, the database had 44,314 doctors who hadtaken Part 1 (n = 37,358), Part 2 (n = 28,285) or PACES(n = 27,040) at a first attempt and were on the LRMPand so had data on ESCUW. Twenty thousand two hun-dred ninety-nine doctors had taken all three MRCP(UK)parts, 7771 had taken two parts and 20,299 had takenonly one part.Of 37,358 doctors who were on their first attempt at
Part 1, 423 (1.13%) had ESCUW and had significantlylower scores on the exam, Cohen’s d being − 0.617(Table 1). In a simple logistic regression, standardisedPart 1 scores significantly predicted ESCUW (loge(OR)= − 0.597, SE = 0.048, OR = 0.550× per SD). Multiple lo-gistic regression taking into account sex, ethnicity, UKqualification, decades since qualification and decadesnot on the UK Register showed that Part 1 scores were
still significant predictors of ESCUW (loge(OR) = −0.376, SE = 0.052, OR = 0.687× per SD).For first attempt at Part 2, there were 28,285 doctors
of whom 274 had ESCUW (0.97%), and they had signifi-cantly lower marks with an effect size of − 0.536. On itsown, Part 2 score predicted ESCUW (loge(OR) = − 0.589per SD, SE = 0.066, OR = 0.555× per SD). After takingsex, UK qualification, decades since qualification and de-cades not on the UK Register into account, Part 2 scoreswere still significant predictors of ESCUW (loge(OR) = −0.379 per SD, SE = 0.074, OR = 0.685× per SD).Of 27,040 doctors taking PACES for the first time, 289
(1.07%) had ESCUW and had scored significantly loweron the exam with Cohen’s d = − 0.696 (Table 1). PACESscore alone predicted ESCUW (loge(OR) = − 0.588 perSD, SE = 0.051, OR = 0.555× per SD), and the effectremained highly significant after taking into account sex,UK qualification, decades since qualification and decadesnot on the UK Register (loge(OR) = − 0.356 per SD, SE =0.063, OR = 0.700× per SD).Data for Part 2 and PACES were missing where candi-
dates had failed earlier exams (Part 1 or Part 2) or hadtaken exams before the time window in which data were
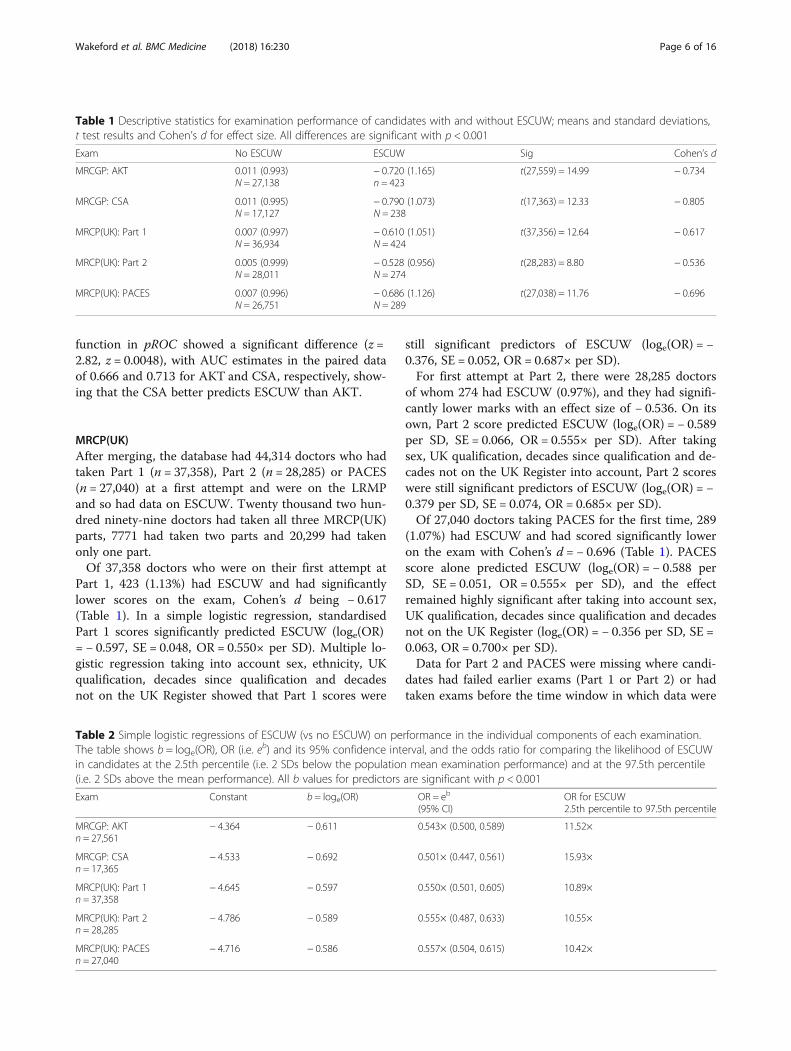
Table 1 Descriptive statistics for examination performance of candidates with and without ESCUW; means and standard deviations,t test results and Cohen’s d for effect size. All differences are significant with p < 0.001
Exam No ESCUW ESCUW Sig Cohen’s d
MRCGP: AKT 0.011 (0.993)N = 27,138
− 0.720 (1.165)n = 423
t(27,559) = 14.99 − 0.734
MRCGP: CSA 0.011 (0.995)N = 17,127
− 0.790 (1.073)N = 238
t(17,363) = 12.33 − 0.805
MRCP(UK): Part 1 0.007 (0.997)N = 36,934
− 0.610 (1.051)N = 424
t(37,356) = 12.64 − 0.617
MRCP(UK): Part 2 0.005 (0.999)N = 28,011
− 0.528 (0.956)N = 274
t(28,283) = 8.80 − 0.536
MRCP(UK): PACES 0.007 (0.996)N = 26,751
− 0.686 (1.126)N = 289
t(27,038) = 11.76 − 0.696
Table 2 Simple logistic regressions of ESCUW (vs no ESCUW) on performance in the individual components of each examination.The table shows b = loge(OR), OR (i.e. eb) and its 95% confidence interval, and the odds ratio for comparing the likelihood of ESCUWin candidates at the 2.5th percentile (i.e. 2 SDs below the population mean examination performance) and at the 97.5th percentile(i.e. 2 SDs above the mean performance). All b values for predictors are significant with p < 0.001
Exam Constant b = loge(OR) OR = eb
(95% CI)OR for ESCUW2.5th percentile to 97.5th percentile
MRCGP: AKTn = 27,561
− 4.364 − 0.611 0.543× (0.500, 0.589) 11.52×
MRCGP: CSAn = 17,365
− 4.533 − 0.692 0.501× (0.447, 0.561) 15.93×
MRCP(UK): Part 1n = 37,358
− 4.645 − 0.597 0.550× (0.501, 0.605) 10.89×
MRCP(UK): Part 2n = 28,285
− 4.786 − 0.589 0.555× (0.487, 0.633) 10.55×
MRCP(UK): PACESn = 27,040
− 4.716 − 0.586 0.557× (0.504, 0.615) 10.42×
Wakeford et al. BMC Medicine (2018) 16:230 Page 6 of 16
available or had not yet had time to take later exams.The former particularly needs taking into account for ananalysis of the relative predictive importance of the sep-arate parts of the MRCP(UK) exam. The EM algorithmwas used to estimate means and SDs of all the 44,314candidates, irrespective of which parts of the exam theyhad taken. The EM estimated mean (SD) on z-score--transformed marks for Part 1 was − 0.1045 (.993), forPart 2 was − 0.168 (1.040) and for PACES was − 0.085(1.016), compared with means of 0 (SD 1) in the rawz-score-transformed data. Missing data therefore were
biased, not least as candidates who fail a part at a firstattempt are less likely to take further parts, but if theyhad, they would have performed less well than thosepassing parts at a first attempt [8].Multiple logistic regression was carried out on 100 sets
of data with missing values imputed. Table 3 shows thatall three examinations had significant, independent pre-dictions of ESCUW (Part 1: OR = 0.814, 95% CI = 0.703 to0.943; Part 2: OR = 0.734, 95% CI = 0.617 to 0.874; PACES:OR = 0.609, 95% CI = 0.538 to 0.689). PACES had a signifi-cantly larger prediction of ESCUW (loge(OR) = − 0.496
Table 3 Multiple logistic regression of ESCUW (vs no ESCUW) on performance on the separate examination components of eachexamination. Data are necessarily structurally missing as candidates who do not pass one component do not continue to take latercomponents, so that missing values have been replaced using 100 multiple imputations, and there is also right and left truncation.The table shows the effect for each exam component, after partialling out the effects of all other components. The columns show b= loge(OR), OR (i.e. eb) and the OR for comparing the likelihood of ESCUW in candidates at the 2.5th percentile (i.e. 2 SDs below thepopulation mean examination performance) and at the 97.5th percentile (i.e. 2 SDs above the population mean), performance of allother assessments being taken as at the mean. All b values for predictors are significant with p < 0.001
Exam Component b = loge(OR) OR = eb
(95% CI)OR for ESCUW2.5th percentile vs 95th percentile
MRCGPn = 27,561
Constant − 4.482 0.011×
AKT − 0.307 0.736× (0.659, 0.821) 3.33×
CSA − 0.569 0.566× (0.495, 0.647) 9.30×
MRCP(UK)n = 44,314
Constant − 4.726 0.009×
Part 1 − 0.206 0.814× (0.703, 0.943) 2.24×
Part 2 − 0.309 0.734× (0.617, 0.874) 3.36×
PACES − 0.496 0.609× (0.538, 0.689) 6.99×
a b
c d e
Fig. 1 ROC curves for predicting ESCUW on the basis of examination results for the two MRCGP and three MRCP(UK) assessments. The verticalaxis shows the sensitivity, and the horizontal axis (1-Specificity). The area under the curve ('Area') and its standard error ('SE'), along with thenumber of cases of ESCUW and non-ESCUW are shown within each plot
Wakeford et al. BMC Medicine (2018) 16:230 Page 7 of 16
per SD; 95% CI − 0.619 to − 0.373) than did Part 1(loge(OR) = − 0.206 per SD; 95% CI = − 0.353 to − 0.059),the confidence intervals not overlapping. The independentpredictive effect of Part 2 was between that of PACES andPart 1. Analysis of the non-imputed raw dataset based on20,299 complete cases found broadly similar effects to thatof the imputed data set (Part 1: OR = 1.007; 95% CI =0.820 to 1.237; Part 2: OR = 0.745; 95% CI = 0.607 to0.916; PACES: OR = 0.655; 95% CI = 0.568 to 0.756), withsignificant effects for Part 2 and PACES (p = 0.005 and p< 0.001) but not for Part 1 (p = 0.945). The non-significantresult for Part 1 presumably occurs because it is heavilyrange restricted, only candidates passing all three parts be-ing included, and Part 2 correlating with Part 1 and ac-counting for Part 1’s variance.The areas under the ROC curves were 66.5% (SE
1.3%), 65.0% (SE 1.7%) and 67.8% (SE 1.6%) for Parts 1,2 and PACES, respectively (see Fig. 1c–e). A paired ana-lysis of AUCs for Part 1, Part 2 and PACES curves usingthe roc.test() function in pROC showed a significant dif-ference between Part 1 and PACES (z = 2.39, p = 0.017,AUCs for paired data = 0.593 and 0.653) but not betweenPart 1 and Part 2(z = 1.49, p = 0.14, AUCs for paireddata = 0.645 and 0.676) or Part 2 and PACES (z = 1.88, p= 0.060, AUCs for paired data = 0.602 and 0.635). PACESis therefore a better predictor of ESCUW than eitherPart 1 or Part 2.Unpaired comparison of ROCs for the MRCGP and
MRCP(UK) assessments showed no significant differences
in AUCs between the knowledge tests (AKT vs Part 1,p = 0.27) or the clinical assessments (CSA vs PACES,p = 0.14).
Overall estimates of effect sizeIt is convenient to have a simple overall estimate of therelationship of exam results to the likelihood of FtP is-sues. For Table 1, the unweighted mean of the five effectsizes is − 0.678 (range = − 0.536 to − 0.805), and forTable 2, the unweighted mean of the five odds ratioscomparing candidates at the 2.5th and 97.5th perform-ance percentiles is 11.86×.
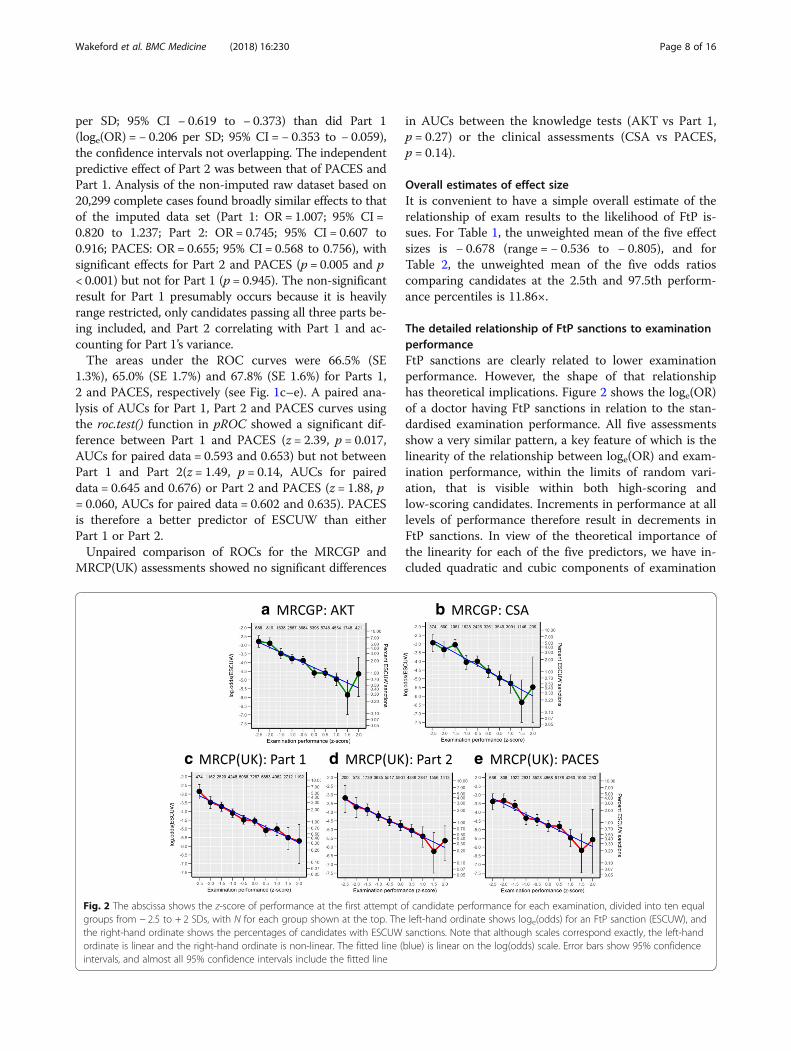
The detailed relationship of FtP sanctions to examinationperformanceFtP sanctions are clearly related to lower examinationperformance. However, the shape of that relationshiphas theoretical implications. Figure 2 shows the loge(OR)of a doctor having FtP sanctions in relation to the stan-dardised examination performance. All five assessmentsshow a very similar pattern, a key feature of which is thelinearity of the relationship between loge(OR) and exam-ination performance, within the limits of random vari-ation, that is visible within both high-scoring andlow-scoring candidates. Increments in performance at alllevels of performance therefore result in decrements inFtP sanctions. In view of the theoretical importance ofthe linearity for each of the five predictors, we have in-cluded quadratic and cubic components of examination
c
a b
d e
Fig. 2 The abscissa shows the z-score of performance at the first attempt of candidate performance for each examination, divided into ten equalgroups from − 2.5 to + 2 SDs, with N for each group shown at the top. The left-hand ordinate shows loge(odds) for an FtP sanction (ESCUW), andthe right-hand ordinate shows the percentages of candidates with ESCUW sanctions. Note that although scales correspond exactly, the left-handordinate is linear and the right-hand ordinate is non-linear. The fitted line (blue) is linear on the log(odds) scale. Error bars show 95% confidenceintervals, and almost all 95% confidence intervals include the fitted line
Wakeford et al. BMC Medicine (2018) 16:230 Page 8 of 16
performance into the model, and in no case were theadditional improvements in fit significant at the p < 0.05level. The linearity of the relationships between loge(OR)and examination performance in Fig. 2 are therefore arobust and an intriguing finding.
ESCUW in subgroups based on place of graduation, sexand ethnicityPlace of Primary Medical Qualification (PMQ; coded asUK or elsewhere), sex and ethnicity are known to be re-lated to FtP sanctions, and PMQ, sex and ethnicity alsorelate to performance of postgraduate medical examina-tions. It is therefore important to ensure that the pre-dictive effects of postgraduate performance are notconfounded by demographic differences. Table 4 shows,for both MRCGP and MRCP(UK), the performance ofESCUW and non-ESCUW doctors broken down by UK/non-UK graduate, male/female and white/BME (withethnicity not broken down in non-UK graduates as Nsof white doctors were small). In all sub-groups on all ex-aminations, the ESCUW doctors perform less well, al-though differences are not always individually significantdue to small sample sizes. Analyses of variance of thefive examinations showed that UK graduates and Whitedoctors in each case performed better (p < 0.001 in eachcase). Sex differences were more variable with men per-forming better on MRCP(UK) Parts 1 and 2 but womenperforming better on MRCGP AKT and CSA andMRCP(UK) PACES. Despite all such differences, theESCUW doctors performed less well overall for all ex-aminations (p < 0.001), with no interactions with UKgraduation, sex or ethnicity. The mean overall Cohen’s dwas − 0.49, which is a little less than the values in Table 1because variance between groups has been removed.
The causal relationship between examinationperformance and ESCUW sanctionsThe previous analyses make clear that there is an associ-ation between poor examination performance and re-ceiving ESCUW sanctions. The direction of causalitythough is not immediately clear as it may be that beinginvestigated for FtP problems may itself have resulted inpoor examination performance. We investigated the tim-ing of exams and ESCUW sanctions for both the first at-tempt at MRCGP AKT and the first attempt atMRCP(UK) Part 1. The analyses were not carried out forMRCGP CSA and MRCP(UK) Part 2 and PACES asthere were greater overlaps in the timing of ESCUWsanctions and the timing of the exam.
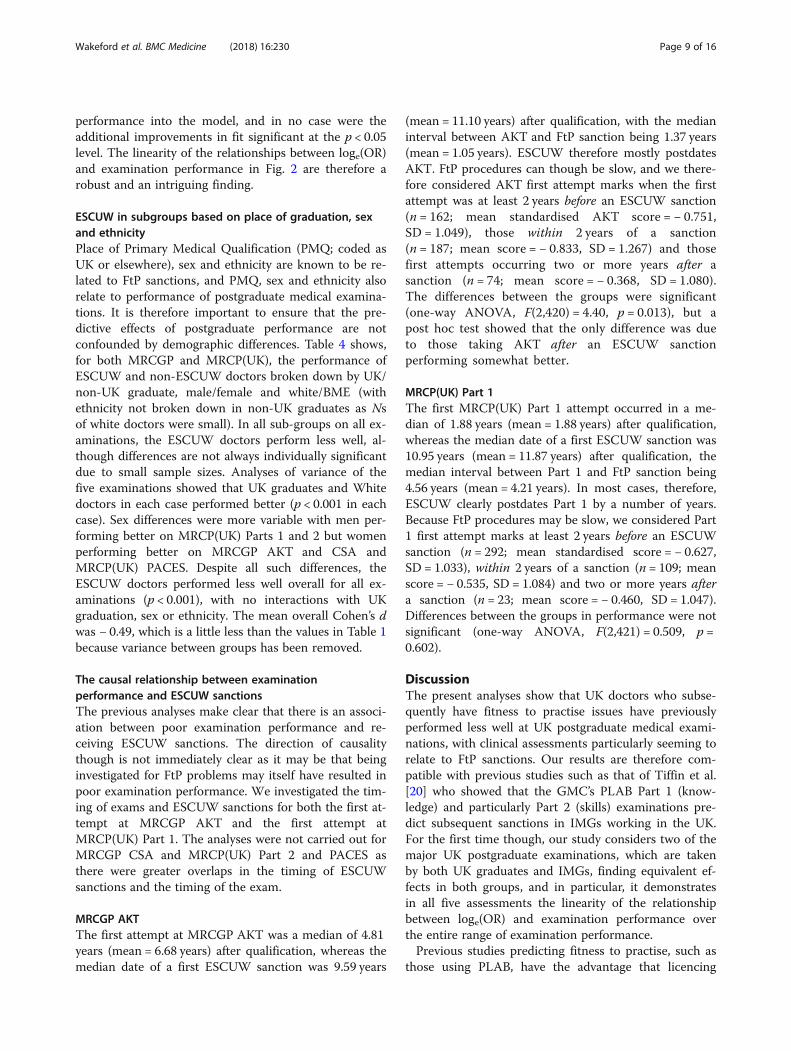
MRCGP AKTThe first attempt at MRCGP AKT was a median of 4.81years (mean = 6.68 years) after qualification, whereas themedian date of a first ESCUW sanction was 9.59 years
(mean = 11.10 years) after qualification, with the medianinterval between AKT and FtP sanction being 1.37 years(mean = 1.05 years). ESCUW therefore mostly postdatesAKT. FtP procedures can though be slow, and we there-fore considered AKT first attempt marks when the firstattempt was at least 2 years before an ESCUW sanction(n = 162; mean standardised AKT score = − 0.751,SD = 1.049), those within 2 years of a sanction(n = 187; mean score = − 0.833, SD = 1.267) and thosefirst attempts occurring two or more years after asanction (n = 74; mean score = − 0.368, SD = 1.080).The differences between the groups were significant(one-way ANOVA, F(2,420) = 4.40, p = 0.013), but apost hoc test showed that the only difference was dueto those taking AKT after an ESCUW sanctionperforming somewhat better.
MRCP(UK) Part 1The first MRCP(UK) Part 1 attempt occurred in a me-dian of 1.88 years (mean = 1.88 years) after qualification,whereas the median date of a first ESCUW sanction was10.95 years (mean = 11.87 years) after qualification, themedian interval between Part 1 and FtP sanction being4.56 years (mean = 4.21 years). In most cases, therefore,ESCUW clearly postdates Part 1 by a number of years.Because FtP procedures may be slow, we considered Part1 first attempt marks at least 2 years before an ESCUWsanction (n = 292; mean standardised score = − 0.627,SD = 1.033), within 2 years of a sanction (n = 109; meanscore = − 0.535, SD = 1.084) and two or more years aftera sanction (n = 23; mean score = − 0.460, SD = 1.047).Differences between the groups in performance were notsignificant (one-way ANOVA, F(2,421) = 0.509, p =0.602).
DiscussionThe present analyses show that UK doctors who subse-quently have fitness to practise issues have previouslyperformed less well at UK postgraduate medical exami-nations, with clinical assessments particularly seeming torelate to FtP sanctions. Our results are therefore com-patible with previous studies such as that of Tiffin et al.[20] who showed that the GMC’s PLAB Part 1 (know-ledge) and particularly Part 2 (skills) examinations pre-dict subsequent sanctions in IMGs working in the UK.For the first time though, our study considers two of themajor UK postgraduate examinations, which are takenby both UK graduates and IMGs, finding equivalent ef-fects in both groups, and in particular, it demonstratesin all five assessments the linearity of the relationshipbetween loge(OR) and examination performance overthe entire range of examination performance.Previous studies predicting fitness to practise, such as
those using PLAB, have the advantage that licencing
Wakeford et al. BMC Medicine (2018) 16:230 Page 9 of 16
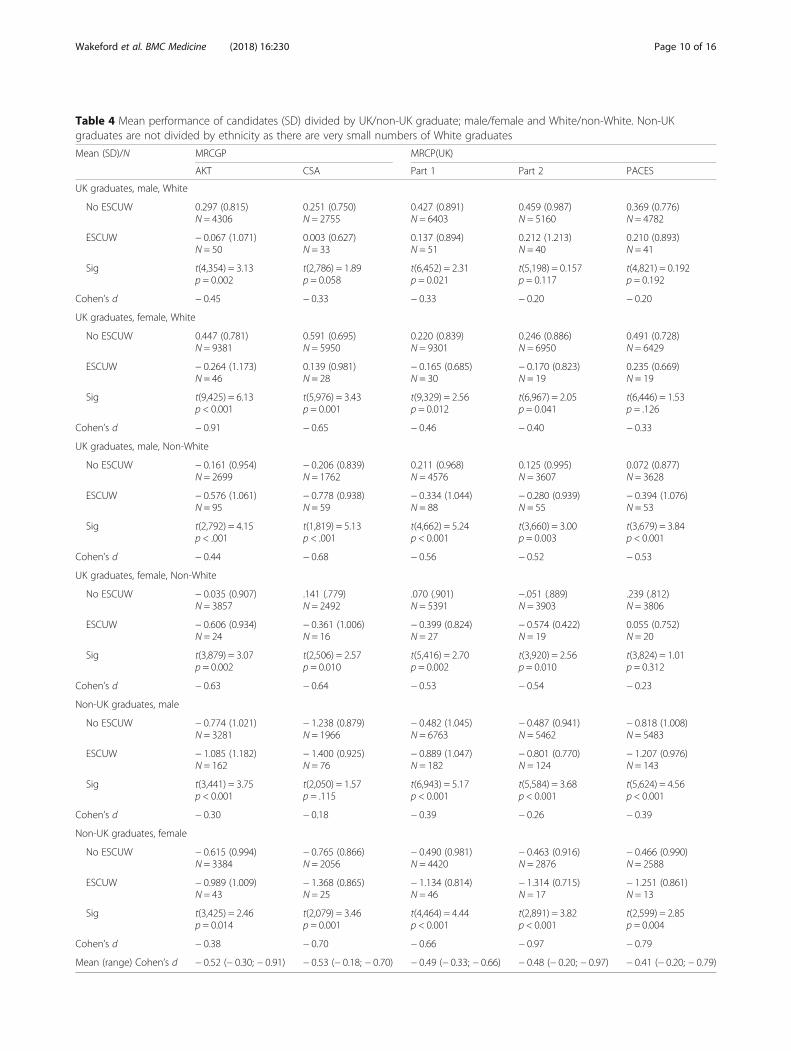
Table 4 Mean performance of candidates (SD) divided by UK/non-UK graduate; male/female and White/non-White. Non-UKgraduates are not divided by ethnicity as there are very small numbers of White graduates
Mean (SD)/N MRCGP MRCP(UK)
AKT CSA Part 1 Part 2 PACES
UK graduates, male, White
No ESCUW 0.297 (0.815)N = 4306
0.251 (0.750)N = 2755
0.427 (0.891)N = 6403
0.459 (0.987)N = 5160
0.369 (0.776)N = 4782
ESCUW − 0.067 (1.071)N = 50
0.003 (0.627)N = 33
0.137 (0.894)N = 51
0.212 (1.213)N = 40
0.210 (0.893)N = 41
Sig t(4,354) = 3.13p = 0.002
t(2,786) = 1.89p = 0.058
t(6,452) = 2.31p = 0.021
t(5,198) = 0.157p = 0.117
t(4,821) = 0.192p = 0.192
Cohen’s d − 0.45 − 0.33 − 0.33 − 0.20 − 0.20
UK graduates, female, White
No ESCUW 0.447 (0.781)N = 9381
0.591 (0.695)N = 5950
0.220 (0.839)N = 9301
0.246 (0.886)N = 6950
0.491 (0.728)N = 6429
ESCUW − 0.264 (1.173)N = 46
0.139 (0.981)N = 28
− 0.165 (0.685)N = 30
− 0.170 (0.823)N = 19
0.235 (0.669)N = 19
Sig t(9,425) = 6.13p < 0.001
t(5,976) = 3.43p = 0.001
t(9,329) = 2.56p = 0.012
t(6,967) = 2.05p = 0.041
t(6,446) = 1.53p = .126
Cohen’s d − 0.91 − 0.65 − 0.46 − 0.40 − 0.33
UK graduates, male, Non-White
No ESCUW − 0.161 (0.954)N = 2699
− 0.206 (0.839)N = 1762
0.211 (0.968)N = 4576
0.125 (0.995)N = 3607
0.072 (0.877)N = 3628
ESCUW − 0.576 (1.061)N = 95
− 0.778 (0.938)N = 59
− 0.334 (1.044)N = 88
− 0.280 (0.939)N = 55
− 0.394 (1.076)N = 53
Sig t(2,792) = 4.15p < .001
t(1,819) = 5.13p < .001
t(4,662) = 5.24p < 0.001
t(3,660) = 3.00p = 0.003
t(3,679) = 3.84p < 0.001
Cohen’s d − 0.44 − 0.68 − 0.56 − 0.52 − 0.53
UK graduates, female, Non-White
No ESCUW − 0.035 (0.907)N = 3857
.141 (.779)N = 2492
.070 (.901)N = 5391
−.051 (.889)N = 3903
.239 (.812)N = 3806
ESCUW − 0.606 (0.934)N = 24
− 0.361 (1.006)N = 16
− 0.399 (0.824)N = 27
− 0.574 (0.422)N = 19
0.055 (0.752)N = 20
Sig t(3,879) = 3.07p = 0.002
t(2,506) = 2.57p = 0.010
t(5,416) = 2.70p = 0.002
t(3,920) = 2.56p = 0.010
t(3,824) = 1.01p = 0.312
Cohen’s d − 0.63 − 0.64 − 0.53 − 0.54 − 0.23
Non-UK graduates, male
No ESCUW − 0.774 (1.021)N = 3281
− 1.238 (0.879)N = 1966
− 0.482 (1.045)N = 6763
− 0.487 (0.941)N = 5462
− 0.818 (1.008)N = 5483
ESCUW − 1.085 (1.182)N = 162
− 1.400 (0.925)N = 76
− 0.889 (1.047)N = 182
− 0.801 (0.770)N = 124
− 1.207 (0.976)N = 143
Sig t(3,441) = 3.75p < 0.001
t(2,050) = 1.57p = .115
t(6,943) = 5.17p < 0.001
t(5,584) = 3.68p < 0.001
t(5,624) = 4.56p < 0.001
Cohen’s d − 0.30 − 0.18 − 0.39 − 0.26 − 0.39
Non-UK graduates, female
No ESCUW − 0.615 (0.994)N = 3384
− 0.765 (0.866)N = 2056
− 0.490 (0.981)N = 4420
− 0.463 (0.916)N = 2876
− 0.466 (0.990)N = 2588
ESCUW − 0.989 (1.009)N = 43
− 1.368 (0.865)N = 25
− 1.134 (0.814)N = 46
− 1.314 (0.715)N = 17
− 1.251 (0.861)N = 13
Sig t(3,425) = 2.46p = 0.014
t(2,079) = 3.46p = 0.001
t(4,464) = 4.44p < 0.001
t(2,891) = 3.82p < 0.001
t(2,599) = 2.85p = 0.004
Cohen’s d − 0.38 − 0.70 − 0.66 − 0.97 − 0.79
Mean (range) Cohen’s d − 0.52 (− 0.30; − 0.91) − 0.53 (− 0.18; − 0.70) − 0.49 (− 0.33; − 0.66) − 0.48 (− 0.20; − 0.97) − 0.41 (− 0.20; − 0.79)
Wakeford et al. BMC Medicine (2018) 16:230 Page 10 of 16
examinations are of necessity taken before clinical practiceand censure can take place, making inference of the direc-tion of causality straightforward. Postgraduate examinationsthough take place after doctors have been in clinical prac-tice for a while, and therefore, causation might occur in theopposite direction, the stress associated with FtP investiga-tions perhaps resulting in poorer examination performance.However, the analysis of timing in our study shows firstattempts at MRCGP AKT and MRCP(UK) Part 1 aretypically several years before an FtP sanction, and yet per-formance at AKT and Part 1 is still substantially poorer.The causal direction is therefore from poorer examinationperformance to FtP issues, rather than vice versa.
Linearity, ‘good-enough’ and ‘more-is-better’The large size of our study means that the detailed rela-tionship between examination performance andloge(OR) for FtP sanctions can be examined (see Fig. 2).It is clear that the relationship is linear across the entirerange of examination performance, as found elsewhere[17], every decrement in examination performanceresulting in an equal increment in the log odds of beingsanctioned. It should be mentioned that it is linearity onthe odds scale which is relevant, and not linearity on aprobability scale, probabilities having the problem thatthey cannot go below 0 or above 1 and therefore any re-lationship to ability must be non-linear, a difficulty thatis not found on odds (logit) scales which are bounded byplus and minus infinity. It is for that reason that regres-sion using binary variables uses a logistic (odds) scale.Interpreting the linearity in Fig. 2 requires a consider-
ation of what other form the relationship might havetaken. An important approach to such issues is that
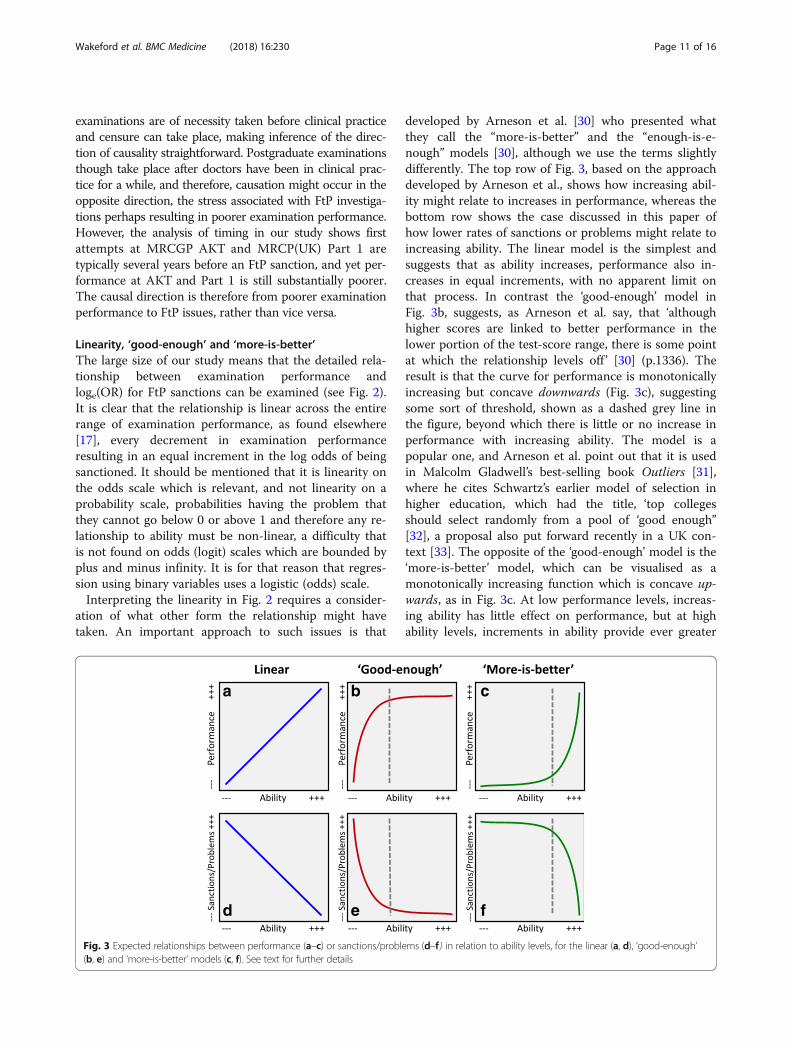
developed by Arneson et al. [30] who presented whatthey call the “more-is-better” and the “enough-is-e-nough” models [30], although we use the terms slightlydifferently. The top row of Fig. 3, based on the approachdeveloped by Arneson et al., shows how increasing abil-ity might relate to increases in performance, whereas thebottom row shows the case discussed in this paper ofhow lower rates of sanctions or problems might relate toincreasing ability. The linear model is the simplest andsuggests that as ability increases, performance also in-creases in equal increments, with no apparent limit onthat process. In contrast the ‘good-enough’ model inFig. 3b, suggests, as Arneson et al. say, that ‘althoughhigher scores are linked to better performance in thelower portion of the test-score range, there is some pointat which the relationship levels off ’ [30] (p.1336). Theresult is that the curve for performance is monotonicallyincreasing but concave downwards (Fig. 3c), suggestingsome sort of threshold, shown as a dashed grey line inthe figure, beyond which there is little or no increase inperformance with increasing ability. The model is apopular one, and Arneson et al. point out that it is usedin Malcolm Gladwell’s best-selling book Outliers [31],where he cites Schwartz’s earlier model of selection inhigher education, which had the title, ‘top collegesshould select randomly from a pool of ‘good enough’’[32], a proposal also put forward recently in a UK con-text [33]. The opposite of the ‘good-enough’ model is the‘more-is-better’ model, which can be visualised as amonotonically increasing function which is concave up-wards, as in Fig. 3c. At low performance levels, increas-ing ability has little effect on performance, but at highability levels, increments in ability provide ever greater
a b c
d e f
Fig. 3 Expected relationships between performance (a–c) or sanctions/problems (d–f ) in relation to ability levels, for the linear (a, d), ‘good-enough’(b, e) and ‘more-is-better’ models (c, f). See text for further details
Wakeford et al. BMC Medicine (2018) 16:230 Page 11 of 16
gains in performance. Once again, there is some sort ofthreshold, with performance below that level being al-most uniformly weak. Finally, in the present case, whereit is low rates of sanctions or problems which are desir-able, the curves of Fig. 3a–c are inverted to give thecurves of Fig. 3d–f.Professional sanctions are particularly concerned with
problems of patient safety. A common explanatorymodel is in terms of a few ‘bad apples’ who perform atvery low levels and need to be weeded out (just as it isoften erroneously claimed that most road traffic acci-dents are due to a minority of individuals with ‘acci-dent-proneness’). That is, the ‘good-enough’ model in adifferent guise, the bad apples being below the thresholdand responsible for most accidents. In contrast is a situ-ation in which all doctors are vulnerable to problems,but increasing knowledge and skills gained by trainingmitigate against problems, as training shifts the distribu-tion of knowledge and skills to the right and reduces thelikelihood of problems at all levels of performance (seethe figure 5 in a theoretical analysis by one of us [34]).
Linearity emerges from encountering tasks with a widerange of difficulty levelsWhich model applies linear, good-enough or more-is-better is primarily a statistical issue to be resolved withdata, but extreme cases are easy to understand. Considerindividuals who differ in mathematical ability across awide range from innumerate to postgraduate. To workon a market stall selling fruit and vegetables, a know-ledge of addition, subtraction, multiplication and (pos-sibly) division is likely to be useful for chargingcustomers and giving change. However, a knowledge ofcalculus, matrix algebra or Lie theory is unlikely to pro-vide any additional benefit, so that the ‘good-enough’model of Fig. 3b makes sense, with a threshold perhapsat about the typical level of a 10- or 11-year-old. In con-trast, for post-doctoral study of elliptic functions, a veryhigh level of mathematical attainment is essential, witheven the ability of typical school leavers or graduates inmathematics hardly being able to help. In such a case,additional mathematical knowledge at higher levels islikely to be ever more useful in answering such arcanequestions, so that ‘more-is-better’, with the minimalthreshold probably being a doctorate in a relevant area.Finally, what about the wide range of mathematical ap-plications that one encounters in everyday life, fromsimple to surprisingly complex? It seems reasonable toassume a linear model, in which with increasing math-ematical ability, a wider range of quotidian problems canbe solved. The linearity in a linear model emerges there-fore from the summing of a series of good-enough ormore-is-better models each with different thresholds,which correspond to different tasks in everyday life.
Clinical practice can also be considered in such terms, atypical practitioner having a wide range of different tasksof different difficulties at which they need to remaincompetent, with serious failure in any likely to result insanctions [35].So, which model is appropriate for medical practice?
Undoubtedly, there are advocates for ‘good-enough’models, with arguments made that only knowledge of acore curriculum with only basic science relevant tofrequently presenting conditions being necessary fordoctors, the majority of anatomy or biochemistry orknowledge of a wide range of clinical conditions not be-ing needed for safe, acceptable practice, at least undersupervision. For high levels of specialisation and inde-pendent practice, that seems to be unrealistic, and spe-cialist knowledge across a range of clinical and basicsciences seems ever more likely to be necessary. More isprobably better, therefore, although more is perhaps notneeded in all areas, making the linear model a goodpragmatic compromise.The form of the ability-performance relationship is
relevant across many areas of medical education, as forinstance in the current discussions on the UKMLA (UKMedical Licensing Assessment) which wishes to ‘[set] acommon threshold for safe practice’ [36], the implicit as-sumption being that of the good-enough model. Oftenthe setting of pass marks in examinations suggests that athreshold is being set on a good-enough model. How-ever, it is highly doubtful that candidates scoring exactlyat the pass mark are competent whereas those scoringone mark below the pass mark are not competent orthat those exactly at the pass mark will perform as wellin clinical practice as those in the top few percent ofthose passing the assessment (and just-passing candi-dates in postgraduate examinations clearly have prob-lems with subsequent tests [22]). Pass marks are mainlyfor administrative and practical convenience, but are notreally suggesting that ‘good-enough’ to pass is equivalentin all areas of subsequent practice. To paraphrase Cress-well [37], who draws on Sainsbury’s work on vagueness[38], a pass mark is merely a legal line which has only apragmatic justification in an area where there are no ac-tual boundaries.The linearity of the relationships in Fig. 2 is now much
more comprehensible. Not knowing enough results inpoor performance, problems in practice and possiblesanctions, whereas knowing more, and ever more, is aprotection against problems and sanctions, particularlywhen practice involves a wide range of differing clinicalpresentations and appropriate actions. The linearity istherefore an important result as it emphasises that FtPissues are not merely problems associated with verypoorly performing doctors (the ‘bad apples’). Evenamongst high-performing doctors, additional increments
Wakeford et al. BMC Medicine (2018) 16:230 Page 12 of 16
in performance result in better performance and a re-duction in the odds of FtP sanctions. A key implicationis that any reduction of pass marks or standards in ex-aminations, for whatever reason, perhaps political, prag-matic or otherwise, will result in higher subsequent ratesof FtP issues as has been modelled elsewhere [39]. Thecorollary is that greater knowledge and higher perform-ance are always of professional benefit, even in thosewho are already of high ability, as probably mosthigh-performing professionals recognise.
Clinical assessments vs knowledge testsAn important finding from the multiple regressions isthat clinical assessments (CSA or PACES) predict FtPsignificantly better than do the knowledge assessmentsof AKT and Part 1. That result may seem surprisinggiven the seemingly similar slopes of the graphs in Fig. 2.The difference arises because the simple regressions arejust carried out for those candidates for whom data areavailable, whereas the multiple regressions are carriedout for all candidates in the database, with imputationof missing values where needed. A pre-requisite of tak-ing PACES (and Part 2) is having passed Part 1, andmost candidates taking CSA will have passed AKT.There is therefore restriction of range in candidates tak-ing later examinations, only better candidates takingthem. However, what is required is a comparative assess-ment of construct validity on the basis of all candidateshaving taken all of the assessments, and for that, missingdata need to be imputed. PACES predicts at a similarlevel as, say, Part 1, in the simple analyses, but the vari-ance of the candidates is less for PACES, and if the likelyability level of all candidates is taken into account, thenPACES will predict better across the entire range of abil-ity. An alternative way of viewing it is that if just onetest were to be applied to all candidates with theintention of predicting FtP issues, then PACES wouldpredict better than Part 1. A separate approach to com-paring knowledge-based and clinical assessments is ourcomparison of ROC curves, where the paired analysis isrestricted to candidates taking both types of assessmentand where the area under the curve is significantlygreater for clinical as opposed to knowledge-based as-sessments, for both MRCGP and MRCP(UK).
Conduct, trust and fitness to practiseFitness to practise is at the core of being a doctor; doc-tors who are not fit to practise endanger patients andothers. While doctors need to be competent, establisheffective relationships with patients and act responsiblyin relation to health care, those attributes, as the GMCmakes clear, ‘while essential, are not enough’ [40]. TheGMC continues,
‘Doctors have a respected position in society and theirwork gives them privileged access to patients … Adoctor whose conduct has shown that [they] cannotjustify the trust placed in [them] should not continuein unrestricted practice while that remains the case.In short, the public is entitled to expect that theirdoctor is fit to practise, and follows our principles ofgood practice described in Good medical practice’ [40](paras 2-3).
Conduct and trust are therefore at the heart of FtP.That seemingly contrasts with the apparent content ofpostgraduate examinations such as MRCGP andMRCP(UK), for which knowledge, understanding andcompetency in practical skills are the essential compo-nents, most notably in ‘knowledge assessments’ such asMRCGP AKT and MRCP(UK) Parts 1 and 2 and ‘clinicalassessments’ such as MRCGP CSA and MRCP(UK)PACES. Examination has neither conduct nor trust at itscore, although most examiners would probably feel thatthose traits are implicit, but not explicit, in the assess-ments. It is therefore remarkable in many ways that poorperformance in MRCGP and MRCP(UK) relates sostrongly to FtP issues in our very large sample of doc-tors. A weakness of our study is that the LRMP does notspecify the precise reasons for sanction (but these havebeen studied elsewhere [20], and future work shouldlook in more detail at the grounds for sanction). An-other potential weakness is that this study looked only atperformance on an internal medicine or a general prac-tice examination, whereas the likelihood of sanctionsvaries by specialty (including no specialty and dual spe-cialty) [2]. That being said, many doctors takeMRCP(UK) or MRCGP but do not complete their train-ing in internal medicine or general practice, either mov-ing into a different specialty or not completing theirtraining, particularly since MRCP(UK) is an ‘entry’ exam.Furthermore, among doctors on the specialist and GPregisters, physicians are among the least likely to besanctioned whereas GPs are among the most likely. It istherefore likely that the large sample in our study cov-ered a broad range of doctors working in a wide varietyof specialties and clinical contexts.Why performance in knowledge assessments and clin-
ical assessments predict failures of the conduct and trustwhich are said to underpin FtP problems is not entirelyclear and merits investigation. However, attaining appro-priate levels of knowledge and competence does notcome easily within professions such as medicine. Clinicalpractice itself helps, of course [41], but there is also anextensive need for doctors to read and study within theirdisciplines, to interact with colleagues as part of the so-cial networks of knowledge that professions generateand to practise specific skills and competencies. All such
Wakeford et al. BMC Medicine (2018) 16:230 Page 13 of 16
things are driven as much by internal, intrinsic processesas by external forces and pressures, and the conscien-tiousness, the care and the concern which make doctorswant to perform better and to know more are probablythe same underlying psychological processes which gen-erate trust and conduct that is appropriate. Medicine asa profession has never only been about pathophysiologyand its vicissitudes, but instead is a continuum, for asJonathan Miller put it, ‘one foot is planted in the physicalworld, electronic impulses and the muck of the humanbody; the other is planted in the subjective, experientialworld of consciousness and conduct’ [42].
Clinical examinations provide incremental validity forpostgraduate examinationsThe validity of postgraduate assessments is important,acting as a guarantor to the public and patients, as wellas a professional justification for the time and effortexpended by trainees on examinations. The clear rela-tionship of poor performance to FtP issues in our fiveassessments, particularly taken in conjunction with otherstudies [16–18, 20], makes clear that postgraduate exam-inations are not mere academic games but are importantevidence for the predictive validity of postgraduate ex-aminations. A feature of UK postgraduate education isthat examinations contain both knowledge assessmentsand clinical assessments, and our previous comparisonof performance of candidates taking both MRCP(UK)and MRCGP suggests the knowledge and clinical assess-ments assess separate domains of expertise [21]. Ourdata suggest that clinical assessments are particularlyimportant in predicting FtP, and clinical examinations al-most always include communication skills (and as theGMC says, competence and communication are essen-tial for doctors). That poor performance in the clinicalexaminations, CSA and PACES, is a better predictor ofFtP problems than performance in knowledge assess-ments is of practical and political importance. A declinein clinical examination skills continues to be of concern[43, 44], despite many physicians finding examinationimportant [45] and errors in patient care occurring be-cause of poor examination skills [46–48]. Clinical exam-ination in practice has been taking place less over thepast four decades [49], perhaps as a result of an influen-tial 1975 paper claiming that examination contributedlittle to diagnosis [50]. Postgraduate assessments in theUK (although rarely in the USA) emphasise clinical ex-aminations as well as knowledge assessments. However,clinical assessments are expensive and time-consumingto run, needing experienced examiners in a one-to-onerelationship with candidates who themselves are inter-acting with patients, be they surrogates or, in the case ofMRCP(UK), real patients with real diseases and realsymptoms and signs, meaning that examinations need to
take place in a clinical environment. None of that comescheap, and there is always a temptation to assume thatcomputer-based assessments might replace traditionalclinical examinations, but it may well be mistaken, par-ticularly if poor performance at clinical assessments par-ticularly relates to FtP problems. That has implicationsfor postgraduate examinations, undergraduate examina-tions and licencing examinations such as USMLE Stage2 CS and the still being developed UKMLA.
ConclusionsThis study is the first to demonstrate for UK postgradu-ate examinations that knowledge assessments and clin-ical assessments are independent predictors of FtPsanctions, with clinical assessments showing a largerpredictive effect than knowledge assessments (as wasalso previously found for PLAB assessments of IMGs[20]). The greater predictive validity of clinical assess-ments over knowledge assessments has implications forthe design of undergraduate and postgraduate clinicalexaminations. Likewise, the linearity of the effects acrossthe entire range of knowledge and skills assessments im-plies that additional knowledge and skills are beneficialto doctors at all levels of attainment.
AbbreviationsABIM: American Board of Internal Medicine; AKT: Applied Knowledge Test;ANOVA: Analysis of variance; AUC: Area under the curve; BME: Black andMinority Ethnic; CSA: Clinical Skills Assessment; DIF: Differential itemfunctioning; EM: Expectation maximisation; ESCUW: Erasure, Suspension,Conditions on Practice, Undertakings or Warnings; FtP: Fitness to practise;GMC: General Medical Council; GP: General practice or general practitioner;IBM SPSS: IBM Statistical Package for the Social Sciences; IMG: Internationalmedical graduate; LRMP: List of Registered Medical Practitioners; MAR: Missingat random; MCQ: Multiple-choice question; MPTS: Medical Practitioners TribunalService; MRCGP: Membership of the Royal College of General Practitioners;MRCP(UK): Membership of the Royal Colleges of Physicians of the UnitedKingdom; NBME: National Board of Medical Examiners; NHS: National HealthService; NIHR: National Institute for Health Research; nPACES: New PracticalAssessment of Clinical Examination Skills; OR: Odds ratio; PACES: PracticalAssessment of Clinical Examination Skills; PLAB: Professional and LinguisticAssessments Board; PMQ: Primary medical qualification; R: The R projectfor statistical computing; RCGP: Royal College of General Practitioners;ROC: Receiver operating characteristic; SD: Standard deviation;UCL: University College London; UK: United Kingdom; UKMLA: UnitedKingdom Medical Licensing Assessment; USMLE: United States MedicalLicensing Examination
AcknowledgementsWe are grateful to the staff of the Royal College of General Practitioners andthe MRCP(UK) Central Office for their assistance with linking the data. Inparticular, we thank Liliana Chis for her continuing help with this and otherprojects. We also thank Professor Andrew Elder and Dr. David Swanson forhelpful comments on an earlier draft of the paper.
FundingKL’s PhD thesis was funded by an Impact Studentship held jointly betweenUCL and MRCP(UK). KW is funded by a National Institute for Health ResearchCareer Development Fellowship. The views expressed are those of theauthor(s) and not necessarily those of the NHS, the NIHR or the Departmentof Health.
Wakeford et al. BMC Medicine (2018) 16:230 Page 14 of 16
Availability of data and materialsThe LRMP is a publically available database provided by the GMC. TheMRCP(UK) data that support the findings of this study are available uponreasonable request from the Membership of the Royal Colleges of Physicians(UK), subject to review of its Academic, Quality Management and ResearchCommittee (AQMRC). Requests should be made to the Head of Research viathe MRCPUK website https://www.mrcpuk.org/contact-us. The MRCGP dataare confidential to the RCGP and are not available for further research due toethical and legal concerns that access could compromise researchparticipant privacy.
Authors’ contributionsThe idea for the research was developed by ICM, KW and KL using MRCP(UK)data as a part of KL’s PhD thesis. Subsequent development of the work wascarried out by REW for MRCGP and ICM for MRCP(UK), the joint sets of databeing analysed by ICM and REW, with the collaboration of KW. ICM wrotethe first draft of the manuscript, with subsequent contributions from allauthors. All authors read and approved the final manuscript.
Authors’ informationREW is a Fellow of Hughes Hall, Cambridge, and carried out psychometricanalyses of the MRCGP examination. KL was a PhD student at UCL while thisstudy was carried out. KW is an Associate Professor in Medical Educationat UCL and an Educational Advisor to the MRCP(UK). ICM is Professor ofPsychology and Medical Education at UCL and an Educational Advisor to theMRCP(UK). All authors read and approved the final manuscript.
Ethics approval and consent to participateThe analysis considered only administrative data and information within thepublic domain and therefore is not subject to ethical permission at UniversityCollege London (UCL; see https://ethics.grad.ucl.ac.uk/exemptions.php).
Consent for publicationNot applicable.
Competing interestsREW received personal fees from Royal College of General Practitioners,during the conduct of the study and personal fees from Royal College ofGeneral Practitioners outside the submitted work. KL received grants fromMRCP(UK) during the conduct of the study. KW is an Educational Advisor toMRCP(UK) and her department received consultancy fees from MRCP(UK)during the conduct of the study. ICM is an Educational Advisor to MRCP(UK)and his department received consultancy fees from MRCP(UK) during theconduct of the study.
Publisher’s NoteSpringer Nature remains neutral with regard to jurisdictional claims inpublished maps and institutional affiliations.
Author details1Hughes Hall, University of Cambridge, Cambridge CB1 2EW, UK. 2Onet, ul.,Marszałkowska 76, Warsaw, Poland. 3Research Department of MedicalEducation, UCL Medical School, University College London, Gower Street,London WC1E 6BT, UK.
Received: 18 June 2018 Accepted: 9 November 2018
References1. General Medical Council. Doctors who commit suicide while under GMC
fitness to practise investigation. London: General Medical Council .http://www.gmc-uk.org/Internal_review_into_suicide_in_FTP_processes.pdf_59088696.pdf. Accessed 8 Nov 2017.; 2017.
2. Unwin E, Woolf K, Wadlow C, Dacre J. Disciplined doctors: does the sex of adoctor matter? A cross-sectional study examining the association betweena doctor's sex and receiving sanctions against their medical registration.BMJ Open. 2014;4(8):e005405.
3. General Medical Council. Securing the licence to practise: introducing aMedical Licensing Assessment a public consultation. London: GeneralMedical Council. https://www.gmc-uk.org/MLA_consultation_document_English_writeable_distributed.pdf_69151379.pdf; 2017.
4. Archer J, Lynn N, Coombes L, Gale T, de Bere SR. The medical licensingexamination debate. Regul Gov. 2016;11:315–22.
5. Flier LA, Henderson CR, Treasure CL. Time to eliminate the Step 2 Clinical Skillsexamination for US medical graduates. JAMA Intern Med. 2016;176:1245–6.
6. General Medical Council. An introduction to revalidation. London: GeneralMedical Council. http://www.gmc-uk.org/doctors/revalidation/9627.asp.Accessed 6 Nov 2017; 2017.
7. General Medical Council. The GMC’s fitness to practise procedures. London:General Medical Council; 2017. https://www.gmc-uk.org/-/media/documents/dc4591-the-meaning-of-fitness-to-practise-25416562.pdf.Accessed 6 Nov 2017.
8. Ludka-Stempien K, Woolf K, McManus IC. Poor performance on theMRCP(UK) examination predicts license limitations in subsequent medicalpractice. Prague: Proceedings of AMEE (Association for Medical Education inEurope), Prague August 2013; 2013.
9. Ludka-Stempien K. The predictive validity of the MRCP(UK) examination(PhD thesis). London: University college London; 2015.
10. Royal College of Anaesthetists. A report on the welfare, morale andexperiences of anaesthetists in training: the need to listen. London: RoyalCollege of Anaesthetists. available at https://www.rcoa.ac.uk/document-store/welfare-morale-report-2017; 2017.
11. Messick S. Validity of psychological assessment: validation of inferencesfrom persons’ responses and performances as scientific inquiry into scoremeaning. AP. 1995;50:749.
12. Downing SM. Validity: on the meaningful interpretation of assessment data.Med Educ. 2003;37:830–7.
13. Lissitz RW. The concept of validity: revisions, new directions, andapplications. Charlotte: Information Age Publishing; 2009.
14. Kane MT. Validating the interpretations and uses of test scores. JEM. 2014;50:1–73.
15. American Educational Research Association, American PsychologicalAssociation, National Council on Measurement in Education. Standards foreducational and psychological testing. Washington, DC: AmericanEducational Research Association; 2014.
16. Norcini JJ, Boulet JR, Opalek A, Dauphinee WD. The relationship betweenlicensing examination performance and the outcomes of care byinternational medical school graduates. Acad Med. 2014;89:1–6.
17. Papadakis MA, Arnold J, Blanton H, Holmboe ES, Lipner RS. Performanceduring internal medicine residency training and subsequent disciplinaryaction by state licensing boards. Ann Intern Med. 2008;148:869–76.
18. Cuddy MM, Young A, Gelman A, Swanson DB, Johnson DA, Dillon GF, et al.Exploring the relationships between USMLE performance and disciplinaryaction in practice: a validity study of score inferences from a licensureexamination. Acad Med. 2017;92:1780–5.
19. Cuddy MM, Winward ML, Johnston MM, Lipner RS, Clauser BE. Evaluatingvalidity evidence for USMLE step 2 clinical skills data gathering and datainterpretation scores: does performance predict history-taking and physicalexamination ratings for first-year internal medicine residents? Acad Med.2016;91:133–9.
20. Tiffin PA, Paton LW, Mwandigha LM, McLachlan JC, Illing J. Predicting fitnessto practise events in international medical graduates who registered as UKdoctors via the Professional and Linguistic Assessments Board (PLAB)system: a national cohort study. BMC Med. 2017;15:66 https://doi.org/10.1186/s12916-017-0829-1.
21. Wakeford R, Denney ML, Ludka-Stempien K, Dacre J, McManus IC. Cross-comparison of MRCGP & MRCP(UK) in a database linkage study of 2,284candidates taking both examinations: assessment of validity and differentialperformance by ethnicity. BMC Med Educ. 2015;15:1.
22. McManus IC, Ludka K. Resitting a high-stakes postgraduate medicalexamination on multiple occasions: nonlinear multilevel modelling ofperformance in the MRCP(UK) examinations. BMC Med. 2012;10:60.
23. McManus IC, Chis L, Fox R, Waller D, Tang P: Implementing statisticalequating for MRCP(UK) Parts 1 and 2. BMC Med Educ 2014, 14: 204 http://www.biomedcentral.com/1472-6920/14/204; doi:https://doi.org/10.1186/1472-6920-14-204.
24. Royal College of General Practitioners. MRCGP examinations. London: RoyalCollege of General Practitioners. http://www.rcgp.org.uk/training-exams/mrcgp-exams-overview.aspx. Accessed 6 Nov 2017; 2017.
25. Elder A, McAlpine L, Bateman N, Dacre J, Kopelman P, McManus IC.Changing PACES: developments to the examination in 2009. Clin Med.2011;11:231–4.
Wakeford et al. BMC Medicine (2018) 16:230 Page 15 of 16
26. General Medical Council. The state of medical education and practice in theUK: 2015. London: General Medical Council. http://www.gmc-uk.org/SOMEP_2015.pdf_63501874.pdf. Accessed 8 Nov 2017; 2015.
27. Hope D, Adamson K, McManus IC, Chis L, Elder A. Using differential itemfunctioning to evaluate potential bias in a high stakes postgraduateknowledge based assessment. BMC Med Educ. 2018;18:1–7.
28. R Core Team. R: a language and environment for statistical computing. Vienna:R Foundation for Statistical Computing. https://www.R-project.org/; 2017.
29. Robin X, Turck N, Hainard A, Tiberti N, Lisacek F, Sanchez F-C, et al. pROC: anopen-source package for R and S+ to analyze and compare ROC curves. BMCBioinformatics. 2011;12:77 http://www.biomedcentral.com/1471-2105/12/77.
30. Arneson JJ, Sackett PR, Beatty AS. Ability-performance relationships ineducation and employment settings: critical tests of the more-is-better andgood-enough hypotheses. Psychol Sci. 2011;22:1336–42.
31. Outliers: the story of success. New York: Little, Brown; 2008.32. Schwartz B. Top colleges should select randomly from a pool of ‘good
enough’. Chron High Educ. 2005;2005:B20–5.33. Major LE, Machin S. Social mobility and its enemies. London: Penguin
Random House; 2018.34. McManus IC, Vincent CA. Can future poor performance be identified during
selection? In: Lens P, van der Waal G, editors. Problem doctors: a conspiracyof silence. Amsterdam: IOS Press; 1997. p. 213–36.
35. Handfield-Jones RS, Mann KV, Challis ME, Hobma SO, Klass DJ, McManus IC,et al. Linking assessment to learning: a new route to quality assurance inmedical practice. Med Educ. 2002;36:949–58.
36. General Medical Council. Medical Licensing Assessment. London: https://www.gmc-uk.org/education/standards-guidance-and-curricula/projects/medical-licensing-assessment. Accessed 11 Sept 2018: General Medical Council; 2018.
37. Cresswell M. Heaps, prototypes and ethics: the consequence of usingjudgments of student performance to set examination standards in a timeof change. London: Institute of Education; 2003.
38. Sainsbury RM. Departing from Frege. Essays in the philosophy of language.London: Routledge; 2018.
39. Davison I, McManus IC, Taylor C. Evaluation of GP Specialty Selection[Report commissioned by Health Education England]. Birmingham: Schoolof Education. Available at www.ucl.ac.uk/medical-education/publications/reprints2016/GPspecSelReport.pdf; 2016.
40. General Medical Council. The meaning of fitness to practise. Essays in thephilosophy of language. London: General Medical Council; 2014. https://www.gmc-uk.org/-/media/documents/dc4591-the-meaning-of-fitness-to-practise-25416562.pdf.
41. McManus IC, Woolf K, Dacre J, Paice E, Dewberry C. The academicbackbone: longitudinal continuities in educational achievement fromsecondary school and medical school to MRCP(UK) and the SpecialistRegister in UK medical students and doctors. BMC Med. 2013;11:242.https://doi.org/10.1186/1741-7015-11-242.
42. Bassett K. Operating theatre. CAM. 1995:(14)7–11.43. Jauhar S. The demise of the physical exam. NEJM. 2006;354:548–51.44. Elder A, Verghese A. Bedside matters – putting the patient at the centre of
teaching and learning. J R Coll Physicians Edinb. 2015;45:186–7.45. Elder A, McManus IC, Patrick A, Nair K, Vaughan L, Dacre J. The value of the
physical examination in clinical practice: an international survey. Clin Med.2017;17:490–8.
46. Reilly BM. Physical examination in the care of medical inpatients: anobservational study. Lancet. 2003;362:1100–5.
47. Verghese A, Charlton B, Kassirer JP, Ramsey M, Ioannidis JPA. Inadequaciesof physical examination as a cause of medical errors and adverse events: acollection of vignettes. AJM. 2015;128:1322–4.
48. Verghese A, Horwitz RI: In praise of the physical examination [Editorial]. BritMed J 2009, 339b5448.
49. Oliver CM, Hunter SA, Ikeda T, Galletly DC. Junior doctor skill in the art ofphysical examination: a retrospective study of the medical admission noteover four decades. BMJ Open. 2013;3:e002257. https://doi.org/10.1136/bmjopen-2012-002257.
50. Hampton JR, Harrison MJG, Mitchell JRA, Prichard JS, Seymour C. Relativecontributions of history-taking, physical examination, and laboratoryinvestigation to diagnosis and management of medical outpatients. BritMed J. 1975;2:486–9.
Wakeford et al. BMC Medicine (2018) 16:230 Page 16 of 16