Embed Size (px)
Citation preview
Copyright (C) Mitsubishi Research Institute, Inc.
Title: Analysis of Renewable Energy Measures in Japan and Abroad
Policy Mechanisms and Current Conditions
Hajime Alabanza, University of California, San Diego
September, 12, 2014
Copyright (C) Mitsubishi Research Institute, Inc. 2
Table of Contents
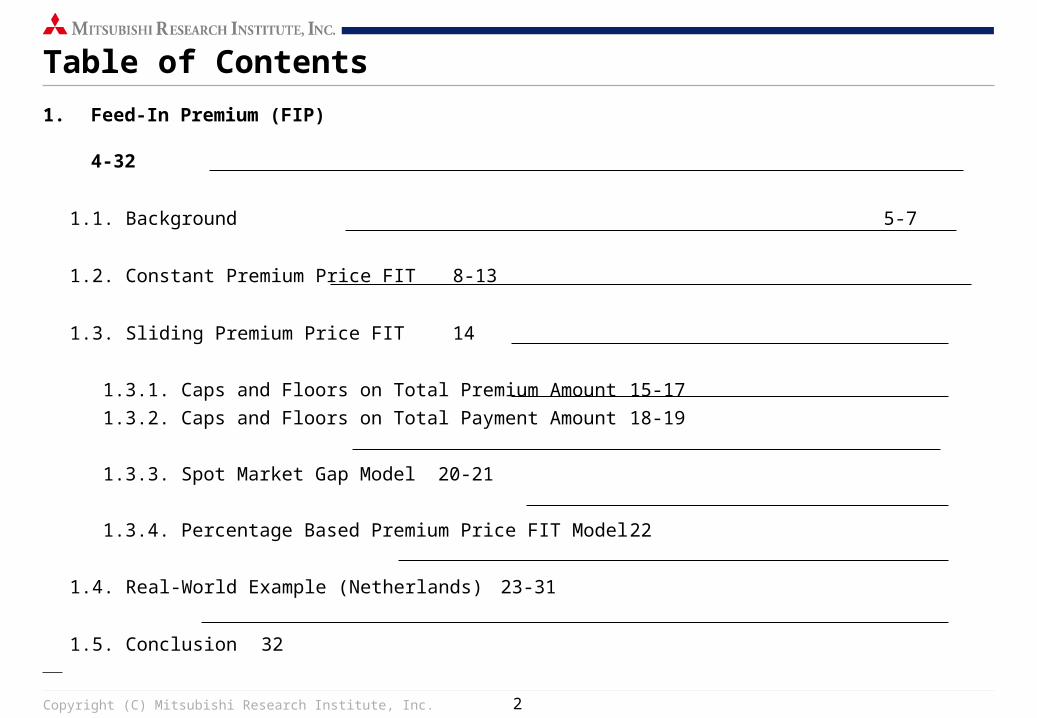
1. Feed-In Premium (FIP)
4-32
1.1. Background 5-7
1.2. Constant Premium Price FIT 8-13
1.3. Sliding Premium Price FIT 14
1.3.1. Caps and Floors on Total Premium Amount 15-17
1.3.2. Caps and Floors on Total Payment Amount 18-19
1.3.3. Spot Market Gap Model 20-21
1.3.4. Percentage Based Premium Price FIT Model 22
1.4. Real-World Example (Netherlands) 23-31
1.5. Conclusion 32
Copyright (C) Mitsubishi Research Institute, Inc. 3
Table of Contents
2. Renewable Energy Power Business in Japan 33-61
2.1. FIT Scheme in Japan 34-38
2.2. Survey of Renewable Energy Sites 39-51
2.3. Challenges and Issues for RE Power Business in Japan 52-59
2.4. My Impressions 60-61
Copyright (C) Mitsubishi Research Institute, Inc. 4
1. Premium Price FIT Policy
1.1: FIP Background
1.2: Constant Premium Price FIT
1.3: Sliding Premium Price FIT
1.4: Real-World Example (Netherlands)
1.5: Conclusion
Copyright (C) Mitsubishi Research Institute, Inc. 5
1.1 : Background
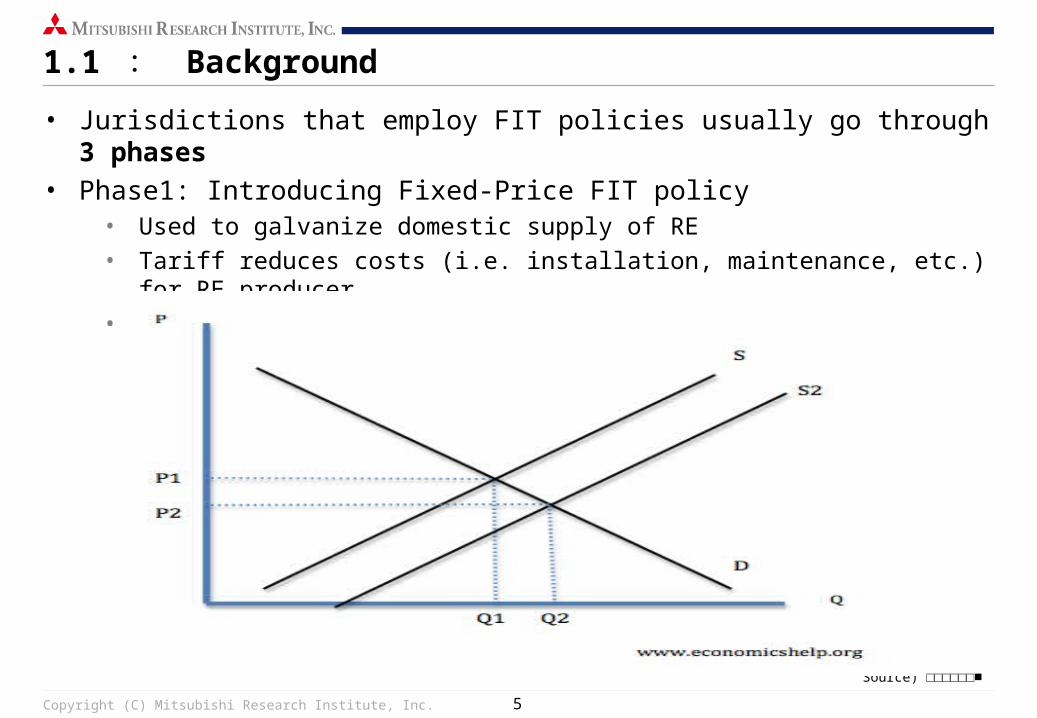
• Jurisdictions that employ FIT policies usually go through 3 phases• Phase1: Introducing Fixed-Price FIT policy
• Used to galvanize domestic supply of RE• Tariff reduces costs (i.e. installation, maintenance, etc.) for RE producer• Increase in RE deployment
Source) □□□□□□■
Copyright (C) Mitsubishi Research Institute, Inc. 6
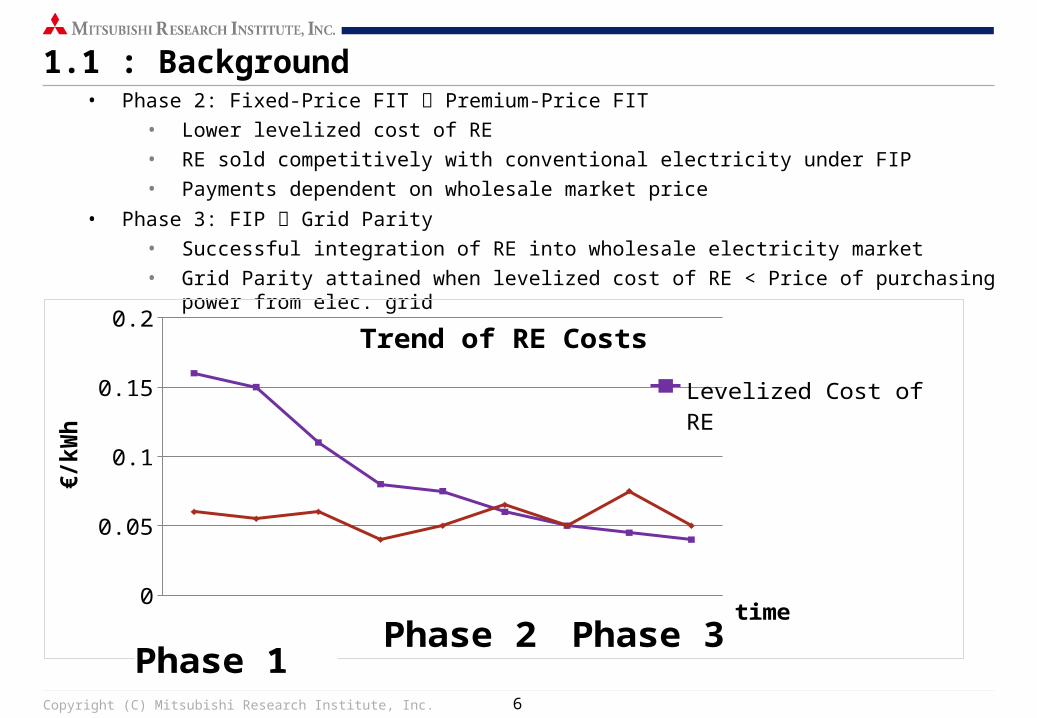
1.1 : Background• Phase 2: Fixed-Price FIT Premium-Price FIT
• Lower levelized cost of RE
• RE sold competitively with conventional electricity under FIP
• Payments dependent on wholesale market price
• Phase 3: FIP Grid Parity
• Successful integration of RE into wholesale electricity market
• Grid Parity attained when levelized cost of RE < Price of purchasing power from elec. grid
00.020.040.060.080.1
0.120.140.160.18
Trend of RE Costs
Levelized Cost of RE
Price of Power from Elec. Grid
time
€/kW
h
Phase 1 Phase 2 Phase 3
Copyright (C) Mitsubishi Research Institute, Inc. 7
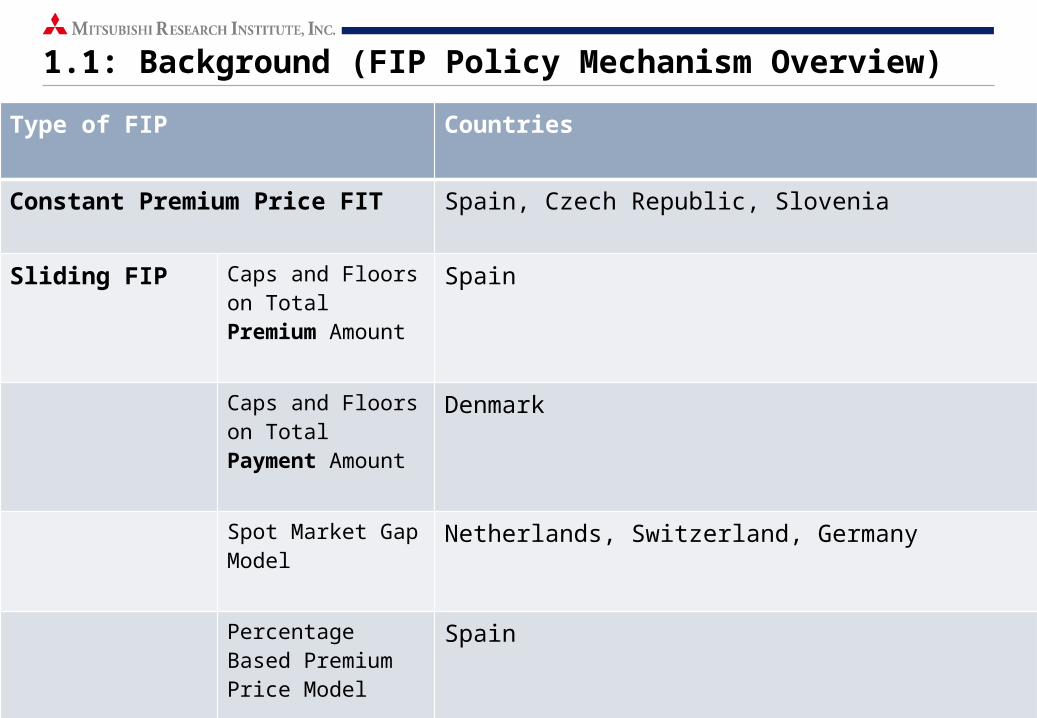
1.1: Background (FIP Policy Mechanism Overview)
Type of FIP Countries
Constant Premium Price FIT Spain, Czech Republic, Slovenia
Sliding FIP Caps and Floors on Total Premium Amount
Spain
Caps and Floors on Total Payment Amount
Denmark
Spot Market Gap Model
Netherlands, Switzerland, Germany
Percentage Based Premium Price Model
Spain
Copyright (C) Mitsubishi Research Institute, Inc. 8
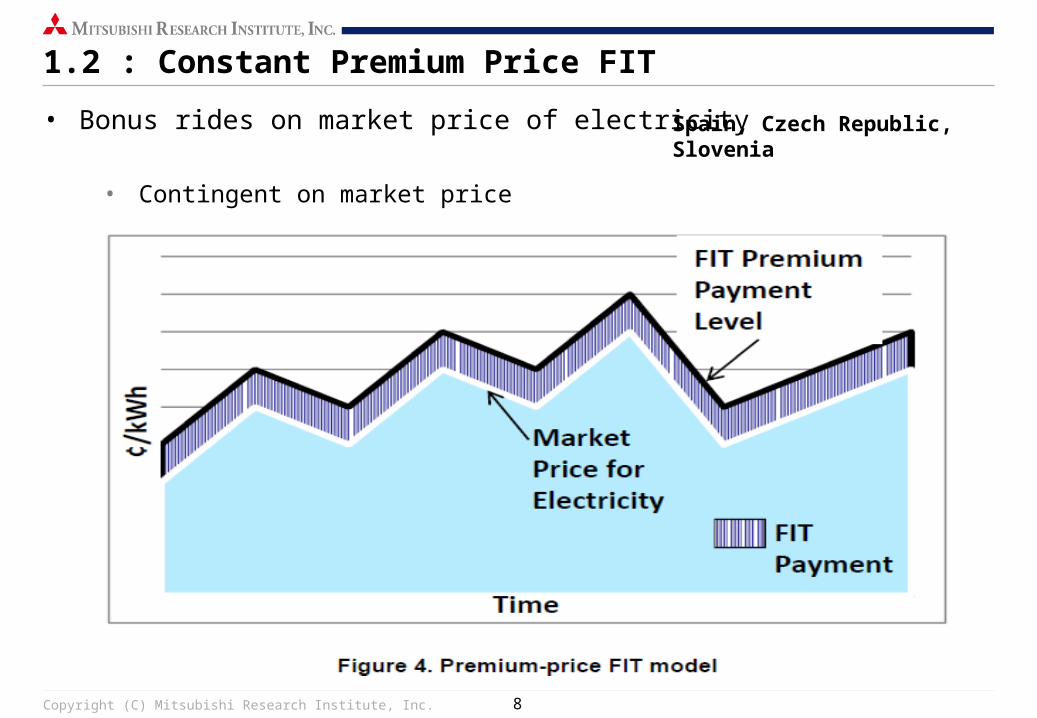
1.2 : Constant Premium Price FIT
• Bonus rides on market price of electricity
• Contingent on market price
Spain, Czech Republic, Slovenia
Copyright (C) Mitsubishi Research Institute, Inc. 9
1.2 : Constant Premium Price FIT
• Payment level largely based on
• Type of technology
• Size of project
• Deployed in
• Spain 1998-2004 (along with fixed FIT) (i.e. Solar, wind, hydro, biomass)
• Czech Republic (along with fixed FIT)
• Slovenia (i.e. Solar, wind, hydro, biomass, geothermal)
Copyright (C) Mitsubishi Research Institute, Inc. 10
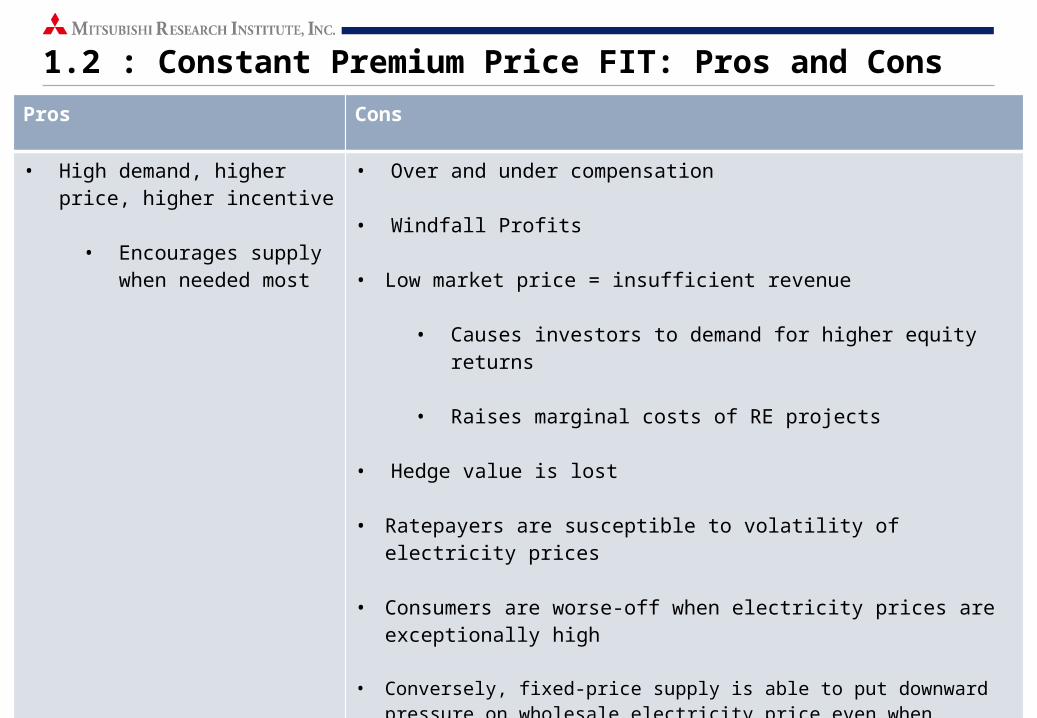
1.2 : Constant Premium Price FIT: Pros and Cons
Pros Cons
• High demand, higher price, higher incentive
• Encourages supply when needed most
• Over and under compensation
• Windfall Profits
• Low market price = insufficient revenue
• Causes investors to demand for higher equity returns
• Raises marginal costs of RE projects
• Hedge value is lost
• Ratepayers are susceptible to volatility of electricity prices
• Consumers are worse-off when electricity prices are exceptionally high
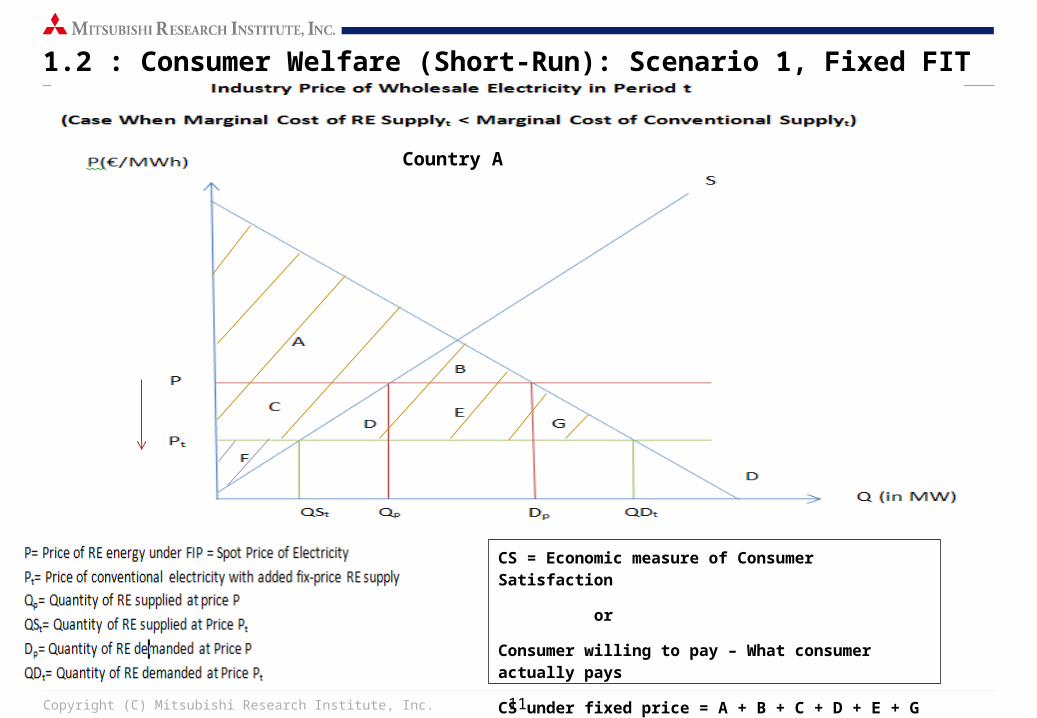
• Conversely, fixed-price supply is able to put downward pressure on wholesale electricity price even when electricity prices are high if
Marginal Cost RE Supply < Marginal Cost of Conventional Supply
Copyright (C) Mitsubishi Research Institute, Inc. 11
1.2 : Consumer Welfare (Short-Run): Scenario 1, Fixed FIT
CS = Economic measure of Consumer Satisfaction
or
Consumer willing to pay – What consumer actually pays
CS under fixed price = A + B + C + D + E + G
Country A
Copyright (C) Mitsubishi Research Institute, Inc. 12
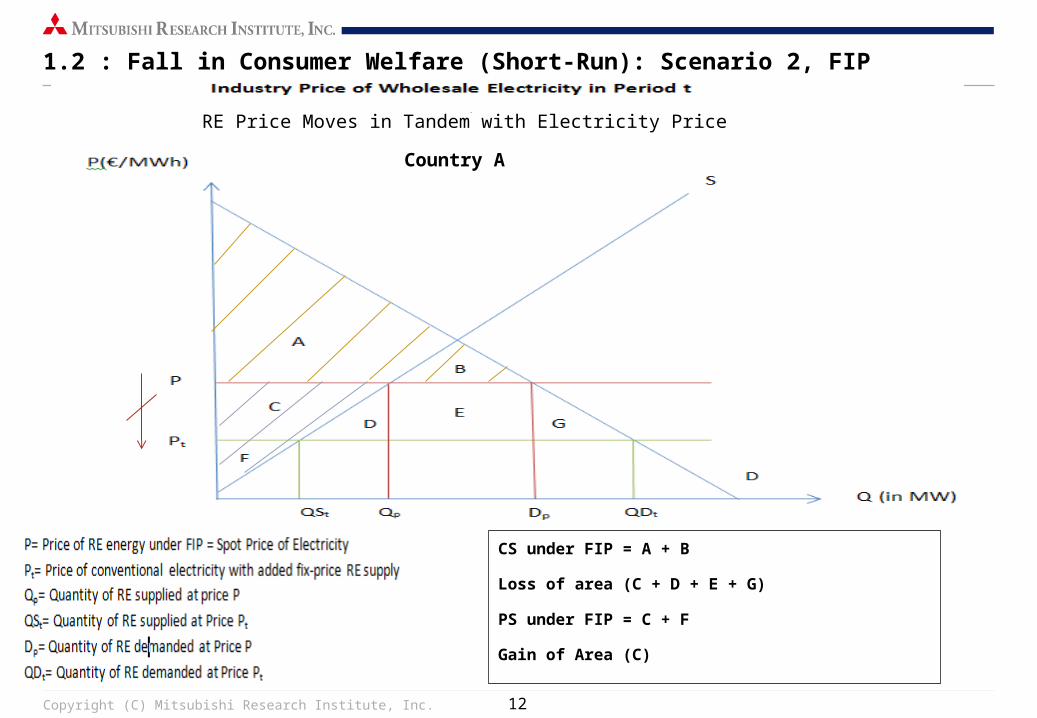
1.2 : Fall in Consumer Welfare (Short-Run): Scenario 2, FIP
CS under FIP = A + B
Loss of area (C + D + E + G)
PS under FIP = C + F
Gain of Area (C)
Country A
RE Price Moves in Tandem with Electricity Price
Copyright (C) Mitsubishi Research Institute, Inc. 13
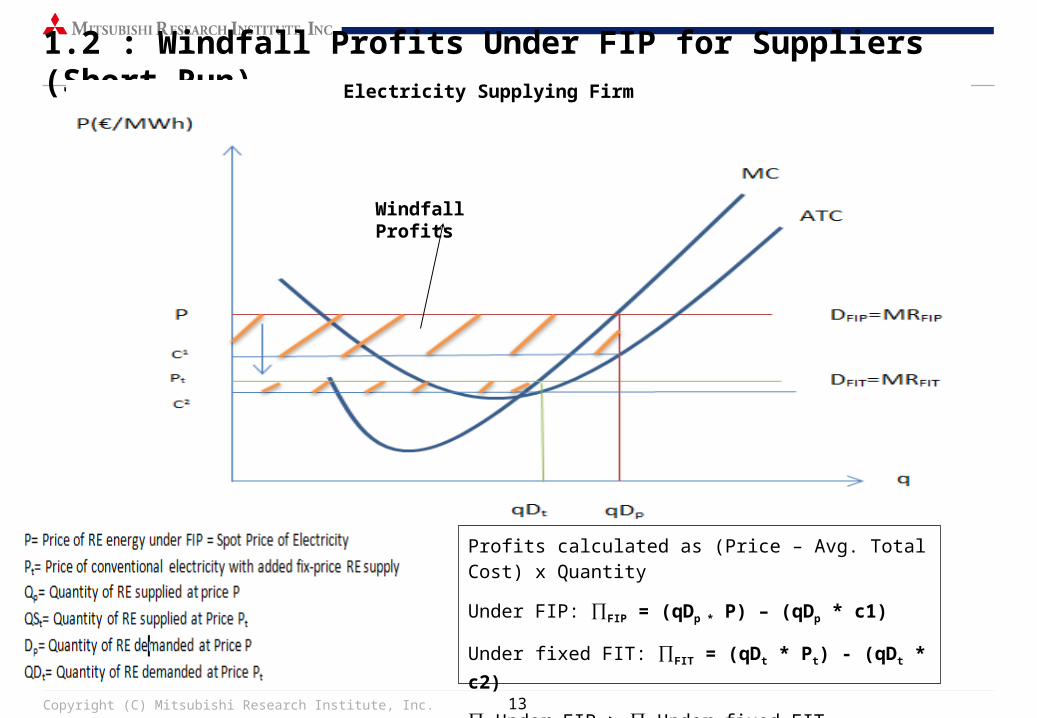
1.2 : Windfall Profits Under FIP for Suppliers (Short-Run)
Profits calculated as (Price – Avg. Total Cost) x Quantity
Under FIP: ∏FIP = (qDp * P) – (qDp * c1)
Under fixed FIT: ∏FIT = (qDt * Pt) - (qDt * c2)
∏ Under FIP > ∏ Under fixed FIT
Electricity Supplying Firm
Windfall Profits
Copyright (C) Mitsubishi Research Institute, Inc. 14
1.3 : Sliding Premium Price FIT: Overview
• Protection from windfall profits
• Payments vary depending on market price
• Premium payments fall as market price increases
• Establishes floor payment level to guarantee minimum payment for RE producer (security for RE generators)
• Establishes cap payment level that maximizes premium payment doled out (keeps FIT policy costs in check)
Copyright (C) Mitsubishi Research Institute, Inc. 15
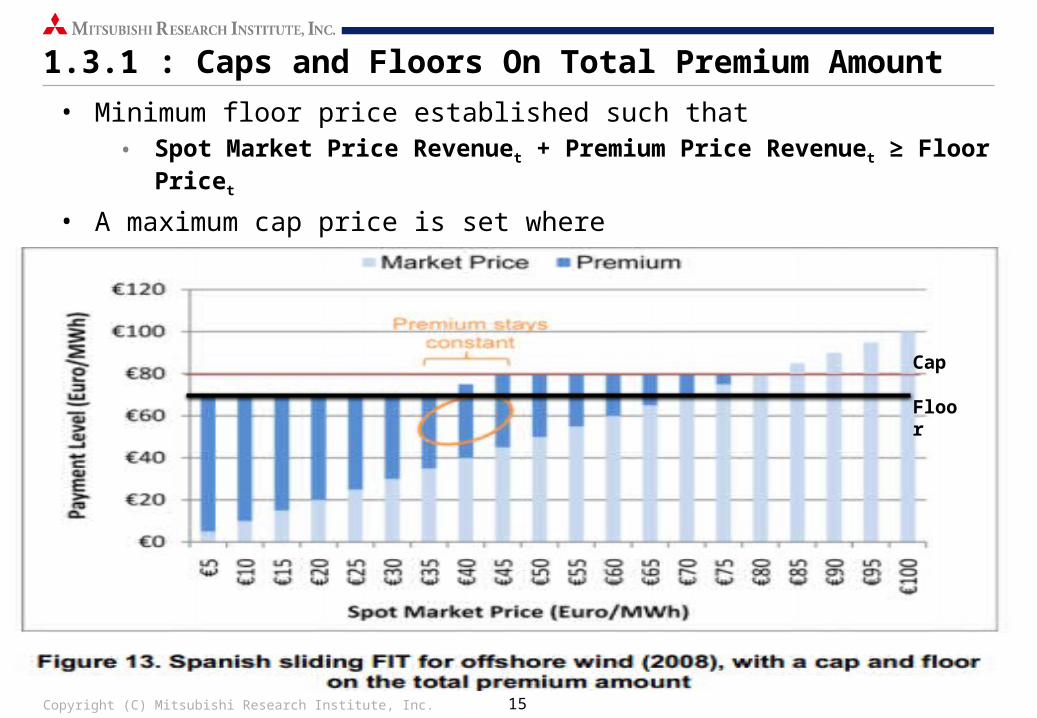
1.3.1 : Caps and Floors On Total Premium Amount
• Minimum floor price established such that• Spot Market Price Revenuet + Premium Price Revenuet ≥ Floor Pricet
• A maximum cap price is set where• Premium Pricet=0 iff Spot Pricet ≥ Cap Pricet
Floor
Cap
Copyright (C) Mitsubishi Research Institute, Inc. 16
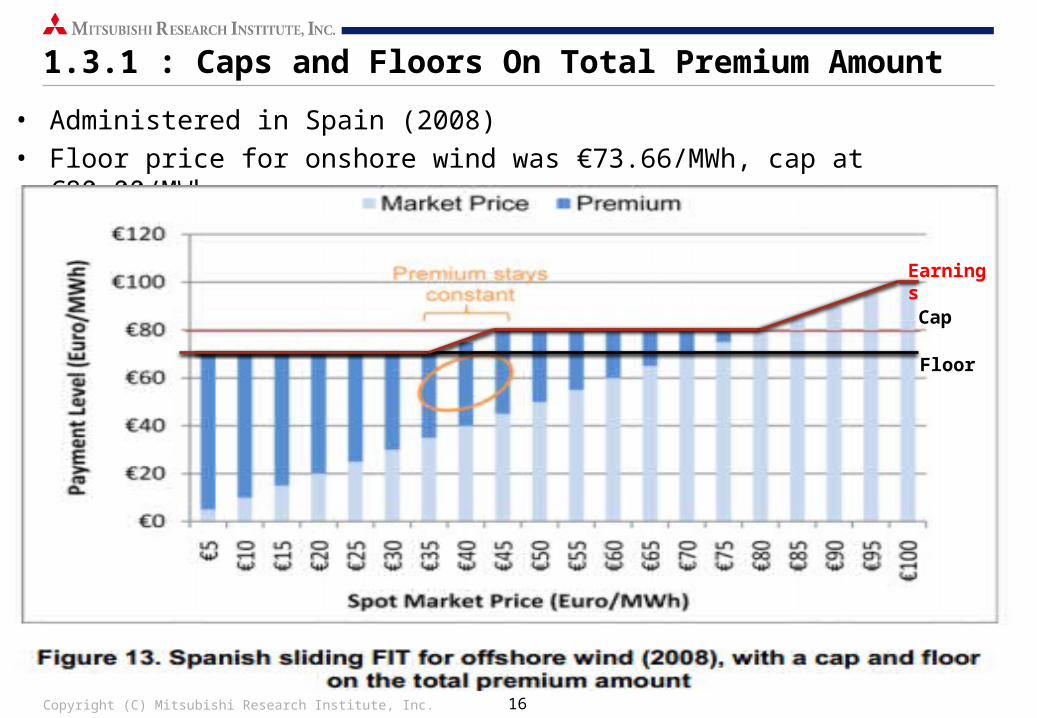
1.3.1 : Caps and Floors On Total Premium Amount
• Administered in Spain (2008)• Floor price for onshore wind was €73.66/MWh, cap at €80.00/MWh
Earnings
Cap
Floor
Copyright (C) Mitsubishi Research Institute, Inc. 17
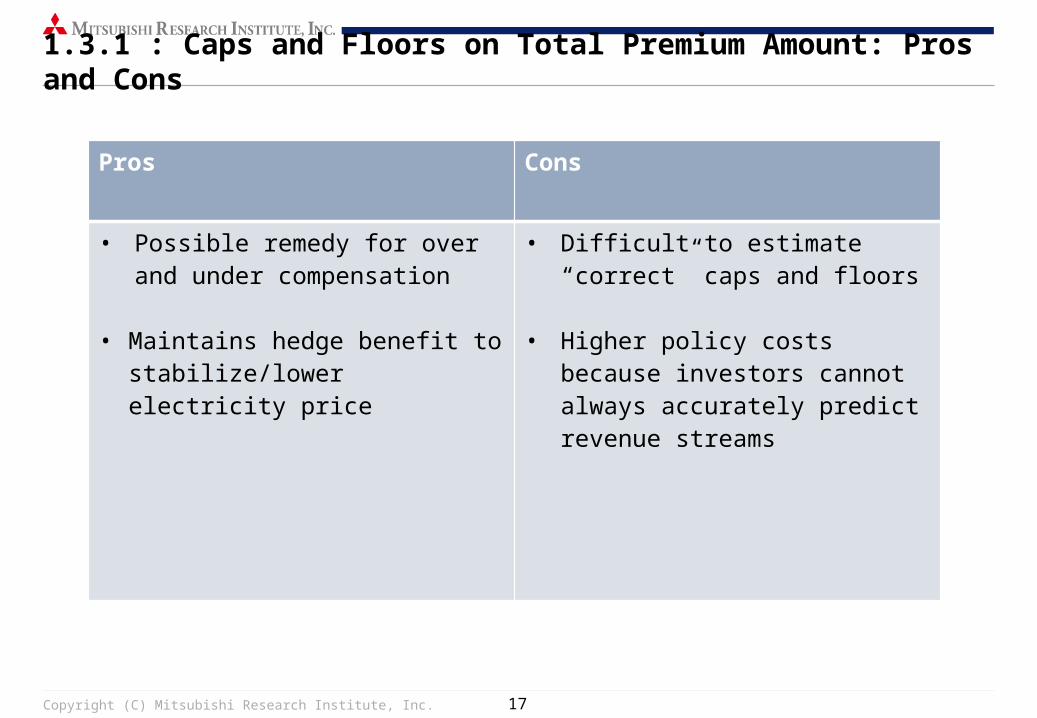
1.3.1 : Caps and Floors on Total Premium Amount: Pros and Cons
Pros Cons
• Possible remedy for over and under compensation
• Maintains hedge benefit to stabilize/lower electricity price
• Difficult to estimate “correct” caps and floors
• Higher policy costs because investors cannot always accurately predict revenue streams
Copyright (C) Mitsubishi Research Institute, Inc. 18
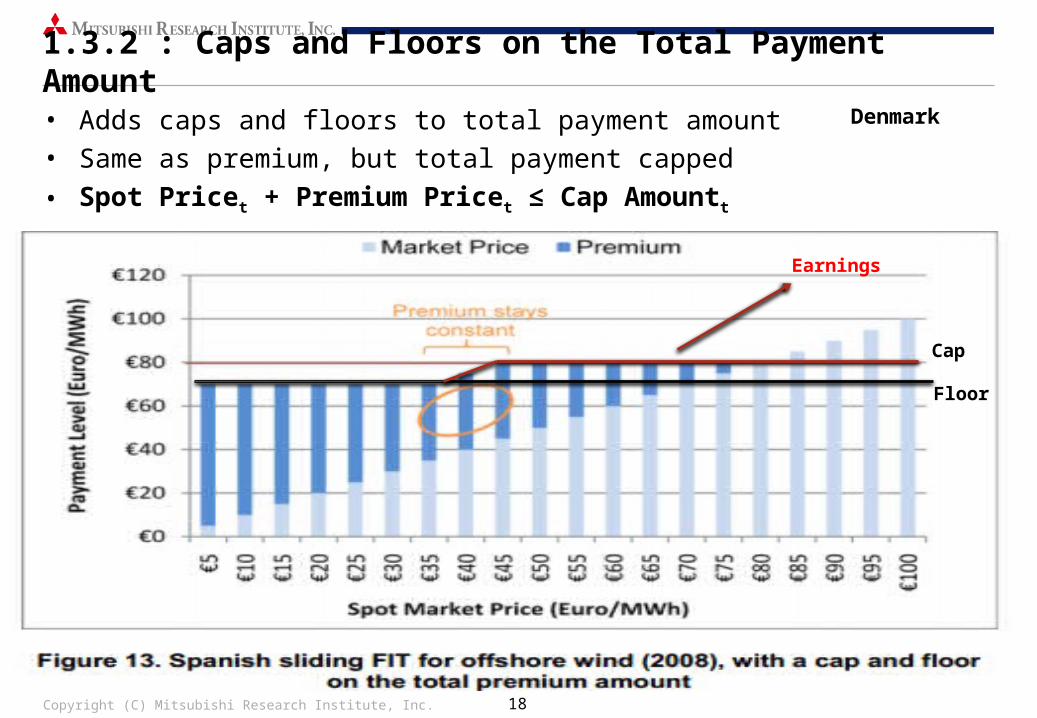
1.3.2 : Caps and Floors on the Total Payment Amount
• Adds caps and floors to total payment amount• Same as premium, but total payment capped
• Spot Pricet + Premium Pricet ≤ Cap Amountt
Denmark
Earnings
Floor
Cap
Copyright (C) Mitsubishi Research Institute, Inc. 19
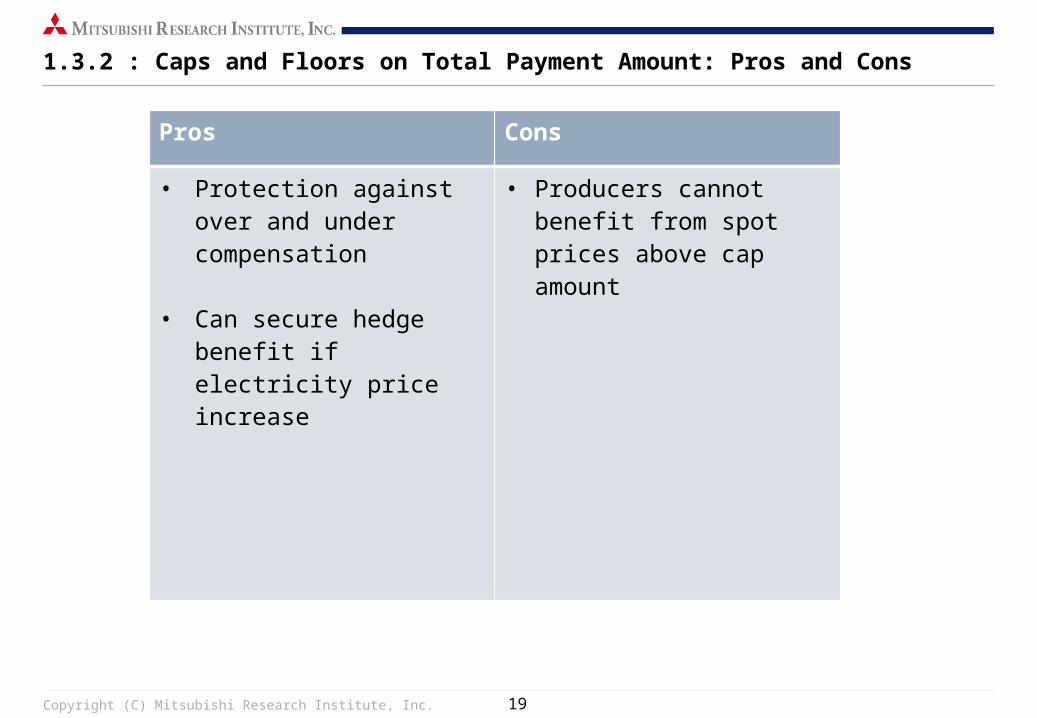
1.3.2 : Caps and Floors on Total Payment Amount: Pros and Cons
Pros Cons
• Protection against over and under compensation
• Can secure hedge benefit if electricity price increase
• Producers cannot benefit from spot prices above cap amount
Copyright (C) Mitsubishi Research Institute, Inc. 20
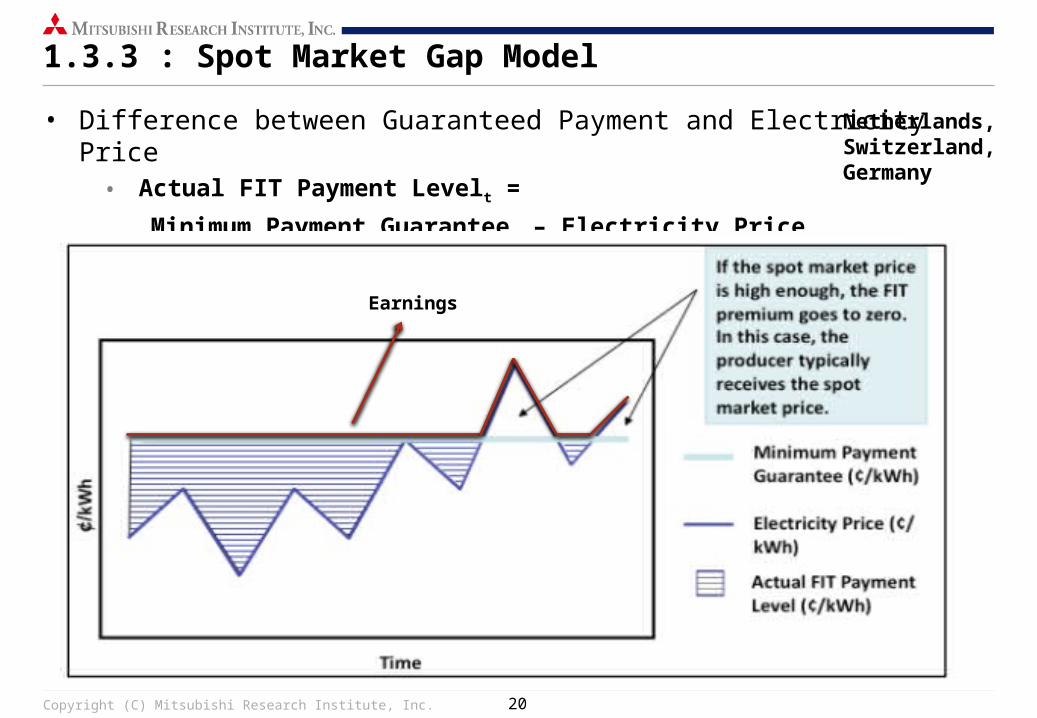
1.3.3 : Spot Market Gap Model
• Difference between Guaranteed Payment and Electricity Price• Actual FIT Payment Levelt =
Minimum Payment Guaranteet – Electricity Pricet
Netherlands, Switzerland, Germany
Earnings
Copyright (C) Mitsubishi Research Institute, Inc. 21
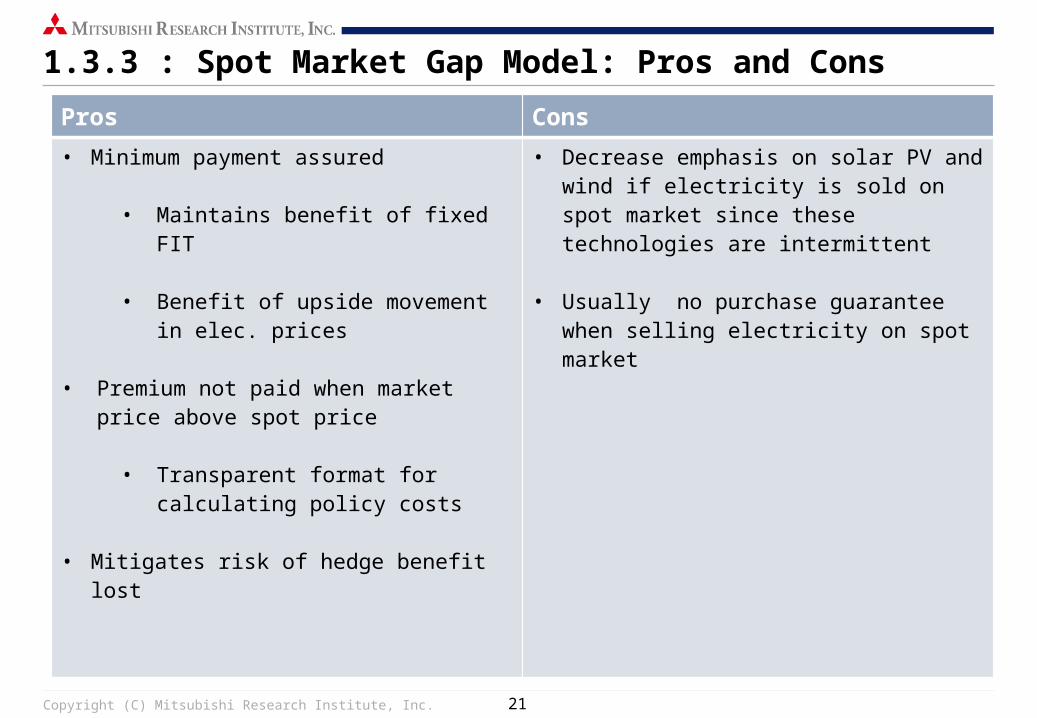
1.3.3 : Spot Market Gap Model: Pros and Cons
Pros Cons
• Minimum payment assured
• Maintains benefit of fixed FIT
• Benefit of upside movement in elec. prices
• Premium not paid when market price above spot price
• Transparent format for calculating policy costs
• Mitigates risk of hedge benefit lost
• Decrease emphasis on solar PV and wind if electricity is sold on spot market since these technologies are intermittent
• Usually no purchase guarantee when selling electricity on spot market
Copyright (C) Mitsubishi Research Institute, Inc. 22
1.3.4 : Percentage Based Premium Price FIT Model
• Defined as percentage of spot market price
• Used by Spain in 2004
• Increase or decrease in premiums based on movement of market price
• Significantly higher policy costs
• Volatile FIT payments
• Model rarely used
Copyright (C) Mitsubishi Research Institute, Inc. 23
1.4 : Real-World Example (Netherlands)
• Current RE policy known as SDE+ (Stimulering Duurzame Energieproductie) (2011)
• Premium FIT policy with elements of auction based scheme
• Only selected RE producers benefit from support tariff or premium
• SDE+ also know as “contract for difference” (CFD)
• Revenues above certain level
• 3.5 billion Euros available annually
• Levied on energy bills of households and industries
Copyright (C) Mitsubishi Research Institute, Inc. 24
1.4 : Real-World Example (Netherlands)
• Qualified producers
• Renewable electricity
• Renewable gas
• Renewable heat and power (CHP)
• Technologies included
• Solar, wind, biomass, hydro, and geothermal resources
• Granted for a period of 5, 12, or 15 years depending on technology
• Hydro, wind, geothermal, and solar have 15 duration
• Target is 14% RE by 2020
Copyright (C) Mitsubishi Research Institute, Inc. 25
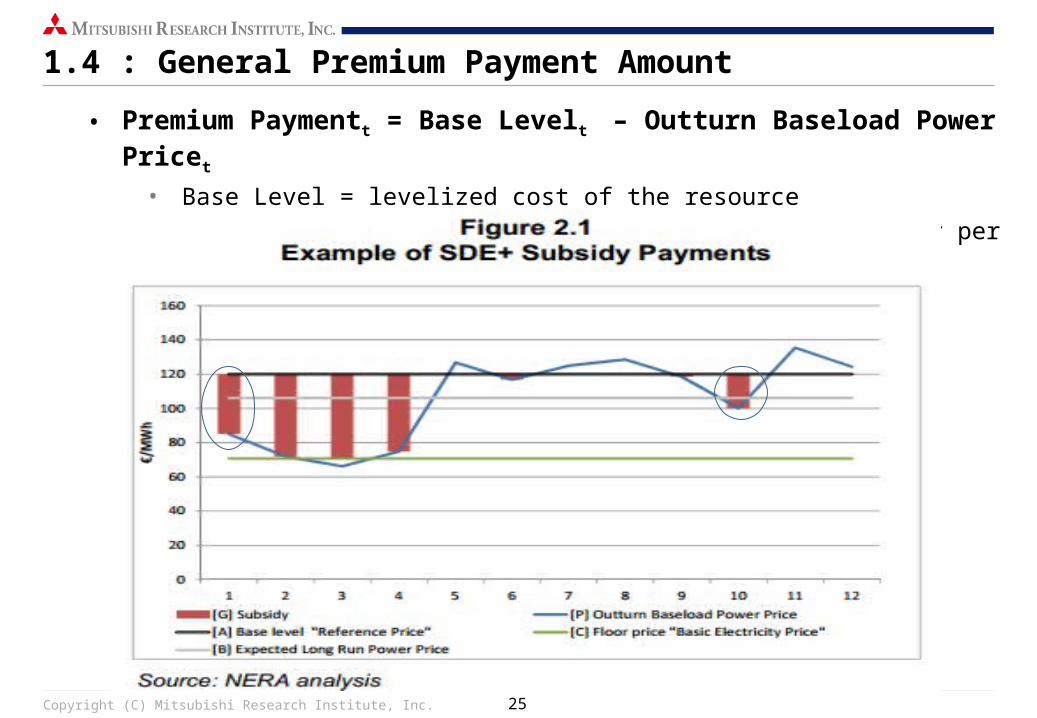
1.4 : General Premium Payment Amount
• Premium Paymentt = Base Levelt – Outturn Baseload Power Pricet
• Base Level = levelized cost of the resource• Outturn Baseload Power Price = average price of power per year
Copyright (C) Mitsubishi Research Institute, Inc. 26
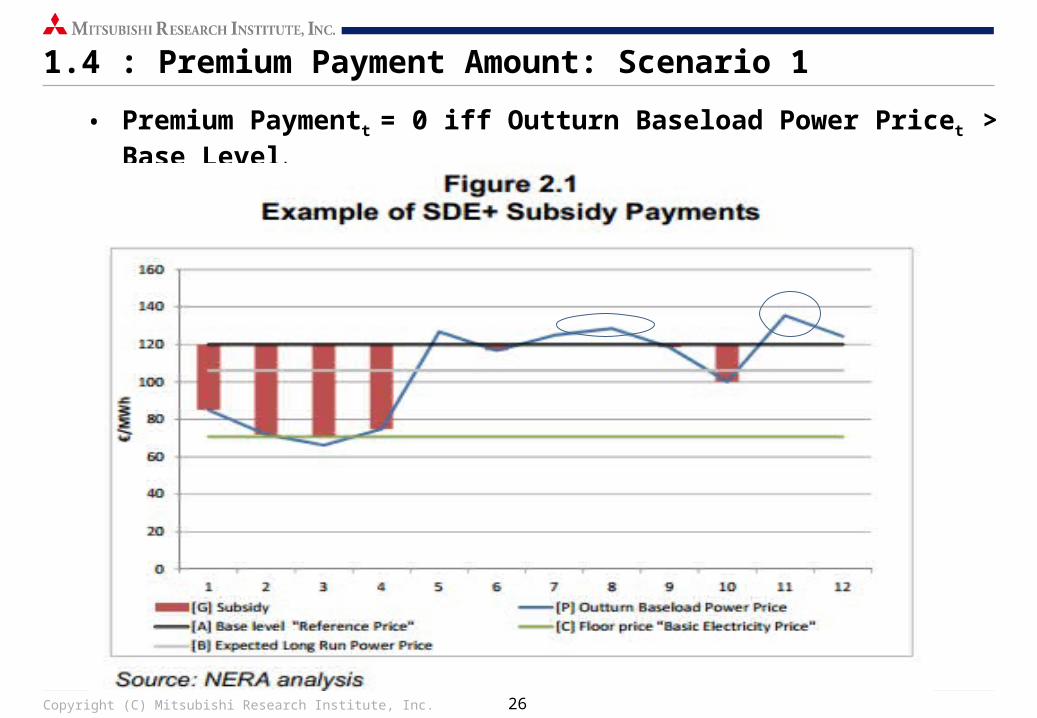
1.4 : Premium Payment Amount: Scenario 1
• Premium Paymentt = 0 iff Outturn Baseload Power Pricet > Base Levelt
Copyright (C) Mitsubishi Research Institute, Inc. 27
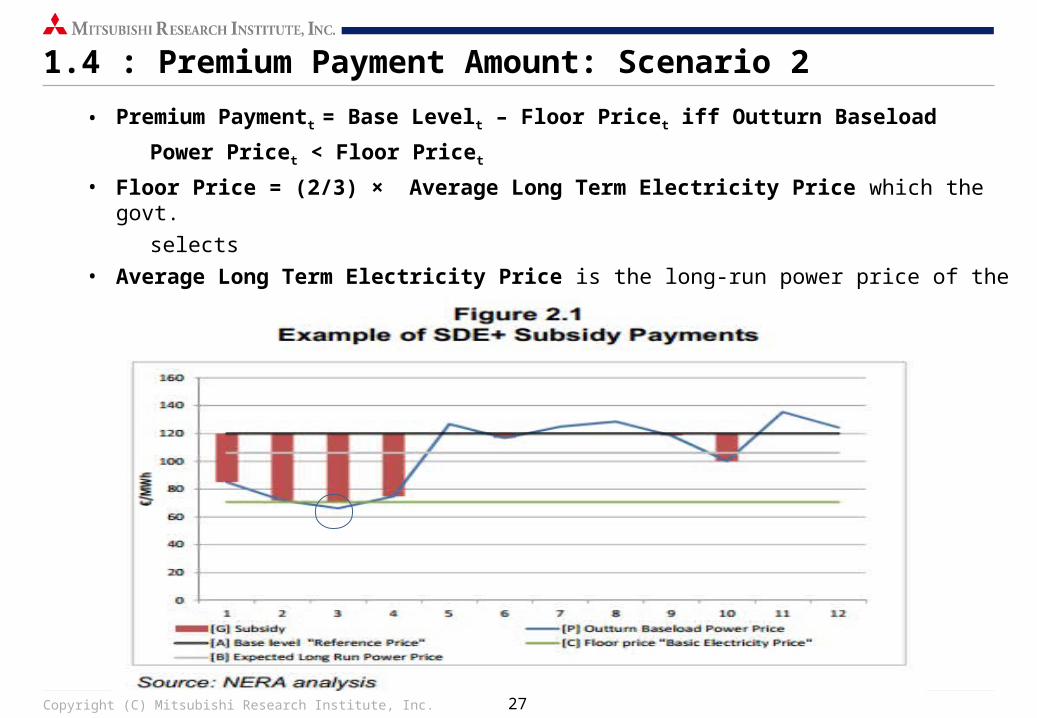
1.4 : Premium Payment Amount: Scenario 2
• Premium Paymentt = Base Levelt – Floor Pricet iff Outturn Baseload
Power Pricet < Floor Pricet
• Floor Price = (2/3) × Average Long Term Electricity Price which the govt.
selects
• Average Long Term Electricity Price is the long-run power price of the
respective RE source in the year that subsidy was applied
Copyright (C) Mitsubishi Research Institute, Inc. 28
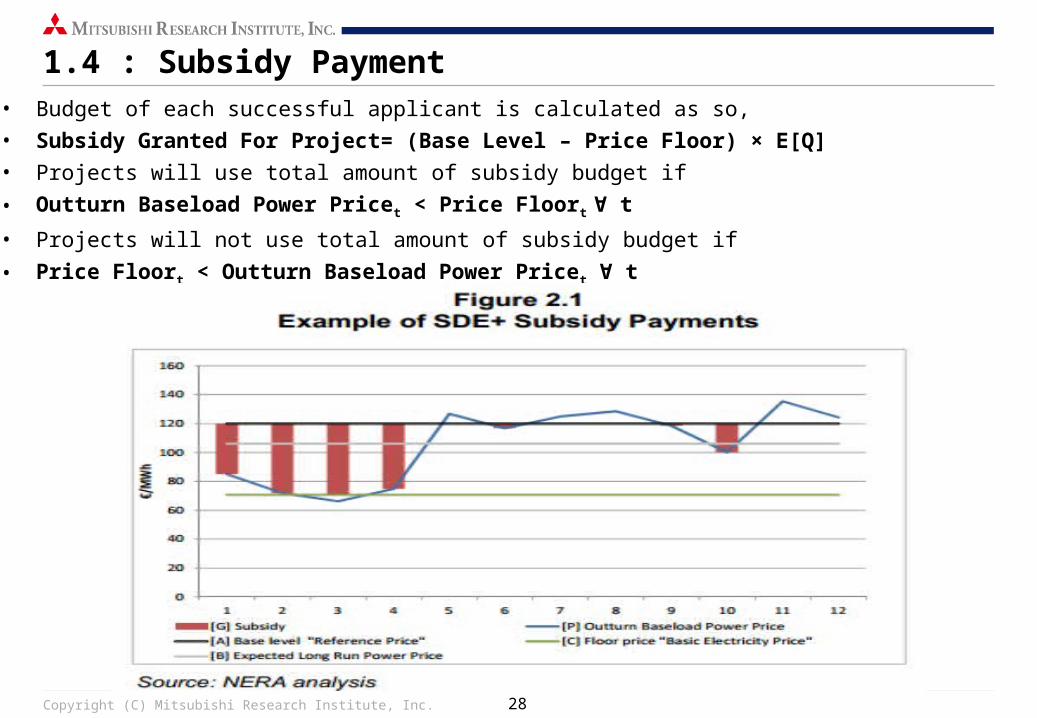
1.4 : Subsidy Payment• Budget of each successful applicant is calculated as so,
• Subsidy Granted For Project= (Base Level – Price Floor) × E[Q]
• Projects will use total amount of subsidy budget if
• Outturn Baseload Power Pricet < Price Floort t∀
• Projects will not use total amount of subsidy budget if
• Price Floort < Outturn Baseload Power Pricet t∀
Copyright (C) Mitsubishi Research Institute, Inc. 29
1.4 : Auction Scheme
• Subsidies only offered annually
• Encourages competition
• Government selects most cost effective-project
• Projects with lower base levels have priority access
• Favors larger projects (economies of scale) and innovative projects
• Auction in this sense
Copyright (C) Mitsubishi Research Institute, Inc. 30
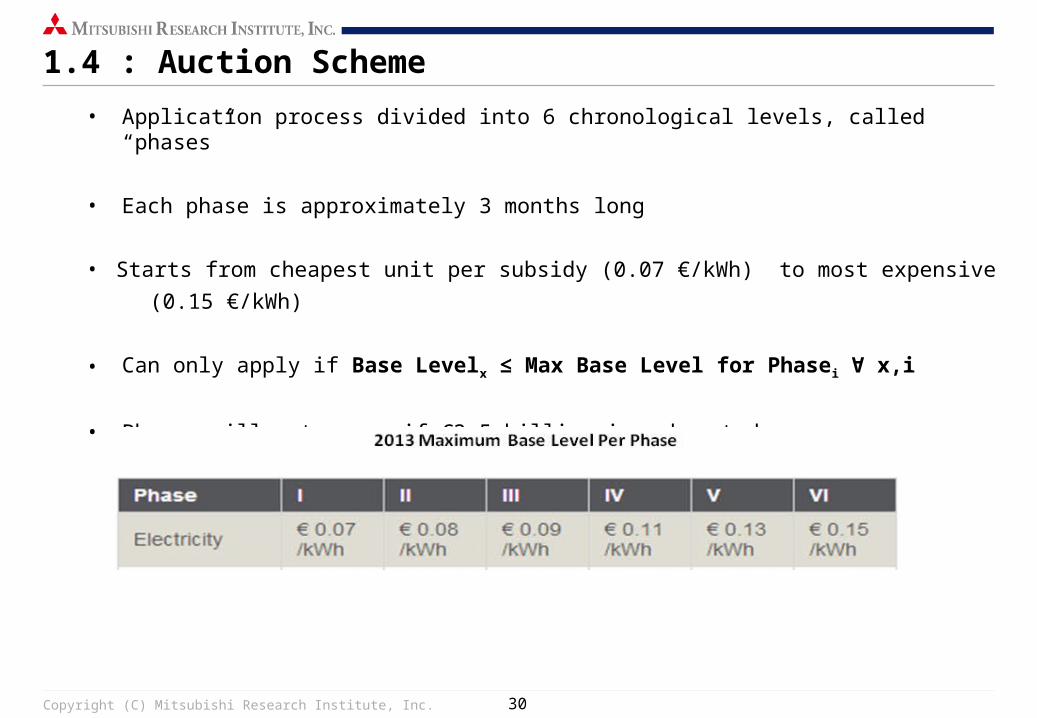
1.4 : Auction Scheme
• Application process divided into 6 chronological levels, called “phases”
• Each phase is approximately 3 months long
• Starts from cheapest unit per subsidy (0.07 €/kWh) to most expensive
(0.15 €/kWh)
• Can only apply if Base Levelx ≤ Max Base Level for Phasei x,i∀
• Phases will not ensue if €3.5 billion is exhausted
Copyright (C) Mitsubishi Research Institute, Inc. 31
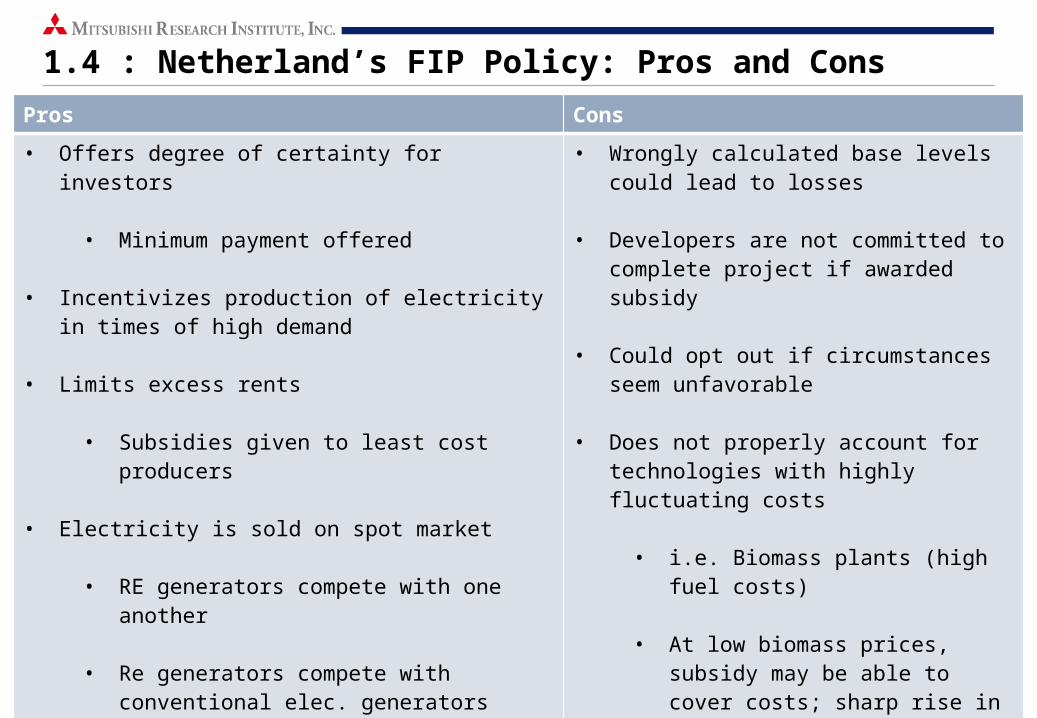
1.4 : Netherland’s FIP Policy: Pros and Cons
Pros Cons
• Offers degree of certainty for investors
• Minimum payment offered
• Incentivizes production of electricity in times of high demand
• Limits excess rents
• Subsidies given to least cost producers
• Electricity is sold on spot market
• RE generators compete with one another
• Re generators compete with conventional elec. generators
• Wrongly calculated base levels could lead to losses
• Developers are not committed to complete project if awarded subsidy
• Could opt out if circumstances seem unfavorable
• Does not properly account for technologies with highly fluctuating costs
• i.e. Biomass plants (high fuel costs)
• At low biomass prices, subsidy may be able to cover costs; sharp rise in prices could render subsidy useless
• Base price must be indexed to annual biomass prices
Copyright (C) Mitsubishi Research Institute, Inc. 32
1.5 : Conclusion
• FIP model mostly implemented in European countries
• Each FIP model has its own drawbacks
• Can be successful if implemented properly
• Tariff payment amounts
• Degression Rates
• Main goal is market integration
Copyright (C) Mitsubishi Research Institute, Inc. 33
2. Renewable Energy Power Business in Japan
2.1: FIT Scheme in Japan
2.2: Survey of Renewable Energy Sites
2.3: Challenges and Issues for RE Power Business in Japan
2.4: My Impressions
Copyright (C) Mitsubishi Research Institute, Inc. 34
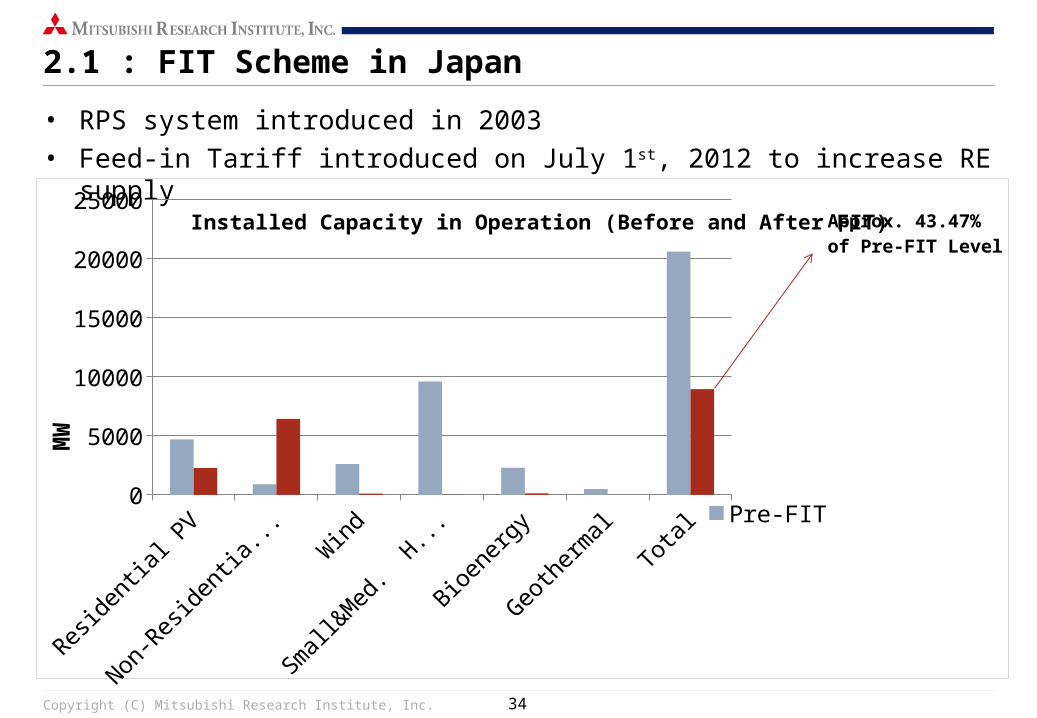
2.1 : FIT Scheme in Japan
• RPS system introduced in 2003• Feed-in Tariff introduced on July 1st, 2012 to increase RE supply
Reside
ntial
PV
Non-R
eside
ntial
PV
Wind
Small
&Med
. Hyd
ro
Bioene
rgy
Geo
ther
mal
Total
0
5000
10000
15000
20000
25000Installed Capacity in Operation (Before and After FIT)
Pre-FIT (July 2012 - March 2014)
MW
Approx. 43.47% of Pre-FIT Level
Copyright (C) Mitsubishi Research Institute, Inc. 35
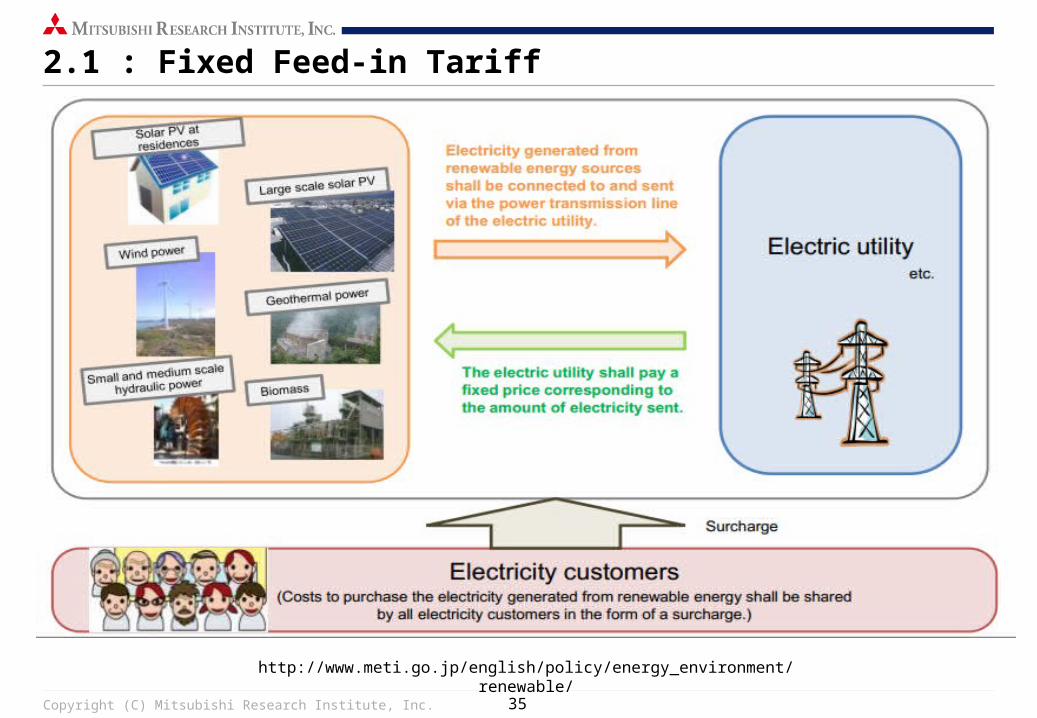
2.1 : Fixed Feed-in Tariff
http://www.meti.go.jp/english/policy/energy_environment/renewable/
Copyright (C) Mitsubishi Research Institute, Inc. 36
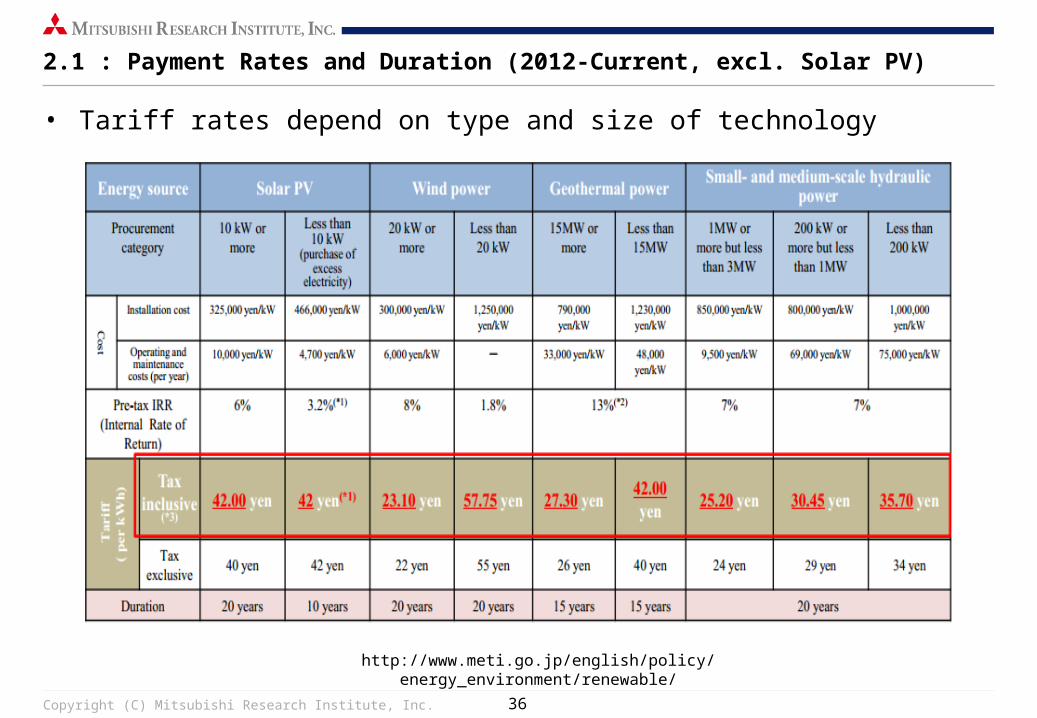
2.1 : Payment Rates and Duration (2012-Current, excl. Solar PV)
• Tariff rates depend on type and size of technology
http://www.meti.go.jp/english/policy/energy_environment/renewable/
Copyright (C) Mitsubishi Research Institute, Inc. 37
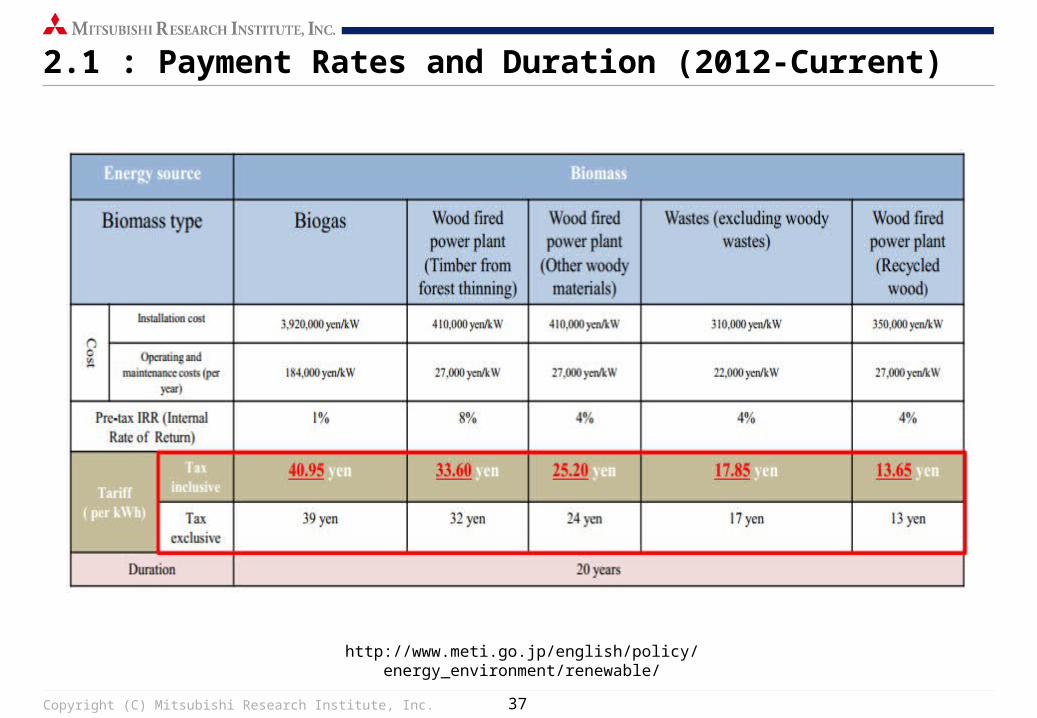
2.1 : Payment Rates and Duration (2012-Current)
http://www.meti.go.jp/english/policy/energy_environment/renewable/
Copyright (C) Mitsubishi Research Institute, Inc. 38
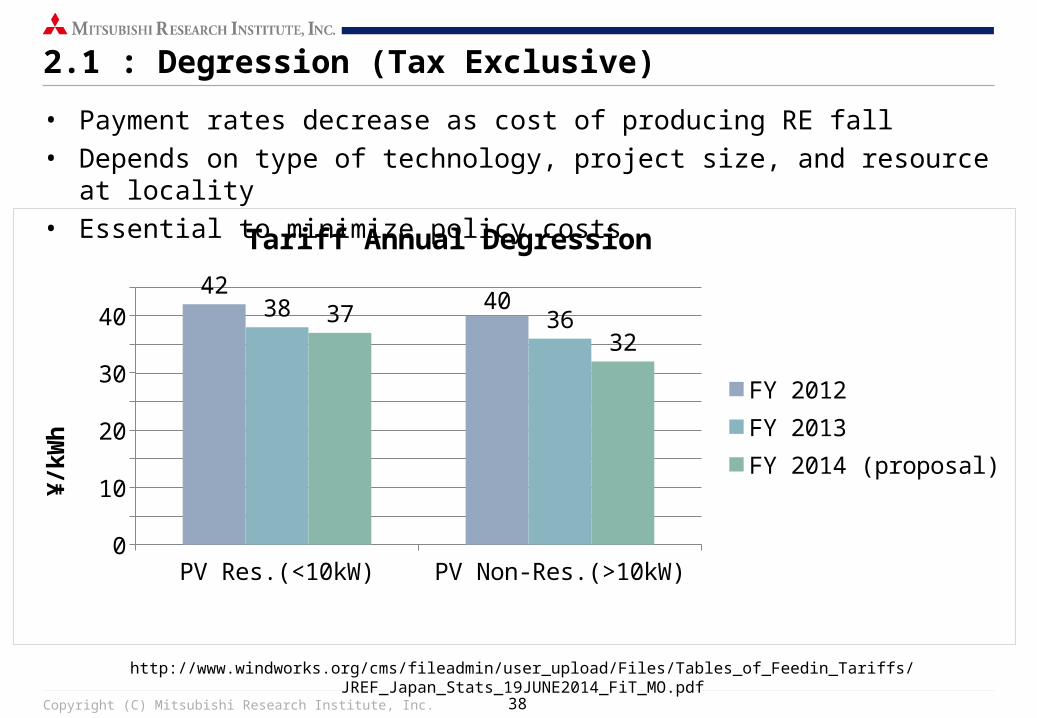
2.1 : Degression (Tax Exclusive)
• Payment rates decrease as cost of producing RE fall• Depends on type of technology, project size, and resource at locality• Essential to minimize policy costs
PV Res.(<10kW) PV Non-Res.(>10kW)0
5
10
15
20
25
30
35
40
45 424038
3637
32
Tariff Annual Degression
FY 2012FY 2013FY 2014 (proposal)
¥/kW
h
http://www.windworks.org/cms/fileadmin/user_upload/Files/Tables_of_Feedin_Tariffs/JREF_Japan_Stats_19JUNE2014_FiT_MO.pdf
Copyright (C) Mitsubishi Research Institute, Inc. 39
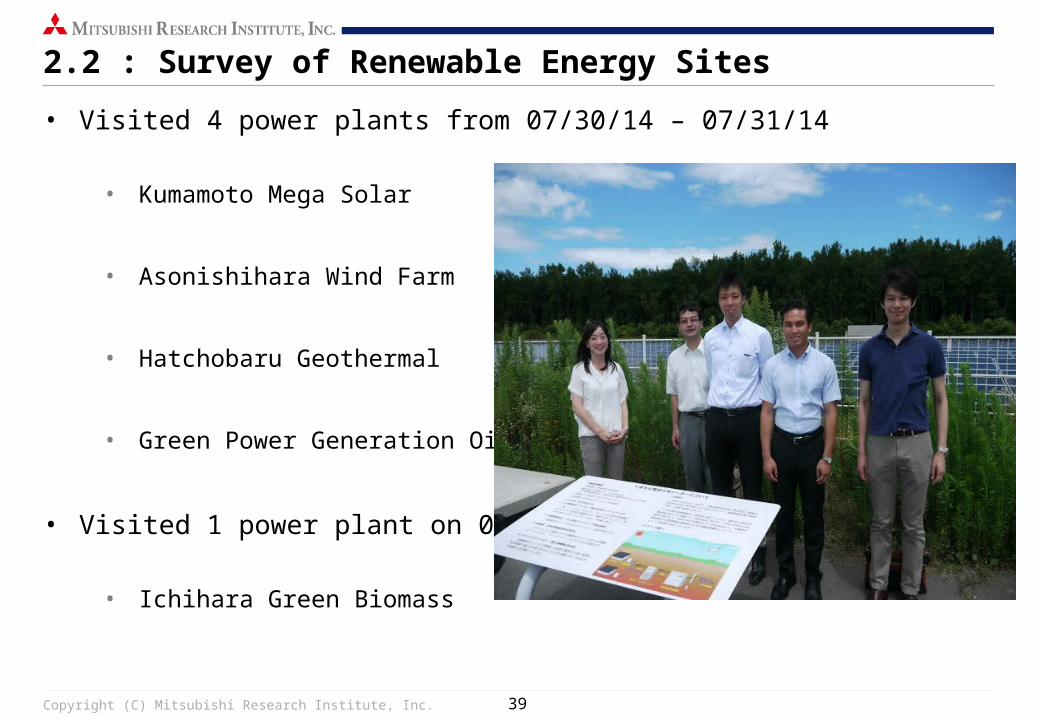
2.2 : Survey of Renewable Energy Sites
• Visited 4 power plants from 07/30/14 – 07/31/14
• Kumamoto Mega Solar
• Asonishihara Wind Farm
• Hatchobaru Geothermal
• Green Power Generation Oita
• Visited 1 power plant on 08/06/14
• Ichihara Green Biomass
Copyright (C) Mitsubishi Research Institute, Inc. 40
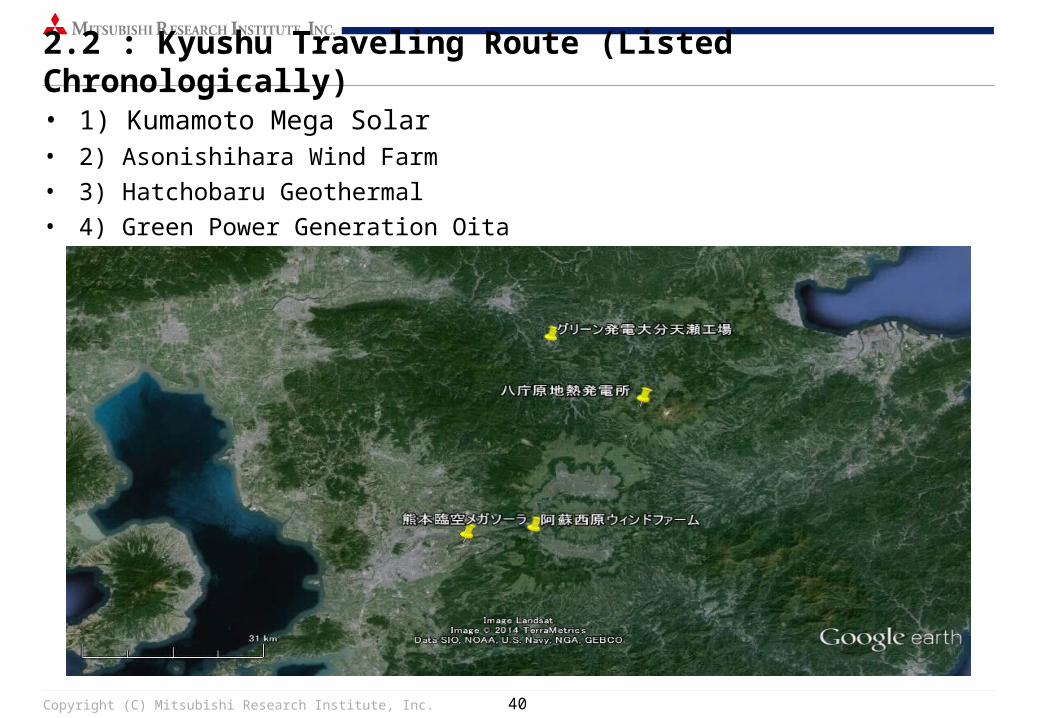
2.2 : Kyushu Traveling Route (Listed Chronologically)
• 1) Kumamoto Mega Solar• 2) Asonishihara Wind Farm
• 3) Hatchobaru Geothermal
• 4) Green Power Generation Oita
Copyright (C) Mitsubishi Research Institute, Inc. 41
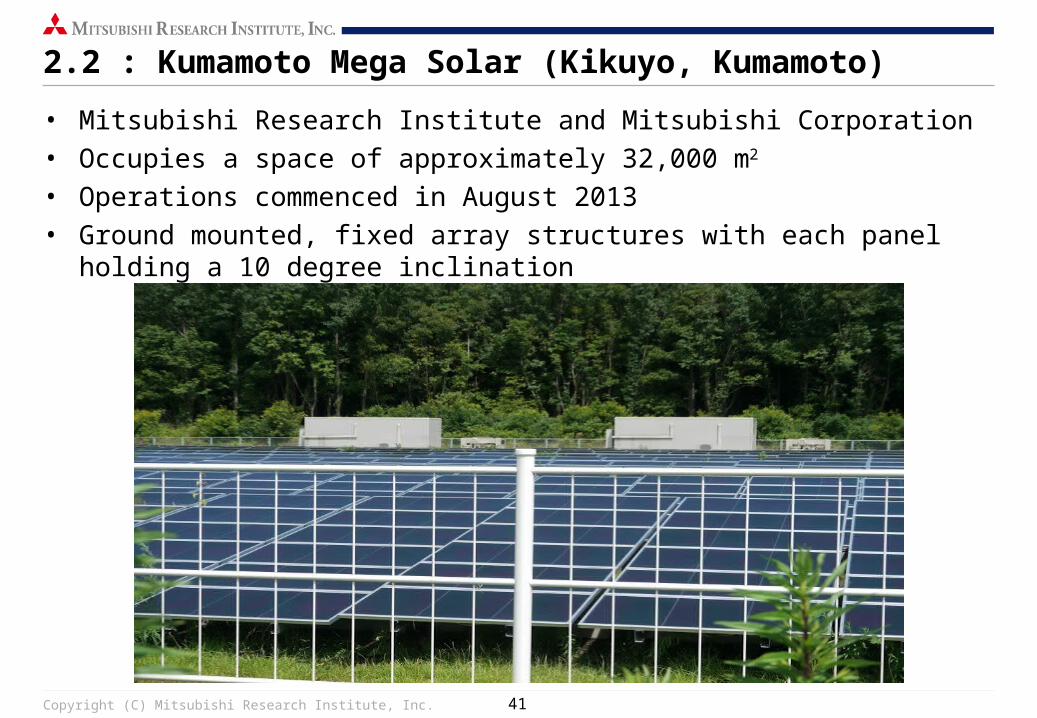
2.2 : Kumamoto Mega Solar (Kikuyo, Kumamoto)
• Mitsubishi Research Institute and Mitsubishi Corporation• Occupies a space of approximately 32,000 m2
• Operations commenced in August 2013• Ground mounted, fixed array structures with each panel holding a 10 degree
inclination
Copyright (C) Mitsubishi Research Institute, Inc. 42
2.2 : Kumamoto Mega Solar (Kikuyo, Kumamoto), Basic Operations
• Total capacity of this project is 2 MW
• 40 yen per kWh for a duration of 20 years
• Generated power is sold to Kyushu Electric Power Co.
• Provided to consumers located in the Kumamoto area
• The site reaches its peak power production at noon when incident solar radiation is perpendicular to the module surface (bell-shaped curve)
Copyright (C) Mitsubishi Research Institute, Inc. 43
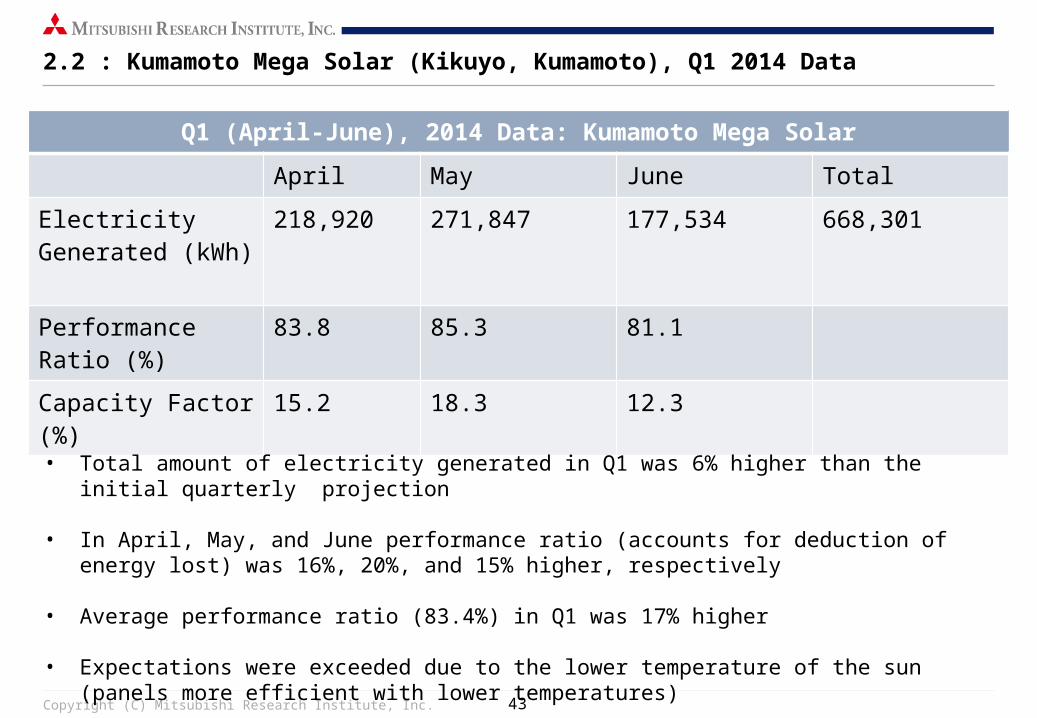
2.2 : Kumamoto Mega Solar (Kikuyo, Kumamoto), Q1 2014 Data
Q1 (April-June), 2014 Data: Kumamoto Mega Solar
April May June Total
Electricity Generated (kWh)
218,920 271,847 177,534 668,301
Performance Ratio (%)
83.8 85.3 81.1
Capacity Factor (%) 15.2 18.3 12.3
• Total amount of electricity generated in Q1 was 6% higher than the initial quarterly projection
• In April, May, and June performance ratio (accounts for deduction of energy lost) was 16%, 20%, and 15% higher, respectively
• Average performance ratio (83.4%) in Q1 was 17% higher
• Expectations were exceeded due to the lower temperature of the sun (panels more efficient with lower temperatures)
Copyright (C) Mitsubishi Research Institute, Inc. 44
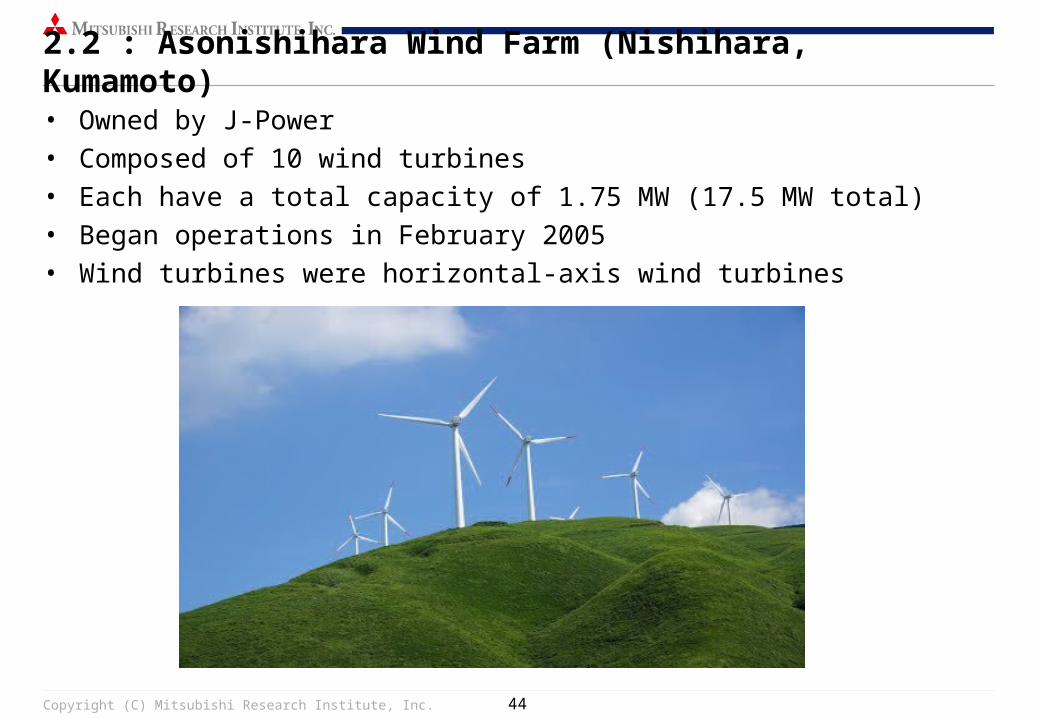
2.2 : Asonishihara Wind Farm (Nishihara, Kumamoto)
• Owned by J-Power• Composed of 10 wind turbines• Each have a total capacity of 1.75 MW (17.5 MW total)• Began operations in February 2005• Wind turbines were horizontal-axis wind turbines
Copyright (C) Mitsubishi Research Institute, Inc. 45
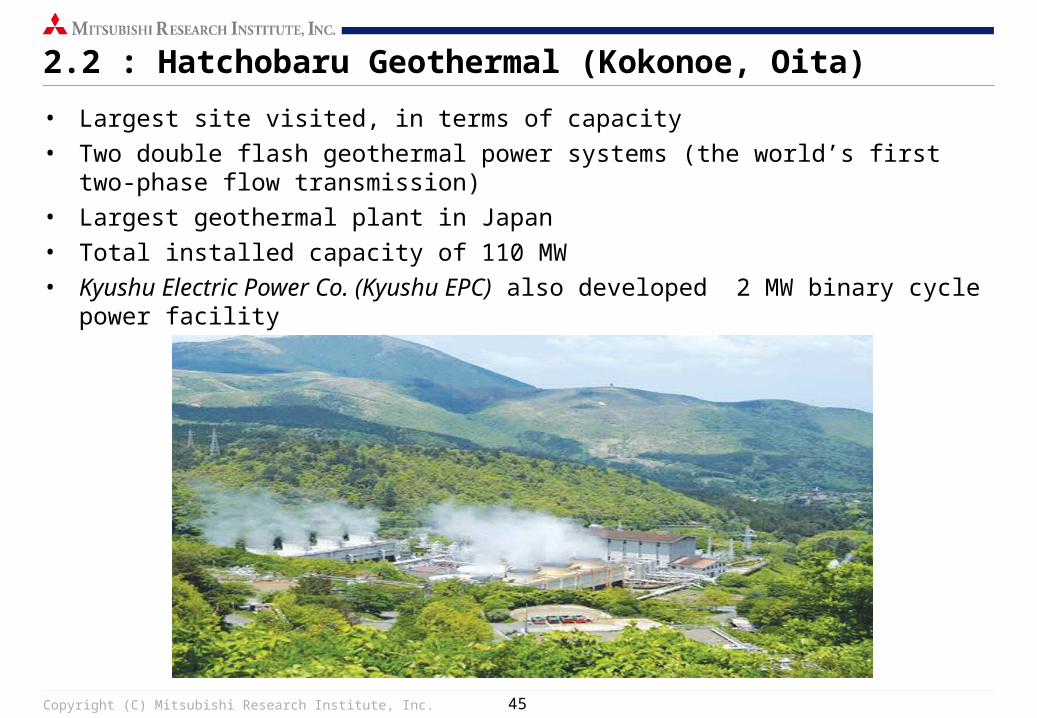
2.2 : Hatchobaru Geothermal (Kokonoe, Oita)
• Largest site visited, in terms of capacity
• Two double flash geothermal power systems (the world’s first two-phase flow transmission)
• Largest geothermal plant in Japan
• Total installed capacity of 110 MW
• Kyushu Electric Power Co. (Kyushu EPC) also developed 2 MW binary cycle power facility
Copyright (C) Mitsubishi Research Institute, Inc. 46
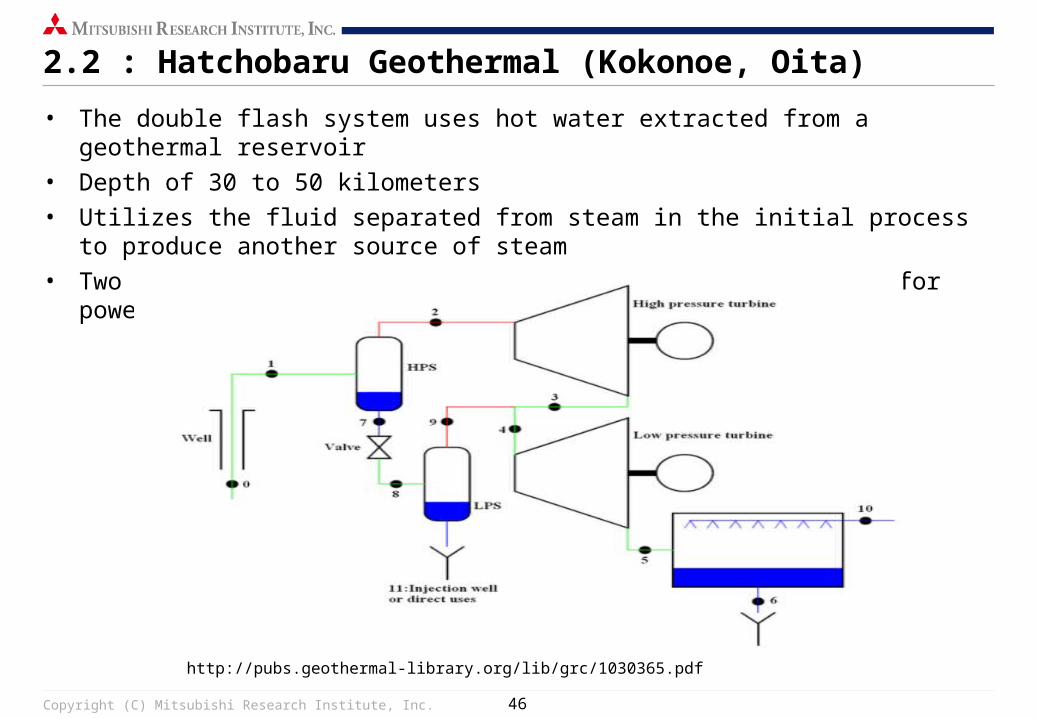
2.2 : Hatchobaru Geothermal (Kokonoe, Oita)
• The double flash system uses hot water extracted from a geothermal reservoir
• Depth of 30 to 50 kilometers
• Utilizes the fluid separated from steam in the initial process to produce another source of steam
• Two sources of steam are then used to rotate the turbine for power generation
http://pubs.geothermal-library.org/lib/grc/1030365.pdf
Copyright (C) Mitsubishi Research Institute, Inc. 47
2.2. : Hatchobaru Geothermal (Kokonoe, Oita)• Increases output by 15% to 25%
• High capacity rate (60% to 70%)
• Holds an advantage over intermittent renewable energy sources like solar and wind
• Binary cycle system is used where geothermal fluids are at lower temperatures and no steam is available
• Low boiling fluid is heated with hot water to create the steam needed for power generation
• Estimated 23,000 MW worth of geothermal resource capacity
• Equivalent to more than 20 nuclear power plants
• Japan is only behind Indonesia and the United States
Copyright (C) Mitsubishi Research Institute, Inc. 48
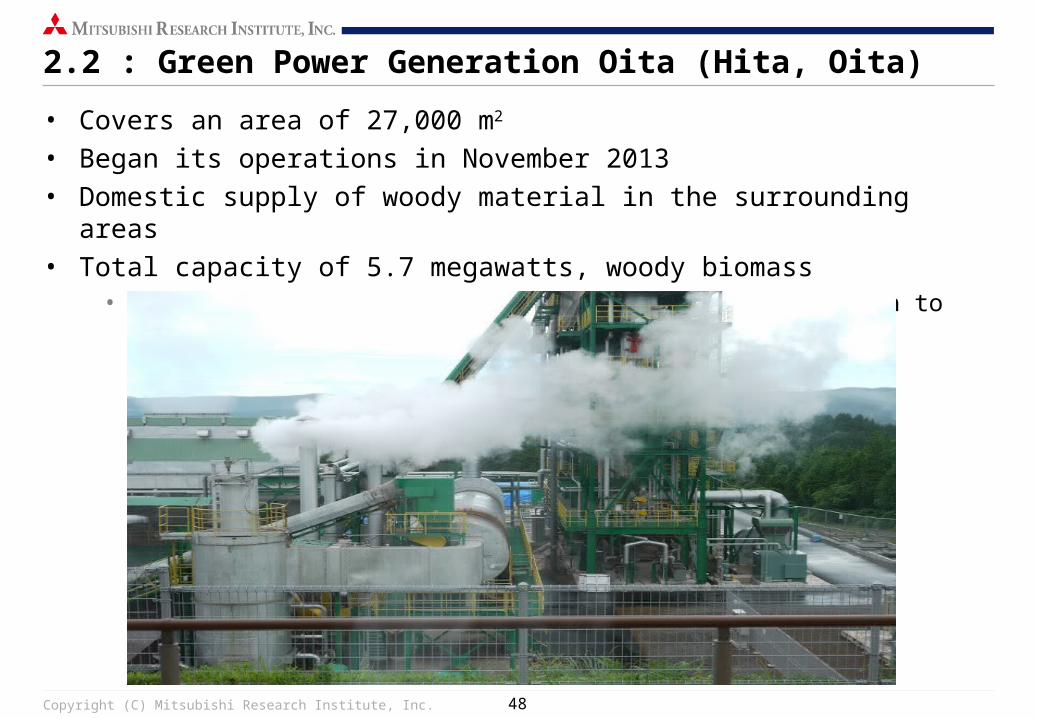
2.2 : Green Power Generation Oita (Hita, Oita)
• Covers an area of 27,000 m2
• Began its operations in November 2013• Domestic supply of woody material in the surrounding areas• Total capacity of 5.7 megawatts, woody biomass
• Annual supply of 70,000 tons of fuel per year (enough to power 10,000 homes)
Copyright (C) Mitsubishi Research Institute, Inc. 49
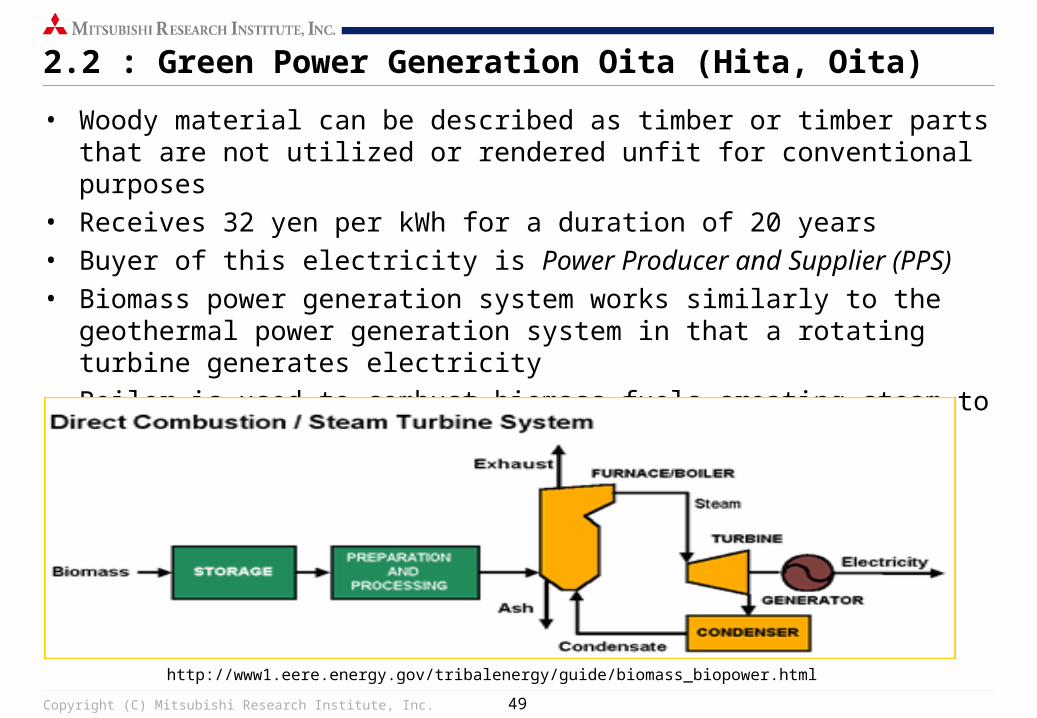
2.2 : Green Power Generation Oita (Hita, Oita)
• Woody material can be described as timber or timber parts that are not utilized or rendered unfit for conventional purposes
• Receives 32 yen per kWh for a duration of 20 years• Buyer of this electricity is Power Producer and Supplier (PPS)• Biomass power generation system works similarly to the geothermal power
generation system in that a rotating turbine generates electricity• Boiler is used to combust biomass fuels creating steam to rotate the turbine• Net emission of C02 is zero
http://www1.eere.energy.gov/tribalenergy/guide/biomass_biopower.html
Copyright (C) Mitsubishi Research Institute, Inc. 50
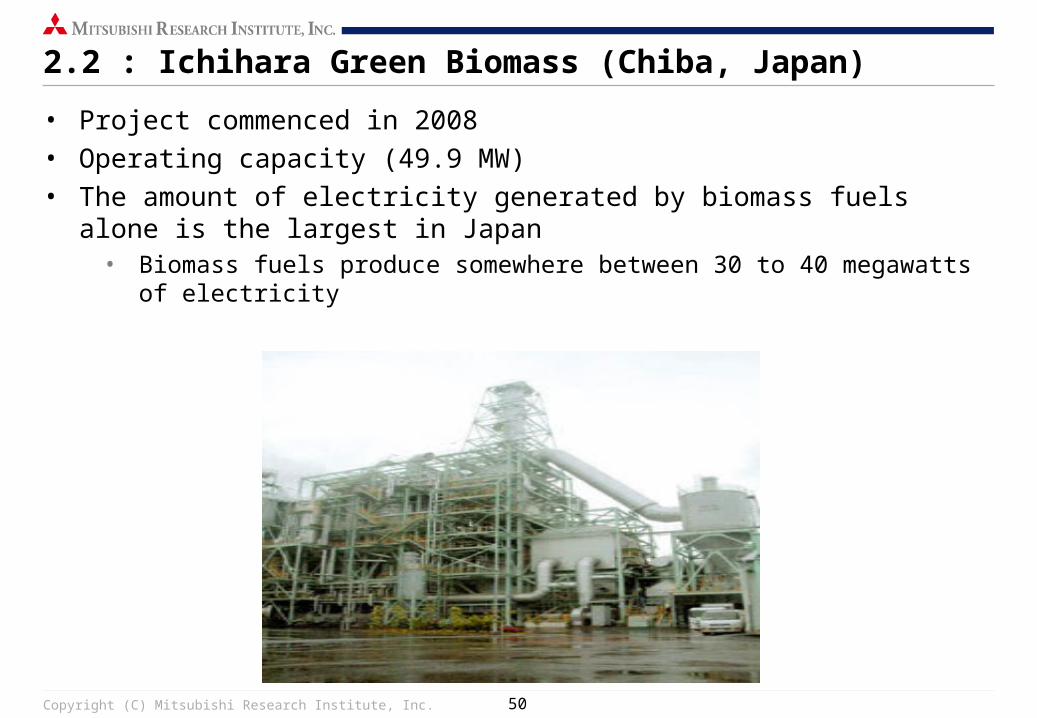
2.2 : Ichihara Green Biomass (Chiba, Japan)
• Project commenced in 2008• Operating capacity (49.9 MW)• The amount of electricity generated by biomass fuels alone is the largest in
Japan• Biomass fuels produce somewhere between 30 to 40 megawatts of electricity
Copyright (C) Mitsubishi Research Institute, Inc. 51
2.2 : Ichihara Green Biomass (Chiba, Japan)
• Refuse Paper and Plastic Fuel (RPF)
• 95% biomass (wasted woody biomass from construction) and 5% plastic
• Biomass component of the fuel is derived from wood collected from old houses
• Biomass system used to convert these fuels to energy is of the standard type
• Transition from the old RPS policy to FIT
• Under the RPS policy, Green Power Ichihara sold its electricity to TEPCO
• Electrical output is being sold to different utilities at a price of 13 yen per kWh
Copyright (C) Mitsubishi Research Institute, Inc. 52
2.3 : Challenges and Issues for RE Power Business in Japan
• Regulated Electricity Market
• Retail and power generation control by regional monopolies
• Limited access to the grid
• Unfavorable for RE generators
• Asymmetric deployment in technologies
• Overload of solar projects
• Untapped potential
Copyright (C) Mitsubishi Research Institute, Inc. 53
2.3 : Regulated Electricity Market
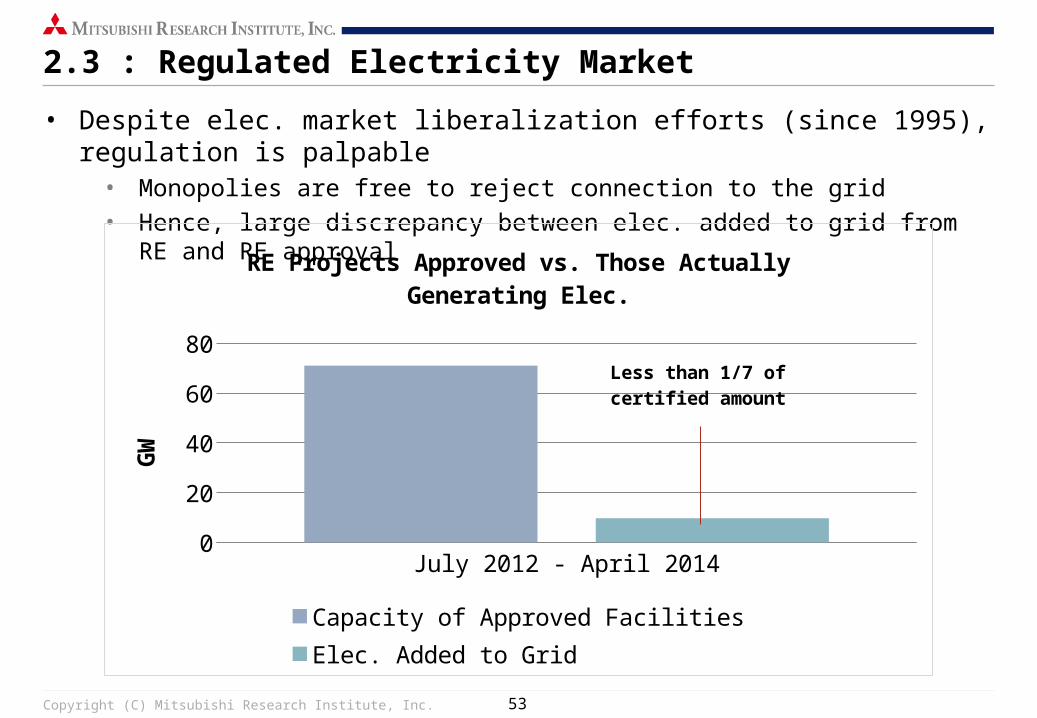
• Despite elec. market liberalization efforts (since 1995), regulation is palpable• Monopolies are free to reject connection to the grid• Hence, large discrepancy between elec. added to grid from RE and RE approval
July 2012 - April 20140
1020304050607080
RE Projects Approved vs. Those Actually Generating Elec.
Capacity of Approved Facilities Elec. Added to Grid
GW
Less than 1/7 of certified amount
Copyright (C) Mitsubishi Research Institute, Inc. 54
2.3 : Regulated Electricity Market
• Weak inter-zone transmissions grid
• For example, only a limited amount of electricity generated in Hokkaido (controlled by Hokkaido Elec. Power Co.) can be sent to Tohoku
• Inter transmission grids have small cables (i.e. HokkaidoTohoku is 600 MW)
• Eliminates ability to maximize from areas with strong RE resources (i.e. wind in Hokkaido)
• Grid Expansion
• Utilities have no obligation to expand grid in order to accommodate RE
Copyright (C) Mitsubishi Research Institute, Inc. 55
2.3 : Measures for Regulated Electricity Market
• Reformation of Japanese electricity market
• Full liberalization of electricity market set to take place from 2016-2020
• Long-Term Plan
• Open retail market to full competition
• Open power generation sector to full competition
• Unbundle the transmission and distribution sectors (access of all players to distribution and transmission systems without discrimination).
• Unconditional access to grid for RE suppliers
• Transmission of electricity beyond regions
• Creates competition for current monopolies
• Energy mix will contain more renewable energy
Copyright (C) Mitsubishi Research Institute, Inc. 56
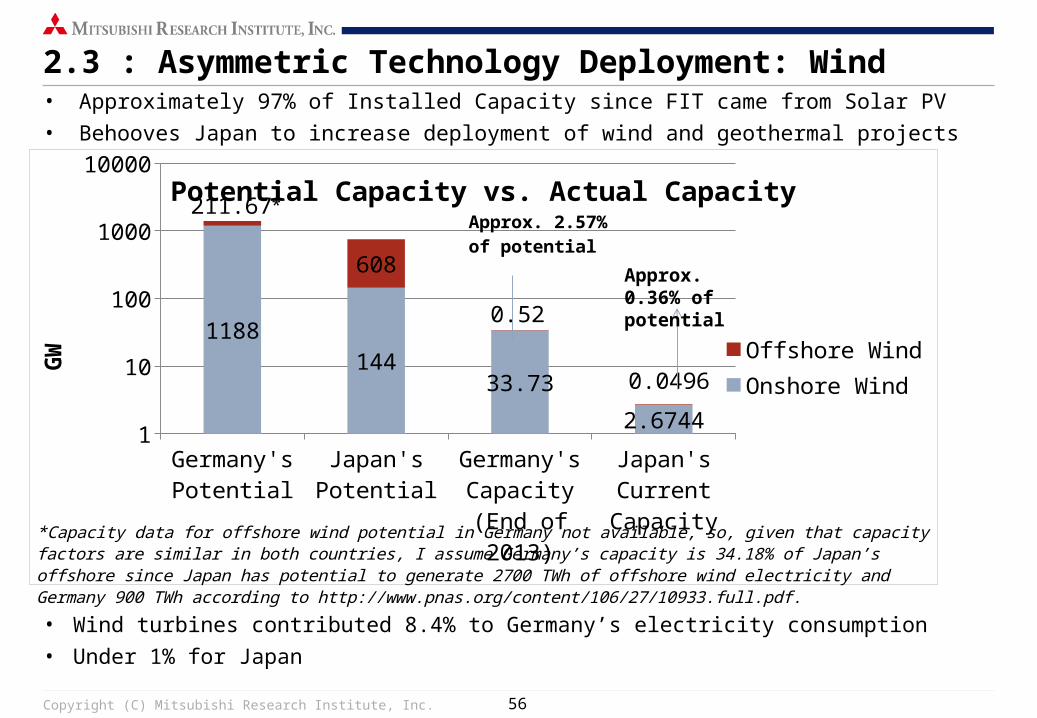
2.3 : Asymmetric Technology Deployment: Wind• Approximately 97% of Installed Capacity since FIT came from Solar PV
• Behooves Japan to increase deployment of wind and geothermal projects
• Wind turbines contributed 8.4% to Germany’s electricity consumption
• Under 1% for Japan
1
10
100
1000
10000
1188144
33.73
2.6744
211.67
608
0.52
0.0496
Potential Capacity vs. Actual Capacity
Offshore WindOnshore Wind
GW
Approx. 2.57% of potential
*Capacity data for offshore wind potential in Germany not available, so, given that capacity factors are similar in both countries, I assume Germany’s capacity is 34.18% of Japan’s offshore since Japan has potential to generate 2700 TWh of offshore wind electricity and Germany 900 TWh according to http://www.pnas.org/content/106/27/10933.full.pdf.
*
Approx. 0.36% of potential
Copyright (C) Mitsubishi Research Institute, Inc. 57
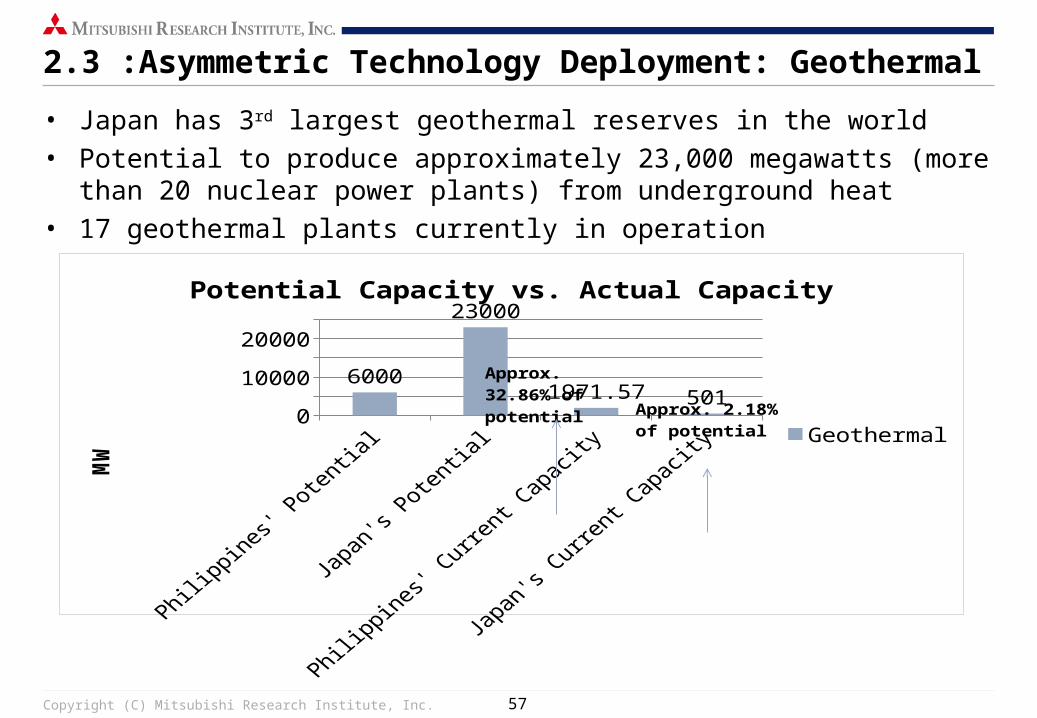
2.3 :Asymmetric Technology Deployment: Geothermal
• Japan has 3rd largest geothermal reserves in the world• Potential to produce approximately 23,000 megawatts (more than 20 nuclear
power plants) from underground heat• 17 geothermal plants currently in operation
Philipp
ines'
Poten
tial
Japa
n's P
oten
tial
Philipp
ines'
Curre
nt C
apac
ity
Japa
n's C
urre
nt C
apac
ity0
10000
20000
6000
23000
1971.57 501
Potential Capacity vs. Actual Capacity
Geothermal
MW
Approx. 32.86% of potential
Approx. 2.18% of potential
Copyright (C) Mitsubishi Research Institute, Inc. 58
2.3 : Potential Remedies for Asymmetric Technology Deployment
• Liberalization of the electricity market
• Break-up GEU’s (General Electricity Utility) monopoly power
• Will elicit fair competition
• In the meanwhile, create incentives to increase deployment in technologies other than solar PV
• Higher FIT rates (i.e. wind and geothermal)
• Priority grid access
• Grid Expansion
• Stronger inter-zone transmission grid
Copyright (C) Mitsubishi Research Institute, Inc. 59
2.3 : Potential Remedies for Asymmetric Technology Deployment
• Loosening rules on wind farms
• Strict building codes
• Addressing political and social obstacles for geothermal energy
• 60% of geothermal energy located in national parks (reexamine environmental protection laws)
• Resistance from hot-spring owners
Copyright (C) Mitsubishi Research Institute, Inc. 60
2.4 : My Impressions
• Great deal of potential for RE in Japan
• Panacea for energy woes in resource-scarce Japan
• RE is safe and stable
• FIT policy has been a driving force in increasing the RE supply in Japan
• Down the line, appropriate tariff rates for FIT policy are important
• FIT rates that are too high will overburden consumers (electricity is inelastic)
• FIT rates that are too low will deter investment in RE (cost > revenue)
• Also important to look at FIT policy mature countries for guidance (i.e. Germany, Spain, etc.)
Copyright (C) Mitsubishi Research Institute, Inc. 61
2.4: My Impressions
• Further progress of RE power business in Japan is contingent on different factors
• Liberalization of electricity market in the near future is imperative
• Procuring funds for grid expansion
• Developing effective RE energy storage devices to attain grid stability
• Creating greater incentives for certain RE technologies
• Loosening building codes and revising environmental policy
• Ultimately, RE can thrive if these matters are addressed
Copyright (C) Mitsubishi Research Institute, Inc. 62
References
Couture, Toby, Karlynn Cory, Claire Kreycik, and Emily Williams. “A Policymaker’s Guide to Feed-in Tariff Policy Design.” NREL (2010): 51-66. NREL Online. Web. July 15. 2014.
"Get to Know the SDE+ 2012." NL Agency Ministry of Economic Affairs(n.d.): n. pag. Web. 21 Aug. 2012.
"Global Wind Report: Annual Market Update 2013." GWEC (n.d.): n. pag. Web. 07 Sept. 2014. <http://www.gwec.net/wp-content/uploads/2014/04/GWEC-Global-Wind-Report_9-April-2014.pdf>.
Ferroukhi, Rabia, and Diala Hawila. “Renewable Energy Tariff-Based Mechanisms.” IRENA (2012): 16. IRENA Online. Web. July 17. 2014.
Fulton, Mark, Reid Capalino, and Josef Auer. “The German Feed-in Tariff: Recent Policy Changes.” Deutsche Bank Group (2012): 1-27. Deutsche Bank Group Online. Web. July 12th. 2014.
"Geothermal Energy in Philippines and Indonesia." REVE. N.p., 1 Nov. 2013. Web. 08 Sept. 2014. <http://www.evwind.es/2013/11/01/geothermal-energy-in-philippines-and-indonesia/37199>.
Johnston, Eric. "Power Play: The Debate over Renewable Energy." Japan Times RSS. N.p., n.d. Web. 08 Sept. 2014. <http://www.japantimes.co.jp/news/2014/08/16/business/power-play-debate-renewable-energy/#.VA1pB8J_saB>.
Copyright (C) Mitsubishi Research Institute, Inc. 63
References
Lu, X., M. B. Mcelroy, and J. Kiviluoma. "From the Cover: Global Potential for Wind-generated Electricity." Proceedings of the National Academy of Sciences 106.27 (2009): 10933-0938. Web. 07 Sept. 2014. <http://www.pnas.org/content/106/27/10933.full.pdf>.
Nakazawa, Masato. "Potential Geothermal Energy in Japan." Environmental Resource Center SJSU. N.p., 13 May 2013. Web. 08 Sept. 2014. <http://www.ercsjsu.org/blog/potential-geothermal-energy-in-japan>.
Radov, Daniel, Robin Brejnholt, Ruxandra Ciupagea, Harry Fearnehough, Monique Voogt, and Mirjam Harmelink. “Options for a Renewable Energy Supplier Obligation in the Netherlands.” NERA (2013): 5-10. NERA Online. Web. July 18, 2014.
"SDE+ 2014." Netherlands Enterprise Agency (n.d.): n. pag. Feb. 2014. Web. 21 Aug. 2014. <http://english.rvo.nl/sites/default/files/2014/04/Brochure%20SDE%2B%202014.pdf>.
"STATISTICS | JREF." STATISTICS | JREF. N.p., n.d. Web. 08 Sept. 2014. <http://jref.or.jp/en/energy/general.php>.
Takehama, Asami. "Grid Integration Issues of Renewable Energy in Japan and Transparency of Grid Data." (n.d.): n. pag. 29 Aug. 2013. Web. 07 Sept. 2014. <http://www.polsoz.fu-berlin.de/polwiss/forschung/systeme/ffu/veranstaltungen/termine/downloads/13_salzburg/Takehama-Salzburg-2013.pdf>.
Copyright (C) Mitsubishi Research Institute, Inc. 64
References
Watanabe, Chisaki. "GE Says Japan Has More Potential to Harness Wind Power." Bloomberg.com. Bloomberg, 27 Feb. 2014. Web. 08 Sept. 2014. <http://www.bloomberg.com/news/2014-02-26/ge-says-japan-has-more-potential-to-harness-wind-energy.html>.
Yamazaki, Takuya. "Electricity Market Reform in Japan." Ministry of Economy, Trade and Industry (n.d.): n. pag. Http://www.eu-japan.eu/sites/eu-japan.eu/files/Session2_Yamazaki.pdf. 11 Sept. 2013. Web. 07 Sept. 2014. <http://www.eu-japan.eu/sites/eu-japan.eu/files/Session2_Yamazaki.pdf>.
Yates, Tarn, and Bradley Hibberd. “Levelized Cost of Energy.” Solar Pro. April/May 2012. http://solarprofessional.com/articles/finance-economics/levelized-cost-of-energy.

Copyright (C) Mitsubishi Research Institute, Inc. 65
Thank you for your attention!
Name: Hajime Alabanza
Email: [email protected]