Embed Size (px)
Citation preview
Fit and Healthy Make the Mind Wealthy
Jeffrey Levi, PhDExecutive Director, Trust for America’s Health
Associate Professor of Health Policy, GWU, School of Public Health and Health Services
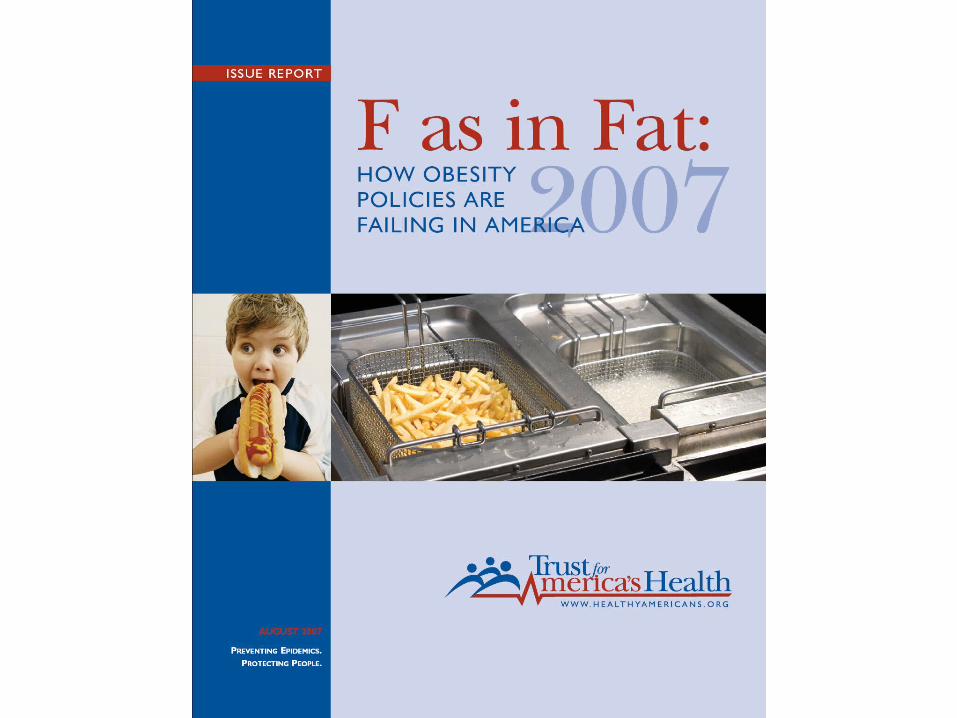
Key Findings from F as in Fat, 2007
Approximately 25 million children are obese or overweight.
The rate of childhood obesity more than tripled from 1980 to 2004.
14.8% of youth ages 10-17 are overweight. (National Survey on Children)
13.1% of high school students are overweight. (Youth Risk Behavior Surveillance System)
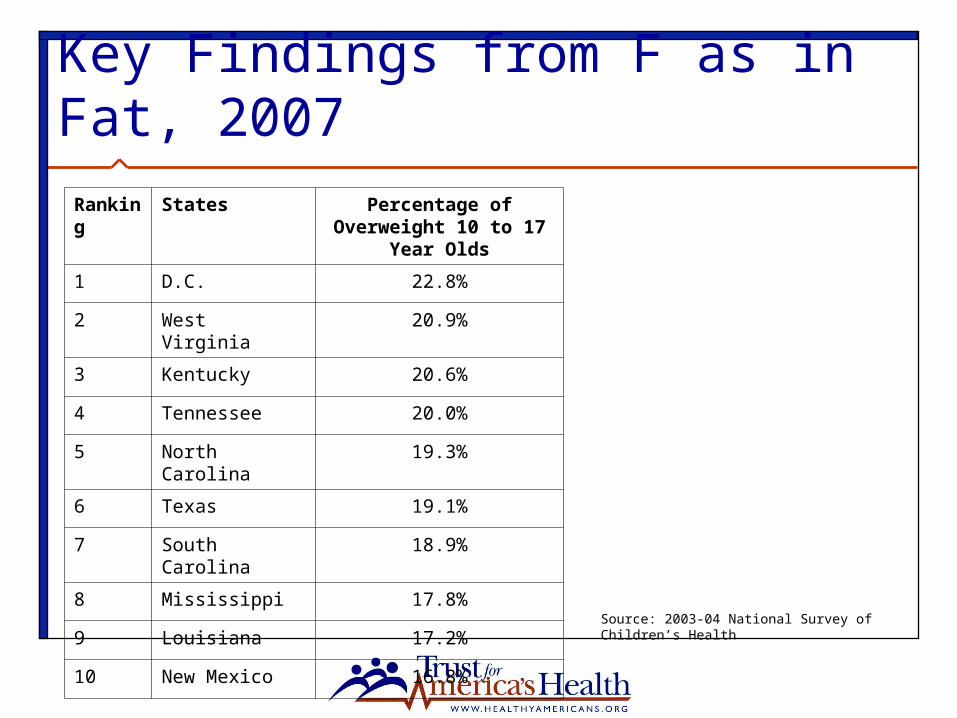
Key Findings from F as in Fat, 2007
Ranking States Percentage of Overweight 10 to 17 Year Olds
1 D.C. 22.8%
2 West Virginia 20.9%
3 Kentucky 20.6%
4 Tennessee 20.0%
5 North Carolina 19.3%
6 Texas 19.1%
7 South Carolina 18.9%
8 Mississippi 17.8%
9 Louisiana 17.2%
10 New Mexico 16.8%Source: 2003-04 National Survey of Children’s Health
Key Findings from F as in Fat, 2007 Only approximately 70 percent of high school
students participated in CDC’s recommended minimum level of activity for youth.
Thirty years ago, two-thirds of American children walked to school each day; today less than one-in-five walk or bike to school.
Only 54 percent of high school students had physical education class at least once a week, and only 33 percent had daily physical education.
Public Opinion Survey on Obesity: Key Findings
More than two-thirds of Americans believe children do not participate in adequate amounts of physical activity during the school day or outside of school
More than 70% of Americans rated proposals to increase physical education in schools as an 8 or higher on a 10 point scale
Recommendations for PE and PA for Children
The CDC: 60 minutes or more of activity per day on five or more days per week (“Healthy Youth! Youth Online: Comprehensive Results)
The National Association for Sports and Physical Education and the American Heart Association: 150 minutes of PE instruction during each school week for elementary school children and 225 minutes per week for middle school students
Physical Education & Physical Activity in Schools
CDC’s School Health and Policies and Programs Study (SHPPS) 2006 is the largest, most comprehensive assessment of school health programs in the U.S.
It was also conducted in 2000 and 1994 and is planned again for 2012.
It assesses school health policies and programs at the state, district, school and classroom levels.
Source: SHPPS 2006 Overview Fact Sheet
SHPPS Key Findings: Physical Education The percentage of districts requiring elementary schools to teach
PE increased from 82.6% in 2000 to 93.3% in 2006. The percentage of states requiring or encouraging districts or
schools to follow standards or guidelines based on the National Standards for Physical Education increased from 59% in 2000 to 76% in 2006.
Only 4% of elementary schools, 8% of middle schools and 2% of high schools provided daily PE or its equivalent for the entire school year for students in all grades.
The total amount of active time in PE courses was 35.6 minutes among all classes/courses.
Overall, 22% of schools did not require students to take any physical education.
Source: SHPPS 2006 Physical Education Fact Sheet
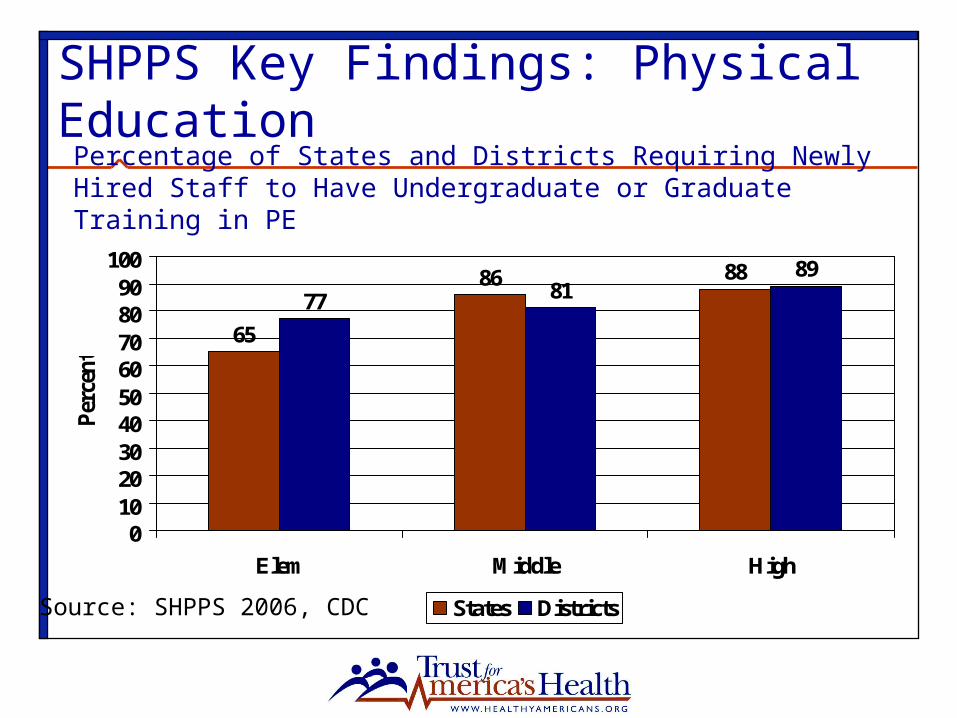
SHPPS Key Findings: Physical Education
65
86 8877 81
89
0102030405060708090
100
Elem Middle High
Per
cent
States Districts
Percentage of States and Districts Requiring Newly Hired Staff to Have Undergraduate or Graduate Training in PE
Source: SHPPS 2006, CDC
SHPPS Key Findings: Physical Activity 67.8% of elementary schools provided daily recess
for students in all grades. 44% of elementary schools, 67% of middle schools
and 22% of high schools offer PA breaks. 44% of all schools supported or promoted walk/bike
to school. 14% of states and 18% of districts adopted a policy
encouraging districts or schools to support or promote walk/bike to school.
Source: SHPPS 2006, CDC
Conclusion Schools are a major venue for changing the
culture of inactivity – and we have data to show that this change can occur.
Physical education and physical activity still far less than recommended levels. “Requirements” often below recommended levels Implementation of requirements limited by costs
and pressures to perform on standardized tests.