Embed Size (px)
Citation preview

archaeologicalscience
RESEARCH DEPARTMENT REPORT SERIES no. 13/2007 ISSN 1749-8775
FISkERTON, LINCOLNSHIREANALySIS OF THE MODERN IRON ANALOguE SAMPLES BuRIED FOR 30 MONTHSARCHAEOLOgICAL CONSERvATION REPORT
vanessa Fell and Jim Williams


Research Department Report Series 13/2007
Fiskerton, Lincoinshire
Analysis of the Modern Iron Analogue Samples Buried for 30 Months
Vanessa Fell and Jim Williams
© English Heritage 2007
ISSN 1749-8775
The Research Department Report Series, incorporates reports from all the specialist teams within the English Heritage Research Department: Archaeological Science; Archaeological Archives; Historic Interiors Research and Conservation; Archaeological Projects; Aerial Survey and Investigation; Archaeological Survey and Investigation; Architectural Investigation; Imaging, Graphics and Survey, and the Survey of London. It replaces the former Centre for Archaeology Reports Series, the Archaeological Investigation Report Series, and the Architectural Investigation Report Series.
Many of these are interim reports which make available the results of specialist investigations in advance of full publication. They are not usually subject to external refereeing, and their conclusions may sometimes have to be modified in the light of information not available at the time of the investigation. Where no final project report is available, readers are advised to consult the author before citing these reports in any publication. Opinions expressed in Research Department reports are those of the author(s) and are not necessarily those of English Heritage.

Research Department Report Series 13/2007
Fiskerton, Lincoinshire
Analysis of the Modern Iron Analogue Samples Buried for 30 Months
Vanessa Fell and Jim Williams
Summary A project was initiated in December 2003 to investigate the deterioration of modern analogue samples buried in the vicinity of the Iron Age causeway at Fiskerton. The final sets of iron coupons were retrieved and analysed after 30 months burial. The results of X-ray diffraction analysis of the corrosion products on those 30 month coupons are reported here. The iron carbonate siderite was the dominant corrosion product at all soil horizons, and iron sulphides occurred in the lower waterlogged anoxic levels. Analysis of the previously recovered coupons and the calculations of the corrosion rates for all the burial periods are reported on elsewhere. Keywords Burial Environments Conservation Modern Iron Author’s Address Vanessa Fell: English Heritage Fort Cumberland, Fort Cumberland Road, Eastney, Portsmouth
P04 9LD. Telephone: 02392 856787. Email:vanessa.feIl
Jim Williams: English Heritage, 44 Derngate, Northampton NN1 1UH. Telephone: 01604 735400. Email: jim.wiIIiams

1
Introduction This study is part of a joint project to assess the deterioration of a range of modern test materials buried in the vicinity of the Iron Age causeway, in particular the effects of the deliberate rewatering of the field in 2004. Modern materials serving as analogues for archaeological finds were buried for specific periods of time, recovered at intervals over several years, and then analysed to determine the extent and nature of deterioration. The materials tested were iron, copper, bone, antler and horn. For the iron samples, the corrosion products were characterised by X-ray diffraction analysis (XRD). Results from the coupons recovered at 6, 12 and 18 months burial durations were reported previously (Fell 2005). This report presents the XRD results for the final group recovered, which have been buried for 30 months (Figure 1). Corrosion rates were calculated through weight loss per unit area, and are reported on elsewhere (Fell 2006).
Figure 1. Inert plastic rods bearing iron coupons as recovered after 30 months burial. The iron coupons or bars of c. 50mm length are tied to the rods between the white spacers and are partly hidden in these images by soil that is in the recesses. Left: Rod 4 of Cluster 1 being pulled from the ground. Centre: upper part of Rod 4 of Cluster 1 (the north delph of the River Witham is visible in the background). Right: Rod 4 of Cluster 2 shown leaning against the fencing surrounding the groundwater monitoring point

2
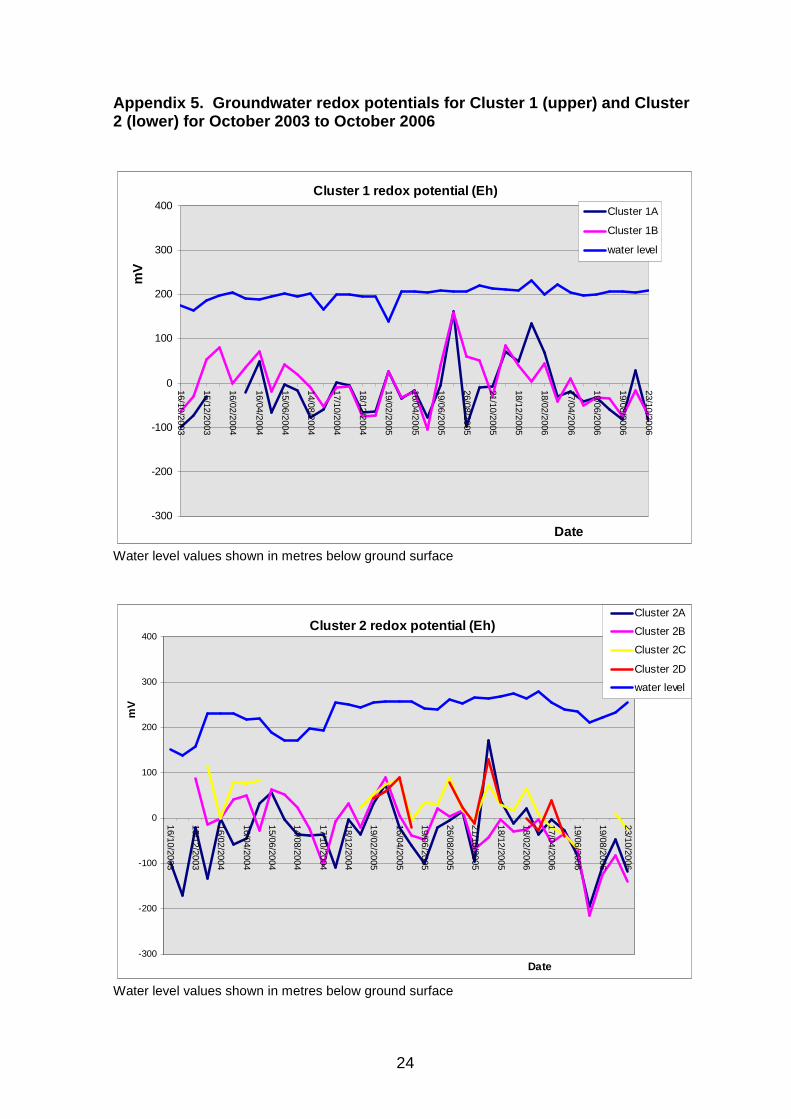
Soil and groundwater conditions Other survey and monitoring projects have progressed at the same time as the burial experiments, including soil characterisation, groundwater monitoring and functional assessment (Last 2005). Of particular relevance to the burial studies is the groundwater monitoring, arranged and curated by JW and described previously (Williams 2005). Although all these data are not yet fully available, relevant summaries are given here (Appendices 2–6), and syntheses for the earlier data are available (Last 2005; Fell and Williams 2004). Fuller results will be published as proceedings of a conference held in Lincoln in June 2006 (Williams in prep) and as proceedings of the international conference ‘Preservation of Archaeological Remains In Situ’ (PARIS3) held in Amsterdam in December 2006 (Williams et al in prep). The principal variables in the soil and groundwater that have been considered in relation to the buried analogues are depths of burial, soil types, seasonal changes, and groundwater levels, pH, redox potential, chemistry and oxygen levels. The analogue samples were placed in the ground at two locations, near the north delph of the River Witham at Cluster 1 monitoring point, and at 25 metres away to the north at Cluster 2 monitoring point. The soil types where analogues are buried are summarised in Figure 2 and Appendix 1, and they vary from degraded peat in the upper horizons to anoxic reedy silts in lower horizons (J Rackham pers comm). At Cluster 1, the upper soil horizons comprise shelly silts and degraded peat, with reedy silts (with clay components) dominating below 1.2 metres. There is a greater depth of peat at Cluster 2, and here the reedy silts start at around 1.5m below ground surface. At Cluster 1, the analogue materials are particularly susceptible to changes in the water levels in the adjacent delph. For example, water levels are sometimes altered by flushing of the dykes, and very occasionally by clearance of the dykes. In October 2004, the water table was deliberately raised by the blocking of the land drainage ditches by the farmer towards the Countryside Stewardship Scheme. By mid-November, the water levels at Cluster 1 had raised slightly, to an average depth of 0.9m from the soil surface compared with previous levels of between 1.0m and 1.5m depth. Through 2006, the water levels remained in the region of 0.7m to 1.0m below ground level (Appendix 2). The groundwater conditions at Cluster 2 could be expected to be less oxic than at Cluster 1, particularly in the lower levels where anoxic conditions should prevail. Through 2005, the water levels were around 0.3m to 0.6m depth from the surface and were more consistent than the previous levels which ranged from 0.7m to 1.6m depth (Appendix 3). During a comparatively dry period in the summer of 2006 however, the levels dropped for several months, to around 0.6m–0.9m. The average pH values were slightly different at the two monitoring points (Table 1 and Appendix 4). At Cluster 1, the average readings were 6.5 – 6.7 before rewatering and 6.7 after rewatering. At Cluster 2, the average readings were 6.3 but the range was greater, particularly when the measurements of the upper

3
Figure 2. Diagram of an installation rod (centre) bearing eight iron coupons showing their sequence, depths and approximate relationships to soil types and peizometers. Note that coupon 1 is lowest in the soil profile.
0.1m 0.2m 0.3m 0.4m 0.5m 0.6m 0.7m 0.8m
1.3m 1.4m 1.5m 1.6m 1.7m 1.8m 1.9m 2.0m
0.9m 1.0m 1.1m 1.2m 1.2
B
A
Plough soil
Shelly silts
Degraded woody peat
Reedy silt
Well preserved peat
B
A
Cluster 1 Cluster 2
Peizometer location
C
C
D

4
peizometers (C and D) are taken into account. The average vertical variation at both clusters is only slight. However, the lowest figures for the upper dipwells are 4.8 and 5.4. Low pH results were recorded on occasions where de-watered soil was wetted again, replicating results that Caple and Dungworth (1998) reported for laboratory re-wetting experiments. After a few months of those levels becoming rewatered, pH measurements were similar to those in the lower peizometers. Table 1. Summary of average pH and Eh values for October 2003 to October 2006 showing values per peizometer before and after rewatering of the field
Peizometer pH Redox potential (Eh)
Before rewatering (October 2003 to September 2004)
Cluster 1 A B B* A+B*
6.5 (6.09 – 6.83) 6.7 (6.05 – 8.61) 6.5 (6.05 – 6.67) 6.5 (6.05 – 6.83)
-39 (-100 – +49) +12 (-63 – +81) +12 (-63 – +81) -13 (-100 – +149)
Cluster 2 A B C D A+B+C+D
6.7 (5.98 – 7.78) 6.3 (5.86 – 6.88) 5.5 (5.28 – 5.72)
–– 6.3 (5.28 – 7.78)
-46 (-170 – +58) +28 (-28 – +87) +87 (+76 – +113) –– +4 (-170 – +113)
After rewatering (October 2004 to October 2006)
Cluster 1 A B A+B
6.7 (6.4 – 7.74) 6.7 (6.33–7.52)
6.7 (6.33 – 7.74)
-7 (-97 – +161) -6 (-105 – +159) -7 (-105 – +161)
Cluster 2 A B C D A+B+C+D
6.5 (6.23 – 6.9) 6.3 (5.86 – 6.97) 6.0 (4.82 – 6.64) 6.4 (5.24 – 6.81) 6.3 (4.82 – 6.97)
-30 (-195 – +170) -36 (-218 – +89) +19 (-66 – +90) +33 (-40 – +129) -12 (-218 – +170)
Bracketed figures show the range. * Ignoring an anomaly in May 2004
Values for redox potential at Cluster 2 were more reducing with depth whereas readings for the two peizometers placed at Cluster 1 were close together, whilst a third installed higher up the sequence never received water and therefore no readings were taken (Table 1 and Appendix 5). Initially, redox measurements were collected using a probe, inserted into water, recovered using a hand bailer from the proximal boreholes located to the east (see Williams 2005, fig 2.1). This system provides good trend data, comparing at a gross scale the difference between the lower and upper levels on site, and this can be seen in the slight

5
difference in the average values between Cluster 2 A/B and C/D. The results would be more striking if the somewhat anomalous results were removed (such as 170mV in Cluster 2A). More recently, in situ redox probes have been installed, and initial results support the general indications that the deposits are more reducing with depth (Figure 3). In this case, the data from the in situ probes are more reducing than the water based system, and the results less variable.
Fiskerton Redox data for cluster 2 hogan probes
-1000
-500
0
500
1000
1500
3 4 5 6 7 8 9
pH
mV
up_h2o
low _h2o
iron
sulph2
cluster 2 upper Hogan
cluster 2 middle Hogan
cluster 2 low er Hogan
Figure 3. Measurements for the in situ redox probes at Cluster 2 during 2006, showing clear separation between the lower silts (dark green), the peat above (light green) and the degraded woody peat (red) Chemical measurements for the period March 2004 to December 2006 show notably high sulphate and high calcium (Appendix 6). During this period, the sulphate concentration averaged 1023mg/l (range 656 – 1520 mg/l), which may be important for microbial activity. Its origin may be from prior saline conditions when the Witham was partially tidal during periods of its history (Field and Parker-Pearson 2003, 1), or the sulphate may have arisen through the use of soil fertilisers. Calcium, averaging 497mg/l (range 425 – 571mg/l), is also high, as expected in near-neutral soils (cf Bohn et al 2001, 37). Its presence may in part be due to limestone in the local geology and within the Iron Age causeway, as well as the shelly deposits in upper soil horizons (Field and Parker-Pearson 2003, 12). Other elements that are relatively high in concentration are iron and manganese; in low oxygenated soils, sulphate, iron and manganese are able to act as electron acceptors and may therefore be important for microbial activity (cf Bohn et al 2001).
6
Methodology Recovery and preparation of the iron coupons The methods employed to prepare and install the analogue materials are described in Fell et al (2005). The iron samples are small bars c. 50mm in length that are also referred to in this text as bars or coupons. These were mounted separately on a series of inert plastic installation rods designed to be inserted in the ground with the aid of an auger to minimise soil disturbance. In December 2003, the rods were inserted in the ground to depths up to 1.7 metres, correlating with known soil conditions. Figure 2 shows an installation rod bearing eight coupons of iron, and the approximate depth at which they were buried. Twelve rods of analogue iron samples were prepared, each rod bearing eight iron coupons. Six rods were installed in the ground at the two monitoring points Cluster 1 and Cluster 2. One rod was recovered from both locations at 6 months (22 June 2004), 12 months (8 December 2004), 18 months (22 June 2005), and the final collection was at 30 months (25 June 2006). In June 2006, it was decided to collect all the remaining six installation rods together, in part because the corrosion was unexpectedly rapid. These would be stored in various ways and some analysed later as part of a different experiment to test the effects of short-term storage conditions. One rod from each cluster was analysed immediately by XRD to determine the corrosion products; these are the rods termed ‘Cluster 1 Rod 4’ and ‘Cluster 2 Rod 4’ in the original methodology statement, where dimensions and weight are given (Fell et al 2005, 13–21, table 4.1). Storage of the bars The rods were recovered from the ground on 25 June 2005 and wrapped in plasticized foil to attempt to maintain relatively cool conditions. They were transported to the laboratory in Portsmouth where they were refrigerated immediately at 4°C, less than 12 hours after recove ry. On the following day, the individual bars were detached from the rods, loose soil was removed, and their condition described (Appendix 1). The bars were then photographed in sets (eg Figs 4 and 7), allowed to dry out (Cluster 1 bars) or dried out with industrial methylated sprits spray (Cluster 2 bars), rephotographed, and sampled for XRD analysis. The latter samples were dry stored with desiccant until they could be analysed in the subsequent few days. To enable corrosion rate calculations, the bars themselves were chemically stripped and weighed (Fell 2006). The remaining four installations rods of bars were stored at 4°C within the original plasticized foil, as recovered from site. These will be analysed in various ways at a later date.

7
X-ray diffraction analysis X-ray diffraction analysis will detect only crystalline phases and therefore amorphous components will not be determined. Nevertheless, it is a standard analytical method for determining minerals and corrosion products on archaeological artefacts, as well as numerous other applications. Samples in the order of 1mg were ground in an agate mortar prior to analysis. X-ray diffraction data were collected on a Philips PW 1840 powder diffractometer using cobalt Kα radiation (wavelength Kα1 = 0.178896nm, Kα2 = 0.179285nm) incorporating a solid-state silicon detector. The running parameters were normally 40kV 40mA for X-ray generation. Data collection was between the angles 7 and 100° 2 θ, at step size 0.10° per step, time per step 5s, wi th a receiving slit width of 0.3mm. A search-match computer programme was used to identify unknown components in the diffraction patterns by comparison with standards in the powder diffraction file (International Centre for Diffraction Data, ICDD). Initially powder diffraction files database version PDF-1 was employed; later, in 2006, version PDF-2 was used. Minerals named in this report, their formulae and their PDFs are shown in Table 2. Table 2. Corrosion products and other minerals detected by XRD
Mineral name Formula Common name PDF-1 no.
Goethite α-FeOOH Iron oxyhydroxide 29-0713
Magnetite Fe3O4 Iron oxide 19-0629
Maghemite γ-Fe2O3 Iron oxide 39-1346
Siderite FeCO3 Iron carbonate 29-0696
Lepidocrocite γ-FeOOH Iron oxyhydroxide 44-1415
Akaganéite β-FeOOH Iron oxyhydroxide 34-1266
Greigite Fe3S4 Iron sulphide 16-0713
Mackinawite Fe1+xS Iron sulphide 24-0073, 15-0037
Pyrite FeS2 Iron sulphide 42-1340
Vivianite Fe3(PO4)2.8H2O Iron phosphate 30-0662
Iron sulphide FeS Iron sulphide 23-1120
Calcite CaCO3 Calcium carbonate 05-0586
Quartz SiO2 Silicon dioxide 31-1233, 33-1161

8
Results Cluster 1 The corroded coupons, as recovered and removed from their installation rod, are shown in Figure 4.
Figure 4. Cluster 1 coupons as recovered showing the variability in condition and colour. The top two rows show the two sides of the same eight bars, in sequence with coupons 1 at the left, coupon 8 at the right. The coupons have been removed from the installation rod and loose soil has been detached, but they have not yet dried out. The lowest row shows one side of the coupons after drying out (for comparison of colours only). Lengths of original coupons c. 50mm.

9
The XRD results for the coupons from Cluster 1 are summarised in Table 3 and Figures 5 and 6. Coupons 1 to 5, buried deeper than 1.2 metres, yielded principally siderite, with small amounts of iron sulphides and iron oxides. The upper three coupons, Coupons 6 to 8, yielded mainly goethite and calcite. Table 3. Cluster 1: summary of XRD results for coupons buried for 30 months Bar Depth mm XRD no Major Minor Trace 8 565 5411 Calcite
Goethite Quartz
7 775 5410 Calcite Quartz
Goethite
6 985 5413 Goethite Calcite
Siderite Quartz Maghemite*
5 1195 5408 Siderite - 4 1325 5407 Siderite Maghemite* Quartz 3 1455 5406 Siderite - Quartz
Maghemite* 2 1585 5405 Siderite - Quartz,
Maghemite* 1 1615 5404 Siderite - Mackinawite
Quartz * Magnetite or maghemite (cannot be distinguished by XRD)
Figure 5. Selected XRD spectra for coupons 1, 5 and 8 buried at Cluster 1

10
F
igure 6. XR
D spectra for the eight coupons buried for 30 m
onths at Cluster 1
5411 = bar 8 (uppermost in soil profile); 5410 = bar 7; 5413 = bar 6; 5408 = bar 5;
5407 = bar 4; 5406 = bar 3; 5405 = bar 2; 5404 =
bar 1 (lowest in soil profile)

11
Cluster 2 The corroded bars, as recovered and removed from their installation rod, are shown in Figure 7.
Figure 7. Cluster 2 coupons as recovered showing the variability in condition and colour. The top two rows show the two sides of the same eight bars, in sequence with coupons 1 at the left, coupon 8 at the right. The coupons have been removed from the installation rod and loose soil has been detached, but they have not yet dried out. The lowest row shows one side of the coupons after being dried out (the sequence across the page is the same as in the upper two rows but their orientations are not necessarily the same). Lengths of original coupons c. 50mm.

12
Results from coupons at Cluster 2 are summarised in Table 4 and Figures 8 and 9. All of these coupons yielded primarily siderite, with some mackinawite also in the lower five coupons, and a variety of other minor phases on the upper three coupons. Table 4. Cluster 2: summary of XRD results for coupons buried for 30 months
S Depth mm XRD no Major Minor Trace
8 565 5403 Siderite
Calcite Quartz
7 775 5401
Siderite
Calcite Quartz Lepidocrocite
6 985 5400 Siderite Greigite Quartz 5 1195 5399 Siderite Mackinawite
Calcite Clay constituents
4 1325 5398 Siderite Mackinawite - 3 1455 5397 Siderite - - 2 1585 5396 Siderite Mackinawite - 1 1615 5395 Siderite Mackinawite Quartz
Figure 8. Selected XRD spectra for coupons 1, 5 and 8 buried at Cluster 2

13
F
igure 9. XR
D spectra for the eight coupons buried for 30 m
onths at Cluster 2
5403 = bar 8 (upperm
ost in soil profile); 5401 = bar 7; 5400 = bar 6; 5399 =
bar 5;
5398 = bar 4; 5397 = bar 3; 5396 =
bar 2; 5395 = bar 1 (lowest in soil profile)

14
Discussion Corrosion products From previous analyses (Fell 2005), corrosion products determined on the coupons buried for six months were principally iron oxyhydroxides and oxides – goethite, magnetite and maghemite (Table 5). The presence of these oxidised species may in part be related to the presence of oxygen surrounding the coupons at the time of burial, as well as a lower water table prior to the rewatering of the field. However, analyses of the subsequent coupons, recovered at 12, 18 and now 30 months, showed that the commonest corrosion products found on those from the lower waterlogged and partly waterlogged levels were siderite, and iron sulphides such as mackinawite, greigite and pyrite. Iron sulphides and siderite were also found on the archaeological iron artefacts recovered during excavations in 1981 and 2001 (Fell and Ward 1998; Fell and Williams 2004). Together, these results suggest that the lower coupons are largely in anoxic conditions, which is supported by the measurements of the groundwater levels and redox potentials. Usually associated with anoxic microbial reactions is the presence of hydrogen sulphide, which was very obviously present at the time that the analogues were extracted from the ground. Table 5. Summary of the main corrosion products identified at 6, 12, 18 and 30 months S Depth Corrosion products and water levels (m) 6 months 12 months 18 months 30 months Cluster 1 8 0.56 ● ● ● ● 7 0.77 ● ● ● ● ▒ 6 0.98 ● � ▒ ● � ▒ ● � ▒ ● � ▒ 5 1.19 ● ▒ ● ▒ ● ■ ▲ ▒ ■ ▒ 4 1.32 ● ● ■ ▲ ■ 3 1.45 ■ ▲ ■ 2 1.58 ▲ ■ ▲ ■ 1 1.61 ▲ ● ■ ▲ ■ Cluster 2 8 0.56 ● ● � ▒ ● ■ � ▒ ■ ▲ � ▒ 7 0.77 ● ▒ ● ■ ▒ ● ■ ▒ ■ ▲ ▒ 6 0.98 ● ▒ ● ■ ▒ ● ■ ▲ ▒ ■ ▒ 5 1.19 ● � ▒ ● ■ ▒ ■ ▒ ■ ▲ ▒ 4 1.32 ● ▲ ■ ■ ■ ▲ 3 1.45 ● ▲ ■ ▲ ■ ■ 2 1.58 ● ▲ ■ ▲ ■ ▲ ■ 1 1.61 ● ■ ■ ▲ ■ ▲
● iron oxides; ■ iron carbonate; ▲ iron sulphides; � water level at recovery
▒ range of water levels since burial

15
The apparent dominance of siderite may conceal the true range of corrosion products. The analytical technique employed, XRD, does not have 100 per cent sensitivity and so minor phases are sometimes not detected. Furthermore, XRD only detects crystalline phases whereas some iron sulphides are known to be amorphous (cf Vaughan and Lennie 1991). The black appearance of many of the corroded coupons upon recovery (see Figs 4 and 7) certainly suggested that sulphides were present, and yet these were not always detected, perhaps because they were not crystalline. Corrosion mechanisms The presence of the individual corrosion products, principally iron oxides, iron sulphides and iron carbonate, can be explained by several corrosion mechanisms. The commonest corrosion products from the oxidation of iron in aerobic environments are the oxides goethite and magnetite (Cornell and Schwertmann 2003). In anaerobic conditions, however, iron sulphides will form instead, as a consequence of bacterial activity whereby sulphate-reducing bacteria produce hydrogen sulphide from groundwater sulphate. At the same time, fermentative processes can reduce available organic matter in the soil to provide energy, and the by-products can include bicarbonate and carbonate. If free Fe2+ ions are available, and the local pH and other conditions are suitable, iron carbonate may precipitate. Siderite and the iron sulphide mackinawite are the primary products of anaerobic microbial corrosion (Tiller 1982, 139). Calcium carbonate is commonly formed during biogenic degradation of organic matter, and thus is often associated with sulphide production, although its origin may of course be geological. At Fiskerton, the groundwater monitoring data suggests that there are a number of parameters that might have affected the corrosion processes. Principally, these are the high levels of sulphate and calcium, the slightly acidic pH and the slightly reducing redox potential. Furthermore, the lowest coupons were placed in reedy silts with clay components that are conducive to anoxic conditions. From the above pathways it seems likely that both the calcite and siderite found on the archaeological artefacts and on the modern iron at Fiskerton are most probably the by-products of the microbial metabolic pathway in which Fe2+ is continually precipitated as iron sulphide via sulphide production by sulphate-reducing bacteria. Stability of siderite The presence of siderite on the iron artefacts and on the analogues at Fiskerton is particularly interesting because it also occurs as a major corrosion product on archaeological ironwork at Nydam Mose in Denmark (Matthiesen et al 2003; Matthiesen et al 2004), as well as on archaeological artefacts in more oxygenated situations (Neff et al 2005) and in wet calcareous soils in laboratory tests (Angelini et al 1998). It has also been reported in mires, marine and in other locations where it forms through the biological reduction of available iron oxides (eg Pye et al 1990), although it can form as scales in other non-biological ways (Sontheimer et al 1981). At Fiskerton, its formation need not necessarily be through the same pathway as at Nydam Mose (where iron sulphides are absent) because the ground

16
water and soil conditions are different, although both sites have groundwater in the near neutral pH range. Siderite is known to confer stability to iron through its passivating properties (Sontheimer et al 1981; Tiller 1982; Matthiesen et al 2003). Its presence may therefore be beneficial to the ironwork at Fiskerton, as has been suggested for artefacts and analogues at other archaeological sites (Matthiesen et al 2004). Although the pH values recorded at Fiskerton were on average very slightly acidic, siderite would still be able to exist if all other conditions are favourable. The critical pH limit for the dissolution of siderite has been calculated to be 6.2 (Matthiesen et al 2003, 189), which is slightly lower than the pH values determined at Fiskerton. Furthermore, within an active population of bacteria, the local pH and other conditions can be rather different from the bulk groundwater. Corrosion rates The corrosion rates of the analogue iron samples increased dramatically over the 30 month period of the study except for those that were in drained, partly or fully oxygenated peat (Fell 2006). Characterisation of the corrosion products suggest that anaerobic microbial activity was dominant near to and below the water table, producing iron sulphides and carbonate. Although these products can be protective under certain conditions, if the protective corrosion film is broken, microbial corrosion can be very rapid. The severe corrosion rates demonstrated on the experimental coupons at both Cluster 1 and Cluster 2 locations are unexpected and difficult to explain given that the principal corrosion product identified is the non-aggressive siderite. The severest and most erratic corrosion occurred on the coupons that were close to or below the water table levels. Presumably, therefore, the sulphide layers that were formed were not protective, or had been disrupted and were then no longer protective. On balance, the absence of protective films on the coupons, for whatever reason, seems the most plausible explanation for the aggressive corrosion. During study of the archaeological artefacts from the 1981 excavation, it was clear that the better preserved artefacts were those that were buried in the lowest levels of the site, well below the variations in water table. However, of course, we do not know how many artefacts from any of the archaeological levels have totally corroded away. Conceivably the present water levels are insufficient to protect the clean surfaces of the modern experimental iron that has not had chance to develop well-formed corrosion layers. However, this need not necessarily be a concern for any archaeological iron artefacts that still survive in the ground, providing they have intact and protective corrosion layers. The impact of rewatering The parameters that seem to have most altered since the rewatering of the field are the raising of the water table and the associated changes in the oxygen levels within the soil profile. During the period monitored, the pH and redox potentials have not altered significantly, but sulphate levels have almost halved. These

17
factors do not explain the rapid corrosion rates on the analogue iron near the water table and add nothing further to the possible causes discussed earlier. Conclusions The corrosion products determined on both the archaeological iron and the analogues suggest that the re-watering of the site may be beneficial to the archaeological iron due to the presence of siderite and the continuation or re-introduction of anoxic waterlogged conditions. The predominance of siderite is significant because it is considered to confer stability to artefacts through its passivating properties. However, measurements of corrosion rates showed that (clean) modern analogue iron placed within the zones of fluctuating water tables had corroded rapidly despite forming potentially stable corrosion products. This may be because non-protective corrosion films had formed upon the recently buried modern iron, whereas the surviving archaeological iron was deposited in the Iron Age in more benign circumstances. Acknowledgements Access to the field was by kind permission of the tenant farmer Phil Good. The water monitoring program was funded by English Heritage and Lincolnshire County Council, and the chemical analysis of water samples by the Environment Agency. Information on soil types was supplied by James Rackham on the basis of the augering of the holes at the time of installation of the analogue materials. Roger Wilkes patiently nudged the XRD analyser into action on numerous occasions over the last three years and without which the analyses could not have been completed. Karla Graham, Paul Simpson, Matthew Collins and Hannah Koon are co-workers on the overall project who are studying other (non-ferrous) materials, but who have also assisted in various ways towards the iron study. References Angelini, E, Barberis, E, Bianco, P, Rosalbino, F and Ruatta, L 1998 ‘Effect of burial in different soils on the decay of iron artifacts: Laboratory investigation’, in Mourey, W and Robbiola, L (eds) Metal 98, Proc ICOM Metals Conservation Group Conference, 27–29 May 1998, Draguignan, France. London: James and James, 106–110 Bohn, H L, McNeal, B L and O’Connor, G A 2001 Soil Chemistry, 3 edn. John Wiley and Sons Caple, C and Dungworth, D 1998 ‘Waterlogged Anoxic Archaeological Burial Environments’. Ancient Monuments Laboratory Report 22/98. London: HBMC Cornell, R M, and Schwertmann, U 2003 The Iron Oxides: Structure, Properties, Reactions, Occurrences and Uses. Weinheim, Germany: Wiley-VCH

18
Fell, V 2005 ‘Fiskerton: Scientific analysis of corrosion layers on archaeological iron artefacts and from experimental iron samples buried for up to 18 months’. Centre for Archaeology Report 65/2005. Portsmouth: English Heritage Fell, V 2006 ‘Corrosion rates for modern experimental iron samples buried at Fiskerton, Lincolnshire’. Research Department Report 61/2006. Portsmouth: English Heritage Fell, V, Graham, K, Simpson, P, Wilkes, R, Williams, J and Wimbleton, P 2005 ‘Equipment for the Installation of Experimental Materials at Fiskerton, Lincolnshire’. Centre for Archaeology Report 32/2005. Portsmouth: English Heritage Fell, V and Ward, M 1998. 'Iron sulphides: corrosion products on artifacts from waterlogged deposits', in W Mourey and L Robbiola (eds) Metal 98, Proc ICOM Metals Conservation Group Conference, 27–29 May 1998, Draguignan, France. London: James and James, 111–115 Fell, V and Williams, J, 2004 ‘Monitoring of archaeological and experimental iron at Fiskerton, England’, in J Ashton and D Hallam (eds) Metal 04. Proceedings of the International Conference on Metals Conservation, Canberra, 4–8 October 2004. Canberra: National Museum of Australia, 17–27 Field, N and Parker Pearson, M 2003 Fiskerton. An Iron Age Timber Causeway with Iron Age and Roman Votive Offerings: the 1981 Excavations. Oxford: Oxbow Last, J 2005 ‘Archaeological prospection and monitoring at Fiskerton, Lincolnshire: a multi-stranded survey project’. Unpublished summary report compiled for English Heritage Matthiesen, H, Hilbert, L R and Gregory, D J 2003 ‘Siderite as a Corrosion Product on Archaeological Iron from a Waterlogged Environment’, Studies in Conservation, 48 (3), 183–194 Matthiesen, H, Hilbert, L R, Gregory, D and Sørensen, B 2004 ‘Long term corrosion of iron at the waterlogged site Nydam in Denmark: studies of environment, archaeological artefacts, and modern analogues’, in Andra (ed) Prediction of Long Term Corrosion Behaviour in Nuclear Waste Systems, Eurocorr 2004, Proc 2nd International Workshop, Nice, September 2004. Andra: France, 114–127 Neff, D, Dillmann, P, Bellot-Gurlet, L and Beranger, G 2005 ‘Corrosion of iron archaeological artefacts in soil: characterisation of the corrosion system’ Corrosion Science 47, 515–535 Pye, K, Dickson, J A D, Schiavon, N, Coleman, M L and Cox, M 1990 ‘Formation of siderite–Mg-calcite–iron sulphide concretions in intertidal marsh and sandflat sediments, north Norfolk, England’, Sedimentology 37, 325–343

19
Sontheimer, H, Kölle, W, and Snoeyink, V L 1981 ‘The siderite model of the formation of corrosion-resistant scales’, Journal American Water Works Association 73 (11) 572–579 Tiller, A K , 1982 ‘Aspects of Microbial Corrosion’, in Parkins, R N (ed) Corrosion Processes. London: Applied science Publishers, 115–159 Vaughan, D J and Lennie, A R 1991 ‘The iron sulphide minerals: their chemistry and role in nature’, Science Progress 75, 371–388
Williams, J 2005 ‘Groundwater monitoring’, in Fell et al 2005, 6–10

20
Appendix 1. Condition of the iron bars as recovered, showing also burial depths and soil types
Bar Depth
mm Buried in soil type*
Condition of the bars #
Cluster 1 8 565 Oxidised. Orange deposits 7 775
Shelly silts Oxidised. Orange deposits
6 985 Oxidised. Orange deposits 5 1195
Degraded peat Most has corroded away. Black. Some orange staining on the plastic rod
4 1325 As bar 5 3 1455 Not quite as corroded as Bars 4 & 5 2 1585 All black. Less corroded than those above 1 1615
Reedy silts
Black. Corroded away on the upper tie. Cluster 2 Generally these are less orange than those at Cluster 2 8 565 Little or no orange deposits 7 775
Degraded woody peat with wood Little or no orange deposits (as Bar 8)
6 985 Little or no orange deposits (as Bar 8) 5 1195 Black 4 1325 Black. Now very short, ?corroded away 3 1455
Reasonably well preserved peat
Black and robust 2 1585 Black and robust (as Bar 3) 1 1615
Reedy silts Black and robust (as Bar 3)
* Information from James Rackham # Condition of the bars as removed from the installation rods in the laboratory on 26.6.2006, one day after recovery

21
Ap
pen
dix 2. W
ater levels at Clu
ster 1 for A
ug
ust 2003 to
No
vemb
er 2006 (m
easured as depths below ground surface)
Cluster 1 water levels
-2.00
-1.80
-1.60
-1.40
-1.20
-1.00
-0.80
-0.60
-0.40
-0.20
0.00 15/08/03
15/09/2003
13/11/2003
15/01/2004
16/03/2004
15/05/2004
16/07/2004
18/09/2004
17/11/2004
15/01/2005
18/03/2005
15/05/2005
20/07/2005
19/09/2005
20/11/2005
21/01/2006
22/03/2006
20/05/2006
30/07/2006
17/09/2006
18/11/2006
D a t e
Wat
er le
vel,
bel
ow
gro
un
d /
m
1a w ater levels
1b w ater levels
1c w ater levels
river level

22
Ap
pen
dix 3. W
ater levels at Clu
ster 2 for A
ug
ust 2003 to
No
vemb
er 2006 (m
easured as depths below ground surface
Cluster 2 water levels
-1.80
-1.60
-1.40
-1.20
-1.00
-0.80
-0.60
-0.40
-0.20
0.00 15/08/2003
15/09/2003
13/11/2003
15/01/2004
16/03/2004
15/05/2004
16/07/2004
18/09/2004
17/11/2004
15/01/2005
18/03/2005
15/05/2005
20/07/2005
19/09/2005
20/11/2005
21/01/2006
22/03/2006
20/05/2006
30/07/2006
17/09/2006
18/11/2006
Date
Wat
er le
vel,
bel
ow
gro
un
d /
m
2a water levels
2b water levels
2c water levels
2d water levels

23
Appendix 4. Groundwater pH values for Cluster 1 (upper) and Cluster 2 (lower) for October 2003 to October 2006
Cluster 1 pH values
0
1
2
3
4
5
6
7
8
9
10
16/10/2003
15/12/2003
16/02/2004
16/04/2004
15/06/2004
14/08/2004
17/10/2004
18/12/2004
19/02/2005
16/04/2005
19/06/2005
26/08/2005
21/10/2005
18/12/2005
18/02/2006
17/04/2006
19/06/2006
19/08/2006
23/10/2006
pH
Cluster 1A
Cluster 1B
water level
Water level values shown in metres below ground surface
Cluster 2 pH values
0
1
2
3
4
5
6
7
8
9
10
16/10/2003
15/12/2003
16/02/2004
16/04/2004
15/06/2004
14/08/2004
17/10/2004
18/12/2004
19/02/2005
16/04/2005
19/06/2005
26/08/2005
21/10/2005
18/12/2005
18/02/2006
17/04/2006
19/06/2006
19/08/2006
23/10/2006
pH
Cluster 2ACluster 2BCluster 2CCluster 2Dwater level
Water level values shown in metres below ground surface
24
Appendix 5. Groundwater redox potentials for Cluster 1 (upper) and Cluster 2 (lower) for October 2003 to October 2006
Cluster 1 redox potential (Eh)
-300
-200
-100
0
100
200
300
400
16/10/2003
15/12/2003
16/02/2004
16/04/2004
15/06/2004
14/08/2004
17/10/2004
18/12/2004
19/02/2005
16/04/2005
19/06/2005
26/08/2005
21/10/2005
18/12/2005
18/02/2006
17/04/2006
19/06/2006
19/08/2006
23/10/2006
Date
mV
Cluster 1A
Cluster 1B
water level
Water level values shown in metres below ground surface
Cluster 2 redox potential (Eh)
-300
-200
-100
0
100
200
300
400
16/10/2003
15/12/2003
16/02/2004
16/04/2004
15/06/2004
14/08/2004
17/10/2004
18/12/2004
19/02/2005
16/04/2005
19/06/2005
26/08/2005
21/10/2005
18/12/2005
18/02/2006
17/04/2006
19/06/2006
19/08/2006
23/10/2006
Date
mV
Cluster 2A
Cluster 2B
Cluster 2C
Cluster 2D
water level
Water level values shown in metres below ground surface

25
Appendix 6. Selected groundwater data for Cluster 2 peizometer B for March 2004 to December 2006 ∆
Min Max Average
pH* 5.8 7.0 6.3
Redox potential* -215 +89 -19
Temperature (°C)* 5.2 20.7 12.0
Conductivity (mS/cm)* 1.78 2.66 2.34
Sulphate (SO4 mg/l) 656 1520 1023
Calcium (Ca mg/l) 425 571 497
Chloride (Cl mg/l) 34 75 57
ortho-Phosphate (as P mg/l) <0.02 1.9 0.14
Sulphide (S mg/l) <0.01 1.8 0.2
Silicate (SiO2 mg/l) 17.7 33.9 28
Iron (Fe mg/l) 9.4 44 22
Manganese (Mn mg/l) 2.8 4.5 3.4
Copper (Cu mg/l) 0.008 0.04 0.02
Nitrite (as N mg/l) 0.004 0.3 0.05
Nitrogen, total (as N mg/l) 8.1 27.5 13.2
∆ Excluding anomalous chemical data for Jan 2005 * Data to November 2006
Selected groundwater ion concentrations for March 2004 to December 2006
0
200
400
600
800
1000
1200
1400
1600
Mar
-04
May
-04
Jul-0
4
Sep
-04
Nov
-04
Jan-
05
Mar
-05
May
-05
Jul-0
5
Sep
-05
Nov
-05
Jan-
06
Mar
-06
May
-06
Jul-0
6
Sep
-06
Nov
-06
Date
mg/
litre
ClSO4CaMnFeLinear (SO4)

ENGLISH HERITAGE RESEARCH DEPARTMENT
English Heritage undertakes and commissions research into the historic environment, and the issues that affect its condition and survival, in order to provide the understanding necessary for informed policy and decision making, for sustainable management, and to promote the widest access, appreciation and enjoyment of our heritage.
The Research Department provides English Heritage with this capacity in the fields of buildings history, archaeology, and landscape history. It brings together seven teams with complementary investigative and analytical skills to provide integrated research expertise across the range of the historic environment. These are:
* Aerial Survey and Investigation * Archaeological Projects (excavation) * Archaeological Science * Archaeological Survey and Investigation (landscape analysis) * Architectural Investigation * Imaging, Graphics and Survey (including measured and metric survey, and photography) * Survey of London
The Research Department undertakes a wide range of investigative and analytical projects, and provides quality assurance and management support for externally-commissioned research. We aim for innovative work of the highest quality which will set agendas and standards for the historic environment sector. In support of this, and to build capacity and promote best practice in the sector, we also publish guidance and provide advice and training. We support outreach and education activities and build these in to our projects and programmes wherever possible.
We make the results of our work available through the Research Department Report Series, and through journal publications and monographs. Our publication Research News, which appears three times a year, aims to keep our partners within and outside English Heritage up-to-date with our projects and activities. A full list of Research Department Reports, with abstracts and information on how to obtain copies, may be found on www.english-heritage.org.uk/researchreports
For further information visit www.english-heritage.org.uk