Embed Size (px)
Citation preview

1
Fisk University
2012-2013 FACT BOOK
Office of Institutional Assessment and Research

2
The 2012-2013 Fisk University Fact Book is designed to present and provide basic descriptive
and statistical information about Fisk University collectively and the institutional divisions and
majors individually. The tables in this document illustrate commonly requested data about Fisk
University. The title for each table describes the data shown in the table. Most tables consist of
counts and percentages as well as grand totals. Questions regarding the data, requests for original
reports and/or requests for more detailed data or data analysis may be addressed to the Office of
Institutional Assessment and Research.
3
Table of Contents
Page
Fact Book Description 2
Table of Contents 3-4
University Overview
Brief History of Fisk University and Prominent Alumni 5
Major Historical Events 6-8
Presidents of Fisk University 9
Mission Statement, Vision, Tagline and Core Values 10
Accreditations and Memberships 11
Board of Trustees 12
Admission Information
Fall Applicants by State 13
Fall Admitted Students by State 14
First-Time Enrolled Undergraduate Students by State 15
Application and Admission Data concerning First-time Freshman 16
New First-time Freshman High School Rank 16
New First-Time Freshman Average High School GPA 16
New First-Time Freshman SAT and ACT Averages 17
Financial Aid Information
Financial Aid Amounts by Category 17
Financial Aid data for First-Time, Full-time Freshman 18
Enrollment Information
Fall Headcount and FTE data 19
Annual Unduplicated Enrollment 19
Fall Enrollment by Gender 20
Fall Enrolment by Ethnicity 20-21
Fall Enrollment by Classification 21
Fall Enrollment by Classification: Graduate Students and Undergraduate Students 22
Fall Enrollment By State of Residence 23
International Student Enrollment 24
Enrollment By Major 25
Academic Performance
Average Semester GPA by Classification 26
Average Overall GPA by Major 27
Retention and Graduation Information
4
First-Time, First-Year Retention Rates 28
Six Year Graduation Rates 29
Degrees Conferred By Major and Division 30
Percentage of Degrees Conferred By Major and Division 31
Faculty Information
Faculty by Full-time/Part-time Status 32
Percentage of Faculty by Full-time/Part-time Status 32
Faculty by Tenure Status 33
Percentage of Faculty by Tenure Status 33
Revenue and Expenditures
Statement of Revenue and Expenses 34
Institutional Advancement
Gifts Summary/Alumni of Record 35
5
History
Founded in 1866, Fisk University is coeducational, private, and one of America’s premier
Historically Black Universities. The first Black college to be granted a chapter of Phi Beta Kappa
Honor Society, Fisk serves a diverse student body with students from 40 states and 6 foreign
countries. There are residence halls for men and women. The focal point of the 40-acre campus
and architectural symbol of the university is Jubilee Hall, the first permanent building for the
education of Blacks in the South, named for the internationally renowned Fisk Jubilee Singers,
who continue their tradition of singing and sharing classic Negro spirituals along with other
genres of music from African, Brazil, African American and other diverse cultures.
From its earliest days, Fisk faculty and alumni have been among America’s intellectual leaders
providing leadership in several fields including medicine, science, art, humanities, religion,
literature, sociology and philosophy. A few examples of the many prominent Fisk alumni
include:
Ruth E. Anderson, Esq., senior counsel Nissan North America, Inc.
Dr. Johnetta B. Cole, director of the Smithsonian’s National Museum of African Art/
former President of Bennett and Spelman Colleges
Milele Coggs, Esq., Alderwoman Milwaukee, WI Sixth District
The Honorable Paulette J. Delk, Judge U. S. Bankruptcy Court, TN Western District
Rel Dowdell, filmmaker
Dr. W. E. B. Du Bois, the first black Ph.D. from Harvard, great social critic and
cofounder of the NAACP
Dr. John Hope Franklin, historian/scholar
Alonzo L. Fulgham, founder and principal of TJM International Consultants, LLC
Nikki Giovanni, poet/writer;
John F. Harris, Esq., assistant general counsel Ford Motor Company
Mandisa Hundley, recording artist/ ‘American Idol’ finalist
Judith Jamison, artistic director of the Alvin Ailey Dance Company
Dr. Carol R. Johnson, superintendent Boston public schools
The Honorable Hazel R. O’Leary, Esq., Fisk’s 14th President and former U.S. Secretary
of Energy
Dr. David L. Lewis, professor/two-time Pulitzer Prize winning author
John Lewis, U.S. Representative (GA)/civil rights movement leader
Margo M. McKay, Esq., U.S. Department of Agriculture Assistant Secretary for Civil
Rights
Dr. Alton B. Pollard, III, Dean of the Howard University School of Divinity
Dr. Charlene D. Portee, President American Academy of Physical Therapy
Dr. Bradley Sheares, Director and Chairman of Compensation and Organization
Committee, Covance Inc.
6
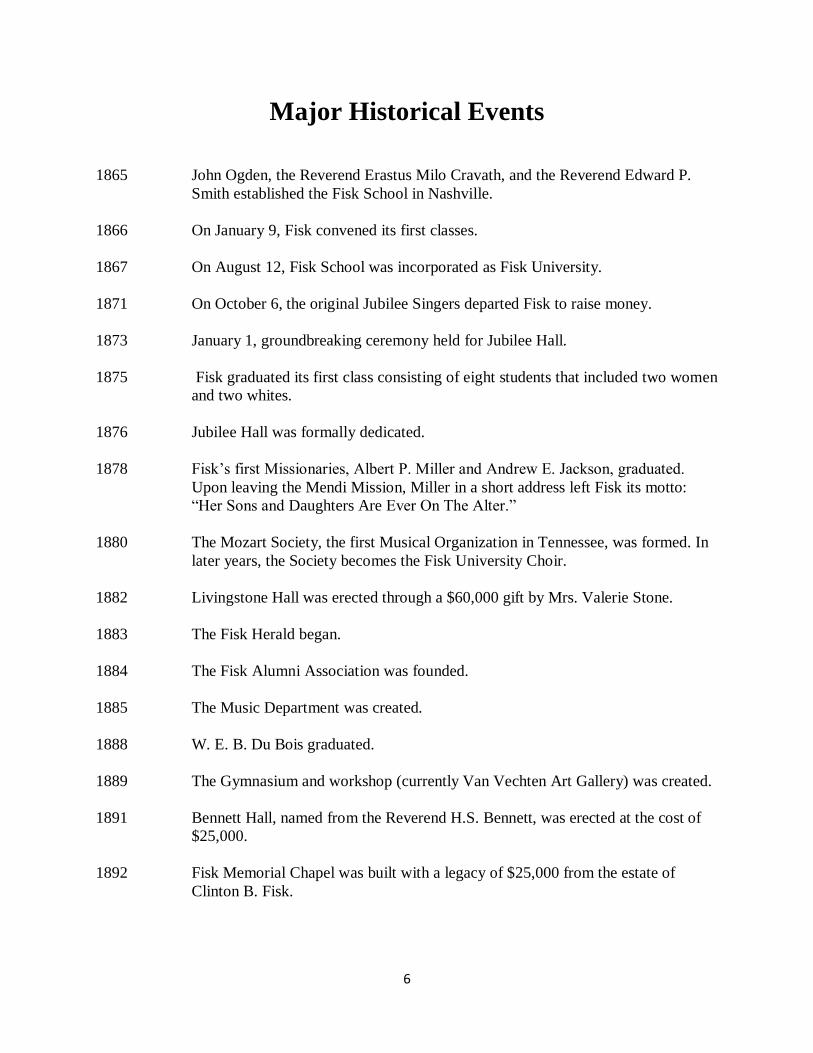
Major Historical Events
1865 John Ogden, the Reverend Erastus Milo Cravath, and the Reverend Edward P.
Smith established the Fisk School in Nashville.
1866 On January 9, Fisk convened its first classes.
1867 On August 12, Fisk School was incorporated as Fisk University.
1871 On October 6, the original Jubilee Singers departed Fisk to raise money.
1873 January 1, groundbreaking ceremony held for Jubilee Hall.
1875 Fisk graduated its first class consisting of eight students that included two women
and two whites.
1876 Jubilee Hall was formally dedicated.
1878 Fisk’s first Missionaries, Albert P. Miller and Andrew E. Jackson, graduated.
Upon leaving the Mendi Mission, Miller in a short address left Fisk its motto:
“Her Sons and Daughters Are Ever On The Alter.”
1880 The Mozart Society, the first Musical Organization in Tennessee, was formed. In
later years, the Society becomes the Fisk University Choir.
1882 Livingstone Hall was erected through a $60,000 gift by Mrs. Valerie Stone.
1883 The Fisk Herald began.
1884 The Fisk Alumni Association was founded.
1885 The Music Department was created.
1888 W. E. B. Du Bois graduated.
1889 The Gymnasium and workshop (currently Van Vechten Art Gallery) was created.
1891 Bennett Hall, named from the Reverend H.S. Bennett, was erected at the cost of
$25,000.
1892 Fisk Memorial Chapel was built with a legacy of $25,000 from the estate of
Clinton B. Fisk.
7
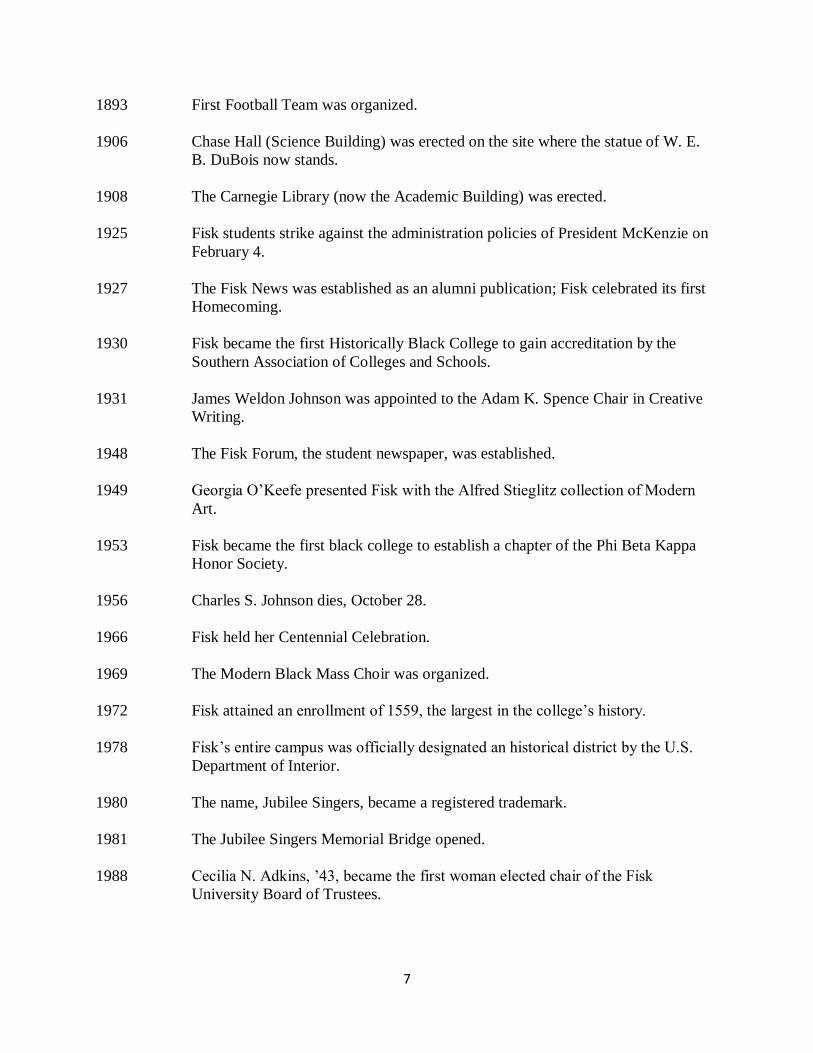
1893 First Football Team was organized.
1906 Chase Hall (Science Building) was erected on the site where the statue of W. E.
B. DuBois now stands.
1908 The Carnegie Library (now the Academic Building) was erected.
1925 Fisk students strike against the administration policies of President McKenzie on
February 4.
1927 The Fisk News was established as an alumni publication; Fisk celebrated its first
Homecoming.
1930 Fisk became the first Historically Black College to gain accreditation by the
Southern Association of Colleges and Schools.
1931 James Weldon Johnson was appointed to the Adam K. Spence Chair in Creative
Writing.
1948 The Fisk Forum, the student newspaper, was established.
1949 Georgia O’Keefe presented Fisk with the Alfred Stieglitz collection of Modern
Art.
1953 Fisk became the first black college to establish a chapter of the Phi Beta Kappa
Honor Society.
1956 Charles S. Johnson dies, October 28.
1966 Fisk held her Centennial Celebration.
1969 The Modern Black Mass Choir was organized.
1972 Fisk attained an enrollment of 1559, the largest in the college’s history.
1978 Fisk’s entire campus was officially designated an historical district by the U.S.
Department of Interior.
1980 The name, Jubilee Singers, became a registered trademark.
1981 The Jubilee Singers Memorial Bridge opened.
1988 Cecilia N. Adkins, ’43, became the first woman elected chair of the Fisk
University Board of Trustees.
8
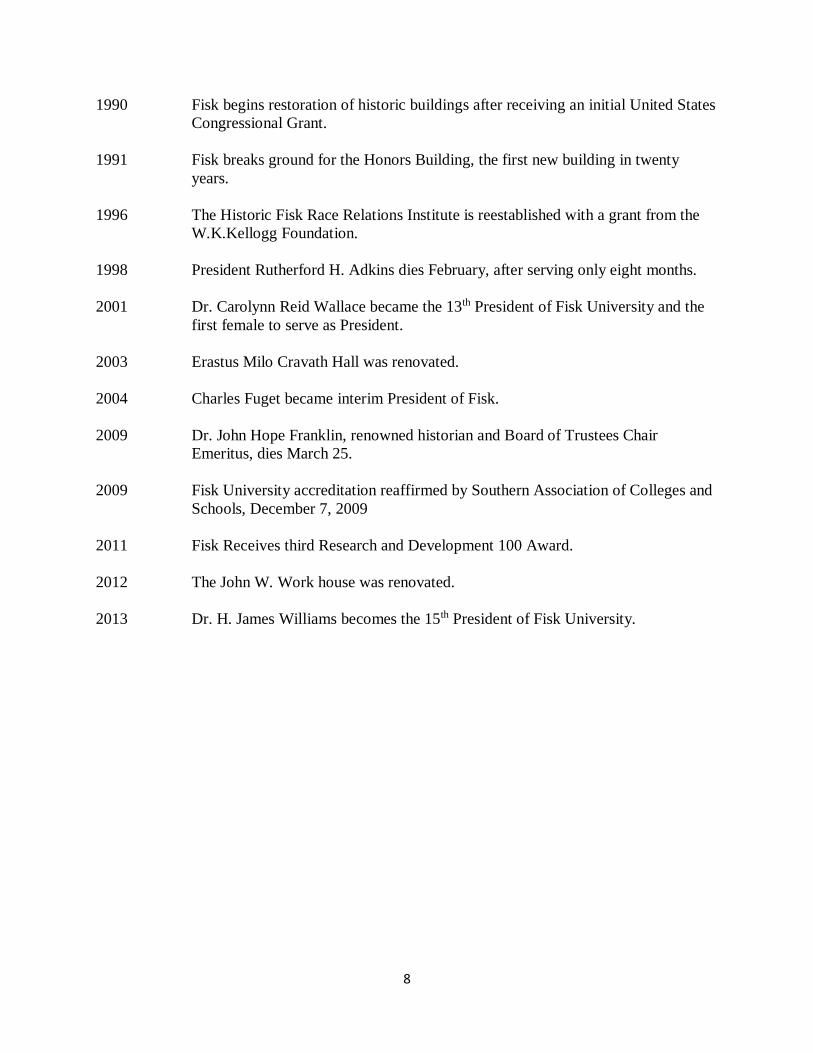
1990 Fisk begins restoration of historic buildings after receiving an initial United States
Congressional Grant.
1991 Fisk breaks ground for the Honors Building, the first new building in twenty
years.
1996 The Historic Fisk Race Relations Institute is reestablished with a grant from the
W.K.Kellogg Foundation.
1998 President Rutherford H. Adkins dies February, after serving only eight months.
2001 Dr. Carolynn Reid Wallace became the 13th President of Fisk University and the
first female to serve as President.
2003 Erastus Milo Cravath Hall was renovated.
2004 Charles Fuget became interim President of Fisk.
2009 Dr. John Hope Franklin, renowned historian and Board of Trustees Chair
Emeritus, dies March 25.
2009 Fisk University accreditation reaffirmed by Southern Association of Colleges and
Schools, December 7, 2009
2011 Fisk Receives third Research and Development 100 Award.
2012 The John W. Work house was renovated.
2013 Dr. H. James Williams becomes the 15th President of Fisk University.
9
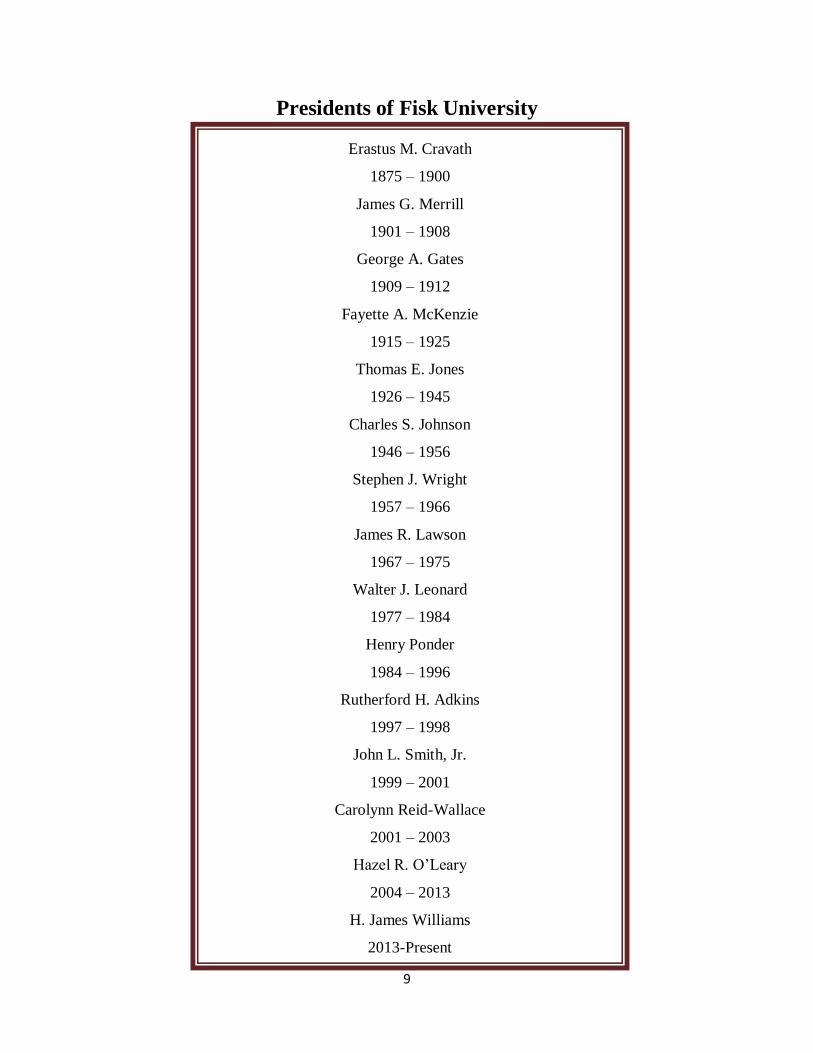
Presidents of Fisk University
Erastus M. Cravath
1875 – 1900
James G. Merrill
1901 – 1908
George A. Gates
1909 – 1912
Fayette A. McKenzie
1915 – 1925
Thomas E. Jones
1926 – 1945
Charles S. Johnson
1946 – 1956
Stephen J. Wright
1957 – 1966
James R. Lawson
1967 – 1975
Walter J. Leonard
1977 – 1984
Henry Ponder
1984 – 1996
Rutherford H. Adkins
1997 – 1998
John L. Smith, Jr.
1999 – 2001
Carolynn Reid-Wallace
2001 – 2003
Hazel R. O’Leary
2004 – 2013
H. James Williams
2013-Present
10
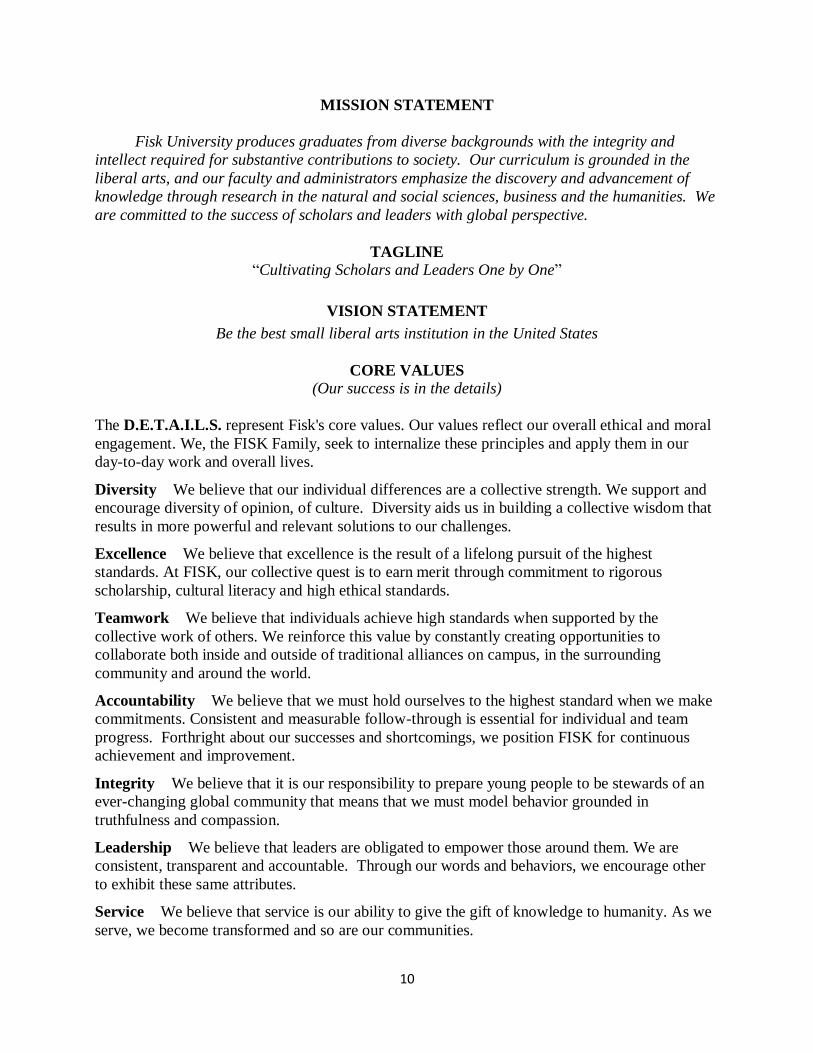
MISSION STATEMENT
Fisk University produces graduates from diverse backgrounds with the integrity and
intellect required for substantive contributions to society. Our curriculum is grounded in the
liberal arts, and our faculty and administrators emphasize the discovery and advancement of
knowledge through research in the natural and social sciences, business and the humanities. We
are committed to the success of scholars and leaders with global perspective.
TAGLINE
“Cultivating Scholars and Leaders One by One”
VISION STATEMENT
Be the best small liberal arts institution in the United States
CORE VALUES
(Our success is in the details)
The D.E.T.A.I.L.S. represent Fisk's core values. Our values reflect our overall ethical and moral
engagement. We, the FISK Family, seek to internalize these principles and apply them in our
day-to-day work and overall lives. Diversity We believe that our individual differences are a collective strength. We support and
encourage diversity of opinion, of culture. Diversity aids us in building a collective wisdom that
results in more powerful and relevant solutions to our challenges. Excellence We believe that excellence is the result of a lifelong pursuit of the highest
standards. At FISK, our collective quest is to earn merit through commitment to rigorous
scholarship, cultural literacy and high ethical standards. Teamwork We believe that individuals achieve high standards when supported by the
collective work of others. We reinforce this value by constantly creating opportunities to
collaborate both inside and outside of traditional alliances on campus, in the surrounding
community and around the world. Accountability We believe that we must hold ourselves to the highest standard when we make
commitments. Consistent and measurable follow-through is essential for individual and team
progress. Forthright about our successes and shortcomings, we position FISK for continuous
achievement and improvement. Integrity We believe that it is our responsibility to prepare young people to be stewards of an
ever-changing global community that means that we must model behavior grounded in
truthfulness and compassion. Leadership We believe that leaders are obligated to empower those around them. We are
consistent, transparent and accountable. Through our words and behaviors, we encourage other
to exhibit these same attributes. Service We believe that service is our ability to give the gift of knowledge to humanity. As we
serve, we become transformed and so are our communities.
11
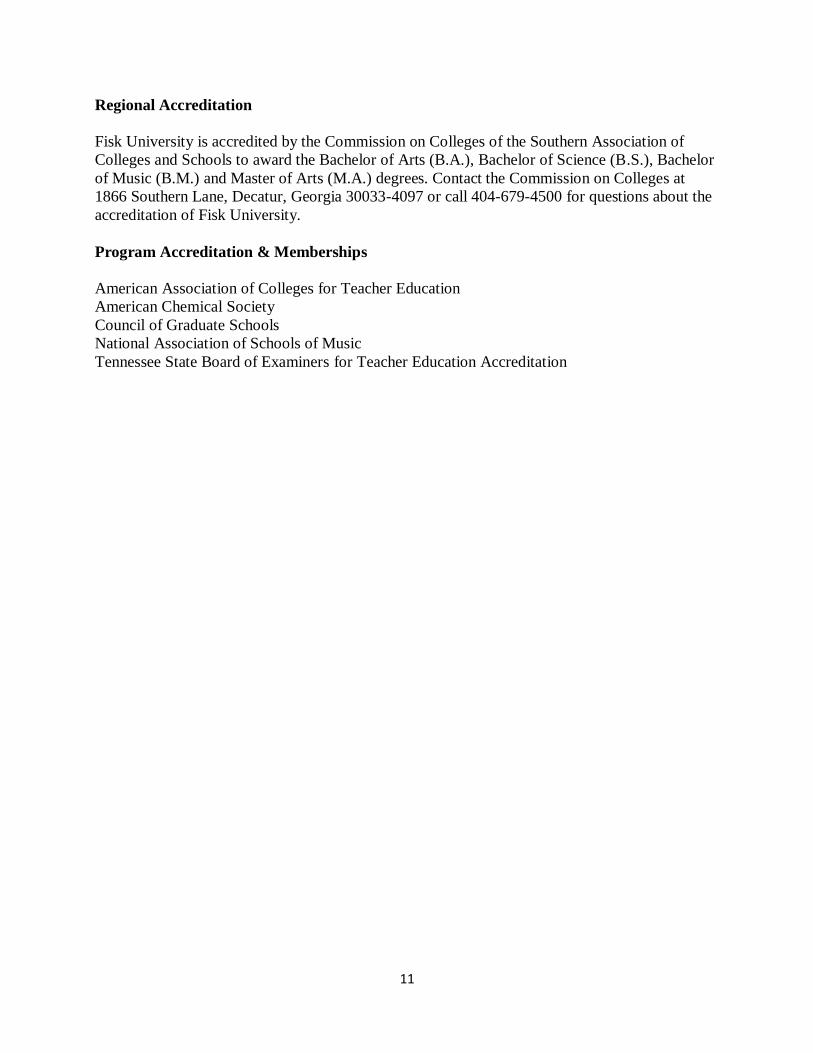
Regional Accreditation
Fisk University is accredited by the Commission on Colleges of the Southern Association of
Colleges and Schools to award the Bachelor of Arts (B.A.), Bachelor of Science (B.S.), Bachelor
of Music (B.M.) and Master of Arts (M.A.) degrees. Contact the Commission on Colleges at
1866 Southern Lane, Decatur, Georgia 30033-4097 or call 404-679-4500 for questions about the
accreditation of Fisk University.
Program Accreditation & Memberships
American Association of Colleges for Teacher Education
American Chemical Society
Council of Graduate Schools
National Association of Schools of Music
Tennessee State Board of Examiners for Teacher Education Accreditation
12
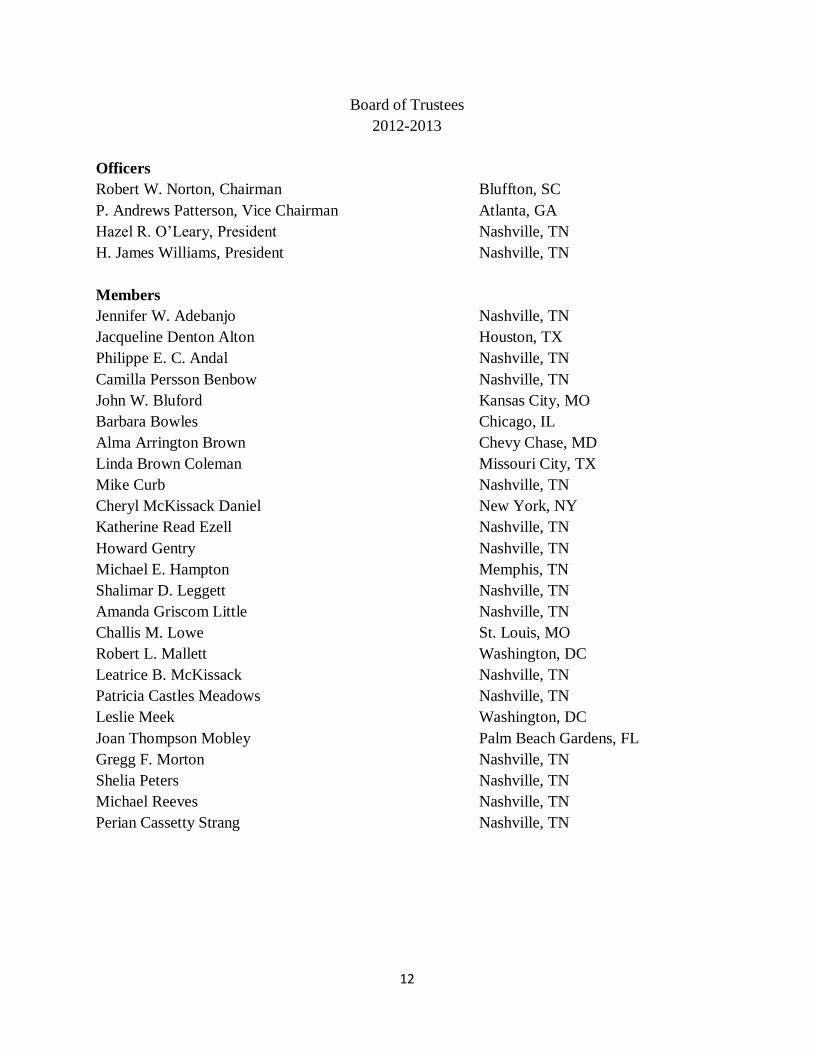
Board of Trustees
2012-2013
Officers
Robert W. Norton, Chairman Bluffton, SC
P. Andrews Patterson, Vice Chairman Atlanta, GA
Hazel R. O’Leary, President Nashville, TN
H. James Williams, President Nashville, TN
Members
Jennifer W. Adebanjo Nashville, TN
Jacqueline Denton Alton Houston, TX
Philippe E. C. Andal Nashville, TN
Camilla Persson Benbow Nashville, TN
John W. Bluford Kansas City, MO
Barbara Bowles Chicago, IL
Alma Arrington Brown Chevy Chase, MD
Linda Brown Coleman Missouri City, TX
Mike Curb Nashville, TN
Cheryl McKissack Daniel New York, NY
Katherine Read Ezell Nashville, TN
Howard Gentry Nashville, TN
Michael E. Hampton Memphis, TN
Shalimar D. Leggett Nashville, TN
Amanda Griscom Little Nashville, TN
Challis M. Lowe St. Louis, MO
Robert L. Mallett Washington, DC
Leatrice B. McKissack Nashville, TN
Patricia Castles Meadows Nashville, TN
Leslie Meek Washington, DC
Joan Thompson Mobley Palm Beach Gardens, FL
Gregg F. Morton Nashville, TN
Shelia Peters Nashville, TN
Michael Reeves Nashville, TN
Perian Cassetty Strang Nashville, TN
13
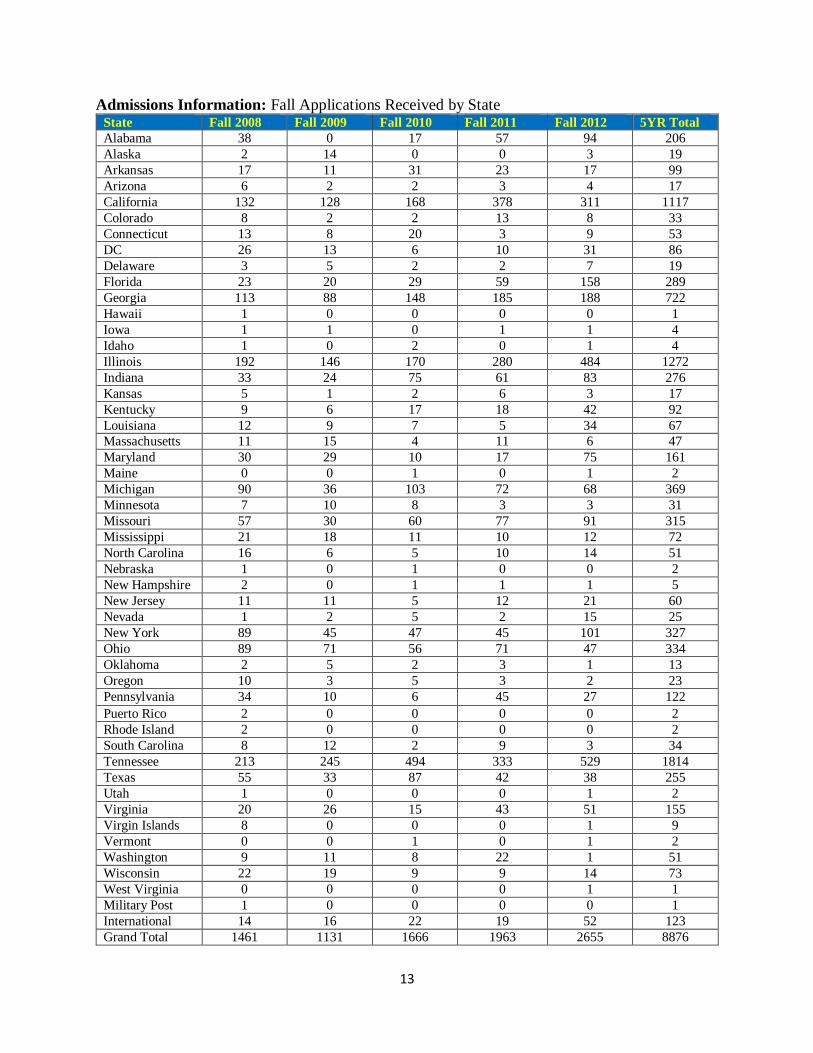
Admissions Information: Fall Applications Received by State State Fall 2008 Fall 2009 Fall 2010 Fall 2011 Fall 2012 5YR Total
Alabama 38 0 17 57 94 206
Alaska 2 14 0 0 3 19
Arkansas 17 11 31 23 17 99
Arizona 6 2 2 3 4 17
California 132 128 168 378 311 1117
Colorado 8 2 2 13 8 33
Connecticut 13 8 20 3 9 53
DC 26 13 6 10 31 86
Delaware 3 5 2 2 7 19
Florida 23 20 29 59 158 289
Georgia 113 88 148 185 188 722
Hawaii 1 0 0 0 0 1
Iowa 1 1 0 1 1 4
Idaho 1 0 2 0 1 4
Illinois 192 146 170 280 484 1272
Indiana 33 24 75 61 83 276
Kansas 5 1 2 6 3 17
Kentucky 9 6 17 18 42 92
Louisiana 12 9 7 5 34 67
Massachusetts 11 15 4 11 6 47
Maryland 30 29 10 17 75 161
Maine 0 0 1 0 1 2
Michigan 90 36 103 72 68 369
Minnesota 7 10 8 3 3 31
Missouri 57 30 60 77 91 315
Mississippi 21 18 11 10 12 72
North Carolina 16 6 5 10 14 51
Nebraska 1 0 1 0 0 2
New Hampshire 2 0 1 1 1 5
New Jersey 11 11 5 12 21 60
Nevada 1 2 5 2 15 25
New York 89 45 47 45 101 327
Ohio 89 71 56 71 47 334
Oklahoma 2 5 2 3 1 13
Oregon 10 3 5 3 2 23
Pennsylvania 34 10 6 45 27 122
Puerto Rico 2 0 0 0 0 2
Rhode Island 2 0 0 0 0 2
South Carolina 8 12 2 9 3 34
Tennessee 213 245 494 333 529 1814
Texas 55 33 87 42 38 255
Utah 1 0 0 0 1 2
Virginia 20 26 15 43 51 155
Virgin Islands 8 0 0 0 1 9
Vermont 0 0 1 0 1 2
Washington 9 11 8 22 1 51
Wisconsin 22 19 9 9 14 73
West Virginia 0 0 0 0 1 1
Military Post 1 0 0 0 0 1
International 14 16 22 19 52 123
Grand Total 1461 1131 1666 1963 2655 8876
14
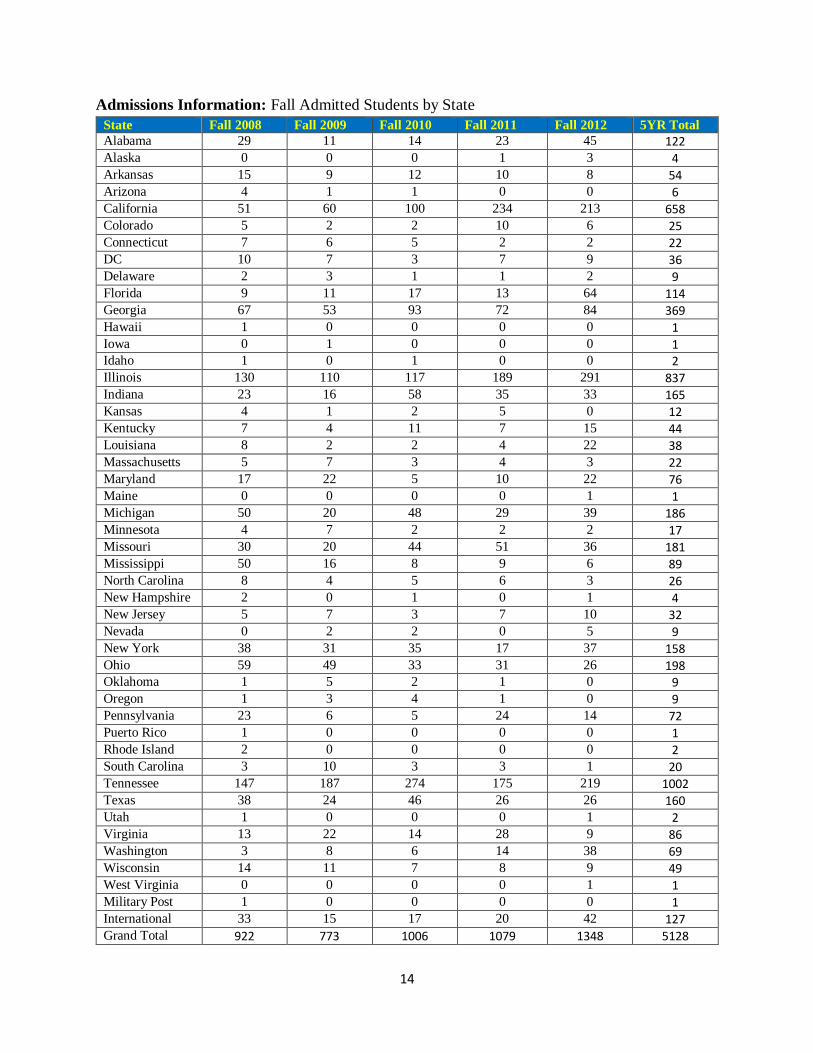
Admissions Information: Fall Admitted Students by State
State Fall 2008 Fall 2009 Fall 2010 Fall 2011 Fall 2012 5YR Total
Alabama 29 11 14 23 45 122 Alaska 0 0 0 1 3 4 Arkansas 15 9 12 10 8 54 Arizona 4 1 1 0 0 6 California 51 60 100 234 213 658 Colorado 5 2 2 10 6 25 Connecticut 7 6 5 2 2 22 DC 10 7 3 7 9 36 Delaware 2 3 1 1 2 9 Florida 9 11 17 13 64 114 Georgia 67 53 93 72 84 369 Hawaii 1 0 0 0 0 1 Iowa 0 1 0 0 0 1 Idaho 1 0 1 0 0 2 Illinois 130 110 117 189 291 837 Indiana 23 16 58 35 33 165 Kansas 4 1 2 5 0 12 Kentucky 7 4 11 7 15 44 Louisiana 8 2 2 4 22 38 Massachusetts 5 7 3 4 3 22 Maryland 17 22 5 10 22 76 Maine 0 0 0 0 1 1 Michigan 50 20 48 29 39 186 Minnesota 4 7 2 2 2 17 Missouri 30 20 44 51 36 181 Mississippi 50 16 8 9 6 89 North Carolina 8 4 5 6 3 26 New Hampshire 2 0 1 0 1 4 New Jersey 5 7 3 7 10 32 Nevada 0 2 2 0 5 9 New York 38 31 35 17 37 158 Ohio 59 49 33 31 26 198 Oklahoma 1 5 2 1 0 9 Oregon 1 3 4 1 0 9 Pennsylvania 23 6 5 24 14 72 Puerto Rico 1 0 0 0 0 1 Rhode Island 2 0 0 0 0 2 South Carolina 3 10 3 3 1 20 Tennessee 147 187 274 175 219 1002 Texas 38 24 46 26 26 160 Utah 1 0 0 0 1 2 Virginia 13 22 14 28 9 86 Washington 3 8 6 14 38 69 Wisconsin 14 11 7 8 9 49 West Virginia 0 0 0 0 1 1 Military Post 1 0 0 0 0 1 International 33 15 17 20 42 127 Grand Total 922 773 1006 1079 1348 5128

15
Admissions Information: First-Time Enrolled Undergraduate Students by State (Full-time and Part-time)
State Fall 2008 Fall 2009 Fall 2010 Fall 2011 Fall 2012 5YR Total
Alabama 0 2 4 6 5 17 Alaska 0 0 0 0 1 1 Arkansas 0 0 1 1 1 3 California 4 2 8 13 21 48 Colorado 1 0 0 0 3 4 Connecticut 1 1 0 1 0 3 DC 0 2 1 1 1 5 Delaware 0 0 0 0 1 1 Florida 0 2 4 1 3 10 Georgia 6 11 10 8 10 45 Idaho 1 0 0 0 0 1 Illinois 15 21 19 20 32 107 Indiana 2 1 2 3 5 13 Kansas 0 0 0 1 0 1 Kentucky 2 0 3 0 4 9 Louisiana 1 0 1 1 3 6 Massachusetts 0 1 0 0 0 1 Maryland 4 2 2 2 3 13 Michigan 3 2 7 3 11 26 Minnesota 0 1 0 0 2 3 Missouri 1 6 4 3 2 16 Mississippi 1 3 0 1 1 6 Nevada 0 0 0 0 1 1 North Carolina 0 0 0 1 0 1 New Jersey 0 1 0 0 0 1 New York 4 4 2 1 5 16 Ohio 8 5 4 5 6 28 Oklahoma 1 0 0 1 0 2 Oregon 1 1 2 0 0 4 Pennsylvania 4 0 0 1 2 7 South Carolina 0 0 0 0 1 1 Tennessee 22 30 57 25 53 187 Texas 3 3 10 3 10 29 Utah 0 0 0 0 1 1 Virginia 1 0 1 0 0 2 Washington 1 0 1 1 0 3 Wisconsin 2 0 0 1 2 5 Unidentified
/International
11 6 2 5 14 38
Grand Total 100 107 145 109 204 665
16
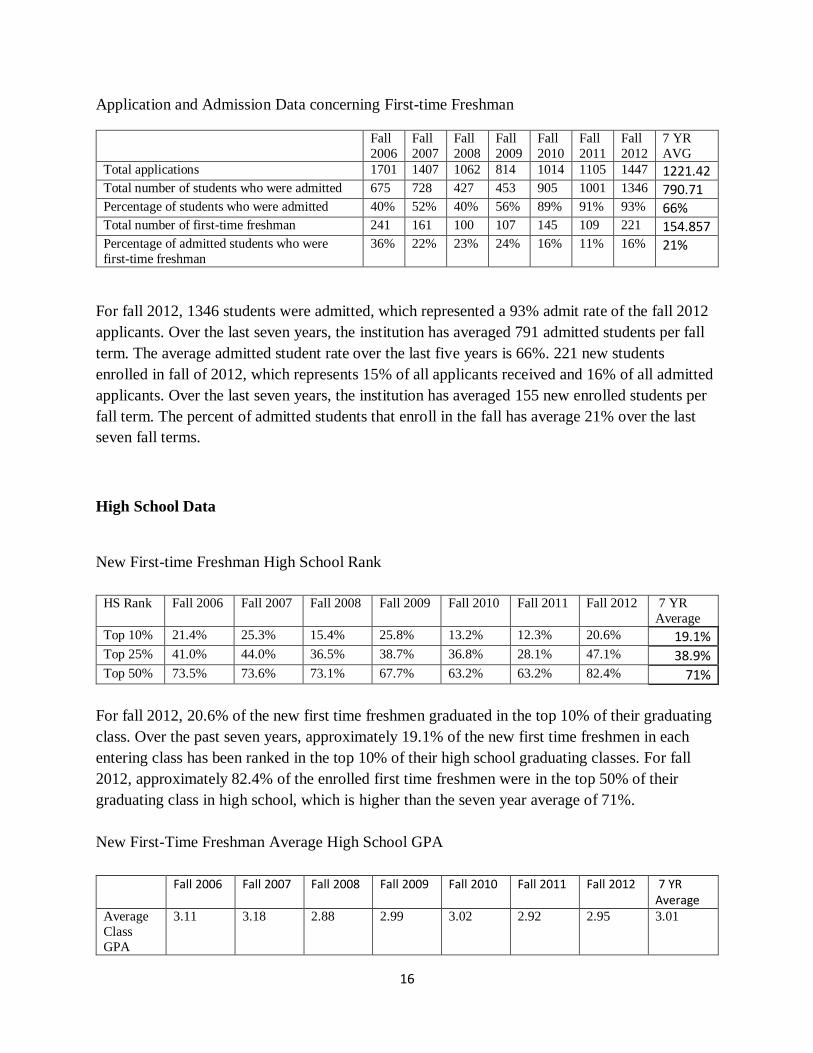
Application and Admission Data concerning First-time Freshman
Fall
2006
Fall
2007
Fall
2008
Fall
2009
Fall
2010
Fall
2011
Fall
2012
7 YR
AVG
Total applications 1701 1407 1062 814 1014 1105 1447 1221.42 Total number of students who were admitted 675 728 427 453 905 1001 1346 790.71 Percentage of students who were admitted 40% 52% 40% 56% 89% 91% 93% 66% Total number of first-time freshman 241 161 100 107 145 109 221 154.857 Percentage of admitted students who were
first-time freshman
36% 22% 23% 24% 16% 11% 16% 21%
For fall 2012, 1346 students were admitted, which represented a 93% admit rate of the fall 2012
applicants. Over the last seven years, the institution has averaged 791 admitted students per fall
term. The average admitted student rate over the last five years is 66%. 221 new students
enrolled in fall of 2012, which represents 15% of all applicants received and 16% of all admitted
applicants. Over the last seven years, the institution has averaged 155 new enrolled students per
fall term. The percent of admitted students that enroll in the fall has average 21% over the last
seven fall terms.
High School Data
New First-time Freshman High School Rank
HS Rank Fall 2006 Fall 2007 Fall 2008 Fall 2009 Fall 2010 Fall 2011 Fall 2012 7 YR
Average
Top 10% 21.4% 25.3% 15.4% 25.8% 13.2% 12.3% 20.6% 19.1% Top 25% 41.0% 44.0% 36.5% 38.7% 36.8% 28.1% 47.1% 38.9% Top 50% 73.5% 73.6% 73.1% 67.7% 63.2% 63.2% 82.4% 71%
For fall 2012, 20.6% of the new first time freshmen graduated in the top 10% of their graduating
class. Over the past seven years, approximately 19.1% of the new first time freshmen in each
entering class has been ranked in the top 10% of their high school graduating classes. For fall
2012, approximately 82.4% of the enrolled first time freshmen were in the top 50% of their
graduating class in high school, which is higher than the seven year average of 71%.
New First-Time Freshman Average High School GPA
Fall 2006 Fall 2007 Fall 2008 Fall 2009 Fall 2010 Fall 2011 Fall 2012 7 YR Average
Average
Class
GPA
3.11 3.18 2.88 2.99 3.02 2.92 2.95 3.01
17
The average high school grade point average for new first time freshmen that enrolled during the
fall 2012 semester was 2.95. For the last seven years, the average high school grade point
average for new first time freshmen is 3.01.
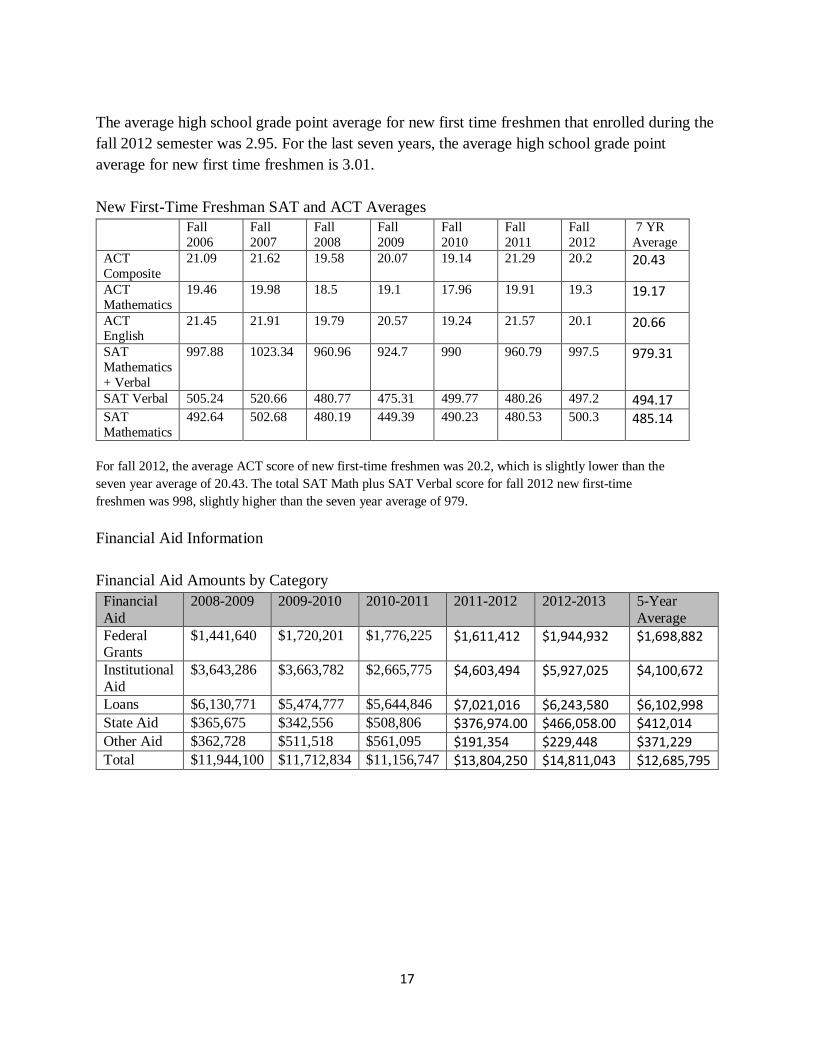
New First-Time Freshman SAT and ACT Averages
Fall
2006
Fall
2007
Fall
2008
Fall
2009
Fall
2010
Fall
2011
Fall
2012
7 YR
Average
ACT
Composite
21.09 21.62 19.58 20.07 19.14 21.29 20.2 20.43
ACT
Mathematics
19.46 19.98 18.5 19.1 17.96 19.91 19.3 19.17
ACT English
21.45 21.91 19.79 20.57 19.24 21.57 20.1 20.66
SAT
Mathematics
+ Verbal
997.88 1023.34 960.96 924.7 990 960.79 997.5 979.31
SAT Verbal 505.24 520.66 480.77 475.31 499.77 480.26 497.2 494.17 SAT
Mathematics
492.64 502.68 480.19 449.39 490.23 480.53 500.3 485.14
For fall 2012, the average ACT score of new first-time freshmen was 20.2, which is slightly lower than the
seven year average of 20.43. The total SAT Math plus SAT Verbal score for fall 2012 new first-time
freshmen was 998, slightly higher than the seven year average of 979.
Financial Aid Information
Financial Aid Amounts by Category
Financial
Aid
2008-2009 2009-2010 2010-2011 2011-2012 2012-2013 5-Year
Average
Federal Grants
$1,441,640 $1,720,201 $1,776,225 $1,611,412 $1,944,932 $1,698,882
Institutional
Aid
$3,643,286 $3,663,782 $2,665,775 $4,603,494 $5,927,025 $4,100,672
Loans $6,130,771 $5,474,777 $5,644,846 $7,021,016 $6,243,580 $6,102,998 State Aid $365,675 $342,556 $508,806 $376,974.00 $466,058.00 $412,014 Other Aid $362,728 $511,518 $561,095 $191,354 $229,448 $371,229 Total $11,944,100 $11,712,834 $11,156,747 $13,804,250 $14,811,043 $12,685,795
18
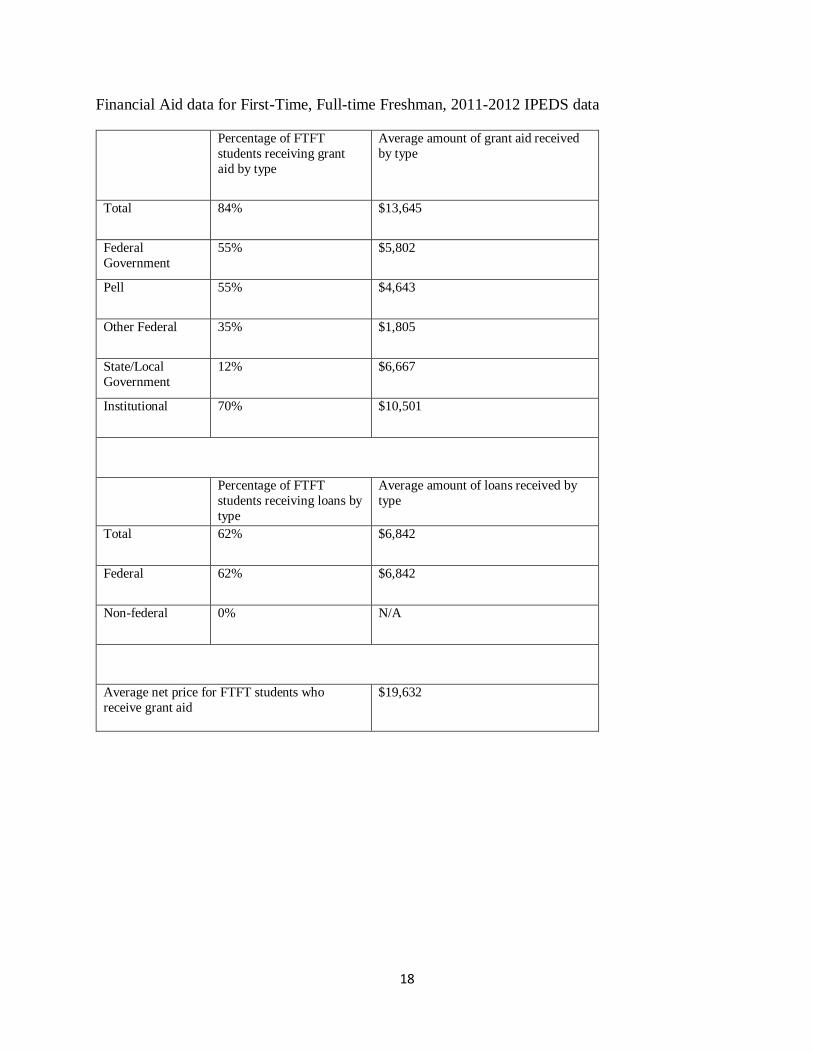
Financial Aid data for First-Time, Full-time Freshman, 2011-2012 IPEDS data
Percentage of FTFT
students receiving grant
aid by type
Average amount of grant aid received
by type
Total 84% $13,645
Federal
Government
55% $5,802
Pell 55% $4,643
Other Federal 35% $1,805
State/Local
Government
12% $6,667
Institutional 70% $10,501
Percentage of FTFT
students receiving loans by
type
Average amount of loans received by
type
Total 62% $6,842
Federal 62% $6,842
Non-federal 0% N/A
Average net price for FTFT students who
receive grant aid
$19,632
19
Enrollment Trends: Total Headcount and FTE data
Fall 2006
Fall 2007
Fall 2008
Fall 2009
Fall 2010
Fall 2011
Fall 2012
7 YR AVG
Enrollment 939 814 720 652 580 533 613 693
FTE 923 801 707 638 568 518 584 677
Spring 2007
Spring 2008
Spring 2009
Spring 2010
Spring 2011
Spring 2012
Spring 2013
7 YR AVG
Enrollment 887 764 668 628 533 497 564 648.71
FTE 856 741 646 610 515 482 524 624.86
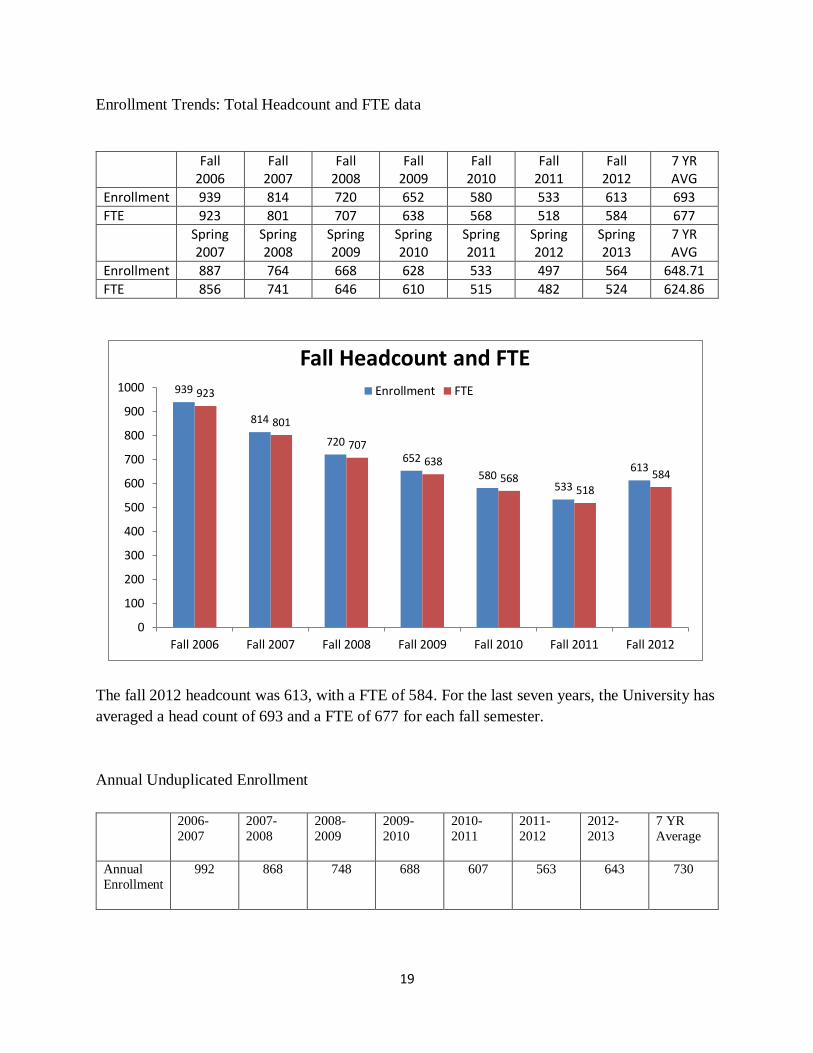
The fall 2012 headcount was 613, with a FTE of 584. For the last seven years, the University has
averaged a head count of 693 and a FTE of 677 for each fall semester.
Annual Unduplicated Enrollment
2006-
2007
2007-
2008
2008-
2009
2009-
2010
2010-
2011
2011-
2012
2012-
2013
7 YR
Average
Annual
Enrollment
992 868 748 688 607 563 643 730
939
814
720
652
580533
613
923
801
707
638
568518
584
0
100
200
300
400
500
600
700
800
900
1000
Fall 2006 Fall 2007 Fall 2008 Fall 2009 Fall 2010 Fall 2011 Fall 2012
Fall Headcount and FTEEnrollment FTE
20
Fall Enrollment by Gender
Semester Females
% of
Females Males
% of
Males Total
Fall 2006 663 71% 276 29% 939
Fall 2007 558 69% 256 31% 814
Fall 2008 488 68% 232 32% 720
Fall 2009 420 64% 232 36% 652
Fall 2010 357 62% 223 38% 580
Fall 2011 334 63% 199 37% 533
Fall 2012 373 61% 240 39% 613
7 Year Avg. 456 65% 237 35% 693
The percent of female students in fall 2012 was 61%, slightly lower than the seven year average
of 65%. The percent of male students in fall 2012 was 39%, slightly higher than the seven year
average of 35%.
Fall Enrolment by Ethnicity
Semester Fall
2006 Fall
2007 Fall
2008 Fall
2009 Fall
2010 Fall
2011 Fall
2012 7 YR Avg.
African American
882 746 642 559 483 445 519 611
American Indian Native
American
1 1 0 0 0 2 2 12
Asian 2 2 3 3 2 0 2 2
Bi-Racial 4 4 4 11 13 11 11 8
Caucasian 5 4 3 5 9 12 13 7
Hispanic 5 5 1 1 4 4 2 3
Pacific Islander
2 1 2 2 2 1 0 1
Unknown 38 51 65 71 67 58 64 59
Non-Resident
Alien 0 0 0 0 0 0 0 0
Total Students
939 814 720 652 580 533 613 693
21
Fall 2012 Enrollment by Ethnicity
Fall Enrollment by Classification
Semester Freshmen Sophomore Junior Senior Undergraduate Graduate Total
Fall 2006 307 227 150 187 871 68 939
Fall 2007 196 251 167 151 765 49 814
Fall 2008 147 137 232 168 684 36 720
Fall 2009 140 93 131 239 603 49 652
Fall 2010 186 101 80 151 518 62 580
Fall 2011 184 139 87 70 480 53 533
Fall 2012 216 126 113 117 572 41 613
7 YR AVG 197 153 137 155 642 51 693
African American85%
American Indian Native
American0%
Asian0%
Bi-Racial2%
Caucasian2%
Hispanic0% Pacific Islander
0%
Unknown11%
Fall 2012 Enrollment by Ethnicity
African American
American Indian Native American
Asian
Bi-Racial
Caucasian
Hispanic
Pacific Islander
Unknown
22
871
765
684
603
518480
572
68 49 36 49 62 53 41
0
100
200
300
400
500
600
700
800
900
1000
Fall 2006 Fall 2007 Fall 2008 Fall 2009 Fall 2010 Fall 2011 Fall 2012
Nu
mb
er o
f S
tud
ents
Enrollment by Level
Undergraduate Graduate
23
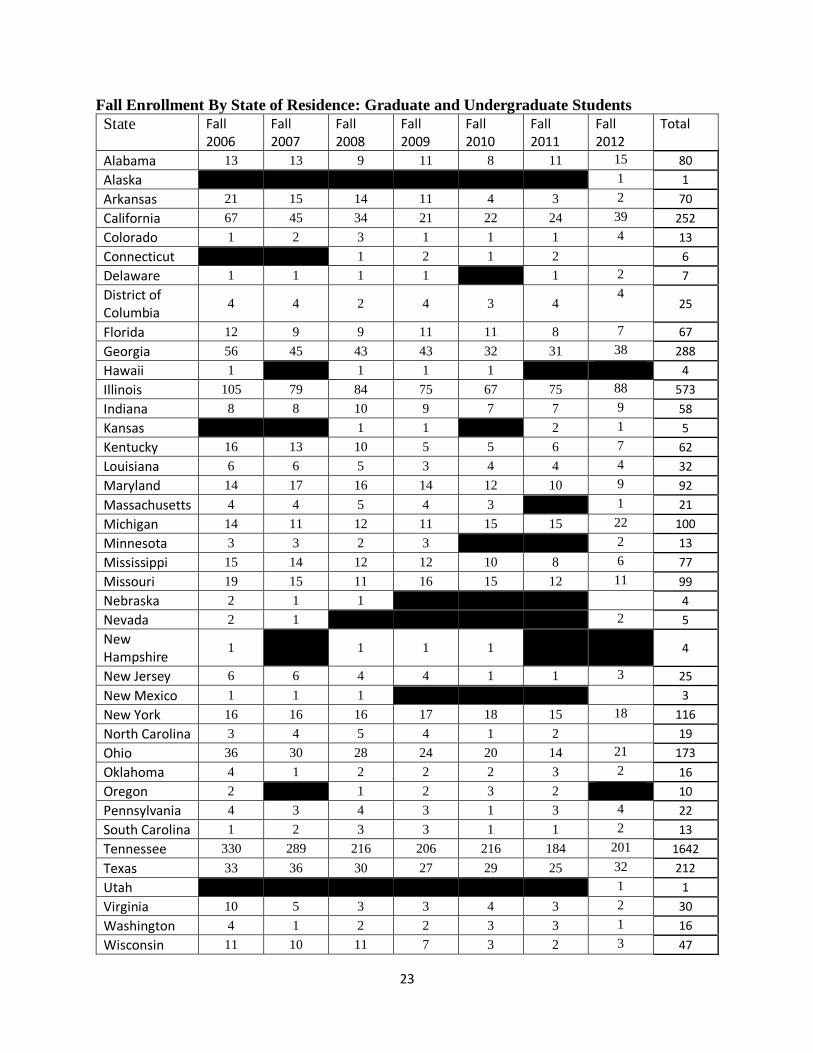
Fall Enrollment By State of Residence: Graduate and Undergraduate Students
State Fall 2006
Fall 2007
Fall 2008
Fall 2009
Fall 2010
Fall 2011
Fall 2012
Total
Alabama 13 13 9 11 8 11 15 80
Alaska 1 1
Arkansas 21 15 14 11 4 3 2 70
California 67 45 34 21 22 24 39 252
Colorado 1 2 3 1 1 1 4 13
Connecticut 1 2 1 2 6
Delaware 1 1 1 1 1 2 7
District of Columbia
4 4 2 4 3 4 4
25
Florida 12 9 9 11 11 8 7 67
Georgia 56 45 43 43 32 31 38 288
Hawaii 1 1 1 1 4
Illinois 105 79 84 75 67 75 88 573
Indiana 8 8 10 9 7 7 9 58
Kansas 1 1 2 1 5
Kentucky 16 13 10 5 5 6 7 62
Louisiana 6 6 5 3 4 4 4 32
Maryland 14 17 16 14 12 10 9 92
Massachusetts 4 4 5 4 3 1 21
Michigan 14 11 12 11 15 15 22 100
Minnesota 3 3 2 3 2 13
Mississippi 15 14 12 12 10 8 6 77
Missouri 19 15 11 16 15 12 11 99
Nebraska 2 1 1 4
Nevada 2 1 2 5
New Hampshire
1 1 1 1
4
New Jersey 6 6 4 4 1 1 3 25
New Mexico 1 1 1 3
New York 16 16 16 17 18 15 18 116
North Carolina 3 4 5 4 1 2 19
Ohio 36 30 28 24 20 14 21 173
Oklahoma 4 1 2 2 2 3 2 16
Oregon 2 1 2 3 2 10
Pennsylvania 4 3 4 3 1 3 4 22
South Carolina 1 2 3 3 1 1 2 13
Tennessee 330 289 216 206 216 184 201 1642
Texas 33 36 30 27 29 25 32 212
Utah 1 1
Virginia 10 5 3 3 4 3 2 30
Washington 4 1 2 2 3 3 1 16
Wisconsin 11 10 11 7 3 2 3 47
24
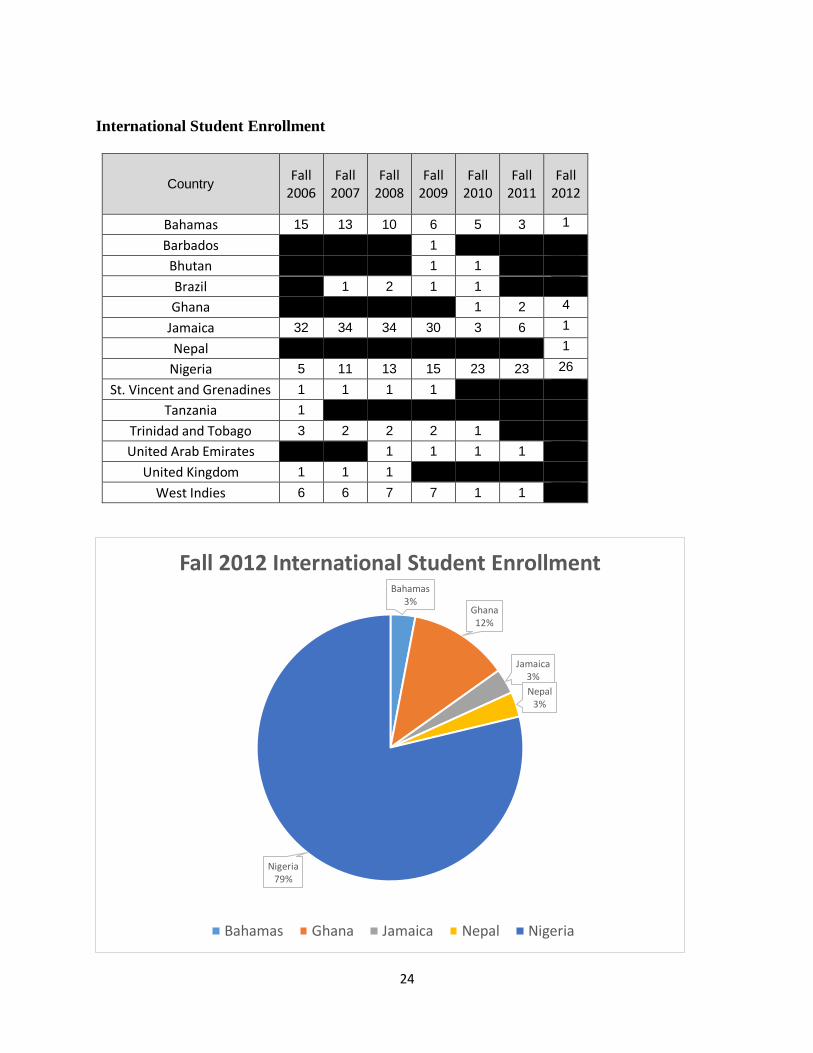
International Student Enrollment
Country Fall
2006 Fall
2007 Fall
2008 Fall
2009 Fall
2010 Fall
2011 Fall
2012
Bahamas 15 13 10 6 5 3 1
Barbados 1
Bhutan 1 1
Brazil 1 2 1 1
Ghana 1 2 4
Jamaica 32 34 34 30 3 6 1
Nepal 1
Nigeria 5 11 13 15 23 23 26
St. Vincent and Grenadines 1 1 1 1
Tanzania 1
Trinidad and Tobago 3 2 2 2 1
United Arab Emirates 1 1 1 1
United Kingdom 1 1 1
West Indies 6 6 7 7 1 1
Bahamas3%
Ghana12%
Jamaica3%
Nepal3%
Nigeria79%
Fall 2012 International Student Enrollment
Bahamas Ghana Jamaica Nepal Nigeria
25
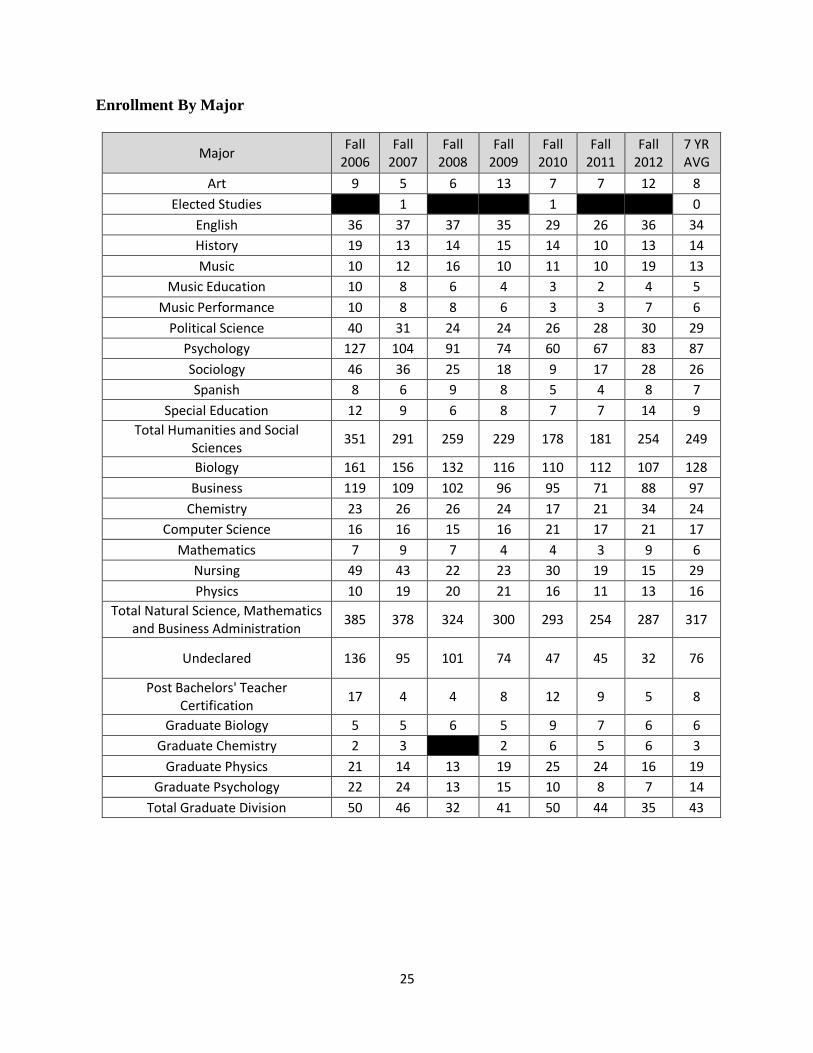
Enrollment By Major
Major Fall
2006 Fall
2007 Fall
2008 Fall
2009 Fall
2010 Fall
2011 Fall
2012 7 YR AVG
Art 9 5 6 13 7 7 12 8
Elected Studies 0 1 0 0 1 0 0
English 36 37 37 35 29 26 36 34
History 19 13 14 15 14 10 13 14
Music 10 12 16 10 11 10 19 13
Music Education 10 8 6 4 3 2 4 5
Music Performance 10 8 8 6 3 3 7 6
Political Science 40 31 24 24 26 28 30 29
Psychology 127 104 91 74 60 67 83 87
Sociology 46 36 25 18 9 17 28 26
Spanish 8 6 9 8 5 4 8 7
Special Education 12 9 6 8 7 7 14 9
Total Humanities and Social Sciences
351 291 259 229 178 181 254 249
Biology 161 156 132 116 110 112 107 128
Business 119 109 102 96 95 71 88 97
Chemistry 23 26 26 24 17 21 34 24
Computer Science 16 16 15 16 21 17 21 17
Mathematics 7 9 7 4 4 3 9 6
Nursing 49 43 22 23 30 19 15 29
Physics 10 19 20 21 16 11 13 16
Total Natural Science, Mathematics and Business Administration
385 378 324 300 293 254 287 317
Undeclared 136 95 101 74 47 45 32 76
Post Bachelors' Teacher Certification
17 4 4 8 12 9 5 8
Graduate Biology 5 5 6 5 9 7 6 6
Graduate Chemistry 2 3 0 2 6 5 6 3
Graduate Physics 21 14 13 19 25 24 16 19
Graduate Psychology 22 24 13 15 10 8 7 14
Total Graduate Division 50 46 32 41 50 44 35 43
26
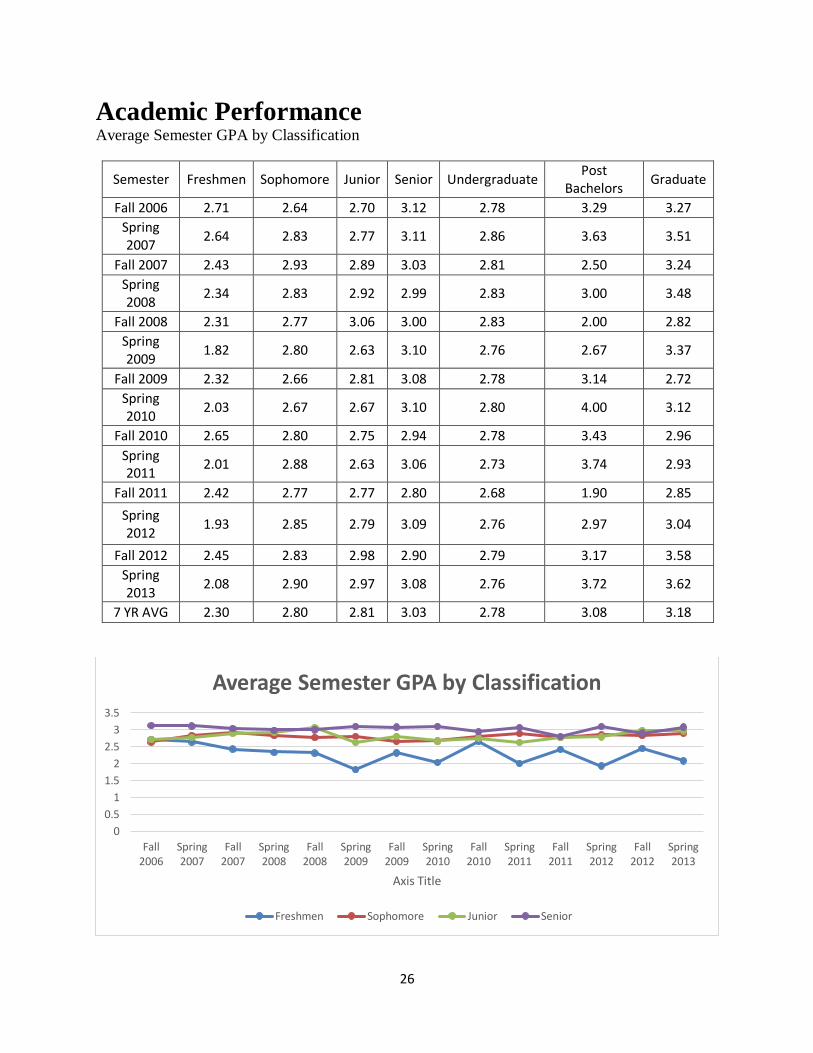
Academic Performance Average Semester GPA by Classification
Semester Freshmen Sophomore Junior Senior Undergraduate Post
Bachelors Graduate
Fall 2006 2.71 2.64 2.70 3.12 2.78 3.29 3.27
Spring 2007
2.64 2.83 2.77 3.11 2.86 3.63 3.51
Fall 2007 2.43 2.93 2.89 3.03 2.81 2.50 3.24
Spring 2008
2.34 2.83 2.92 2.99 2.83 3.00 3.48
Fall 2008 2.31 2.77 3.06 3.00 2.83 2.00 2.82
Spring 2009
1.82 2.80 2.63 3.10 2.76 2.67 3.37
Fall 2009 2.32 2.66 2.81 3.08 2.78 3.14 2.72
Spring 2010
2.03 2.67 2.67 3.10 2.80 4.00 3.12
Fall 2010 2.65 2.80 2.75 2.94 2.78 3.43 2.96
Spring 2011
2.01 2.88 2.63 3.06 2.73 3.74 2.93
Fall 2011 2.42 2.77 2.77 2.80 2.68 1.90 2.85
Spring 2012
1.93 2.85 2.79 3.09 2.76 2.97 3.04
Fall 2012 2.45 2.83 2.98 2.90 2.79 3.17 3.58
Spring 2013
2.08 2.90 2.97 3.08 2.76 3.72 3.62
7 YR AVG 2.30 2.80 2.81 3.03 2.78 3.08 3.18
0
0.5
1
1.5
2
2.5
3
3.5
Fall2006
Spring2007
Fall2007
Spring2008
Fall2008
Spring2009
Fall2009
Spring2010
Fall2010
Spring2011
Fall2011
Spring2012
Fall2012
Spring2013
Axis Title
Average Semester GPA by Classification
Freshmen Sophomore Junior Senior
27
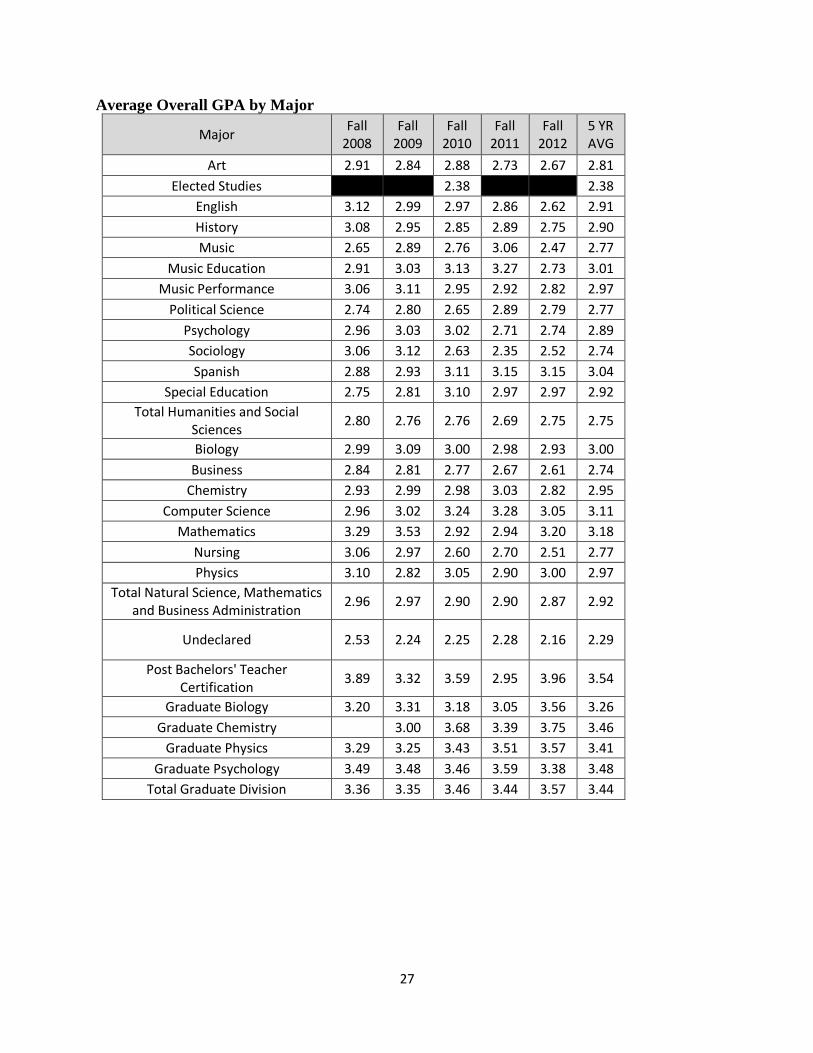
Average Overall GPA by Major
Major Fall
2008 Fall
2009 Fall
2010 Fall
2011 Fall
2012 5 YR AVG
Art 2.91 2.84 2.88 2.73 2.67 2.81
Elected Studies 2.38 2.38
English 3.12 2.99 2.97 2.86 2.62 2.91
History 3.08 2.95 2.85 2.89 2.75 2.90
Music 2.65 2.89 2.76 3.06 2.47 2.77
Music Education 2.91 3.03 3.13 3.27 2.73 3.01
Music Performance 3.06 3.11 2.95 2.92 2.82 2.97
Political Science 2.74 2.80 2.65 2.89 2.79 2.77
Psychology 2.96 3.03 3.02 2.71 2.74 2.89
Sociology 3.06 3.12 2.63 2.35 2.52 2.74
Spanish 2.88 2.93 3.11 3.15 3.15 3.04
Special Education 2.75 2.81 3.10 2.97 2.97 2.92
Total Humanities and Social Sciences
2.80 2.76 2.76 2.69 2.75 2.75
Biology 2.99 3.09 3.00 2.98 2.93 3.00
Business 2.84 2.81 2.77 2.67 2.61 2.74
Chemistry 2.93 2.99 2.98 3.03 2.82 2.95
Computer Science 2.96 3.02 3.24 3.28 3.05 3.11
Mathematics 3.29 3.53 2.92 2.94 3.20 3.18
Nursing 3.06 2.97 2.60 2.70 2.51 2.77
Physics 3.10 2.82 3.05 2.90 3.00 2.97
Total Natural Science, Mathematics and Business Administration
2.96 2.97 2.90 2.90 2.87 2.92
Undeclared 2.53 2.24 2.25 2.28 2.16 2.29
Post Bachelors' Teacher Certification
3.89 3.32 3.59 2.95 3.96 3.54
Graduate Biology 3.20 3.31 3.18 3.05 3.56 3.26
Graduate Chemistry 3.00 3.68 3.39 3.75 3.46
Graduate Physics 3.29 3.25 3.43 3.51 3.57 3.41
Graduate Psychology 3.49 3.48 3.46 3.59 3.38 3.48
Total Graduate Division 3.36 3.35 3.46 3.44 3.57 3.44
28
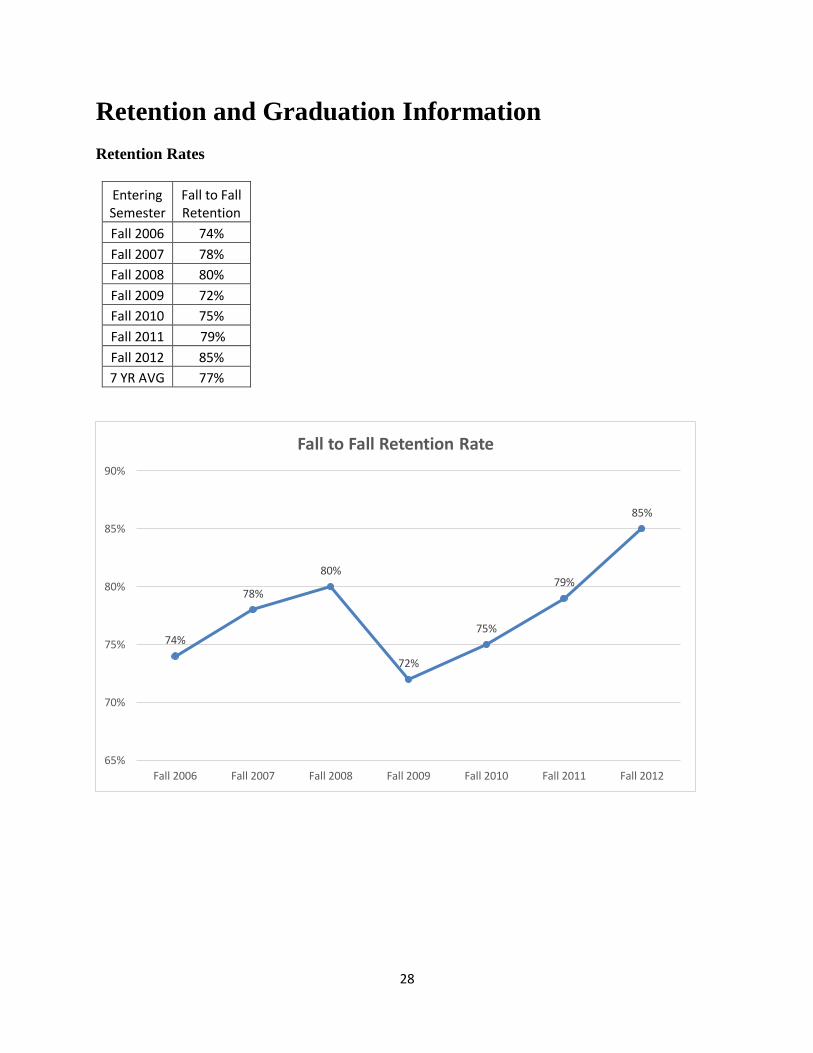
Retention and Graduation Information
Retention Rates
Entering Semester
Fall to Fall Retention
Fall 2006 74%
Fall 2007 78%
Fall 2008 80%
Fall 2009 72%
Fall 2010 75%
Fall 2011 79%
Fall 2012 85%
7 YR AVG 77%
74%
78%
80%
72%
75%
79%
85%
65%
70%
75%
80%
85%
90%
Fall 2006 Fall 2007 Fall 2008 Fall 2009 Fall 2010 Fall 2011 Fall 2012
Fall to Fall Retention Rate
29
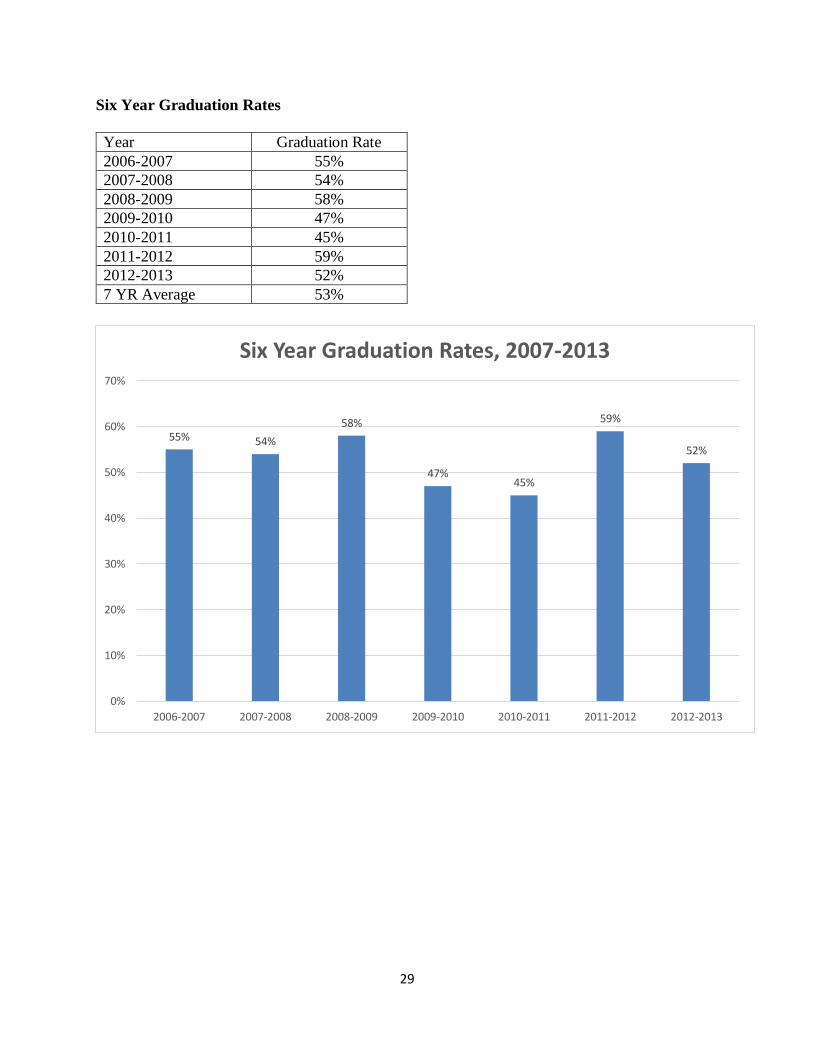
Six Year Graduation Rates
Year Graduation Rate
2006-2007 55%
2007-2008 54%
2008-2009 58%
2009-2010 47%
2010-2011 45%
2011-2012 59%
2012-2013 52%
7 YR Average 53%
55% 54%
58%
47%45%
59%
52%
0%
10%
20%
30%
40%
50%
60%
70%
2006-2007 2007-2008 2008-2009 2009-2010 2010-2011 2011-2012 2012-2013
Six Year Graduation Rates, 2007-2013
30
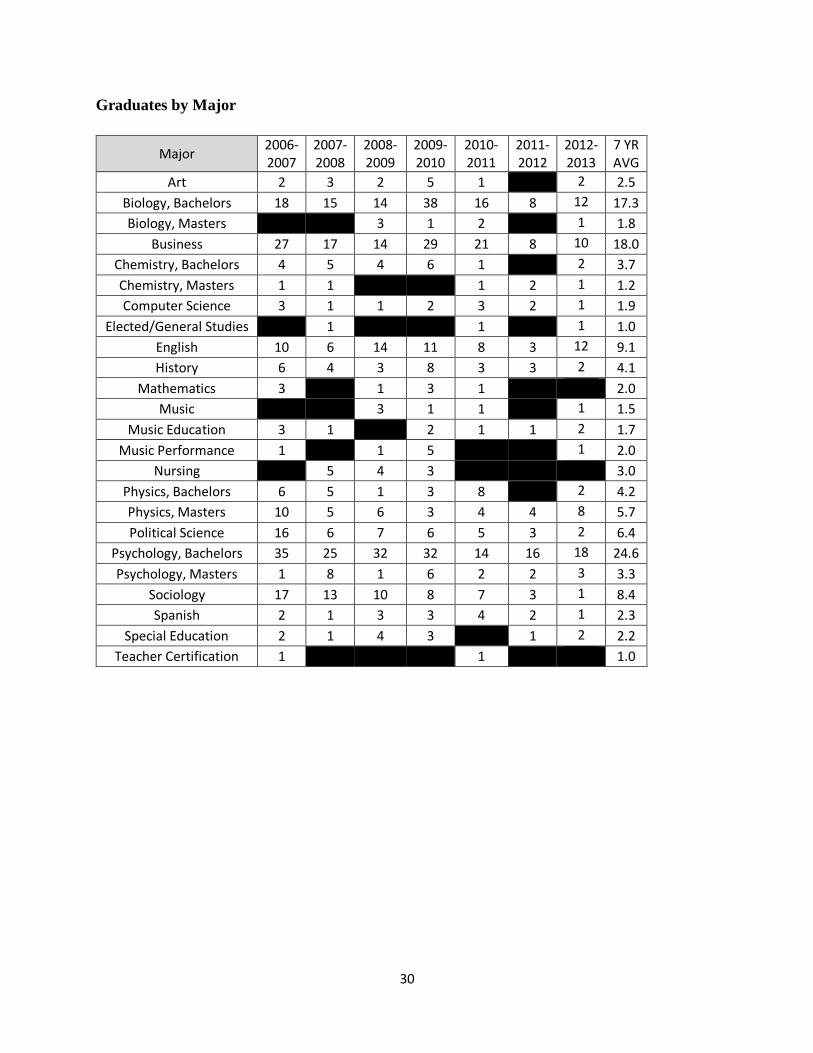
Graduates by Major
Major 2006-2007
2007-2008
2008-2009
2009-2010
2010-2011
2011-2012
2012-2013
7 YR AVG
Art 2 3 2 5 1 2 2.5
Biology, Bachelors 18 15 14 38 16 8 12 17.3
Biology, Masters 3 1 2 1 1.8
Business 27 17 14 29 21 8 10 18.0
Chemistry, Bachelors 4 5 4 6 1 2 3.7
Chemistry, Masters 1 1 1 2 1 1.2
Computer Science 3 1 1 2 3 2 1 1.9
Elected/General Studies 1 1 1 1.0
English 10 6 14 11 8 3 12 9.1
History 6 4 3 8 3 3 2 4.1
Mathematics 3 1 3 1 2.0
Music 3 1 1 1 1.5
Music Education 3 1 2 1 1 2 1.7
Music Performance 1 1 5 1 2.0
Nursing 5 4 3 0 3.0
Physics, Bachelors 6 5 1 3 8 2 4.2
Physics, Masters 10 5 6 3 4 4 8 5.7
Political Science 16 6 7 6 5 3 2 6.4
Psychology, Bachelors 35 25 32 32 14 16 18 24.6
Psychology, Masters 1 8 1 6 2 2 3 3.3
Sociology 17 13 10 8 7 3 1 8.4
Spanish 2 1 3 3 4 2 1 2.3
Special Education 2 1 4 3 1 2 2.2
Teacher Certification 1 1 1.0
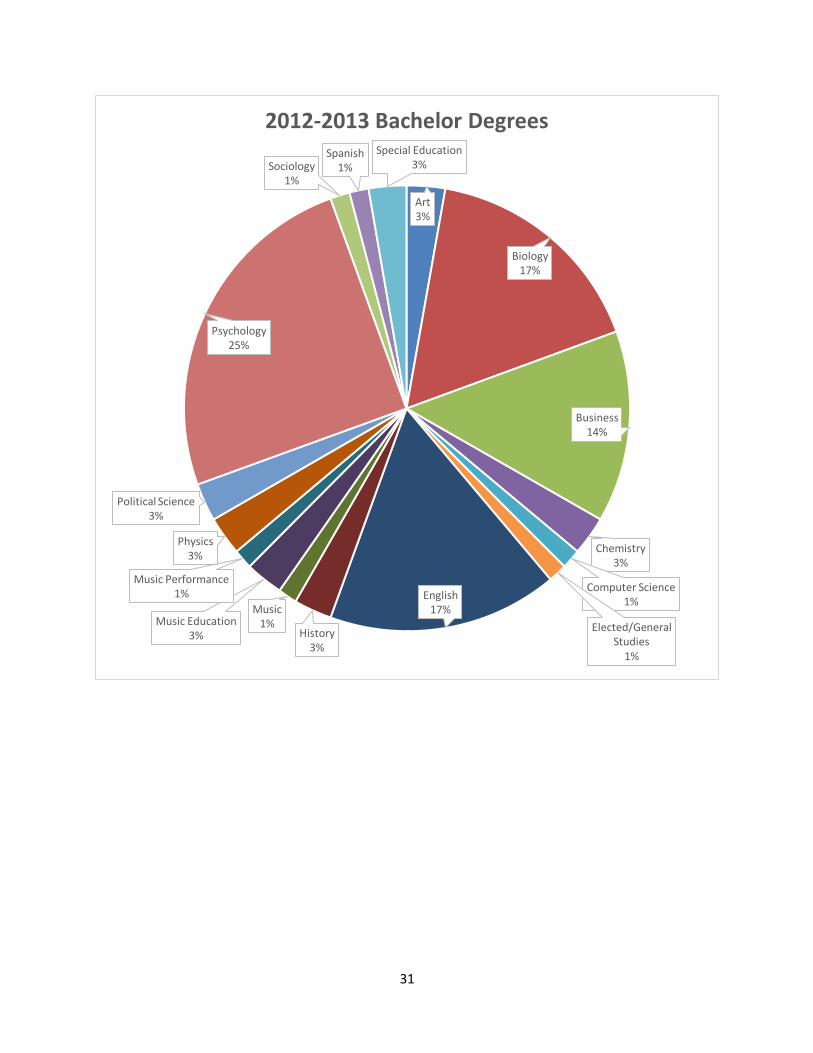
31
Art3%
Biology17%
Business14%
Chemistry3%
Computer Science1%
Elected/General Studies
1%
English17%
History3%
Music1%Music Education
3%
Music Performance1%
Physics3%
Political Science3%
Psychology25%
Sociology1%
Spanish1%
Special Education3%
2012-2013 Bachelor Degrees
32
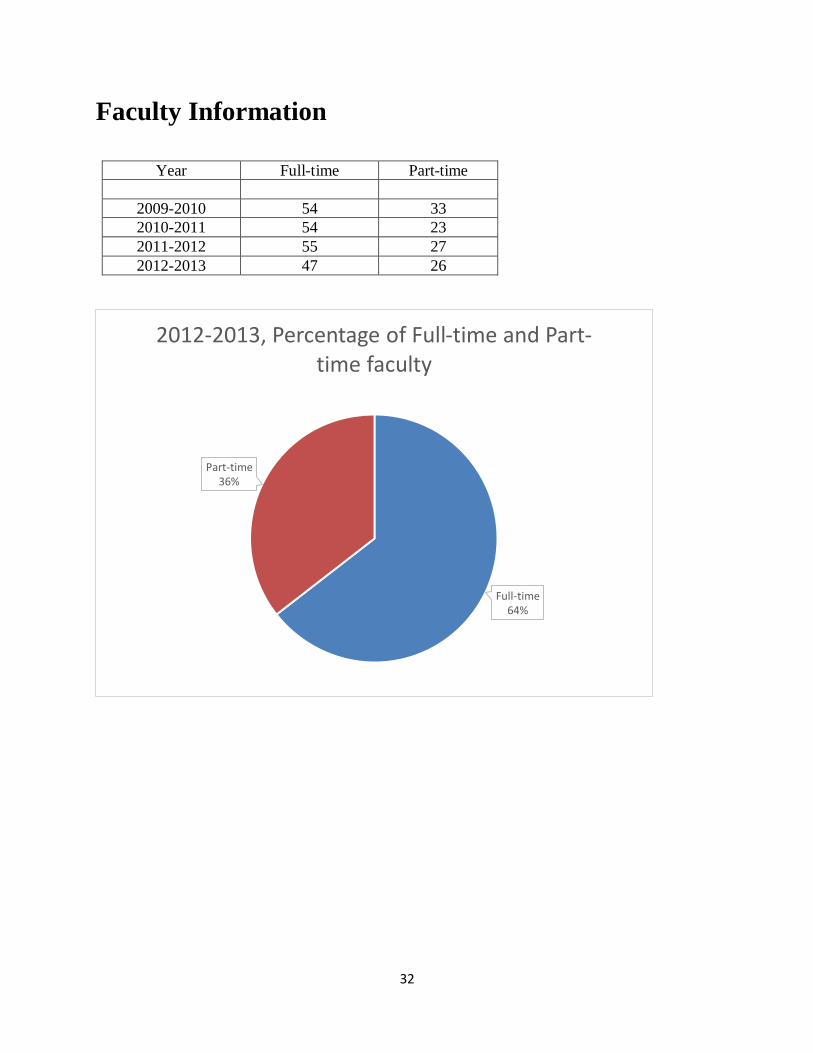
Faculty Information
Year Full-time Part-time
2009-2010 54 33
2010-2011 54 23
2011-2012 55 27
2012-2013 47 26
Full-time64%
Part-time36%
2012-2013, Percentage of Full-time and Part-time faculty
33
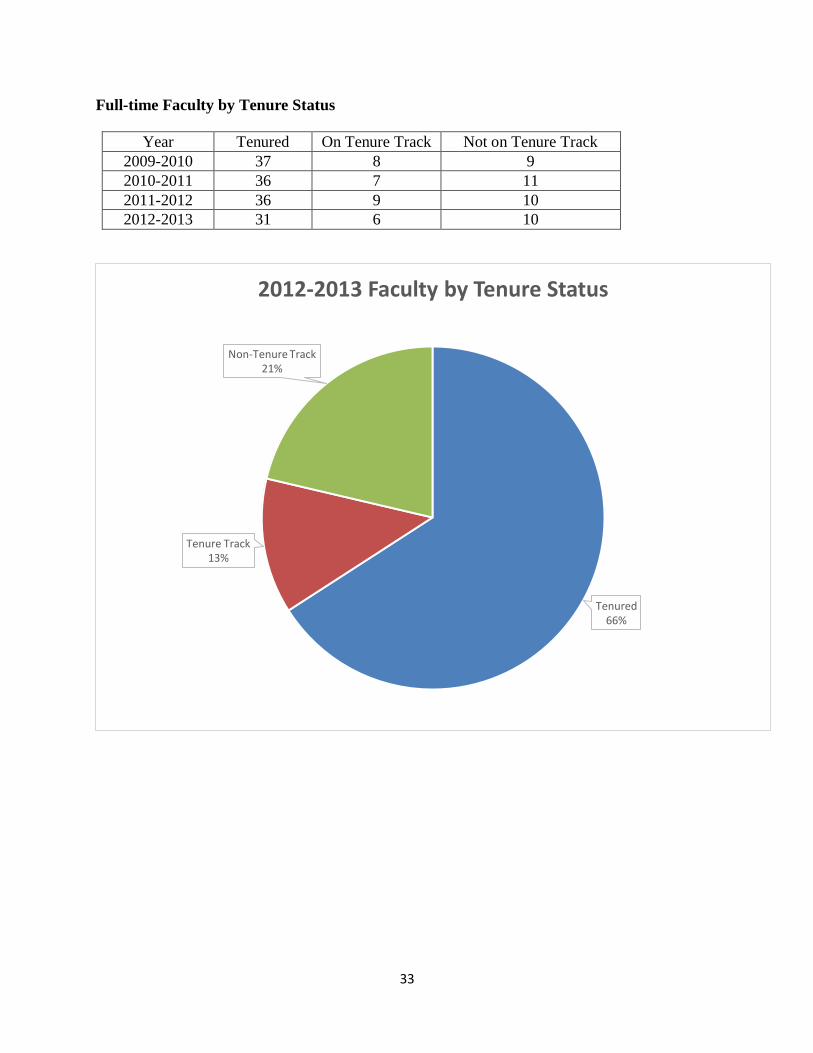
Full-time Faculty by Tenure Status
Year Tenured On Tenure Track Not on Tenure Track
2009-2010 37 8 9
2010-2011 36 7 11
2011-2012 36 9 10
2012-2013 31 6 10
Tenured66%
Tenure Track13%
Non-Tenure Track21%
2012-2013 Faculty by Tenure Status
34
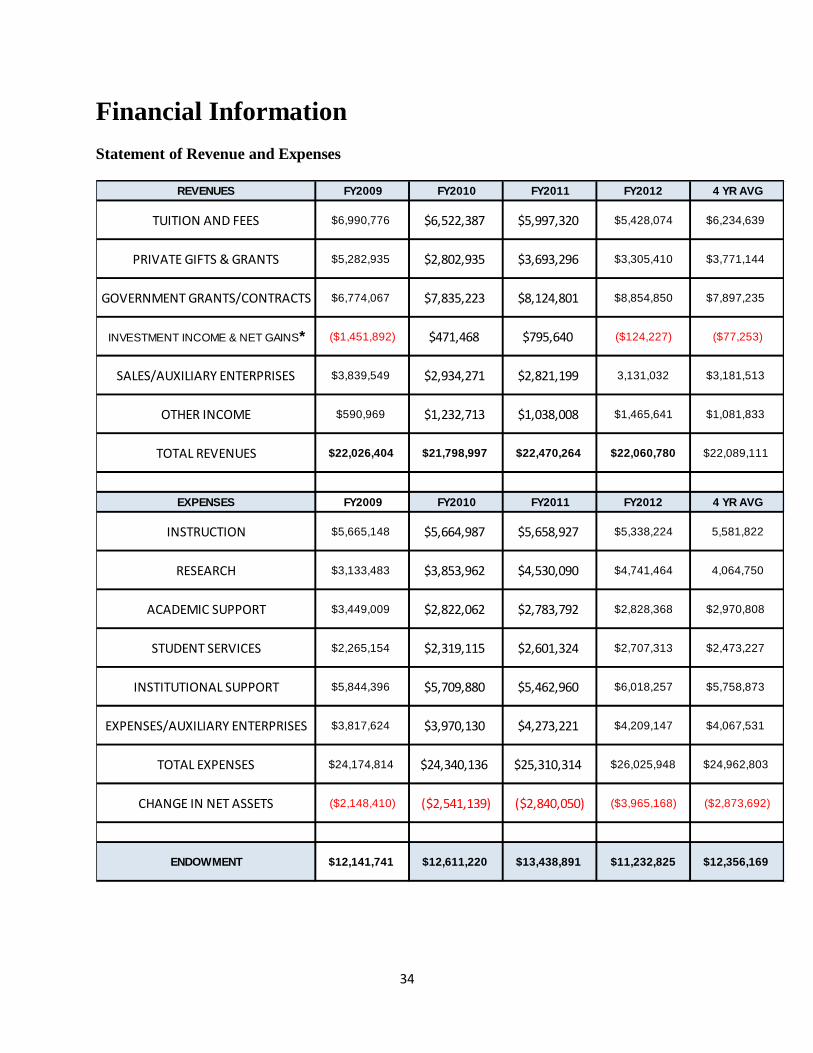
Financial Information
Statement of Revenue and Expenses
REVENUES FY2009 FY2010 FY2011 FY2012 4 YR AVG
EXPENSES FY2009 FY2010 FY2011 FY2012 4 YR AVG
ENDOWMENT $12,141,741 $12,611,220 $13,438,891 $11,232,825 $12,356,169
CHANGE IN NET ASSETS ($2,148,410) ($2,541,139) ($2,840,050) ($3,965,168) ($2,873,692)
TOTAL EXPENSES $24,174,814 $24,340,136 $25,310,314 $26,025,948 $24,962,803
EXPENSES/AUXILIARY ENTERPRISES $3,817,624 $3,970,130 $4,273,221 $4,209,147 $4,067,531
INSTITUTIONAL SUPPORT $5,844,396 $5,709,880 $5,462,960 $6,018,257 $5,758,873
STUDENT SERVICES $2,265,154 $2,319,115 $2,601,324 $2,707,313 $2,473,227
ACADEMIC SUPPORT $3,449,009 $2,822,062 $2,783,792 $2,828,368 $2,970,808
RESEARCH $3,133,483 $3,853,962 $4,530,090 $4,741,464 4,064,750
INSTRUCTION $5,665,148 $5,664,987 $5,658,927 $5,338,224 5,581,822
TOTAL REVENUES $22,026,404 $21,798,997 $22,470,264 $22,060,780 $22,089,111
OTHER INCOME $590,969 $1,232,713 $1,038,008 $1,465,641 $1,081,833
SALES/AUXILIARY ENTERPRISES $3,839,549 $2,934,271 $2,821,199 3,131,032 $3,181,513
INVESTMENT INCOME & NET GAINS* ($1,451,892) $471,468 $795,640 ($124,227) ($77,253)
GOVERNMENT GRANTS/CONTRACTS $6,774,067 $7,835,223 $8,124,801 $8,854,850 $7,897,235
PRIVATE GIFTS & GRANTS $5,282,935 $2,802,935 $3,693,296 $3,305,410 $3,771,144
TUITION AND FEES $6,990,776 $6,522,387 $5,997,320 $5,428,074 $6,234,639
35
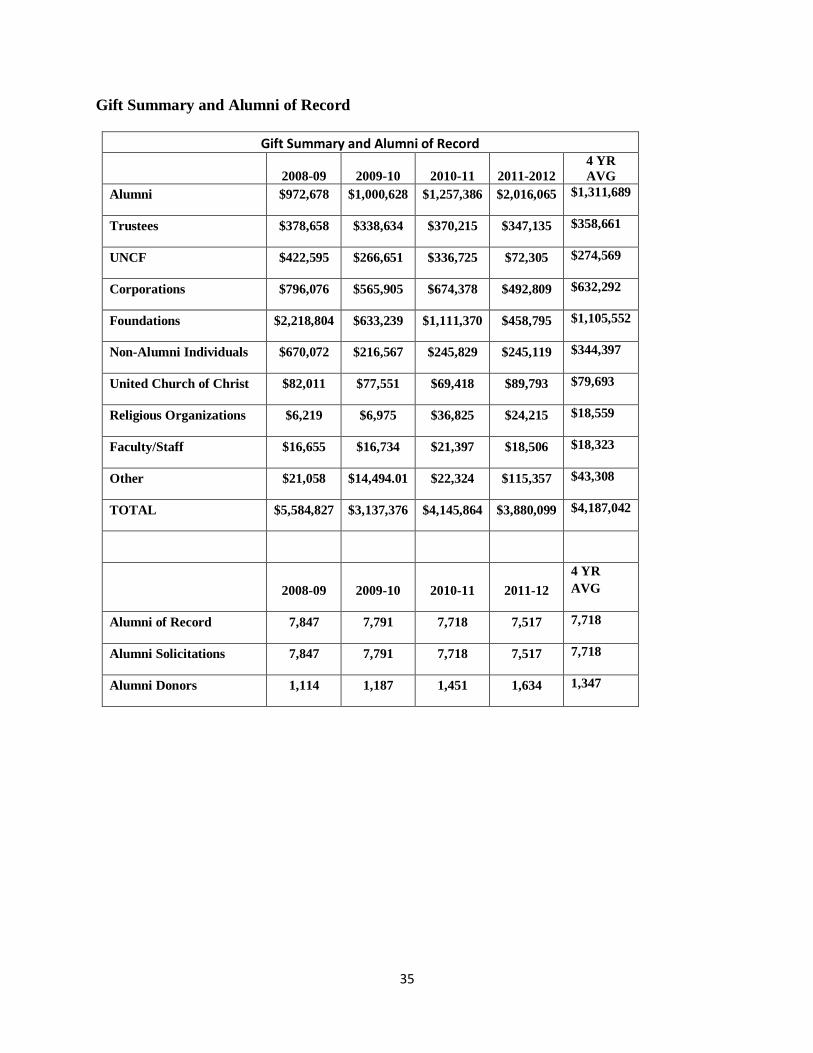
Gift Summary and Alumni of Record
Gift Summary and Alumni of Record
2008-09 2009-10 2010-11 2011-2012
4 YR
AVG
Alumni $972,678 $1,000,628 $1,257,386 $2,016,065 $1,311,689
Trustees $378,658 $338,634 $370,215 $347,135 $358,661
UNCF $422,595 $266,651 $336,725 $72,305 $274,569
Corporations $796,076 $565,905 $674,378 $492,809 $632,292
Foundations $2,218,804 $633,239 $1,111,370 $458,795 $1,105,552
Non-Alumni Individuals $670,072 $216,567 $245,829 $245,119 $344,397
United Church of Christ $82,011 $77,551 $69,418 $89,793 $79,693
Religious Organizations $6,219 $6,975 $36,825 $24,215 $18,559
Faculty/Staff $16,655 $16,734 $21,397 $18,506 $18,323
Other $21,058 $14,494.01 $22,324 $115,357 $43,308
TOTAL $5,584,827 $3,137,376 $4,145,864 $3,880,099 $4,187,042
2008-09 2009-10 2010-11 2011-12
4 YR
AVG
Alumni of Record 7,847 7,791 7,718 7,517 7,718
Alumni Solicitations 7,847 7,791 7,718 7,517 7,718
Alumni Donors 1,114 1,187 1,451 1,634 1,347


![Helhedssyn på fisk og fiskevarer - orbit.dtu.dk pÃ¥ fisk og fiskevarer[1].pdf · Konklusion Konklusionen på revurderingen af fisk som fødevarer er, at fisk er sundt, og at det](https://img.pdfslide.us/doc/110x75/5e1cd6af7d00775d4b1efebd/helhedssyn-p-fisk-og-fiskevarer-orbitdtudk-pf-fisk-og-fiskevarer1pdf.jpg)