Embed Size (px)
Citation preview

Fish Mercury Long Term Monitoring Annual Data Reports Methods
Massachusetts Department of Environmental Protection Office of Research and Standards
Boston, MA July 2010

FISH MERCURY LONG-TERM MONITORING ANNUAL DATA REPORTS METHODS
TABLE OF CONTENTS
List of Abbreviations .................................................................................................. ii
1.0 Program Overview ............................................................................................... 1
2.0 Materials and Methods………………………………………………............... 2
2.1 Field Sampling………………………………………………...................... 2
2.2 Laboratory Procedures……………………………………………….......... 4
2.2.1 Tissue Mercury Analysis………………………………………… 4
2.2.2 Water Quality Analysis…………………………………………… 4
2.2.3 Quality Control and Quality Assurance……………………………. 4
2.3 Data Analysis…………………………………………............................. 5
3.0 References……………………………………………….................................. 6
Appendices.................................................................................................................. 8
Appendix 1. Sampling Schedule………………………………………………. 9
Appendix 2. Lake Information………………………………………………… 10
Cover photo: Lake Lashaway, by Jane Rose
MassDEP i

FISH MERCURY LONG-TERM MONITORING ANNUAL DATA REPORTS METHODS
LIST OF ABBREVIATIONS
BCR ref. std. European Commission’s Community Bureau of Reference Standard Ca calcium Cl chloride Fe iron K potassium LMB largemouth bass (Micropterus salmoides) LT lake trout (Salvelinus namaycush) m meter MassDEP Massachusetts Department of Environmental Protection Mg magnesium
mg/kg milligrams per kilogram Mn manganese Na sodium NH3 ammonia NO2 nitrite NO3 nitrate ORS MassDEP’s Office of Research and Standards pH the negative log (base 10) of the molal concentration of hydrogen ions
(H+) in solution (acidity measure) SO4 sulfate Std. dev or s standard deviation Tot. P total phosphorus YP yellow perch (Perca flavescans)
MassDEP ii

FISH MERCURY LONG-TERM MONITORING ANNUAL DATA REPORTS METHODS
1.0 PROGRAM OVERVIEW
MassDEP’s Office of Research and Standards started a research program on mercury in freshwater fish in 1994, which continues today. The work is distinct from more limited fish sampling for a variety of contaminants conducted under the auspices of the Massachusetts Interagency Committee on Fish Toxics for the purposes of determining whether or not fish consumption advisories for lakes are needed.
In 2001, MassDEP established a long-term monitoring research program to track changes in mercury contamination of fish. The program objective is to document the magnitude and direction of year-to-year and long-term changes in edible muscle total mercury concentrations in LMB and YP in designated monitoring lakes. The initial stages of this effort coincided with reductions in mercury use and emissions in Massachusetts and the surrounding region.
This report presents the standard methods used throughout the program, along with background materials. Data from 1999 – 2004 are presented in Hutcheson et al (2006). Data for subsequent years will be available and posted as Annual Data Reports in the mercury section of MassDEP’s website (http://www.mass.gov/dep/). The Annual Data Reports do not include an interpretation of the fish mercury testing results. The purpose of the reports is to document the results of fish mercury testing. Interpretation of the data will be provided in a future report.
A number of complementary studies were also conducted. A study of seasonal variation in fish tissue mercury concentrations provided perspective on intra-annual variation in mercury and helped better design monitoring studies (MassDEP, 2006). A comparative food web mercury study in two similar lakes located near each other, but with different levels of mercury in top predator fish increased understanding of the ecological basis for varying patterns of mercury bioaccumulation seen in different lakes (MassDEP 2003a).
Wildlife are an integral part of any pond ecosystem. A first step toward addressing the risks mercury poses to animals that live in and around the water, for example, fish-eating birds such as loons, is to better understand their exposure from the food chain. As part of its overall program, Massachusetts has compiled information on mercury in wildlife (Pokras, et al 2006).
Data from studies on mercury in popular freshwater fish allow widespread screening of Massachusetts lakes for potential human health risks. The Massachusetts Department of Public Health (DPH) issues fish consumption advisories to address health hazards posed by eating mercury-contaminated fish.
Sediment and water quality of the lakes where fish have been studied were analyzed, and that data along with individual fish tissue mercury concentrations are available from a database access portal (http://public.dep.state.ma.us/fish/). The database contains total mercury concentrations in edible tissues (dorsal muscle). The identified reports may be consulted for details of analytical methodologies employed in particular parts of the program.
MassDEP 1
FISH MERCURY LONG-TERM MONITORING ANNUAL DATA REPORTS METHODS
Fish tissue data, water quality data and lake physical data from ORS’s research program are made available in the Annual Data Reports from the Long-Term Fish Monitoring Research Program.
2.0 MATERIALS AND METHODS
The program objective is to document the magnitude and direction of long-term changes in edible muscle total mercury concentrations in LMB and YP in the monitoring lakes. Approximately half the lakes designated as long term monitoring lakes are sampled on a rotating annual cycle. Dependent upon the degree of interannual variation observed between years in the initial stages of the program and available financial resources, the duration between repeat samplings may be changed in subsequent years. To date, in some years, additional numbers of lakes were sampled in regions of the state of particular interest, specifically the high mercury deposition area (Hutcheson et al. 2008) encompassing the northeast part of Massachusetts, in order to give more temporal and spatial resolution.
The criteria used to select long term monitoring lakes led us to choose lakes that:
• are in representative ecoregions of the state; • are in the predicted high mercury deposition area in northeast Massachusetts; • span the West–to-East distance across the state to reflect possible out-of-state long-range
atmospheric inputs with prevailing winds; • are positioned in urban and rural areas of the state; • were recommended by Massachusetts Basin Team leaders; • have protected watersheds; • are heavily fished; • provide habitat for species higher on the food chain than fish, such as loons, beavers and
turtles. • have been sampled previously.
2.1 FIELD SAMPLING
Fish are collected with box nets, gill nets, trot lines, electroshocking and rod and reel. They are removed from the water, rinsed with ambient water, wrapped individually in aluminum foil, placed in polyethylene Ziploc© bags and placed on ice for delivery to the laboratory within 24 hours of collection.
Fish are collected in the spring of each year to control for the variability which can be introduced by seasonal changes in fish tissue mercury concentrations (MassDEP 2005). In order to provide robust
MassDEP 2

FISH MERCURY LONG-TERM MONITORING ANNUAL DATA REPORTS METHODS
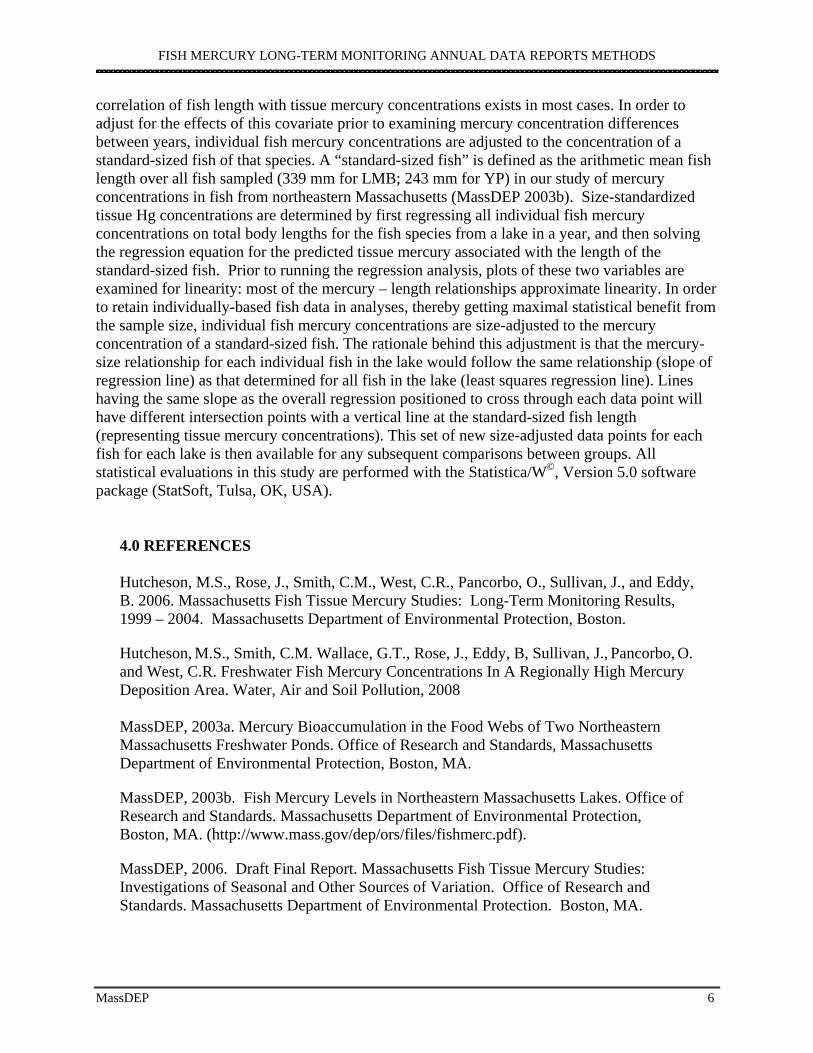
Figure 1. Locations of Long-Term Monitoring Lakes
MassDEP 3

FISH MERCURY LONG-TERM MONITORING ANNUAL DATA REPORTS METHODS
size/age ranges of LMB, a size spectrum of fish is collected. YP greater than 20-25 cm total length are sought to represent those consumed by anglers. Required numbers of replicate fish were determined using sample size calculation algorithms in Statistica©. Estimates of variance in the data from our previous studies were used along with a desired confidence level of 0.10 and power of 80% to calculate required sample sizes. Our calculations and consideration of practical issues including analytical costs and concerns over potential overharvesting of resident fish populations, led us to seek 30 replicate YP per lake per sampling event and 12-15 LMB. These sample sizes were estimated to have an ability to identify differences in means of approximately 40-50% in LMB and 15-20% in YP. In practice, there are occasions when it is not possible to obtain the desired numbers of fish.
Basic water quality measurements are obtained at one station at the deepest part of each lake at 1 m depth intervals with multiprobe field instruments. Temperature, pH, dissolved oxygen concentration and conductivity are measured. Dependent upon whether or not the water column is stratified at the time of sampling, either mid-epilimnion and hypolimnion water samples are taken or a single mid-depth sample is taken for analysis.
2.2 LABORATORY PROCEDURES
2.2.1 Tissue Mercury Analysis Fish are processed for analysis of mercury in lateral muscle in accordance with US EPA procedures (U.S. Environmental Protection Agency 1993). Total fish lengths and wet weights are recorded. The sex and reproductive condition of each fish was assessed by visual examination of gonads and classification as: Immature; Developing; Ripe; and Spent. Fish are occasionally classified as “resting” and “ripe and running”. Gonad wet weights are determined. Scales are removed from the fish for age analysis. Other details of handling and sample preparation are identical to those described in Rose et al. (1999).
Fish tissue mercury concentrations expressed on a wet weight basis are determined in accordance with US EPA procedures (U.S. Environmental Protection Agency 1993) and are described elsewhere ((Hutcheson et al. 2008)). For analyses performed through 2004 according to US EPA Method 245.6 (US EPA 1991), accuracy (i.e., Hg percent recovery from Hg-spiked fish samples) and precision (i.e., Hg relative percent difference among duplicate fish samples) in the analyses of fish samples were 103 ± 9.1 % and 4.0 ± 3.8 % (means ± 1 s) respectively. The accuracy of analyses of a mercury fish tissue reference standard consisting of freeze-dried tuna tissue (BCR ref. std #463) was 103 ± 4.7 % recovery. Mercury in all laboratory reagent blanks was less than the method detection limit (MDL) of 0.02 mg/kg. The analytical method was changed in 2005 to one following US EPA Method 7473 (US EPA 2007) using a Milestone DMA80 direct mercury analyzer. Details on an intercomparison of mercury concentrations determined with the two methods on the same tissue samples are available from the Office of Research and Standards. This method employs sample thermal decomposition, mercury amalgamation, and atomic absorption spectrophotometry. The method detection limit is 0.002 mg/kg and the reporting limit is 0.006 mg/kg.
MassDEP 4

FISH MERCURY LONG-TERM MONITORING ANNUAL DATA REPORTS METHODS
2.2.2 Water Analysis Water samples are analyzed for major cations and anions (Na, K, Ca, Mg, Fe, Mn, SO4, Cl), dissolved organic carbon content (DOC), total organic carbon content (TOC), nitrate+nitrite nitrogen, total phosphorus, and ammonia. The analytical techniques used for each and associated detection limits are provided in Table 1 and MassDEP (2005).
2.2.3 Quality Control And Quality Assurance Sample spikes and replicate analyses are conducted to determine precision. Freeze-dried tuna tissue (BCR ref. std. #463) is analyzed for mercury as a reference standard. All recoveries and precision estimates are within the EPA Method 7473 Acceptance Criteria. Mercury in all laboratory reagent blanks is less than the method detection limit.
Table 1. Analytical Methods for Water Quality
Analyte Method
Reporting Limit, mg/L
Method
Na 0.02 EPA 200.7 K 0.07 EPA 200.7 Ca 0.01 EPA 200.7 Mg 0.005 EPA 200.7 SO4 0.06 EPA 300 Cl 0.07 EPA 300 Fe 0.01 EPA 200.7 Mn 0.005 EPA 200.7
TOC 0.2 EPA 415.1 DOC 0.2 EPA 415.1
Alkalinity 0.25 EPA 310.1 NO2 0.003 EPA 300.0 NO3 0.002 EPA 300.0 NH3 0.001 Standard
Methods. 4500-NH3 F
Tot. P 0.001 Standard Methods. 4500-P E
2.3 DATA ANALYSIS
Bivariate plots of individual fish mercury concentrations versus total fish length for each species for each lake are examined for outliers. Outliers are either corrected, if representing a data entry error, or excluded if outlying the sphere of the remainder of the data. The criterion for exclusion is a subjective determination that a data point falls well outside the range of others in the data set and/or represents a mercury/size relationship at odds with all the other data. A positive linear
MassDEP 5
FISH MERCURY LONG-TERM MONITORING ANNUAL DATA REPORTS METHODS
correlation of fish length with tissue mercury concentrations exists in most cases. In order to adjust for the effects of this covariate prior to examining mercury concentration differences between years, individual fish mercury concentrations are adjusted to the concentration of a standard-sized fish of that species. A “standard-sized fish” is defined as the arithmetic mean fish length over all fish sampled (339 mm for LMB; 243 mm for YP) in our study of mercury concentrations in fish from northeastern Massachusetts (MassDEP 2003b). Size-standardized tissue Hg concentrations are determined by first regressing all individual fish mercury concentrations on total body lengths for the fish species from a lake in a year, and then solving the regression equation for the predicted tissue mercury associated with the length of the standard-sized fish. Prior to running the regression analysis, plots of these two variables are examined for linearity: most of the mercury – length relationships approximate linearity. In order to retain individually-based fish data in analyses, thereby getting maximal statistical benefit from the sample size, individual fish mercury concentrations are size-adjusted to the mercury concentration of a standard-sized fish. The rationale behind this adjustment is that the mercury-size relationship for each individual fish in the lake would follow the same relationship (slope of regression line) as that determined for all fish in the lake (least squares regression line). Lines having the same slope as the overall regression positioned to cross through each data point will have different intersection points with a vertical line at the standard-sized fish length (representing tissue mercury concentrations). This set of new size-adjusted data points for each fish for each lake is then available for any subsequent comparisons between groups. All statistical evaluations in this study are performed with the Statistica/W©, Version 5.0 software package (StatSoft, Tulsa, OK, USA).
4.0 REFERENCES
Hutcheson, M.S., Rose, J., Smith, C.M., West, C.R., Pancorbo, O., Sullivan, J., and Eddy, B. 2006. Massachusetts Fish Tissue Mercury Studies: Long-Term Monitoring Results, 1999 – 2004. Massachusetts Department of Environmental Protection, Boston.
Hutcheson, M.S., Smith, C.M. Wallace, G.T., Rose, J., Eddy, B, Sullivan, J., Pancorbo, O. and West, C.R. Freshwater Fish Mercury Concentrations In A Regionally High Mercury Deposition Area. Water, Air and Soil Pollution, 2008
MassDEP, 2003a. Mercury Bioaccumulation in the Food Webs of Two Northeastern Massachusetts Freshwater Ponds. Office of Research and Standards, Massachusetts Department of Environmental Protection, Boston, MA.
MassDEP, 2003b. Fish Mercury Levels in Northeastern Massachusetts Lakes. Office of Research and Standards. Massachusetts Department of Environmental Protection, Boston, MA. (http://www.mass.gov/dep/ors/files/fishmerc.pdf).
MassDEP, 2006. Draft Final Report. Massachusetts Fish Tissue Mercury Studies: Investigations of Seasonal and Other Sources of Variation. Office of Research and Standards. Massachusetts Department of Environmental Protection. Boston, MA.
MassDEP 6

FISH MERCURY LONG-TERM MONITORING ANNUAL DATA REPORTS METHODS
Pokras, M., Tseng, F., Miconi, R., Murray, M. and Bremer, D., 2004. Mercury Bioaccumulation in Non-fish Vertebrates in Massachusetts: Compilation of Existing Resources and Recommendations for the Future. Wildlife Clinic, Tufts University School of Veterinary Medicine, North Grafton, MA.
Rose J, Hutcheson MS, West CR, Pancorbo O, Hulme K, Cooperman A, Decesare G, Isaac R, Screpetis A. 1999. Fish Mercury Distribution in Massachusetts, USA Lakes. Environmental Toxicology And Chemistry 18(7):1370-9.
U.S. Environmental Protection Agency. 1991. Method 245.6 Determination of mercury in tissues by cold vapor spectrometry. Revision 2.3. Cincinnati, Ohio.
U.S. Environmental Protection Agency. 1993. Guidance for Assessing Chemical Contaminant Data for Use in Fish Advisories, Vol. 1. Fish Sampling and Analysis. EPA 823-R-93-002. Washington, DC.
U.S. Environmental Protection Agency. 2007. Method 7473. Mercury in solids and solutions by thermal decomposition, amalgamation, and atomic absorption spectrophotometry.
MassDEP 7

FISH MERCURY LONG-TERM MONITORING ANNUAL DATA REPORTS METHODS
APPENDICES
MassDEP 8
FISH MERCURY LONG-TERM MONITORING ANNUAL DATA REPORTS METHODS
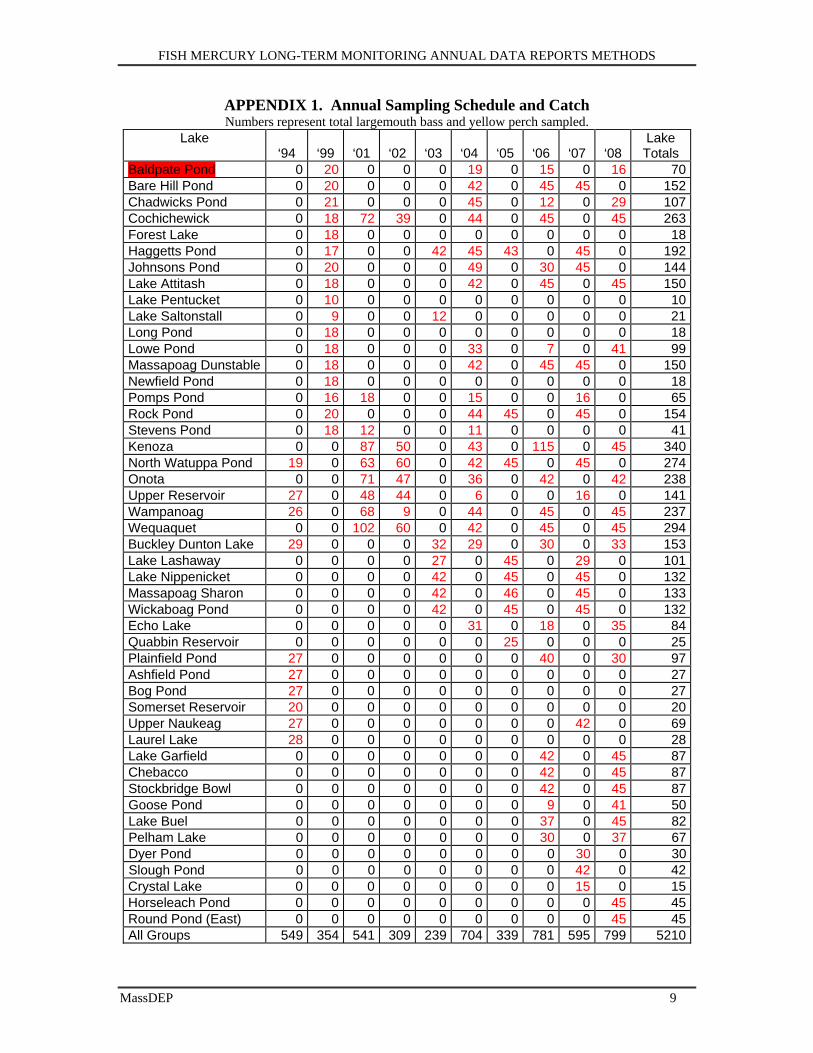
APPENDIX 1. Annual Sampling Schedule and Catch Numbers represent total largemouth bass and yellow perch sampled.
Lake ‘94 ‘99 ‘01 ‘02 ‘03 ‘04 ‘05 ‘06 ‘07 ‘08
Lake Totals
Baldpate Pond 0 20 0 0 0 19 0 15 0 16 70 Bare Hill Pond 0 20 0 0 0 42 0 45 45 0 152 Chadwicks Pond 0 21 0 0 0 45 0 12 0 29 107 Cochichewick 0 18 72 39 0 44 0 45 0 45 263 Forest Lake 0 18 0 0 0 0 0 0 0 0 18 Haggetts Pond 0 17 0 0 42 45 43 0 45 0 192 Johnsons Pond 0 20 0 0 0 49 0 30 45 0 144 Lake Attitash 0 18 0 0 0 42 0 45 0 45 150 Lake Pentucket 0 10 0 0 0 0 0 0 0 0 10 Lake Saltonstall 0 9 0 0 12 0 0 0 0 0 21 Long Pond 0 18 0 0 0 0 0 0 0 0 18 Lowe Pond 0 18 0 0 0 33 0 7 0 41 99 Massapoag Dunstable 0 18 0 0 0 42 0 45 45 0 150 Newfield Pond 0 18 0 0 0 0 0 0 0 0 18 Pomps Pond 0 16 18 0 0 15 0 0 16 0 65 Rock Pond 0 20 0 0 0 44 45 0 45 0 154 Stevens Pond 0 18 12 0 0 11 0 0 0 0 41 Kenoza 0 0 87 50 0 43 0 115 0 45 340 North Watuppa Pond 19 0 63 60 0 42 45 0 45 0 274 Onota 0 0 71 47 0 36 0 42 0 42 238 Upper Reservoir 27 0 48 44 0 6 0 0 16 0 141 Wampanoag 26 0 68 9 0 44 0 45 0 45 237 Wequaquet 0 0 102 60 0 42 0 45 0 45 294 Buckley Dunton Lake 29 0 0 0 32 29 0 30 0 33 153 Lake Lashaway 0 0 0 0 27 0 45 0 29 0 101 Lake Nippenicket 0 0 0 0 42 0 45 0 45 0 132 Massapoag Sharon 0 0 0 0 42 0 46 0 45 0 133 Wickaboag Pond 0 0 0 0 42 0 45 0 45 0 132 Echo Lake 0 0 0 0 0 31 0 18 0 35 84 Quabbin Reservoir 0 0 0 0 0 0 25 0 0 0 25 Plainfield Pond 27 0 0 0 0 0 0 40 0 30 97 Ashfield Pond 27 0 0 0 0 0 0 0 0 0 27 Bog Pond 27 0 0 0 0 0 0 0 0 0 27 Somerset Reservoir 20 0 0 0 0 0 0 0 0 0 20 Upper Naukeag 27 0 0 0 0 0 0 0 42 0 69 Laurel Lake 28 0 0 0 0 0 0 0 0 0 28 Lake Garfield 0 0 0 0 0 0 0 42 0 45 87 Chebacco 0 0 0 0 0 0 0 42 0 45 87 Stockbridge Bowl 0 0 0 0 0 0 0 42 0 45 87 Goose Pond 0 0 0 0 0 0 0 9 0 41 50 Lake Buel 0 0 0 0 0 0 0 37 0 45 82 Pelham Lake 0 0 0 0 0 0 0 30 0 37 67 Dyer Pond 0 0 0 0 0 0 0 0 30 0 30 Slough Pond 0 0 0 0 0 0 0 0 42 0 42 Crystal Lake 0 0 0 0 0 0 0 0 15 0 15 Horseleach Pond 0 0 0 0 0 0 0 0 0 45 45 Round Pond (East) 0 0 0 0 0 0 0 0 0 45 45 All Groups 549 354 541 309 239 704 339 781 595 799 5210
MassDEP 9

FISH MERCURY LONG-TERM MONITORING ANNUAL DATA REPORTS METHODS
APPENDIX 2. INFORMATION FOR ALL LAKES SAMPLED IN THE LONG TERM MONITORING PROGRAM
Water body Town PALIS# Watershed Acres Lat./ Long. Attitash Amesbury 84002 Merrimack 368 42.851, -70.983 Baldpate Boxford 91001 Merrimack 59 42.699, -71.002 Bare Hill Harvard 81007 Nashua 768 42.490, -71.598 Buckley Dunton Becket 32013 Westfield 145 42.313, -73.138 Chadwicks Haverhill, Boxford 84006 Merrimack 173 42.742, -71.080 Chebacco Essex, Hamilton 93014 No. Shore 207 42.611, -70.808 Cochichewick North Andover 84008 Merrimack 573 42.704, -71.097 Crystal Lake Orleans 96050 Cape Cod 33 41.774, -69.983 Dyer Wellfleet 96070 Cape Cod 10 41.937, -70.007 Echo Milford, Hopkinton 72035 Charles 105 42.192, -71.512 Goose Lee 21043 Housatonic 238 42.284, -73.191 Haggetts Andover 84022 Merrimack 210 42.648, -71.199 Horseleech Truro 96144 Cape Cod 23 41.969, -70.006 Johnsons Groveland Boxford 84027 Merrimack 193 42.733, -71.052 Kenoza Haverhill 84028 Merrimack 240 42.792, -71.050 Buel Monterey 21014 Housatonic 194 42.171, -73.280 Garfield Monterey 21040 Housatonic 256 42.183, -73.195 Lashaway North & East Brookfield 36079 Chicopee 274 42.236, -72.046 Lowe Boxford 92034 Ipswich 35 42.676, -70.985 Massapoag Dunstable 81081 Nashua 111 42.649, -71.495 Massapoag Sharon 73030 Neponset 389 42.103, -71.177 Nippenicket Bridgewater 62131 Taunton 375 41.970, -71.039 North Watuppa Fall River 61004 Mount Hope 1700 41.706, -71.104
Bay Onota Pittsfield 21078 Housatonic 646 42.471, -73.279 Pelham Lake Rowe 33016 Deerfield 79 42.699, -72.889 Pentucket Haverhill 84051 Merrimack 37 42.791, -71.073 Plainfield Plainfield 33017 Deerfield 63 42.542, -72.957 Pomps Andover 83014 Shawsheen 25 42.636, -71.152 Quabbin Multiple towns 36129 Chicopee 24462 42.447, -72.272 Reservoir Rock Georgetown 91012 Parker 49 42.730, -71.006 Round(E) Truro 96260 Cape Cod 6 41.971, -70.010 Saltonstall Haverhill 84059 Merrimack 44 42.783, -71.066 Slough Truro 96298 Cape Cod 28 41.966, -70.012 Stevens North Andover 84064 Merrimack 22 42.691, -71.108 Stockbridge Bowl Stockbridge 21105 Housatonic 383 42.336, -73.317 Upper Naukeag Ashburnham 35090 Millers 31 42.658, -71.927 Upper Reservoir Westminster 35091 Millers 304 42.536, -71.968 Wampanoag Ashburnham Gardner 81151 Nashua 225 42.616, -71.965 Wequaquet Barnstable 96333 Cape Cod 573 41.670, -70.341 Wickaboag West Brookfield 36166 Chicopee 314 42.246, -72.156 PALIS# = Massachusetts pond and lake identification system number
MassDEP 10