Embed Size (px)
Citation preview
•
REPUBLIC or GHA�A
FISHERIES MANAGEMENT PLAN OF GHANA
A NATIONAL POLICY FOR THE MANAGEMENT OF
THE MARINE FISHERIES SECTOR
2015-2019
�ISHERIES MANAGEMENT PLAN OF GHANAI
I A NATIONAL POLICY FOR THE MANAGEMENT OF
THE MARINE FISHERIES SECTOR
2015-2019

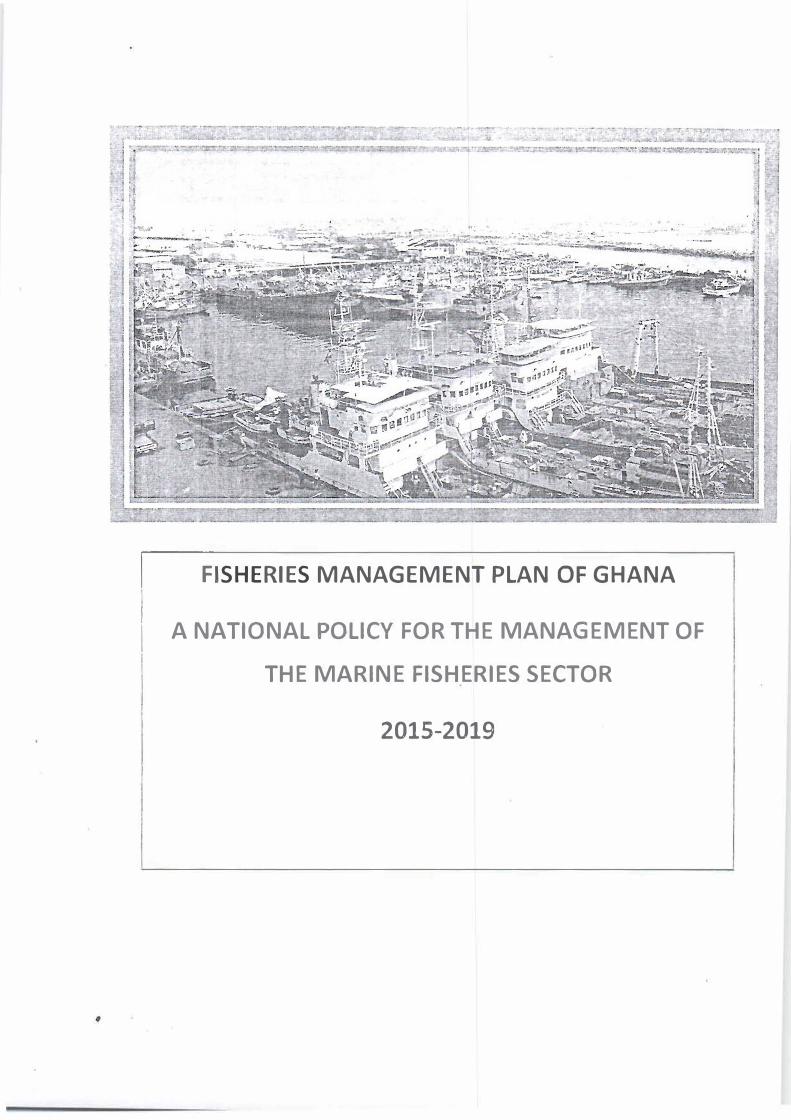
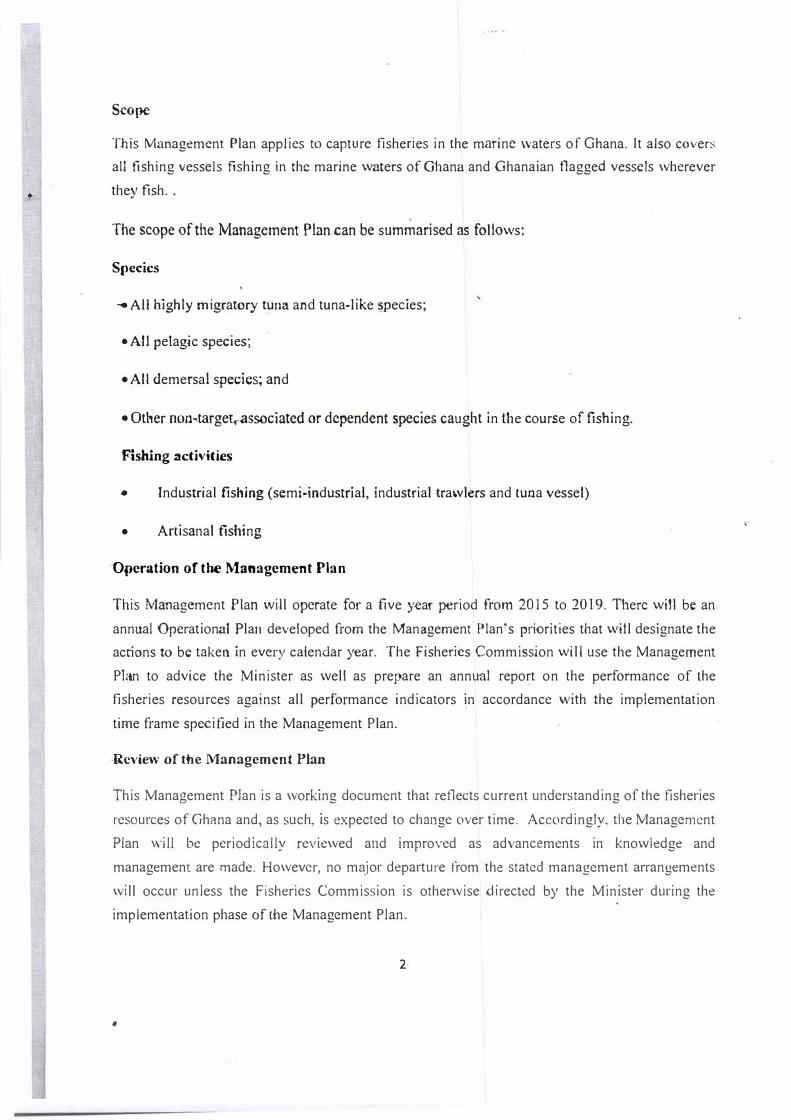
Canoes in Tema fishing port
•
The Ghana Government is fully
committed to implementing a robust
Fisheries Management Plan to ensure
long-term conservation of its fish
stocks whilst at the same time
contributing to improve food and
nutritional safety at a national level
Table of Contents
Definitions ..................................................................................................................................... iii
Abbreviations ............................................................................................. , .. - .....................•........... iv
Excaa.tive Summuy •. ••••.•............•...............................................•..•....•.................. .....•.......•....•......... , v
CHAPTER ONE - ™TR.ODUCTION ......................... ....................................................................... 1
Goal ... , ... . _ .. , ................................................................................ .' ..... -......................................... 1
Purpose .................................................................................................................................................................................. 1
Key Objectives .......... ................... ... . .' ................................. : .. _ ............................................. ·-............. I
Scope ...................................................................................................................................................................................... 2
Operation of the Management Plan ...................................................................................................................................... 2
Review of the Management Plan ........................................................................................................................................... 2
CHAPTER TWO - POLICY FRAMEWORK ....................................................................... ,_ ............. 3
Guiding Principles ................................................................................................................................................................. .S
CHAPTER THREE. INSTITUTIONAL FRAMEWORK ........................................................... ... ........ 7
Institutions responsible for the management of the fisheries resources of Ghana ................................................... 7
Ministry of Fisheries and Aquaculture Development. .................... ............... . . : ..... .................................... 1
The Fisheries Commission .................................................................................................................................................... 7
Inter.agency collaboration ..................................................................................................................................................... 7
CHAPTER FOUR· DESCR.Il'TION OF THE GHANAIAN FISHERIES SECT-OR .................................... 9
Ghana's Marine fishing sector ...... - . ....................... ....................................... . ...... ....... ........................ 9
Socio.economic importance of the fisheries sector ............................................................................................................. 12
The Tuna Sub·sector ............................................................................................................................................................ 12
'The industrial Sector ............................................................................................................................................ h .............. 13
fhe Setni•lndustrial sector ................................................................................................................. , ... m, .......................... 13
·The Anisanal Sector ........................................................................ -.................. -... .......... , .............................. " ..................... 13
j
CHAPTER FIVE -STATUS OF EXPLOITATION OF FISH STOCKS (FISHING EFFORT AND MAXIMUM
SUSTAINABLE YIELD (MSY) ........... ........................... ...................... ............................................ 14
Fishing Effort and Maximum Sustainable Yield ......... ......... . ...................................... .......... ................... 1-1
Key issues ....... ............................ ................ . .......... ...... .. . .... . ......... . ................................... ....... 15
CHAPTER SIX -ADDRESSING KEY ISSUES .................... .......... ..... ............................................... 16
Industrial Trawl fishery ........................................................................................................................................................ 17
Semi-Industrial fishery ......................................................................................................................................................... 19
Tuna and other large pelagic migratory species .................................................................................................................. 24
CHAPTER SEVEN -IMPLEMENTATION AND FINANCING OFTrIE MANAGEMENT PLAN ....... ....... 34
Table 1: The timeline for implementing Strategic Actions under the Fisheries Management Plan (2015-2019) ........ 34
38
High Prionty; Medium Priority and Low Priority ..................................................................................................... 38
Table 2: The Operational Plan 2015. This illustrates the means of implementing Strategic Actions under the Fisheries Management Pian (2015-20l9) and ,he mode of
enforcement ....................................................................................... 3739
Table 3: Financial Plan for year 1 (2015) ...................................................................................................... 40
References .............................................................. ................. ......... ....... ...................... . . . . . 47
Appendix ........................................................... ........................................................................... 48
ii
t
Definitions -"t - •.
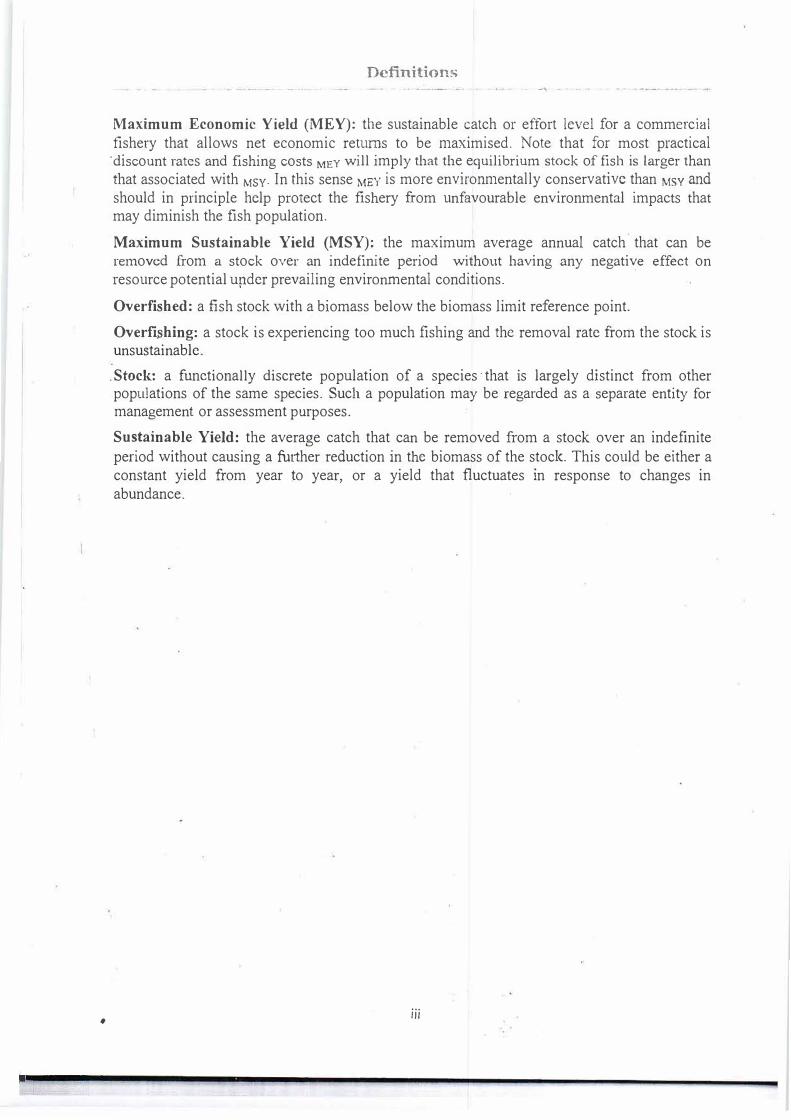
Maximum Economic Yield (MEY): the sustainable catch or effort level for a commercial fishery that allows net economic returns to be maximised. Note that for most practical 'discount rates and fishing costs MEY will imply that the equilibrium stock of fish is larger than that associated with MSY· In this sense MEY is more environmentally conservative than MSY and should in principle help protect the fishery from unfavourable environmental impacts that may diminish the fish population.
•
Maximum Sustainable Yield (MSY): the maximum average annual catch that can be removed from a stock over an indefinite period without having any negative effect on resource potential uµder prevailing environmental conditions.
Overfished: a fish stock with a biomass below the biomass limit reference point.
Overfishing: a stock is experiencing too much fishing and the removal rate from the stock is unsustainable
. Stock: a functionally discrete population of a species ·that is largely distinct from other populations of the same species. Such a population may be regarded as a separate entity for management or assessment purposes.
Sustainable Yield: the average catch that can be removed from a stock over an indefinite period without causing a fwther reduction in the biomass of the stock. This could be either a constant yield from year to year, or a yield that fluctuates in response to changes in abundance.
iii
•
BET
CCRF
CPUE
EEZ
EY
FAD
FAO
FMP
FSSD
GDP
FC
GRT
ICCAT
JEZ
IFMD
IUU
LOA
MEY
MOFAD
MSY
NHS
QA
RFMO
UNCED
VMS
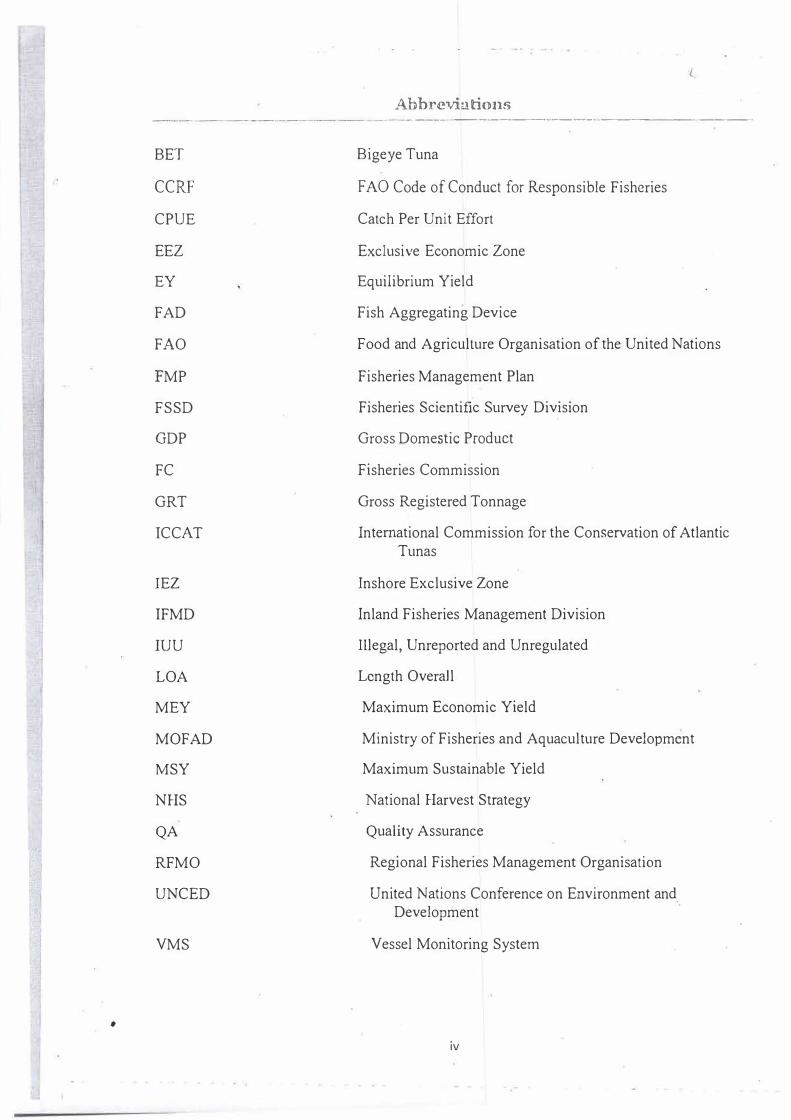
Abbreviations --· -- -- ---·-···-···------·--· ----------
Bigeye Tuna
F AO Code of Conduct for Responsible Fisheries
Catch Per Unit Effort
Exclusive Economic Zone
Equilibrium Yield
Fish Aggregating Device
Food and Agriculture Organisation of the United Nations
Fisheries Management Plan
Fisheries Scientific Survey Division
Gross Domestic Product
Fisheries Commission
Gross Registered Tonnage
International Commission for the Conservation of Atlantic Tunas
Inshore Exclusive Zone
Inland Fisheries Management Division
Illegal, Unreported and Unregulated
Length Overall
Maximum Economic Yield
Ministry of Fisheries and Aquaculture Development
Maximum Sustainable Yield
National Harvest Strategy
Quality Assurance
Regional Fisheries Management Organisation
United Nations Conference on Environment and Development
Vessel Monitoring System
iv
•
•
Executive Sun1�ary -- -------------·--·----·------- �-·�-------------- ----------·-·-
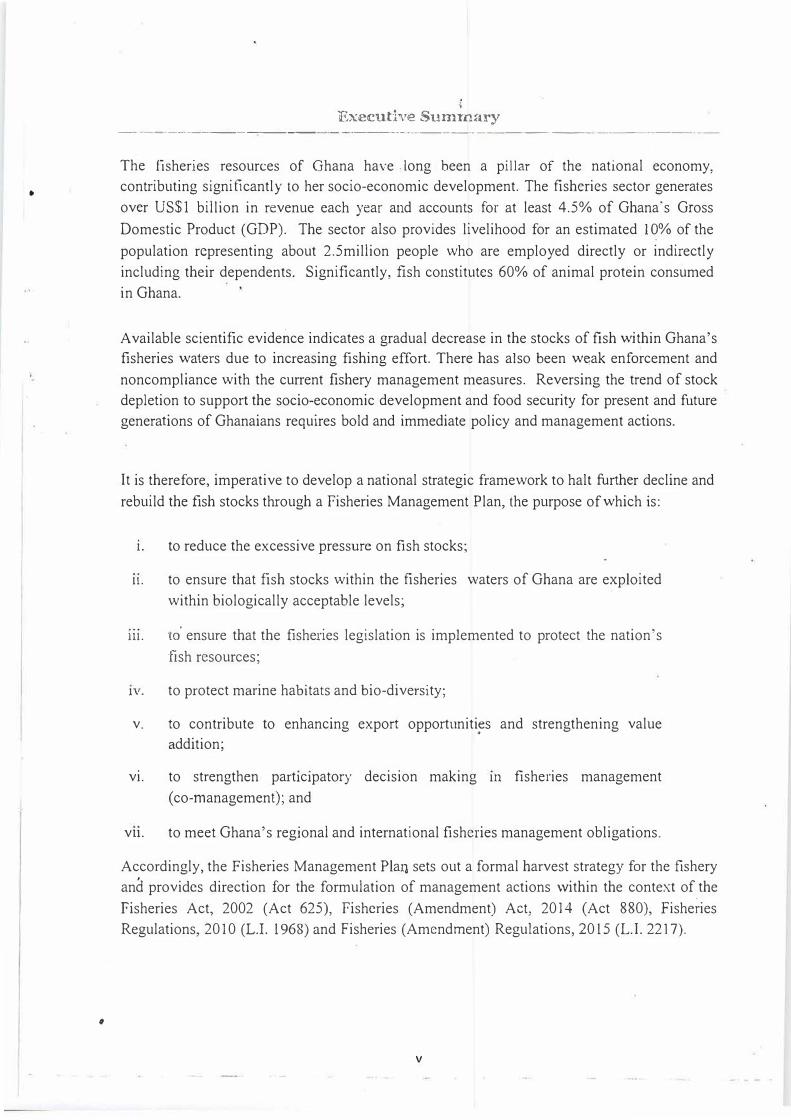
The fisheries resources of Ghana have long been a pillar of the national economy, contributing significantly to her socio-economic development. The fisheries sector generates over US$1 billion in revenue each year and accounts for at least 4.5% of Ghana's Gross Domestic Product (GDP). The sector also provides livelihood for an estimated I�% of the population representing about 2.5million people who are employed directly or indirectly including their dependents. Significantly, fish constitutes 60% of animal protein consumed in Ghana.
Available scientific evidence indicates a gradual decrease in the stocks of fish within Ghana's fisheries waters due to increasing fishing effort. There has also been w�ak enforcement and noncompliance with the current fishery management measures. Reversing the trend of stock depletion to support the socio-economic development and food security for present and future generations of Ghanaians requires bold and immediate policy and management actions.
It is therefore, imperative to develop a national strategic framework to halt further decline and rebuild the fish stocks through a Fisheries Management Plan, the purpose of which is:
1. to reduce the excessive pressure on fish stocks;
11. to ensure that fish stocks within the fisheries waters of Ghana are exploitedwithin biologically acceptable levels;
111. to' ensure that the fisheries legislation is implemented to protect the nation'sfish resources;
1v. to protect marine habitats and bio-diversity;
v. to contribute to enhancing export opportuniti�s and strengthening valueaddition;
vi. to strengthen part1c1patory decision making m fisheries management(co-management); and
v11. to meet Ghana's regional and international fisheries management obligations.
Accordingly, the Fisheries Management Plan sets out a formal harvest strategy for the fishery and provides direction for the formulation of management actions within the context of the Fisheries Act, 2002 (Act 625), Fisheries (Amendment) Act, 2014 (Act 880), Fishe�ies Regulations, 2010 (L.I. 1968) and Fisheries (Amendment) Regulations, 2015 (L.I. 2217) .
V
•
•
C!-L\I'TER ONE- -JNTRODUC110N
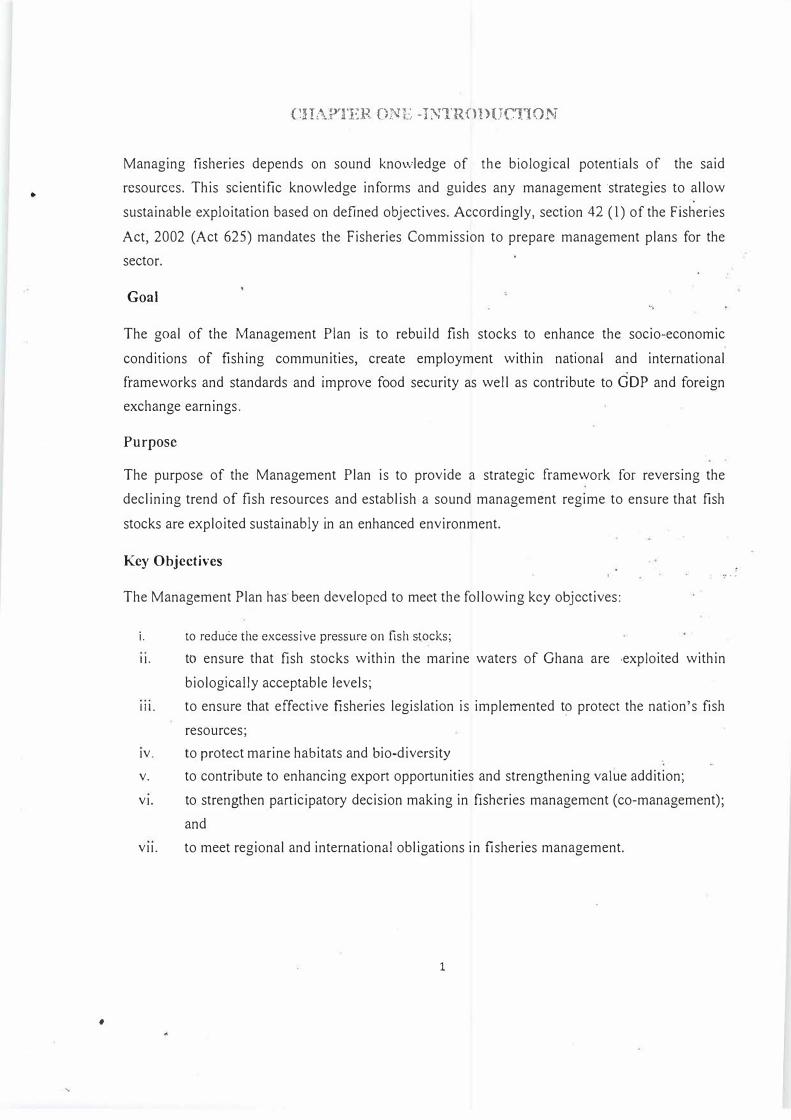
Managing fisheries depends on sound knowledge of the biological potentials of the said
resources. This scientific knowledge informs and guides any management ·strategies to allow
sustainable exploitation based on defined objectives. Accordingly, section 42 (1) of the Fisheries
Act, 2002 (Act 625) mandates the Fisheries Commission to prepare management plans for the
sector.
Goal
The goal of the Management Plan is to rebuild fish stocks to enhance the socio-economic
conditions of fishing communities, create employment within national and international
frameworks and standards and improve food security as well as contribute to GDP and fore.ign
exchange earnings.
Purpose
The purpose of the Management Plan is to provide a strategic framework for reversing the
declining trend of fish resources and establish a sound management regime to ensure that fish
stocks are exploited sustainably in an enhanced environment.
Key Objectives
The Management Plan has· been developed to meet the following key objectives:
i. to reduce the excessive pressure on fish s.t_ocks;
'1' · ·
11. to ensure that fish stocks within the marine waters of Ghana are ,exploited within
biologically acceptable levels;
111. to ensure that effective fisheries legislation is implemented t� protect the nation's fish
resources;
1v. to protect marine habitats and bio-diversity
v. to contribute to enhancing export opportunities and strengthening value addition;
v1. to strengthen participatory decision making in fisheries management (co-management);
and
v11. to meet regional and international obligations in fisheries management.
1
,.
SCO!)C
This Mar1agement Plan applies to capture fisheries in the marine waters of Ghana. It also covers
all fishing vessels fishing in the marine waters of Ghana and-Ghanaian flagged vessels wherever
they fish ..
The scope of the Management Plan can be summarised as fol1ows:
Species
... All highly migratory tuna and tuna•I ike species;
• A�! pelag4c species;
• All demersal species; and
• Other non·target�ssociated or dependent species caught in the course of fishing.
Fishlng activities
• Industrial fishing (semi•industrial, industrial trawlers and tuna vessel)
• Artisanal fishing
-Operation of the Management Plan
This Management Plan .will operate for a five year period from 2015 to 2019. There wit! be an
annual Operational Plan developed from the Management Plan's priorities that will designate the
actions to be taken in every calendar year. The Fisheries Commission will use the Management
Plan to advice the Minister as well as prepare an annual report on the performance of the
fisheries resources against all performance indicators in accordance with the implementation
time frame specified in the Management Plan.
-Review of the Management Plan
This Management Plan is a working document that reflects current understanding of the fisheries
resources of Ghana and, as such, is expected to change over time. Accordingly, the Management
Plan will be periodically reviewed and improved as advancements in knowledge and
management are made. However, no major departure from the stated management arrangements
will occur unless the Fisheries Commission is otherwise directed by the Minister during the
implementation phase of the Management Plan.
2
•
•
•
CHAPTER T\-VO -POLICY FR.i-\JVlE\VORJC
The current overall Government policy intent for the fisheries sector in Ghana is guided by
1. Ghana Shared Growth Development Agenda (GSGDA 11);
u. Fisheries Act, 2002 (Act 625) Fisheries (Amendment) Act, 2014 (Act 880), Fisheries
Regulations, 2010 (Lt 1968) and Fisheries (Amendment) Regulations, 2015 (L.I 2217);
m. the Republic-of Ghana Fisheries and Aquaculture Policy (2008); and
iv. the Ghana Fisheries and Aquaculture Sector Development Plan 2011-2016.
These provide a broad statutory and policy framework to ensure the ecologically sustainable management of Ghana's marine, estuarine and freshwater fisheries resources. Sectron-42(1) of the Fisheries Act; 2002 (Act 625) in particutar,. mandates the Fisheries Commission- to prepare
management plans to sustainably manage the f1&heries resources.
Section 42 - Fisheryplans
(-1) A fishery plan prepared by the Commission for the management and development of fisheries
shatl:
(a) be based on the best scienti:trc information available;
. (� ensure the optimum utilization of the fishery resources; and
(c) be consistent with good management priRcipies.
Section-43 of the Act 625 specifies tJfe content of a fisher>ies managemen� plan pursuant to
section·42 of the Act 62,5.
3
•
Section 43 - Content of a fishery plan
(1) A fishery plan shall:
(a) identify the fishery resource and its characteristics, including its economic and
social value and interrelationship with other species in the ecosystem;
(b) assess the present state of exploitation of each resource and taking into account
relevant biological, social, and economic factors, determine the potential average
annual yields from the resource;
(c) specify the measures to be taken to promote the development of the local fishing
enterprises, both industrial and artisanal:
(d) determine the amount of the fishery resource to be made available to licensed
foreign fishing vessels;
(e) specify the conservation measures to be enforced to protect the resources from
I, over-exploitation;
(f) indicate the research necessary to enhance management of the fishery r,=source;
(g) specify the information and any other data required to be given or reported for
the effective management and development of fisheries; and
(h) take into account relevant artisanal fishing methods or principles.
This Management Plan sets out management strategies and key performance measures to allow
for assessment of the degree to which these objectives are being achieved.
It also aims to achieve outcomes that are consistent with broader Government objectives for the
management of marine resources.
The Management Plan takes into account Ghana's obligations and commitments under the
following key International Instruments:
• The United Nations Convention on the Law of the Sea, 1982;
•
• the Convention establishing the International Commission for the Conservation of Atlantic Tunas (ICCAT) 1966 and its Recommendations;
• Agenda 21 - The United Nations Conference on Environment and Development(UNCED);
• The FAO Code of Conduct for Responsible Fisheries, 1995;
• FAO Compliance Agreement on Flag States, 1993;
• The UN Fish Stock Agreement on Flag State Responsibilities and Port State Measures;and
• FAO Guidelines on Flag State for Responsible Fisheries, 1997.
2.1 Guiding Principles
The following five key principles wiU provide guidance for the development of strategies for effective implementation of the Plan.
2.1.1 Equitable distribution of benefits
Ghana will develop sustainable, locally owned fisheries that can provide significant opportunities for delivering social benefits for the people.
2.1.2 Use of the precautiollary approach in management
This is a fundamental component of an eff�ctive risk management strategy. In support of this approach, Ghana will ensure that in the absence of adequate scientific information, conservation and protection systems will be put in place and regularly reviewed to ensure that no irreversible damage is caused to the habitat and the fisheries resources.
2.1.3 Participation, public accountability and transparency
Shared responsibility is an important part of managing the fisheries resources of Ghana. This Management Plan will promote collaboration, participatory decision making and shared responsibility with ail stakeholders. The Government will be accountable and transparent in the management of the fishedes resources of Ghana.
5

•
2.1.4 Limitation of adverse environmental impacts
The Government wi 11 ensure the conservation and protection of the fisheries resources and shall
uphold and apply the polluter pays principle in protecting marine habitat.
•2.1.5 £co-system Approach
This approach considers all components of the eco-system including, ethnic population. communities and habitat and their linkages as the basis for the conservation and sustainable use of the fisheries resources of Ghana.
6

•
The Institutions responsible for the management of the fisheries resources of Ghana include the following;
Ministry of Fisheries and Aquaculture Development (MO FAD)
MO FAD has oversight responsibility for the sustainable management of fisheries resources and
development of the fishing industry.
In this regard, MOFAD will:
1. obtain Cabinet approval for the implementation of the Management Plan;
11. provide financial resources for the implementation of the Management Plan;
HJ. supervise implementing institutions and agencies; and
1v. promote collaboration between the Fisheries Commission and Sub Regional, Regional
and International Fisheries Management Organisations in the implementation of the
Management Plan.
The Fisheries Commission
The Fisheries Commission is responsible for the following:
1. implementation of the Management Plan through the establishment of a Fisheries
Management Operational Committee;
11. developing the capacity of staff of the Fisheries Commission for effective
implementation of the Management Plan;
111. periodically reviewing the Management Plan;
1v. collaborating with relevant authorities and major stakeholders in the implementation of
Plan measures; and
v. coordinating the activities of all relevant stakeholders in the implementation of the Plan.
Inter-agency collaboration
In accordance with Section 13 of the Fisheries Act, 2002 (Act 625). the Fisheries Commission
shall collaborate with the following in the implementation of the Plan:
7
•
•
•
•
•
•
•
•
•
•
Ministry of Environment. Science and Technology (Environmental Protection Agency):
Ministry of Justice and Attorney-General's Department:
Ministry of Transport, Ghana Maritime Authority (G.iv1A) and Ghana Ports and Harbour
Authority (GPHA);
Ministry of Finance (MOF);
Ministry of Interior (Ghana Police Service);
Ministry of Defence (Ghana Navy ind Ghan:i Ai;-forcr;j:
Ministry of Trade (Ghana Standards Authority and Ghana Export Promotion Authority);
Ministry of Health {Food and Drugs Autho:ity): and
Research Institutions and Uni<.·ersifr::s .
This collaboration will be principally in the fo'.lo·wmg key areas:
e Monitoring, comr0! and surveiUan;.::e:
• National observer programme :
• Port samp!;!1g ;
• Compliance and enforcement :
• Data collecti0n ar.d :11:mag.ement :
• Control of fish Imports and Expons: and
• Designation of i\.britim� Protected Are2s : r-.lPAs } .
•
CUA .. f'TEH t'OCR- DFSC'RJ PTIO� OF THE ta[:\..:'\ii\..L\N FISHER1ES
SECTOR
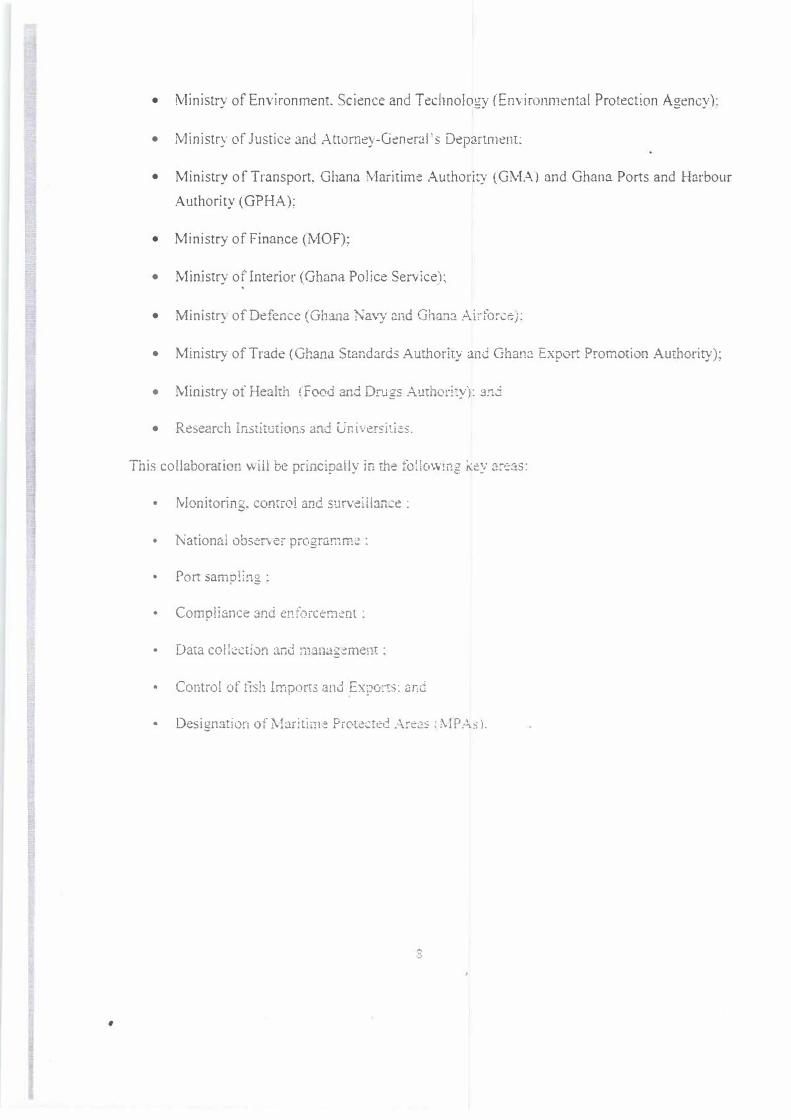
Ghana has a coastline of about 550km and a maritime domain, including the territorial sea and
the Exclusive Economic Zone (EEZ) of 228,000km2.The productivity of Ghana's marine
fisheries is driven by a coastal up welling system, when cold water rich in nutrients are brought
to the surface and stimulate the ecosystem. There are two up welling seasons in Ghana; a major up welling season from July through September, and a minor up welling season, from late December to early February. These are also the high seasons for fishing.
Ghana's Marine Fishing Sector
Ghana's marine fisheries capture sector consists of three main types of fishing fleets:
• Artisanal canoes (made of wood, motorised and non-motorised;
• Semi-industrial boats (mainly wooden boats); and
• Industrial vessels (generally over 25 m Length Overall (LOA) made of steel hull and
with capacity to operate in areas beyond national jurisdiction).
9
Artisr:nal Fleet
Numher <d l'C:sseis
• ;\,folorist!d - 8./58
• No11-11111/orised - 1 ./9 J
f> Totai
Fishing geur
lines, traps, pots
Targt�l sp�!cies
- 9951
- gillnl!ls, hand-
- surdinellos,
011dw1:y and mackerels
A1111110/ catch - 15./.000m/
10
•
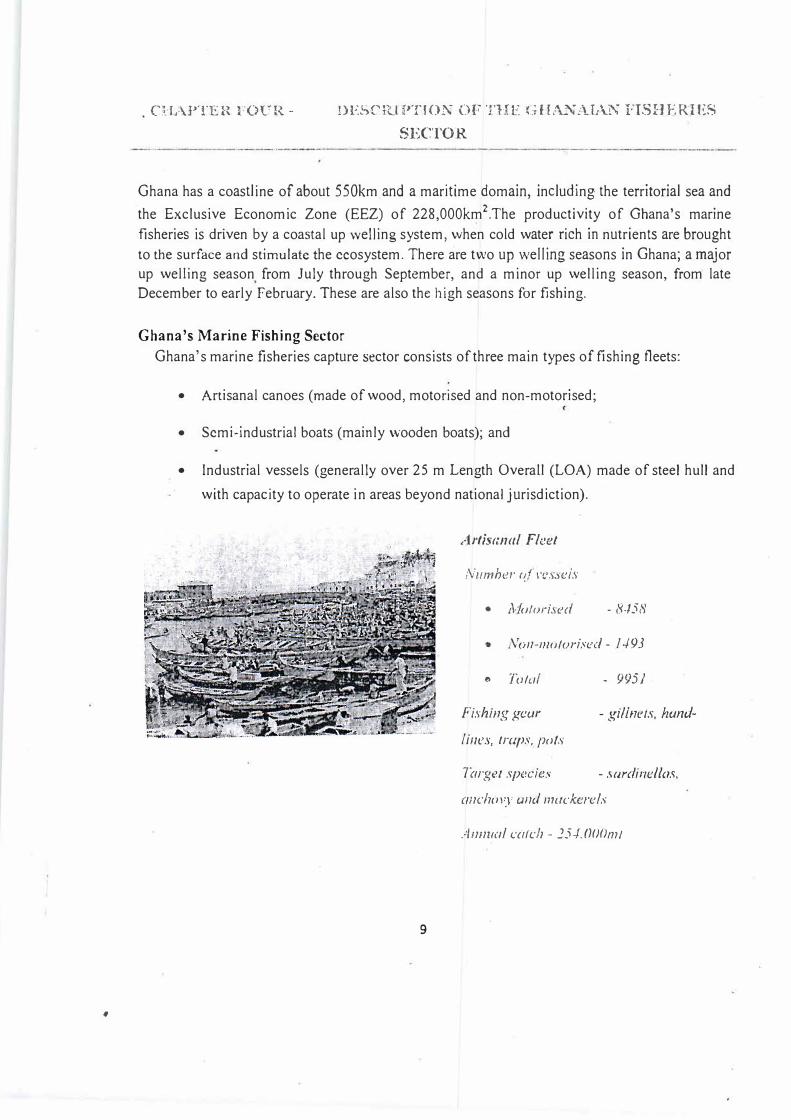
St!mi-imlustrial ( lllslwre) Fleet
.\'umber o(,·essds - ./03
Purse su i11c\·
Trmr/e;,
- 363
- ./ f)
- purse Sl!.ines end /row!
Turgr.:t vJe<.:ies - sarclinellas m11ckacis
unclgrunls
"1 mmol c:al<.:h - 6. {)()0 ml
Industrial Trawl Fleet
,\"umber (?(ressc!ls - 107
Fishi11g gear - hotlum truwl
Tor;ze1 species - sparids. groupers.
-c'!!lt!,)ish and snappers
Annual rn1ch - /85,0001111
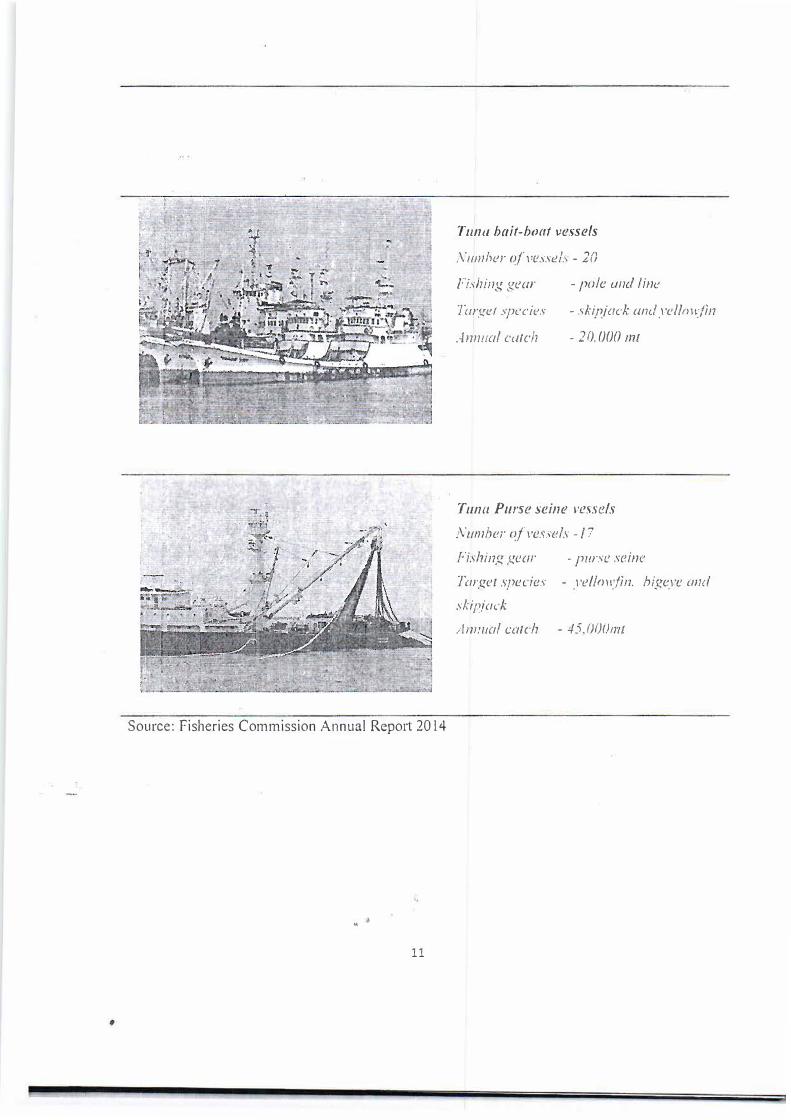
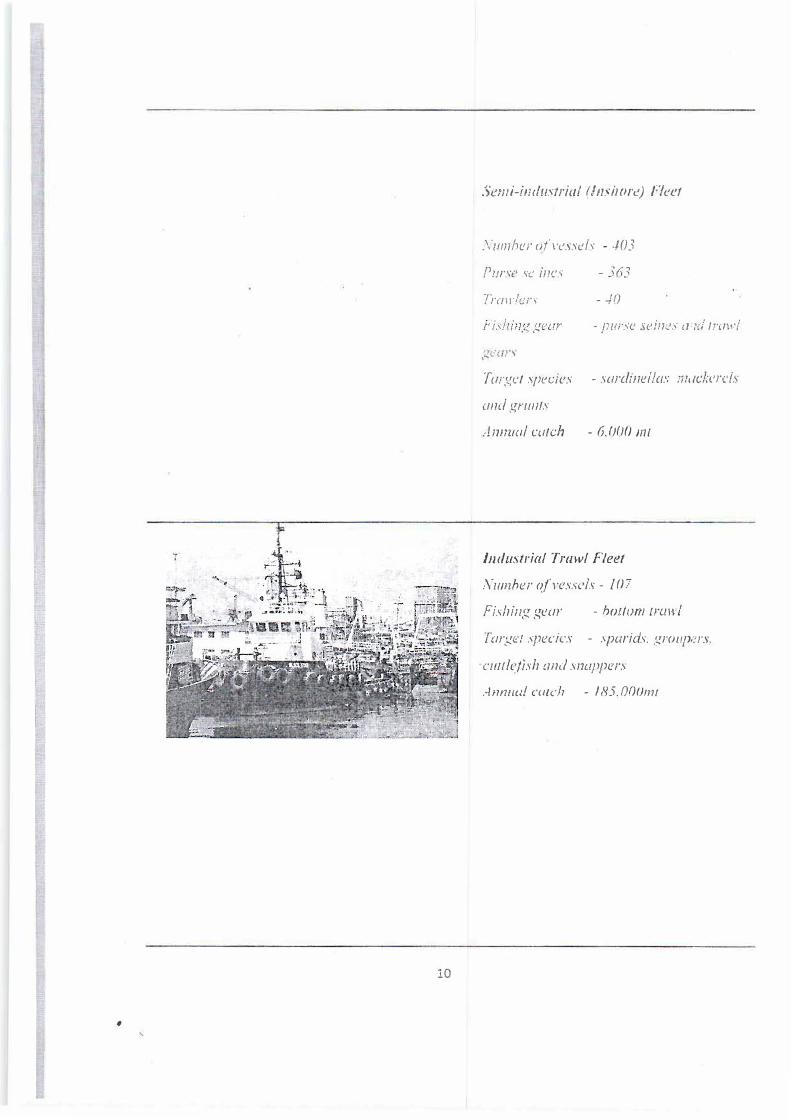
Source: Fisheries Commission Annual Report 2014
.; ..
11
Tuna bait-boat vessels
X11mher <�l vessel.\ - 20
Fishi1w oear '-..., ........
- pule w1d line
Target ::.pecies - skipjack undyellniifin
Annual catch - 2 0, OOO mt
Tuna Purse seine 1·esse/s
Xumher qf vesse!s -17
Fishing geor
Target species
skipjack
- purse seine
ve/1011:fin. higeve cmd
,lmnw/ catch - 45JJOOmt
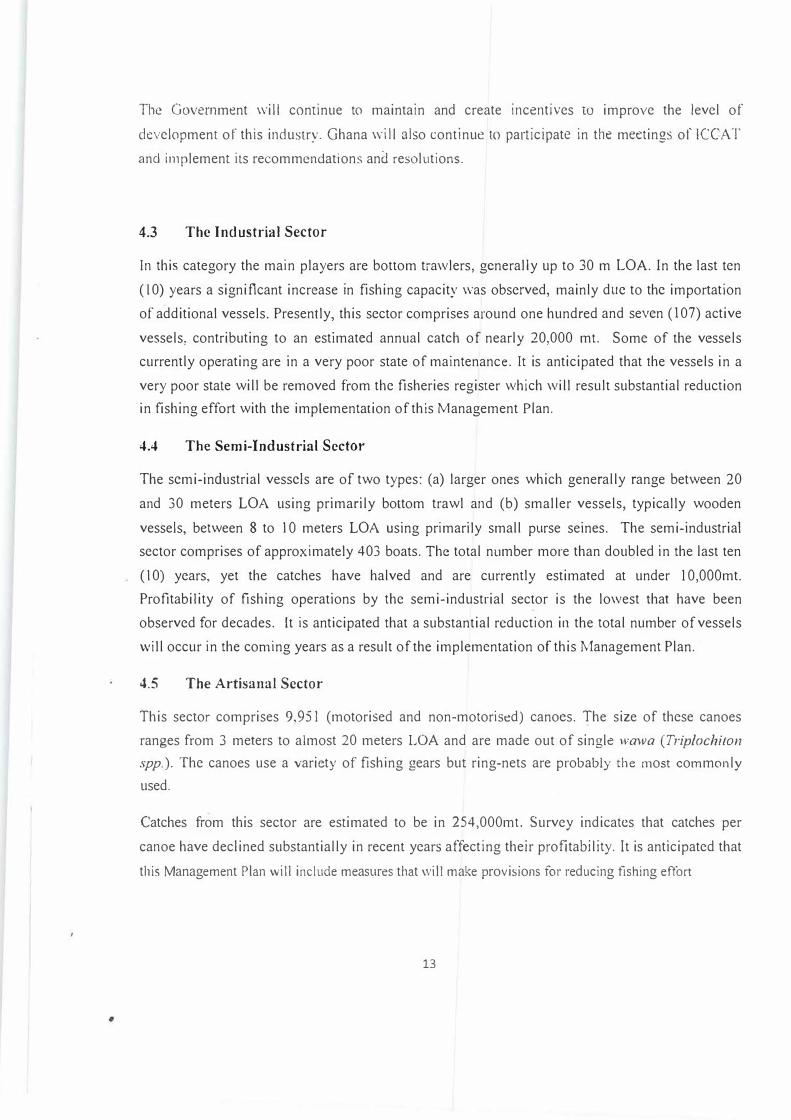
Ghanaian Fishing Vessels and Catch Data (2014)
The operational status and volumes of catch of Ghanaian fishing vessels areas specified below.
Number of Volume of catch vessels (mt)
Marine
Motorised canoes 8458 172,300 Non-motorised canoes 1493 81,900 Total canoes 9951 254,200 Semi-industrial 403 6,100 Trawlers 107 18,500
Bait boats 20 Tuna vessels Purse seine: 17 65,000 Grand total 343,800 Source: FSSD, 2014
4.1 Socio-economic importance of the fisheries sector
Catch per Percentage vessel
contribution (mt/vessel)
50.12 20.37
23.82 54.86 73.93 75.23 l.77 15.13 5.38 172.89
l 8.91 1756.75
Fish constitutes more than sixty percent (60%) of animal protein intake by the Ghanaian
population. Scientific evidence point to the fact that Ghana's marine, fish landings has declined
over the last decade. This has resulted in Ghana becoming a net importer of about forty percent
(40%) of her fish requirements. This figure is likely to increase in the coming years due to the
current population growth rate combined with the current dwindling trend in fish landings. This
will have significant implications to the coumry"s economy as a result of increase importation of
fish. Studies have also shown that aquaculture production would not be able to narrow this gap
anytime soon.
Given that a great share of the population relies upon fish and fish products as their main source
of protein, it is important to prevent the over exploitation of the fisheries resources.
4.2 The Tuna Sub-Sector
Tuna fishing occurs mainly in Ghana's EEZ, and on the high seas. The targeted stocks are
essentially those under the management of ICCA T. The tuna sub-sector has been benefitting
from a relatively good stability with current iandings estimated at around 65.000 mt per year. It
is likely that Ghana will maintain its position as one of the important regional hubs for tuna
landings.
12
The Government will continue to maintain and create incentives to improve the level of
development of this industry. Ghana will also continue tO participate in the meetings of ICCAT
and implement its recommendations and resolutions.
4.3 The Industrial Sector
In this category the main players are bottom trawlers, generally up to 30 m LOA. In the last ten
(10) years a signiflcant increase in fishing capacity was observed, mainly due to the importation
of additional vessels. Presently, this sector comprises around one hundred and seven (107) active
vessels, contributing to an estimated annual catch of nearly 20,000 mt. Some of the vessels
currently operating are in a very poor state of maintenance. It is anticipated that the vessels in a
very poor state will be removed from the fisheries register which will result substantial reduction
in fishing effort with the implementation of this Management Plan.
4.4 The Semi-Industrial Sector
The semi-industrial vessels are of two types: (a) larger ones which generally range between 20
and 30 meters LOA using primarily bottom trawl and (b) smaller vessels, typically wooden
vessels, between 8 to l O meters LOA using primarily small purse seines. The semi-industrial
sector comprises of approximately 403 boats. The total number more than doubled in the last ten
(10) years, yet the catches have halved and are currently estimated at under 1 O,OOOmt.
Profitability of fishing operations by the semi-industrial sector is the lowest that have been
observed for decades. It is anticipated that a substantial reduction in the total number of vessels
will occur in the corning years as a result of the implementation of this Management Plan.
4.5 The Artisanal Sector
This sector comprises 9,951 (motorised and non-motorised) canoes. The size of these canoes
ranges from 3 meters to almost 20 meters LOA and are made out of single ,1•awa (Triplochiton
spp.). The canoes use a variety of fishing gears but ring-nets are probably the most commonly
used.
Catches from this sector are estimated to be in 254,000mt. Survey indicates that catches per
canoe have declined substantially in recent years affecting their profitability. It is anticipated that
this Management Plan will include measures that will make provisions for reducing fishing effort
13
•
CHAPTER FIVE - STATUS OF F.XPLOITATIOI',; OF FlSH STOCKS (FISHING
E�'fORT A�I.i :i.fAXDIC:\-1 Sl"STAl� . .\lE E YI LLD C\lSY) .,
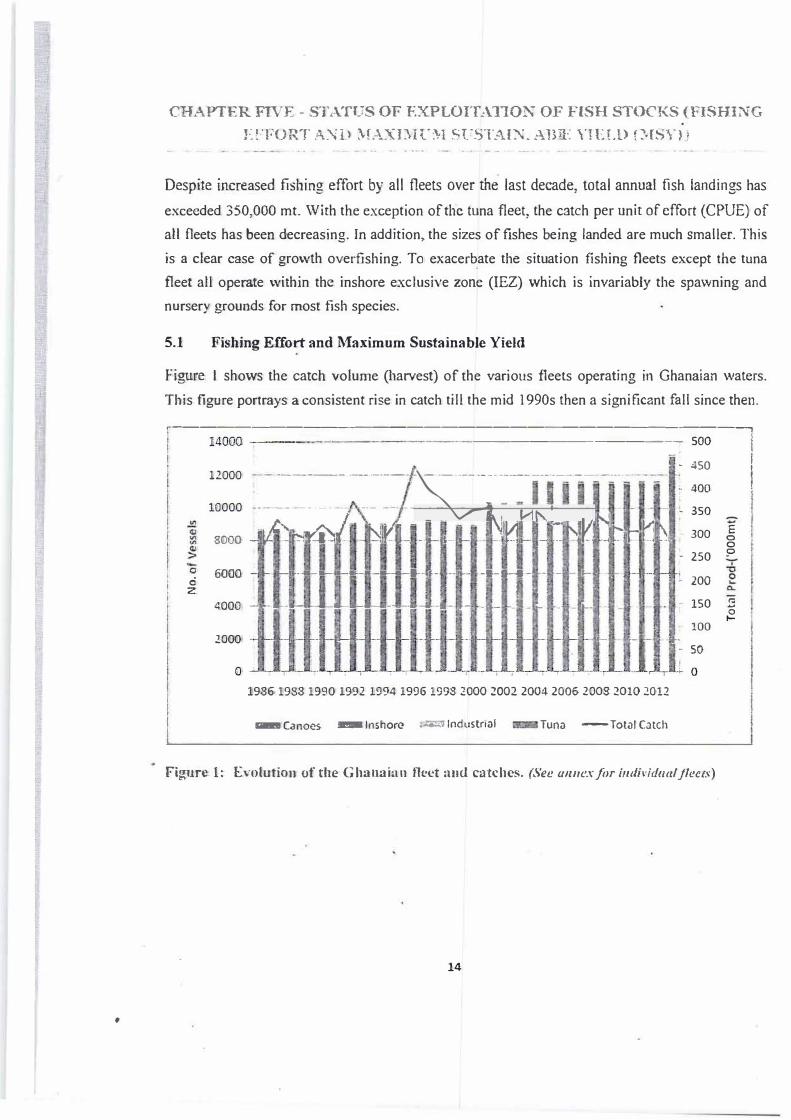
Despite increased fishing effort by all fleets over the last dec.ade, total annual fish landings has
exceeded 350,000 mt. With the exception of tlie tuna fleet, the catch per unit of effort (CPUE) of
aU fleets has been decreasing. fn addition, the sizes of fishes being landed are much smaller. This
is a dear case of growth overfishing. To exacerbate the situatjon fishing fleets except the tuna
fleet all operate within the inshore exclusive zone (IEZ) which is invariably the spawning and
nursery grounds for most fish species.
5.1 Fishing Effort and :Maximum Sustainable Yield
Figure l shows the catch volume (harvest) of the various fleets operating in Ghanaian waters.
This figure portrays a consistent rise in catch till the mid 1990s then a significant fall since then.
,------------------------------------,
c:i z.
------------ SOO I
12000 . ------- ·------·-·
�
--·--------- -· . - - - -
10000 -· -- - · .. .. -- · - · -· - .. ... - · ·
� I \ ,....., ...._ sooo - L ·_ � 0 �- � � � __ ,_ _ _ � __ �- \ � _ -:-� � �-6000 - >- - �..tS--.t-1-PI-----·--- - - - _.,...., ...... - - ,-
4000 - .... ___,,_....... _.......,_,___n_____ >- - - • - - - - >- -
- 450
1' • 400
350
300 �
- 250
200
0 9
15
0 �
100
0 � 2000 - �- ----- �
19861938 1990 1992 1994 1996 1998 2000 2002 2004 2006 2008 2010 2012
111a1 Canoes - Inshore ;;;:-, Industrial Tuna -Total Catch
- 50
figure 1� Evotution of the Ghanaian fleet an<l catches. (See am,exfor imlfridualjleet�)
14
•
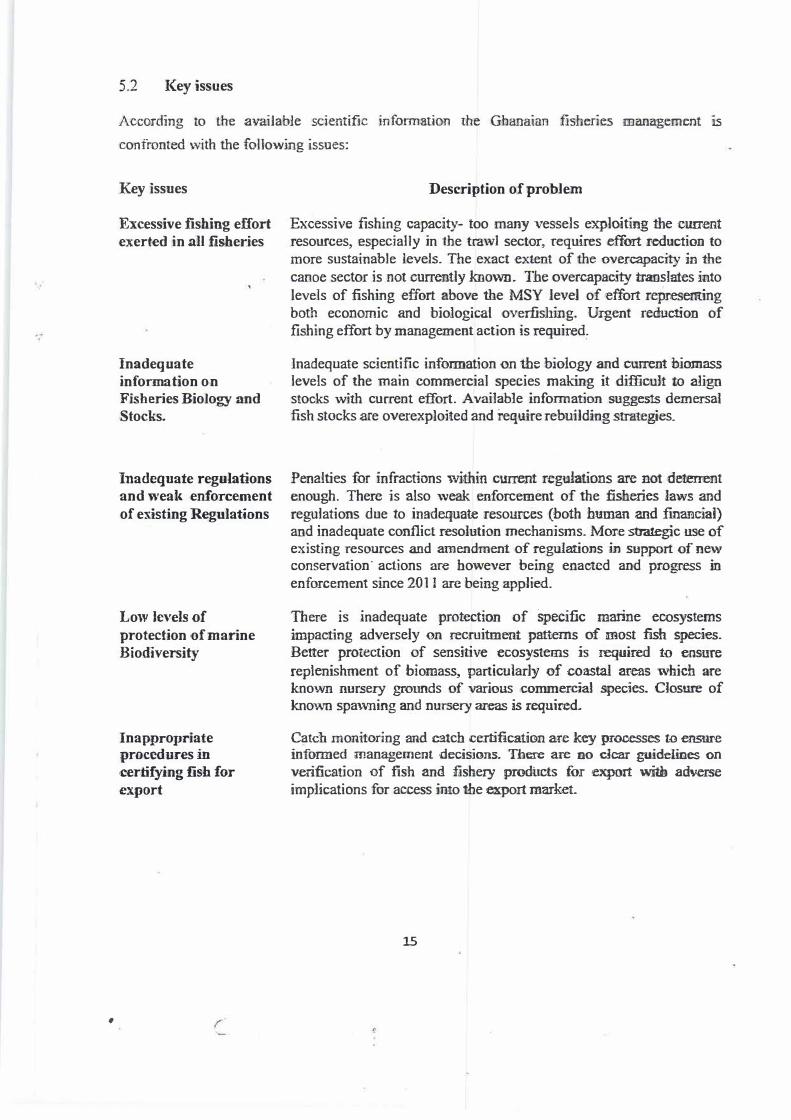
5.2 Key issues
According to the avaiJabJe scientific information the Ghanaian fisheries management is
confmnted with the foHow.ing issues:
Key issues
Excessive fishing effort exerted in all :fisheries
Inadequate information on Fisheries Biology and Stocks.
Inad�guate regulations and weak enforcement ofexistingRegu]arions
Low levels of protection ,of marine Biodiversity
lnappropriiate procedures mcertifying :fish for export
Description of problem
Excessive fishing capacity- too many vessels exploiting the oorrent resources, especially in the trawl sector, requires effort l'Cduction to more sustainable levels. The exact extent of 1the overicap.acity in the canoe sector is not currently known. T.be overcap:acill:y tr.ms1ates mto levels of fishing effort above 1he MSY level of effort representing both economic and bfological overfislring. Urgent J:eduction of fishing effort by management action is required.
Inadequate scientific information on the biology antl cunrent biomass Jevels of the main rommercial species making it difficwt to align stocks with current effort .. Available information suggests demersal fish stocks are overexploited and require rebuilding strategies.
P,enalties for infractions w.i�hin current regulations are not deterrent enough. There is also weak enforcement of the :fisheries laws and regufations due to inadequate resources (both human and financial) and inadequate conflict resolution mechanisms. Mo11e strategic use of existing resources and amendment of regulations in support of new conservation- actions are however being enacted and progress in enfomement since 2011 are beiog applied.
There is inadequate protection of specific marine ecosystems impacting adversely on recruitment patterns of most fish specjes_ Better protection of sensitive ecosystems Jis .required to en.snre replenishment of biomass, particularly of coastal areas which are known nursery grounds of various �mmercfaJ species. Closure of known spawning and nursery areas is requin:,d.
Catch monitoring and catch 40ertification ar.e .key processes m ensure informed management decisions. There are no clear guidelines on verification of fish and fishery products for export with adverse implications for access into the export market.
15
•
There are five key issues which require major strategic responses under the Management Plan:
1. Reducing the current levels of fishing effort and fishing capacity.
2. Improving information on fisheries biology and stock assessment to support a stock
rebuilding harvest strategy.
3. Effective ,enforcement of fisheries legislation.
4. Protecting marine habitat to conserve biodiversity.
5. Product certification and reducing post-harvest losses.
These challenges will be addressed with strategic actions which are measurable by key
performance indices (KPls). Jn the following tables the strategies to address the challenges are
proposed and those that are major policies and requiring immediate implementation in 2015 are
asterisked (*).
16
•
J11dustrral Trawl fisl)ery I
Strategic actions
applied to:
TRA WLCRS (T)
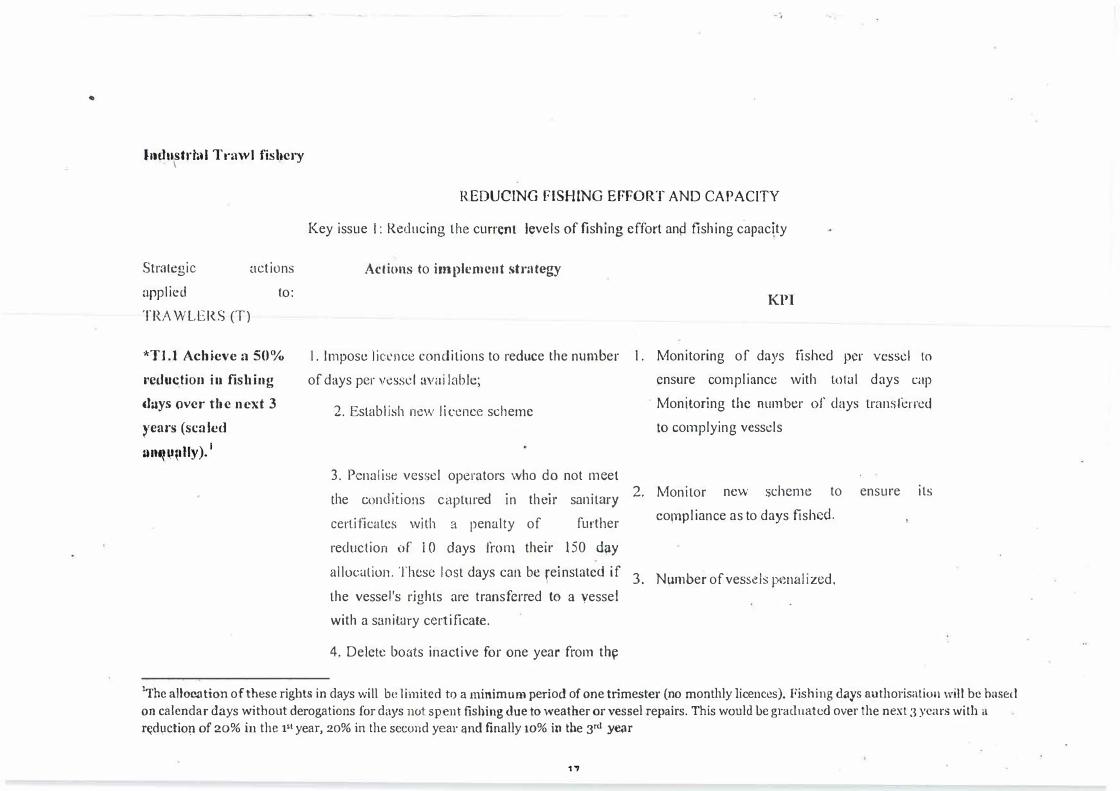
*Tl.J Achieve a 50%
l'eduction in fishing
days over the next 3
years (scaled
nn�v{!Hy). 1
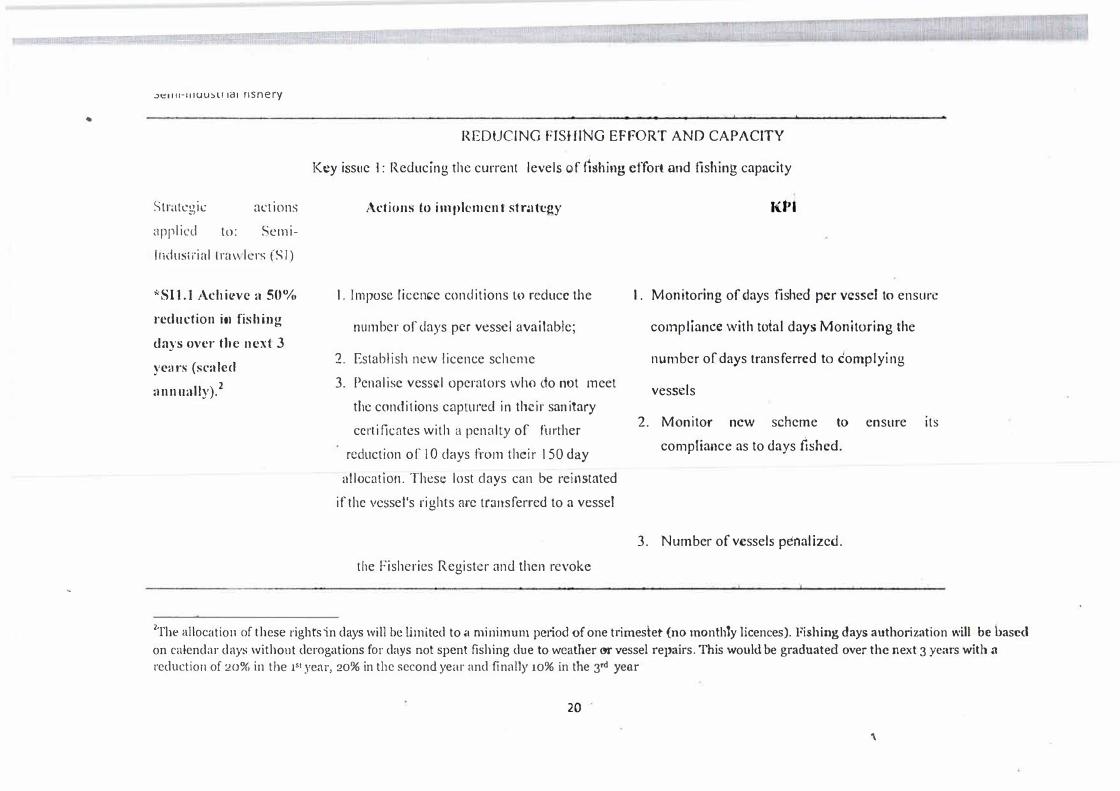
REDUCING FISHlNG EFFORT AND CAPACITY
Key issue l: Reducing the cum;nt levels of fishing effort anp fishing c·apacity
Actions to implement strategy
KPl
l. lmposc licence conditions to reduce the number
of days per v�ssd avai !able;
1. Monitoring of days fished per vessd to
ensure compliance with totul days cap
2. Establish new licence scheme · Monitoring the number of days transforrcq
to complying vessels
3. Pcnalist: vessel operators who do not meet
h d. . d . h . . 2. Monitort e con 1t1ons capture rn t e1r sarntary new scheme to
certificates with a penalty of further co{l'lpliance as to days fished.
reduction of I O days from their l50 d�y
allocation. These lost days can be reinstated if 3. Nµmber of vessels penalized.the vessel's rights are transferred to a yessel
with a sanitc.1ry certificate.
4. Delete boats inactive for one year from th�
ensure its
1The allocation of these rights in days will be limited to a minimum period of one trimester (no monthly licences}. Fishing days authorisation will be base<l
on calendar days without derogations for days not spent fishing due to weather or vessel repairs. This would be graduated over the next 3 years with a r�duction of 20% in the 1'1 year, 20% in the second year <\Hd finally 10% in the 3rd year
1.,
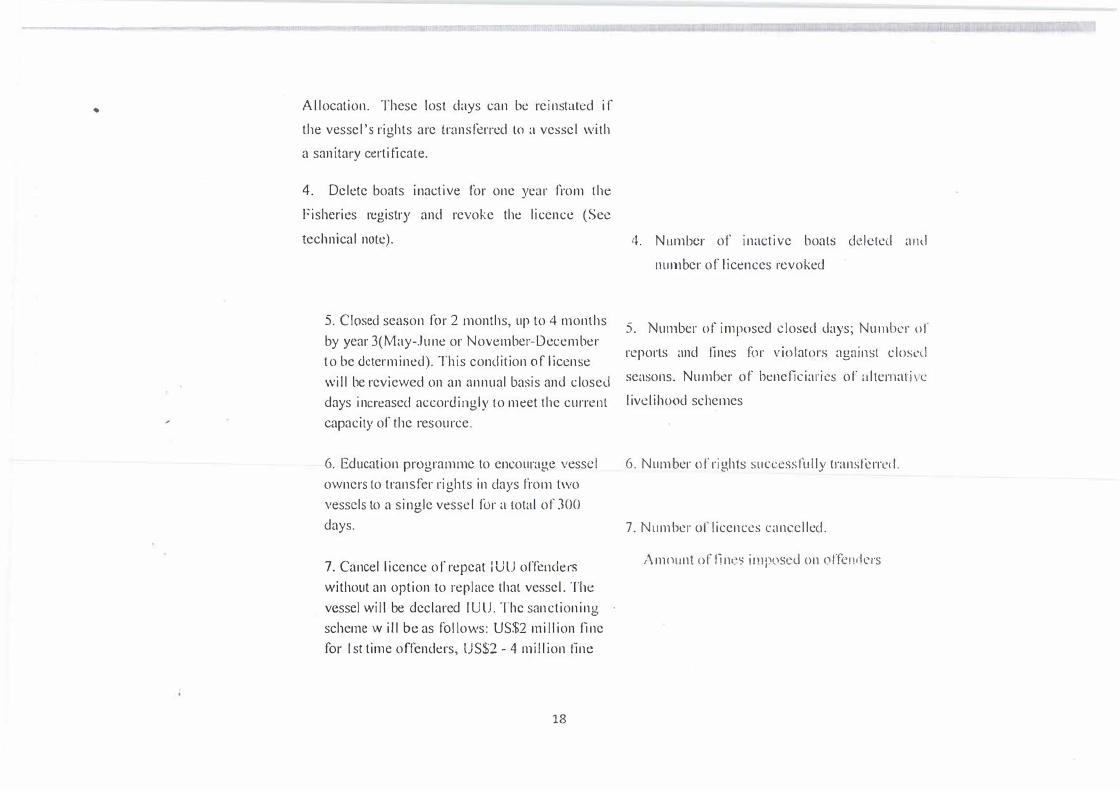
• Allocalion. These losl days can be reinstated if
the vessel's righls are transferred lo a vessel with
a sanitary certificate.
4. Delete boats inactive for one year from the
r-isherics registry and revoke the licence (Sec
technical note).
5. Closed season for 2 months, up to 4 months
by year 3(May-June or November-December
to be determined). This condition or license
will be reviewed on an nnnual basis and closed
days increased accordingly to meet the current
capacity of the resource.
6. Education programme to encourage vessel
owners to transfer rights in days from l wo
vessels lo a single vessel for a total of 300
days.
7. Cancel licence of repeat IUU offenders
without an option to replace that vessel. The
vessel will be declared IUU. The sanctioning
scheme will be as follows: US$2 million fine
for 1st time offenders, US$2 - 4 million line
18
4. Number of inactive boals deleted a11d
number of licences revoked
5. Number of imposed closed days; Number nr
rcporls and lines for violators against clos1:Li
seasons. Number of beneficiaries of .:ll tcrnari, <.:
livelihood schemes
6. Number or rights successfully transferred.
7. Number or licences cancelled.
Amount of fin�·s impt,scd on offenders
•
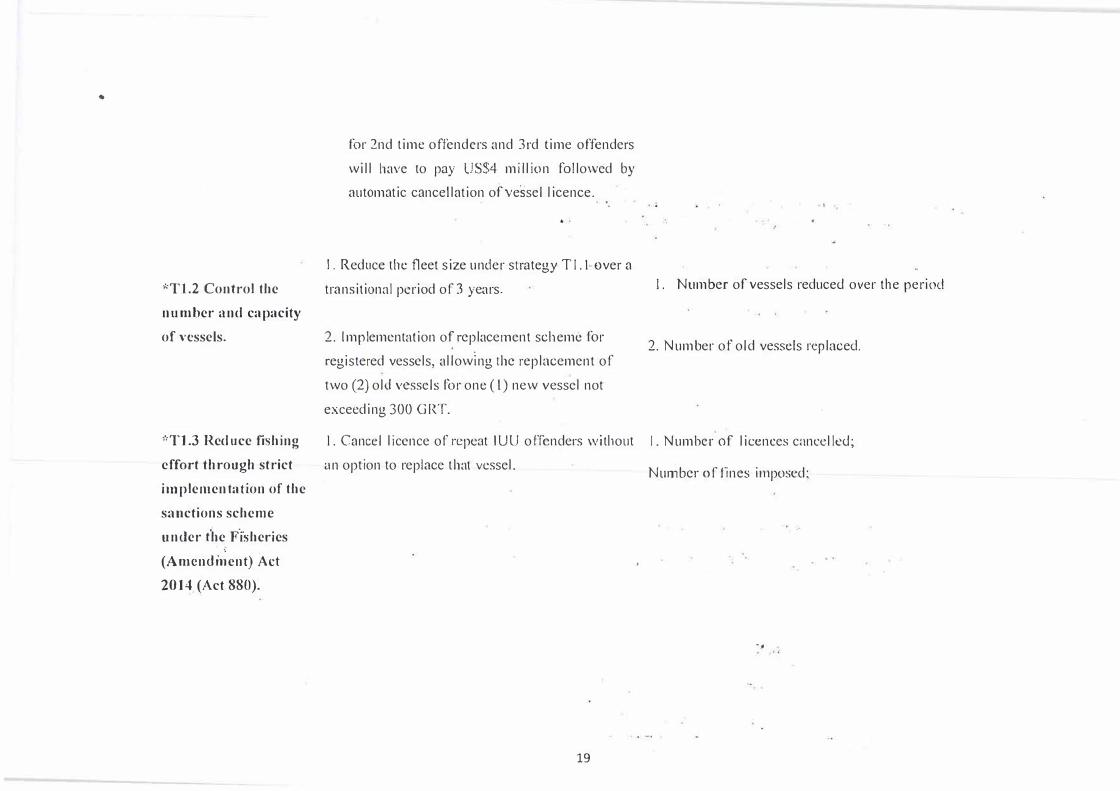
*T1.2 Control thenumber nnd capacityof vessels.
'�TJ.3 Reduce fishing effort through strict implementation of the
sanctions scheme under the F°rsheries
(Amcnur�ent) Act
2014 (Act 880).
for 2nd time offenders and 3rd time offenders
will have to pay US$4 million followed by
automatic cancellation of vessel licence.
I. Reduce the fleet size under strategy T 1.1 over a
transitional period of 3 years.
2. Implementation of replacement scheme for
registered vessels, allowing the replacement of
two (2) old vessels for one ( 1) new vessel not
exceeding 300 GRT.
I. Cancel licence of repeat IUU offenders without
an option to replace that vessel.
19
I. Number of vessels reduced over the period
2. Number of old vessels replaced.
I. Number of licences cancelled;
Number of fines imposed;
..
•
..),::1111-111uu:.u 101 nsnery
Stratcgii.:
applied to:
aclions
Semi-
li1dusirial trawlers (SI)
*Sil.I Achieve a 50%
reduction i11 fishing
clays over the next 3
yc�1.-s (scaled
annually).2
REDUCING FISHING EFFORT AND CAPACITY
Key issue l: Reducing the current levels of fishing effort and fishing capacity
Actions to implement strntcgy
I. Impose licen"e conditions to reduce the
number of days per vessel available;
2. Establish new licence scheme
3. Penalise vessel operators who do not meet
the conditions captured in their sanitary
certificates with a penalty of further
reduction of l O clays from their 150 day
allocation. These lost days can be reinstated
if the vessel's rights are trnnsferred to a vessel
the Fisheries Register and then revoke
K.PI
l. Monitoring of days fished per vessel to ensure
compliance with total days Monitoring the
number of days transferred to complying
vessels
2. Monitor new scheme to ensure its
compliance as to days fished.
3. Number of vessels penalized.
2The allocation of these righrsin days will be limited to a minimum period of one trimester (no monthly licences). Fishing days authorization will be based
on calendar days without derogations for days not spent fishing due to weather c:,r vessel repairs. This would be graduated over the next 3 years with a reduction of 20% in the 1s1 year, 20% in the second year and finally 10% in the 3rd yeor
20
'\
•
� ...
- - -- _________ __..__... _______ --Jc.....1. _ _.._ _ __..._........._ __ ....___
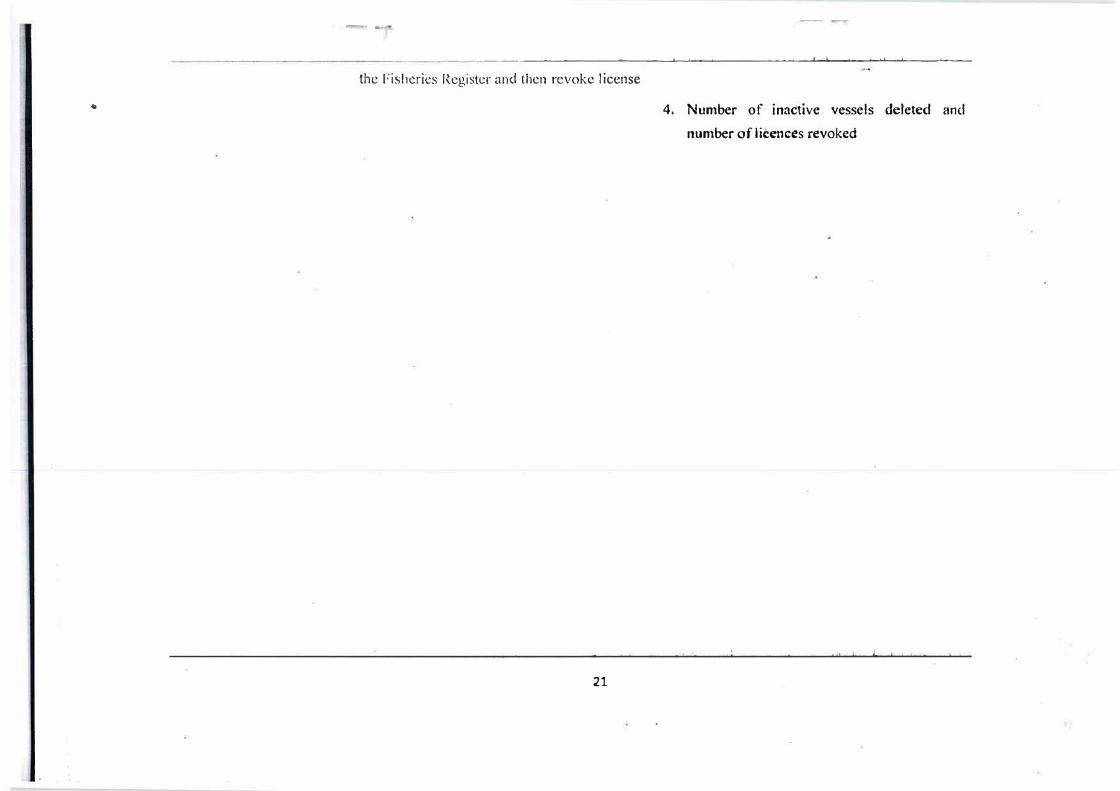
the Fisheries Register and then revoke license
21
4.. Number of inactive vessels deleted and
number of licencts revoked
..
.)t,: 11 U-1 IIUU!>lrtcll 11sne ry
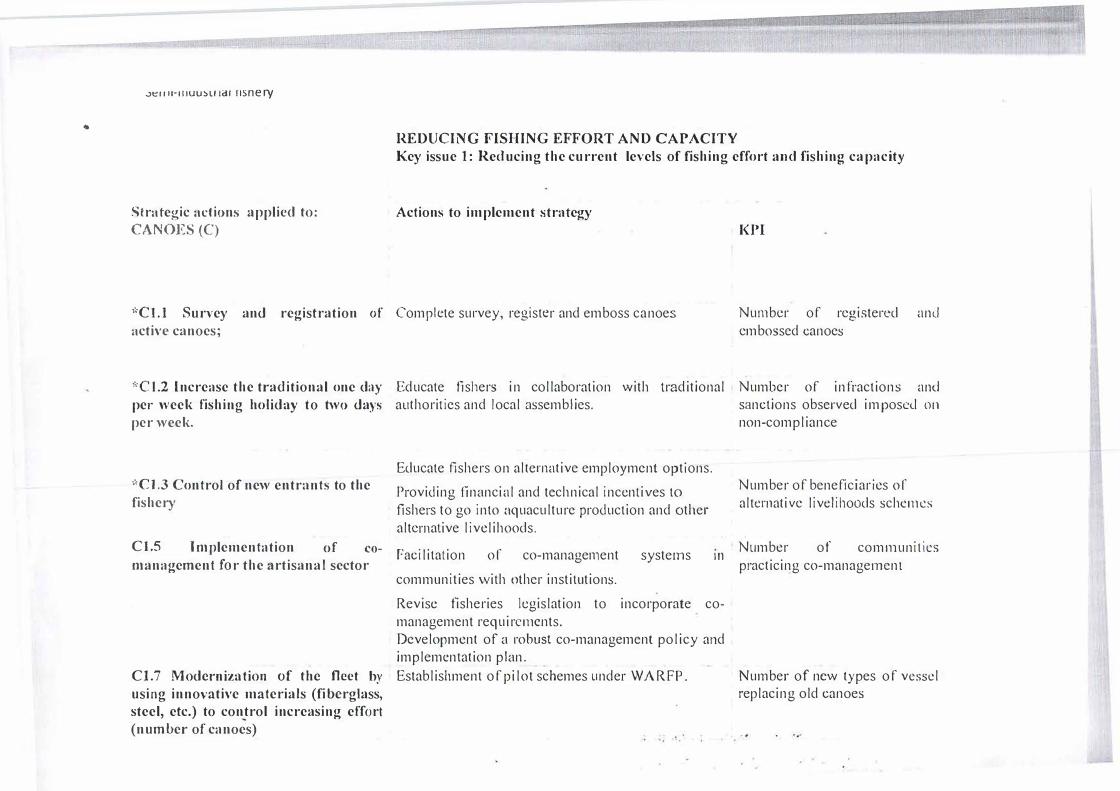
REDUCING FISHING EFFORT AND CAPACITY
Key issue 1: Reducing the current levels of fishing effort and fishing capacity
Strategic actions applied to: Actions to implement strategy CANOES (C)
*Cl.1 Su.-vey and registration of Complete survey, register and emboss canoesactive canoes;
l<Pl
Number of registered and embossed canoes
''°C 1.2 Increase the traditional one day per week fishing holiday to two days per week.
Educate fishers in collaboration with traditional Number of infractions and
,·,ct.3 Control of new entrants to the fishery
Cl.5 Implementation of co-management for the artisanal sector
authorities and local assemblies.
Educate fishers on alternative employment options.
Providing financial and technical incentives to fishers to go into aquaculture production and other alternative livelihoods.
Facilitation of co-management
communities with other institutions.
systems Ill
Revise fisheries legislation to incorporate comanagement requirements. Development of a robusl co-management policy and implementation plan.
C1.7 Modernization of the fleet by Establishment of pilot schemes under WARFP. using innovative materials (fibcrglass, steel, etc.) to control increasing effort (number of canoes)
sanctions observed imposctl on non-compliance
Number of beneficiaries of alternative livelihoods scheme:-.
Number of communilics practicing co-management
Number of new types of vessel replacing old canoes
..
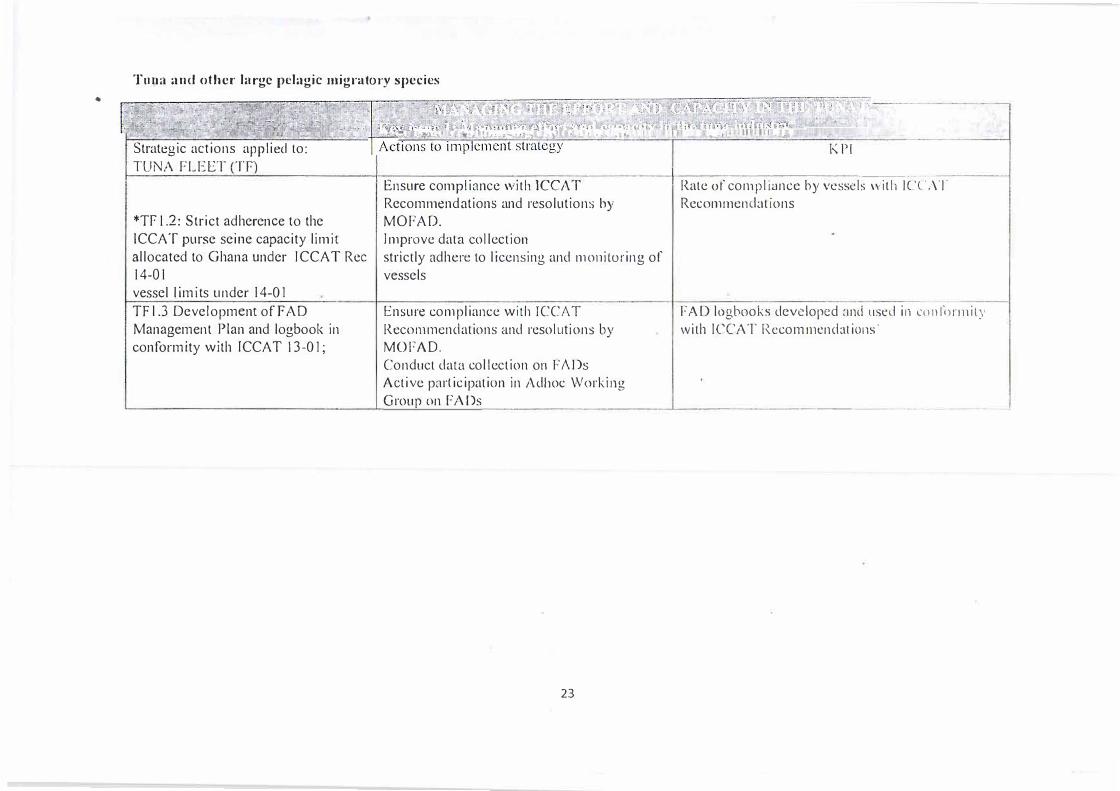
Ttqrn and other· large pelagic migratory species
->., ... \;t ,. ' ;;-· - ··� . ---.--..: ··�·, .. .;-... .;.• - ••.. ,.,., ,·.:..;;.,_;.;i_-,.;;,·l:.-. .,.... . , .. ,� .... -.)1\, ·•;.-.. �...1 · - �,..z,. ·. -�_.,, ..... , ...
Strategic actions app lied to: ·---· _ I TUNA fLECT (TF)
I ... ��. I Rate of con,pli_nncc by vessels with ICC.YI
KPl
*TF 1.2: Strict adherence to theICCAT purse seine capacity limitallocated to Ghana under ICCAT Ree14-01
vessel limits under 14-01
TFl .3 Development off AD Management Plan and logbook in conformity with fCCAT 13-01;
Ensure compliance wit11 ILLA 1 Recommendations and resolutions by MOFAD. Improve data collection strictly adhere to licensing and monitoring of vessels
Ensure compliance with ICCAT Recommendations and resolutions by
MOFAD. Conduct data col lection on FADs
Active participation in Adhoc Working
Recommendat1ons
FAD logbooks developed nnd used in confnrrnily with ICCA T Recomrnendat ions·
Group on FADs __ _
23
[1
•
.:>0:1111-11 tu u:,u 1a1 rrsnery
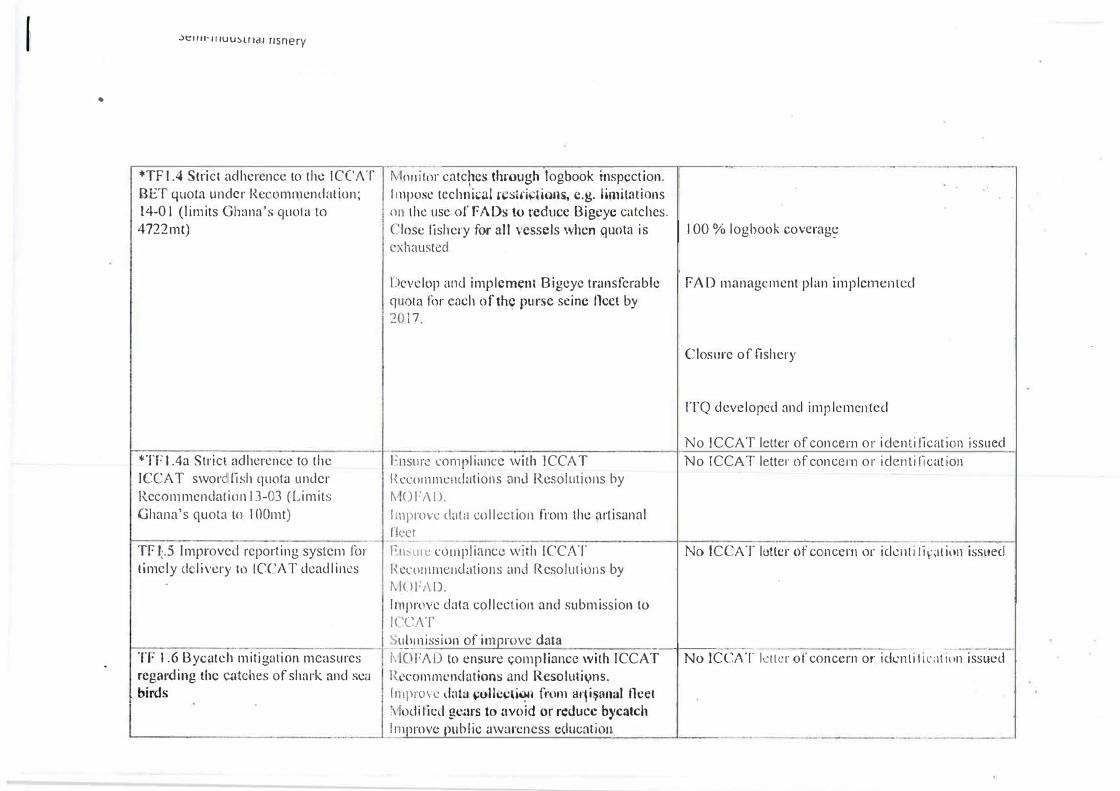
*TF 1.4 Strict adherence to the ICCATBET quota µnder Recomn;iendnt(on;14-0 I (limits Ghana's quota to4722mt)
*TF 1.4a Stricl adherence to theICCAT swordfish quota underRecommendation 13-03 (LimitsGhana's quota to I OOmt)
TF �.5 Improved reporting system for timely delivery to ICC'AT deadlines
. ·--TF 1.6 Bycateh mitigation mensures regarding the catches of shark and sea
� birds
I\ 11
()
C
C
l q 2
[
H I\ (,
I'
1:
11 I\
!1 11
I\ R 11 [\
(1
nnifor catches through logbook inspection. ,pose technical rcstri�lions, e.g. H{llitations
the use of FADs to reduce Bigeye catches. ose fishery for all vessels when guota is j 100 % logbook coverag� hausted
cvelop and implement Bigeye transferable I FAD management plan implemented ota for each of th� purse seine fleet by 17.
1surc compliance with ICCA T ec.:om111c..:11dations and Resolutions by 01'/\I >.
1provc dnta collection from the artisanal 'Ct l'-un: cnmpliancc with ICCAT ert1rn111endations and Resolutions by 01:1\D.
,prove data collection and submission to CAT
Closure of fishery
ITQ developed nncl implemented
No ICCA T letter of concern or iclcnti lication issued No ICCA T lclter of concern or identi Ii cation
No ICCAT loller of concern or iclcnti l'iplion issued
�n iss�on of in�prove data --1---· OFAL) to ensure c;ompliance with ICCAT I No JCCJ\T kttl'r of concern or idcnli ticHion issued
1:commendations and ResolutiQns. 1prov1.: data �ollccti� from arfi�anal fleet odificd gears to avoid or reduce bycatch1prove public awareness education
..
----·---- -------,-- - ----
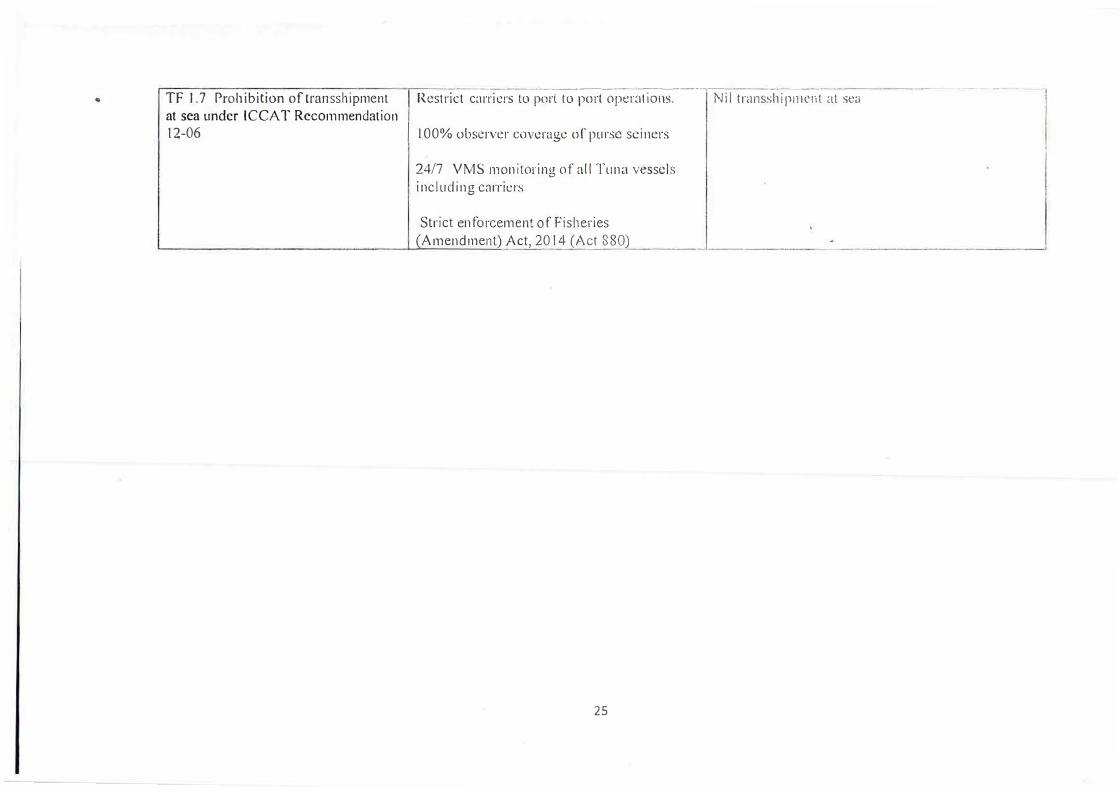
Nil transshipment at sea TF 1.7 Prohibition of transshipment I Restrict carriers lo port to port operations. at sea under ICCA T Recommendation l 4-06 I l 00% observer coverage of purse seiners
24/7 VMS monitoring of all Tuna vessels including carriers
Strict en forcement of Fisheries {Amend_ment) Act, 20_1_4 _ _{Act 88Ql
25
•
-
..>1:1111-111uu:, u 1c:11 nsnery
Sthttc�ic actious
:tt)plied to: ALL
FLEETS
Actions to implem<.>nt strakgy
______ ,
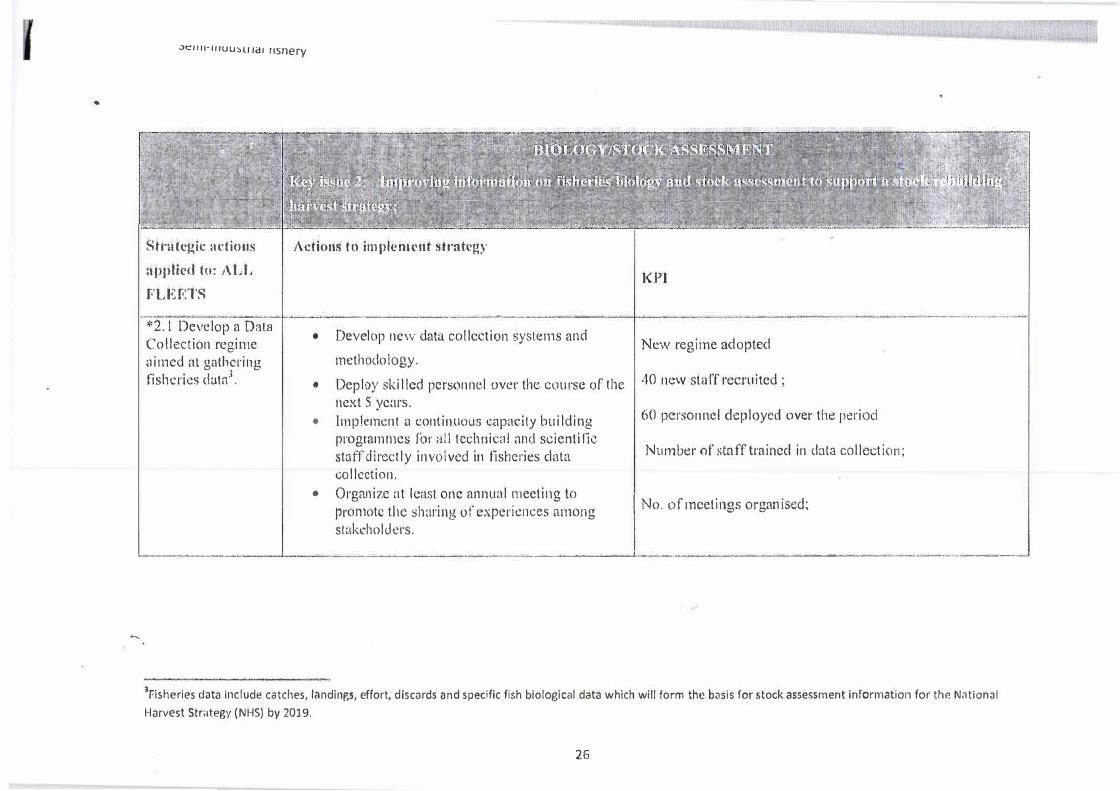
*2.1 Develop a DataCollection regitneaimed at gatheringfisheries data3
.
�---�-�------
.,.:;u:��=· -���---�-
• Develop new data collection systems andmethodology.
• Deploy skilled personnel over the course of thehext S years.
• implement a continuous capacity building programmes for all technical and scientific staff directly involved in fisheries data collection.
KPl
New regime adopted
40 new staff 1·ecl'Uitcd ;
60 personnel deployed over the period
Number of sta ff trained in data collection;
• Organize at least one annual meeting to . . . promote the shaifog of experic11ces among I No. of meetmgs organised; stakcholdci·s.
- ----------"'-·-�-----�-_...;.---1 - ·-----·----- ·
3Fisheries data include catches, landlr,gs, effort, discords and specific fish biological data which will form the basis for stock assessment inform.ition for the National
Harvest Strategy (NHS) by 2019.
26
•
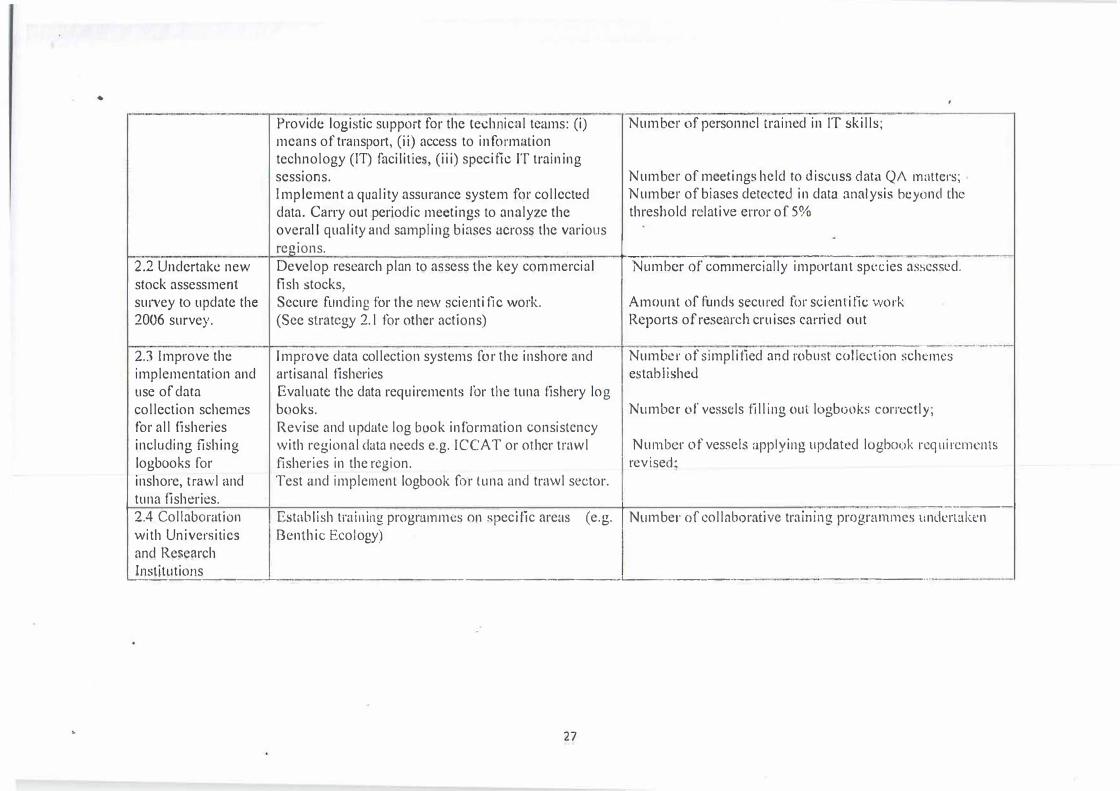
2.2 Undertake new stock assessment survey to update the
2006 survey.
2.3 Improve the implementation and use of data collection schemes for all fisheries including fishing logbooks for inshore, trawl and
Provide logistic support for the technicnl teams: (i) means of transport, (ii) access to information technology (IT) facilities, (iii) specific IT training sessions. Implement a quality assurance system for collected data. Carry out periodic meetings to analyzc the
Number of personnel trained in IT skills;
Number of meetings held to discuss data Q/\ matters; Number of biases detected in data analysis beyond Lhc threshold relative error of 5%
overall quality and sampling biases across the various regions. . . J _______ -·---···---Develop research plan to assess the key commercial ["Number of commercially important species asscsst:d.fish stocks, Secure funding for the new scienti fie work. (See strategy 2. l for other actions)
Improve data collection systems for rhc inshore and artisanal fisheries Evaluate the data requ ircmcnts for the tuna fishery log books. Revise and update log book information consistency with regional data needs e.g. ICCA T or other trawl fisheries in the region. Test and implement logbook for tuna nnd trawl sector.
Amount of funds secured for scientific work Reports of rese�u·ch cruises carried out
·----�-
Number of simplified and robust collection schemes established
Number of vessels filling out logbooks correctly;
Number of vessels applying updated logbook requirements revised:
1 tuna fisheries.. . . . . � � . . . __________ ,2.4 Collaboration Establish trn111111g programmes on �pec1t1c aret1s (e.g. f Number of collaborat1ve tra111111g programmes und�1taken with Universities Benthic Ecology) and Research Institutions
�------- ------------------·-'---------- ·------·4····
27
•
.>1:1111·111uu:,u 1c11 risnery
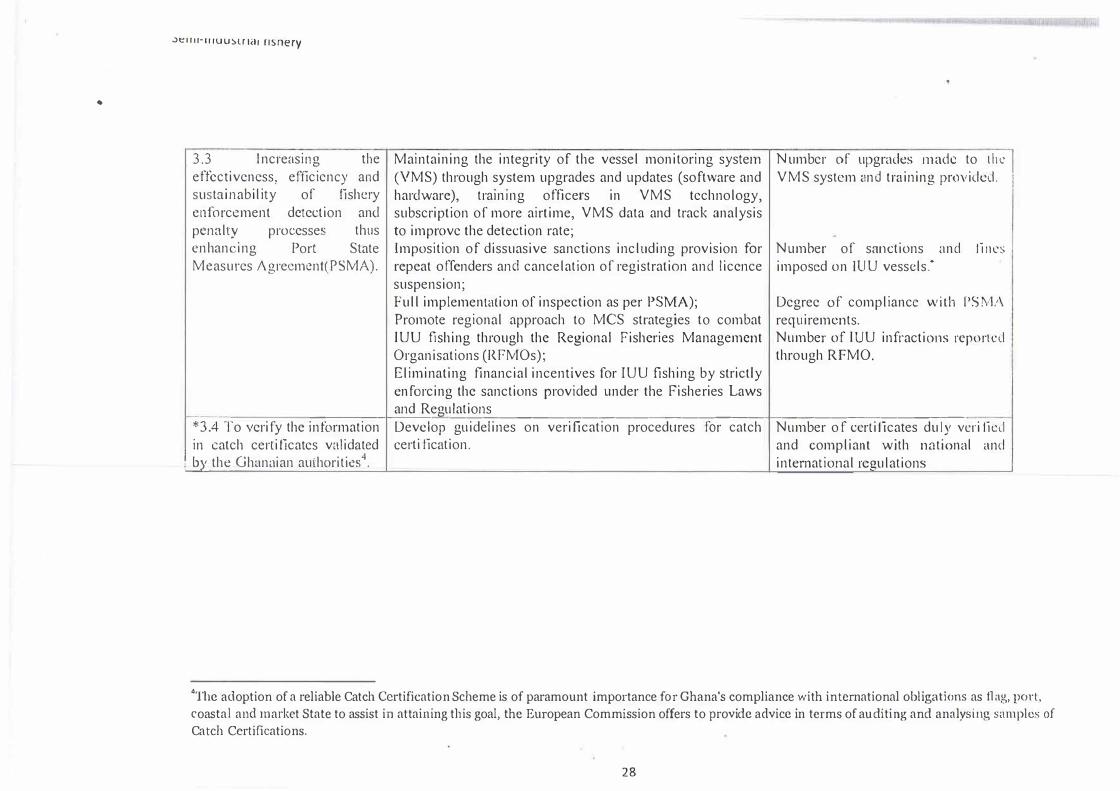
3.3 Increasing the effectiveness, erticiency and sustainability of fishery enforcement detection and penalty processes thus enhancing Port State Measures /\grecmcnt(PSMA).
Maintaining the integrity of the vessel monitoring system (VMS) through system upgrades and updates (software and hardware), tra1n111g officers in VMS technology, subscription of more airtime, VMS data and track analysis to improve the detection rate; Imposition of dissuasive sanctions including provision for repeat offenders and cancelation of registration and licence suspension; Full implementation of inspection as per PSMA);
Promote regional approach to MCS strategies to combat lUU fishing through the Regional Fisheries Management Organisations (RFMOs); Eliminating financial incentives for IUU fishing by strictly enforcing the sanctions provided under the Fisheries Laws
Number of upgrades made to Lh\! I VMS system and training providd. I
Number of sanctions and lini:s
imposed on IUU vessels.�
Degree of compliance wilh PSM!\
requirements. Number of lUU infractions reported through RFMO.
and Regulations -----l---- --------------------+------------
* 3 .4 To verify the information Develop guidelines on verification procedures for catch in catch certificates validated certi lication.
� the Ghnnaian authoritic!s4.
Number of certificates duly vcri tied and compliant with national and international regulations
4
The adoption of a reliable Catch Certification Scheme is of paramount importance for Ghana's compliance with international obligations as flag, port.
coastal and market State to assist in attaining this goal, the European Commission offers to provide advice in terms ofau diting and analysing samples of
Catch Certifications.
28
•
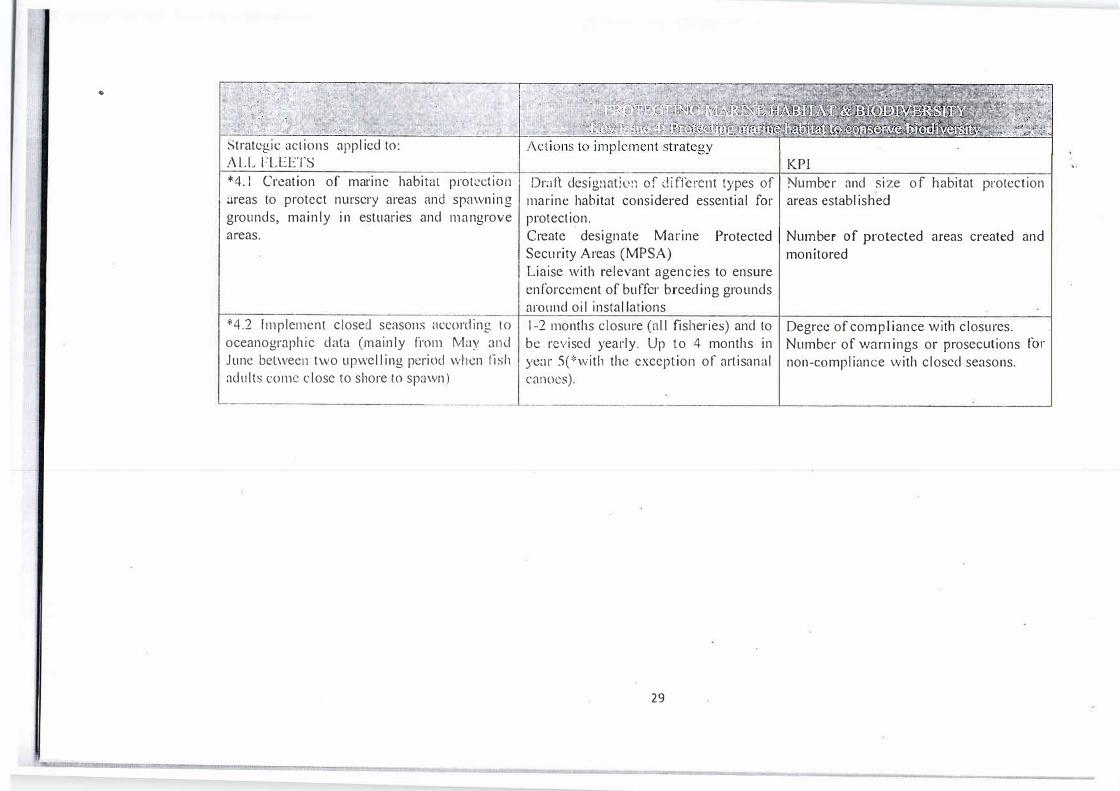
Strategic actions applied to: ALL FLEETS *4.1 Creation of marine habitat protectionnreas to protect nursery areas and spawning grounds, mainly in estuaries and mangrove areas.
*4.2 Implement closed seasons according tooceanographic data (mainly from May and June between two upwelling period when fish adults come close to shore to spawn)
KPI Draft designatio:1 of different types of I Number and _size of habitat protection
marine habitat considered essential for areas established protection. Create designate Marine Security Areas (MPSA)
Protected I Number of protected areas created andmonitored
Liaise with relevant agencies to ensure enforcement of buffer breeding grounds around oil installations 1-2 months closure (all fisheries) and tobe revised yearly. Up to 4 months in year S(*with the exception of artisanal canoes).
29
Degree of compliance with closures. Number of warnings or prosecutions for non-com pi iance with closed seasons.
•
->e1111-111uu!>u1c11 nsnery
l------------------------1-----�=--''----------'------,,-- � ... ___...:.::_:.. .- .....
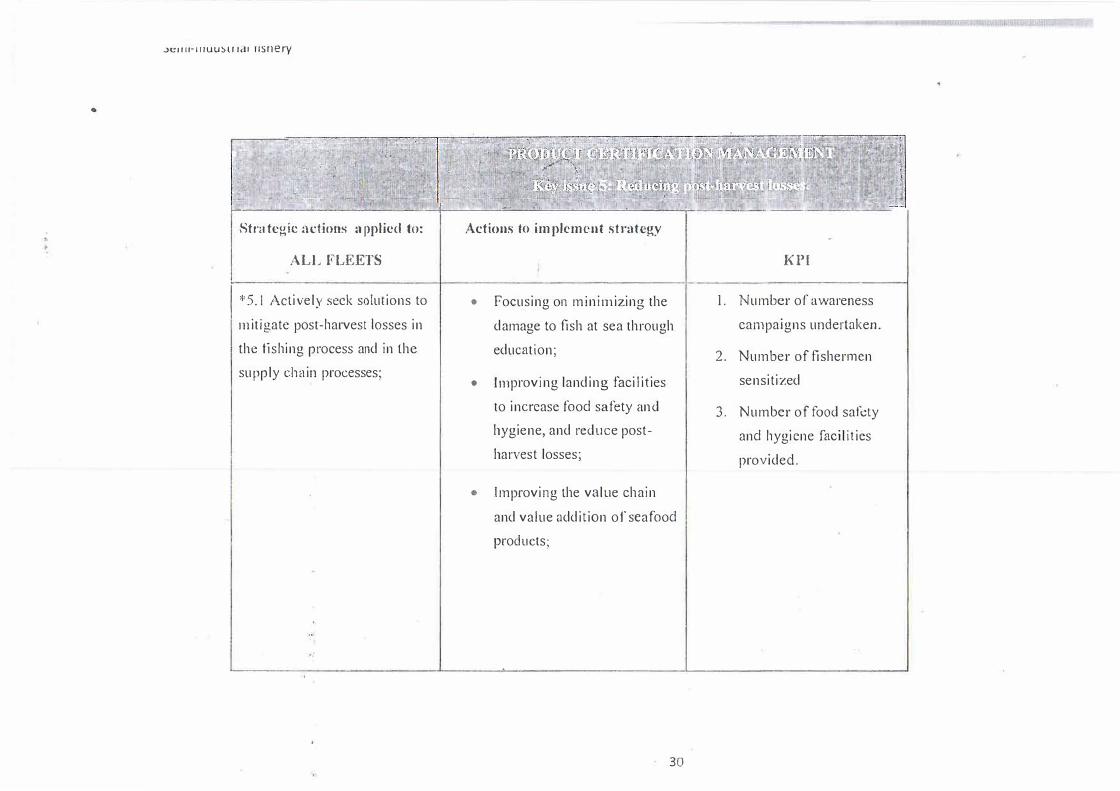
Stra tcgic actions a pplicd to:
ALL FLEETS
I *5.1 Actively seek solutions to I
mitigate post-harvest losses in the tishing process and in the supply chain processes;
Actions to implement strategy
• Focusing on minimizing thedamage to fish at sea througheducation;
• Improving landing facilitiesto increase food safety andhygiene, and redt1ce postharvest losses;
o Improving the value chain
and value addition of seafoodproducts;
30
KPI
1. Number of awarenesscampaigns undertaken.
2. Number of fishermensensitized
3. Number of food safetyand hygiene facilitiesprovided.
•
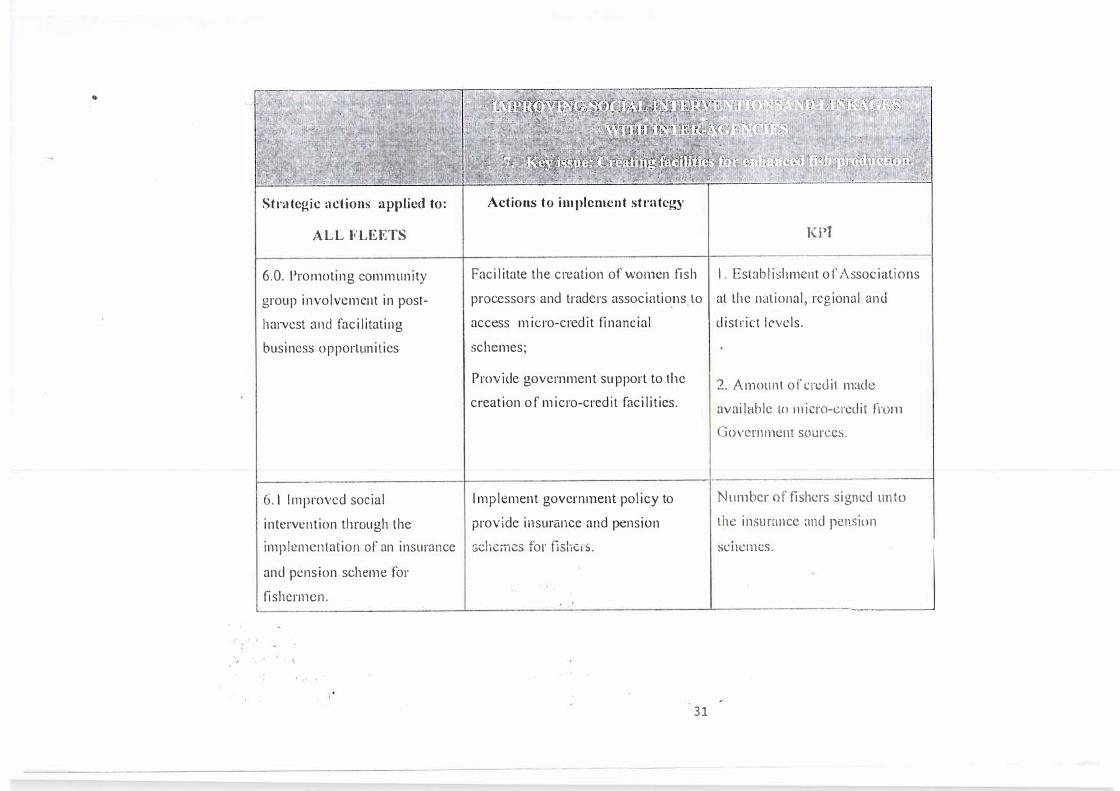
Strategic actions applied to:
ALL FLEETS
6.0. Promoting community
group involvement in post
harvest and facilitating
business opportunities
6.1 I rnproved social
intervention through the
Actions to implement strategy
KPl
Facilitate the creation of women fish I. Estnblishmcnt of Associations
processors and traders associatio_ns to at the national, regional and
access micro-credit financial district levels.
schemes;
Provide government support to the
creation of micro-credit facilities.
Implement government policy to
provide insurance and pension
2. Amount of credi1 made
available to micro-credit from
Govcm1ncnt sources.
Number of fishers signed unto
the insurance and pension
implementation of an insurance schemes for fishciS. S(;ht:mcs.
_Jand pension scheme for
fishermen.
31
Je1111·111uu�u Jd1 11snery
•
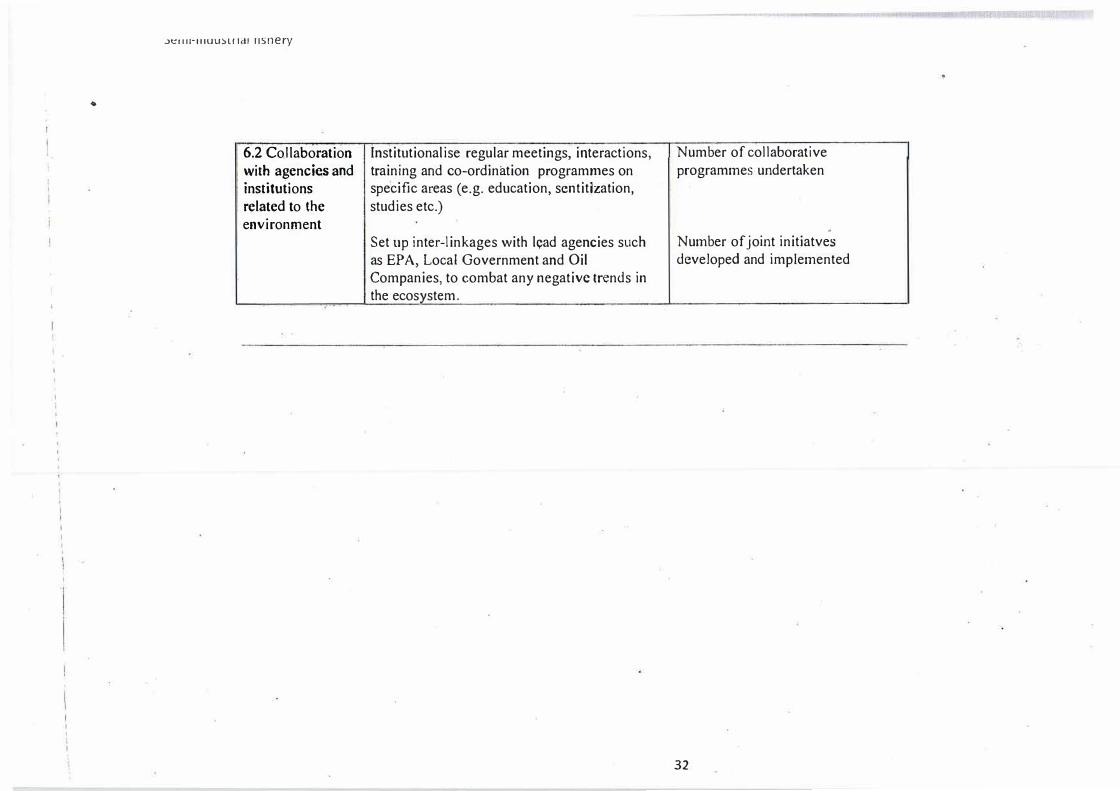
6.2 Collaboration Institutionalise regular meetings, interactions, Number of collaborative with a�encies and training and co-ordination programmes on programmes undertaken institutions specific areas ( e.g. education, sentitization, related to the studies etc.) environment .
Set up inter-linkages with lead agencies such Number of joint initiatves as EPA, Local Government and Oil developed and implemented Companies, to combat any negative trends in the ecosystem.
32
CHAPTER SE"VE� - i�lPLE)IEXT��TiP� _-\SD FJS . .\..,CIXG or THE
:',f -\ '\.-\<:rE, H-.�: r Pl --�,
An annual Operational Plan (OP) will be developed to implement the strategic actions required
to address the key issues identified in the Fisheries Management Plan covering the period 2015-: .
20 I q as shown in table l. In Table 1 the strategic action steps with cm asterisk (*) are ranked
as l,ai•ing a High Priori(y (*HP). Other strategies are either medium prioritr (t.fP), or low
priority (LP). The rankings in Table l reflects the importance of the strategy in response to the
cbllenges identified and' the need for fishery reform means we need to address the HP issues in
20 I 5. Other strategy actions have !ower priorities. MP or LP in the initial part of the FMP. The
reform measures of2015 will pay off in the later years ofrhe FMP (1016-1020).
The ;'ced r.o prioritise changes in key areas in :o 15 means th2.t the energies of the implementing
?OVemment agenc1 and managers would be slgnif:c�ntly di'Terem in the early years of reform
(20,5 a.:.:d 20161 than wwards 2019. wi1en the ben.efi:s of imtia! etlc� and capaci� adjustment
;.vili :ead to a more secure undcf?inning for :.:1e fishe:-y reso:.:r..:i.:!S.
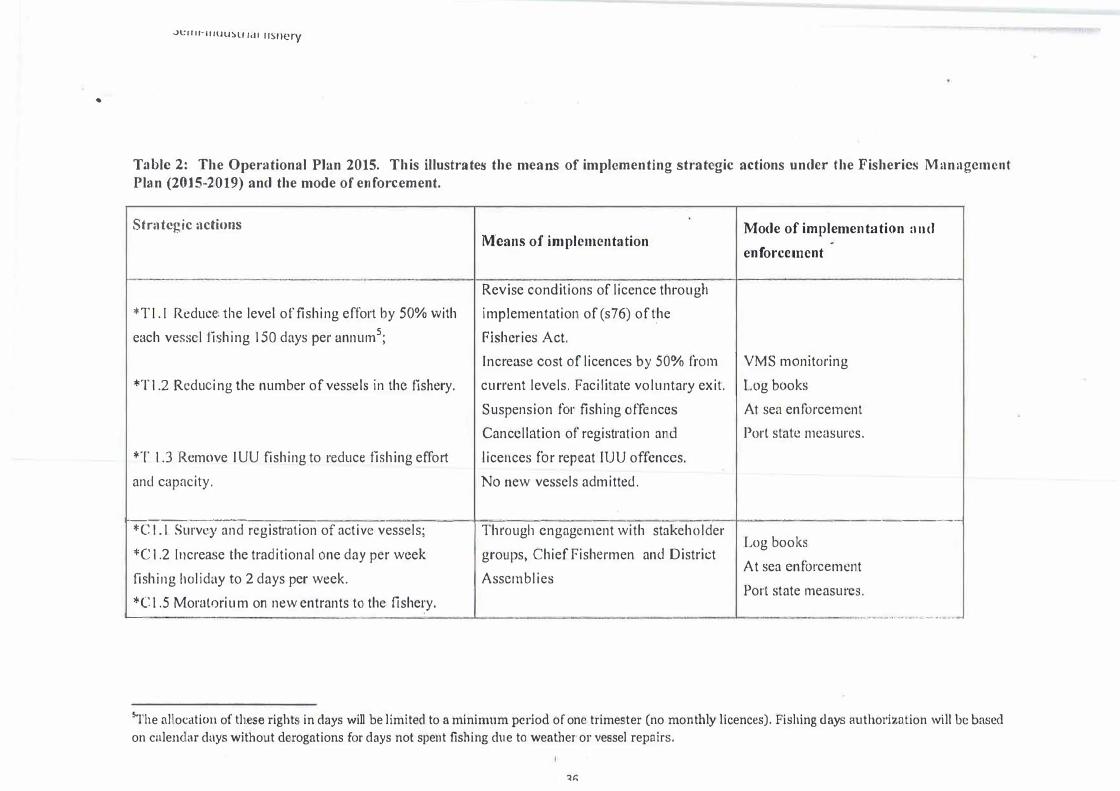
The Operationai plan for 2015 is speci:""'i�d ir;. sc,me detail!:-: Table 2. The :ors Operational plan
is io!" �;:� key s:rategies that have to be u:1Jertake:1 in 2015 to implemen� the fishery reform
r:·ocess In Table 2. mear:.s of implementation arrd r:i.:xle of .:r:.fo:-cement of a selected number of
ve ::: "'S• highly ranked major strategic actions \ asterisked�) unu�r each chal!enge are preser.ted.
Tl-.i� will guiae the prompt imp!ement2tion of th�se key 5:,.a�egii:s co;nmen.::ing in earl� �O I 5 and
�0�liruing thr0ugh the year and to 2019 where applicabie. Within each �car a pwctical
,)ocrac1c,na1 plan wiii be prepared with ti�e �:-::.rnes acc:o.·ding t0 T..:blcs l and 2 \Vith a budget. ln
�:1-:: !.::t:::· part of2015 the Operotionai Plan for :o ! 6 \...-ill tc c:-a!':-c.:!.
i.! Sour�es of Funds
lmpkmcnration also requires the prov1s1on of the adequ..1t� financial, technical and human
rl:'c:ources. Both MOF AD 211d Fisherie5 Commission are committed to provide the funding of the
Pl:.Jr.. through the following actions:
•
! . Undertaking a re•.·iew and prioritization of allocation of funds from the fisheri�s
Oevelopment Fund. particularly to suppNt research and �nforcernent:
33

:,
'l
•
2. Undertake a rc:view and upward adjustment of the license and permit fees and also
introduce new levies for other services provided.;
3. Initiate bilateral cooperation and technical assistance to support the implementation of the
Plan.
34
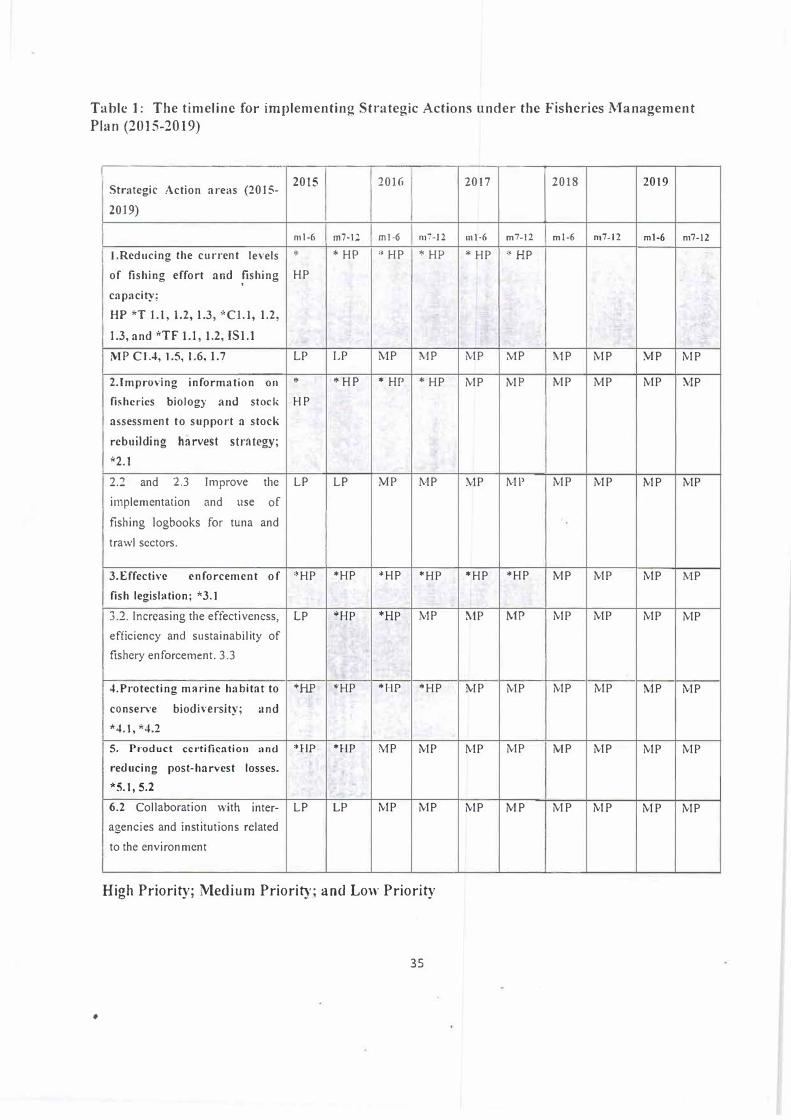
Table J: The timeline for implementing Strategic Actions under the Fisheries Management
Plan (2015-2019)
r--12018 Strategic Action arei1s (2015-
2015 2016 2017 2019
2019)
ml-6 m7-12 mJ-6 rn7-12 ml-6 m7-12 ml-6 m7-l2 ml-6 rn7-12
I.Reducing the current levels * * HP * HP * HP * HP * HP
of fishing effort and �shing HP
capacity;
HP *T 1.1, 1.2, 1.3, *Cl.I, 1.2,
1.3, and *TF 1.1, 1.2, ISI.l
MP Cl.4, 1.5, t.6, 1.7 LP LP MP r-.JP MP MP MP MP MP MP
2.Improving information Oil * * HP * HP * HP MP MP MP MP MP MP fisheries biology and stock HP assessment to support a stock
rebuilding harvest strategy;
*2.1
2.2 and 2.3 Improve the LP LP MP MP MP MP MP MP MP MP implementation and use of
fishing logbooks for tuna and
trawl sectors.
3.Effectivc enforcement of '�HP *HP *HP *HP *HP *HP MP MP MP MP fish legislation; *3.1
3.2. Increasing the effectiveness, LP •HP *HP MP MP MP MP MP MP MP efficiency and sustainability of fishery enforcement. 3.3
4.Protecting marine habitat to "'HP *HP *HP *HP MP MP MP MP MP MP conserve biodiversity; and*4.1, *4.2
5. Prnduct certification and *HP *HP MP MP MP MP MP MP MP MP reducing post-harvest losses.*5.1, 5.2
6.2 Collaboration with inter- LP LP MP MP MP MP MP MP MP MP agencies and institutions related
to the environment
High Priority; Medium Priority; and Low Priority
35
•
•
Jo.::1111-11,uu:,u tdt 11s11ery
Table 2: The Operational Plan 2015. This illustrates the means of implementing strategic actions under the Fisheries M anagemcnt Plan (2015-2019) and the mode of enforcement.
Strategic actions
*TI. I Reduce the level of fishing effort by 50% witheach vessel fishing 150 days per annum5
;
Means of implementation
Revise conditions of licence through implementation of (s76) of t _he Fisheries Act.
Mode of implementation and
enf orccmcnt
*T 1.2 Reducing the number of vessels in the fishery.Increase cost of licences by 50% from
I VMS monitoring
current levels. Facilitate voluntary exit. Log books
*T 1.3 Remove IUU fishing to reduce fishing effortand capacity.
Suspension for fishing offences Cancellation of registration and licences for repeat IUU offences. No new vessels admitted.
At sea enforcement Port state measures.
f------------------------1--�---�------------------------� *C 1.1 Survey and registration of active vessels; Through engagement with stakeholder *C 1.2 Increase the traditional one day per week groups, Chief Fishermen and District fishing holiday to 2 days per wt:ek. Assemblies *C 1.5 Moratorium on new entrants to the fishery.
Log books At sea enforcement Port state measures.
L.-.-•
·-··--····-··-·--- - ··----
5The allocation of tl1ese rights in days will be limited to a minimum period of one trimester (no monthly licences). Fishing days authorization will be based
on calendar days without derogations for days not spent fishing due to weather or vessel repairs.
�h
•
,,.
\
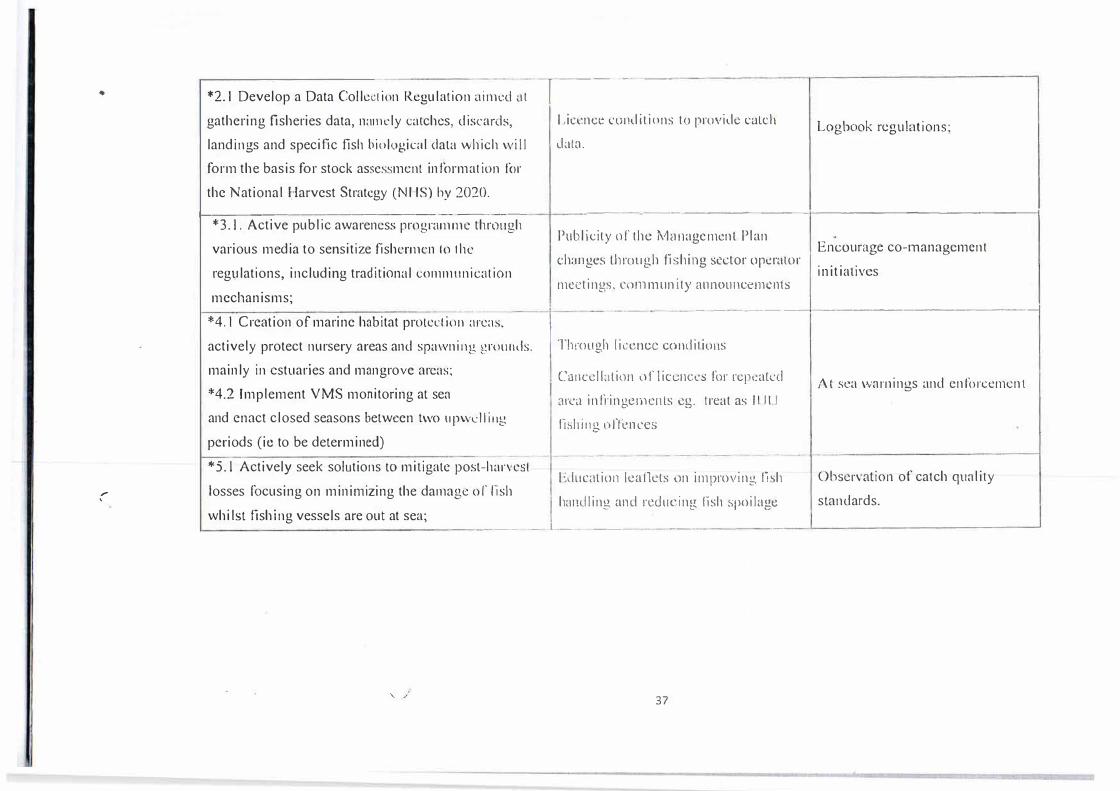
*2.1 Develop a Data Collcc,lion Regulation ainwd at 1------ --·gathering fisheries data, namely catches, discards, landings and specific fish biological data which will form the basis for stock assessment in formation for the National 1:-{arvest Strategy (NI IS) by 2020.
f.---------------------------
*3.1. Active public awareness programme throughvarious media to sensitize fishermen to thereg�ilations, including traditional comm11nication
mechanisms;*4.1 Creation of marine habitat protect ion areas, I
actively protect nursery areas and spawning trot11Hls. I
mainly in estuaries and mangrove areas;*4.2 Implement VMS monitoring at seaand enact closed seasons between two upwclli11g
periods (io to be determined)
*5.1 Actively seek solutions to mitigate post-harvestlosses focusing on minimizing the damage or· fish
Licence co11dilions to provide catch
data. Logbook regulations;
----- ---·-- ------------! -----------------------1
Publicity of the Management Plan eh:rnges through fishing sector operator
meetings, community announcements
Encourage co-management initiatives
-------- --,------------------------1
Through lil"cncc conditions
Canc�lblil)ll oflic�11ccs for rcpcakd area infringcmcnls cg. treat as 11 II I lisliing ofli.'nces
Educntion kalkts on improving lish handling and redt1c.ing: fish spoilagt!
/\t sea warnings and enforcement
Observation of catch quality standards.
whilst fishing vessels are out at sea;�-- -- [ __ -- - -
·, �37
, 1
•
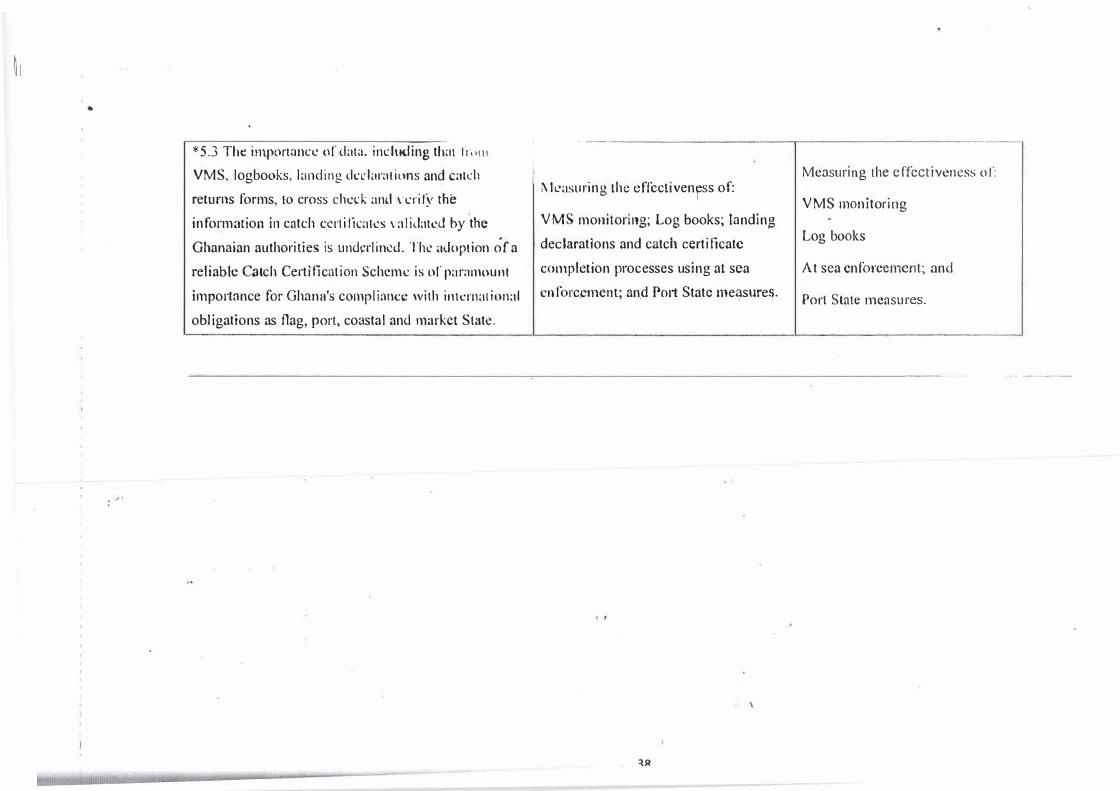
* 5.3 The ini.porrnncc or data. including that fr, 1111
VMS. logbooks, landing declarations and catdi
returns forms, to cross check and , cri ry the
information in catch ccrtilica1t.:s ,·alidated by tne
Ghanaian authoriti es is und�rlined. The .i�option of a
reliable Catch Certification Scheme is or paramount
impo11ance for Ghana's compli::mce with international
obligations as flag, port, coastal and market State.
-- ·----
1 I\ leasuring the effcctivenrss of:
VMS monitoring; Log books; landini
declarations and catch certificate
completion processes using at sea
cnforcpmcnt; and Po11 State me�sures.
�R
Measuring the effectiveness or:
VMS monitoring
Log books
At sea enforcement; and
Port State measures.
•
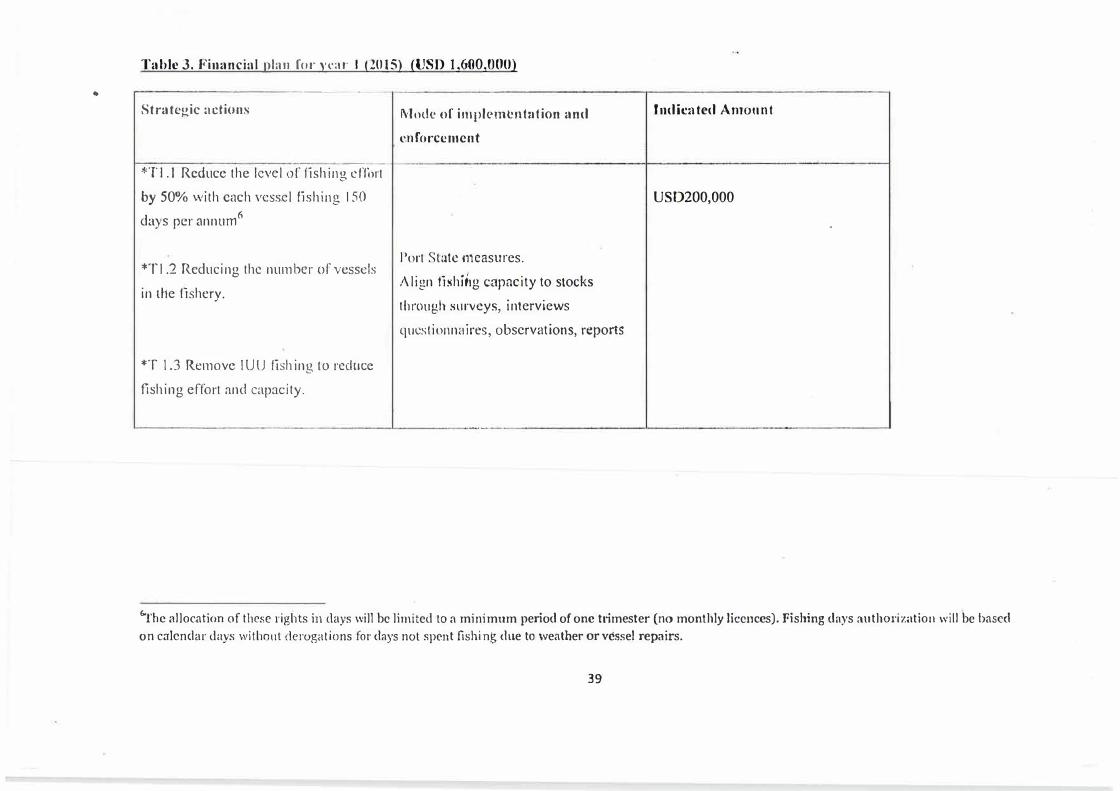
Table 3. Financial phm for yi·ar I (10l5) (USD 1,600,000)
-·-
Strategic actions
-
·- -
*TI. I Reduce the level of fishing clfort
by 50% with each vessel fishing 150
days per annum6
*TI .2 Reducing the number of vessels
in tl1e fishery.
*T 1.3 Remove IUU fishing to reduce
fishing effort and capacity.
Mode of implemcnt:1tion and
<.'nforcemcnt
Port State measures.
Align foihittg capacity to stocks
through surveys, interviews
questionnaires, observations, reports
·--
Indicated Amount
USD200,000
.
61'hc allocation of these rights in days will be limited to a minimum period of one trimester (no monthly licences). Fishing days authoriz.ttion will be based on calendar days withonl derogations for dnys not spent fishing due to weather or vessel repairs.
39
•
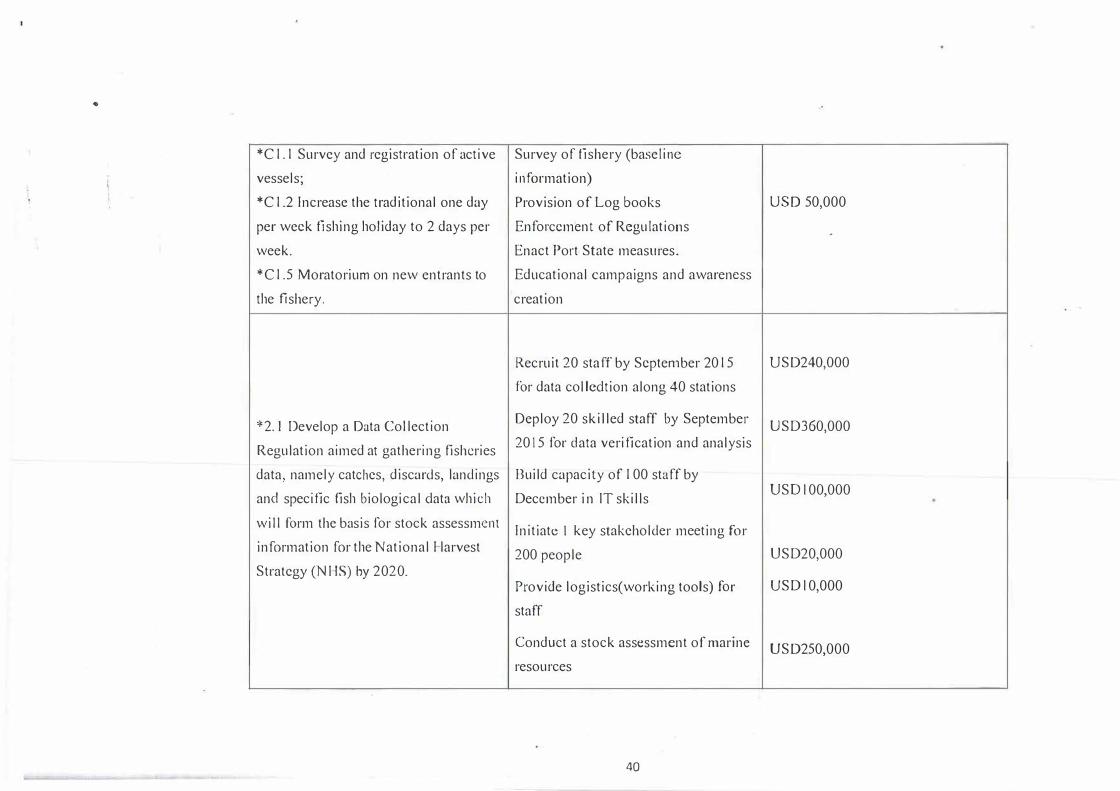
*C 1. 1 Survey and registration of active Survey of fishery (baseline
vessels; in formation)
*C 1.2 Increase the traditional one day Provision of Log books USO 50,000
per week fishing holiday to 2 days per Enforcement of Regulations -
week. Enact Port State measures.
*C 1.5 Moratorium on new entrants to Educational campaigns and awareness
the fishery. creation
Recruit 20 staff by September 20 15 US0240,000
for data col lcdtion along 40 stations
*2.1 Develop a Data CollectionDeploy 20 skilled staff by September
USD360,000
Regulation aimed at gathering fisheries 2015 for data verification and analysis
data, namely catches, discards, landings I3uild capacity of 100 staff by
and specific lish biological data which December in IT skills USDI00,000
wi 11 form the basis for stock assessment Initiate I key stakeholder meeting for
information for the National I larvest 200 people USD20,000
Strategy (NI IS) by 2020. Provide logistics(working tools) for USDI0,000
staff
Conduct a stock assessment of marine US0250,000 resources
40
• ,------· -
Strntt-gic adiu11s
*3. J. Active public awareness
programme through various media to
sensitize fishermen of' Lile regulations,
including traditional communication
mechanisms;
Mode of implementation and
enforcement
Co-management initiatives
established through durbars, radio
programmes TV adverts and print
media etc.
USD20,000
*4. l Creation of marine habitat
protection areas, actively protect
nursery areas and spawning ground'>.
mainly in estuaries and mangrove
areas;
Survey conducted to establish areas I USD50,000
Educational campaigns and awareness I USD20,000
creation
*4.2 Implement closed sea�ons hdwcen
two upwclling periods I month closure
each June ( all species) and 2 lllonlhs
dcmcrsal species).
Enforcement of Regulations
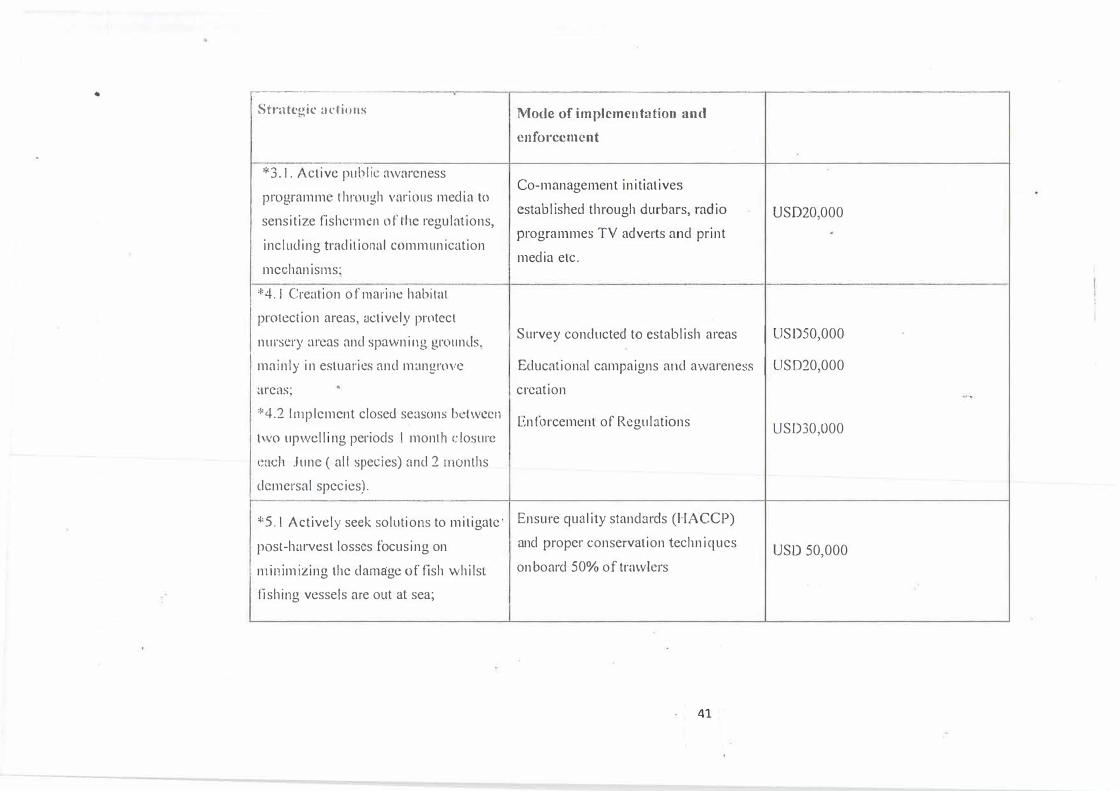
�'5.1 Actively seek solutions to mitigate' Ensure quality standards (HACCP)
post-harvest losses focusing on and proper conservation techniques
nlinimizing the damage of fish whilst on board 50% of trawlers
fishing vessels are out at sea;
41
USD30,000
USO 50,000
..
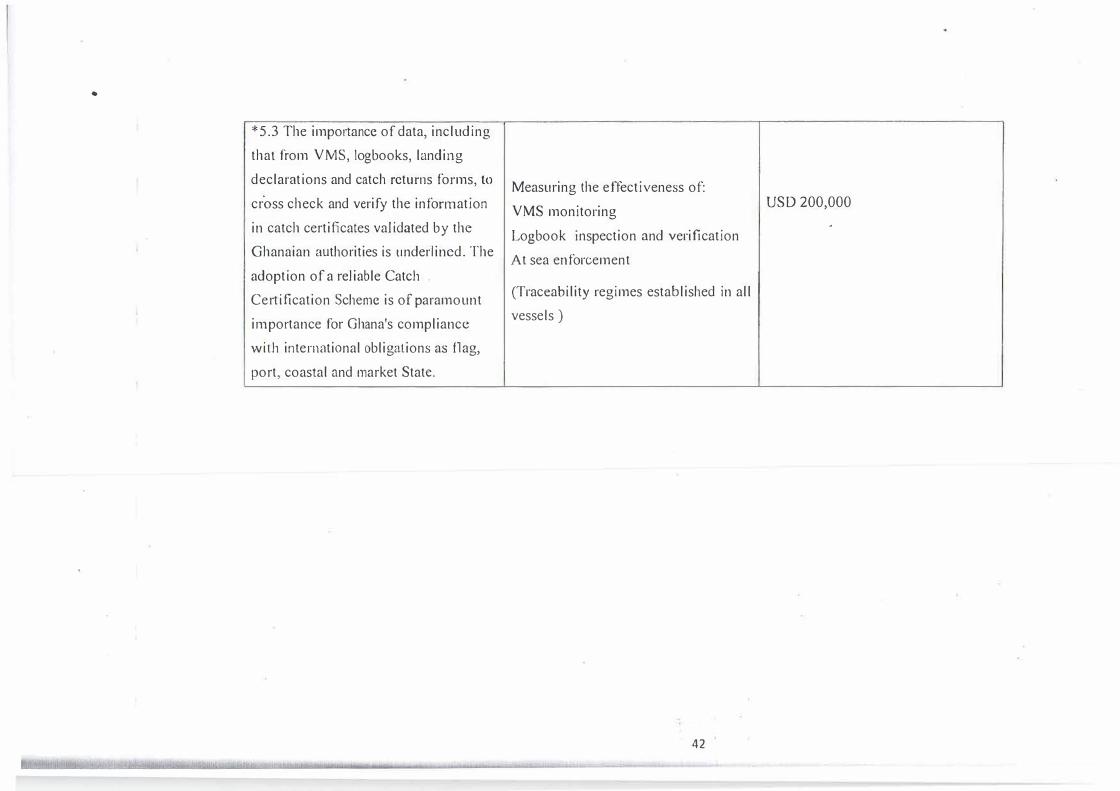
*5.3 The impo1tance of data, including
that from VMS, logbooks, landing
declarations and catch returns forms, to Measuring the effectiveness of: USD 200,000 cross check and verify the information VMS monitoring
, in catch certificates validated by the Logbook inspection and verification Ghanaian authorities is underlined. The At sea enforcement adoption of a reliable Catch
Certification Scheme is of paramount(Traceability regimes established in all
importance for Ghana's compliancevessels)
with international obligations as flag,
port, coastal and market State.
42
Rcfcre:nc'-'s
Thiago, D. and E. Mensah. 2014. Modernization of the Fishing Vessels Registry and Licensing
System to Enhance Sustainable Management of Ghana's Fisheries: Final Report.
\VARFP- Ghana.
World Bank 2011: Project Appraisal Document on a Proposed Credit to the Republic of Ghana. Report no. 57898-GH. World Bank Washington DC.
World Bank (2013) Annex 2: Time lines for strategic action plan implementation 2015-
2020
Anon (2013) 2013 Annual Report - · Fisheries, Ministry of Fisheries and Aquaculture
Development
43
•
•
.\ppen<ii'\'.
----- -------------
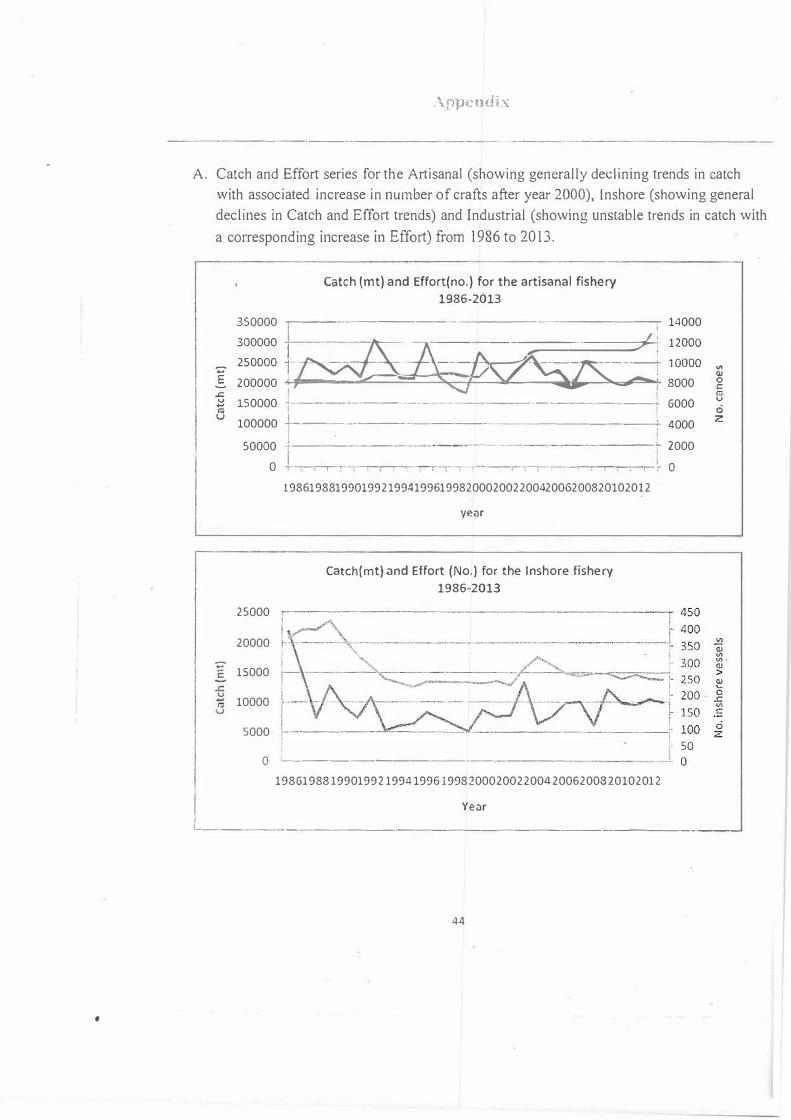
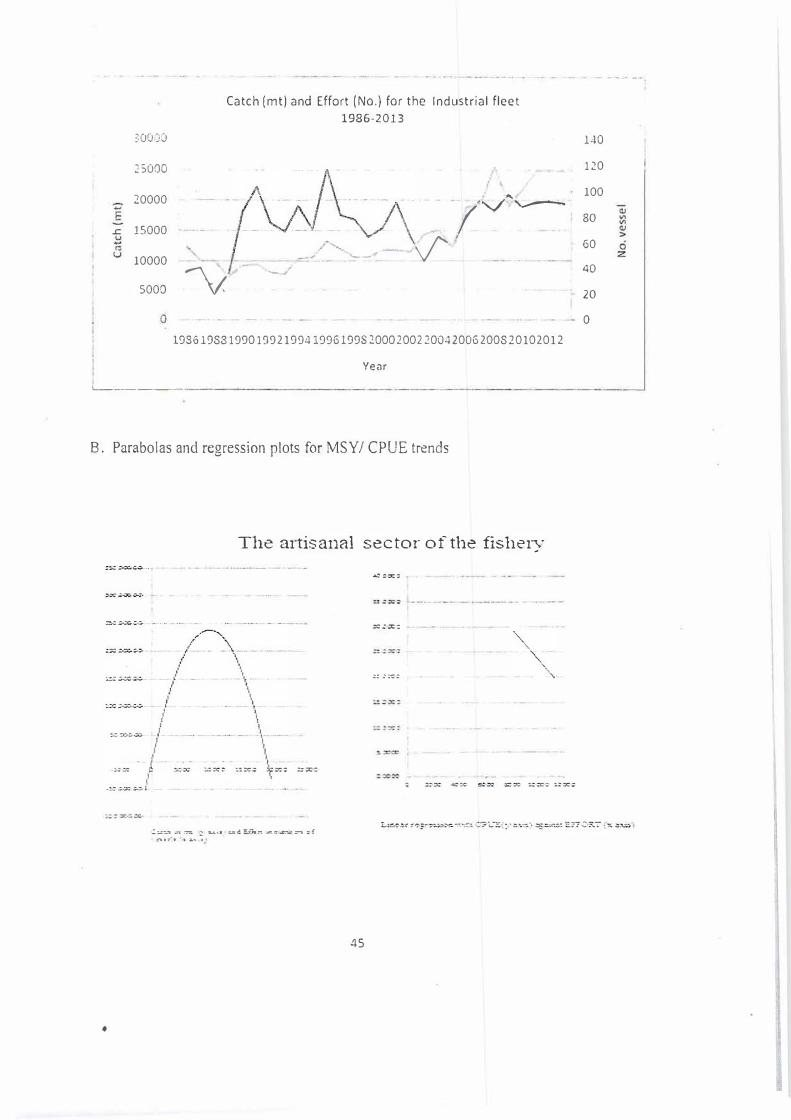
A. Catch and Effort series for the Artisanal (showing generally declining trends in catch
with associated increase in number of crafts after year 2000), Inshore (showing general
declines in Catch and Effo1t trends) and Industrial (showing unstable trends in catch with
a corresponding increase in Effort) from 1986 to 2013.
Catch (mt) and Effort(no.) for the artisanal fishery 1986-2013
350000 -,--- · -----·- ------- , 14000
'° :����� ���&}i,; D� :�:� �! 200000 �-,,..__-"!t.-. -'---- :'2},_-�-----·�--�--'· - : 8000 §� 150000 t-----·-·--···-- -- ------ ---i 6000 ciV 1000001---
.- ------------ -----· -;---L 4000 z
E
50000 ------- �-··--- -----1.. 2000
0 1--.-r-T· -�� ··-, -- • �--, •-,-,..- -��;-,-• 0
25000
20000
15000
10000
5000
19861988199019921994199619982000200220042006200820102012
year
Catch(mt) and Effort (No.) for the Inshore fishery 1986-2013
0 1_.. _________________ _
19861988 199019921994199619982000200220042006200820102012
Year
. so
·-- 0
L------------------------------------'
44
300)0
25000
20000
.c 15000
10000
5000
Catch !mt) and Effort !No.) for the Industrial fleet
1986-2013
�,. --
- -,v"'�
( \/'
V. _.,,
19361983199019921994199619982000200220042006200820102012
Year
L__ ____ _
B. Parabolas and regression plots for MSY/ CPUE trends
•
The artisanal sector of the fishery
::::c:
=-� .... ""' : -.J -��-t � .. �;;='""' ;!
�·:-·, \a.-, .
45
.:.:x: ...
:;:x:
:.: : :?: .:
l�O
120
100
80
60
40
20
0
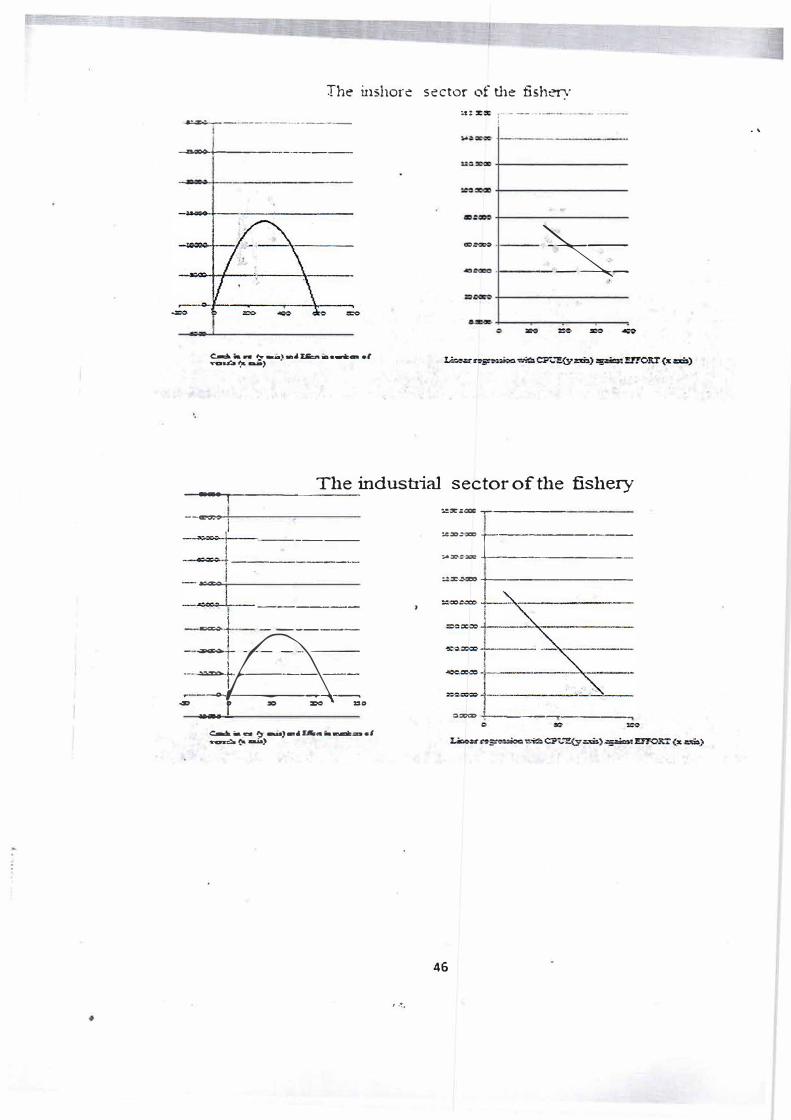
Jhe inshore sector of the fishery
�----,-- ---------.. ----
--+------------
c..•-�--� ... �-._ ....... , vaab�...,.,
�: X'X r· -· -!
... =
-
� -
The indust:Iial sector of the fishery -.o..,occc»o.,._,.
1 __________ _
----, ----
�ex:"------------------
.,cc� I - ---·-·--
.- � � - r "° �\ = .. �::x:::
C--iaC"a ,,.-.. ... )--•£.Sr•a .. .-.::n.,-ta---,
�.:-a:c..------
:::: :=================::====�:�------------
Q!l0CD.+------·-.-----�
46
l � •
. '
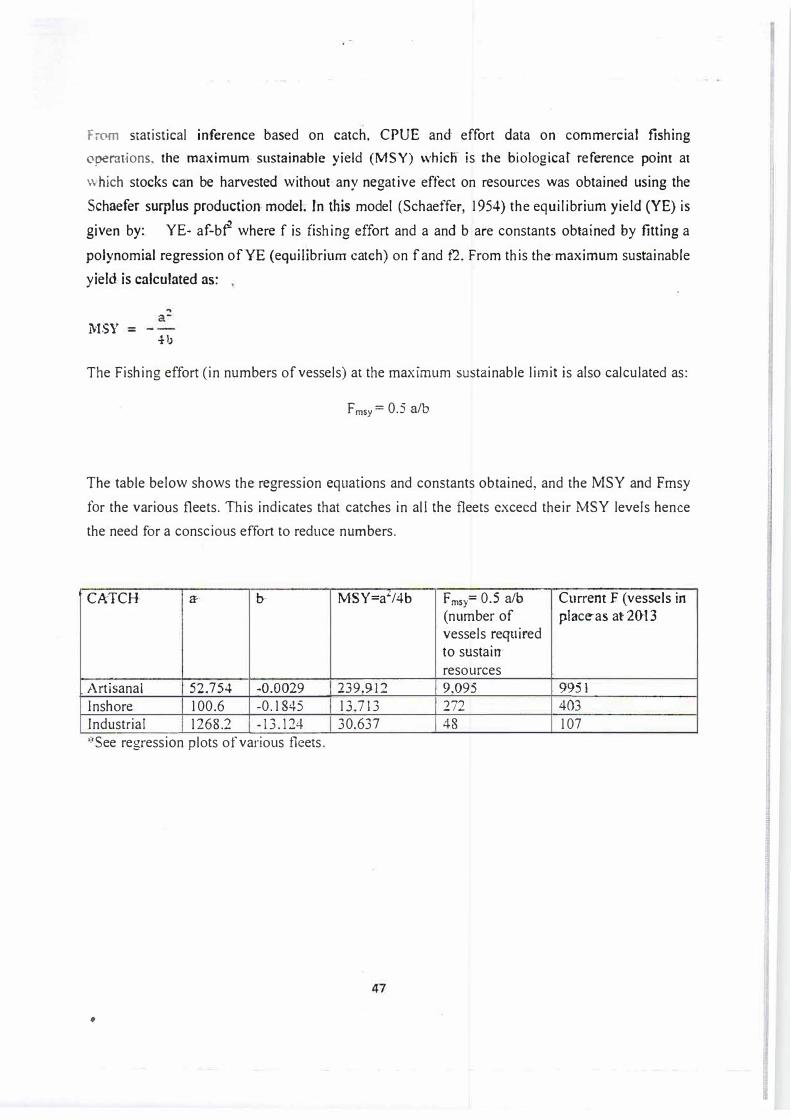
f :-ooi statistical inference based on catch, CPUE and effort data on· commercial fishing 0perat-ions, the maximum sustainabte yield (MSY) whicn is the biotogicar reference point at
v. hich stocks can be harvested without any negative effect on resources was obtained using the
Schaefer surplus production- model. rn tliis model (Schaeffer, 1954) the equilibrium yield (YE) is
given by� YE- af-bf where f is fishing effort and a and b are constants obtained by fitting a
polynomial regression of YE (equilibriumcateh) on fand f2. From this the-maximum sustainableyield is calculated as:
MSY = 4b
The Fishing effort (in numbers of vessels) at the maximum sustainable limit is also calculated as:
Fmsy= 0.5 a/b
The table below shows the regression equations and constants obtained, and the MSY and Fmsy
for the various fleets. This indicates that catches in all the fleets exceed their MSY levers hence the need for a conscious effort to reduce numbers.
·cATCH a-· b- MSY=a"/4b Fmsy= 0.5 a/b Current E (vessels in
(number of pJace-·as at20B vessels required to sustairr resources
Artisanal 52.754 -0.0029 239,912 9,095 9951
Inshore. 100.6 -0.1845 13,713 272 403 Industrial 1268.2 -13.124 30,637 48 107 *See regression plots of various fleets .
•
•
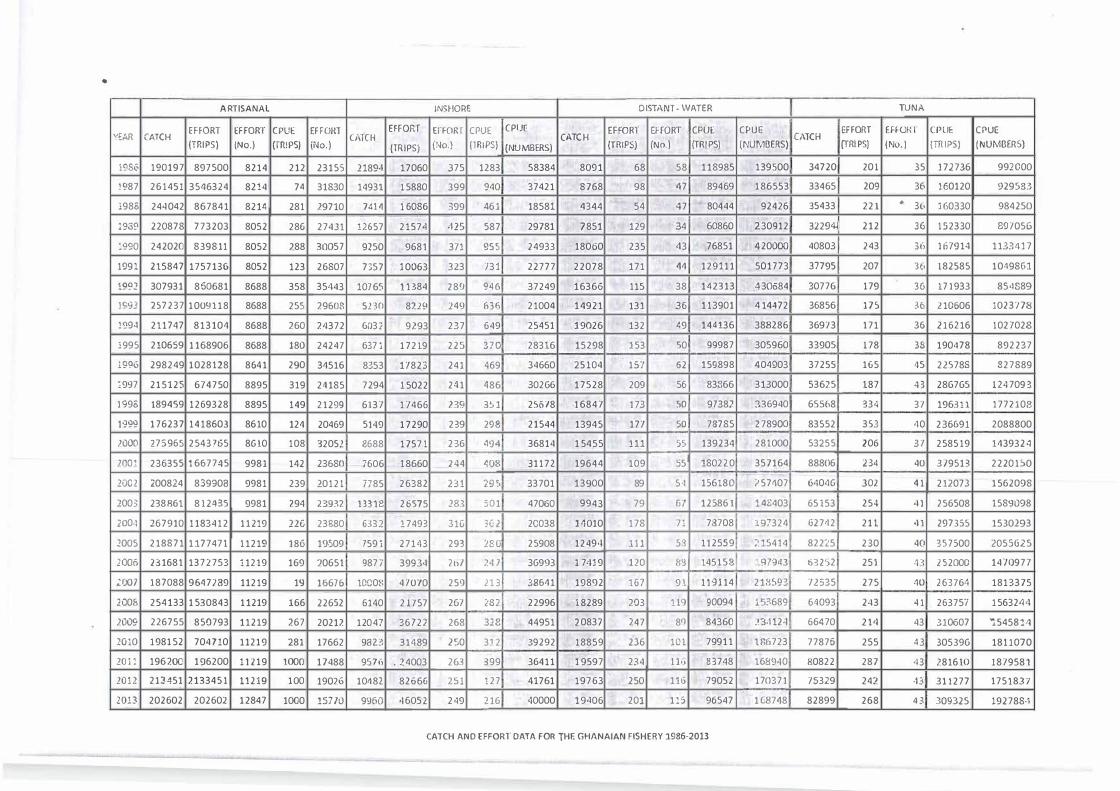
ARTISANAL INSHORE DISTANT· WATER TI.JNA
EFFORT EFFORT CPUE EFFORT EFFORT EFfORf CPU!: CPUE EFFORT EFFORT CPUE CPUE EFFORT ffFUK I C.PUE CPUC V£AR CATCH (;\T(I� CATCH
(No.) (TRIPS) (NUMBERS) CATCH
[TRIPS) {No.) {TRIPS) {NUMBERS) {TRIPS) {No.) (TRIPS) (No.) {TRIPS) {No.) (TRIPS) (NUMBERS) {TRIPS)
1986 190197 897500 8214 212 23155 21894 17060 375 1283 58384 8091 68 58 118985 139500 34720 201 35 172736 992000
!987 261451 3546324 8214 74 31830 14931 15880 399 940 37421 8768 98 47 89469 186553 33465 209 36 160120 929583
1988 244042 867841 8214 281 29710 7414 16086 399 461 18581 4344 54 47 80444 92426 35433 221 • 36 160330 984250
1989 220878 773203 8052 286 274Jl 12657 21574 ,125 587 29781 7851 129 34 60860 230912 32294 212 36 152330 897056
:990 242020 839811 8052 288 30057 9250 9681 371 955 24933 18060 235 43 76851 420000 40803 243 36 167914 113.3417
1991 215847 1757136 8052 123 26807 7357 10063 323 /31 22777 22078 171 44 129111 501773 37795 207 36 182585 1049861
1�92 307931 860681 8688 358 35443 10765 11384 289 946 37249 16366 115 38 142313 430684 30776 179 3(, 171933 8511889
1c.93 257237 1009118 8688 255 29608 5BO 8229 149 636 21004 14921 13J 36 113901 414472 36856 175 36 l10606 1023178
!<194 211747 813104 8688 260 24372 6032 9293 237 649 25451 19026 132 49 144136 388286 36973 171 36 216216 1027028
1995 210659 1168906 8688 180 24247 6371 17219 225 370 28316 15298 153 50 99987 305960 33905 178 38 190478 892237
19% 298249 1028128 8641 290 34516 8353 17823 241 469 34660 25104 157 62 159898 404903 37255 165 45 225788 327889
,997 215125 674750 8895 319 24185 7294 15022 241 486 30266 17528 209 56 83866 313000 53625 187 43 286765 1247093
1998 189459 1269328 8895 149 21299 6137 17466 )?,9 3�1 25678 16847 173 so 97382 336940 65Sh8 334 37 196311 1777108
1999 176237 1418603 8610 124 20469 5149 17290 239 298 21544 13945 177 so 78785 2.78900 83552 353 40 236691 2088800
7000 275965 2543765 8610 108 3205l 1:688 17571 236 494 36814 15455 111 55 139234 281000 53255 206 37 258519 1439324
)001 236355 1667745 9981 142 23680 7606 18660 244 408 31172 19644 109 55' 180220 357164 88806 234 40 379513 2220150
2002 200824 839908 9981 239 20121 /785 26382 231 295 33701 13900 89 5.1 156180 157407 64046 302 41 212073 1562098
2003 238861 812435 9981 294 239'1'2 13318 26575 .'>83 �01 47060 9943 79 6'/ 125861 14S403 65153 254 41 256508 1589098
200·1 267910 1183412 11219 226 23880 6,$32 17493 316 �G.l 20038 14010 178 71 78708 ,97324 G2742 211 •11 297355 1530293
2005 218871 1177471 11219 186 19509 7591 27143 293 280 25908 1249<1 111 5•3 112559 :'15414 82225 230 40 357500 2055625
1006 231681 1372753 11219 169 20651 9877 39934 ibl 247 36993 1 7419 120 8'l 145158 .97;}43 63252 251 4 .{ 252000 1470977
2007 187088 95q7739 11219 19 16676 10008 47070 259 J13 38641 19892 167 9l 119114 213593 72535 275 40 263764 1813375
2005 254133 1530843 11219 166 22652 6140 21757 267 LS2 22996 18289 203 11'1 90094 15:1689 64093 243 41 263757 1563244
7.009 226755 850793 11219 267 20212 12047 36722 268 322 44951 20837 247 8rJ 84360 23•1124 66470 214 43 310607 ': 545814
2010 198152 704710 11219 281 17662 982:1 31489 250 312 39292 18859 236 lO'l 79911 t8b723 77876 255 43 305396 1811070
20Ji 196200 196200 11219 1000 17488 9S7f, . 24003 263 399 36411 19597 234 11•1 83748 168940 80822 287 43 }81610 1879581
1012 213451 2133451 11219 100 19026 10482 82666 2�1 127 41761 19763 250 116 79052 170371 75329 242 43 311277 1751837
2013 202602 202602 12847 1000 15770 9950 46052 249 216 40000 191106 201 115 96547 168748 82899 268 4� 309325 192788-�
CATCH ANO EFFORT DATA FOR THE GHANAIAN FISHERY 1986-2013