Embed Size (px)
Citation preview

ISSN 1198-6727
FisheriesCentreResearchReports
2020 Volume 28 Number 5
Updating to 2018 the 1950-2010 marine catch reconstructions of
the Sea Around Us: Part I - Africa, Antarctica, Europe and
the North Atlantic
Institute for the Oceans and Fisheries, The University of British Columbia, Canada

Please cite as: B. Derrick, M. Khalfallah, V. Relano, D. Zeller and D. Pauly (eds.) 2020. Updating to 2018 the 1950-2010 marine catch reconstructions of the Sea Around Us: Part I - Africa, Antarctica, Europe and the North Atlantic. Fisheries Centre Research Reports 28(5): 321 pp.
© Institute for the Oceans and Fisheries, The University of British Columbia, 2020 Fisheries Centre Research Reports are Open Access publications
ISSN 1198-6727
Institute for the Oceans and Fisheries University of British Columbia,
2202 Main Mall, Vancouver, BC, V6T 1Z4.
This research report is indexed in Google Scholar, Research Gate, the UBC library archive (cIRcle).

2020 Fisheries Centre Research Reports 28(5)
2
TABLE OF CONTENTS DIRECTOR’S FOREWORD ............................................................................................................................................ 6 PREFACE .................................................................................................................................................................... 7 UPDATING TO 2018 THE 1950-2020 MARINE CATCH RECONSTRUCTIONS OF THE SEA AROUND US ............................... 9 SEMI-AUTOMATION PROCEDURE FOR CATCH RECONSTRUCTION FORWARD CARRY ....................................................... 15
Supranational data sources ........................................................................................................................... 16 National data ................................................................................................................................................. 16 The reported catch in the output is greater than that of the input .............................................................. 19 The unreported catch in the semi-automation years is rising too quickly ................................................... 19 The reported catch spikes in the semi-automation years ............................................................................. 19
African countries catch reconstruction updates ................................................................................................... 21 ANGOLA: UPDATED CATCH RECONSTRUCTION FOR 2011-2018 ................................................................................... 22 CAMEROON: UPDATED CATCH RECONSTRUCTION FOR 2011-2018 .............................................................................. 27 CÔTE D'IVOIRE: UPDATED CATCH RECONSTRUCTION FOR 2011-2018 ........................................................................ 31 THE GAMBIA: UPDATED CATCH RECONSTRUCTION FOR 2011-2018 ........................................................................... 35 GHANA: UPDATED CATCH RECONSTRUCTION FOR 2011-2018 .................................................................................... 40 KENYA: UPDATED CATCH RECONSTRUCTION FOR 1950-2018 .................................................................................... 46 MAURITANIA: UPDATED CATCH RECONSTRUCTION FOR 2011-2018 ........................................................................... 60 MOZAMBIQUE: UPDATED CATCH RECONSTRUCTION FOR 2011-2018 ......................................................................... 65 MARINE FISHERIES IN THE SOMALI EEZ, UPDATED TO 2018 ..................................................................................... 69 SOUTH AFRICA: UPDATED CATCH RECONSTRUCTION FOR 2011-2018 ......................................................................... 72 TANZANIA: UPDATED CATCH RECONSTRUCTION FOR 2011-2018 ............................................................................... 77 MADAGASCAR AND SMALLER ISLANDS IN THE WESTERN INDIAN OCEAN: UPDATED CATCH RECONSTRUCTIONS FOR 2011-2018 .............................................................................................................................................................. 81
Comoros Island ............................................................................................................................................. 81 Îles Éparses /Mozambique Channel Islands ................................................................................................ 83 Madagascar .................................................................................................................................................... 84 Mauritius ....................................................................................................................................................... 86 Mayotte (France) ........................................................................................................................................... 88 Réunion (France) .......................................................................................................................................... 90 Seychelles ...................................................................................................................................................... 92
Updating to 2018 the 1950-2010 catch reconstructions for islands off West Africa ......................................... 100 Ascension Island (United Kingdom) ........................................................................................................... 100 Canary Islands (Spain) ................................................................................................................................. 101 Cape Verde ................................................................................................................................................... 103 Madeira Island (Portugal) ........................................................................................................................... 105 Saint Helena (United Kingdom) ................................................................................................................. 106 São Tomé and Príncipe ............................................................................................................................... 107 Tristan da Cunha Island (United Kingdom) ............................................................................................... 109
UPDATING TO 2018 THE CATCH RECONSTRUCTIONS FOR 14 COUNTRIES OF THE WEST AFRICAN MAINLAND ............. 115

Updating to 2018 the 1950-2010 marine catch reconstructions of the Sea Around Us: Part I – Africa, Antarctica, Europe and the North Atlantic
3
Benin ............................................................................................................................................................. 116 Congo (Brazzaville) ...................................................................................................................................... 118 Congo (Ex-Zaïre) ......................................................................................................................................... 120 Equatorial Guinea ........................................................................................................................................ 121 Gabon ........................................................................................................................................................... 122 Guinea .......................................................................................................................................................... 125 Guinea-Bissau ............................................................................................................................................. 126 Liberia ........................................................................................................................................................... 127 Morocco (Atlantic) ...................................................................................................................................... 129 Namibia ........................................................................................................................................................ 131 Nigeria ......................................................................................................................................................... 132 Senegal ......................................................................................................................................................... 134 Sierra Leone ................................................................................................................................................. 136 Togo .............................................................................................................................................................. 137
ANTARCTICA AND SURROUNDING ISLANDS: UPDATED CATCH RECONSTRUCTIONS FOR 2011-2018 ............................ 148 Antarctica (Large Marine Ecosystem) ........................................................................................................ 148 Bouvet Island (Norway) .............................................................................................................................. 150 Crozet Island (France) .................................................................................................................................. 151 Falkland Islands (U.K.) ............................................................................................................................... 154 Kerguelen Islands (France) ......................................................................................................................... 156 Prince Edward Island (South Africa) ........................................................................................................... 157 St. Paul and Amsterdam Islands (France) .................................................................................................. 158 South Georgia, South Sandwich and South Orkney Islands (United Kingdom) ....................................... 159
EUROPEAN COUNTRIES CATCH RECONSTRUCTION UPDATES ..................................................................................... 166 DENMARK (BALTIC SEA): UPDATED CATCH RECONSTRUCTION FOR 2011-2018 ......................................................... 167 GEORGIA: UPDATED FISHERIES CATCH RECONSTRUCTION TO 2018 .......................................................................... 174 GREECE INCLUDING THE ISLAND OF CRETE: UPDATED CATCH RECONSTRUCTION TO 2018 ........................................ 179 SPAIN (MEDITERRANEAN AND GULF OF CADIZ): CATCH RECONSTRUCTION UPDATE TO 2018 ................................... 188 TURKEY (BLACK, MARMARA, AND MEDITERRANEAN SEA): UPDATED CATCH RECONSTRUCTION TO 2018 ................... 197 BLACK SEA: UPDATED CATCH RECONSTRUCTIONS TO 2018 ..................................................................................... 205
Bulgaria ....................................................................................................................................................... 205 Romania ...................................................................................................................................................... 206 Russia (Black Sea) ....................................................................................................................................... 208 Ukraine ........................................................................................................................................................ 210
ISLANDS IN THE NORTH ATLANTIC: ........................................................................................................................ 216 UPDATING CATCH RECONSTRUCTIONS TO 2018 ....................................................................................................... 216
Azores Islands (Portugal) ............................................................................................................................. 217 Bermuda (United Kingdom) ........................................................................................................................ 217 Faeroe Islands (Denmark) .......................................................................................................................... 219 Greenland (Denmark) ................................................................................................................................. 219

2020 Fisheries Centre Research Reports 28(5)
4
Iceland ......................................................................................................................................................... 221 Ireland ......................................................................................................................................................... 223 Jan Mayen and Svalbard Islands (Norway) ................................................................................................ 224 United Kingdom and Channel Islands (UK) ............................................................................................... 225
BALTIC SEA: UPDATED CATCH RECONSTRUCTIONS TO 2018 ..................................................................................... 232 Estonia ......................................................................................................................................................... 232 Finland ......................................................................................................................................................... 234 Germany (Baltic Sea) .................................................................................................................................. 236 Latvia ........................................................................................................................................................... 237 Lithuania ..................................................................................................................................................... 239 Poland .......................................................................................................................................................... 240 Russia (Baltic Sea) ....................................................................................................................................... 242 Sweden (Baltic) ............................................................................................................................................ 244
MEDITERRANEAN: UPDATED CATCH RECONSTRUCTIONS TO 2018 ............................................................................ 251 Albania ......................................................................................................................................................... 253 Algeria .......................................................................................................................................................... 254 Bosnia and Herzegovina .............................................................................................................................. 255 Croatia ......................................................................................................................................................... 256 Cyprus (North and South) ........................................................................................................................... 258 Egypt (Mediterranean) ................................................................................................................................ 260 France (Corsica) .......................................................................................................................................... 261 France (Mainland) ....................................................................................................................................... 264 Israel (Mediterranean) ................................................................................................................................ 267 Italy (mainland, Sardinia and Sicily) .......................................................................................................... 268 Lebanon ....................................................................................................................................................... 270 Libya ............................................................................................................................................................. 271 Malta ............................................................................................................................................................ 272 Montenegro ................................................................................................................................................. 272 Morocco (Mediterranean) ........................................................................................................................... 274 Palestine (Gaza Strip) .................................................................................................................................. 274 Slovenia ....................................................................................................................................................... 275 Spain (Balearic Islands) .............................................................................................................................. 276 Syria ............................................................................................................................................................. 278 Tunisia ......................................................................................................................................................... 279
NORTHWESTERN AND NORTHERN CONTINENTAL EUROPE: UPDATED CATCH RECONSTRUCTIONS TO 2018 ............... 295 Belgium ........................................................................................................................................................ 296 Denmark (North Sea) .................................................................................................................................. 298 France (Atlantic Coast) .............................................................................................................................. 300 Germany (North Sea) .................................................................................................................................. 302 The Netherlands .......................................................................................................................................... 303 Norway (Mainland) ..................................................................................................................................... 305
Updating to 2018 the 1950-2010 marine catch reconstructions of the Sea Around Us: Part I – Africa, Antarctica, Europe and the North Atlantic
5
Portugal (Mainland) .................................................................................................................................... 307 Russia (Barents Sea) ................................................................................................................................... 309 Spain (Northwest) ........................................................................................................................................ 311 Sweden (West Coast) ................................................................................................................................... 313

2020 Fisheries Centre Research Reports 28(5)
6
DIRECTOR’S FOREWORD In 2016, Dr. Daniel Pauly and Dr. Dirk Zeller were co-editors on GLOBAL ATLAS OF MARINE FISHERIES: AS CRITICAL APPRAISAL OF CATCHES AND ECOSYSTEMS IMPACTS. This book encapsulated data collected by the Sea Around Us Project, documenting fisheries catch reconstructions for all maritime countries of the world, which initially covered the years from 1950 to 2010. Prior to this opus there has been only one source of data on global fishery catches: information reported to the Food and Agriculture Organization of the United Nations by member countries. The Sea Around Us Project spent ten-years undertaking this epic study, showing that the officially reported catch data was misleading, with many countries underreporting the catch by as much as 500%, while others significantly overreported their catches. The study also included poorly reported data from small-scale, sport and recreational fishers; information that was not included in FAO figures. What you are looking at now is an update of that study, documenting the update to 2018 of the Sea Around Us’ fisheries catch reconstructions for all maritime countries of the world. It is the first of two volumes that cover African countries and territories, including the many islands surrounding that continent, Antarctica and its surrounding island territories, and Europe, with the North Atlantic islands and southern Mediterranean countries added in. A second volume, “Updating to 2018 the 1950-2010 marine catch reconstructions of the Sea Around Us: Part 2” 28(6) covers the Americas, including the Caribbean and much of the Indo-Pacific region, i.e., East, South, Southeast and East Asia, and Oceania. This was a huge task and I would very much like to thank the Sea Around Us’ authors, editors and contributors for such monumental undertaking. Well done! Evgeny Pakhomov Director, Institute for the Oceans and Fisheries, University of British Columbia, 2202 Main Mall, Vancouver, BC, V6T 1Z4, Canada

Updating to 2018 the 1950-2010 marine catch reconstructions of the Sea Around Us: Part I – Africa, Antarctica, Europe and the North Atlantic
7
PREFACE About five years into the work of the Sea Around Us, which began in mid-1999, we conceived ‘catch reconstruction’ as an approach to overcome structural deficiencies with the global marine fisheries statistics published since 1950 by the Food and Agricultural Organization of the United Nations (FAO). These data, based on the annual submissions by FAO member countries, omit the bulk of catches generated by small-scale fisheries, i.e., artisanal, subsistence and recreational fisheries, despite the importance of the first two for the food security of the majority of FAOs member countries and the economic importance of recreational fishing in several others, for example, Australia. As well, despite their importance for ecosystem-based fisheries management, FAO statistics explicitly exclude fish that were caught and subsequently discarded. These statistics also omit broad range estimates for illegal or otherwise unreported fisheries known to exist but for which precise catch data are not available. These multiple omissions cause official catch statistics to be biased downward. In 2005, the Sea Around Us undertook the challenge of correcting this flaw and making a more complete global marine fisheries data set available to researchers, civil society, and interested governments. The work involved in this undertaking was enormous. We completed the project over 10 years later only because of the enthusiastic support we received from hundreds of colleagues throughout the world, all of whom helped us document the fisheries and their catches from the waters of over 200 countries and island territories for the 61 years from 1950 to 2010 in a comprehensive atlas1. These data and a variety of derived products (fisheries status indicators, maps, etc.) are available on our website (www.seaaroundus.org) and are being used, as we had hoped, by a multitude of colleagues, non-governmental organizations, and even a few government agencies. In 2017, an update to 2014 of our reconstructed catch data was released online, but the steps taken and the data used for this update were documented only internally. Therefore, the present report, which documents the update of our catch reconstructions to 2018, also retroactively document the 2014 update. Because catch reconstructions and their updates are very time-consuming, this work was performed, for the overwhelming majority of cases, in a two-step process: (1) the reconstructed catch data were first manually updated from 2010 to either 2014, 2015, 2016 or 2017, and then (2) they were carried forward to 2018 using a semi-automated routine. Step (1) involved searching for additional sources of data to complement officially reported catch statistics. This produced what we call ‘Reported catch ++’, where the two plus signs indicate that information was added to data reported officially by FAO or other agencies, either national or international. Step (2) refers to what we call ‘carry-forward’, which, however, is not a simple extrapolation. Rather, it is a procedure developed by Simon-Luc Noël, a Sea Around Us team member, that uses the reported data for the missing years and from the last few years of reconstruction to guide (or constrain) the extension of the reconstructed catch data. This may be seen as ‘Reported catch +’ because it includes all the new information
1 Pauly, D. and D. Zeller (eds). 2016. Global Atlas of Marine Fisheries: A critical appraisal of catches and ecosystem impacts. Island Press, Washington D.C., xii +497 p.

2020 Fisheries Centre Research Reports 28(5)
8
provided by the reported catch in the years leading to and including 2018 (from FAO, or another international or national agency) in addition to all the information gathered in the previous years. This new procedure, described in the second chapter of this report, allowed us to publish in 2020 catches reconstructed to 2018, i.e., in the same year that FAO published its 2018 capture statistics. This procedure, however, introduces additional, high uncertainty into estimates of unreported catches derived with it, and therefore should not be used regularly or excessively for future years. The documentation of this work, which covers all maritime countries and island territories of the world, briefly presents how the updates and the ‘carry-forwards’ were done, with a brief characterization of the local fisheries2. For nearly all countries and territories we also document, based overwhelmingly on inputs by Ms. Veronica Relano, the degree of protection that may be provided to the fish stocks in the Exclusive Economic Zones (EEZ) of the country or territory in question, notably through the marine protected areas (MPA) that they contain. However, in view of the multitude of countries (or part thereof) and territories covered, this documentation spans two Fisheries Centre Reports, i.e., the one you presently reading, covering most of Africa, Antarctica, Europe, and the North Atlantic Islands, while the other covers the Americas, East, South and Southeast Asia and Oceania3. I thank my co-editors, Brittany Derrick, Myriam Khalfallah, Veronica Relano, and Dirk Zeller for their contribution in shaping this report; Elaine Chu and Sandra W. Pauly for editorial assistance; and the many authors of national and regional chapters, both Sea Around Us team members and external collaborators, for their persistence. On behalf of the Sea Around Us, I also thank the many philanthropic foundations that have enabled us to thrive for over 20 years, notably, the Pew Charitable Trusts, the Paul G. Allen Family Foundation, and the Bloomberg, Marisla, Oak, Packard, Rockefeller, Waterloo and Angell Family Foundations. Last but not least, the Sea Around Us thanks the Minderoo Foundation, our main supporter in 2019-2020, for funding the bulk of the work leading to this catch update to 2018. Daniel Pauly Principal Investigator, Sea Around Us Vancouver, December 2020
2 A large fraction of the citations in this report refers to “Working Papers” (WP) or “Fisheries Centre Research Reports” (FCRR) of the former UBC Fisheries Centre (now Institute for the Oceans and Fisheries, or IOF). For brevity’s sake, the corresponding references will not repeatedly mention that the WP and FCRR are products of the University of British Columbia in Vancouver, Canada. 3 B. Derrick, M. Khalfallah, V. Relano, D. Zeller and D. Pauly (eds). 2020. Updating to 2018 the 1950-2010 Marine Catch Reconstructions of the Sea Around Us. Part II: The Americas and Asia-Pacific. Fisheries Centre Research Report 28(6).

Updating to 2018 the 1950-2010 marine catch reconstructions of the Sea Around Us: Part I – Africa, Antarctica, Europe and the North Atlantic
9
UPDATING TO 2018 THE 1950-2020 MARINE CATCH RECONSTRUCTIONS OF THE SEA AROUND US*
Brittany Derrick and Daniel Pauly
Sea Around Us, Institute for the Oceans and Fisheries, University of British Columbia, 2202 Main Mall, Vancouver, BC, V6T 1Z4, Canada
Abstract This account presents the approaches and methods used to update to 2018 the catch reconstructions performed by the Sea Around Us for the Exclusive Economic Zones of all the world’s maritime countries and territories, which initially covered the years 1950 to 2010. Emphasis is given to overcoming the continued deficiencies of various countries’ catch data reporting systems, and, in particular, mitigating the effect of the ‘presentist bias’ (D. Zeller and D. Pauly 2018. Marine Policy 90: 14-19), i.e., the tendency of official data to report the increasing catch resulting from an improved coverage of landing sites without retroactive corrections of past reports, suggesting increasing national catches where none occurred. Introduction Country-specific catch reconstruction methods are available for 1950-2010 from the database and website of the Sea Around Us (www.seaaroundus.org) for all coastal countries of the world and their overseas territories. Summaries are available in Pauly and Zeller (2016a, 2016b), Zeller et al. (2016), Derrick et al. (2019) and Pauly and Zeller (2019a), and thus need not be reiterated here. Over one hundred of the initial catch reconstructions, documented mainly through Working Papers (e.g., Funes et al. 2015 and Belhabib 2013) or chapters in Fisheries Centre Research Reports (e.g., Zylich et al. 2014 and Persson et al. 2015) were subsequently updated and published in the peer-reviewed literature (e.g., Canty et al. 2019; Léopold et al. 2017). A number of country data sets were updated (and often also corrected) online, either with (see e.g., Divovich et al. 2015) or without documentation. This report resets the clock in terms of documentation, presenting for all the world’s maritime countries and territories what has been done by the Sea Around Us to update the catch reconstructions to the 2018 calendar year. Overall, this report covers 28 countries in detailed, individual chapters, with the remaining 188 countries and territories included in summary sections of regional chapters. Given that the bulk of this report was written in mid-2020, the question may be asked as to why we seem to be 2 years ‘behind’. The explanation is that the Sea Around Us catch reconstructions are mainly based on (i.e., complement) the worldwide fisheries statistics published annually by the Food and Agriculture Organization of the United Nations (FAO), which bases its global capture statistics on harmonized annual submission by their member countries. Because the processes involved in the production of the FAO statistics are complex (Garibaldi 2012), they generally track the national reports with a lag time of about 18 months. The Sea Around Us adds granularity (re-expressing them on a detailed spatial basis, by fishery and gear type, etc.) and neglected catches (discards, recreational and subsistence, etc.) to the FAO statistics (Zeller et al. 2016, 2018). Depending on the staffing level of the Sea Around Us, this process previously required at least a year or more to add to the data
* Cite as: Derrick, B. and D. Pauly. 2020. Updating to 2018 the 1950-2020 marine catch reconstructions of the Sea Around Us, p. 9-14. In: B. Derrick, M. Khalfallah, V. Relano, D. Zeller and D. Pauly (eds). Updating to 2018 the 1950-2010 Marine Catch Reconstructions of the Sea Around Us: Part I – Africa, Antarctica, Europe and the North Atlantic. Fisheries Centre Research Report. 28(5).

2020 Fisheries Centre Research Reports 28(5)
10
published by FAO and other agencies. This lag time has now been shortened by partly relying on the semi-automatic procedure described by Noël (2020). In the face of declining global catches, climate change impacts and continued deficiencies in reported data, updating our catch reconstructions as fast as possible is important. Data deficiencies include the continued lack of coverage by reporting systems of frequently overlooked small-scale (e.g., Zeller et al. 2015) and recreational fishing sectors (Freire et al. 2020) or the effect of practices such as discarding (Zeller et al. 2018) or illegal activities, as well as the false appearance of increases in reported catches due to the ‘presentist bias’ which results from improvements in reporting systems (Zeller and Pauly 2018). Although the FAO has acknowledged these challenges (FAO 2018; Pauly and Zeller 2019b), the quality of the FAO statistics continues to depend on the data it receives from its member countries. In other words, the quality of the FAO statistics is limited by the monitoring and reporting capacity of individual countries to fully estimate the catch removed from their waters. Thus, catch reconstruction continues to be necessary to correct, at least to a certain extent, the official estimates of global removals of marine fish and invertebrate species by all sectors and fishing practices. Methods for updates and corrections Methods for industrial catches of tunas, billfishes, and other large pelagic species Since our first synthesis of the global industrial catch data of tuna, billfishes, and other large pelagic species was published (Le Manach et al. 2016), updates have been made to the methods used to harmonize and spatialize the catch data for industrially caught large pelagic species reported by Regional Fisheries Management Organizations (RFMOs). These updates include harmonizing the more comprehensive RFMO data sets on nominal landings with the spatial subsets of data provided by each RFMO and adding basic levels of discarding to the reported landings data which are presented within Sea Around Us database using algorithms to allocate these catches (and their associated discards) to our ½ degree latitude/longitude cells, and thus to the EEZ of countries (Coulter et al. 2020). Notably, these improved harmonization algorithms now take fishing gear into account, which will enable a close collaboration with the Global Fishing Watch (globalfishingwatch.org) and can also allocate their fishing effort data gathered from satellites (Kroodsma et al. 2018). Also, our algorithms allow consideration of the data uncertainty associated with our maps of tuna and billfish catches. Future research will undertake an in-depth reconstruction of the global industrial large pelagic fisheries catches, and thereby provide time series of unreported landings estimates that are currently lacking for these global industrial fisheries. Note that to avoid double counting, because they are handled separately (as data ‘Layer 3’), the industrial catches of large pelagic species are not considered when reconstructing the catch of a given county in its own EEZ (‘Layer 1’) and the distant water fleet catches of non-large pelagic species in the EEZs of various countries (‘Layer 2’). Jellyfish catch updates, 2011-2018 Jellyfish, particularly the flame jellyfish Rhopilema esculentum, are important in Southeast and East Asia, notably in China. Their ‘real’ catch in various countries, which differs strongly from what member countries report to the FAO, was kindly updated to 2018 by Dr. Lucas Brotz, using the same approaches as in Brotz (2016a, 2016b).

Updating to 2018 the 1950-2010 marine catch reconstructions of the Sea Around Us: Part I – Africa, Antarctica, Europe and the North Atlantic
11
Catch by commercial gears Fishing gears were assigned to commercial catch on a taxon basis for each country for 1950-2015 as described by Cashion et al. (2018). Unless otherwise described, gear breakdowns were maintained to 2018 at the 2015 proportion per taxon. End-use of catch The end-use of the catch (i.e., direct human consumption, used for fishmeal production, or animal feed, etc.) was assigned to reconstructed catch for 1950-2016 as described in Cashion et al. (2017). Unless otherwise described, the end-use of the catch was maintained to 2018 based on the 2016 proportions. New end uses will be assigned to the reconstructed catches 2021, notably for use as bait in other fisheries (Yoshida et al. 1977; Saila et al. 2002), and use for the live fish market, both of which will require prices different from those currently used to calculate the ex-vessel values of fisheries (Tai et al. 2017). Another set of end uses will result from the incorporation of sponge fisheries in the catch data of the Sea Around Us planned for 2021/2022 Sponges have so far been omitted because they are not used for direct or indirect human consumption. However, with 39 countries reporting some catches of sponges to the FAO, there is no longer a reason to omit this valuable commodity. Semi-automatic carry-forward Catch reconstructions are time consuming. They become challenging when more diverse data or information sources are available, and when more taxa and more data dimensions are added, such as catch by gear, or catch by end use (see above). Thus, we have looked for some time for a process that would allow at least some of the work to be more ‘automated’, or at least facilitated by dedicated software algorithms. The present contribution of Noël (2020) is a first step in this direction. We hope that its refinement will help speed up reconstruction updates that may eventually allow us to perform annual updates. Here, only a fraction of the 250+ countries (or parts thereof) and territories received an in-depth reconstruction ‘update’ to 2018 by Sea Around Us team members, with the rest carried forward ‘semi-automatically’ using the method of Noël (2020). Time will tell whether this is feasible on an ongoing basis or not. Importantly, however, for any given country, such ‘semi-automated’ carry forward can only be used for a few years, after which an in-depth review is required to ensure that new information on the fisheries of that country can be considered. Considering uncertainty in updated catches During the review of catch reconstructions submitted to peer-reviewed journals, Sea Around Us team were often confronted with vehement requests for the quantification of the uncertainty implied in the reconstructions. They were initially surprised by this, given that in fisheries research, the uncertainty inherent in catch data is rarely, if ever considered. It did not help much to point out that catch reconstruction are not concerned with precision (i.e., whether one could expect another to generate similar results upon re-doing the reconstruction), but about accuracy, i.e., attempting to eliminate a systematic bias (in officially reported data), which statistical theory does not really consider. However, this argument failed to convince many reviewers. This was also the case with the argument that officially reported catches, despite being based on samples, e.g., from fish markets (Ulman et al. 2015) or landings sites (Jacquet et al. 2010; McBride et al. 2013), with likely high level of uncertainty, are generally not thought to require confidence intervals. Thus, starting with Zeller et al. (2014), we now now add to our reconstructions, including those in Pauly and Zeller (2016) and the updates in this and its companion volume (Derrick et al. 2020), a procedure for quantifying their uncertainly (Table 1).

2020 Fisheries Centre Research Reports 28(5)
12
Table 2.1. ‘Scores’ for evaluating the quality of time series of reconstructed catches with their approximate confidence intervals (IPCC criteria from Figure 1 of Mastrandrea et al. 2010); the percent intervals are adapted from Ainsworth and Pitcher (2005) and Tesfamichael and Pitcher (2007).
This procedure consists of the authors of the reconstructions (or the updates summarized here) assigning to the catch estimates of each fisheries sector (industrial, artisanal, subsistence, and recreational) in each of three periods (1950-1969, 1970-1989, 1990-2010, and 2011-2018) a score expressing their evaluation of the quality of the time series, i.e., (1) ‘very low’, (2) ‘low’, (3) ‘high’, and (4) ‘very high’. (There is no ‘medium’ score, to avoid easy, non-informative choices). Each of the scores corresponds to a range of uncertainty (Table 1), adapted from Monte-Carlo simulations by Ainsworth and Pitcher (2005) and Tesfamichael and Pitcher (2007). The overall score for the reconstructed total catch of a sector and/or period is then computed from the mean of the scores for each sector, weighted by its catch. Note that this procedure was applied to countries’ domestic catches (i.e., ‘Layer 1’), but not to foreign catches, whose uncertainty is generally very high and likely exceeds the ranges suggested in Table 1. Note also that uncertainty scores are not presented in the report, nor in its companion volume. However, they are parts of Sea Around Us database, and several of our online products (e.g., time series of catches for the EEZ of countries, or distinct fish populations) now have uncertainty scores attached to them. Discussion The updating of catch reconstructions not only produces catch time series that are current, but also helps identify errors and/or omissions in earlier reconstructions, as well as integrate new and improved knowledge on fisheries. Another source of retroactive corrections to reconstructed estimates is provided by the CMSY stock assessments method of Froese et al. (2019) and its recent improvements, which the Sea Around Us performed in 2017-2018 (Palomares et al. 2018). We thus performed the corrections of inconsistencies and errors in catch data identified by the assessments as we assembled single-species time series for about 1300 stocks in 483 species of fish and invertebrates. Another opportunity to improve the Sea Around Us delivery of quality catch data for the world’s marine fisheries is the establishment in August 2017 of the Sea Around Us - Indian Ocean at the University of Western Australia (UWA) in Perth. Led by Prof. Dirk Zeller, this unit of the Sea Around Us, working in close collaboration with the UWA’s Marine Futures Laboratory of Prof. Jessica Meeuwig, focuses on issues affecting the Indian Ocean region and its surrounding areas. This collaboration contributes to the Sea Around Us’ goal to provide the data and insights to rebuild fisheries and marine biodiversity in the global oceans.
Score +/- (%) Corresponding IPCC criteria* 4 Very high 10 High agreement & robust evidence 3 High 20 High agreement & medium evidence or medium agreement &
robust evidence 2 Low 30 High agreement & limited evidence or medium agreement &
medium evidence or low agreement & robust evidence. 1 Very low 50 Low agreement & low evidence
*Mastrandrea et al. (2010) note that “confidence increase” (and hence confidence intervals are reduced) “when there are multiple, consistent independent lines of high-quality evidence”.

Updating to 2018 the 1950-2010 marine catch reconstructions of the Sea Around Us: Part I – Africa, Antarctica, Europe and the North Atlantic
13
As always, the Sea Around Us welcomes feedback and requests to collaborate to correct any errors in our data and to continually improve upon and update our data with the best possible information. Our data are freely accessible and downloadable on our website (www.seaaroundus.org). To request information, suggest data updates or to receive email updates from the Sea Around Us, send an email to [email protected]. Acknowledgements Funding for the work presented here was provided by the Minderoo Foundation, by the Marisla, Oak and David and Lucille Packard Foundations and by the Bloomberg Philanthropies through Rare. References Ainsworth, C.H. and T.J. Pitcher. 2005. Estimating illegal, unreported and unregulated catch in British
Columbia's marine fisheries. Fisheries Research, 75(1-3): 40-55. Belhabib D, A. Mendy, D. Zeller, and D. Pauly. 2013. Big fishing for small fishes: six decades of fisheries in The
Gambia “the smiling coast of Africa”. Fisheries Centre Working Paper #2013-07, 20 p. Brotz, L. 2016a. Jellyfish fisheries – a global assessment, p. 110-124 In: D. Pauly and D. Zeller (eds). Global
Atlas of Marine Fisheries: A Critical Appraisal of Catches and Ecosystem Impacts. Island Press. Washington, D.C.
Brotz, L. 2016b. Jellyfish fisheries of the world. Electronic Theses and Dissertations (ETDs) 2008+, University of British Columbia, Vancouver, 179 p.
Canty S, M. Funes, S. Box, K. Zylich, B. Derrick, E. Divovich, A. Lindop, D. Pauly and D. Zeller. 2019. The hidden value of artisanal fisheries in Honduras. Fisheries Management and Ecology, 26: 249-259.
Cashion, T., D. Al-Abdulrazzak, D. Belhabib, B. Derrick, E. Divovich, D. Moutopoulos, S.-L. Noël, M. Palomares, L. Teh, D. Zeller D and D. Pauly. 2018. Reconstructing global marine fishing gear use: Catches and landed values by gear type and sector. Fisheries Research, 206: 57-26.
Cashion, T., F. Le Manach, D. Zeller and D. Pauly. 2017. Most fish destined for fishmeal production are food-grade fish. Fish and Fisheries, 18: 837-844.
Coulter, A., T. Cashion, A. Cisneros-Montemayor, S. Popov, G. Tsui, F. Le Manach, L. Schiller, M. Palomares, D. Zeller and D. Pauly. 2020. Using harmonized historical catch data to infer the expansion of global tuna fisheries. Fisheries Research, 221:105379. doi.org/10.1016/j.fishres.2019.105379
Derrick, B., D. Zeller, D. Pauly and M.LD. Palomares. 2019. Sea Around Us research protocols: catch reconstructions. Sea Around Us Report to the Minderoo Foundation. Vancouver, 74 p.
Divovich, E, L.C.L. Teh, K. Zylich and D. Zeller. 2015. Updated reconstruction of Bermuda’s marine fisheries catches, 1950-2010. Fisheries Centre Working Paper #2015-96, 18 p
FAO. 2018. The State of World Fisheries and Aquaculture 2018 - Meeting the sustainable development goals. Food and Agriculture Organization of the United Nations (FAO), Rome. 209 p.
Freire, K.M.F., D. Belhabib, J.C. Espedido, L. Hood, K.M. Kleisner, V.W.L. Lam, M.L. Machado, J.T. Mendonça, J.J. Meeuwig, P.S. Moro, F.S. Motta, M.-L.D. Palomares, N. Smith, L. Teh, D. Zeller, K. Zylich and D. Pauly. 2020. Estimating global catches of marine recreational fisheries. Frontiers in Marine Science, 7(12): 1-18.
Froese, R., H. Winker, G. Coro, N. Demirel, A.C. Tsikliras, D. Dimarchopoulou, G. Scarcella, M.L.D. Palomares, M. Dureuil and D. Pauly. 2019. Estimating stock status from relative abundance and resilience. ICES Journal of Marine Science, fsz230. doi.org/10.1093/icesjms/fsz230
Funes, M., K. Zylich, E. Divovich, D. Zeller, A. Lindop, D. Pauly and S. Box. 2015. Honduras, a fish exporting country: Preliminary reconstructed marine catches in the Caribbean Sea and the Gulf of Fonseca, 1950 – 2010. Fisheries Centre Working Paper #2015-90, 16 p.
Garibaldi, L. 2012. The FAO global capture production database: A six-decade effort to catch the trend. Marine Policy, 36: 760-768.
Jacquet, J.L., H. Fox, H. Motta, A. Ngusaru and D. Zeller. 2010. Few data but many fish: marine small-scale fisheries catches for Mozambique and Tanzania. African Journal of Marine Science, 32(2): 197-206.
Khalfallah, M., K. Zylich, D. Zeller and D. Pauly. 2016. Reconstruction of domestic marine fisheries catches for Oman (1950-2015). Frontiers in Marine Science, 3(152): 1-11. doi.org/10.3389/fmars.2016.00152
Kroodsma, D.A., J. Mayorga, T. Hochberg, N.A. Miller, K. Boerder, F. Ferretti, A. Wilson, B. Bergman, T.D. White, B.A. Block, P. Woods, B. Sullivan, C. Costello, and B. Worm. 2018. Tracking the global footprint of fisheries. Science, 359(6378): 904-908. doi.org/10.1126/science.aao5646

2020 Fisheries Centre Research Reports 28(5)
14
Le Manach, F., P. Chavance, A. Cisneros-Montemayor, A. Lindop, A. Padilla, L. Schiffer, D. Zeller and D. Pauly. 2016. Chapter 3: Global Catches of Large Pelagic Fishes, with emphasis on the high seas, p. 34-45. In: D. Pauly and D. Zeller (eds). Global Atlas of Marine Fisheries: A Critical Appraisal of Catches and Ecosystem Impacts. Island Press. Washington, D.C.
Léopold, M., G. David, J. Raubani, J. Kaltavara, L. Hood and D. Zeller. 2017. The reconstruction of total marine fisheries catches for the New Hebrides and the Republic of Vanuatu, 1950-2014. Frontiers in Marine Science, 4(306): 1-11.
Mastrandrea, M.D., C.B. Field, T.F. Stocker, O. Edenhofer, K.L. Ebi, D.J. Frame, H. Held, E. Kriegler, K.J. Mach, P.R. Matschoss, G.-K. Plattner, G.W. Yohe and F.W. Zwiers. 2010. Guidance Note for Lead Authors of the IPCC Fifth Assessment Report on Consistent Treatment of Uncertainties. Intergovernmental Panel on Climate Change (IPCC). Available at www.ipcc.ch/pdf/supporting-material/uncertainty-guidance-note.pdf
McBride, M.M., B. Doherty, A. J. Brito, F. Le Manach, L. Sousa, I. Chauca and D. Zeller. 2013. Taxonomic disaggregation and update to 2010 for marine fisheries catches in Mozambique. Fisheries Centre Working Paper #2013-02, 26 p.
Noël, S.-L. 2020. Automation Procedure for Catch Reconstruction Updates, p. 15-20. In: B. Derrick, M. Khalfallah, V. Relano, D. Zeller and D. Pauly. (eds). Updating to 2018 the 1950-2010 Marine Catch Reconstructions of the Sea Around Us: Part I – Africa, Antarctica, Europe and the North Atlantic. Fisheries Centre Research Report 28(5).
Palomares, M.L.D., R. Froese, B. Derrick, S.-L. Noël, G. Tsui, J. Woroniak and D. Pauly. 2018. A preliminary global assessment of the status of exploited marine fish and invertebrate populations. A report prepared by the Sea Around Us for OCEANA. University of British Columbia, Vancouver, 64 p.
Pauly, D. and D. Zeller. 2016a. Catch reconstructions reveal that global marine fisheries catches are higher than reported and declining. Nature Communications 7: 9.
Pauly, D. and D. Zeller. 2016b. Global Atlas of Marine Fisheries: A critical appraisal of catches and ecosystem impacts. Island Press, Washington D.C.
Pauly, D. and D. Zeller. 2019a. The making of a global marine fisheries catch database for policy development, p. 221-235 In: C. Sheppard (ed.). World Seas: An Environmental Evaluation. Vol. III: Ecological Issues and Environmental Impacts. Academic Press, Elsevier, London.
Pauly, D. and D. Zeller. 2019b. Agreeing with FAO: Comments on SOFIA 2018. Marine Policy, 100: 332-333. Persson, L., A. Lindop, S. Harper, K. Zylich and D. Zeller. 2015. Failed state: Reconstruction of domestic
fisheries catches in Somalia 1950-2010, p. 111-127. In: F. Le Manach and D. Pauly (eds). Fisheries catch reconstructions in the Western Indian Ocean, 1950-2010. Fisheries Centre Research Report 23(2).
Saila, S.B., S.W. Nixon and C.A. Oviatt. 2002. Does Lobster Trap Bait Influence the Maine Inshore Trap Fishery? North American Journal of Fisheries Management, 22: 602-605.
Tai, T., T. Cashion, V.W.Y. Lam, W. Swartz and U.R. Sumaila. 2017. Ex-vessel Fish Price Database: Disaggregating Prices for Low-Priced Species from Reduction Fisheries. Frontiers in Marine Science, 4(363): 1-10. doi.org/10.3389/fmars.2017.00363
Tesfamichael, D. and T.J. Pitcher. 2007. Estimating the unreported catch of Eritrean Red Sea fisheries. African Journal of Marine Science 29(1): 55-63.
Ulman, A., A. Saad, K. Zylich, D. Pauly and D. Zeller. 2015. Reconstruction of Syria’s fisheries catches from 1950-2010: Signs of overexploitation. Fisheries Centre Working Paper #2015-80, 26 p.
Yoshida, H.O., R.N. Uchida and T. Otsu. 1977. The Pacific Tuna Pole-and-Line and Live-Bait Fisheries. In: R.S. Shomura (ed). Collection of tuna baitfish paper. U.S. Department of Commerce, NOAA Technical Report NMFS Circular, 408: 36-51.
Zeller, D., T. Cashion, M.L.D. Palomares and D. Pauly. 2018. Global marine fisheries discards: a synthesis of reconstructed data. Fish & Fisheries, 19(1): 30-39.
Zeller, D., S. Harper, K. Zylich and D. Pauly. 2014. Synthesis of under-reported small-scale fisheries catch in Pacific -island waters. Coral Reefs, 34: 25-39. doi.org/10.1007/s00338-014-1219-1
Zeller, D. and D. Pauly. 2018. The ’presentist bias’ in time-series data: implications for fisheries science and policy. Marine Policy, 90: 14-19.
Zeller, D., M. Palomares, A. Tavakolie, M. Ang, D. Belhabib, W. Cheung, V. Lam, E. Sy, G. Tsui, K. Zylich and D. Pauly. 2016. Still catching attention: Sea Around Us reconstructed global catch data, their spatial expression and public accessibility. Marine Policy, 70: 145-152.
Zylich, K., S. Shon, S. Harper and D. Zeller. 2014. Reconstruction of total marine fisheries catches for the Republic of Vanuatu, 1950-2010, p. 147-156 In: Zylich, K., D. Zeller, M. Ang and D. Pauly (eds). Fisheries catch reconstructions: Islands, Part IV. Fisheries Centre Research Reports 22(2).

Updating to 2018 the 1950-2010 marine catch reconstructions of the Sea Around Us: Part I – Africa, Antarctica, Europe and the North Atlantic
15
SEMI-AUTOMATION PROCEDURE FOR CATCH RECONSTRUCTION FORWARD CARRY*
Simon-Luc Noël
Sea Around Us, Institute for the Oceans and Fisheries, University of British Columbia, 2202 Main Mall, Vancouver, BC, V6T 1Z4, Canada
Abstract The updating of reconstructed marine fisheries catches taken from the waters of maritime countries is research-intensive, and time-consuming work, even when these catches are based on detailed catch data submitted to the Food and Agriculture Organization of the United Nations (FAO) or Regional Fisheries Management Organizations (RFMOs). The author describes a semi-automatic procedure (called here ‘carry-forward’) that partially automates the most tedious steps in reconstruction updating and thus accelerates the pace at which updating is completed. Introduction The Sea Around Us maintains databases with catch and related data on all maritime countries of the world including ‘reconstructed’ catches (Pauly and Zeller 2016a, 2016b, Derrick and Pauly 2020, this vol.) and a website (www.seaaroundus.org) displaying these data, from which they can also be downloaded. The catch reconstructions upon which the data are based rely on reported data from several international fisheries organizations, primarily the Food and Agriculture Organization (FAO), and these reported statistics are updated and revised on an annual basis by the FAO, both to add the most recent year of data as well as to perform retroactive changes where needed (Garibaldi 2012). Therefore, the Sea Around Us must also regularly update its catch reconstructions both in order to keep pace with these changes and to correct unwarranted assumptions made in previous years. Before the current updates of these reconstructions, the Sea Around Us time series spanned the years 1950 to at least 2014, with some countries having data available up to 2016. Since that time, the Sea Around Us team at UBC has shrunk in size, going from several dozens of full-time members (post-doctorate fellows, graduate students, research assistants, and volunteers) with an overwhelming majority dedicated to catch reconstructions, to about a dozen members working on several different projects. The establishment of the Sea Around Us-Indian Ocean group at the University of Western Australia in 2017, the Sea Around Us’ partnership with Quantitative Aquatics (Q-quatics), a small non-profit NGO in the Philippines, and our continued collaborations with researchers around the world are helping toward maintaining our database but do not fully compensate for the overall decline in staffing. It became clear that it would be impossible to provide annual ‘manual’ updates of every single Sea Around Us catch reconstruction with the resources at our disposal. Automation or semi-automation of the reconstruction process was thus in part unavoidable, at least for reconstructions that fit a particular conservative profile, toensure reasonably accurate projections of their catch time series. Moreover, this process should be both less time-consuming and more sophisticated than the simple manual ‘carry forward’ used occasionally to speed up the data updating.
* Cite as: Noël, S.-L. 2020. Semi-automation procedure for catch reconstruction forward carry, p. 15-20. In: B. Derrick, M. Khalfallah, V. Relano, D. Zeller and D. Pauly. (eds). Updating to 2018 the 1950-2010 marine catch reconstructions of the Sea Around Us: Part I – Africa, Antarctica, Europe and the North Atlantic. Fisheries Centre Research Report 28(5).

2020 Fisheries Centre Research Reports 28(5)
16
In the following, the semi-automation process that the author developed is described using the latest update as an example. The new procedure Preparation of automation inputs To properly carry a reconstructed data set forward, the code relies on the underlying framework of reported fisheries landings data where the largest spatial unit is the FAO Major Fishing Area, hereafter referred to as ‘FAO area’. Within this framework, catch reconstructions fall into several spatial categories:
1. Reconstructions that cover the entire home EEZ of a fishing entity; 2. Reconstructions that cover a portion of a fishing entity’s home EEZ, and each portion corresponds to a
unique FAO area (e.g., Canada, USA); 3. Reconstructions that cover a portion of a fishing entity’s home EEZ, but all portions are found in the
same FAO area (e.g., United Arab Emirates) 4. Reconstructions that include several EEZs belonging to a fishing entity (e.g., Norway).
To properly semi-automate a reconstruction, we must account for all its spatial components, which are identified in the Sea Around Us database with the use of the ‘reference ID’, a unique identifier that matches a reconstruction to the spatial area that it covers. We must then match those spatial components to the reported data, ensuring no duplication or trimming of reported data. Because the reference ID is already functionally defined in the Sea Around Us database, the carry-forward method relies on a derived identification number known as the ‘automation ID’, which unites all components of an EEZ that, together, correspond to 100% of the reported catch from a fishing country within one or multiple FAO areas. This automation ID is typically the same as the reference ID, except in reconstructions that correspond to spatial category #3 in the list above: in those cases, while each reconstruction would retain its separate reference ID, they would share an automation ID, which identifies the fact that they draw from the same reported baseline. Each reconstruction relies on its assigned reported baseline of landings, to which unreported landings and discards are added to reconstruct total catches. This reported baseline can come from many different sources, including the Food and Agriculture Organization (FAO); one of the many Regional Fisheries Management Organizations (RFMOs) of the world, including the International Convention for the Exploration of the Seas (ICES), the Northwest Atlantic Fisheries Organization (NAFO), and the Convention for the Conservation of Antarctic Marine Resources (CCAMLR); or data from a fishing entity’s national statistical system. The reported data are treated differently in the semi-automation based on its source. Supranational data sources The vast majority of reference IDs rely on supranational data sources, which have the benefit of being standardized across countries in terms of their format and the data found within. Because of this, there are only trivial changes that must be made to the data from the FAO, CCAMLR, ICES, and NAFO, such as translating the country names to Sea Around Us fishing entity names, or assigning FAO areas to RFMO data. None of the formatting or layout of the data needs to be modified. Once these small changes are made, the data can be directly imported into the semi-automation, where the code applies a standard set of transformations before proceeding with the rest of the process. National data Unlike fisheries data from supranational sources, national data are produced by a fishing entity’s statistical or fisheries management system, which does not necessarily follow a set of standardized methods across all

Updating to 2018 the 1950-2010 marine catch reconstructions of the Sea Around Us: Part I – Africa, Antarctica, Europe and the North Atlantic
17
countries. In addition, different national data sources may provide additional spatial or sectoral catch information that may be important to preserve for the reconstruction. Therefore, for each country using national data as its reported baseline, the data in question must be located and sourced, then transformed to a standard format before being used in the semi-automation. The semi-automation code must take great care to ensure that common names are adequately translated to correct scientific names and to include additional information about the catches should it be present. Semi-automation of the reported baseline Due to the complexity of the data emanating from foreign fishing in a fishing entity’s EEZ or the associate FAO area at the time of writing, the semi-automation process only handles reported fishing from the home fishing entity both within and outside of an EEZ within the same FAO area. For example, foreign fishing in FAO areas such as the Eastern Central Atlantic and Southeast Atlantic were manually partitioned between EEZs for 2011-2017 based on the 2010 disaggregation of reported taxa caught by a fishing country per EEZ within these ocean areas. The exception to the above-mentioned rule is for reconstructions that rely on CCAMLR data, as the bulk of a reconstruction’s reported catch may come from foreign fishing entities. The process by which the reported catch is converted from the data source format to the reported baseline format used by the Sea Around Us is as follows: 1) The taxa included in the reconstruction are compared against the taxa present in the reported baseline:
a) If industrial landings of tunas, billfish, and other highly migratory large pelagic species are present in the reconstruction, the semi-automation code calculates the ratio of reported small-scale and recreational catch included within the reconstruction to the total catch of these species in the reported baseline, as an average over the five preceding years, to calculate the portion of the catch to be included. This process is necessary because industrial catches of these species are treated separately from the typical catch reconstruction (Coulter et al. 2020);
b) All other FAO taxonomic categories are assigned a ‘matching taxon’ corresponding to either the proper taxon (or taxon grouping) for the FAO category in the reported baseline, or the closest taxonomic relative, using the Sea Around Us taxon lineage reference table. This matching taxon is used to assign the catch of each taxon per FAO category in the reported baseline to the area, sector, and fishing gear assigned to them in the reconstruction even if the taxon did not appear in earlier years within the reconstruction;
c) In the case of national data, whose reported taxon names may have been changed during the reconstruction, the code adds an additional ‘spreading’ algorithm for matching taxa. When it identifies a taxon from the reported baseline that is not present in the reconstruction, the algorithm first searches down and across taxonomic groups to find the closest relative present in the reconstruction but not already assigned to a taxon in the reported data. For example, if Scomber colias is in the reported data, but Scomber japonicus is in the reconstruction, the spreading algorithm would properly identify and rename Scomber colias. If no match can be found using this method, the code moves on to the matching process described in 1b above.
2) Using the above taxon matching work, the reported baseline is then distributed among the proper
dimensions of the reconstruction in the following order: a) Reported taxonomic categories are disaggregated to Sea Around Us taxa according to the
average over the preceding five years. For example, ‘marine fishes nei’ will often be

2020 Fisheries Centre Research Reports 28(5)
18
disaggregated to finer taxonomic detail in the reconstruction; the code will preserve the average disaggregation from the five preceding years;
b) Catch by taxon is then distributed among any reported fishing entities (fishing countries) in the reconstruction-- typically, only any applicable home fishing entities with exceptions for CCAMLR reconstructions.
c) Catch by taxon is then distributed among spatial dimensions—EEZ, EEZ subareas, sub-regional area, province and state, as well as any RFMO divisions. This is accomplished by extrapolating the trend in this spatial distribution in the five preceding years through the semi-automated year(s). Any spatial dimensions already identified within the reported data, as is the case for ICES, CCAMLR, and NAFO data sources, are preserved as is;
d) The reported catch is finally split among fishing sectors and fishing gears by extrapolating the trend in their distribution along the five preceding years.
Semi-automation of the unreported catch component The process of semi-automation of the unreported component of the catch is performed using one of several methods: 1) Addition: The trend in the previously reconstructed unreported catch as a percentage of reported
landings is calculated over the five years preceding the first semi-automated year, extrapolated through the semi-automated years, and then multiplied with the semi-automated reported catch to obtain the unreported component. If that percentage is highly variable through those five preceding years, the average percentage is used instead. This method is typically chosen when the slope of the reported catch is negative, or if the slope is positive and the variability of the percentages is low;
2) Subtraction: The trend in the total reconstructed catch (reported + unreported) is calculated over the five years preceding the first semi-automated year and extrapolated through the semi-automation years. The unreported component of the catch is then derived by subtracting the semi-automated reported catch from the extrapolated total catch estimate for each year in the semi-automated carry-forward. This method is typically chosen when the slope of the reported catch on the preceding five years is positive, and the unreported catch as a percentage of reported landings is highly variable through those preceding years.
3) Flat: The total unreported catch from the year immediately preceding the semi-automated years is carried forward unchanged. This method functions as a bounding mechanism to prevent unreported catch from ballooning as reported catch rises or to preserve a reasonable estimate of unreported catch when reported catch falls dramatically over time.
The total unreported catch calculated from the chosen methods is then disaggregated across all other dimensions using the distribution from the last five years prior to semi-automation. Checks of potential concerns A graph of the reconstructed catch for the full time series is produced by the semi-automation code for initial visual identification of any potential issues with the semi-automation, for example an unrealistic spike or drop in reported or unreported catches. The semi-automation process also generates a spreadsheet output with all data parameters, similar to the raw data that comprise a catch reconstruction, for a more detailed analysis of the distribution of the catch among taxa, sectors, gears, and spatial dimensions. Using both outputs allows the general health of the semi-automated output to be manually assessed and errors in the assignment of dimensions to the reported data to be spotted and quickly rectified.

Updating to 2018 the 1950-2010 marine catch reconstructions of the Sea Around Us: Part I – Africa, Antarctica, Europe and the North Atlantic
19
Troubleshooting the output The following are situations that may arise during the semi-automation of a reconstruction. The code has been designed to automatically announce these errors, provide instructions on how to correct them, and preserve a date- and time-stamped error log with these outputs. Once steps have been taken to correct errors, the semi-automation may be rerun. The reported catch in the output is greater than that of the input In some instances, the semi-automated total reported catch may be greater than the input reported catch due to errors in the manner the catch was distributed among taxa, spatial, or sectoral dimensions. When this occurs, the code automatically stops the semi-automation process and prompts the user to check the code and data in order to correct the faulty calculation manually. The unreported catch in the semi-automation years is rising too quickly The default calculation of the unreported catch for the semi-automation years relies on extrapolating the trend of the catch in the five years immediately preceding the years to be semi-automated. In some cases, the calculated trend results in a massive increase in unreported catch over the semi-automation years. The temporal window used to calculate this trend can be adjusted manually to produce a more conservative estimate of unreported catch. The reported catch spikes in the semi-automation years A spike in the reported catch could mean that there were retroactive changes in the reported baseline. When the code detects such a spike, it will automatically use the subtraction method to calculate unreported catches. In cases where the subtraction method produces negative unreported catches (i.e., new reported catches exceed previously calculated total catches), the last year of unreported catch will be carried forward unchanged. A different method may be employed in such cases to overwrite the reconstruction from years where data already exists in the Sea Around Us database. In this process, the reported baseline of overwritten years is replaced with a new output that relies on the newest version of the reported data for those years. As an example, a carry-forward is performed on a reconstruction with data from 1950-2017 in the Sea Around Us database, with a reported baseline that has data available to 2018. It is noticed that there are significant retroactive changes in the reported baseline between 2015 and 2017 in the new 2018 reported data version. The code can be instructed to begin the carry-forward in 2015 instead of after 2017, thereby replacing the existing reported baseline from 2015 onwards with the semi-automatically-generated output. Depending on whether the unreported catch was determined manually or semi-automatically, it may be preserved or replaced, respectively. Discussion The ‘semi-automation’ approach described here does not automate more than a few steps in the processing of well-behaved catch data sets. However, these steps do remove some of the tedium from manually updating catch reconstructions for a time. This semi-automation routine should not be viewed as a replacement of research-intensive reconstruction updates, but rather as a temporary measure that can be used for a few years, before a thorough research-based review or correction to data is required. This is because the routine cannot consider literature with new knowledge (beyond the catch statistics it is driven by), nor identify or integrate new knowledge on changes in fisheries. Thus, the Sea Around Us will endeavor to alternate semi-automated forward carries with expert reviews/updates on a rotational basis for each country. Still, the author hopes that

2020 Fisheries Centre Research Reports 28(5)
20
the approach and software developed here will be further refined to accelerate the work involved with global updates. Acknowledgments Funding for the work presented here was provided by the Minderoo, Marisla, Oak, David and Lucille Packard Foundations and the Bloomberg Philanthropies through Rare. I also thank my colleagues of the Sea Around Us at UBC, Vancouver, Canada, and Q-quatics in Los Baños, Philippines for testing the procedure presented here and providing feedback. References Coulter, A., T. Cashion, A. Cisneros-Montemayor, S. Popov, G. Tsui, F. Le Manach, L. Schiller, M. Palomares,
D. Zeller and D. Pauly. 2020. Using harmonized historical catch data to infer the expansion of global tuna fisheries. Fisheries Research, 221:105379. doi.org/10.1016/j.fishres.2019.105379.
Derrick, B. and D. Pauly. 2020. Updating to 2018 the 1950-2020 marine catch reconstructions of the Sea Around Us, p. 9-14. In: B. Derrick, M. Khalfallah, V. Relano, D. Zeller and D. Pauly. (eds). Updating to 2018 the 1950-2010 Marine Catch Reconstructions of the Sea Around Us: Part I – Africa, Antarctica, Europe and the North Atlantic. Fisheries Centre Research Report 28(5).
Garibaldi, L. 2012. The FAO global capture production database: A six-decade effort to catch the trend. Marine Policy, 36: 760-768.
Pauly, D. and D. Zeller. 2016a. Catch reconstructions reveal that global marine fisheries catches are higher than reported and declining. Nature Communications, 9. doi.org/10.1038/ncomms10244
Pauly, D. and D. Zeller (eds). 2016b. Global Atlas of Marine Fisheries: A critical appraisal of catches and ecosystem impacts. Island Press, Washington D.C., xii +497 p.

Updating to 2018 the 1950-2010 marine catch reconstructions of the Sea Around Us: Part I – Africa, Antarctica, Europe and the North Atlantic
21
African countries catch reconstruction updates The group of contribution on African countries includes ten individual chapters dealing with Angola, Cameroon, Côte d’Ivoire, The Gambia, Ghana, Kenya, Mauritania, Mozambique, South Africa, Somalia, and Tanzania. This group of contributions also includes three regional chapters. The first, “Madagascar and smaller islands of the Western Indian Ocean: Updated catch reconstructions for 2011-2018”, includes sections covering the Comoros Islands, Îles Éparses, Madagascar, Mauritius, Mayotte, La Réunion, and Seychelles. The second, “Updating to 2018 the 1950-2010 catch reconstructions for islands off West Africa”, includes sections covering the following small island states and territories: Ascension (UK), Canary Islands (Spain), Cape Verde, Madeira (Portugal), Saint Helena (UK), São Tomé and Principe, and Tristan da Cunha (UK). Finally, the third, “Updating to 2018 the catch reconstructions for 14 countries of the West African Mainland”, includes sections covering Benin, Congo (Brazzaville), Congo (Ex-Zaïre), Equatorial Guinea, Gabon, Guinea, Guinea-Bissau, Liberia, Morocco (Atlantic) Namibia, Nigeria, Senegal, Sierra Leone, and Togo. African countries (or parts thereof) not included here are Morocco (Mediterranean), Algeria, Tunisia, Libya, and Egypt (covered in Khalfallah et al. 2020), and Sudan, Eritrea and Djibouti (covered in Khalfallah et al. 2020). References Derrick, B. and D. Pauly. 2020. Updating to 2018 the 1950-2020 marine catch reconstructions of the Sea
Around Us, p. 9-14. In: B. Derrick, M. Khalfallah, V. Relano, D. Zeller and D. Pauly (eds). Updating to 2018 the 1950-2010 Marine Catch Reconstructions of the Sea Around Us: Part I – Africa, Antarctica, Europe and the North Atlantic. Fisheries Centre Research Report 28(5).
Khalfallah, M. 2020. Data-poor fisheries: Case studies from the southern Mediterranean and the Arabian Peninsula. PhD thesis, University of British Columbia, Vancouver, 349 p.
Khalfallah, M., R. White, T. Cashion, B. Derrick, S-L Noël and E. Page. 2020. Red Sea and Gulf of Aden countries: Updated catch reconstructions to 2018, p. 346-364. In: B. Derrick, M. Khalfallah, V. Relano, D. Zeller and D. Pauly (eds). Updating to 2018 the 1950-2010 Marine Catch Reconstructions of the Sea Around Us. Part II: The Americas and Asia-Pacific. Fisheries Centre Research Report. 28(6).

2020 Fisheries Centre Research Reports 28(5)
22
ANGOLA: UPDATED CATCH RECONSTRUCTION FOR 2011-2018*
Brittany Derrick Sea Around Us, Institute for the Oceans and Fisheries, University of British Columbia,
2202 Main Mall, Vancouver, BC, V6T 1Z4, Canada Abstract The reconstruction of Angola’s marine fisheries catch data was updated for 2011-2018. The most significant difficulty in updating this catch reconstruction was accounting for the increase in reported landings in recent years. After investigating potential reasons for the increase in reported landings, it was considered that recent catch increases were due to the inclusion of catches from the Eastern Central Atlantic FAO area that had previously been reported from the Southeast Atlantic FAO area. The descriptions of this update of the Angolan catch reconstruction provides details on each fishing sector, i.e., industrial, artisanal, subsistence and recreational fisheries. Introduction Total marine fisheries catch for Angola were reconstructed from 1950-2010 by Belhabib and Divovich (2014; Belhabib et al. 2016), and then updated to 2015 (Belhabib and Divovich 2015). In the process, an increase in reported landings was noted for the Southeast Atlantic FAO area between versions of FAO data reported for Angola for years after 2010 (Figure 1). Prior to the release of the FAO 2014 dataset, it was clear that landings reported in Angola in the Southeast Atlantic FAO area excluded landings from the Eastern Central Atlantic FAO area. Because of the significant increase in landings reported in the FAO 2014 and 2015 datasets compared to previous FAO data versions, it was assumed, however, that the landings reported in the Southeast Atlantic in the FAO 2014 and 2015 datasets also included landings from the Eastern Central Atlantic from 2008 onwards (Figure 1). Although this increase in reported landings is assumed to reflect improvements in reporting, FAO must encourage Angola to report separately landings originating from different FAO Statistic Areas. Materials and Methods Retroactive changes to reported landings data were incorporated for 2008-2010. The reported landings were attributed to industrial fisheries in the Southeast and Eastern Central Atlantic based on the relative percentage of total landings of each sector and area for each year (Figure 2). After reported landings were subtracted from the calculated total catch per sector, unreported landings were determined to be the remainder. In 2015, landings reported to FAO exceeded reconstructed estimates for domestic industrial and artisanal fisheries from both the Easter Central Atlantic and Southeast Atlantic; the excess catch was assumed reported from subsistence fisheries. National reports of domestic industrial landings were available for 2011 (COMHAFAT/ATLAFCO 2015) and 2013-2015 (Ayoubi and Failler 2014; ANGOP 2015). Domestic industrial landings were assumed to be reported in their entirety from 2011-2015. Reported landings were interpolated between the 2011 and 2013 anchor points and held constant at the 2014 level for 2015. Artisanal landings were carried forward to 2015 using the original methods (Belhabib and Divovich 2015). The number of artisanal vessels fishing in marine waters was available for 2011-2013 (IPA 2013) and 2015 when the Ministério das Pesca limited the number of artisanal vessels to 5,500 (Anon. 2015).
* Cite as: Derrick, B. 2020. Angola: updated catch reconstructions for 2011 – 2018, p. 22-26. In: B. Derrick, M. Khalfallah, V. Relano, D. Zeller and D. Pauly (eds). Updating to 2018 the 1950-2010 Marine Catch Reconstructions of the Sea Around Us: Part I – Africa, Antarctica, Europe and the North Atlantic. Fisheries Centre Research Report 28(5).

Updating to 2018 the 1950-2010 marine catch reconstructions of the Sea Around Us: Part I – Africa, Antarctica, Europe and the North Atlantic
23
The number of vessels was interpolated in 2011 and 2014, because the large increase in vessels occurring in 2011 was assumed unlikely. The artisanal catch resulting from beach seine fishing was assumed to remain constant for 2011-2015. The proportion of catch assumed to originate from Cabinda Province was maintained at the 2010 level. Reported artisanal landings were estimated as the remaining reported landings after accounting for industrial landings from 2011-2014 and assumed to be fully reported in 2015. Unreported artisanal landings were disaggregated by taxa based on the 2007 taxonomic breakdown for 2011-2015. The FAO category of ‘Marine Fishes nei’ was, as previously, disaggregated into taxa based on the taxonomic breakdown of reported landings for each sector.
Figure 1. Showing how the reported catch for Angola in the Southeast Atlantic FAO Statistical Area increase between the FAO 2013 and FAO 2018 data sets for 2000-2018. Discards were updated for 2008-2014 using the percentage discarded of total landings for each gear. The breakdown of discarded taxa within each gear type was held constant at the 2010 proportions for 2011-2015. Subsistence catches were carried forward for 2011-2015 using the 2010 estimates of average catch per day and days per year spent fishing. The total number of subsistence fishers was calculated for 2011-2015 based on the 2010 ratio of subsistence fishers to total population estimates sourced from the World Bank. For each sector, catch assumed to originate from the Angolan exclave of Cabinda was calculated using the 2010 proportion. The number of recreational fishers was determined for 2011-2015 by extrapolating the rate of increase in recreational fishers from 2002-2010 forward for 2011-2015. The number of hours, days and catch per hour spent recreational fishing were assumed to remain the same as in 2010 for 2011-2015. The taxonomic breakdowns of landings from 2010 was used to disaggregate each sector for 2011-2015. Foreign fishing for commercially valuable species such as round sardinella (Sardinella aurita), Cunene horse mackerel (Trachurus trecae), and flathead grey mullet (Mugil cephalus) continued in Angola’s EEZ. Illegal, unregulated and unreported fishing continued as well, facilitated by Angola’s proximity to ports of convenience in West Africa and areas of transshipment (Petrossian 2018). In recent years, however, collaborations between Angola and other countries have emerged which stimulate legal fishing activity and increased protection of fishing grounds against illegal fishing. In 2014, businesses from Angola, Spain, and Portugal signed fisheries agreements to manage fishing vessels, which could lead to an increased market for

2020 Fisheries Centre Research Reports 28(5)
24
Angolan fish exports (Anon. 2014). Under the Southern African Development Community (SADC) regional program, Angola, Namibia, and South Africa collaborate to survey fishing grounds for illegal fishing (Anon. 2012). In 2012, Angola strengthened its level of surveillance by constructing three surveillance vessels (Anon. 2012). However, reports on their operations could not be located. Reported landings by China, Japan, Portugal, Russia, Spain, and Ukraine vessels fishing in Angola’s Exclusive Economic Zone (EEZ) were updated for 2011-2015 based on the 2010 ratio of reported landings per fishing entity in Angola’s EEZ. Unreported landings by China, Japan, and Russia were estimated to be the difference between reported landings by each fishing entity and total landings by each fishing entity with total landings assumed constant at the 2010 amount. Unreported landings by Senegalese vessels were assumed to have ceased in 2010. Transition from 2015 to 2018 The catch reconstruction was semi-automated for the period 2016-2018 based on landings reported by the FAO (2020) and the procedure outlined by Noël (2020). Details on the reconstruction and update of Angola’s recreational fisheries are provided in Freire et al. (2020) and are thus omitted here. Results and Discussion Figure 2 presents updated catch data for the marine fisheries in the Angolan EEZ. More details may be found on the Sea Around Us website (www.seaaroundus.org), including for the Cabinda exclave. The last years, derived by our ‘semi-automatization’ routine, will be revisited in the next update.
Figure 2. Reconstructed domestic catch within Angola’s EEZ by fishing sector for 1950-2018. Recreational catches are included, but are too small to be visible.
Potts et al. (2014) reports that rapid ocean warming has been having a large effect on coastal fisheries along the southern coast. Notably, there has been a southward shift of the distribution of dusky kob (Argyrosomus coronus) well into Namibian waters. This will have to be considered in future updates. Marine biodiversity protection Angola has agreed to protect its biological diversity through the international Convention on Biological Diversity (Aichi) (Marine Conservation Institute 2020).

Updating to 2018 the 1950-2010 marine catch reconstructions of the Sea Around Us: Part I – Africa, Antarctica, Europe and the North Atlantic
25
Angola has four marine managed areas but no MPAs. The four managed areas’ extent is 24 km2 (UNEP-WCMC and IUCN 2020), which equals less than 1% of the entire EEZ (490,684 km2; Belhabib et al. 2016). They are: Ilheu dos Passaros Integral Nature Reserve (designated in 1973 with a total area of 2 km2), National Park Iona (II) (designated in 1964 with a reported marine area of 25 km2), National Park Quiçãma (II) (designated in 1957 with a reported marine area of 28 km2), and Partial Reserve Namibe (designated in 1960 with a reported marine area of 1 km2) (Marine Conservation Institute 2020). The reserves of Ilheu dos Passaros and Namibe have an IUCN category of IV (Habitat/species management area). On the other hand, the National Parks of Iona and Quiçãma are designated under the IUCN category II, which allows only non-extractive recreational activities and eco-tourism. However, in the past there have been plans to build a resort in the National Park of Quiçãma, which would serve as a base for sport fishing operations (CPIRES 2012). Some of the activities that threaten marine biodiversity and ecosystems in Angola are overfishing, lack of conservation awareness, oil exploration, and uncontrolled coastal development. “[W]ith a climate that is predominantly semi-arid, the coastal region has relatively limited agricultural potential, which means that in the absence of other income generating opportunities, the population is relying increasingly on the sea for food and livelihoods. With a poor urban infrastructure, there is a very real danger that the rapidly expanding urban population will present a serious pollution threat through the increase in untreated sewage which is discharged into the sea in increasing volumes. [Moreover,] there has also been a rapid expansion of hotels and weekend houses specifically along the shore south of Luanda, including inside Quiçama National Park, which needs to be regulated and monitored on the basis of a zoning plan including the coastal and marine areas” (GEF Trust Fund 2017). As a result of this development “[o]verfishing is a major concern, particularly in the south of the country (e.g., adjacent to Iona NP) where there are too many boats fishing the same resource. The marine fisheries in Angola can be divided into artisanal (mainly for horse mackerel and bottom valued species like groupers, snappers, seabreams, croakers and spiny lobster), semi-industrial and industrial, where the main species caught are the horse mackerel, sardinella, shrimps and deep-sea red crab. Non-optimal harvesting of resources means that artisanal and industrial fisheries compete for the same fishing areas and for the same resource, as it is the case for horse mackerel. This can lead to a depletion of the resource below sustainable levels and high by-catch” (GEF Trust Fund 2017). There is also a risk of marine pollution and spills from oil extraction and shipping activities. Efforts to increase conservation awareness and adequate regulations are necessary in Angola, as local authorities, the private sector, communities and civil society are largely unaware of the consequences of the deterioration of marine and coastal environments (GEF Trust Fund 2017). Acknowledgement Funding for the work presented here was provided by the Minderoo Foundation, by the Marisla, Oak and David and Lucille Packard Foundations, and by the Bloomberg Philanthropies through Rare. References ANGOP. 2015. Angola: Captura de pescado regista avanços, diz Ministério das Pescas. Agência Angola Press
(ANGOP). Available at: www.angop.ao/angola/pt_pt/noticias/economia/2015/8/40/Angola-Captura-pescado-regista-avancos-diz-Ministerio-das-Pescas,b1246814-1bf0-4145-957a-0f5300f58e61.html
Anon. 2012. Angola invests in fight against illegal fishing in coastal waters. Forbes, edition of 2 February 2012. Available at: www.forbes.com/sites/gcaptain/2012/02/02/angola-invests-in-fight-against-illegal-fishing-in-coastal-waters/#741c304c11c8

2020 Fisheries Centre Research Reports 28(5)
26
Anon. 2014. Companies from Angola, Spain and Portugal sign fisheries agreement. Macauhub, edition of 24 November 2014. Available at: www.macauhub.com.mo/en/2014/11/24/companies-from-angola-spain-and-portugal-sign-fisheries-agreement/
Anon. 2015. Decreto Presidencial n. º 28/15 de 13 de Janeiro. Ministério das Pesca, FAOLEX. Available at: extwprlegs1.fao.org/docs/pdf/ang148508.pdf
Ayoubi, HE. and P. Failler. 2014. Industrie des pêches et de l’aquaculture en Angola. Rapport n°6 de la revue de l'industrie des pêches et de l'aquaculture dans les Pays de la Conférence Ministérielle sur la Coopération Halieutique entre les États Africains Riverains de l’Océan Atlantique (COMHAFAT) & The Ministerial Conference on Fisheries Cooperation among African States Bordering the Atlantic Ocean (ATLAFCO). 72 p.
Belhabib, D. and E. Divovich. 2014. Rich fisheries and poor data: a catch reconstruction for Angola, 1950-2010. Fisheries Centre Working Paper Series # 2014-12, 19 p.
Belhabib, D. and E. Divovich. 2015. Rich fisheries and poor data: a catch reconstruction for Angola, 1950-2010, an update of Belhabib and Divovich (2014), p. 115-128 In: D. Belhabib and D. Pauly (eds). Fisheries catch reconstructions: West Africa, Part II. Fisheries Centre Research Report 23(3).
Belhabib, D., E. Divovich, and D. Pauly. 2016. Angola, p. 187. In: D. Pauly and D. Zeller (eds). Global Atlas of Marine Fisheries: A Critical Appraisal of Catches and Ecosystem Impacts. Island Press, Washington, DC.
COMHAFAT/ATLAFCO. 2015. Etudes des industries des pêches et de l’aquaculture dans les pays de la COMHAFAT: Rapport de l’Atelier de restitution. Ministérielle sur la Coopération Halieutique entre les États Africains Riverains de l’Océan Atlantique (COMHAFAT) & The Ministerial Conference on Fisheries Cooperation among African States Bordering the Atlantic Ocean (ATLAFCO). 36 p.
CPIRES. 2012. Parques Naturais e Zonas Protegidas de Angola. Available at: www.cpires.com/angola_parques.html
FAO. 2020. FAO yearbook. Fishery and Aquaculture Statistics 2018/FAO annuaire. Statistiques des pêches et de l'aquaculture 2018/FAO anuario. Estadísticas de pesca y acuicultura 2018. Rome/Roma
Freire, K.M.F., D. Belhabib, J.C. Espedido, L. Hood, K.M. Kleisner, V.W.L. Lam, M.L. Machado, J.T. Mendonça, J.J. Meeuwig, P.S. Moro, F.S. Motta, M.L.D. Palomares, N. Smith, L. Teh, D. Zeller, K. Zylich and D. Pauly. 2020. Estimating global catches of marine recreational fisheries. Frontiers in Marine Sciences, 7(12): 1-18. doi.org/10.3389/fmars.2020.00012
GEF Trust Fund. 2017. GEF-6 PROJECT IDENTIFICATION FORM (PIF). Available at: www.thegef.org/sites/default/files/project_documents/ID9748__PIMS_6051_Creation_of_MPA_in_Angola_140317_for_resubmission.pdf
IPA. 2013. Pesca artesanal, Pesca do Futuro e Aquicultura Comunal, Novo Campo de Oportunidades. Ministérios das Pescas. Instituto de Desenvolvimento da Pesca Artesanal e da Aquicultura Comunal (IPA). Available at: pescas.gov.ao/public/documentos/2.pdf [Accessed: 30 November 2017].
Marine Conservation Institute. 2020. MPAtlas [Online]. Seattle, WA. Available at: www.mpatlas.org Noël, S.-L. 2020. Semi-automation procedure for catch reconstruction forward carry, p. 15-20. In: B. Derrick,
M. Khalfallah, V. Relano, D. Zeller and D. Pauly (eds). Updating to 2018 the 1950-2010 Marine Catch Reconstructions of the Sea Around Us: Part I – Africa, Antarctica, Europe and the North Atlantic. Fisheries Centre Research Report 28(5).
Petrossian, G.A. 2018. A micro-spatial analysis of opportunities for IUU fishing in 23 Western African countries. Biological Conservation, 225: 31-41.
Potts, W.M., R. Hernriques, C.V. Santos, K. Munnik, I. Ansorge, F. Dufois, A.J. Booth, C. Kirchner, W.H.H. Sauer and P.W. Shaw. 2014. Ocean warming, a rapid distributional shift, and the hybridization of a coastal fish species. Global Change Biology, 20(9): 2765-2777.
UNEP-WCMC and IUCN. 2020. Protected Planet: Protected Area Profile for Angola from the World Database of Protected Areas, June 2020. Available at: www.protectedplanet.net/country/AO

Updating to 2018 the 1950-2010 marine catch reconstructions of the Sea Around Us: Part I – Africa, Antarctica, Europe and the North Atlantic
27
CAMEROON: UPDATED CATCH RECONSTRUCTION FOR 2011-2018*
Brittany Derrick Sea Around Us, Institute for the Oceans and Fisheries, University of British Columbia,
2202 Main Mall, Vancouver, BC, V6T 1Z4, Canada
Abstract This contribution presents an update to 2018 of the marine fisheries catch reconstruction for Cameroon initially covering the years 1950 to 2010. Improvements in the sampling procedure for artisanal catches have led to a significant increase in reported catch in recent years. In order to account for this increase in reporting and to avoid a ‘presentist bias’, total reconstructed catches were interpolated from the previous peak of catch (in 2015), which was assumed to be fully reported. Details are provided regarding sector-specific aspects of this update. Introduction Reconstruction of Cameroon’s marine fisheries catch data was performed for 1950-2010 by Belhabib and Pauly (2015a, 2015b, 2016) and subsequently updated to 2015 by the Sea Around Us. Since the original reconstruction, new sampling methods for estimating artisanal catch have been implemented by the Government of Cameroon with the assistance of FAO’s Technical Cooperation Programme. This has shown that the previous sampling methods underestimated the number of canoes by 13, 000 (Djienouassi 2016; FAO (2016b). Due to these findings, FAO has modified its catch statistics for Cameroon in the 2015 dataset, and retroactively corrected its 2010-2013 data (FAO 2016a; Figure 1). Figure 1. Comparison of 2014 and 2018 versions of FAO marine landings for Cameroon (Central Eastern Atlantic) for 2000-2018. Materials and Methods Given the changes suggested by the FAO statistics, the following describes the improvements we have made to the original reconstruction to obtain reasonable estimates of artisanal fisheries catches.
* Cite as: Derrick, B. 2020. Cameroon: updated catch reconstruction for 2011 – 2018, p. 27-30. In: B. Derrick, M. Khalfallah, V. Relano, D. Zeller and D. Pauly (eds). Updating to 2018 the 1950-2010 Marine Catch Reconstructions of the Sea Around Us: Part I – Africa, Antarctica, Europe and the North Atlantic. Fisheries Centre Research Report 28(5).
2020 Fisheries Centre Research Reports 28(5)
28
First, the total reconstructed landings for 2003 and the total reconstructed landings for 2015 were used as anchor points and annual reconstructed landings were interpolated between the two anchors. The total reconstructed unreported landings were then calculated as the difference between total reconstructed landings and reported landings and then disaggregated by fishing sector as described below. Total industrial landings were updated for 2011-2015 by multiplying the catch per unit effort (CPUE) with updated number of vessels. Lejeune and Boixel (2013) described the total number of industrial vessels as declining by 7% between 2009 and 2013; this number was used to estimate the total number of vessels in 2013. It was assumed that the number of vessels remained the same for 2013-2015; the number of vessels were interpolated for 2011-2012 between the anchor points. The 2010 percentage of total industrial landings reported were assumed to remain the same for 2011-2015. Unreported landings were determined to be the difference between the total industrial landings and the calculated industrial reported landings. The 2010 ratios of reported industrial landings attributed to shrimp and demersal trawling were held constant for 2011-2015. The taxonomic breakdown of unreported landings was held constant at the 2010 proportions for 2011-2015. Discards from demersal trawl and shrimp trawl fisheries were carried forward at the previously used rate of discards. The taxonomic composition of discards for 2011-2015 was assumed to remain the same as in 2010. Because of the new information regarding the estimation of artisanal fisheries catches, it was assumed that the previous estimate had likely underestimated the actual catch from artisanal fisheries. This estimate of artisanal catches over time will need to be more fully re-evaluated in a future update. In the meantime, artisanal landings were retroactively modified to reflect the increase in catch for 2004-2014 (Figure 2). Artisanal reported landings were updated for 2004-2014 based on the difference between the data reported by FAO in the 2015 dataset and the reported industrial landings. All updated reported landings were assigned to taxa based on the proportions in the FAO 2015 dataset for each year. Unreported landings from artisanal fisheries were updated for 2006-2014 based on the difference between the total unreported landings per year and the unreported landings attributed to industrial and subsistence sectors. Unreported catch by artisanal fisheries were allocated to taxa at the same proportions as in the original reconstruction. Until future reviews can assess this in detail, we assumed that artisanal fisheries were assumed fully reported in 2015. The catches of the subsistence sector were updated for 2011-2015 using the methods described by Belhabib and Pauly (2015a). The total population of Cameroon was updated for 2011-2015 with data from the World Bank, and both the 2010 percentages of the coastal population and the taxonomic breakdowns were carried forward unaltered. The decrease in per capita consumption rate was extrapolated forwards for 2011-2015 to continue the trend of declining per capita consumption. The assumption of a continuously declining consumption rate over recent times will need to be more fully re-evaluated in a future update. Landings reported by foreign fishing entities in Cameroon’s Exclusive Economic Zone (EEZ) were updated for 2011-2015 based on reported landings by fishing entities in the Southeast Atlantic in the FAO 2015 dataset. The 2010 ratio of reported landings estimated to originate from Cameroon’s EEZ was used to allocate reported landings to Cameroon’s EEZ for 2011-2015. Total landings by Chinese vessels fishing in Cameroon’s EEZ were assumed to remain constant for 2010-2015. As a result, unreported landings were estimated from the difference between total landings and reported landings, by China, allocated from Eastern Central Atlantic FAO area to Cameroon’s EEZ. The taxonomic breakdown from 2010 was carried forward unaltered for China’s unreported landings. Discards from Chinese vessels fishing in Cameroon’s EEZ were updated for 2011-2015 based on the 2010 ratio of total catch by China in Cameroon. The assumption and data associated with foreign fishing by Chinese and other foreign fleets in Cameroon will need to be more fully re-evaluated in a future update. Transition from 2015 to 2018 Finally, the automatization procedure described in Noël (2020) was applied to update the reconstruction to 2016-2018, based on FAO’s release of their fisheries statistics for 2018. Results and Discussion Figure 2 present the reconstructed marine fisheries catch of Cameroon from 1950 to 2018.

Updating to 2018 the 1950-2010 marine catch reconstructions of the Sea Around Us: Part I – Africa, Antarctica, Europe and the North Atlantic
29
Figure 2. Reconstructed domestic catch of Cameroon’s fisheries by fishing sector for 1950-2018. In spite of the attempt outlined above to mitigate the effects of improved data collection and reporting in recent years on the historical catch time series, these reconstructed catches probably still reflect the occurrence of a ‘presentist bias’ in the artisanal fisheries data of Cameroon (Zeller and Pauly 2018), whose strong increase is suspicious. This issue will have to be revisited and carefully investigated in the next round, when the 2-year of semi-automated forward carry will need to be replaced by a more detailed, research-intensive update. Nevertheless, the major issue for the marine fisheries of Cameroon continues to be foreign, illegal fishing. The abundance of commercially valued species (e.g., the bonga shad, Ethmalosa fimbriata and the royal threadfin, Pentanemus quinquarius) and the proximity to areas of trans-shipment and ports of convenience put Cameroon at risk for illegal, unreported, and unregulated fishing by foreign fishing entities (Petrossian 2018). To deal with this threat to its marine resources, Cameroon is reported to have boarded and searched 10 vessels fishing illegally in 2014 and 12 vessels in 2015. Information was not available to determine the nationalities and level of catch involved, or the enforcement and penalty outcomes, but it should be incorporated in future updates. Cameroon also fined a Chinese vessel fishing in a restricted area and auctioned the 5 tonnes of catch found onboard in 2016 (Anon. 2016). Marine biodiversity protection Cameroon is a member of the Convention on Biological Diversity (Aichi), but efforts for protecting its marine biodiversity and its commitments have just started. For example, in 2000 its EEZ was declared (with 14,669 km2; Belhabib and Pauly 2015) and its MPAs occupy 1,602 km2 (UNEP-WCMC and IUCN 2020), which corresponds to 11 % of the EEZ. Efforts towards management and protection of marine resources and ecosystems are focused on the creation of protected areas and to attain development goals in order to become an emergent country in 2035 (Mbi and Lebga 2020). “The Ministry of Livestock Fisheries and Animal Industries (MINEPIA) has been monitoring eco-friendly practices of fishers in order to improve marine ecosystem, and this is often realized in collaboration with stakeholders. This is the case of the Livestock and Fisheries Development Project (LIFIDEP), North West

2020 Fisheries Centre Research Reports 28(5)
30
Region, which has provided technical and material assistance to fishers. A typical example is the training programme on Community Based Fisheries Management realized in collaboration with the North West Regional Delegation of Livestock, Fisheries and Animal Industries (DREPIA). Within the framework of this initiative, fishing gears are provided to fishers, and in addition, their knowledge and skills are enhanced on the effective use of available cultural technologies in the fishing occupation […] “Consequently, appropriate educational programs and campaigns with the community of fishers will cultivate awareness, and a positive green mental culture capable of fostering sustainable work behaviors’” (Mbebeb et al. 2019). Acknowledgements Funding for the work presented here was provided by the Minderoo Foundation, by the Marisla, Oak and David and Lucille Packard Foundations, and by the Bloomberg Philanthropies through Rare. References Anon. 2016. Cameroonian authorities intercept another Chinese illegal fishing vessel. Cameroon Concord,
edition of 20 July 2016. Available at: cameroon-concord.com/business/item/6450-cameroonian-authorities-intercept-another-chinese-illegal-fishing-vessel
Belhabib, D. and D. Pauly. 2015a. Reconstructing fisheries catches for Cameroon between 1950 and 2010. Fisheries Centre Working Paper #2015-04, 8 p.
Belhabib, D. and D. Pauly. 2015b. Reconstructing fisheries catches for Cameroon between 1950 and 2010, p. 77-84 In: D. Belhabib and D. Pauly (eds). Fisheries catch reconstructions: West Africa, Part II. Fisheries Centre Research Report 23(3).
Belhabib, D., and D. Pauly. 2016. Cameroon, p. 213. In: D. Pauly and D. Zeller (eds). Global Atlas of Marine Fisheries: A Critical Appraisal of Catches and Ecosystem Impacts. Island Press, Washington, DC.
Djienouassi, S. 2016. Improvement of data collection on small scale fisheries in Cameroon through the FAO's TCP with COREP countries. Presentation at FAO COFI Side Event, 12 July 2016, Rome, Italy.
FAO. 2016a. FAO Yearbook. Fishery and Aquaculture Statistics. 2014. Rome, Italy. FAO. 2016b. The State of World Fisheries and Aquaculture 2016. Contributing to food security and nutrition
for all. Rome, Italy. 200 p. Lejeune, J.L. and Y. Boixel. 2013. Plan strategique national de developpement et de mise en oeuvre du systeme
SCS et/ou VMS Cameroun. Document N°9b. Renforcement des Compétences et capacités en matière de SCS dans la Zone COREP. Commission Régional des Pêches du Golfe de Guinée (COREP), Libreville, Gabon.
Mbebeb, F. E., F.E. Gakuna and K.M. Ngwenyi. 2019. Working in Harmony with Nature: Physical and Mental Cultural Ecology as Motivators of inland Fishers in Bambalang, North West Cameroon. International Journal of Business and Social Science, 10(1).
Mbi, B.M.T. and A.K. Lebga. 2020. Protected Areas in Cameroon at the Mercy of the 2035 Emergent Project. Natural Resources Management and Biological Sciences. https://doi.org/10.5772/intechopen.92086
Noël, S.-L. 2020. Automation Procedure for Catch Reconstruction Updates, p. 15-20. In: B. Derrick, M. Khalfallah, V. Relano, D. Zeller and D. Pauly (eds). Updating to 2018 the 1950-2010 Marine Catch Reconstructions of the Sea Around Us: Part I – Africa, Antarctica, Europe and the North Atlantic. Fisheries Centre Research Report 28(5).
Petrossian, G.A. 2018. A micro-spatial analysis of opportunities for IUU fishing in 23 Western African countries. Biological Conservation, 225: 31-41.
UNEP-WCMC and IUCN. 2020. Protected Planet: Protected Area Profile for Cameroon from the World Database of Protected Areas, June 2020. Available at: www.protectedplanet.net/country/CM
Zeller, D. and D. Pauly. 2018. The ’presentist bias’ in time-series data: implications for fisheries science and policy. Marine Policy, 90: 14-19.

Updating to 2018 the 1950-2010 marine catch reconstructions of the Sea Around Us: Part I – Africa, Antarctica, Europe and the North Atlantic
31
CÔTE D'IVOIRE: UPDATED CATCH RECONSTRUCTION FOR 2011-2018*
Brittany Derrick Sea Around Us, Institute for the Oceans and Fisheries, University of British Columbia, 2202 Main Mall,
Vancouver, BC, V6T 1Z4, Canada
Abstract An update to the catch reconstruction for Côte d’Ivoire’s marine fisheries were completed for 2011-2015, and a semi-automation routine was used to carry reconstructed catch estimates forward to 2018. The original method relied on the number of vessels and catch-per-unit-effort (CPUE) for each vessel to estimate the catch for artisanal vessels. In recent years, new information was located and used to derive an updated CPUE and vessel numbers in order to reconstruct catches of artisanal fisheries. Detailed descriptions of the updated reconstruction by fishing sector are provided. Introduction The catch from Côte d’Ivoire’s marine fisheries was reconstructed for 1950-2010 by Belhabib and Pauly (2015, 2016) and updated to 2015 by the Sea Around Us. Materials and Methods Artisanal fisheries The artisanal fisheries landings were updated for 2011-2015 using the method used by Belhabib and Pauly (2015), combined with updated effort and catch per unit effort (CPUE) information. Updated total population information was obtained from the World Bank database and was used to determine the coastal population based on the 2010 ratio of coastal population to the total population. The number of lagoon fishers was estimated by extrapolating the decline in the percentage of the coastal population that engaged in lagoon fishing from 2010 forward to 2015. The total numbers of lagoon fishers were then multiplied by the CPUE in 2010 to determine the total artisanal lagoon landings for 2011-2015. All artisanal lagoon landings were assigned to the taxon ‘marine fishes not identified’. Artisanal marine landings were updated for 1985-2015 with updated CPUE information. UEMOA (2016) estimated the number of artisanal canoes to be 1,608 and total marine landings to be 36,183 tonnes in 2015. Based on this information, the CPUE in 2015 was computed to be 22.5 tonnes per canoe. The CPUE for marine artisanal fisheries was interpolated between the original anchor point in 1984 and the new anchor point in 2015. The number of canoes was interpolated between the 2010 anchor point of 1,372 canoes and the 2015 anchor point of 1,608 canoes. Then, artisanal landings were derived by multiplying the number of canoes by the updated CPUE information for 1985-2015. The original taxonomic breakdown was maintained for 1985-2010 and the taxonomic breakdown of landings reported to FAO was used to disaggregate reported marine artisanal landings for 2011-2015. Industrial fisheries Domestic industrial landings from trawl and purse seine fisheries were updated for 2011-2015. National data were available for 2011-2012 from INS (2012). Failler et al. (2014) reported that one domestic trawler was operating from 2011 onwards. Because no further information was available, the 2012 landings by trawl
* Cite as: Derrick, B. 2020. Côte d'Ivoire: Updated catch reconstruction for 2011 – 2018, p. 31-34. In: B. Derrick, M. Khalfallah, V. Relano, D. Zeller and D. Pauly (eds). Updating to 2018 the 1950-2010 Marine Catch Reconstructions of the Sea Around Us: Part I – Africa, Antarctica, Europe and the North Atlantic. Fisheries Centre Research Report 28(5).

2020 Fisheries Centre Research Reports 28(5)
32
fisheries were held constant for 2012-2015. Landings by domestic purse seiners were available for 2002-2012 from INS (2012). Djou (2016) reported that 25 small pelagic domestic purse seiners were operating in 2016, and Failler et al. (2014) described 18 small pelagic purse seiners in 2011. The number of domestic purse seiners was interpolated between 2011 and 2016. Using the total landings from domestic purse seiners and the number of vessels, the CPUE for 2012 was determined. The CPUE for 2012 was assumed to remain constant from 2012-2015 and multiplied by the number of purse seine vessels each year to calculate landings for 2013-2015. Landings from industrial fisheries were disaggregated by taxon using the breakdown of FAO reported landings after accounting for domestic faux poisson, i.e., literally ‘false fish’, but actually the unrecorded bycatch of the purse seine fisheries (Belhabib and Pauly 2015). After accounting for industrial and artisanal landings in 2011-2015, all excess reported catch remaining were assumed to be catches of faux poisson landed in Abidjan that had been reported as domestic catch. As a result, these landings were assigned to the taxon “marine fishes not identified”. Discards from domestic industrial fisheries were updated for 2011-2015 based on the ratio of catches discarded in 2010. The 2010 taxonomic breakdown for discards was maintained for 2011-2015. Subsistence fishing The subsistence catch was updated for 2011-2015 based on the method in Belhabib and Pauly (2015). The 2010 percentage of the coastal population engaged in cast net fishing was determined and used to calculate the number of cast net fishers for 2011-2015. The number of cast net fishers from Ebrié and Aby lagoon were multiplied by the CPUE from 2010, and cast net landings from Grand Lahou Lagoon were updated for 2011-2015 using the methods described previously by Belhabib and Pauly (2015). Subsistence catches by tegbe were determined for 2011-2015 based on the 2010 percentage of fishers to the coastal population and multiplied by the CPUE from 2010. The percentage of artisanal landings that was taken home for family consumption (i.e., subsistence) was maintained at the 2010 level for 2011-2015. The taxonomic breakdown of subsistence catches from 2010 was maintained for 2011-2015. Foreign fishing Landings by foreign fishing entities fishing in Côte d’Ivoire’s Exclusive Economic Zone (EEZ) were updated for 2011-2015. Commercially valuable species, such as bigeye grunt (Brachydeuterus auratus), bonga shad (Ethmalosa fimbriata), round sardinella (Sardinella aurita) and Madeiran sardinella (Sardinella maderensis) are highly prized by foreign fishing entities (Petrossian 2018). Reported landings by China, France, Spain, and Japan were updated for 2011-2015 based on the 2010 proportion of landings reported by each fishing entity determined to originate in the EEZ of Côte d’Ivoire. The 2010 tonnage from each fishing entity was held constant for 2011-2015, and unreported landings were determined to be the remaining landings after reported landings were accounted for. The landings of faux poisson by foreign fishing entities were updated for 2011-2014 with data from Chavance et al. (2016). The percentage of faux poisson that was not reported was extrapolated from 2010-2014 to calculate total faux poisson landings. The total landings of faux poisson were assumed to remain constant for 2014-2015. Discards by foreign fishing entities for 2011-2015 were derived using the methods described for 2010 in Belhabib and Pauly (2015).

Updating to 2018 the 1950-2010 marine catch reconstructions of the Sea Around Us: Part I – Africa, Antarctica, Europe and the North Atlantic
33
Transition from 2015 to 2018 The catch update to 2015 was extended to 2018 using the semi-automation procedure developed by Noël (2020) and the reported landings available to 2018 provided by the FAO. Results and Discussion Figure 1 shows the catch reconstructed and updated for the EEZ of the Côte d’Ivoire.
Figure 1. Reconstructed domestic catch for Côte d’Ivoire’s EEZ by fishing sector for 1950-2018. To estimate the portion of catch not covered by official reporting systems, the catch-per-unit-effort (CPUE) per commercial vessel was used to reconstruct commercial landings for 2011-2015. Availability of CPUE information and the number of vessels actively fishing made it possible to estimate total catch per fishing sector. This total catch amount can then be compared to the reported data to identify gaps in data reporting. The reconstructed catch data for 2016-2018 obtained through the semi-automatic procedure of Noël (2020) will later be replaced by a more detailed, research-intensive update. Marine biodiversity protection Côte d'Ivoire has an EEZ of 173,764 km2 declared in 1977 (Belhabib and Pauly 2015). However, efforts towards protection of natural resources and especially conservation of marine environments are not sufficient. The country is part of the multilateral treaty of the Convention on Biological Diversity (Aichi) but currently there are no existing MPAs that protect Côte d'Ivoire’s waters (Marine Conservation Institute 2020). “The Government has signed agreements with several neighboring countries (Guinea, Senegal and Ghana), as well as the European Union. These agreements particularly concern territorial maritime waters and EEZs. They regulate fisheries activities in these zones by avoiding conflicts between different types of fisheries activities, prohibiting unsustainable fishing practices using non-regulated engines and by obliging all the fishers to declare their catches. The agreement with the European Union, the most important and signed on January 11, 1991 in Brussels (Belgium), allows European fleets to access the Ivorian maritime waters. In exchange, the EU provides financial resources to improve scientific knowledge necessary for a good management of fisheries resources” (Abe et al. 2000). Some research programs on “the Study of Tropical Atlantic Tuna Fish Resources” and on “the Economic Study of Maritime Fisheries Network” are financed by the EU and are currently run by the Oceanographic Research

2020 Fisheries Centre Research Reports 28(5)
34
Centre of Abidjan (Abe et al. 2000). Even though the country enacted some environmental legislation that can be used to address issues related with fisheries, MPAs are necessary to protect marine ecosystems from some of the major threats in Côte d'Ivoire, such as degradation of the coastline (including mangroves and beach) and overfishing (Abe et al. 2000). Degradation and overexploitation of marine resources have led to loss of protein for human consumption, unemployment, and other factors (Abe et al. 2000). Some of the causes of these threats are poverty (Fisher et al. 2015), inequalities, demographic pressure, the ineffective compliance with regulations, and ineffective law enforcement. “Ineffective law enforcement is characterized by the use of unauthorized mesh size, the disrespect for the period of seasonal closures of fisheries activities and the fishing in restricted areas” (Abe et al. 2000). Acknowledgements Funding for the work presented here was provided by the Minderoo Foundation, by the Marisla, Oak, and David and Lucille Packard Foundations, and by the Bloomberg Philanthropies through Rare. References Abe, J., M. Kouassi, J. Ibo, N. N’guessan, A. Kouadio, N. N’goran and N. Kaba. 2000. Côte d’Ivoire coastal
zone phase 1: integrated environmental problem analysis. Global Environment Facility, MSP Sub-Saharan Africa Project (GF/6010–0016). Available at: www.oceandocs.org/bitstream/handle/1834/630/Cote%20d?sequence=1
Belhabib, D. and D. Pauly. 2015. Côte d’Ivoire: fisheries catch reconstruction, 1950-2010, p. 17-36. In: D. Belhabib and D. Pauly (eds). Fisheries catch reconstructions: West Africa, Part II. Fisheries Centre Research Reports 23(3).
Belhabib, D. and D. Pauly. 2016. Côte d’Ivoire, p. 231. In: D. Pauly and D. Zeller (eds). Global Atlas of Marine Fisheries: A Critical Appraisal of Catches and Ecosystem Impacts. Island Press, Washington, DC.
Chavance, P., P. Dewals, M.J. Amande, A. Delgado de Molina, A. Cauquil and D. Irié. 2016. Tuna fisheries catch landed in Abidjan (Côte d’Ivoire) and sold on local fish market for the period 1982-2014. Collect. Vol. Sci. Pap. ICCAT, 72(3): 674-680.
Djou, K.J. 2016. Rapport pour l'atelier de lancement du projet CPCO FAO TCP « renforcement de la collecte systématique de données sur les pêches en Afrique de l’Ouest », Inventaire national de collecte des données sur la pêche. 9 p. Available at: www.fcwc-fish.org/fisheries/statistics/cote-d-ivoire
Failler, P., H.E. Ayoubi and A. Konan. 2014. Industrie des pêches et de l'aquaculture en Côte d’Ivoire. Rapport n°7 de la revue de l'industrie des pêches et de l'aquaculture dans la zone de la COMHAFAT. Conférence Ministérielle sur la Coopération Halieutique entre les États Africains Riverains de l’Océan Atlantique (COMHAFAT). 200 p.
Fisher, B., A.M. Ellis, D.K. Adams, H.E. Fox and ER. Selig. 2015. Health, wealth, and education: the socioeconomic backdrop for marine conservation in the developing world. Marine Ecology Progress Series, 530:233-242.
INS. 2012. Annuaire statistique des pêches et de l'élevage, 2012. Institut National de la Statistique (INS). Available at: www.ins.ci/n/index.php?option=com_content&view=article&id=115&Itemid=97
Marine Conservation Institute. 2020. MPAtlas [Online]. Seattle, WA. Available at: www.mpatlas.org Noël, S.-L. 2020. Semi-automation procedure for catch reconstruction forward carry, p. 15-20. In: B. Derrick,
M. Khalfallah, V. Relano, D. Zeller and D. Pauly (eds). Updating to 2018 the 1950-2010 Marine Catch Reconstructions of the Sea Around Us: Part I – Africa, Antarctica, Europe and the North Atlantic. Fisheries Centre Research Report 28(5).
Petrossian, G.A. 2018. A micro-spatial analysis of opportunities for IUU fishing in 23 Western African countries. Biological Conservation, 225: 31-41.
UEMOA. 2016. Enquête cadre de la pêche maritime artisanale: présentation du rapport de la Côte d’Ivoire. Atelier régional de validation et clôture du programme: état des pêcheries artisanales continentale et maritime dans les 8 états membres de l’UEMOA, UEMOA, Abidjan, Côte d’Ivoire. 37 p.

Updating to 2018 the 1950-2010 marine catch reconstructions of the Sea Around Us: Part I – Africa, Antarctica, Europe and the North Atlantic
35
THE GAMBIA: UPDATED CATCH RECONSTRUCTION FOR 2011-2018*
Anna Mbenga Chama, Salifu Ceesaya, Dyhia Belhabibb and Simon-Luc Noëlc a) Department of Fisheries, Republic of the Gambia, 6 Marina Parade, Banjul, The Gambia
b) Ecotrust Canada, Vancouver, BC, Canada. c) Sea Around Us, Institute for the Oceans and Fisheries, University of British Columbia, 2202 Main
Mall, Vancouver, BC, V6T 1Z4, Canada
Abstract An update to the catch reconstruction for The Gambia was completed for 2011-2018. The major challenge in updating the catch reconstruction for The Gambia was reconstructing the total small-scale catch, given the constraint that the reporting system covered only select landing sites. To account for small-scale marine catches across the entire country, we applied catch-per-unit-effort (CPUE) information to the landing sites not covered by surveys. Details of methods used to update the catch data for all sectors of the fisheries of The Gambia are provided below. Introduction A catch reconstruction of the marine fisheries of The Gambia for 1950-2010 was presented by Belhabib et al. (2013; 2016a; 2016b). Here, we document an update of fisheries catch data for The Gambia to 2018 based on FAO statistics and national statistics for artisanal and industrial fisheries produced by the Gambian Ministry of Fisheries & Water Resources. We also describe, by sector, how unreported catches were reconstructed. Materials and Methods Artisanal fisheries Total landings from artisanal fisheries were reconstructed for 2011-2015 by applying catch-per-unit-effort (CPUE) rates to the number of artisanal vessels. Total reported catch for each landing site covered during the Catch Assessment Survey (Anon. 2015) was divided by the total number of boats per landing site to estimate surveyed artisanal CPUE for 2015. Then, we estimated the catch of the landing sites not covered by the Catch Assessment Survey (Anon. 2015) by using the CPUE of the closest surveyed landing site, assuming that the CPUE of the two landing sites is approximately equal. We interpolated the number of artisanal fishing boats for each landing site between anchor point years for 2006-2014 to the total number of boats in 2015 by applying the percentage of each landing site to the total number of boats in 2015. We keep this percentage constant between 2006 and 2014, and we finally multiplied the percentage of boats for each landing site by the total number of boats in each year. Next, we multiplied the CPUE by the number of boats for 2006-2014 to estimate the total artisanal catch. This enabled unreported catch from the landing sites not covered by the survey to be estimated based on the reported landings from the Catch Assessment Survey (Anon. 2015). Unreported catch for 2016-2017 was calculated using the ratio of unreported and reported artisanal landings in 2015. The taxonomic breakdown of the reported artisanal landings was used to disaggregate unreported artisanal landings for 2011-2017.
* Cite as: A.M. Cham, Ceesay, S., Belhabib, D. and S.-L. Noël. 2020. The Gambia: Updated catch reconstruction for 2011 –2018, p. 35-39. In: B. Derrick, M. Khalfallah, V. Relano, D. Zeller and D. Pauly (eds). Updating to 2018 the 1950-2010 Marine Catch Reconstructions of the Sea Around Us: Part I – Africa, Antarctica, Europe and the North Atlantic. Fisheries Centre Research Report 28(5).

2020 Fisheries Centre Research Reports 28(5)
36
Subsistence catches A sizeable component of subsistence catch in The Gambia consists of oysters and cockles collected in the Gambia River’s estuary. We extrapolated the total number of shellfish collectors from 2012 to 2017 and kept the CPUE constant from 2012-2017 at 11.6 kg per fisher (Belhabib et al. 2013; Table 1). The 2010 estimate of 120 active fishing days per year for the shellfish collectors was maintained for 2011-2017 (Table 1). We then calculated the catch by multiplying the CPUE by the number of fishing days by the number of fishers. We disaggregated subsistence catch for this sector at the same proportions as for 2010 (Belhabib et al. 2013).
Table 1: Number of fishers corresponding to the total number of catch (2010 – 2015)
Year Number of
fishers CPUE (kg/day) Number of days
fished Catch(t)
2010 -- -- -- 2,838 2011 -- -- -- 3,612 2012 3,150 11.6 120 4,385
2013 3,240 11.6 120 4,510 2014 3,330 11.6 120 4,635 2015 3,420 11.6 120 4,761
2016 3,510 11.6 120 4,886 2017 3,600 11.6 120 5,011
Subsistence catch by men and children The population of the Gambia was updated for 2012-2017 from World Bank data. The percentage of the population living near the coast was maintained at its 2010 value (Belhabib et al. 2013) for 2012-2017 and used to calculate the coastal population. The annual per capita consumption was extrapolated for 2012-2017 and applied to the coastal population to estimate the subsistence catch by men and children. This catch was taxonomically disaggregated according to the 2010 proportions for 2012-2017. Subsistence catch given to women as payment for helping fishers The subsistence catch given to women as payment for helping line and net fishers was extrapolated to 2017 based on the trend from the original reconstruction and disaggregated taxonomically based on the 2010 ratios. Recreational catch The number of tourists who visited The Gambia from 2011 to 2015 were extracted from the World Bank database; its estimate of 162,000 tourists in 2017 allowed an interpolation for 2016. We assumed that 4.3% of the total number of tourists engaged in recreational fishing (Manel 2008), spending on average 10 days in The Gambia and fishing 5 days (Belhabib et al. 2013) for 2011-2017. We held the CPUE constant at 14.5 kg per tourist (Belhabib et al. 2016) for 2011-2017 and the number of days fished at 5 (Manel 2008). We estimated total recreational catch by multiplying the number of recreational fishers by the CPUE and the number of days fished. The 2010 recreational taxonomic breakdown was maintained for 2011-2017. Industrial catch A list of licensed industrial fishing vessel names, nationality, vessel type, and the reported GRT from 2011 to 2014 was obtained from the Monitoring Control and Surveillance Unit of the Department of Fisheries of The Gambia. No industrial vessels were licensed to fish from late 2015 to 2017 due to the ban on industrial fishing within its EEZ (Belhabib et al. 2016; Cabral et al. 2018). However, illegal fishing is known to continue despite

Updating to 2018 the 1950-2010 marine catch reconstructions of the Sea Around Us: Part I – Africa, Antarctica, Europe and the North Atlantic
37
the ban, and reported catch from the industrial subsector was available for 2015-2018 from the Fisheries Department Statistics Unit. To reconstruct the industrial catch for 2011-2014, we applied a CPUE of 14.78 kg·GRT-1·day-1 per vessel to the number of vessels (Belhabib et al. 2013). We assumed that the number of fishing days was constant at 165 days for purse seine vessels and 95 days for tuna vessels (Belhabib et al. 2013). Reported industrial catches were subtracted from total reconstructed industrial catch for 2011-2015. Unreported landings were held constant at the 2015 amount for 2016-2017, and discards were calculated based on the ratio per gear for 2011-2017. Transition from 2017 to 2018 The catch update to 2017 was extended to 2018 using the procedure developed by Noël (2020) and the reported landings available to 2018 provided by the FAO and the Gambian Ministry of Fisheries & Water Resources. Results and Discussion Figure 1 presents the reconstructed marine and estuarine fisheries catch of The Gambia for the period from 2000 to 2018. Fishmeal and fish oil production has increased in scale in recent years; approximately 40% of Gambian reported fisheries catches in 2016 were destined for one of The Gambia’s fishmeal and fish oil production plants (Anon. 2019), which export their products and will eventually contribute to local food security issues (Pauly 2019a, 2019b).
Figure 1. The domestic marine and estuarine fisheries catch of the The Gambia by fishing sector for the period from 1950 to 2018 as reconstructed here. Foreign fishing of bonga shad (Ethmalosa fimbriata) and other commercially valuable species leads to high risk of illegal fishing, which is aggravated by The Gambia being close to ports of convenience and transshipment locations (Petrossian 2018).

2020 Fisheries Centre Research Reports 28(5)
38
Marine biodiversity protection The Gambia has agreed to protect biological diversity through the international Convention on Biological Diversity (Aichi) and the Ramsar Convention on Wetlands of International Importance and the World Heritage Convention (Marine Conservation Institute, 2020). The Gambia has three marine managed areas and two MPAs. Together, these areas cover 14.3 km2 (UNEP-WCMC and IUCN 2020), which equals less than 1% of the entire EEZ (22650 km2; Belhabib et al. 2016b). The three MPAs are Niumi (a National Park designated in 1986 with a total area of 77 km2), Tanbi Wetland (a National Park designated in 2003 with a total area of 60 km2), and Tanji (a Bird Sanctuary designated in 1993 with a total area of 6 km2). The two marine managed areas are Baobolon (a Wetland Reserve designated in 1996 with a total area of 220 km2) and Tanbi Wetland Complex (a Ramsar Site designated in 2007 with a total area of 63 km2). The Baobolon Wetland Reserve is the biggest of the Ramsar sites, “[a] tidal wetland complex on the Gambia River consisting of six major bolons (tributaries), tidal estuaries, and three distinct wetland ecosystems: mangrove forest, saltmarsh and savanna woodland. The tidal flats have been dyked for fresh water retention and rice production. The mangroves provide important fish spawning habitat. The site borders Senegal, offering the potential for bilateral cooperation with management. Human activities are predominantly recreational (birdwatching, wildlife viewing, fishing, and canoeing) and also include mangrove and thatch grass harvesting” (Ramsar sites information service, 2020). Acknowledgements Funding for the work presented here was provided by the Minderoo Foundation, by the Marisla, Oak, and David and Lucille Packard Foundations, and by the Bloomberg Philanthropies through Rare. References Anon. 2015. 2015 Catch Assessment Survey report. Gambia Artisanal Fisheries Development Project, Banjul. Anon. 2019. Fishing for Catastrophe: How global aquaculture supply chains are leading to the destruction of
wild fish stocks and depriving people of food in India, Vietnam and The Gambia. Changing Markets Foundation. 89 p.
Belhabib, D., A. Mendy, Y. Subah, N.T. Broh, A.S. Jueseah, N. Nipey, W.W. Boeh, N. Willemse, D. Zeller and D. Pauly. 2016a. Fisheries catch under-reporting in The Gambia, Liberia and Namibia, and the three Large Marine Ecosystems which they represent. Environmental Development, 17: 157-174.
Belhabib, D., A. Mendy, D. Zeller, and D. Pauly. 2016b. Gambia, p. 272. In: D. Pauly and D. Zeller (eds). Global Atlas of Marine Fisheries: A Critical Appraisal of Catches and Ecosystem Impacts. Island Press, Washington, DC.
Belhabib, D., A. Mendy, D. Zeller, D. Pauly. 2013. Big fishing for small fishes: six decades of fisheries in The Gambia, “the smiling coast of Africa”. Fisheries Centre Working Paper #2013-07, 20 p.
Cabral, R.B., J. Mayorga, M. Clemence, J. Lynham, S. Koeshendrajana, U. Muawanah, D. Nugroho, Z. Anna, G.A. Mira, N. Zulbainarni, S.D. Gaines and C. Costello. 2018. Rapid and lasting gains from solving illegal fishing. Nature Ecology & Evolution, 2(4): 650–658. doi.org/10.1038/s41559-018-0499-1
Manel, C.J.P. 2008. Analyse économique des effets induits par la pêche récréative au Sénégal: Cas de la petite côte et du Siné Saloum. Master thesis, Université de Bretagne Occidentale, Brest, France. 72 p.
Marine Conservation Institute. 2020. MPAtlas [Online]. Seattle, WA. Available at: www.mpatlas.org Noël, S.-L. 2020. Semi-automation procedure for catch reconstruction forward carry, p. 15-20. In: B. Derrick,
M. Khalfallah, V. Relano, D. Zeller and D. Pauly (eds). Updating to 2018 the 1950-2010 Marine Catch Reconstructions of the Sea Around Us: Part I – Africa, Antarctica, Europe and the North Atlantic. Fisheries Centre Research Report 28(5).
Pauly, D. 2019a. Micronutrient richness of global catches. Nature https://doi.org/10.1038/d41586-019-02810-2; https://rdcu.be/bSRf8
Pauly, D. 2019b. Le marché mondial du poisson contribue aux carences alimentaires. Pour la Science (506 ; octobre 22; see : www.pourlascience.fr/sd/environnement/le-marche-mondial-du-poisson-contribue-aux-carences-alimentaires-18224.php
Petrossian, G.A. 2018. A micro-spatial analysis of opportunities for IUU fishing in 23 Western African countries. Biological Conservation, 225: 31-41.

Updating to 2018 the 1950-2010 marine catch reconstructions of the Sea Around Us: Part I – Africa, Antarctica, Europe and the North Atlantic
39
Ramsar sites information service. 2020. Baobolon Wetland Reserve. Available at: rsis.ramsar.org/ris/860?language=en
UNEP-WCMC and IUCN. 2020. Protected Planet: Protected Area Profile for Gambia from the World Database of Protected Areas, June 2020. Available at: https://www.protectedplanet.net/country/GM

2020 Fisheries Centre Research Reports 28(5)
40
GHANA: UPDATED CATCH RECONSTRUCTION FOR 2011-2018*
Ruby Polidoa, Simon-Luc Noëlb and Kofi Amadorc
a) Quantitative Aquatics, Inc., IRRI G. S. Khush Hall, College, Los Baños, 4031 Laguna, Philippines
b) Sea Around Us, Institute for the Oceans and Fisheries, University of British Columbia, 2202 Main Mall, Vancouver, BC, V6T 1Z4, Canada
c) Marine Fisheries Research Division, Ministry of Fisheries and Aquaculture Development, Tema, Ghana Abstract This contribution updates to 2018 a previous reconstruction of the catch of Ghana’s marine and lagoon fisheries that initially covered the years 1950 to 2010. Here, some emphasis is given to the foreign trawlers operating illegally in the Ghanaian Exclusive Economic Zone, and to the conflicts this generates with local fishers. Details are also provided for the various sectors of Ghana’s marine and lagoon fisheries. Introduction A thorough catch reconstruction for the marine and lagoon/estuarine fisheries of Ghana from 1950 to 2010 was carried out by Nunoo et al. (2014a, 2014b, 2016). The present update builds in part upon an update to 2014 performed by the last author (K. Amador, unpublished data). Materials and Methods FAO reported data were compared to data reported nationally by the MOFA (MOFA 2012, 2013, 2014) and MoFAD (2019). The FAO data were treated as the reported data baseline and subdivided into artisanal, industrial, and tuna fishery sectors according to nationally-reported proportions. Any excess national data in any of these sectors were assigned to unreported landings. Subsistence and estuarine/lagoon fisheries Subsistence consumption for Ghana was estimated by using the available per-capita fish consumption for 2010 (Nunoo et al. 2014a, 2014b) and 26 kg per person per year in 2016 (FAO 2016). An average household size of 4 was estimated for 2010 (Nunoo et al. 2014a, 2014b) and 4.5 people per household for 2016 (Michael Bauer Research 2016). To estimate subsistence catches for 2011-2017, the average household size was multiplied by the number of fishers and the per-capita fish consumption. Because no other information was available, the values for lagoon fisheries and the overall taxonomic breakdown for the sector were held constant for 2011-2017. Recreational fisheries Recreational catch was updated for 2011-2017 the same way as in Nunoo et al. (2015) using the number of tourists reported by The World Bank (2018). Artisanal fisheries The number of artisanal fishers was estimated from the number of canoes in operation in Ghanaian waters multiplied by the average crew size per canoe, the latter of which was extrapolated from Nunoo et al. (2014b)
* Cite as: Polido, R., S.-L. Noël and K. Amador. 2020. Ghana: Updated catch reconstruction for 2011 – 2018, p. 40-45. In: B. Derrick, M. Khalfallah, V. Relano, D. Zeller and D. Pauly (eds). Updating to 2018 the 1950-2010 Marine Catch Reconstructions of the Sea Around Us: Part I – Africa, Antarctica, Europe and the North Atlantic. Fisheries Centre Research Report 28(5).

Updating to 2018 the 1950-2010 marine catch reconstructions of the Sea Around Us: Part I – Africa, Antarctica, Europe and the North Atlantic
41
for 2011-2017. Given the available information, the number of active marine canoes for 2011 (11,231 canoes), 2016 (12,449 canoes; The World Bank 2017) and 2017 (11,583 canoes; The World Bank 2017, Lazar et al. 2018) served as anchor points. The crew size was extrapolated from the 2010 value, which was assumed to have increased due to the introduction of premix fuel subsidies that make artisanal fishing cheaper (Tanner et al. 2014). Industrial tuna and bait fisheries The FAO data corresponding to industrial tuna fisheries changed substantially between 1996 and 2010, mainly in the distribution of catch between taxa but sometimes increasing total tonnage. Catches of tuna and billfishes are not addressed here because they have been updated through a separate Sea Around Us study (Coulter et al. 2020). The number of tuna bait boats in Ghana was available for 2011 and 2012 (14 bait boats; Chassot et al. 2014), 2014 (20 bait boats; Anon. 2015), and 2016 (20 bait boats; Defaux et al. 2018). The number of fishing trips per bait boat was derived from the 2010 data and carried forward to 2017 along with the 2010 CPUE to reconstruct bait catches from this fishery. The 2010 tonnage of discards per bait boat was carried forward to 2017 and used to estimate anchovy discards. Trawlers and other industrial fisheries The activities of pair trawlers have been a common grievance for artisanal fishers in Ghana. However, there appears to be some confusion among fishers as to what exactly a pair trawler is, as well as evidence that even though pair-trawlers may be present in Ghana, most, if not all, are decommissioned (Teitelbaum 2009; Gyamfi 2014; Ampofo 2016). Based on recent evidence, however, it is entirely possible that pair trawlers continue to operate illegally in Ghanaian waters despite the 2008 ban. According to the Environmental Justice Foundation (EJF 2018), 90-95% of Ghana's trawl fleets may have some Chinese involvement. In 2015, over 95% of trawlers with active licenses (102 of 106 vessels) fishing in Ghanaian waters were captained by Chinese nationals (EJF 2018). Also, 90% of industrial trawl vessels licensed in Ghana in 2015 were built in China. Foreign entities are prohibited by law from engaging in joint ventures for industrial trawl fishing. To bypass this, countries like China maintain opaque corporate structures to conceal the identities of the beneficial owners, making it more difficult to detect illegal fishing activities (EJF 2018). The Chinese government also provides support to the majority of trawlers currently operating in Ghana in the form of fuel subsidies, loans and other funding for their operations (EJF 2018). This suggests considerable industrial trawling occurs in Ghana. Based on this information, the minimum number of pair trawlers operating in Ghanaian waters was assumed to be 2 for 2011 to 2013, reduced to 1 for 2014 and kept constant to 2017. The 2010 catch-per-vessel was used to estimate catches for these pair trawlers. South Korea, China and Japan are known to fish legally in Ghana. FAO tuna catch of Auxis rochei by South Korea and Japan in the Eastern Central Atlantic was used to update catch for 2011-2014. However, no catches of this species were reported by the FAO for 2015-2017. Reported Chinese landings were updated using the proportion of ‘marine fishes nei’ derived in 2014, which was applied to get catch for 2015-2017. Illegal foreign fishing Illegal fishing in Ghana was calculated as a ratio of nationally-reported tuna landings. The trend in the ratio of tuna catch used to calculate the illegal catches from 2008 to 2010 was carried forward to 2017 and used to estimate illegal fishing for those years, split evenly between China and Togo. Additional discard rates of 10%
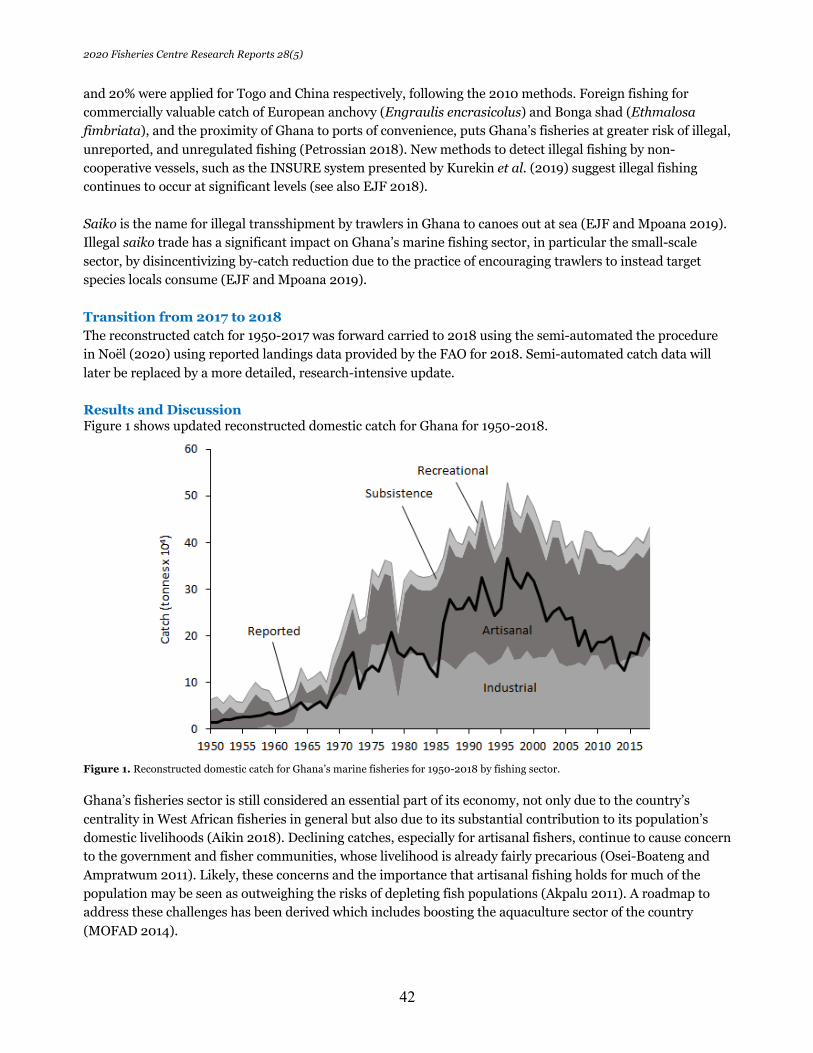
2020 Fisheries Centre Research Reports 28(5)
42
and 20% were applied for Togo and China respectively, following the 2010 methods. Foreign fishing for commercially valuable catch of European anchovy (Engraulis encrasicolus) and Bonga shad (Ethmalosa fimbriata), and the proximity of Ghana to ports of convenience, puts Ghana’s fisheries at greater risk of illegal, unreported, and unregulated fishing (Petrossian 2018). New methods to detect illegal fishing by non-cooperative vessels, such as the INSURE system presented by Kurekin et al. (2019) suggest illegal fishing continues to occur at significant levels (see also EJF 2018). Saiko is the name for illegal transshipment by trawlers in Ghana to canoes out at sea (EJF and Mpoana 2019). Illegal saiko trade has a significant impact on Ghana’s marine fishing sector, in particular the small-scale sector, by disincentivizing by-catch reduction due to the practice of encouraging trawlers to instead target species locals consume (EJF and Mpoana 2019). Transition from 2017 to 2018 The reconstructed catch for 1950-2017 was forward carried to 2018 using the semi-automated the procedure in Noël (2020) using reported landings data provided by the FAO for 2018. Semi-automated catch data will later be replaced by a more detailed, research-intensive update. Results and Discussion Figure 1 shows updated reconstructed domestic catch for Ghana for 1950-2018.
Figure 1. Reconstructed domestic catch for Ghana’s marine fisheries for 1950-2018 by fishing sector. Ghana’s fisheries sector is still considered an essential part of its economy, not only due to the country’s centrality in West African fisheries in general but also due to its substantial contribution to its population’s domestic livelihoods (Aikin 2018). Declining catches, especially for artisanal fishers, continue to cause concern to the government and fisher communities, whose livelihood is already fairly precarious (Osei-Boateng and Ampratwum 2011). Likely, these concerns and the importance that artisanal fishing holds for much of the population may be seen as outweighing the risks of depleting fish populations (Akpalu 2011). A roadmap to address these challenges has been derived which includes boosting the aquaculture sector of the country (MOFAD 2014).

Updating to 2018 the 1950-2010 marine catch reconstructions of the Sea Around Us: Part I – Africa, Antarctica, Europe and the North Atlantic
43
The Ghanaian government has also stepped up its efforts to gradually replenish its dwindling fish stocks by imposing an inshore fishing ban for May to June 2019 (Rufai 2019), along with a closed season for industrial trawling from August to October the same year (FCWC 2019). Ghana will need to consider enforcing serious reductions in industrial fishing, particularly by foreign beneficial ownership fleets, in order to better support its artisanal fisheries that are of crucial importance for domestic food security and livelihoods (Zeller and Pauly 2019). Marine biodiversity protection Ghana has agreed to protect its biological diversity through the international Convention on Biological Diversity (Aichi) and the Ramsar Convention on Wetlands of International Importance and the World Heritage Convention (Marine Conservation Institute 2020). In Ghana, conservation of marine ecosystems and resources is addressed through regulations, education and awareness programs (Amlalo 2006). “The main thrust and orientation of national policies on the protection, management and development of the marine and coastal environment is pivoted on the following three major areas: Integrated coastal zone management and sustainable development; Marine environmental protection, both from land-based activities and from sea-based activities; and Sustainable use and conservation of marine living resources (both of the high seas and under national jurisdiction)” (Amlalo 2006). “In Ghana there are no marine protected areas yet so the country does not fully have an adequate portion protected by the PA network according to the level of biodiversity. There is commitment to protecting a viable and representative PA network, through government efforts and competent staff whose capacities are developed and strengthened by training and career development programmes. However, there are no restoration targets for under-represented and/or greatly diminished ecosystems, but there is a mangrove restoration programme from the coastal wetlands” (UICN/PACO 2010). There are some discrepancies in the available data about Ghanaian MPAs; the MPAtlas states that Ghana supposedly has two MPAs and four marine managed areas (Marine Conservation Institute 2020). However, the two MPAs are further classified as ‘Forest Reserves’, which may also protect the surrounding waters. The four managed areas are Ramsar sites. On the other hand, the WDPA indicates that the MPAs’ extent is 221 km2 (UNEP-WCMC and IUCN 2020), which would correspond to less than 1% of the entire EEZ (225,661 km2; Nunoo et al. 2014, Nunoo et al. 2016). In the “short-medium” term (2016-2030), one of the national strategic goals is that at least “10 per cent of coastal and marine areas, especially areas of particular importance for biodiversity and ecosystem services, are conserved through effectively and equitably managed, ecologically representative and well-connected systems of protected areas and other effective area-based conservation measures, and integrated into the wider landscapes and seascapes”. However, the budget to preserve marine biodiversity including the establishment of marine protected areas and protection of important wetlands is just 1 million USD out of the 534.5 million USD of the total indicative cost (Republic of Ghana 2016). “Work on diversity of organisms in marine and aquatic systems has concentrated mainly on those exploited for food (principally mammals, reptiles, fishes and large shelled invertebrates)” (Republic of Ghana 2016). Even though more research is required to confirm the status of marine mammals in Ghanaian waters, all marine mammal species appear to be threatened. This is because of their predisposition to being part of the by-catch of fisheries. Reports show that drift gill nets (DGN) are impacting dolphins in particular (Ofori-Danson et al. 2003). Moreover, three species of turtles are confirmed to be threatened (leatherback, olive ridley and green) and one species (hawksbill) is locally extinct (Republic of Ghana 2016). In the future, fishery

2020 Fisheries Centre Research Reports 28(5)
44
agencies and managers need to incorporate by-catch monitoring and by-catch reduction measures into management regimes (Republic of Ghana 2016). Some other threats that affect marine ecosystems are habitat loss, degradation, and developments of coastal protection infrastructures (Republic of Ghana 2016). Acknowledgements Funding for the work presented here was provided by the Minderoo Foundation, by the Marisla, Oak, and David and Lucille Packard Foundations, and by the Bloomberg Philanthropies through Rare. References Aikin, E.K. 2018. Challenges of sustainable marine fishing in Ghana. 2018. World Academy of Science,
Engineering and Technology International Journal of Animal and Veterinary Sciences, 12(10): 337- 348.
Akpalu, W. 2011. Fisher skills and compliance with effort-limiting fishing regulations in a developing country. International Journal of Social Economics, 38(8): 9.
Amlalo, D. S. 2006. The protection, management and development of the marine and coastal environment of Ghana, p. 148-157. In: FIG Commissions 4& 7 Working Group 4.3. Administering Marine Spaces: International Issues. The International Federation of Surveyors (FIG), Frederiksberg, Denmark.
Ampofo, O.Y. 2016. If pair-trawling exist, ask the computers. Citi97.3 fm. Available at: citifmonline.com/2016/06/30/if-pair-trawling-exist-ask-the-computers-article/
Anon. 2015. National Fisheries Management Plan of Ghana: A National Policy for the Management of the Marine Fisheries Sector 2015-2019. Republic of Ghana. Ministry of Fisheries and Aquaculture Development Fisheries Commission. 48 p.
Chassot, E., S. Ayivi, L. Floch, P. Dewals, A. Damiano, P. Cauquil, L. Dubroca and P. Bannerman. 2014. Analysis of Ghanaian industrial tuna fisheries data: towards tasks I and II for 2006-2012. Collective Volume of Scientific Papers of ICCAT, 70(6): 16.
Coulter, A., T. Cashion, A. Cisneros-Montemayor, S. Popov, G. Tsui, F. Le Manach, L. Schiller, M. Palomares, D. Zeller and D. Pauly. 2020. Using harmonized historical catch data to infer the expansion of global tuna fisheries. Fisheries Research, 221:105379. doi.org/10.1016/j.fishres.2019.105379
Defaux, V., J. Gascoigne and T. Huntington. 2018. Action plan for the preparation of an Eastern Atlantic-Ghana based – pole and line Fishery Improvement Project (FIP). 53 p.
EJF. 2018. China’s hidden fleet in West Africa: A spotlight on illegal practices within Ghana’s industrial trawl sector. Environmental Justice Foundation (EJF). 31 p.
EJF and H. Mpoano. 2019. Stolen at sea. How illegal 'saiko' fishing is fuelling the collapse of Ghana's fisheries. Environmental Justice Foundation (EJF). 30 p.
FAO. 2016. Fishery and Aquaculture Country Profiles. The Republic of Ghana. Food and Agriculture Organization of the United Nations (FAO), Rome, Italy. Available at: www.fao.org/fishery/facp/GHA/en
FCWC. 2019. Ghana: Ministry imposes 2 months ban on industrial trawlers. Fisheries Committee for the West Central Gulf of Guinea (FCWC). Available at: fcwc-fish.org/ghana-ministry-imposes-2-months-ban-on-industrial-trawlers/.
Gyamfi, A.A. 2014. No pair-trawling in Ghana says Fisheries Minister. PeaceFM 104.3. Available at: www.peacefmonline.com/pages/local/science/201406/202386.php
Kurekin, A.A., B.R. Loveday, O. Clements, G.D. Quartly, P.I. Miller, G. Wiafe and K.A. Agyekum. 2019. Operational monitoring of illegal fishing in Ghana through exploitation of satellite earth observation and AIS data. Remote sensing, 11(293): 1-28.
Lazar, N., K. Yankson, J. Blay, P. Ofori-Danson, P. Markwei, K. Agbogah, P. Bannerman, M. Sotor, K. Yamoa and W.B. Bilisini. 2017. Status of the small pelagic stocks in Ghana (2015). Scientific and technical working group of USAID/ Ghana Sustainable Fisheries Management Project (SFMP). Coastal Resources Center, Graduate School of Oceanography, University of Rhode Island, 28 p.
Marine Conservation Institute. 2020. MPAtlas [Online]. Seattle, WA. Available at: www.mpatlas.org Michael Bauer Research. 2016. Ghana average household size. Esri. Available at:
www.arcgis.com/home/item.html?id=0a9a8c6ac48e4ae7ba7a32f7461beb74 MOFA. 2012. Agricultural Sector Annual Progress Report. Ministry of Food and Agriculture (MOFA), Ghana.
84 p. MOFA. 2013. Agricultural Sector Annual Progress Report. Ministry of Food and Agriculture (MOFA), Ghana.
xvi + 75 p.

Updating to 2018 the 1950-2010 marine catch reconstructions of the Sea Around Us: Part I – Africa, Antarctica, Europe and the North Atlantic
45
MOFA. 2014. Agricultural Sector Annual Progress Report. Ministry of Food and Agriculture (MOFA), Ghana. xiv + 115 p.
MOFAD. 2014. Sector strategic medium-term development plan (2014-2017). Ministry of Fisheries and Aquaculture Development (MOFAD), Ghana. 70 p.
MOFAD. 2019. Fish production (in metric tonnes) by year (2010-2017). Ministry of Fisheries and Aquaculture Development (MOFAD). Available at: www.mofad.gov.gh/publications/statistics-and-reports/fish-production/
Nunoo, F.K.E., B. Asiedu, K. Amador, D. Belhabib and D. Pauly. 2014a. Reconstruction of marine fisheries catches for Ghana, 1950-2010. Fisheries Centre Working Paper #2014-13, 25 p.
Nunoo, F.K.E., B. Asiedu, K. Amador, D. Belhabib, V.W.Y. Lam, U.R. Sumaila and D. Pauly. 2014b. Marine fisheries catches in Ghana: historic reconstruction for 1950 to 2010 and current economic impacts. Reviews in Fisheries Science & Aquaculture, 22(4): 274-283.
Nunoo, F. K. E., B. Asiedu, K. Amador, D. Belhabib, and D. Pauly. 2016. Ghana, p. 277. In: D. Pauly and D. Zeller (eds). Global Atlas of Marine Fisheries: A Critical Appraisal of Catches and Ecosystem Impacts. Island Press, Washington, DC.
Noël, S.-L. 2020. Semi-automation procedure for catch reconstruction forward carry, p. 15-20. In: B. Derrick, M. Khalfallah, V. Relano, D. Zeller and D. Pauly (eds). Updating to 2018 the 1950-2010 Marine Catch Reconstructions of the Sea Around Us: Part I – Africa, Antarctica, Europe and the North Atlantic. Fisheries Centre Research Report 28(5).
Ofori-Danson, P.K., K. van Waerebeek and S. Debrah. 2003. Survey for the conservation of dolphins in Ghanaian coastal waters. Journal of the Ghana Science Association, 5: 45-54.
Osei-Boateng, C. and E. Ampratwum. 2011. The informal sector in Ghana. Friedrich-Ebert-Stiftung (FES), Ghana. 40 p.
Petrossian, G.A. 2018. A micro-spatial analysis of opportunities for IUU fishing in 23 Western African countries. Biological Conservation, 225: 31-41.
Republic of Ghana. 2016. National biodiversity strategy and action plan. Accra, Ghana. Available at: www.cbd.int/doc/world/gh/gh-nbsap-v2-en.pdf
Rufai, N.A. 2019. Ghana bans fishing to rebuild stocks. TRT World. Available at: www.trtworld.com/africa/ghana-bans-fishing-to-rebuild-stocks-26854
Tanner, T., A. Mensah, E.T. Lawson, C. Gordon, R. Godfrey-Wood and T. Cannon. 2014. Political economy of climate compatible development: artisanal fisheries and climate change in Ghana. IDS Working Paper 2014, Institute of Development Studies, Brighton, UK. 30 p.
Teitelbaum, D. 2009. Tackling illegal fishing in Ghana. US Department of State, Accra, Ghana. The World Bank. 2017. Ghana – West Africa Regional Fisheries Program. Available at:
documents.worldbank.org/curated/en/836461508795711024/pdf/Disclosable-Version-of-the-ISR-Ghana-West-Africa-Regional-Fisheries-Program-P124775-Sequence-No-11.pdf
The World Bank. 2018. International Development Association project appraisal document on a proposed credit in the amount of SDR 27.9 million to the Republic of Ghana for a tourism development project. Available at: documents.worldbank.org/curated/en/161661531711822807/pdf/Ghana-Tourism-project-appraisal-document-pad-P164211-25Jun18-06252018.pdf
UNEP-WCMC and IUCN. 2020. Protected Planet: Protected Area Profile for Ghana Island from the World Database of Protected Areas, June 2020. Available at: www.protectedplanet.net/country/GH
UICN/PACO. 2010. Parks and reserves of Ghana: Management effectiveness assessment of protected areas. UICN/PACO, Ouagadougou, BF. Available at: portals.iucn.org/library/sites/library/files/documents/2010-073.pdf
Zeller, D. and D. Pauly. 2019. Viewpoint: Back to the Future for fisheries, where will we choose to go? Global Sustainability, 2(e11): 1-8.

2020 Fisheries Centre Research Reports 28(5)
46
KENYA: UPDATED CATCH RECONSTRUCTION FOR 1950-2018*
Amy McAlpine and Dirk Zeller Sea Around Us- Indian Ocean, School of Biological Sciences, University of Western Australia, 35 Stirling Hwy,
Crawley 6009, WA, Australia Abstract An update to Kenya’s reconstruction of their marine fisheries catches was completed for 2011-2017, and subsequently carried forward to 2018 using a semi-automatic routine. Due to a change in the official data estimation system used to report small-scale coastal catches, a dramatic increase in reported landings since 2015 was documented. We applied adjustment factors to previously reported catch data to account for this change and avoid the ‘presentist bias’ caused by improved reporting. Detailed description of the methods to update each sector are described in the sections below. Given the recent nature of this distinct change in the official data estimation system and the current lack of publicly available documentation on the exact methods to permit validation and testing of this new data collection method, caution must be maintained about the validity of these reported landings data for recent years of small-scale coastal catches. Introduction A preliminary reconstruction of Kenya’s total marine fisheries catch for 1950 to 2010 was conducted by Le Manach et al. (2015, 2016). Here, the original reconstruction is updated to 2017 to account for new information for more recent years, and subsequently forward carried to 2018 using the semi-automation routine of Noël (2020). Using the well-established approach described in Zeller et al. (2016), this reconstruction addresses only marine wild capture fisheries; no freshwater catches, aquaculture production, and catches of marine mammals, turtles or marine plants are included. The present summary is based on McAlpine (2019). Materials and Methods The broad steps of the catch reconstruction process are based on Zeller et al. (2016), with the specific methods and data sources used to reconstruct catches in this study described below. This reconstruction pertains to marine fisheries catch taken within Kenya’s Exclusive Economic Zone (EEZ), defined as the area extending 200 nautical miles from shore (UN 1982). Kenya’s EEZ covers an area of 162,000 km2, including an area of approximately 42,000 km2 that is currently under dispute with Somalia (Chan 2018). For the purposes of this research, and as per Sea Around Us methods, the disputed area was included within Kenya’s EEZ for Kenyan domestic catches. Thus, catch taken by Kenyan fishers within the disputed area will be included in the reconstruction. Initial allocation of the reported data Officially reported landings data for the years 2011-2017 were extracted from the FAO database (FAO 2015, 2019) for the fishing country, Kenya, and compared to national reports produced by Kenya’s Ministry of Agriculture, Livestock and Fisheries (SDF 2014a; SDF&BE 2016). National reports did not provide catch data for 2017, and previous years differed both in total quantity and in taxonomic breakdown to FAO data. Due to these discrepancies, and to maintain consistency with the previous 1950-2010 reconstruction (Le Manach et al. 2015, 2016), FAO data were employed as the official reported catch baseline for this reconstruction.
* Cite as: McAlpine, A. and D. Zeller. 2020. Kenya: Updated catch reconstruction for 1950 – 2018, p. 46-59. In: B. Derrick, M. Khalfallah, V. Relano, D. Zeller and D. Pauly (eds). Updating to 2018 the 1950-2010 Marine Catch Reconstructions of the Sea Around Us: Part I – Africa, Antarctica, Europe and the North Atlantic. Fisheries Centre Research Report 28(5).

Updating to 2018 the 1950-2010 marine catch reconstructions of the Sea Around Us: Part I – Africa, Antarctica, Europe and the North Atlantic
47
The FAO catch data for Kenya were first allocated to the four sectors (industrial, artisanal, subsistence and recreational), that were active within Kenya’s EEZ from 2011 to 2017. Comparison of the FAO reported data with the dataset published by the Indian Ocean Tuna Commission (IOTC) revealed that no official catch of large pelagic taxa has been reported by Kenya for either the industrial longline fishery or the recreational sector during the 2011-2017 time period. Earlier years of Kenyan industrial large pelagic catches are examined in Coulter et al. (2020). Thus, all reported catch for 2011 onwards was assigned to either the industrial shrimp trawl fishery or the two small-scale fisheries (artisanal and subsistence). Reported catch of shrimp and associated bycatch species were assigned to the industrial shrimp trawl fishery using information published by the Kenya Marine and Fisheries Research Institute (KMFRI 2018a). All reported catch of 'Brachyura', 'Crassostrea spp.', 'Crustacea' and 'Holothuroidea' were assigned to the small-scale shore-based gleaner fishery along with 50% of 'Octopodidae' and 6% of ‘Palinuridae’ (SDF 2016). All remaining catch was then assigned to the small-scale coastal fleet. Each fishery was then examined and reconstructed individually. Small-scale coastal fleet Based on previous work by McAlpine (2019), the catch by the small-scale coastal fleet from 2011 to 2017 was first estimated using catch and effort parameters as was done in the preliminary reconstruction of Le Manach et al. (2015) for the pre-2010 period. These estimates were then compared to the official catches for this fishery reported by the KMFRI based on the newly implemented sample-based data estimation method. The catch and effort-based estimation method as used in Le Manach et al. (2015) resulted in estimates for 2016 and 2017 that were substantially lower than the reported data generated by the KMFRI for the same years (see Appendix A). Thus, an alternative method using an adjustment factor was employed to reconstruct catch by the small-scale coastal fleet fishery for the post-2010 period. Reported catches by the small-scale coastal fleet fishery displayed a dramatic increase between 2015 and 2017. This suggests that despite the sample-based collection system being introduced in Kenya beginning in 2013, data collected under the old ‘total enumeration’ system continued to be submitted to the FAO until 2015. Thereafter, sample-based collection system data were reported to FAO starting in 2017, with 2016 apparently a transitionary year between the two data methods. As such, the difference between reported catch in 2015 and 2017 was used to derive a method-change adjustment factor of 1.56. To avoid the artificial amplification of the pre-existing peaks and troughs in the reported catch for earlier years, the adjustment factor was applied to the average of 2011-2015 reported catch, and then added to the original reported catch of each year. The average between the adjusted 2015 total catch and the original reported 2017 catch was used to re-estimate 2016 catch. The taxonomic breakdown of reconstructed total catch for this sector was based on the breakdown of reported catch, and improved using more detailed government fisheries reports (SDF 2014a; SDF&BE 2016). Shore-based fishers Despite the number of shore-based fishers increasing over this time period (SDF 2016), reported catch by shore-based fishers declined after 2015. This decline in reported catch suggests that the underreporting of shore-based catches may have become worse under the new data collection system. Thus, given the growth in the number of shore-based fishers, an adjustment factor would not have been an effective re-estimation technique for shore-based catches. Instead, a parameter-based method was used to re-estimate total catch by shore-based fishers between 2011 and 2017.

2020 Fisheries Centre Research Reports 28(5)
48
In order to estimate total annual catch by shore-based fishers, a time series of the number of shore-based fishers was sourced from government frame surveys (Fisheries Department 2006; SDF 2012, 2014b, 2016). The relevant catch-per-unit-effort (CPUE) was linearly interpolated between 3 kg·fisher-1·day-1 in 2010 (Le Manach et al. 2015) and 3.4 kg·fisher-1·day-1 in 2017 (Musembi et al. 2019). The time-series of shore-based fishers was then multiplied by the respective CPUE rates, with an assumed annual effort of 200 fishing days per year (Le Manach et al. 2015). Given the limited information on this shore-based fishery, the taxonomic breakdown of catches was derived using a combination of catch reported to the FAO, government fisheries reports (SDF 2014a; SDF&BE 2016) and scientific literature (Mirera 2017). For taxa that declined or disappeared after 2015 in the official reported data obtained through the new data collection system, the average composition of catches between 2011 and 2015 was used to adjust the 2016 and 2017 taxonomic breakdown. Catch of holothurians, crabs and octopus tend to be sold at local markets as well as exported, and were thus considered part of the artisanal sector (Kimani 1995; Aloo et al. 2014; Mirera 2017), while catch of cupped oysters and marine crustaceans were considered to be caught for subsistence purposes. Industrial shrimp trawl fishery After a complete ban in 2006, the industrial shrimp trawl fishery was re-opened in 2011 under the guidance of a newly developed Prawn Fishery Management Plan (Government of Kenya 2010). Given the tighter regulatory control of the re-emerged fishery, which included the periodic deployment of Marine Fisheries Observers to collect detailed catch data (KMFRI 2018a), it was assumed that all landed catch by industrial trawlers (i.e., targeted shrimp and retained bycatch) was reported. However, catches discarded at sea are expressly excluded from data reported by FAO (Garibaldi 2012) and were thus assumed to not be included in officially reported catches. Surveys by Marine Fisheries Observers reported the ratio of retained to discarded catch to be 4:1 in 2016 and 2:1 in 2017 (KMFRI 2018a). These ratios were used to estimate total discarded catch for these years, and an average ratio of 3:1 was applied to 2011-2015. Detailed information on the species-specific breakdown of shrimp catch and bycatch (retained and discarded) provided by KMFRI (2018a) were used to derive the taxonomic breakdown of catch by the industrial shrimp trawl fishery from 2011 to 2017. Pelagic longline fishery A domestic industrial longline fishery has been active in Kenya on a sporadic basis since the 1980s, and both the IOTC and the FAO have previously reported catch by this sector. Despite reports of a domestic longline vessel operating in Kenya’s EEZ during much of the 2011-2017 time period (Ndegwa et al. 2018; Ndoro and Ndegwa 2018), since 2010, no industrial catch was reported by the IOTC since 2010 in their official catch data, instead, all catch is categorized as ‘artisanal’. However, IOTC records from onboard observers exist. Further comparison of the IOTC catch database with national catch data sources also indicated that catch by the domestic industrial longline vessel was not included in the officially reported catch data. A report which documented the on-board catch records of the single longline vessel for 2016 reported total catches of 150.4 tonnes in that year (Ndegwa et al. 2018). To reconstruct the catch time-series of this fishery, this catch amount was applied to the years in which the vessel was registered in the IOTC vessel database, i.e., 2011-2012 and 2016-2018. We assumed it did not operate between 2013 and 2015. The taxonomic breakdown published in Ndegwa et al. (2018) was applied to final catch estimates (Table 1). Note that all catches from industrial large pelagic fisheries are examined separately in Coulter et al. (2020).

Updating to 2018 the 1950-2010 marine catch reconstructions of the Sea Around Us: Part I – Africa, Antarctica, Europe and the North Atlantic
49
Table 1. Taxonomic breakdown applied to the catch by the Kenyan industrial longline fishery between 2011 and 2017, as described by Ndegwa et al. (2018). Common name Taxon name Catch (%) Bigeye tuna Thunnus obesus 35.43 Swordfish Xiphias gladius 23.21 Yellowfin tuna Thunnus albacares 14.99 Black tip shark Carcharhinus limbatus 6.30 Tiger shark Galeocerdo cuvier 6.15 Black marlin Istiompax indica 5.29 Others Marine pelagic fishes not identified 4.21 Blue shark Prionace glauca 3.10 Hammerhead sharks Sphyrnidae 1.13 Sailfish Istiophorus platypterus 0.18
Recreational catch Since the 1970s, Kenya’s productive pelagic waters have made this country a popular destination for sport fishing (game fishing). To reconstruct catch for this recreational sector, catch records for the recreational sport fishery for 2004 to 2012 were obtained from reports published by the Kenya Association of Sea Anglers (KASA). These records included total catch (in kg), the number of individual fish caught, and the number of individual fish tagged and released. To estimate retained recreational sport fishing catch, the quantity of catch that was tagged and subsequently released was removed from the KASA catch totals. Retained catch per taxon was estimated as:
Cretained = (Ctotal / Ntotal) x (Ntotal – Ntr) Where Cretained is retained catch, Ctotal is total reported catch, Ntotal is the total number of individuals caught and Ntr is the number of individuals tagged and released. In the original catch reconstruction for Kenya (Le Manach et al. 2015), all sport fishing catch was erroneously considered to be landed; here the pre-2010 recreational catch was retrospectively corrected to account for the proportion of catch that was tagged and released between 1990 and 2010. Based on doubts expressed about the coverage of recreational catch data and the need for improvements in catch data collection for this fishery (Pepperell et al. 2017; N. Conway, pers. comm.), it was furthermore assumed that KASA only managed to record 50% of the total recreational catch that was occurring along Kenya’s coastline. After this adjustment, the total estimated retained and landed catch for 2012 was extrapolated based on the trend in international tourist arrivals (KNBS 2015, 2019) to estimate catch for 2013-2018 (Figure 1).
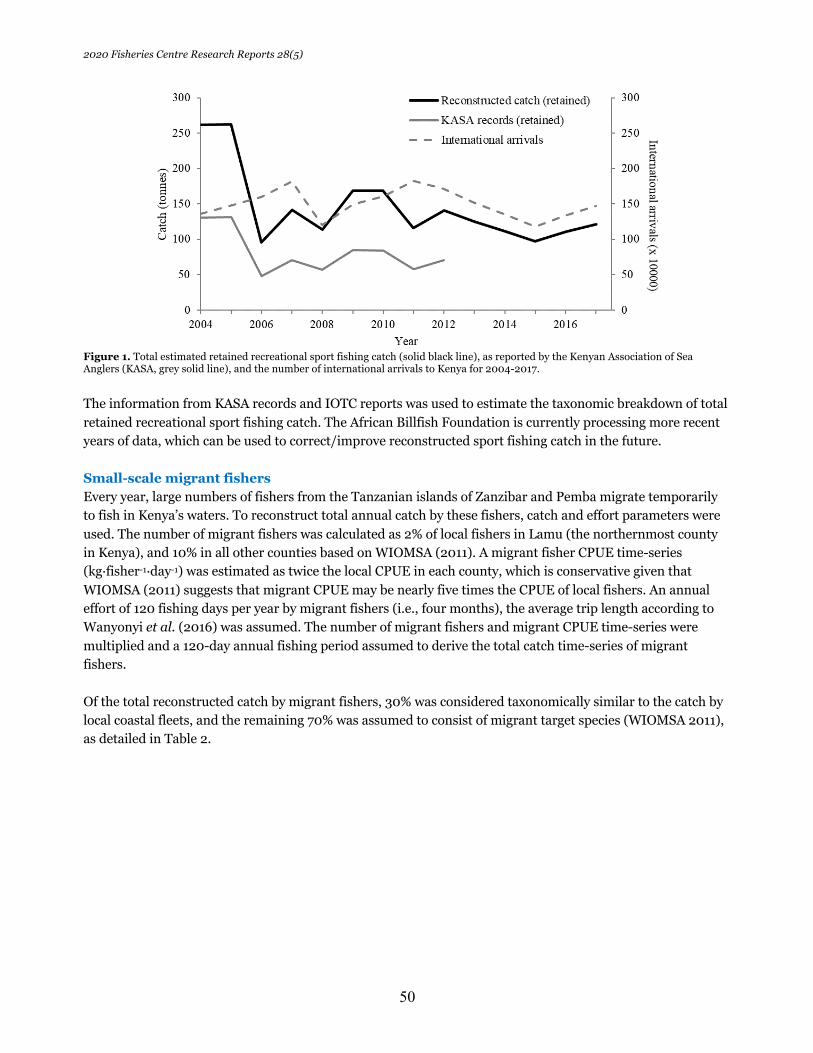
2020 Fisheries Centre Research Reports 28(5)
50
Figure 1. Total estimated retained recreational sport fishing catch (solid black line), as reported by the Kenyan Association of Sea Anglers (KASA, grey solid line), and the number of international arrivals to Kenya for 2004-2017. The information from KASA records and IOTC reports was used to estimate the taxonomic breakdown of total retained recreational sport fishing catch. The African Billfish Foundation is currently processing more recent years of data, which can be used to correct/improve reconstructed sport fishing catch in the future. Small-scale migrant fishers Every year, large numbers of fishers from the Tanzanian islands of Zanzibar and Pemba migrate temporarily to fish in Kenya’s waters. To reconstruct total annual catch by these fishers, catch and effort parameters were used. The number of migrant fishers was calculated as 2% of local fishers in Lamu (the northernmost county in Kenya), and 10% in all other counties based on WIOMSA (2011). A migrant fisher CPUE time-series (kg·fisher-1·day-1) was estimated as twice the local CPUE in each county, which is conservative given that WIOMSA (2011) suggests that migrant CPUE may be nearly five times the CPUE of local fishers. An annual effort of 120 fishing days per year by migrant fishers (i.e., four months), the average trip length according to Wanyonyi et al. (2016) was assumed. The number of migrant fishers and migrant CPUE time-series were multiplied and a 120-day annual fishing period assumed to derive the total catch time-series of migrant fishers. Of the total reconstructed catch by migrant fishers, 30% was considered taxonomically similar to the catch by local coastal fleets, and the remaining 70% was assumed to consist of migrant target species (WIOMSA 2011), as detailed in Table 2.

Updating to 2018 the 1950-2010 marine catch reconstructions of the Sea Around Us: Part I – Africa, Antarctica, Europe and the North Atlantic
51
Table 2. Taxonomic breakdown of reconstructed catch taken in Kenyan waters by migrant fishers from Tanzania. Adapted from WIOMSA (2011).
Common name Taxon Catch (%)
Carangids Carangidae 15 Groupers & seabasses Serranidae 15
Sharks, rays & skates Elasmobranchii 15 Snappers & jobfishes Lutjanidae 15 Octopuses Octopodidae 5
Tropical spiny lobsters Palinuridae 5 Coastal fleet composition Various1 30 1 Based on the taxonomic composition of the reported landings by small-scale coastal fleets, i.e., between 18 and 62 taxa.
Foreign tuna fleet catch There are foreign offshore fishing fleets targeting large pelagic species that operate in Kenyan EEZ waters between 2011 and 2017. This industrial fishery consists of distant water fleets (DWFs) which, despite having retreated during the peak of Somali piracy in the late 2000s, have begun to return to East African waters (POSEIDON et al. 2014). Licenses to access Kenya’s EEZ are provided by the Kenyan government to foreign fishing vessels that exploit the productive offshore fish stocks that have historically remained relatively untapped by domestic fishers. Although foreign fleets are required to report catches to both the IOTC and the national fisheries department, no definitive baseline of reported catches by foreign vessels taken within Kenya’s EEZ can be sourced from either institution. In order to estimate total annual catches by this fishery, a time-series of foreign fishing vessels was combined with gear-based catch estimates. Official records of the number of licensed foreign purse-seine and longline vessels were available for 2011 to 2014 (Government of Kenya 2017) and were used as anchor points for these years. The number of licensed foreign vessels in 2014 was carried forward to 2017 unchanged (Figure 2).
Figure 2. Time-series of the number of foreign-owned purse-seine, longline and total vessels licensed to fish in Kenya’s EEZ between 2011 and 2018. Crosses represent known values (used as anchor points).

2020 Fisheries Centre Research Reports 28(5)
52
The time-series of licensed vessels was multiplied by annual catch-per-vessel estimates of 6,011 t for purse-seine and 223 t for longline vessels (IOTC 2013). These annual catch estimates were adjusted to three-month estimates, based on reports that foreign fishing typically occurs in Kenya’s EEZ only from May to July (POSEIDON et al. 2014). The taxonomic breakdown applied to the resulting total catch estimates of foreign-owned pelagic fishing vessels while fishing in Kenyan waters was based on the taxonomic breakdown of industrial catch reported by the IOTC for spatial reporting cells overlapping Kenya’s EEZ (01- 04° S, 39-44° E), as detailed in Table 3.
Table 3. Taxonomic breakdown of catches by foreign industrial fishing fleets targeting large pelagic taxa in offshore waters. The taxonomic breakdown is based on catch reported by the IOTC for 1° x 1° spatial reporting blocks overlapping Kenya’s EEZ. Common name Taxon name Catch (%) Skipjack tuna Katsuwonus pelamis 49.184 Yellowfin tuna Thunnus albacares 44.338 Bigeye tuna Thunnus obesus 6.440 Albacore tuna Thunnus alalunga 0.036 Non-target species Unidentified pelagic fishes 0.001
Transition from 2017 to 2018 The catch reconstructed to 2017 was carried forward using the semi-automation method of Noël (2020), based on FAO landings to 2018. The catch data updated will be later replaced by a more detailed, research-intensive update. Assessing the uncertainty (data reliability) of the reconstruction The final step in any reconstruction is to derive and present estimates of the uncertainty associated with the reconstruction. Due to the nature of reconstructions, i.e., the reliance on highly variable and diverse secondary information and data sources, and on informed assumptions, traditional approaches to quantifying uncertainty around sampled data points are not applicable. Instead, a method first devised by Zeller et al. (2015) and standardized by Pauly and Zeller (2016) and Zeller et al. (2016, Supplementary Table S1) was used (Table 4), which adapts the scoring approach used by the Intergovernmental Panel on Climate Change to estimate uncertainty in their assessments (Mastrandrea et al. 2010). Note the deliberate absence of a ‘medium trust’ category, which would result in uninformative ‘cop-out’ options by assessors. This method derives the uncertainty of catch time series and associated anchor points, data sources or assumptions based on the confidence in their validity and reliability based on the quality, consistency and consensus of the evidence from which the final data were sourced (see also Derrick and Pauly 2020).
Table 4. Uncertainty scores used to evaluate the quality and reliability of reconstructed catch time series and attribute confidence intervals. IPCC criteria from Figure 1 in Mastrandrea et al. (2010) and adapted from Supplementary Table S1 in Zeller et al. (2016).
Score +/- (%) Corresponding IPCC criteria 4 Very high 10 High agreement & robust evidence 3 High 20 High agreement & medium evidence or medium agreement &
robust evidence 2 Low 30 High agreement & limited evidence or medium agreement &
medium evidence or low agreement & robust evidence 1 Very low 50 Low agreement & low evidence
The underlying data and information sources used as anchor points or to inform assumptions were evaluated, and an uncertainty score (based on Table 4) was attributed to each fishery in Kenya for the 2011-2017 time period (Table 5). Catch-weighted averages of upper and lower confidence limits were then calculated and

Updating to 2018 the 1950-2010 marine catch reconstructions of the Sea Around Us: Part I – Africa, Antarctica, Europe and the North Atlantic
53
applied to catch estimates of each sector. Uncertainty scores and associated confidence intervals for the 1950-2010 catch reconstruction time series based on Le Manach et al. (2015) were derived previously by the Sea Around Us based on Table 4.
Table 5. Uncertainty estimates for each major anchor point and assumption used to reconstruct domestic catches between 2011 and 2017 for the five domestic fisheries in Kenya. Uncertainty scores are allocated as per Table 4 above based on Zeller et al. (2016, Supplementary Table S1). Fishery Anchor
point/assumption Quality of evidence
Level of consensus
Score +/- %
Artisanal & subsistence
Coastal fleet 2017 catch Medium Low 2.0 30.0 2011-2016 catch Low Medium 2.0 30.0
Gleaners (shore-based) Fisher population time-series
High Medium 2.0 30.0
CPUE time-series Medium Low 1.0 50.0 Days fished per year Low Low 1.0 50.0
Sector average (catch weighted)
1.9 30.9
Industrial
Shrimp trawling Discard ratio High Medium 3.0 20.0 Longlining 2016 catch High High 4.0 10.0
2011-2012 & 2017 catches Low Medium 1.0 50.0 Sector average (catch weighted)
2.9 22.8
Recreational
Sport fishery Club catches Medium High 3.0 20.0 International arrivals High High 4.0 10.0
Sector average (catch weighted)
-- -- -- 3.5 15.0
Total average (catch weighted)
-- -- -- 2.0 30.7
Results and Discussion Figure 3 presents the domestic catch taken from the Kenyan EEZ from 1950 to 2018.
Figure 3. Reconstructed domestic catch within Kenya’s EEZ by fishing sector for 1950-2018, including estimated data uncertainty around the total catch time series. Despite employing a conservative approach in the present reconstruction, the nature of catch reconstructions and their reliance on secondary data and information sources and assumptions mean that the final reconstruction can often be associated with medium to high levels of uncertainty. The main driver of

2020 Fisheries Centre Research Reports 28(5)
54
uncertainty in the domestic reconstruction of Kenyan marine catches is the uncertainty associated with the recently implemented sample-based catch data collection system and its expansion methods as employed by the Kenyan authorities. Future investigations into and refinement of these methods may reduce the uncertainty surrounding coastal fleet catch estimates, and resolve whether or not the new data are indeed more accurate than the data derived from the method previously employed in Kenya. The second major driver of uncertainty in the domestic catch reconstruction was the limited information available on catch rates and fishing effort by the shore-based fishery. The lack of publicly available information regarding this marginalized sector (Pauly 2006) despite its high value (including export products) suggests that a bias toward boat-based fisheries exists in Kenya’s data sampling methods and may also extend to scientific research conducted on fisheries in Kenya. Sources of uncertainty in the reconstructed catch for Kenya serve to highlight the aspects of Kenya’s marine fisheries requiring greater investigation, research and refinement. The catch data presented by this reconstruction suggest that Kenya may be on track to improving the data quality of its inshore fisheries. Reference to Sea Around Us reconstructed catches is made within a recent report by KMFRI (2018b), and awareness and use of reconstructed data exists in local agencies (N. Wambiji, KMFRI, pers. comm.). Sample-based Catch Assessment Surveys have been implemented and have resulted in revision to current estimates of marine catches within Kenya’s EEZ (KMRFRI 2018b). While consistent collection of data is limited due to capacity, these surveys are essential to inform stock assessment of Kenyan fisheries (KMRFRI 2018b). However, improvements, method testing and validations are still needed in Kenya’s small-scale catch data sampling system to remove bias and ensure the capture of all fisheries in official statistics. Once such improvements and validations are in place, Kenya should undertake a retroactive correction of all catch data back to 1950 to avoid the ‘presentist bias’ (Zeller and Pauly 2018) in their official catch time series. This correction should be followed by a formal request by the Kenyan government for a retroactive replacement of the data currently presented by FAO on behalf of Kenya back to 1950. Such improvements will allow more accurate historical baselines of fishing impacts and benefits to be derived for Kenya’s marine fisheries. Finally, if Kenya manages to reduce and replace the extensive foreign offshore fishing with its own sustainable, domestic fishery for large pelagics, then marine fisheries have the potential to become a major contributor to both coastal and national food security and economic livelihood. Marine biodiversity protection Kenya has agreed to protect its biological diversity through the international Convention on Biological Diversity (Aichi), the United Nations Law of the Sea, the Ramsar Convention on Wetlands of International Importance and the World Heritage Convention and it is also part of the international network of UNESCO Man and the Biosphere (Marine Conservation Institute 2020). Kenya has 15 MPAs and 14 marine managed areas. The MPAs jointly cover 642 km2 (Marine Conservation Institute 2020), which represents less than 1% of its EEZ (162,794 km2; Le Manach et al. 2016). There is a management body in the country, the so-called Kenya Wildlife Service (KWS). “All MPAs have management plans produced by KWS in collaboration with key stakeholders, including government institutions, local communities, nongovernmental organizations (NGOs), the private sector, community-based organizations (CBOs), and interested individuals. [Moreover,] KWS has partnered with marine scientists in the region to monitor coral bleaching, mortality, and effects on the benthic structure. […] KWS and the Fisheries Department have established a national task force to advise on, among other issues, the development and

Updating to 2018 the 1950-2010 marine catch reconstructions of the Sea Around Us: Part I – Africa, Antarctica, Europe and the North Atlantic
55
implementation of a national conservation and management strategy for sea turtles. The main tools for implementing this strategy include advocacy, communication, education, public awareness, targeted research and monitoring, and threat mitigation. [And] KWS has encouraged the capacity-building of its MPA staff through various regional trainings” (Tuda and Omar 2012). The marine ecosystems and biodiversity in Kenyan waters are threatened by habitat degradation, overfishing, industrialization and pollution (Tuda and Omar 2012). Regarding pollution, in a study (Kaimba et al. 2019) carried out in marine managed areas and MPAs in Kenya with different levels of protection (e.g., Kuruwitu Conservancy with strict protection level and Malindi Reserve moderate level, the latter being the first MPA established in Kenya; Tuda and Omar 2012), showed that as protection increased from “least,” to “moderate” and “strictest,” E. coli concentrations decreased, but nitrate concentration did not show any trend. “These results suggest the potential of marine protection to mitigate coral reef pollution, especially from microbes. They also point to the possibility that multiple sources of pollution exist on which marine protection may have little or no effect” (Kaimba et al. 2019). Acknowledgements This study formed the basis of an MSc thesis by AK McAlpine in the School of Biological Sciences at the University of Western Australia, and was conducted without external funding support. The authors acknowledge the assistance of Gabriel Vianna, Rachel White and Lincoln Hood, who are supported by funding from the Minderoo Foundation. References Aloo, P.A., C.N. Munga, E.N. Kimani and S. Ndegwa. 2014. A review of the status and potential of the coastal
and marine fisheries resources in Kenya. International Journal of Marine Science, 4(24). Chan, K.-C. 2018. The ICJ's Judgement in Somalia v. Kenya and its implications for the Law of the Sea.
Utrecht Journal of International & European Law, 34: 195. Coulter, A., T. Cashion, A. Cisneros-Montemayor, S. Popov, G. Tsui, F. Le Manach, L. Schiller, M. Palomares,
D. Zeller and D. Pauly. 2020. Using harmonized historical catch data to infer the expansion of global tuna fisheries. Fisheries Research, 221:105379. doi.org/10.1016/j.fishres.2019.105379
Derrick, B. and D. Pauly. 2020. Updating to 2018 the 1950-2020 marine catch reconstructions of the Sea Around Us, p. 9-14. In: B. Derrick, M. Khalfallah, V. Relano, D. Zeller and D. Pauly (eds). Updating to 2018 the 1950-2010 Marine Catch Reconstructions of the Sea Around Us: Part I – Africa, Antarctica, Europe and the North Atlantic. Fisheries Centre Research Report. 28(5).
Dzoga, M., D. Simatele, C. Munga. 2018. Assessment of ecological vulnerability to climate variability on coastal fishing communities: A study of Ungwana Bay and Lower Tana Estuary, Kenya. Ocean & Coastal Management, 163: 437-444,
FAO. 2015. Fisheries and aquaculture software. FishStatJ-Software for Fishery Statistical Time Series. Fisheries and Aquaculture Department, Food and Agriculture Organization of the United Nations (FAO), Rome, Italy.
FAO. 2019. FAO Yearbook. Fishery and Aquaculture Statistics 2017. Food and Agriculture Organization of the United Nations (FAO), Rome, Italy. 108 p.
Fisheries Department. 2006. Marine Waters Frame Survey 2006 Report. Fisheries Department. Ministry of Livestock and Fisheries Development, Nairobi, Republic of Kenya. 48 p.
Fulanda, B., J. Ohtomi, E. Mueni, E. Kimani. 2011. Fishery trends, resource-use and management system in the Ungwana Bay fishery Kenya. Ocean & Coastal Management, 54: 401-414.
Garibaldi, L. 2012. The FAO global capture production database: A six-decade effort to catch the trend. Marine Policy, 36: 760-768.
Government of Kenya. 2010. Prawn Fishery Management Plan, 2010. Kenya Marine Fisheries Research Institute, Government of Kenya, Nairobi. 8 p.
Government of Kenya. 2017. State of the Coast Report II: Enhancing Integrated Management of Coastal and Marine Resources in Kenya. National Environment Management Authority (NEMA), Nairobi. 171 p.
IOTC. 2013. Estimation of fishing capacity by tuna fishing fleets in the Indian Ocean. Indian Ocean Tuna Commission, Victoria, Mahé, Seychelles. 77 p.

2020 Fisheries Centre Research Reports 28(5)
56
Kaimba, A., S. de Villiers and S. Wambua. 2019. Does Protection of Marine Areas Safeguard Coral Reefs From Human-Source Pollution? Frontiers in Environmental Science, 7:89. doi.org/10.3389/fenvs.2019.00089
Kimani, E.N. 1995. Coral reef resources of East Africa: Kenya, Tanzania and the Seychelles. Naga, the ICLARM Quarterly, 18(4): 4-7.
KMFRI. 2018a. The RV Mtafiti: Marine Research towards Food Security and Economic Development for Kenya. Kenya Marine Fisheries Research Institute, Mombasa, Kenya. 102 p.
KMFRI. 2018b. The Status of Kenya Fisheries: Towards sustainable exploitation of fisheries resources for food security and economic development. Kenya Marina and Fisheries Research Institute (KMFRI). Kenya Vision 2030. Mombasa, Kenya. 137 p.
KNBS. 2015. Economic Survey 2015. Kenya National Bureau of Statistics, Nairobi. 276 p. KNBS. 2019. Economic Survey 2019. Kenya National Bureau of Statistics, Nairobi. 355 p. Le Manach, F., C. Abunge, T.R. McClanahan and D. Pauly. 2015. Tentative reconstruction of Kenya's marine
fisheries catch 1950-2010, p. 37-51. In: F. Le Manach and D. Pauly (eds). Fisheries catch reconstructions in the Western Indian Ocean, 1950–2010. Fisheries Centre Research Reports 23(2).
Le Manach, F., C. A. Abunge, T. R. McClanahan, and D. Pauly. 2016. Kenya, p. 310. In: D. Pauly and D. Zeller (eds). Global Atlas of Marine Fisheries: A Critical Appraisal of Catches and Ecosystem Impacts. Island Press, Washington, DC.
Marine Conservation Institute. 2020. MPAtlas [Online]. Seattle, WA. Available at: www.mpatlas.org Mastrandrea, M.D., C.B. Field, T.F. Stocker, O. Edenhofer, K.L. Ebi, D.J. Frame, H. Held, E. Kriegler, K.J.
Mach, P.R. Matschoss, G.-K. Plattner, G.W. Yohe and F.W. Zwiers. 2010. Guidance Note for Lead Authors of the IPCC Fifth Assessment Report on Consistent Treatment of Uncertainties. Intergovernmental Panel on Climate Change (IPCC). Available at www.ipcc.ch/site/assets/uploads/2017/08/AR5_Uncertainty_Guidance_Note.pdf
McAlpine, A.K. 2019. Reconstructing domestic and foreign fishing catch in a tropical fishery: the case of Kenya (2011-2017). MSc thesis, University of Western Australia, Perth, 45 p.
McClanahan, T.R. 2018. Multicriteria estimate of coral reef fishery sustainability. Fish and Fisheries, 19: 807-820.
McClanahan, T.R. and C.A. Abunge. 2014. Catch rates and income are associated with fisheries management restrictions and not an environmental disturbance, in a heavily exploited tropical fishery. Marine Ecology Progress Series, 513: 201-210.
McClanahan, T.R., B. Kaunda-Arara and J.O. Omukoto. 2010. Composition and diversity of fish and fish catches in closures and open-access fisheries of Kenya. Fisheries Management and Ecology, 17: 63-76.
McClanahan, T.R. and J.K. Kosgei. 2019. Outcomes of gear and closure subsidies in artisanal coral reef fisheries. Conservation Science and Practice, 1: e114.
McClanahan, T.R. and A. Mangi. 2001. The effect of a closed area and beach seine exclusion on coral reef fish catches. Fisheries Management and Ecology, 8: 107-121.
Mirera, D.O. 2017. Status of the mud crab fishery in Kenya: A review. Western Indian Ocean Journal of Marine Science, 16(1): 35-45.
Musembi, P., B. Fulanda, J. Kairo and M. Githaiga. 2019. Species composition, abundance and fishing methods of small-scale fisheries in the seagrass meadows of Gazi Bay, Kenya. Journal of the Indian Ocean Region, 15(2): 139-156.
Ndegwa, S., K. Benedict and C. Ndoro. 2018. Assessment of the tuna catch composition of a longline vessel in the Kenyan EEZ and the high seas. Indian Ocean Tuna Commission, Victoria, Mahé, Seychelles. 8 p.
Ndoro, C. and S. Ndegwa. 2018. High Seas Billfish Catches by Kenyan Longliner. Indian Ocean Tuna Commission, Victoria, Mahé, Seychelles. 10 p.
Noël, S.-L. 2020. Semi-automation procedure for catch reconstruction forward carry, p. 15-20. In: B. Derrick, M. Khalfallah, V. Relano, D. Zeller and D. Pauly (eds). Updating to 2018 the 1950-2010 Marine Catch Reconstructions of the Sea Around Us: Part I – Africa, Antarctica, Europe and the North Atlantic. Fisheries Centre Research Report 28(5).
Okusa, K., M.A. Samoilys, J. Mbugua, J. de Leeuq and D.O. Obura. 2016. Marine habitats of the Lamu-Kiunga coast: an assessment of biodiversity value, threats and opportunities. ICRAF Working Paper No. 248, World Agroforestry Centre, Nairobi, Kenya. 71 p.
Pauly, D. 2006. Major trends in small-scale marine fisheries, with emphasis on developing countries, and some implications for the social sciences. Maritime Studies (MAST) 4: 7-22.
Pauly, D. and D. Zeller. 2016. Catch reconstructions reveal that global marine fisheries catches are higher than reported and declining. Nature Communications 7: 9.

Updating to 2018 the 1950-2010 marine catch reconstructions of the Sea Around Us: Part I – Africa, Antarctica, Europe and the North Atlantic
57
Pepperell, J., S. Griffiths and N. Kadagi. 2017. Acquisition of catch-and-effort and size data from sport fisheries in the Western Indian Ocean. Indian Ocean Tuna Commission, Victoria, Mahé, Seychelles. 100 p.
POSEIDON, MRAG, COFREPECHE and NFDS. 2014. Ex-ante evaluation of a possible future fisheries partnership agreement and protocol between the European Union and Kenya (Framework contract MARE/2011/01 - Lot 3, specific contract 7). European Union, Brussels. 91 p.
SDF. 2012. Marine Waters Fisheries Frame Survey 2012 Report. State Department of Fisheries. Ministry of Fisheries Development. Nairobi, Kenya. 85 p.
SDF. 2014a. Fisheries Annual Statistical Bulletin 2013. State Department of Fisheries. Nairobi, Kenya. 56 p. SDF. 2014b. Marine Artisanal Fisheries Frame Survey 2014 Report. State Department of Fisheries. Nairobi,
Kenya. 88 p. SDF. 2016. Marine Artisanal Fisheries Frame Survey 2016 Report. State Department of Fisheries. Nairobi,
Kenya. 104 p. SDF&BE. 2016. Fisheries Annual Statistical Bulletin 2016. State Department of Fisheries and the Blue
Economy. Nairobi, Kenya. 65 p. Tuda, A., and M. Omar. 2012. Protection of marine areas in Kenya. The George Wright Forum, 29(1): 43-50.
Available at: www.georgewright.org/291tuda.pdf UN. 1982. Part V: Exclusive Economic Zone, p. 40-49. In: Convention on the Law of the Sea. United Nations
Document, A/Conf. 61/122, New York. Wanyonyi, I.N., A. Wamukota, S. Mesaki, A.T. Guissamulo and J. Ochiewo. 2016. Artisanal fisher migration
patterns in coastal East Africa. Ocean & Coastal Management, 119: 93-108. WIOMSA. 2011. Migrant fishers and fishing in the Western Indian Ocean: Socio-economic dynamics and
implications for management. Final Report of Commissioned Research Project MASMA/CR/2008/02. Western Indian Ocean Marine Science Association (WIOMSA), Zanzibar, Tanzania. 158 p.
Zeller, D., T. Cashion, M.L.D. Palomares and D. Pauly. 2018. Global marine fisheries discards: A synthesis of reconstructed data. Fish and Fisheries, 19(1): 30-39.
Zeller, D., S. Harper, K. Zylich and D. Pauly. 2015. Synthesis of underreported small-scale fisheries catch in Pacific island waters. Coral Reefs, 34(1): 25-39.
Zeller, D., M.L.D. Palomares, A. Tavakolie, M. Ang, D. Belhabib, W.W.L. Cheung, V.W.Y. Lam, E. Sy, G. Tsui and K. Zylich. 2016. Still catching attention: Sea Around Us reconstructed global catch data, their spatial expression and public accessibility. Marine Policy, 70: 145-152.
Zeller, D. and D. Pauly. 2018. The ’presentist bias’ in time-series data: implications for fisheries science and policy. Marine Policy, 90: 14-19.

2020 Fisheries Centre Research Reports 28(5)
58
Appendix A: Estimation of small-scale coastal fleet catch using a parameter-based approach (2011-2017) Following the approach of Le Manach et al. (2015), parameter-based estimates of small-scale coastal fleet catches between 2011 and 2017 were obtained using time-series of the number of fishers, catch-per-unit-effort (CPUE) and annual effort (days fished per year). The number of fishers involved in the coastal fleet fishery from 2011-2017 was sourced from the biennial government frame surveys. Although the number of boat-based fishers was not explicitly provided, it was calculated by removing the number of “foot fishers” from total fishers in each county. The boat-fisher population was then interpolated between survey years (Figure A1). No frame survey was conducted in 2017 (G. Maina, The Nature Conservancy, Kenya, pers. comm.); therefore, the 2016 fisher counts were multiplied by the average annual growth rate (the first survey in 2004) and the last survey in 2016 to derive the 2017 fisher counts.
Figure A1. Number of coastal fleet fishers in each of the five coastal counties in Kenya between 2008 and 2017. Anchor point years, i.e., years where frame surveys were conducted, are represented with an ‘X’. A CPUE (kg/fisher/day) time-series for each county was derived (Table A1) using anchor points which were found in the government reports and scientific literature (Fulanda et al. 2011; McClanahan and Abunge 2014; Okusa et al. 2016; Dzoga et al. 2018; McClanahan and Kosgei 2019). Limited information was available on the catch rates in Lamu and Tana Delta; therefore, anchor points for years prior to 2011 were used to facilitate the estimation of 2011 to 2017 CPUEs. The number of days that fishers were assumed to be active per year was maintained from the previous reconstruction at 220 days (McClanahan and Mangi 2001; McClanahan 2018), as no new or updated information was available. Given that there were indications that fishers on the south coast are active closer to 300 days per year (McClanahan et al. 2010), this estimate may be conservative.

Updating to 2018 the 1950-2010 marine catch reconstructions of the Sea Around Us: Part I – Africa, Antarctica, Europe and the North Atlantic
59
Table A1. Catch-per-unit-effort (CPUE) for each of the five coastal counties in Kenya between 2011 and 2017. County Period CPUE Note References Kilifi 2011-13 3.0 Anchor point; average of 2011-13a McClanahan and Kosgei (2019) 2014-17 3.4 Anchor point; average of 2014-17a McClanahan and Kosgei (2019) Kwale 2011-13 3.9 Anchor point; average of 2011-13a McClanahan and Kosgei (2019) 2014-17 3.6 Anchor point; average of 2014-17a McClanahan and Kosgei (2019) Lamu 2007 10.2 Anchor point; average of 2001-07 Okusa et al. (2016) 2008-17 10.3 -> 11.5 Increase of 1.2% per yearb - Mombasa 2011-13 3.9 Anchor point; average of 2011-13a McClanahan and Kosgei (2019) 2014-17 4.8 Anchor point; average of 2014-17a McClanahan and Kosgei (2019) Tana Delta
2005 5.0 Anchor point Fulanda et al. (2011) 2006-16 5.0 -> 4.4 Linear interpolation -
2017 4.4 Anchor point Dzoga et al. (2018) a This study provided averages only for the two time periods 2011-2013 and 2014-2017 for sites in Kilifi, Kwale and Mombasa. b The trend in CPUE was considered to be increasing in Lamu, as it does in Kilifi, its neighbouring county. However, the rate of recovery was considered to be half that of Kilifi’s, due to lower management enforcement in the region.
A regional small-scale coastal fleet catch time-series for each county was obtained by multiplying the CPUE time-series of each county by the number of boat fishers in each year followed by the number of fishing days per year. These were combined into a national total catch time-series for this fishery. Reconstructed total catch for 2011-2017 was combined with catch reconstructed by Le Manach et al. (2015) for 1950 to 2010 and compared to the officially reported catch baseline (Figure A2).
Figure A2. Total reported and parameter-based reconstructed catch based on the method in Le Manach et al. (2015) by the small-scale coastal fleet from 1950 to 2018, illustrating the potential shortcoming of the parameter-based approach for the most recent years. Reconstructed catch for 1950 to 2010 was sourced from Le Manach et al. (2015). The eported catch is represented by an overlaid dashed line.

2020 Fisheries Centre Research Reports 28(5)
60
MAURITANIA: UPDATED CATCH RECONSTRUCTION FOR 2011-2018*
Elimane Abou Kanea, Ely Beiboua, Mamadou Diaa, Dyhia Belhabibb,c, Brittany Derrickb and Emmalai Pageb a) Institut Mauritanien de Recherches Océanographiques et des Pêches,
Nouadhibou, Mauritania b) Sea Around Us, Institute for the Oceans and Fisheries, University of British Columbia, 2202 Main
Mall, Vancouver, BC, V6T 1Z4, Canada c) Present address: Ecotrust, Vancouver, Canada
Abstract An update to the reconstruction of the fisheries catches of Mauritania, which initially covered 1950 to 2010, was undertaken to the year 2016, and subsequently carried forward to 2018 using a semi-automatic routine. Detailed descriptions of the methods used to reconstruct each sector are presented, with some emphasis on the estimation of discards from industrial fisheries in Mauritania, which is complicated due to the lack of data based on at-sea observations. Introduction Mauritania’s marine fisheries catches were reconstructed for 1950-2005 by Gascuel et al. (2007) and updated for 1950-2010 by Belhabib et al. (2012, 2016). Here, the catches are updated first to 2015, then carried forward to 2018. The reconstruction by Belhabib et al. (2012) documented that catches from Mauritanian waters had doubled between 1950 and 2010, which was a major deviation from the previous reconstruction by Gascuel et al. (2007). This later reconstruction has been updated for the 2011-2015 period, using the comprehensive database of the Institut Mauritanien de Recherches Océanographiques et des Pêches (IMROP), which covers the period from 2011 to 2015 (IMROP 2016; Khallahi 2020). The catches were then carried forward to 2018 using the method in Noël (2020). Within the IMROP database, species or higher taxonomic groups are distinguished between the monitoring systems and logbooks of the artisanal and industrial fisheries (IMROP 2019). We used commercial fisheries information to infer subsistence fishing for the period 2011-2015. In contrast to the period 1950-2010, we no longer consider fishing by the Imraguen as a purely subsistence fishery because Imraguen fishers now export almost all their catches to Nouakchott and Nouadhibou (i.e., artisanal catches) and keep only a very small amount for subsistence (Boncoeur et al. 2011). Artisanal catches To identify the artisanal catch, we first deducted the ‘dawtal’, i.e., the fraction of the catch given to charities which we have assigned as subsistence catch. We estimated the dawtal at 2% of the landing (excluding valuable taxa such as cephalopods, crustaceans, rays, and sharks) for the years 2011-2015 (Chaboud and Ferraris 1995), and then deducted these from the artisanal catch data reported by IMROP. The difference constitutes the artisanal catch. Illegal landings by artisanal pirogues were carried forward for 2011-2015 by using the 2010 ratio between total artisanal landings and illegal Senegalese catch. The 2010 taxonomic breakdown was used to disaggregate catch.
* Cite as: Kane, E.A., E. Beibou, M. Dia, D. Belhabib and E. Page. 2020. Mauritania: Updated catch reconstruction for 2011 – 2018, p. 60-64. In: B. Derrick, M. Khalfallah, V. Relano, D. Zeller and D. Pauly (eds). Updating to 2018 the 1950-2010 Marine Catch Reconstructions of the Sea Around Us: Part I – Africa, Antarctica, Europe and the North Atlantic. Fisheries Centre Research Report 28(5).

Updating to 2018 the 1950-2010 marine catch reconstructions of the Sea Around Us: Part I – Africa, Antarctica, Europe and the North Atlantic
61
Based on direct observations of Ly and Zein (2009), we assumed the discard rate to be 5% of the artisanal catch. This rate was held constant and applied to the reconstructed artisanal catch from 2011 to 2015. Industrial catches We estimated industrial catches based on a reported baseline provided by IMROP, to which 30% of under-reporting (Gascuel et al. 2007) was added for the domestic industrial sector following the original methods by Belhabib et al. (2012). Estimating discards from the industrial fishing sector in Mauritania was quite complex. Because the data from the at-sea observers were not available to us, we used the observed estimates from ter Hofstede and Dickey-Collas (2006) of small pelagic fisheries operated by pelagic trawlers, which is the main small-pelagic gear type in Mauritania. According to these observations, the average fisheries discards was very low for Sardinella aurita (2.9 ± 0.2%, which corresponds to 3,200 ± 300 tonnes) and S. maderensis (5.1 ± 0.4%, which corresponds 400 ± 50 tonnes) (ter Hofstede and Dickey-Collas 2006). Given these averages, we assumed a constant discard rate of 3%, and applied it to the reconstructed industrial catch of small pelagic taxa for the 2011 to 2015 period. For demersal fisheries, we used discard estimates from the Moroccan fisheries (Kelleher 2005). Kelleher (2005) reported an average of 30% of discards of demersal trawl fisheries for cephalopods, sea bream (Dentex canariensis) and hake (Merluccius merluccius). We applied this rate to the reconstructed catch of the cephalopod industrial fishery along with the hake fisheries between 2011 and 2015. For the shrimp fishery, we applied a discard rate of 85% of catches (Kelleher 2005). Recreational catches We reconstructed recreational catches by anglers for 2011-2012 following the methods of Belhabib et al. (2012). To provide a conservative estimate of recreational fisheries catches, we first assembled anchor points for the number of tourists in the Baie de l’étoile fishing center, which hosts European tourists engaged in sport fishing every year. We reconstructed the total number of tourists who visited Mauritania to fish and multiplied it by the average catch per unit effort observed for the years 2011-2014. In 2015, we used the median of the first three years (2011-2014) to estimate recreational catches. Correction to select taxa False scad (Caranx rhonchus) Comparison of reconstructed catches of False scad (Caranx rhonchus) with catches presented by expert working group in FAO (2020) highlighted that foreign catches of this species were not included in the reconstruction at species-level. In order to include these species level catches, foreign catches of False scad within Mauritania were disaggregated from foreign catches of ‘Marine pelagic fishes not identified’ for 1992-2010 for each fishing entity. European anchovy (Engraulis encrasicolus) Working group (FAO 2020) catches of European anchovy (Engraulis encrasicolus) were higher than catches of this species as originally reconstructed by Belhabib et al. (2012) for 1992-2010. In order to include European anchovy catches at the species level, catches of European anchovy were disaggregated from catches of ‘Marine pelagic fishes not identified’ by Russia, Latvia, Lithuania, Ukraine and Fishing Country Unknown fishing within Mauritania’s EEZ for 1992-2010. Round sardinella (Sardinella aurita) and Madeiran sardinella (Sardinella maderensis) Catches of Round sardinella (Sardinella aurita) and Madeiran sardinella (Sardinella maderensis) were disaggregated from catches of Sardinella for 1990-2017 to reflect the species level catches reported by FAO

2020 Fisheries Centre Research Reports 28(5)
62
(2020) for domestic and foreign catches within Mauritania’s EEZ. The five-year average proportion of catch between the two sardinella species from 1990-1995 was applied to split catches of Sardinella for 1950-1989. Atlantic horse mackerel (Trachurus trachurus) and Cunene horse mackerel (Trachurus trecae) Working group (FAO 2020) catches of Atlantic horse mackerel (Trachurus trachurus) and Cunene horse mackerel (Trachurus trecae) were compared to reconstructed catches of these species within the original reconstruction. Foreign catches of ‘Marine pelagic marine fishes not identified’ were used to disaggregate foreign catches of these two species for 1990-2017. Foreign catches of Trachurus trecae outweighed catches of ‘Marine pelagic marine fishes not identified’ for 2015-2017 and so the excess foreign catch of this species was added to the database under Fishing Country Unknown for 2015-2017 unreported landings. This will be reviewed in future as more information becomes available. Transition from 2015 to 2018 The catch reconstructed to 2015 was forward carried to 2018 using the semi-automatic procedures outlined in Noël (2020), based on reported FAO landings data available to 2018. Due to the rapid increase in domestic reported catch and to avoid unrealistically magnifying this increase, unreported commercial landings were assumed to be zero in 2017 and were interpolated in 2016. The semi-automated catch time series will later be replaced by a more detailed, research-intensive update. Also note that prior to the semi-automation process, retroactive changes were made to update the reported data to match the latest version of FAO data. Results and Discussion Figure 1 shows reconstructed domestic catches taken from the Exclusive Economic Zone of Mauritania. Reconstructed catches are intended to provide an alternative to official data on landings reported to the Mauritanian coast guard and IMROP. Official data usually relate to reported landings captured by licensed industrial trawlers.
Figure 1. Reconstructed domestic catches from Mauritania’s EEZ per sector for 1950-2018. Recreational and subsistence catches are included, but are too small to be visible separately. There are a number of commercially valuable species in Mauritania’s EEZ which prompt interest from many foreign fishing entities (Petrossian 2018), e.g., bogue (Boops boops), bigeye grunt (Brachydeuterus auritus); bullet and frigate tuna (Auxis rochei and A. thazard), as well as its most valuable species, Octopus vulgaris

Updating to 2018 the 1950-2010 marine catch reconstructions of the Sea Around Us: Part I – Africa, Antarctica, Europe and the North Atlantic
63
(Miller 2007). The status of several pelagic stocks in N.W. Africa, including from Mauritania was assessed in Palomares et al. (2020). Marine biodiversity protection Mauritania has agreed to protect biological diversity through the international Convention on Biological Diversity (Aichi) and the Ramsar Convention on Wetlands of International Importance and the World Heritage Convention (Marine Conservation Institute 2020). Mauritania has two MPAs and four marine managed areas. The MPAs cover 6,386 km2 (UNEP-WCMC and IUCN, 2020), which occupies 3% of the entire EEZ (204,596 km2; Belhabib et al. 2016). The four marine managed areas are Banc d’Arguin (a Ramsar Site designated in 1982 with a reported marine area of 6,000 km2), Banc d'Arguin National Park (World Heritage Site natural or mixed designated in 1989 with a total area of 12,000 km2), Chat Tboul d’Arguin (a Ramsar Site designated in 2000 with a total area of 155 km2), and Parc National du Diawling d’Arguin (a Ramsar Site designated in 1994 with a total area of 156 km2). The second largest Ramsar site in Mauritania is Diawling National Park, which includes three coastal lagoons and an estuarine zone of mangroves providing feeding grounds for fish, shrimp, and prawns. In 2002 this site was included in the Montreux Record because of infestations of an aquatic fern, Salvinia molesta, and a semi-aquatic wetland plant, Typha australis (Ramsar sites information service 2020). “The Montreux Record is a register of wetland sites on the List of Wetlands of International Importance where changes in ecological character have occurred, are occurring, or are likely to occur as a result of technological developments, pollution or other human interference” (Ramsar 2007). The two MPAs are Banc d'Arguin National Park and Cap Blanc Satellite Reserve. The National Park of Banc d'Arguin (PNBA), designated in 1978, has 6245 km2 (98% of the total extent of MPAs). “In recent years, the administration of the PNBA has greatly strengthened with the implementation of its modernization plans (improvement of personnel and efficiency), planning and management (increase in efficiency interventions in terms of monitoring, research and local development), and business (budgetary consolidation, ability to mobilize financial resources, to manage investments made in the Park on a sustainable basis and to ensure recurrent costs, etc.). The budgetary situation and the management of the PNBA have fundamentally changed with the significant increase in the contribution from the national budget, which now covers more than half of the total budget of the PNBA. Thanks to the Fisheries Agreements signed in 2006 with the European Union, the Mauritanian State has become the main "lessor" of the Park. Significant investments have been made with the State subsidy both in terms of personnel costs and the improvement of field infrastructure” (from French; PNBA 2020). Acknowledgements Funding for the work presented here was provided by the Minderoo Foundation, by the Marisla, Oak, and David and Lucille Packard Foundations, and by the Bloomberg Philanthropies through Rare. References Belhabib, D., D. Gascuel, E. Abou Kane, S. Harper, D. Zeller and D. Pauly. 2012. Preliminary estimation of
realistic fisheries removals from Mauritania: 1950-2010, p. 61-78. In: D. Belhabib, D. Zeller, S. Harper and D. Pauly (eds). Marine fisheries catches in West Africa, Part 1. Fisheries Centre Research Reports 20(3).

2020 Fisheries Centre Research Reports 28(5)
64
Belhabib, D., D. Gascuel, E. Abou Kane, S. Harper, D. Zeller, and D. Pauly. 2016. Mauritania, p. 329. In: D. Pauly and D. Zeller (eds). Global Atlas of Marine Fisheries: A Critical Appraisal of Catches and Ecosystem Impacts. Island Press, Washington, DC.
Boncoeur, J., F. Alban, and O. Thébaud. 2011. Bioeconomy – Bioeconomic analysis of marine protected are fisheries effects, p.190-225. In: J. Claudet (ed). Marine Protected Areas: A Multidisciplinary Approach. Cambridge University Press. Cambridge.
Chaboud, C. and J. Ferraris. 1995. Rapport d’évaluation des systèmes d’échantillonnage de la pêche artisanale mauritanienne au CNROP. ORSTOM, Montpellier. 70 p.
FAO. 2020. Report of the Working Group on the Assessment of Small Pelagic Fish of Northwest Africa. Casablanca, Morocco, 8–13 July 2019. Rapport de groupe de travail sur l’évaluation des petits pélagiques au large de l’Afrique Nord-Occidentale. Casablanca, Maroc, 8-13 juillet 2019. FAO Fisheries and Aquaculture Report No. 1309/FAO, Rapport sur les pêches et l’aquaculture no 1309. Fishery Committee for the Eastern Central Atlantic (CECAF)/Comité des pêches pour l'Atlantique Centre-Est (COPACE). Rome. doi.org/10.4060/ca9562b
Gascuel, D., D. Zeller, M.O. Taleb Sidi and D. Pauly. 2007. Reconstructed catches in the Mauritanian EEZ, p. 105-119. In: D. Zeller and D. Pauly (eds). Reconstruction of Marine Fisheries Catches for Key Countries and Regions (1950-2005). Fisheries Centre Research Reports 15(2).
IMROP. 2016. Capture et effort de la pêche artisanale et côtière en Mauritanie. Institut mauritanien de recherches océanographiques et des pêches (IMORP), Mauritania.
IMROP. 2019. Bulletin statistique des pêches maritimes, 2006-2018, Institut mauritanien de recherches océanographiques et des pêches (IMORP), Mauritania, 79 p.
Khallahi, B., H. Taleb, C. B. Barham, B. M. Habibe, E. A. Kane and M. E. Bouzouma (eds). 2020. Aménagement des ressources halieutiques et gestion de la biodiversité au service du développement durable. Rapport du Neuvième Groupe de Travail de l’IMROP, Nouadhibou, Mauritanie, 11-14 février 2019. 246 p.
Kelleher, K. 2005. Discards in the world's marine fisheries. An update. FAO Fisheries Technical Paper. No. 470. Food and Agriculture Organization of the United Nations (FAO), Rome, Italy. 131p.
Ly, O.K. and S.A.O.M. Zein. 2009. Évaluation économique d’une zone humide: le cas du Diawling, Mauritanie. UICN, Gland, Suisse. Xii + 70 p.
Marine Conservation Institute. 2020. MPAtlas [Online]. Seattle, WA. Available at: www.mpatlas.org Miller, J.W. 2007. Poor nations get cash, the rich send their trawlers – a dearth of octopus. The Wall Street
Journal, 18 July, 2007. Noël, S.-L. 2020. Semi-automation procedure for catch reconstruction forward carry, p. 15-20. In: B. Derrick,
M. Khalfallah, V. Relano, D. Zeller and D. Pauly (eds). Updating to 2018 the 1950-2010 Marine Catch Reconstructions of the Sea Around Us: Part I – Africa, Antarctica, Europe and the North Atlantic. Fisheries Centre Research Report 28(5).
Palomares, M.L.D., M. Khalfallah, J. Woroniak and D. Pauly. 2020. Assessment of 14 species of small pelagic fish caught along the coast of Northwest African countries. p. 77-108 In: M.L.D. Palomares, M. Khalfallah, J. Woroniak and D. Pauly D (eds.). Assessments of marine fisheries resources in West Africa with emphasis on small pelagics, Fisheries Centre Research Report 28(4). Petrossian, G.A. 2018. A micro-spatial analysis of opportunities for IUU fishing in 23 Western African countries. Biological Conservation, 225: 31-41.
PNBA. 2020. Banc d'Arguin Le Parc National, Mauritanie - Governance. Available at: www.pnba.mr/pnba/index.php?option=com_flexicontent&view=items&cid=86&id=221&Itemid=87
Ramsar sites information service. 2020. Parc National du Diawling. Available at: rsis.ramsar.org/ris/666?language=en
Ramsar. 2007. Information Paper number 6. The Montreux Record and the Ramsar Advisory Missions. Available at: www.ramsar.org/sites/default/files/documents/library/info2007-06-e.pdf
ter Hofstede, R. and M. Dickey-Collas. 2006. An investigation of seasonal and annual catches and discards of the Dutch pelagic freezer-trawlers in Mauritania, Northwest Africa. Fisheries Research, 77(2): 184-191.

Updating to 2018 the 1950-2010 marine catch reconstructions of the Sea Around Us: Part I – Africa, Antarctica, Europe and the North Atlantic
65
MOZAMBIQUE: UPDATED CATCH RECONSTRUCTION FOR 2011-2018*
Gabriel M. S. Vianna Sea Around Us - Indian Ocean, School of Biological Sciences, University of Western Australia, 35 Stirling
Hwy, Crawley 6009, WA, Australia Abstract An update to Mozambique’s marine fisheries catch data was completed for 2011-2017; these data were then carried forward to 2018. Data available from the national Fisheries Research Institute (Instituto de Investigacao Pesqueira – IIP) were used to evaluate catch by fishing sector to investigate the continuous and rapid increase in reported small-scale catches across the time series. This information was used to improve the assignment between subsistence and artisanal sectors from 1950 to 2008 based on the updated ratios. Detailed descriptions of the methods used to reconstruct each sector are presented below. Introduction Mozambique’s marine fisheries catch data were reconstructed for 1950-2004 by Jacquet et al. (2007, 2010, 2016), and updated to 2010 by Doherty et al. (2015), with a further update to 2015 by the Sea Around Us. The current update reconstructs Mozambique’s national catches from 2010 to 2017 accounting for updated data presented in the national fisheries’ annual reports issued by the national Fisheries Research Institute (Instituto de Investigação Pesqueira – IIP). Finally, catch data were forward carried to 2018 using the semi-automated routine of Noël (2020). The report classified data as industrial, semi-industrial and artisanal landings. For the purpose of the reconstruction, semi-industrial landings were classified as industrial, and artisanal catches were considered to report the small-scale (i.e., artisanal and subsistence) component of the national fisheries. Since 2009, catches of both small and large-scale (i.e., industrial) fisheries are considered to be fully reported in Mozambique (Chaúca et al. 2013). During the reconstruction, an extensive search (in Portuguese and English) was conducted for literature that could provide information to support the continuous and strong increase in reported catches for the small-scale sector, despite reports of overfishing trends in previous decades (Chaúca et al. 2013; Sousa et al. 2016). Materials and Methods FAO 2015-2017 data comparison Retroactive changes in catch amounts were detected between the FAO 2015 and 2017 data versions. Such changes are not uncommon, and reflect official data correction efforts by countries (Garibaldi 2012). Most noticeable, from 2008 onwards, the original category “Tuna-like fish nei” and a fraction of “Marine fishes nei” were re-allocated to the following categories: “Narrow-barred Spanish mackerel”, “Marlins, sailfishes, etc.”, “Yellowfin tuna”, “Skipjack tuna”, “Albacore”, “Frigate and bullet-tuna”, and “Kawakawa”. Retroactive adjustments in the taxonomic breakdown of “Marine fishes nei” were made to account for these changes. Domestic industrial catches The IIP country report (Anon. 2019b) compiles landing data from 2006 to 2017 and matches the data reported by the FAO on behalf of Mozambique. In 2017, the data reported by the FAO were 4480 t smaller than the national report. For this reconstruction, the FAO data were used as the reported catch baseline, and the
* Cite as: Vianna, G.M.S. 2020. Mozambique: Updated catch reconstruction for 2011 – 2018, p. 65-68. In: B. Derrick, M. Khalfallah, V. Relano, D. Zeller and D. Pauly (eds). Updating to 2018 the 1950-2010 Marine Catch Reconstructions of the Sea Around Us: Part I – Africa, Antarctica, Europe and the North Atlantic. Fisheries Centre Research Report 28(5).

2020 Fisheries Centre Research Reports 28(5)
66
country report information was used to provide the ratio of the total national catch allocated to the industrial and small-scale sectors. Artisanal and subsistence catches Mozambique’s Fisheries Master Plan for 2010-2019 (Anon. 2019c) provides a breakdown of total catches of the small-scale sector into artisanal and subsistence for 2009. This breakdown was used to calculate the proportion of artisanal and subsistence catches within the small-scale catch in 2009. Based on this anchor point, new proportions of artisanal and subsistence catches were estimated for 1950-2008 by holding the original (Jacquet et al. 2010; Doherty et al. 2015) 1950 proportion constant and interpolating the proportions between 1950 and 2009 (Figure 1). Anon. (2019c) also specifies expected values of catch for each sector for 2014 and 2019 following the implementation of the national policy to increase participation of artisanal fisheries in the national economy and thus reducing the proportion of subsistence catches in the total catch. The expected values were used to calculate the proportion of artisanal and subsistence catches within the small-scale catches for these years. Using these values as anchor points, the proportions of artisanal and subsistence catches between 2009 and 2014 and 2015-2017 were interpolated accordingly. Annual catches by each sector where then calculated for the entire time series by multiplying the total small-scale catch by the respective proportions for each sector. The proportions of reported to unreported catches within each sector were adjusted accordingly. Trends in small-scale catches Since the late 2000s, Mozambique’s reported marine catches have displayed a steep increasing trend, mainly due to rapidly growing artisanal catches of taxonomically unidentified marine fish. These increasing reported catches contrast with reports of overfishing and decrease of catch per unit effort (CPUE) by the small-scale sector in the country (Chaúca et al. 2013). While the national fishing monitoring system is considered to have had full reporting coverage of the artisanal catches (i.e., small-scale) since 2009, the patterns observed in the reported data resembles the reporting of aspirational catches instead of actual catches described by FAO (2014). As mentioned in SOFIA (FAO 2014) and discussed in Pauly and Zeller (2017), the FAO has previously expressed concern about official catch statistics being based on target levels rather than actual data collection, e.g., for Myanmar and Vietnam. Strategic documents and reports about the Mozambique fisheries mention annual aspirational targets of 180,000-300,000 t for small-scale fisheries to be reached by 2020 (Scanteam 2016; Anon. 2019a). Reporting aspirational catches associated with these targets could partially explain the disproportionally increasing catches observed in FAO data reported on behalf of the country. Discards Discards were updated following the methods described in Doherty et al. (2015). The estimates of industrial discards were updated based on the percentage of by-catch and discards for the shallow and deep-water bottom trawl fisheries (Anon. 2013, 2014). Transition from 2017 to 2018 The catch reconstructed here to 2017 was forward carried to 2018 using the semi-automatic procedures outlined in Noël (2020), based on reported FAO landings data available to 2018. The semi-automated catch time series will need to be replaced by a more detailed, research-intensive update. Results and Discussion Figure 1 presents reconstructed catches taken from the exclusive economic zone of Mozambique.
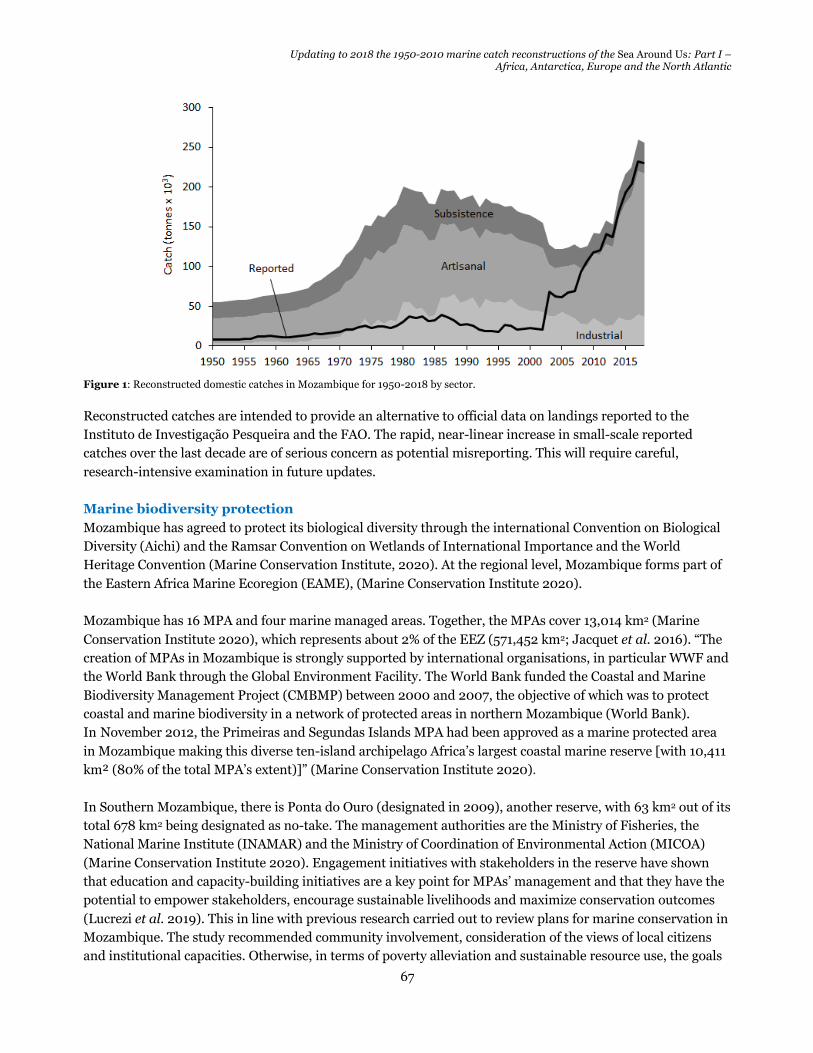
Updating to 2018 the 1950-2010 marine catch reconstructions of the Sea Around Us: Part I – Africa, Antarctica, Europe and the North Atlantic
67
Figure 1: Reconstructed domestic catches in Mozambique for 1950-2018 by sector. Reconstructed catches are intended to provide an alternative to official data on landings reported to the Instituto de Investigação Pesqueira and the FAO. The rapid, near-linear increase in small-scale reported catches over the last decade are of serious concern as potential misreporting. This will require careful, research-intensive examination in future updates. Marine biodiversity protection Mozambique has agreed to protect its biological diversity through the international Convention on Biological Diversity (Aichi) and the Ramsar Convention on Wetlands of International Importance and the World Heritage Convention (Marine Conservation Institute, 2020). At the regional level, Mozambique forms part of the Eastern Africa Marine Ecoregion (EAME), (Marine Conservation Institute 2020). Mozambique has 16 MPA and four marine managed areas. Together, the MPAs cover 13,014 km2 (Marine Conservation Institute 2020), which represents about 2% of the EEZ (571,452 km2; Jacquet et al. 2016). “The creation of MPAs in Mozambique is strongly supported by international organisations, in particular WWF and the World Bank through the Global Environment Facility. The World Bank funded the Coastal and Marine Biodiversity Management Project (CMBMP) between 2000 and 2007, the objective of which was to protect coastal and marine biodiversity in a network of protected areas in northern Mozambique (World Bank). In November 2012, the Primeiras and Segundas Islands MPA had been approved as a marine protected area in Mozambique making this diverse ten-island archipelago Africa’s largest coastal marine reserve [with 10,411 km² (80% of the total MPA’s extent)]” (Marine Conservation Institute 2020). In Southern Mozambique, there is Ponta do Ouro (designated in 2009), another reserve, with 63 km2 out of its total 678 km2 being designated as no-take. The management authorities are the Ministry of Fisheries, the National Marine Institute (INAMAR) and the Ministry of Coordination of Environmental Action (MICOA) (Marine Conservation Institute 2020). Engagement initiatives with stakeholders in the reserve have shown that education and capacity-building initiatives are a key point for MPAs’ management and that they have the potential to empower stakeholders, encourage sustainable livelihoods and maximize conservation outcomes (Lucrezi et al. 2019). This in line with previous research carried out to review plans for marine conservation in Mozambique. The study recommended community involvement, consideration of the views of local citizens and institutional capacities. Otherwise, in terms of poverty alleviation and sustainable resource use, the goals

2020 Fisheries Centre Research Reports 28(5)
68
of archiving biodiversity conservation and tourism development may be counterproductive (Rosendo et al. 2011). Acknowledgments Funding for the work presented here was provided by the Minderoo Foundation, by the Marisla, Oak, and David and Lucille Packard Foundations, and by the Bloomberg Philanthropies through Rare. References Anon. 2013. Relatorio Anual 2013. Instituto Nacional de Investigação Pesqueira, Maputo. 80 p. Anon. 2014. Relatório Anual 2014. Instituto Nacional de Investigação Pesqueira, Maputo. 96 p. Anon. 2019a. Artisanal Fisheries Promotion Project-Supervision Report. IFAD, Mozambique. 344 p. Anon. 2019b. Boletim Estatístico (2006 – 2017). Ministério do Mar, Águas Interiores e Pescas, Maputo. 64 p. Anon. 2019c. Plano Director das Pescas 2010-2019. Ministério das Pescas, Maputo. 56 p. Chaúca, I., P. Limited, T. Pereira, O. Chacate, D. Mualeque, R. Mutombene, A. Simango, O. Chacate, E.
Morais, C. Maúnde, A. Thuzine, A. Wetimane, Z. Masquine, A. Inácio, E. Leong, K. Samucidine and R. Alvaro. 2013. O estado de exploração dos recursos acessíveis à pesca artesanal em Moçambique - 2010. Boletim de Divulgação nº 54, Instituto Nacional de Investigação Pesqueira, Maputo. 50 p.
Doherty, B., M.M. McBride, A. J. Brito, F. Le Manach, L. Sousa L, I. Chauca and D. Zeller. 2015. Marine fisheries in Mozambique: catches updated to 2010 and taxonomic disaggregation, p. 67–81. In: F. Le Manach and D. Pauly (eds). Fisheries catch reconstructions in the Western Indian Ocean, 1950–2010. Fisheries Centre Research Reports 23(2).
FAO. 2014. The State of World Fisheries and Aquaculture (SOFIA). Food and Agriculture Organization (FAO), Rome (Italy). 223 p.
Garibaldi, L. 2012. The FAO global capture production database: A six-decade effort to catch the trend. Marine Policy, 36: 760-768.
Jacquet, J.L. and D. Zeller. 2007. National conflict and fisheries: reconstructing marine fisheries catches for Mozambique, p. 35-47. In: D. Zeller and D. Pauly (eds). Reconstruction of marine fisheries catches for key countries and regions (1950-2005). Fisheries Centre Research Reports 15(2).
Jacquet, J.L., H. Fox, H. Motta, A. Ngusaru and D. Zeller. 2010. Few data but many fish: marine small-scale fisheries catches for Mozambique and Tanzania. African Journal of Marine Science, 32(2): 197-206.
Jacquet, J.L., B. Doherty, M.M. McBride, A. Brito, and D. Zeller. 2016. Mozambique, p. 338. In: D. Pauly and D. Zeller (eds). Global Atlas of Marine Fisheries: A Critical Appraisal of Catches and Ecosystem Impacts. Island Press, Washington, DC.
Lucrezi, S., M.H. Esfehani, E. Ferretti and C. Cerrano. 2019. The effects of stakeholder education and capacity building in marine protected areas: A case study from southern Mozambique. Marine Policy, 108: 103645. doi.org/10.1016/j.marpol.2019.103645
Marine Conservation Institute. 2020. MPAtlas [Online]. Seattle, WA. Available at: www.mpatlas.org Noël, S.-L. 2020. Semi-automation procedure for catch reconstruction forward carry, p. 15-20. In: B. Derrick,
M. Khalfallah, V. Relano, D. Zeller and D. Pauly (eds). Updating to 2018 the 1950-2010 Marine Catch Reconstructions of the Sea Around Us: Part I – Africa, Antarctica, Europe and the North Atlantic. Fisheries Centre Research Report 28(5).
Pauly, D. and D. Zeller. 2017. Comments on FAOs state of world fisheries and aquaculture (SOFIA 2016). Marine Policy, 77: 176-181.
Rosendo, S., K. Brown, A. Joubert, N. Jiddawi and M. Mechisso. 2011. A clash of values and approaches: A case study of marine protected area planning in Mozambique. Ocean & Coastal Management, 54(1):55–65. doi.org/10.1016/j.ocecoaman.2010.10.009
Scanteam, 2016. Support to the Fisheries Sector of Mozambique, 2013-2017 Mid-Term Review. Norad Collected Reviews 07/2016 Oslo. 66 p.
Sousa, L.D., K. Samucidine, N. Dias, O. Chacate and R. Mutombene. 2016. Estado de Exploração dos Recursos Pesqueiros 2014-2015 (EERP). Instituto Nacional de Investigção Pesqueira, Maputo. 48 p.

Updating to 2018 the 1950-2010 marine catch reconstructions of the Sea Around Us: Part I – Africa, Antarctica, Europe and the North Atlantic
69
MARINE FISHERIES IN THE SOMALI EEZ, UPDATED TO 2018*
Rachel White and Dirk Zeller Sea Around Us - Indian Ocean, School of Biological Sciences, University of Western Australia, 35 Stirling
Hwy, Crawley 6009, WA, Australia Abstract Marine fisheries catches in Somalia’s EEZ, which were previously reconstructed for 1950 to 2010, were here updated to 2018. Domestic catches were primarily artisanal and subsistence in nature, with artisanal fisheries also generating some discards. Domestic industrial fishing was only present from 1974-1991, while industrial fishing thereafter was exclusively by illegal foreign fishing fleets. Almost 40% of the total catches in Somalia’s EEZ since the 2000s were foreign in nature, excluding catches by industrial tuna fisheries managed by the IOTC. Introduction Somalia had been plagued by social and political instability since the collapse of a functional national government in 1991. From then until 2001, Somalia did not have an internationally recognized national government (but see Anon, 2019). The country’s political instability led to extensive foreign illegal fishing in the Exclusive Economic Zone (EEZ) of Somalia. Foreign fishing in Somali waters has occurred since at least 1981 and persists to the present. In 2018, the Somali national government began issuing foreign fishing licenses4 which may impact some of the foreign fishing activities in the EEZ in the future. However, such changes depend heavily on both enforcement as well as compliance, both of which seem to be in very short supply in the waters of Somalia. The domestic catches for Somalia were first reconstructed by Persson et al. (2015) for the years 1950 to 2010 (see also Persson 2016), while foreign fishing was estimated originally by Glaser et al. (2015). Subsequently, both domestic and foreign catches were updated to 2016 by Cashion et al. (2018). Here, these data are updated from 2016 to 2018 using updated reported landings data provided by the FAO for the domestic fisheries, and Glaser et al. (2019) for the foreign catches. Methods Domestic catches The catches reported for Somalia by the FAO have remained the same since 2006, likely due to Somalia not reporting any catch data to FAO (Garibaldi 2012). As the original methods by Persson et al. (2015) and Cashion et al. (2018) estimated the small-scale fisheries catches based on the estimated number of active boats, and since no new information regarding this was available, the existing ratios of unreported fisheries (subsistence, discards) to the available FAO reported landings data were used, along with the trend of unreported artisanal landings. Unreported discards were estimated based on a 1:5 artisanal discards to artisanal landings ratio, while unreported subsistence catches were assumed to represent 30% of total reported landings.
* Cite as: White, R. and D. Zeller. 2020. Marine fisheries in the Somali EEZ, updated to 2018, p. 69-71. In: B. Derrick, M. Khalfallah, V. Relano, D. Zeller and D. Pauly (eds). Updating to 2018 the 1950-2010 Marine Catch Reconstructions of the Sea Around Us: Part I – Africa, Antarctica, Europe and the North Atlantic. Fisheries Centre Research Report 28(5). 4 http://www.fao.org/emergencies/fao-in-action/stories/stories-detail/en/c/1176104/

2020 Fisheries Centre Research Reports 28(5)
70
Foreign catches Foreign catches were updated using the Glaser et al. (2019) study on foreign fishing in Somalia as well as the previous study of Glaser et al. (2015), which had been integrated in Cashion et al. (2018). The foreign catches reported in Glaser et al. (2019) were extended to 2018 using information on how these fleets have developed in Somalia’s water in recent years. Catches by the trawlers of Egypt, Greece, Italy, Kenya, and South Korea were carried forward unaltered from 2015 based on Glaser et al. (2015). Thailand had previously ceased to fish in the Somalia EEZ in 2009, but is known to have restarted fishing in 2018 (Glaser et al. 2019). Here, the 2018 catch by Thai fishers was very conservatively estimated as the catch of one vessel based on the previous catch rate from 2009. Future research will need to evaluate the number of Thai vessels and the size of fleets from other countries fishing in Somali waters. Since catches of the industrial tuna fisheries are estimated separately (Coulter et al. 2020), any foreign fisheries targeting tuna and other large pelagic species were examined to avoid any catch double-counting. Although the fisheries by Iran and Yemen in Somali waters are pelagic in nature and target tunas, Cashion et al. (2018) found that these catches were severely underestimated in the data reported by the Indian Ocean Tuna Commission, which forms the Indian Ocean data foundation used by Coulter et al. (2020). Therefore, in this reconstruction the Iranian and Yemeni catches (Glaser et al. 2019) were retained and carried forward. However, when updating the industrial tuna reconstruction, it will be important to avoid double-counting these catches and also to ensure that they are not over estimated. Results and Discussion Since 2010, 57% of the total catches taken within the Somali EEZ were deemed to have been domestic in nature (Figure 1).
Figure 1. Catches in the Somali EEZ waters for 1950-2018, by fishing country. “Other countries” consists of additional countries (primarily Italy, Japan, Sudan, and Taiwan) with minor catches. All domestic catch is considered to be taken by small-scale fisheries, and over 80% of domestic catches are considered artisanal. Domestic catches have been steadily increasing over time; however, in the more recent years, they seem to be levelling off. Foreign fishing fleets from at least eight countries engaged in illegal fishing in Somalia, primarily from Egypt, Iran, South Korea, Thailand and Yemen. Marine biodiversity protection Somalia has agreed to protect its biological diversity through the international Convention on Biological Diversity (Aichi) (Marine Conservation Institute 2020). There are some discrepancies in the available data

Updating to 2018 the 1950-2010 marine catch reconstructions of the Sea Around Us: Part I – Africa, Antarctica, Europe and the North Atlantic
71
about MPAs’ existence and regulations, as the MPAtlas states that Somalia supposedly has one MPA, the Hobyo National Park (MPA extent not known; Marine Conservation Institute 2020). However, the WDPA indicates that Somalian has has no area under marine protection (UNEP-WCMC and IUCN 2020) and the Ramsar sites information service does not indicate any wetland of international importance in the country (Ramsar sites information service 2020). The Hobyo Grassland and Shrubland ecoregion, where the National Park is supposed to be, comprises sand dunes dominated by perennial dune grasslands and sedges (WWF 2020). The Hobyo National Park reserves may have extended their protection to the surrounding waters. However, due to the political instability of the country, information is not available. “[…] it is not known how much habitat remains in this ecoregion, nor how fragmented it has become. The only official protected area is Lag Badana Bush-Bush National Park, but this is undoubtedly no longer functional. […] No recent information on threats is available. It is known that local populations use the scrub and grassland habitats of the ecoregion to graze their animals and gather fuelwood. The recent political instability and clan warfare in Somalia may have impacted habitats through the displacement of people to the coastal strip from urban centers and from areas further inland” (WWF 2020). Acknowledgements Funding for the work presented here was provided by the Minderoo Foundation, by the Marisla, Oak, and David and Lucille Packard Foundations, and by the Bloomberg Philanthropies through Rare. References Anon. 2019. Somalia Fisheries Forum 2019 Outcome Report: Building a roadmap for small-scale Somali
Fisheries. Federal Government of Somalia Ministry of Fisheries and Marine Resources & Puntland Ministry of Fisheries and Marine Resources & Secure Fisheries, Garowe, Puntland. 32p.
Cashion, T., S.M. Glaser, L. Persson, P.M. Roberts and D. Zeller. 2018. Fisheries in Somali waters: Reconstruction of domestic and foreign catches for 1950–2015. Marine Policy, 87: 275-283.
Coulter, A., T. Cashion, A. Cisneros-Montemayor, S. Popov, G. Tsui, F. Le Manach, L. Schiller, M. Palomares, D. Zeller and D. Pauly. 2020. Using harmonized historical catch data to infer the expansion of global tuna fisheries. Fisheries Research, 221:105379. doi.org/10.1016/j.fishres.2019.105379
Garibaldi, L. 2012. The FAO global capture production database: a six-decade effort to catch the trend. Marine Policy, 36(3): 760-768.
Glaser, S.M., P. Roberts, R. Mazurek, K. Hurlburt and L. Kane-Hartnett. 2015. Securing Somali Fisheries. One Earth Future Foundation, Denver, CO. 102 p.
Glaser, S.M., P.M. Roberts and K.J. Hurlburt. 2019. Foreign Illegal, Unreported, and Unregulated Fishing in Somali Waters Perpetuates Conflict. Frontiers in Marine Science, 6(704): 1-14. doi.org/10.3389/fmars.2019.00704
Marine Conservation Institute. 2020. MPAtlas [Online]. Seattle, WA. Available at: www.mpatlas.org Persson, L., A. Lindop, S. Harper, K. Zylich and D. Zeller. 2015. Failed State: Reconstruction of Domestic
Fisheries Catches in Somalia 1950-2010, p. 111-127. In: F. Le Manach and D. Pauly (eds). Fisheries catch reconstructions in the Western Indian Ocean, 1950-2010. Fisheries Centre Research Reports 23 (2).
Persson, L., A. Lindop, S. Harper, K. Zylich and D. Zeller. 2016. Somalia, p. 390. In: D. Pauly and D. Zeller (eds). Global Atlas of Marine Fisheries: A critical appraisal of catches and ecosystem impacts. Island Press, Washington D.C.
Ramsar sites information service. 2020. Explore sites. Available at: rsis.ramsar.org/ris-search/?language=en&f%5B0%5D=regionCountry_en_ss%3AAfrica
UNEP-WCMC and IUCN. 2020. Protected Planet: Protected Area Profile for Somalia from the World Database of Protected Areas, June 2020. Available at: www.protectedplanet.net/country/SO
WWF. 2020. Eastern Africa: Somalia. Available at: www.worldwildlife.org/ecoregions/at1307

2020 Fisheries Centre Research Reports 28(5)
72
SOUTH AFRICA: UPDATED CATCH RECONSTRUCTION FOR 2011-2018*
Rachel Whitea and Brittany Derrickb a) Sea Around Us - Indian Ocean, School of Biological Sciences, University of Western Australia, 35
Stirling Hwy, Crawley 6009, WA, Australia b) Sea Around Us, Institute for the Oceans and Fisheries, University of British Columbia, 2202 Main
Mall, Vancouver, BC, V6T 1Z4, Canada Abstract Earlier reconstructions of the fisheries catches taken from the western and eastern parts of the Exclusive Economic Zone (EEZ) of South Africa from 1950 to 2010 are here updated to 2018. Despite small-scale fishers being required by law to register, Illegal, Unreported and Unregulated (IUU) fishing is thought to persist. To account for these unreported landings, we updated subsistence fisheries based on the proportion of the population that are subsistence fishing and applied the catch rate. Detailed descriptions of the methods used to update South Africa’s fishing catches are presented separately for the western (Atlantic and Cape) and eastern (Indian Ocean) parts of the South African EEZ. Introduction The reconstruction of South Africa’s marine fisheries catches was completed for 1950-2010 by Baust et al. (2015, 2016a, 2016b), and is here updated to 2017. The FAO dataset was used as the reported catch baseline from 2011 to 2017 (FAO 2019), and we maintained the percentage of landings for each FAO category for sector, taxonomy, and gear. The update to 2017 was then carried forward to 2018 using the semi-automation procedure described in Noël (2020), and the landings data for 2018 recently made available by FAO. Methods Important species The total allowable catch (TAC) of hake (Merluccius capensis) has been slowly declining since 2013. In 2017, the FAO reported Cape Hake catch was 131,599 tonnes, or 99% of the 133,119 tonnes TAC (Williamson and Japp 2018; FAO 2019). The hake fishery had 50-60 trawlers and 150 longline vessels in the early 2000s (FAO 2005). We maintained the 2014 ratio of unreported ‘Merluccius’ to reported ‘Cape hakes’ in the Indian Ocean Area and as entirely reported in the Atlantic region. We noted that Merluccius capensis also occurs in the discarded bycatch (Walmsley et al. 2006). Sardine (Sardinops sagax) landings have decreased substantially over the years. We assumed this was likely related to external pressures as these populations have tested negative for pilchard herpesvirus (PHV) (Macey et al. 2016); thus, we maintained these landings as 100% reported. Reported and poached Perlemoen abalone (Haliotis midae) landings continue despite reports of heavy depletion (Bester-van der Merwe et al. 2011). We have maintained the 2014 ratio of unreported to reported landings.
* Cite as: White, R. and B. Derrick. 2020. South Africa: Updated catch reconstruction for 2011 – 2018, p. 72-76. In: B. Derrick, M. Khalfallah, V. Relano, D. Zeller and D. Pauly (eds). Updating to 2018 the 1950-2010 Marine Catch Reconstructions of the Sea Around Us: Part I – Africa, Antarctica, Europe and the North Atlantic. Fisheries Centre Research Report 28(5).

Updating to 2018 the 1950-2010 marine catch reconstructions of the Sea Around Us: Part I – Africa, Antarctica, Europe and the North Atlantic
73
Recreational fishing Recreational landings were carried forward with the decreasing trend and taxonomic disaggregation as described in Baust et al. (2015), as no new information was available. However, the number of anglers may be increasing, and this should be reassessed in future updates. Subsistence and artisanal fishing Unreported landings from the artisanal linefish fishery were carried forward using the existing relationship between reported and unreported landings for each species. For those taxa with no reported component, we continued the pre-existing trend. In 2014, small-scale fishers were identified and awarded the right to fish under amendment of the 1998 Marine Living Resources Act (DAFF). Under DAFF, small-scale fishers must register, and resources are subject to co-management by communities; however, Illegal, Unreported, and Unregulated (IUU) fishing is thought to persist (Sowman et al. 2014). Thus, we maintained subsistence and artisanal fisheries as fully unreported here; however, this can be reassessed as more information about these small-scale fisheries becomes available. To estimate catches by subsistence fisheries, the number of subsistence fishers was updated for 2015–2017 using the original methods in Baust et al. (2015). Updated population information was available from the World Bank for 2015–2017. The non-white population was estimated to comprise 90.9% of the total population of South Africa in 2011 (Statistics South Africa 2012) and this percentage was assumed to remain constant from 2011 to 2017. The percentage of individuals in the non-white population assumed to participate in subsistence fishing (7.13 x 10⁻⁴) was maintained. The taxonomic breakdown for subsistence fisheries was maintained at the 2014 proportions for 2015–2017. Fisheries of the Atlantic and Cape region Tuna and tuna-associated reported landings, as reported in the FAO data, were assumed artisanal and included here. We carried forward discards on all industrial landings as per the 2014 rate (7.06%). Cape horse mackerel (Trachurus capensis) catches appeared to be underestimated in some years, with diamond trawl catches over 20,000 tonnes annually (Johnson and Butterworth 2016). We retroactively added unreported tonnages for years in which the catches in the 2016 report were larger than those reported by FAO, then adjusted the discards accordingly. West Coast rock lobster (Jasus lalandii), which is exported live or as frozen-tails, continues to be heavily depleted. In the absence of updated information, the illegal catch of this lobster was held constant at 500 tonnes per year. South African fisheries in the Indian Ocean We made retroactive changes to tuna-associated taxa back to 1997 in order to avoid double-counting with the industrial catches reported by the RFMOs, as described in Coulter et al. (2020). Because these data are accounted for in Coulter et al. (2020), we removed from our data presented here 100% of the FAO reported bigeye tuna (Thunnus obesus), black marlin (Istiompax indica), blue marlin (Makaira nigricans) and swordfish (Xiphias gladius), blue shark (Prionace glauca), mako shark (Isurus oxyrinchus) catches, and maintained 100% removal of Indo-Pacific sailfish (Istiophorus platypterus), Southern bluefin tuna (Thunnus

2020 Fisheries Centre Research Reports 28(5)
74
maccoyii), and striped marlin (Kajikia audax), and the category ‘marlins nei’. We included albacore (Thunnus alalunga), kawakawa (Euthynnus affinis), requiem sharks nei, and yellowfin tuna (Thunnus albacares) as the FAO reported catch minus the IOTC industrial catch. We also included 100% of ‘Sharks, rays, skates nei’ because targeted demersal shark longlining fleets are present along the entire South African coast. We carried forward discards on all industrial landings as per the 2014 rate (0.13%). Transition from 2017 to 2018 The catch reconstructed here to 2017 was forward carried to 2018 using the semi-automatic procedures outlined in Noël (2020), based on reported FAO landings data available to 2018. The semi-automated catch time series will need to be replaced by a more detailed, research-intensive update. Results and Discussion Figure 1 shows the domestic marine catch for South Africa by fishing sectors.
Figure 1. Reconstructed South African marine fisheries catches for 1950-2018 by fishing sector. Recreational and subsistence catches are included, but are too small to be visible. The South African marine fisheries catch reconstruction for 1950-2018 largely maintained original methods with newly reported catch and population data where available. With the availability of new secondary sources of data, we were able to update the catches of cape horse mackerel, which were previously under-reported (Johnson and Butterworth 2016). The tuna and tuna-like catches were also adjusted, providing less chance of a doubling of catch when combined with the allocated data by Coulter et al. (2019). Future investigations need to examine foreign fishing in the waters of South Africa. Marine biodiversity protection South Africa has agreed to protect its biological diversity through the international agreements of the Convention on Biological Diversity (Aichi), United Nations Convention on the Law of the Sea, Ramsar Convention on Wetlands of International Importance, International Coral Reef Initiative and the World Heritage Convention. The country is also a signatory to Regional Treaties and Agreements such as the Regional Seas Convention (Marine Conservation Institute 2020).

Updating to 2018 the 1950-2010 marine catch reconstructions of the Sea Around Us: Part I – Africa, Antarctica, Europe and the North Atlantic
75
South Africa has 144 MPAs and 15 marine managed areas in its waters (South Africa mainland ‘s EEZ: 1,065,941 km2; Baust et al. 2016a, 2016b). The implemented highly protected areas occupy 5,318 km2, which corresponds to 3% of the EEZ. Tsitsikamma National Park on the southern coast of South Africa has 293 km2 and was designated in 1964 (Marine Conservation Institute 2020), which makes it the largest no-take area and oldest MPA in South Africa. However, the no-take status has been controversial during the last decades, since in 2000 the prohibition of extractive activities was implemented without stakeholders’ consultation and lack of transparency in decision-making processes. “In 1998, and again in 2007 and 2010, the Ministers then responsible for environmental affairs ruled against challenges to open the MPA to shore angling. In 2015, after years of an escalating polarization of stakeholders, some for and some against shore angling, the National Government’s Department of Environmental Affairs (DEA) gazetted a proposal to open sections of the MPA to recreational shore angling and invited public comment. However, during the comment period, the DEA, without prior notice to stakeholders, opened four sections of the MPA to ‘experimental’ angling. It reversed this decision after losing in court to a non-governmental organization that challenged the legality of the action. A year later, in December 2016, this time after receiving comments submitted by stakeholders during the formal stakeholder consultation process, the DEA opened 20% of the MPA’s coastline to angling. This decision was taken despite scientific evidence to support maintaining the MPA’s ‘no-take’ status, and significant public support for maintaining the fully protected status of the MPA” (Lombard et al. 2020). Acknowledgements Funding for the work presented here was provided by the Minderoo Foundation, by the Marisla, Oak, and David and Lucille Packard Foundations, and by the Bloomberg Philanthropies through Rare. References Baust, S., L.C.L. Teh, S. Harper and D. Zeller. 2015. South Africa's marine fisheries catches (1950-2010),
p.129-150. In: F. Le Manach and D. Pauly (eds). Fisheries catch reconstruction in the Western Indian Ocean, 1950-2010. Fisheries Centre Research Report 23(2).
Baust, S., L.C.L. Teh, S. Harper and D. Zeller. 2016a. South Africa (Atlantic Coast), p. 391. In: D. Pauly and D. Zeller (eds). Global Atlas of Marine Fisheries: A Critical Appraisal of Catches and Ecosystem Impacts. Island Press, Washington, DC.
Baust, S., L.C.L. Teh, S. Harper and D. Zeller. 2016b. South Africa (Indian Ocean Coast), p. 392. In: D. Pauly and D. Zeller (eds). Global Atlas of Marine Fisheries: A Critical Appraisal of Catches and Ecosystem Impacts. Island Press, Washington, DC.
Bester-van der Merwe, A.E., R. Roodt-Wilding, F.A. Volckaert, and M.E. D’Amato. 2011. Historical isolation and hydrodynamically constrained gene flow in declining populations of the South-African abalone, Haliotis midae. Conservation Genetics, 12: 543-555.
Coulter, A., T. Cashion, A. Cisneros-Montemayor, S. Popov, G. Tsui, F. Le Manach, L. Schiller, M. Palomares, D. Zeller and D. Pauly. 2020. Using harmonized historical catch data to infer the expansion of global tuna fisheries. Fisheries Research, 221:105379. doi.org/10.1016/j.fishres.2019.105379.
FAO. 2019. Fishery Statistical Collections [Online]. Food and Agriculture Organization of the United Nations (FAO), Rome (Italy).
FAO. 2005. The Republic of South Africa. FAO Fishery and Aquaculture Country Profiles. Available at: www.fao.org/fi/oldsite/FCP/en/ZAF/profile.htm.
Johnson, S.J. and D.S. Butterworth. 2016. The 2016 Horse Mackerel Assessment Model. DAFF Branch Fisheries document. Available at: hdl.handle.net/11427/24033.
Lombard, A.T., I. Durbach, J.M. Harris, J. Mann-Lang, B.Q. Mann, G.M. Branch and C.G. Attwood. 2020. Chapter 13—South Africa’s Tsitsikamma Marine Protected Area – winners and losers, p. 237-270. In: J. Humphreys and R.W.E. Clark (eds). Marine Protected Areas. Elsevier. doi.org/10.1016/B978-0-08-102698-4.00013-7

2020 Fisheries Centre Research Reports 28(5)
76
Macey, B.M., K.W. Christison, J. De Goede, L. Hutchings and C.D. Van Der Lingen. 2016. Testing for the occurrence of pilchard herpes virus (PHV) in South African sardine Sardinops sagax. African Journal of Marine Science, 38: 269-273.
Marine Conservation Institute. 2020. MPAtlas [Online]. Seattle, WA. Available at: www.mpatlas.org Noël, S.-L. 2020. Semi-automation procedure for catch reconstruction forward carry, p. 15-20. In: B. Derrick,
M. Khalfallah, V. Relano, D. Zeller and D. Pauly (eds). Updating to 2018 the 1950-2010 Marine Catch Reconstructions of the Sea Around Us: Part I – Africa, Antarctica, Europe and the North Atlantic. Fisheries Centre Research Report 28(5).
Sowman, M., J. Sunde, S. Raemaekers and O. Schultz. 2014. Fishing for equality: Policy for poverty alleviation for South Africa's small-scale fisheries. Marine Policy, 46: 31-42.
Statistics South Africa. 2012. Census 2011 Census in brief. Statistics South Africa. Report no: 03-01-41, 105 p. Walmsley, S.A., R.W. Leslie and W.H.H. Sauer. 2006. Managing South Africa's trawl bycatch. ICES Journal of
Marine Science, 64: 405-412. Williamson, M. and D. Japp. 2018. Status and Management of the South African Hake trawl fishery - 2018.
Oceana Group, Cape Town, South Africa. 6 p.

Updating to 2018 the 1950-2010 marine catch reconstructions of the Sea Around Us: Part I – Africa, Antarctica, Europe and the North Atlantic
77
TANZANIA: UPDATED CATCH RECONSTRUCTION FOR 2011-2018*
Rachel Whitea, Emmalai Pageb and Simon-Luc Noëlb
a) Sea Around Us - Indian Ocean, School of Biological Sciences, University of Western Australia, 35 Stirling Hwy, Crawley 6009, WA, Australia
b) Sea Around Us, Institute for the Oceans and Fisheries, University of British Columbia, 2202 Main Mall, Vancouver, BC, V6T 1Z4, Canada
Abstract The reconstruction of marine capture fisheries catches for the Republic of Tanzania is updated here to 2018. In the early time period, catches were entirely small-scale in nature with almost 30% considered subsistence. Over time, the commercial sector grew, with artisanal fisheries increasingly dominating the catches. Industrial fisheries started in 1966 and grew to a peak of almost 7000 tonnes in 1998, following which they declined to around 4000 tonnes in 2018 or 3% of total catches. All sectors were assumed to be partially reported, with the highest unreported ratio in the subsistence fisheries. Discards were estimated for both artisanal and industrial fisheries. Introduction The original reconstruction of marine capture fisheries for the Republic of Tanzania (i.e., Tanzania) was carried out for 1950-2005 by Jacquet and Zeller (2007). The reconstruction of Jacquet et al. (2010) was updated to 2010 by Bultel et al. (2015) and Jacquet et al. (2016). Here, we updated Tanzanian marine catches to 2018. Tanzania encompasses a mainland area and three large islands: Mafia, Pemba and Zanzibar. The Zanzibar region refers to the grouping of Pemba and Zanzibar islands, while the mainland region refers to the mainland and Mafia island (Jacquet et al. 2010). The mainland and Zanzibar regions have separate legal and management systems for fisheries due to their largely separate political history (Jacquet et al. 2010). Each region appears to report to the FAO independently, making Tanzania the only country in the world represented by two completely separate ‘country names’ in the FAO catch data system: “Tanzania” representing the mainland region and “Zanzibar” representing the Zanzibar region. Methods Here, Tanzania is treated as a single EEZ/country with two different sub-areas (mainland and Zanzibar). There were no indications that the reporting system had changed since the last reconstruction update by Bultel et al. (2015), thus all catches reported by the FAO for “Tanzania” and “Zanzibar” were considered domestic reported landings, and a 35% unreported ratio was added to all mainland reported taxa (Bultel et al. 2015). These data, with both reported and unreported components, were assigned to fishing sectors, taxa and fishing gears in accordance with the earlier reconstructions. All other unreported fisheries catches for the mainland and Zanzibar regions were added using updated human population data, and disaggregated by fishery (beach seine, blast fishing, cast nets, diving, fixed fences, and spearfishing) based on the earlier reconstructions (Jacquet and Zeller 2007; Bultel et al. 2015). The pre-existing taxonomic, sectoral and gear type breakdowns were maintained. The percentage of unreported Penaeus spp. shrimp catches in the Zanzibar region to reported shrimp catches in the mainland region (52%), and the discard ratio (2:1) for the combined shrimp fisheries were maintained.
* Cite as: White, R., E. Page and S.-L. Noël. 2020. Tanzania: Updated catch reconstruction for 2011 – 2018, p. 77-80. In: B. Derrick, M. Khalfallah, V. Relano, D. Zeller and D. Pauly (eds). Updating to 2018 the 1950-2010 Marine Catch Reconstructions of the Sea Around Us: Part I – Africa, Antarctica, Europe and the North Atlantic. Fisheries Centre Research Report 28(5).

2020 Fisheries Centre Research Reports 28(5)
78
The problem of dynamite fishing Destructive methods of fishing are used widely along coastlines, including dynamite fishing. Braulik et al. (2015) have identified widespread dynamite fishing by artisanal nearshore fishers of mainland Tanzania, despite the practice being illegal since 2003. Braulik et al. (2015) counted over 300 blasts over the span of 31 days, for approximately 10 blasts per day, in a time when dynamite fishing is said to be as intense, or more so, than historically recorded (Slade and Kalangahe 2015). Destructive fishing practices such as blast fishing (i.e., explosives) were thought to still be present in 20185, and since no new estimates on the amount of fish captured using this method were available, the catches estimated by Bultel et al. (2015) were held constant. Industrial fisheries Tanzania’s marine fishing sector has been experiencing a push towards industrialization and modernization in recent years. Although there is interest in the under-exploited economic potential of Tanzania’s marine environments, the push has not come without its challenges -- both technical and ecological (Lazaro 2012; Yussuf 2014; McClanahan et al. 2015). The uptick in destructive blast fishing, while netting relatively little in terms of fish catch, has an outsize impact on marine ecosystem health and structure, which may lead to lower catches if not reined in. Results and discussion The Tanzania marine fisheries catch data update to 2018 maintained the original reconstruction methods by Jacquet and Zeller (2007) and Bultel et al. (2015), but used the new reported catches and human population data (Figure 1).
Figure 1. Reconstructed domestic catch for Tanzania’s EEZ for 1950-2018 by fishing sector. Overall, there is a large portion of reconstructed catches that are deemed unreported (40%), although this has declined from 60% in 1950 to 30% in 2018. Tanzania has made efforts to address IUU fishing by foreign fleets, including through innovative partnerships and joint patrols with NGOs such as the Sea Shepherd organization (www.seashepherdglobal.org/latest-news/tanzania-jodari-concludes/).
5 https://www.nationalgeographic.com/news/2016/06/blast-fishing-dynamite-fishing-tanzania/

Updating to 2018 the 1950-2010 marine catch reconstructions of the Sea Around Us: Part I – Africa, Antarctica, Europe and the North Atlantic
79
Marine biodiversity protection Tanzania has agreed to protect its biological diversity through the international Convention on Biological Diversity (Aichi) (Marine Conservation Institute 2020). Tanzania is reported to have 133 MPAs and one marine managed area. Together, the MPAs cover 2,299 km2 (Marine Conservation Institute 2020), which equals almost 1% of the EEZ (241,129 km2; Jacquet et al. 2016). However, the implemented highly protected areas occupy only 42.6 km2. The only marine managed area is the Rufiji-Mafia-Kilwa (a Ramsar Site designated in 2004 and it has a reported marine area of 5969 km2). The list of existing MPAs from the MPAtlas is confusing as the Mangrove Forest Reserve is divided in very small units that are counted as different MPAs, which results in the Mangrove Forest Reserve being listed 112 times. If one accounts for these repetitions, the total number of MPAs in Tanzania appears to be 35. The same country page in the MPAtlas states that there are, in Tanzania, 13 MPAs referred to as marine reserves or marine conservation areas. The biggest no-take marine reserve is Dar es Salaam, which covers 26 km2. The Dar es Salam marine reserve was designated in 1975 and its management authority is the Government’s marine parks and reserve unit, with the participation of an Advisory Committee and Village Council representatives (Marine Conservation Institute 2020). Only one area in Zanzibar -- the Chumbe Island Coral Park -- is privately owned (Marine Conservation Institute 2020). Moreover, in Tanga there are also collaborative management areas (CMAs) that were announced through by-laws of villages and approved at the national level. “CMAs are based on resource use, specifically on shared fishing grounds, and therefore involve several villages in each CMA. This has helped reduce conflicts and address the difficulties of managing common pool resources. […] These included reefs closed to fishing to serve as fishery reserves. Destructive and illegal beach seines (juya) and dynamite fishing were dramatically reduced through surveillance patrols and gear exchange for beach seines (Horrill et. al. 2001)” (Samoilys and Kanyange 2008). “The MPAs in Tanzania serve to protect diverse ecosystems of mangroves, coral reefs, sea grass beds and the open sea, and the diversity of species housed within. The lives of the Tanzanian people have always been connected to the sea, and one of the goals of MPAs in this region is to protect this way of life for current and future generations by enhancing fish stocks and preserving the important habitats” (Marine Conservation Institute 2020). Acknowledgements Funding for the work presented here was provided by the Minderoo Foundation, by the Marisla, Oak, and David and Lucille Packard Foundations, and by the Bloomberg Philanthropies through Rare. References Braulik, G., A. Wittich, J. McCauley, M. Kasuga, J. Gordon, D. Gillespie and T.R.B. Davenport. 2015. Fishing
with explosives in Tanzania: spatial distribution and hotspots. Wildlife Conservation Society Tanzania Program, Zanzibar. 19 p.
Bultel, E., B. Doherty, A. Herman, F. Le Manach and D. Zeller. 2015. An update of the reconstructed marine fisheries catches of Tanzania with taxonomic breakdown, p. 151-161. In: F. Le Manach and D. Pauly (eds). Fisheries catch reconstructions in the Western Indian Ocean, 1950-2010. Fisheries Centre Research Reports 23 (2).
Horrill, J. C., H. Kalombo and S. Makoloweka. 2001. Collaborative reef and reef fisheries management in Tanga, Tanzania. IUCN EARO, Nairobi. 37p.

2020 Fisheries Centre Research Reports 28(5)
80
Jacquet, J., E. Bultel, B. Doherty, A. Herman, F. Le Manach, and D. Zeller. 2016. Tanzania, p. 408. In: D. Pauly and D. Zeller (eds). Global Atlas of Marine Fisheries: A Critical Appraisal of Catches and Ecosystem Impacts. Island Press, Washington, D.C.
Jacquet, J., H. Fox, H. Motta, A. Ngusaru and D. Zeller. 2010. Few data but many fish: marine small-scale fisheries catches for Mozambique and Tanzania. African Journal of Marine Science 32(2): 197-206.
Jacquet, J.L. and D. Zeller. 2007. Putting the 'United' in the United Republic of Tanzania: reconstruction marine fisheries catches, p. 49-60. In: D. Zeller and D. Pauly (eds). Reconstruction of marine fisheries catches for key countries and regions (1950-2005). Fisheries Centre Research Reports 15 (2).
Marine Conservation Institute. 2020. MPAtlas [Online]. Seattle, WA. Available at: www.mpatlas.org McClanahan, T.R., N.A. Muthiga, C.A. Abunge, A.T. Kamukuru, E. Mwakalapa and H. Kalombo. 2015. What
happens after conservation and management donors leave? A before and after study of coral reef ecology and stakeholder perceptions of management benefits. PLoS ONE 10(10): 24.
Samoilys, M.A. and N.W. Kanyange. 2008. Natural resource dependence, livelihoods and development: Perceptions from Tanga, Tanzania. IUCN ESARO 2008. Available at: www.iucn.org/sites/dev/files/import/downloads/081118_tanga_report_low_res.pdf
Slade, L.M. and B. Kalangahe. 2015. Dynamite fishing in Tanzania. Marine Pollution Bulletin, 101(2015): 6. Yussuf, I. 2014. Tanzania: Challenges in development of fishing industry. Tanzania Daily News. Available at:
allafrica.com/stories/201412241145.html.

Updating to 2018 the 1950-2010 marine catch reconstructions of the Sea Around Us: Part I – Africa, Antarctica, Europe and the North Atlantic
81
MADAGASCAR AND SMALLER ISLANDS IN THE WESTERN INDIAN OCEAN: UPDATED CATCH RECONSTRUCTIONS FOR 2011-2018*
Rachel Whitea, Simon-Luc Noëlb, Hanna Christa, Veronica Relanob, Fayte Sicnawac
and Gordon Tsuib
a) Sea Around Us - Indian Ocean, School of Biological Sciences, University of Western Australia, 35
Stirling Hwy, Crawley 6009, WA, Australia b) Sea Around Us, Institute for the Oceans and Fisheries, University of British Columbia, 2202 Main
Mall, Vancouver, BC, V6T 1Z4, Canada c) Quantitative Aquatics, Inc., IRRI G. S. Khush Hall, College, Los Baños, 4031 Laguna, Philippines
Abstract The marine fisheries catch reconstructions for the waters around Madagascar, the Mozambique Channel Islands and the Mascarene Basin, initially completed for the years 1950 to 2010, were updated or carried forward from various orginal ending years to 2018. This involved Comoros Island, Îles Éparses, Madagascar, Mauritius, Mayotte, La Réunion and the Seychelles. Independent estimates of the catches from artisanal and subsistence fisheries are not readily available or reliably covered by official statistics reported by the FAO. In order to estimate catches from small-scale fisheries, we utilized approaches based on either per capita consumption rates applied to the population or catch-per-unit-effort applied to the number of small-scale vessels. Detailed descriptions of the other methods used to update each of these catch reconstructions are presented in 8 country-specific sections. Introduction The reconstructions of the catches taken from the Exclusive Economic Zones (or the corresponding marine areas prior to 1982) of the Comoros Island, Îles Éparses, Madagascar, Mauritius, Mayotte, La Réunion and the Seychelles from 1950 to 2010 were presented in various contributions listed below. This contribution either updates or carries forward these reconstructions from their various end dates to 2018, using FAO landing data and other datasets, here documented for each country/island entity separately. Comoros Island Comoros marine fisheries were reconstructed for 1950 to 2010 by Doherty et al. (2015, 2016) and here updated to 2017 before being forward carried to 2018. The updated domestic catch of the Comoros was estimated separately for shore-based and hand line fishing. The retroactive changes to the FAO data set since 2007 were incorporated in this reconstruction update. Shore-based fishing The per-capita catch rate for shore-based catch was assumed to continue to decline at the rate calculated between 2000 and 2010. This yearly per-capita catch rate was multiplied by updated population data from Statistics Comoros (AfDB 2017). Because no updated information for population per island was available, the island breakdown for Ngazidja/Grand Comore, Ndzuwani/Anjouan and Mwali/Mohéli from 2013 (for both domestic fisheries) was carried forward.
* Cite as: White, R., S.-L. Noël, H. Christ, V. Relano, F. Sicnawa and G. Tsui. 2020. Madagascar and smaller islands in the Western Indian Ocean: Updated catch reconstruction for 2011 – 2018, p. 81-99. In: B. Derrick, M. Khalfallah, V. Relano, D. Zeller and D. Pauly (eds). Updating to 2018 the 1950-2010 Marine Catch Reconstructions of the Sea Around Us: Part I – Africa, Antarctica, Europe and the North Atlantic. Fisheries Centre Research Report 28(5).

2020 Fisheries Centre Research Reports 28(5)
82
Boat-based domestic fishing Catches by the boat-based fishery of the Comoros Islands was estimated as in Doherty et al. (2015), who used anchor points for the number of boats in the Comoros, calculated a rate of boats-per-1000-people, and used that rate, along with population data from Statistiques Comores (Anon. 2014), to estimate catch using the 2010 rates of catch per boat per year. An anchor point for the number of boats in the Comorian fleet was for 2012 (Soilihi 2013); boats were allocated to the islands of Grande Comore, Anjouan and Mohéli using 2010 ratios from Doherty et al. (2015). The 2012 number of boats per 1000 people was retained for 2013 to 2015 for our estimates; total catch rates for each island were calculated and taxonomically split according to the reported data of FAO (2018), and split between artisanal and subsistence fishing sectors according to Doherty et al. (2015). The number of boats-per-1000-people for the hand line fishery was updated to 2017 using the estimated vessel number for 2014 (Greer et al. 2019) as the anchor point (see also Soilihi 2017). To update hand line landings, the number of boats was multiplied by the 2014 catch rate. The island breakdown for the hand line fishery was carried forward using the ratio of boats per island breakdown from the original reconstruction (Doherty et al. 2015). Reconstructed catch in excess of the FAO reported amounts was distributed the same way and recorded as unreported catch. Transition from 2017 to 2018 The catch reconstructed here to 2017 was forward carried to 2018 using the semi-automatic procedures outlined in Noël (2020), based on reported FAO landings data available to 2018. The semi-automated catch time series will need to be replaced by a more detailed, research-intensive update. Results Figure 1 shows the domestic marine catch for the Comoros Islands by fishing sectors.
Figure 1. Reconstructed artisanal and subsistence catch in the EEZ of the Comoros for 1950 to 2018. Legal foreign fishing does not seem to occur within the Exclusive Economic Zone (EEZ) of Comoros, and information on illegal fishing operation was not readily available. However, the Comoros flag often is used as a flag of convenience. Therefore, the FAO data reported 18 tonnes in 2015 as Comoros flagged, which was allocated to France as in the previous reconstruction.

Updating to 2018 the 1950-2010 marine catch reconstructions of the Sea Around Us: Part I – Africa, Antarctica, Europe and the North Atlantic
83
Marine biodiversity protection Comoros Island has agreed to protect its biological diversity through the international Convention on Biological Diversity (Aichi; Marine Conservation Institute 2020). The Comoros Islands have five MPAs (Marine Conservation Institute 2020), and their total extent is 620 km2 (UNEP-WCMC and IUCN 2020), which is about 0.4% of the EEZ (164,643 km2; Doherty et al. 2015). One of the first and largest MPAs established (2001) in these waters was the Parc Marin de Mohéli (PMM), which covers an area of 366 km2 (UNEP-WCMC and IUCN 2020). Some of the main threats in the waters of the Comoros Islands are turtle poaching, coral reef damage and illegal fishing (Hauzer et al. 2008). Thus, the PMM aims to maintain a healthy status of these diverse ecosystems through some of its management objectives, such as ensuring stocks recruitment of coral fish and preserve seagrass meadows, especially for dugongs and turtles (Youssouf Abdou 2012). However, the Parc Marin de Mohéli, which was initially designed as a model for co-management of marine resources, is currently functioning at reduced capacity after losing funds for covering management costs (Hauzer et al. 2008). As a result of the lack of management effectiveness in the PMM, illegal practices still occur. “Many fishers also remarked that they have never been aware of the location of the PMM no-take zones and that PMM personnel did not enforce these zones. [Moreover] the vast majority of women (in 70% of villages) felt that they had not played any role in the creation of PMM and four female focus groups also remarked that they remained uninformed and ignorant of park activities as well as conservation in general. In spite of this, the women who participated in the focus group interviews were motivated and inspired; they were eager for training in all conservation activities, including nightly surveillance of beaches for turtle poachers” (Hauzer et al. 2008). Îles Éparses /Mozambique Channel Islands The catch reconstruction for the Îles Éparses, consisting of the EEZs of the Glorieuses, Juan de Nova, Bassas da India and Tromelin Islands, was originally reconstructed for 1950-2010 by Le Manach and Pauly (2015, 2016), and later updated to 2014 by Sea Around Us. Sea cucumber (holothurian) fisheries As noted by Le Manach and Pauly (2015), a growing illegal holothurian fishery occurs in the EEZs of the Glorieuses and Juan de Nova Islands. While this fishery is poorly documented, a few key assumptions were made based on information from the French Ministry of Defense, which established a watch for illegal fishing in the Îles Éparses. Fishing operations intercepted by French authorities usually involve approximately 1 tonne (t) of holothurians, with a seizure of 3 t from one operation occurring in 2016, which also yielded 0.5 to 1.5 tonnes of finfish (Anon. 2014a, 2014b, 2015, 2016). The average holothurian catch was calculated at 1.625 tonnes per fishing operation for all boats, and an additional 50% of that estimate consisted of various finfish. To estimate the total catch by this fishery, the Le Manach and Pauly (2015) estimate of at least 10 illegal incursions of holothurian fishers in a period of 15 months between 2013 and early 2014, and an assumption that the number of incursions increased steadily between 2011-2014 were used. This catch was split evenly between the EEZs of the Glorieuses and Mozambique Channel Islands. The estimated finfish catch was taxonomically allocated evenly to Elasmobranchii, Sphyraenidae, Serranidae, and Scombridae following a description of illegal fish catches by holothurian fishers in 2016 (Anon. 2016). Recreational fishing Absent any new information on recreational fishing in Bassas da India, recreational fishing has been carried forward to 2014 following the trend from 2005 to 2010 of finfish and chondrichthyan landings, and finfish

2020 Fisheries Centre Research Reports 28(5)
84
discards. However, given the Sea Around Us’ definition of recreational fishing as that occurring within one’s home EEZ (Zeller and Pauly 2016), this (small) catch was added to the industrial catch since it consisted of fishing by a foreign boat. Artisanal fishing The ‘barque’ fishery of the Glorieuses Islands banks has been calculated based on the assumptions in Le Manach and Pauly (2015) of 30 barques undertaking 10 trips each per year and catching 250 kg of finfish on average. This catch was taxonomically distributed as in 2010 and earlier, and discards were calculated as 10% of the total landings of this fishery. According to Philippe Boras (pers. comm., May 13, 2019), in 2011, Mayotte’s fishing cooperative, CopeMay, did not hide the fact that its vessel fished in the protected areas of Zelee and Geyser Banks targeting large groupers, large lethrinids, large snapper (Lutjanus bohar), jobfishes and large carangids. Illegal fishing by Malagasy fishers around the Ile du Lys was observed to occur between 2011 and 2019, targeting reef fish, reef sharks and sea cucumbers. The Gendarmerie posted on Grande Glorieuse reported that “there’s no means to stop the trafficking” (Philippe Boras, pers. comm., May 13, 2019). Transition from 2014 to 2018 The reconstructed catch and update to 2014 was carried forward to 2018 using the semi-automated procedure described in Noël (2020). The semi-automated reconstructed catch data will later be replaced by a more detailed, research-intensive update. Marine biodiversity protection France has agreed to protect the biological diversity of the Mozambique Channel Islands through the international Convention on Biological Diversity (Aichi) and the Ramsar Convention on Wetlands of International Importance (Marine Conservation Institute 2020). There is also a Scientific Committee (CSIE, Scientific Committee of the Scattered Islands) established as an advisory body to the French administration. In the archipelago, the islands of Europa and Bassas da India were declared Nature Reserves in 1975 (Arrêté préfectoral de 1975) (VLIZ 2020). Europa was designated as a Ramsar site in 2011, protecting 2580 km2 of this coralline island, which provides habitats to the globally endangered Madagascar pond heron Ardeola idae, Fin whale Balaenoptera physalus, green turtle Chelonia mydas and hammerhead shark Sphyrna lewini (Ramsar sites information service 2020). Moreover, the extensive Halimeda facies, well represented in the islands of Glorieuses and Juan de Nova, contribute to the high productivity of their waters, which makes them unique in the context of the Indian Ocean islands (VLIZ 2020). Some of the predominant threats to these islands are fishing, shipping traffic, oil exploration (VLIZ 2020) and introduced species (Ramsar sites information service 2020). The archipelago is not far from other populated islands and fishers from Mayotte and South Africa practice commercial and recreational fishing in these waters. Moreover, since 2008, two permits for petroleum exploration within the EEZ were approved (VLIZ 2020, Obura and Ardron 2020). Madagascar Madagascar’s marine fisheries catch was reconstructed for 1950 to 2008 by Le Manach et al. (2011), and their catch was informally updated to 2010 (Le Manach et al. 2016) and 2014 by the Sea Around Us. It is here updated to 2016 based on national (Balgobin and Iharimamy 2016) and FAO data (2020). Note that foreign

Updating to 2018 the 1950-2010 marine catch reconstructions of the Sea Around Us: Part I – Africa, Antarctica, Europe and the North Atlantic
85
fisheries targeting tunas and other large pelagic species are not covered in this update, as they were addressed in Coulter et al. (2020). Data from the World Bank (2018) were utilized to update the population data to 2016 and calculate the ratio of fishers using the original reconstruction methods (Le Manach et al. 2011). We maintained the increasing trend of fishers resulting in 0.62% of the total population engaged in small-scale fishing by 2016, up from 0.58% in 2010. The small-scale catch was updated by applying an annual catch-per-fisher rate; this rate was continued with the decreasing trend. The small-scale sector breakdown (subsistence and artisanal sectors) was maintained based on the ratios of FAO reported taxon. The FAO had made some relatively small retroactive changes in the catch data from 2011 onwards; here, we updated those. Discards, bycatch and unreported catch rates for the shrimp fisheries were carried forward from 2010. Taxon and gear breakdowns were carried forward. Species of emphasis Since 2013, the FAO has begun to report catches of blue shark (Prionace glauca) from Madagascar. Since previously targeted mako sharks (Isurus oxyrhinchus) are becoming rare (Razafimandimby and Joachim 2017), this is likely new catch rather than a taxonomic disaggregation. Recent stock assessments using the CMSY method (Palomares et al. 2020) highlighted a major increase in the catch of giant mud crab (Scylla serrata). This crab is traditionally targeted; however, since the initiation of live exports to China in 2012, its demand and value have increased dramatically (Yvergniaux and Signa 2014). We considered this a developing commercial fishery and therefore assumed the increases in catch were not a statistical artefact. A controversial estimate of small-scale fisheries catches A study by Barnes-Mauthe et al. (2013) estimated that the catch of Madagascar’s small-scale fisheries was approximately three times higher than suggested by the reconstruction of Le Manach et al. (2011). This estimate by Barnes-Mauthe et al. (2013) was based on a case study of Velondriake, a small fishing village, which was then extrapolated to the entire country using the fisher population numbers in Le Manach et al. (2011), with an additional 20% for land-based fishers. Catch rates by Barnes-Mauthee et al. (2013) were based on the Velondriake case study, with coefficients to account for fishing differences per coastal province. Our evaluation of their procedure suggests that this approach likely led to a catch over-estimate; thus, we maintain our original methods and catch amount here. Nevertheless, future research should carefully investigate changes in and the full scope of the small-scale fisheries sectors. Transition from 2014 to 2018 The reconstructed catch and update to 2014 was carried forward to 2018 using the semi-automated procedure described in Noël (2020) and FAO landing data to 2018. Semi-automated reconstructed catch data will later be replaced by a more detailed, research-intensive update. Marine biodiversity protection Madagascar has agreed to protect its biological diversity through the international Convention on Biological Diversity (Aichi), United Nations Convention on the Law of the Sea, the Ramsar Convention on Wetlands of International Importance, the International Coral Reef Initiative and the World Heritage Convention. Madagascar is also a signatory to Regional Treaties and Agreements such as the Regional Seas Convention (Marine Conservation Institute 2020).

2020 Fisheries Centre Research Reports 28(5)
86
Madagascar has 55 MPAs and three marine managed areas. The MPAs cover 54,042 km2 (Marine Conservation Institute, 2020), which equals 4.5% of the entire EEZ (1,200,330 km2; Le Manach et al. 2016). There are several stakeholders (NGOs, local communities and government) in Madagascar that played a key role in planning and managing MPAs in the country. Moreover, the MIHARY platform provides a site where information of LMMAs (locally managed marine areas) can be shared (MIHARY 2020). However, there is still a need for better coordination “[…] and integrating customary law into the set of regulations for marine conservation and sustainable management in Madagascar. […] [T]he current situation of MPA management is a mix of successful, effective conservation and missed opportunities in the field” (Ratsimbazafy et al. 2019). “Madagascar’s marine biodiversity supports 10 million people in some of the poorest communities in the world, including over 100,000 artisanal fishers who live near the coast and rely on healthy marine and coastal ecosystems for food, revenue, and livelihoods. […] In addition to conserving biodiversity, the marine parks protect cultural heritage and promote sustainable socioeconomic development to contribute to poverty reduction” (WCSNewsroom 2013). “When comparing Madagascar to other countries in the Western Indian Ocean Region, Madagascar seems to be more advanced in term of locally managed marine areas […]. The unique emergence of MPAs of all type in Madagascar can provide inspiration for countries, which are developing or redesigning their marine conservation strategy” (Ratsimbazafy et al. 2019). Mauritius The reconstruction of marine fisheries catches for the Republic of Mauritius was completed for 1950-2008 by Boistol et al. (2011), updated to 2010 (Boistol et al. 2016) and then to 2014 by the Sea Around Us. Here, the update is to 2017, and is based mainly on methods used previously. This update was subsequently carried forward to 2018 based on FAO (2020). Subsistence and recreational fisheries Data from Statistics Mauritius were utilized to update population and tourist numbers (Anon. 2011, 2014, 2018). The subsistence catch was derived from updated population data maintaining the previous subsistence rate from 2008 for Mauritius and Rodrigues Island separately. Recreational catch estimates utilized tourism numbers with a separate fishery for pelagic species and a near-shore lagoon fishery. A slight downward trend in the number of near-shore lagoon fishers was maintained. All subsistence and recreational fisheries catches were assumed to have been entirely unreported for 2011-2017. Artisanal fisheries Artisanal fisheries were included for Rodrigues Island and Mauritius, continuing the 2008 catch rates. There were also artisanal ‘bank fisheries’ and ‘FAD’ fisheries that were added from Statistics Mauritius as ‘St. Brandon inshore’ and FAD, respectively, and converted to wet weight where required (Suet et al. 2018). Industrial fisheries Industrial fisheries catches were adapted from Statistics Mauritius for ‘Bank fisheries’ (i.e., ‘offshore demersal shallow water banks’): ‘chilled’ (i.e., ‘semi-industrial chilled and frozen fish’), and ‘deep-sea’ (i.e., ‘offshore banks deep water snappers’). The catch of the artisanal FAD fishery was deemed fully reported, while other artisanal fisheries were only partially reported. The industrial ‘chilled’ and ‘deep-sea’ fisheries were considered fully reported and the remaining industrial fisheries partially reported.

Updating to 2018 the 1950-2010 marine catch reconstructions of the Sea Around Us: Part I – Africa, Antarctica, Europe and the North Atlantic
87
Figure 2. Reconstructed domestic catch for Mauritius by fishing sector for 1950-2018. Industrial fisheries for large pelagic species For the reported data portions, we followed existing methods. These methods were compared with National Mauritius Statistics (Suet et al. 2018) and Indian Ocean Tuna Commission (IOTC) data (IOTC 2019). Since industrial catches of tunas, billfish and other large pelagic species are estimated separately by the Sea Around Us (Coulter et al. 2020), the reconstruction of their catch is not detailed here. However, it may suffice to mention that the IOTC data were used to separate small-scale catch from industrial catch. ‘Bigeye tuna’ (Thunnus obesus), ‘Black marlin’ (Istiompax indica), ‘Marlins, sailfish, nei’, ‘Striped marlin’ (Kajikia audax), and ‘Swordfish’ (Xiphias gladius) were considered 100% industrial and not included here. On the other hand, we included the artisanal portion of ‘Albacore’ (Thunnus alalunga), ‘Common dolphinfish’ (Coryphaena hippurus), ‘Indo-Pacific sailfish’ (Istiophorus platypterus), ‘Sharks, rays, skates, nei’, ‘Skipjack tuna’ (Katsuwonus pelamis), ‘Wahoo’ (Acanthocybium solandri) and ‘Yellowfin tuna’ (Thunnus albacares). Transition from 2017 to 2018 and beyond The reconstructed catch update to 2017 was carried forward to 2018 using the semi-automated procedure described in Noël (2020) and FAO landing data to 2018. Semi-automated catch data will later be replaced by a more detailed, research-intensive update. The original reconstruction (Boistol et al. 2011) was constrained by the total landings published by the FAO, rather than by the sum of their catch by taxon. Here, we continued to use the original methods and utilize only the FAO total rather than FAO’s taxonomic groupings as constraints. The taxonomic breakdown in relation to reported FAO landings should be revisited in future updates. Marine biodiversity protection Mauritius has agreed to protect its biological diversity through the international Convention on Biological Diversity (Aichi) and the Ramsar Convention on Wetlands of International Importance (Marine Conservation Institute 2020). “Multiple protection and conservation measures have been implemented in an effort to protect coastal and marine biodiversity, improve catches, and control fishing efforts. The protective instruments include time and area closures, gear restrictions, and implementation of various types of marine protected areas (MPAs) and

2020 Fisheries Centre Research Reports 28(5)
88
voluntary no-take (VNT) areas. […] Other strategies for protection of the seas of Mauritius include protection of offshore islets, declaration of world heritage sites, and application of Integrated Coastal Zone Management (ICZM). […] The ICZM has been legislated under the Environmental Protection Act of 2002, which makes provision for a multi-stakeholder committee for developing integrated management plans, monitoring of resources, and providing recommendations on protection and management of coastal zones, islets, and offshore islands. An ICZM framework and plans have been developed for targeted zones. Moreover, coral reef active rehabilitation remains in its infancy in Mauritius, as only coral farming and nurseries have been in practice so far. […] Successful examples include banning of sea cucumber fishing, seasonal closure of octopus (August to October) and mullet fisheries” (Bhagooli and Kaullysing 2019). Mauritius has 31 MPAs and three marine managed areas. The MPAs’ extent is 10.4 km2, which is less than 0.05% of the country’s EEZ (1,272,765 km2; Boistol et al. 2011). However, in the northwest of Mauritius, Balaclava marine park, designated in 1997, (Marine Conservation Institute 2020) has remained unimplemented as a result of a conflict between hotels and fishers. The management authority is the government of Mauritius, which controls activities and visitors in its 4.85 km2. This area includes a single conservation zone of 1.67 km2, a multiple use zone of 3.13 km2, and a Ski Lane of 0.3 km2 (Bhagooli and Kaullysing 2019). Mayotte (France) Mayotte’s marine fisheries catches were reconstructed for the years 1950 to 2010 by Doherty et al. (2015, 2016), updated to 2014 by the Sea Around Us, and here updated to 2017 with new reported data from FAO (2019), followed by a forward carry to 2018. The FAO reported total catch was higher than the estimated domestic catch from 1998 to 2003; for these years, we followed the original reconstruction methods (Doherty et al. 2015) and identified the excess catches following comparison to IOTC (2019) data and reallocated excess reported catch to fishing within La Réunion or the French mainland. Non-tuna industrial fisheries were carried forward as constant for 2011-2017; see below for the tuna catch. Subsistence and artisanal fisheries Reported catch data for non-large pelagic taxa were split into the artisanal and subsistence ‘pirogues & barques’ fisheries using observed trends of an increasing artisanal ratio reaching 61% in 2016. The unreported ratios of ‘pirogues & barques’ fisheries were updated using the original reconstruction methods and updated effort data while maintaining the taxonomic breakdown. Effort data was also utilized to update the artisanal longline fishery and accompanying unreported shark catch, carrying this fishery forward using the 2010 catch rates. Subsistence shore-fishing catches were split into reef-gleaning and djarifa (fishing using nets from cotton sheets or mosquito nets), while maintaining the original ratios and taxonomic breakdown. This update also continued the use of declining per capita catch trend, combined with recent population numbers from the National Statistic Centre (INSEEE). Recreational catches Maintaining a declining per tourist catch rate and utilizing recent INSEE tourism statistics for tourist arrivals, the recreational spear and sport fisheries components were updated to 2017. Commercial fisheries for large pelagic fish Reported FAO data were compared to the data reported by the Indian Ocean Tuna Commission (IOTC 2019) to separate industrial from small-scale tuna catches; here, the former were excluded as they were addressed separately for all countries (Coulter et al. 2020). For all categories except ‘Marine fishes nei’, the artisanal or ‘pirogues & barques’ tuna catch from IOTC was used (rather than the larger FAO landings) for each of the

Updating to 2018 the 1950-2010 marine catch reconstructions of the Sea Around Us: Part I – Africa, Antarctica, Europe and the North Atlantic
89
pertinent taxonomic categories. Using the original methods, we retroactively changed the reported data to match the most updated information from 1998 onward (Figure 3). Poaching in Mayotte A prefectoral decree was declared in 2004 prohibiting the fishing, transport, packaging, sale or purchase of sea cucumbers (holothurians) throughout the territory (land and sea) of Mayotte. Nevertheless, there is poaching, whose extent is difficult to estimate. However, this industry is mostly attracted to turtle poaching, which is easier, has higher yields and is mostly directed toward the domestic market, sparing the poachers from having to negotiate with middlemen for shipping their catches abroad. There is no local consumption of echinoderms. Populations of high-value species (Holothuria nobilis, expensive Actinopyga spp.' and H. scabra seems extremely rare) have declined in shallow waters. Population levels for high-value species (Thelonota anax, Stichopus herrmanni, H. fuscogilva) in deep waters appear to be still abundant, or at least in better shape than in most surrounding countries (Frédéric Ducarme, pers. comm, May 5, 2020). This may be linked to the fact that most people in Mayotte (including fishers) cannot swim and do not have snorkeling or diving gear, leaving only the intertidal space available for poachers (Frédéric Ducarme, pers. comm, May 5, 2020). Transition from 2017 to 2018 The catch reconstructed to 2017 was carried forward to 2018 using the semi-automated procedures outlined in Noël (2020) and reported landings for 2018 provided by the FAO. Semi-automated reconstructed catch data will later be replaced by a more detailed, research-intensive update.
Figure 3. Reconstructed domestic catch in Mayotte’s EEZ by fishing sector for 1950-2018. Marine biodiversity protection The Mayotte Marine Natural Park (PNMM) was created by a presidential decree on January 18, 2010 and covers Mayotte’s EEZ (43,430 km2; Doherty et al. 2016) including the lagoon. It was the first Marine Natural Park that France created overseas and the second largest French MPA. The French Agency for Biodiversity (AFB) supports the Park with the necessary technical, human and financial resources (Terrigeol et al. 2019). The development, implementation and monitoring policies are responsibility of the Department of Environment, Planning and Housing (DEAL) of Mayotte. The Mayotte Biodiversity Strategy for Sustainable Development 2013-2020 includes the National Strategy for Biodiversity 2011-2020 and actions from the Local Action Plan to protect marine species. Marine mammals and sea turtles are also protected on a national scale by inter-ministerial decrees of July 2011 and October 2005, respectively (OFB 2019). “In Mayotte, the protection of species is mainly carried out through the lists of regional protected species: […] regulating

2020 Fisheries Centre Research Reports 28(5)
90
navigation, mooring and scuba diving [… and] regulating the exercise of sea fishing in the waters of Mayotte” (OFB 2019). “Mayotte coral reefs would be one of the most diverse for the Indian Ocean area, with 664 species, against 596 for Reunion and between 423 and 468 for Juan de Nova and Europa, respectively (Chabanet 2012). […] The economic value of the coral reefs (and associated ecosystems) of Mayotte has been estimated at 28 M € per year” (Bigot et al. 2019). Therefore, in 1998, the Mayotte Coral Reef Observatory was created with the objective to monitor the health of coral reefs (OFB 2019). Another site of ecological importance in Mayotte is the Ramsar site, ‘La Vasière des Badamiers’, which was designated in 2011, and covers 1.15 km2. The site consists of a mud flat area partially covered by mangroves and sea grass beds. It is a highly productive ecosystem, offering wintering, feeding and breeding habitats for many species of birds, fish and green turtles (Ramsar sites information service 2020). Among the threats that affect Mayotte’s waters and marine ecosystems are demographic growth, pollution, deforestation and coastal and terrestrial constructions (Bigot et al. 2019; Ramsar sites information service 2020). More monitoring to protect species and ecosystems from illegal practices is still needed. “[…] difficulties of control and supervision may render protected areas non-operational, leaving for example any act of poaching unpunished. Another limit, directly affects the recognition of the target species (an obvious prerequisite for respecting the law), notably the lack of expertise of the local population in the identification of protected species” (Terrigeol et al. 2019). Réunion (France) The catch reconstruction of fisheries in La Réunion from 1950 to 2010 was completed by Le Manach et al. (2015, 2016). This update extends the original catch reconstruction to 2015, and was subsequently forward carried to 2018. The taxonomic breakdown in the FAO data was split into two groups: taxa that appeared in both FAO data and the IOTC nominal catch database (IOTC 2016), and taxa that appeared only in FAO data. IOTC taxa were allocated to industrial and artisanal sectors based on IOTC ratios per sector. Industrial catches of large pelagic taxa were accounted for in a separate study by Coulter et al. (2020). As well, 90% of industrial Elasmobranchii catches were assigned to catches of blue shark (Prionace glauca). Discards from the industrial sector for the domestic catches and catches outside the EEZ of IOTC species were calculated using the same assumptions for 2010 (Le Manach et al. 2015). Landings and discards for the industrial sector for Réunion-flagged fisheries were spatially allocated to the EEZs of La Réunion, Madagascar, Mauritius, and the Mozambique Channel Islands, as well as to the high seas, using estimated ratios from Le Manach et al. (2015). Artisanal vs industrial fisheries FAO landings data of non-IOTC taxa, i.e., taxa other than large pelagic taxa, were allocated to the artisanal and industrial sectors using ratios for 2010 as calculated in Le Manach et al. (2015), except for Carangidae, Clupeidae, and Natantian decapods, who were allocated entirely to the artisanal fishery. However, the snappers Lethrinus mahsena and L. variegatus were allocated to the industrial sector. Unreported catches of L. mahsena and L. variegatus were assumed to be 20% of reported catches. Both reported and unreported catches of industrial non-IOTC fish taxa were spatially allocated as 20% to Madagascar EEZ and 80% to Mauritius EEZ.

Updating to 2018 the 1950-2010 marine catch reconstructions of the Sea Around Us: Part I – Africa, Antarctica, Europe and the North Atlantic
91
The unreported catch for the artisanal fisheries of La Réunion was calculated for IOTC and non-IOTC taxa with the following assumptions:
• Unregistered fishers were assumed to land catches equal to landings by registered fishers. • Recreational catches were assumed to be equal to 50% of registered catches. • Registered artisanal fishers also were assumed to have landed unreported catches: 10% of reported
catches for IOTC species, and 25% of reported catches for non-IOTC species. Furthermore, it was noted that both FAO data and IOTC data were retroactively changed in the 2000s; these changes will need to be reviewed in future updates. Recreational catches Local recreational shore fishing rates were estimated for La Réunion by calculating the ratio of population to shore fishing landings for 2008 to 2010: this relationship was carried forward to 2015 with population data from INSEE (2016). Catches from this sector were allocated to “Marine fishes not identified”, as in Le Manach et al. (2015). Transition from 2015 to 2018 The catch reconstructed to 2015 was carried forward to 2018 using the semi-automatic procedure outlined in Noël (2020), based on FAO reported landings data available to 2018. The reconstructed catch data carried forward will later be replaced by a more detailed, research intensive update. Also note that prior to the semi-automatic process, retroactive changes were made to update the reported data to match the latest version of FAO data. Marine biodiversity protection In 1997, the Marine Park of Reunion was created and ten years later transformed into the Marine Natural Reserve of Réunion (RNMR). Its extent is 35 km2 (Marine Conservation Institute 2020), which is tiny compared with the EEZ of Réunion (>315,000 km2; Le Manach et al. 2016). Only 8% of Réunion’s coral reef area is within the limits of the reserve. Moreover, the RNMR is not a 100% no-take. There are 3 different zones of protection: a general use zone (45%), an area of reinforced protection (50%) where extraction is banned with certain exceptions, and an area under full protection, or “sanctuary” (5% of the area, or less than 2 km2), where only research and monitoring are allowed (Bigot et al. 2019). In 1998, the Global Coral Reef Monitoring Network (GCRMN) started with ten stations inside the reserve (RNMR). Since that year, the coral community has decreased by an average of 25-30% while algae have increased from <20% to 40–50% over the same period (Bigot 2008). “For fish, the reserve’s effect was visible in all sanctuary zones (5% of the overall reserve) and was statistically significant for fore reefs of La Saline and Saint-Leu. Biomass increased by 67%, the proportion of biomass normally taken by fisheries increased by 78%, and the biomass of commercially targeted species increased 900%. Species richness also increased. […] An increase in live coral cover was, however, noted in the sanctuary of la Saline on the fore reef though overall cover remains relatively low (18%). The encouraging results within the sanctuaries emphasize their value. However, restoration of fish populations takes several decades, requiring regular monitoring to adjust management measures when these become necessary” (Bigot et al. 2019). The Réunion marine and coastal habitats function as nurseries for many species that are being affected by threats such as population growth, increasing coastal use and pollution, among others (Bigot et al. 2019).

2020 Fisheries Centre Research Reports 28(5)
92
Seychelles A reconstruction of the Seychelles’ marine fisheries catches covering the years 1950 to 2010 was completed by Le Manach et al. (2015, 2016), and updated to 2017 by Christ et al. (2020). Data from FAO (2018) and the Indian Ocean Tuna Commission (IOTC 2019) were used to update these reconstructed catches to 2017, which subsequently were carried forward to 2018 using the procedure in Noël (2020). Artisanal catches of tuna and billfish from the IOTC were used to separate industrial catches of tuna and billfish from those of artisanal fisheries; the industrial component addressed in Coulter et al. (2020). As the previous reported catch baseline did not match the FAO data in taxonomic categories or total catch, we retroactively changed these data from 1950 onward (Figure 4). We improved the taxonomic disaggregation within the FAO family categories with reports by taxon from the Seychelles Fishing Authority (SFA 1991; Nevill et al. 2007; SFA 2015, 2016b).
Figure 4. Reconstructed domestic catch within the Seychelles by fishing sector for 1950-2018.
Artisanal fisheries The numbers of registered vessels per vessel type (pirogues, outboards, whalers, schoolers, and others) were available from the SFA from 1985. We interpolated vessel numbers backward for outboards, whalers, and schooners to their respective known years of introduction of each vessel type, i.e., 1980, 1958, and 1974, respectively. We compared the reported number of pirogues in 1985 to the population, which resulted in a fisher factor 0.002 pirogues/person. We doubled this rate for 1950, considering that pirogues were the only vessel available at the time and interpolated the rate between 1950 and 1985. We multiplied the population by this rate of pirogues to derive the likely number of pirogues for 1950-1984. We updated the total artisanal catch from 1950 using the original catch per vessel methods in Le Manach et al. (2015). With updated vessel numbers, catch rates, crew size, days fished and percentage of gear usage from the SFA (1991; 2016b), we multiplied the number of vessels per gear type by the catch rate. For reported artisanal landings, we disaggregated the FAO reported family categories using reports, by taxon, from the Seychelles Fishing Authority (SFA 1991; Nevill et al. 2007; Daw et al. 2011; SFA 2015, 2016b). For unreported artisanal landings, we utilized reports by the Seychelles Fishing Authority (SFA 1991; Nevill et al. 2007; SFA 2015, 2016b). We interpolated between 1990 and 2015, and the taxonomic composition was assumed to be consistent before and after these anchor points.

Updating to 2018 the 1950-2010 marine catch reconstructions of the Sea Around Us: Part I – Africa, Antarctica, Europe and the North Atlantic
93
Subsistence fishing We introduced a subsistence sector for the entire period using the available data on population, the number of households, the proportion of fisher households, family size, and consumption rate. In 2010, 71% of total fisher households (or 14% of total households in the Seychelles) engaged in subsistence fishing (Anon. 2012). For 1950, we assumed that 100% of all fisher households in the Seychelles would engage in subsistence fishing, and linearly interpolated between these two anchor points (100% in 1950 and 71% in 2010). We extended the declining number of subsistence households for 2010-2017. To estimate the subsistence catch for 1950-2017, we multiplied the number of subsistence fisher households by family size and per capita supply based on estimated artisanal catch consumption rates of 110 kg·person-1·year-1 in 1990 and 88 kg·person-1·year-
1 in 2017 (Wilson 1994; The World Bank 2018). Due to the absence of subsistence catch data from the SFA statistical reports, we considered all subsistence catches to be unreported. We assumed the taxonomic breakdown for the subsistence fishery is equivalent to the low-value artisanal landings of finfish and octopus. Recreational fishing In 1991, the SFA (1991) released a comprehensive 5-year report on sport fishing; we included these data as the recreational catch for the years covered (1985-1990). We assumed, for the rest of the time period, that the average vessel catch rate was that of the reported years (1985-1990). Then, the 1985 catch per vessel was held constant back to 1970 and multiplied by the number of charter vessels in reported anchor years (1996-2001), and the 1990 catch per vessel was held constant to 2017 and multiplied by the number of charter vessels for each year. Following Le Manach et al. (2015), we filled the gaps by interpolating between ratios of recreational to artisanal catch for the remaining years. The breakdown for the recreational sector was held constant for the entire time period based on 80% reported sport fishing landings and 20% targeted demersal taxa (SFA 1988, 1991; Anon. 2017d). Fisheries for large pelagics The Seychelles industrial and semi-industrial catches of tunas and billfish and associated shark by-catch from the Western and Eastern Indian Ocean were incorporated into the Sea Around Us database documented in Coulter et al. (2019). Marine biodiversity protection The Seychelles have agreed to protect their biological diversity through the international Convention on Biological Diversity (Aichi) and the Ramsar Convention on Wetlands of International Importance (Marine Conservation Institute 2020). The Seychelles are also a signatory to Regional Treaties and Agreements such as the Natura 2000 and are also part of the international network of UNESCO Man and the Biosphere (Marine Conservation Institute 2020). The Seychelles have 33 MPAs and three marine managed areas. The MPAs’ extent is 258 km2 (Marine Conservation Institute 2020), which is tiny relatives to their huge EEZ (1,331,964 km2; Le Manach et al. 2016). However, a planned for, but unimplemented MPAs will potentially cover 208,332 km2 (16% of the entire EEZ), of which a highly protected part will cover 71,665 km2 (Marine Conservation Institute 2020). St Anne Marine National Park was the first MPA established in the Seychelles and in the Western Indian Ocean (in 1973 and covering 9 km2; Marine Conservation Institute 2020). Achieving the MPA’s conservation goals is threatened by poaching, coastal development and unsustainable tourism. Moreover, bottom-up approaches together with community participation and involvement in decision making are also needed (Cockerell and Jones 2020). These governance issues are also found in the Curieuse Marine National Park (designated in in 1979 covering 12 km2 of water; Marine Conservation Institute 2020). Here the inability to

2020 Fisheries Centre Research Reports 28(5)
94
implement economic incentives by not fully capitalizing on the use and non-use values of the park is clearly visible. “Furthermore, the capacity of the state management institution is being eroded through a focus on the development of an extensive network of new marine protected areas under the direction of an international non-governmental organisation” (Clifton et al. 2019). No-fishing areas in the Seychelles hold on average 75% greater fish biomass, especially herbivorous, than fished areas (Graham et al. 2020). “Indeed, herbivorous fish have sustained reef-associated trap fisheries landings in Seychelles following the 1998 coral bleaching event (Robinson et al. 2019). The role of marine reserves in exporting herbivorous fish to fisheries through adult spillover or larval export is likely to be substantial and could play a key role in continued food security as coral reefs degrade through climatic impacts (Hopf et al. 2019)” (Graham et al. 2020). The Red - and CITES-listed humphead wrasse (Cheilinus undulatus) could benefit from no-take areas, but it is recommended that these areas have a buffer zone to also protect females, which may range further than the males (Daly et al. 2020). Discussion The countries and territories that occur in the Mozambique Channel and surround Madagascar all share a reliance on small-scale fisheries for domestic food security. However, these artisanal and subsistence fisheries are often difficult to track and are not reliably included within official catch statistics reported to the FAO. In order to estimate the catches from these small-scale fisheries, we utilized per capita consumption and catch-per-unit-effort based methods to reconstruct catches and compare these estimates with reported statistics. We have used whatever data were available to reconstruct catches from all fisheries within these countries to provide our best estimate of the total removal by all fishing sectors and fishing practices within these areas. We welcome feedback from collaborators to continue to improve upon our reconstructed estimates. Acknowledgements Funding for the work presented here was provided by the Minderoo Foundation, by the Marisla, Oak, and David and Lucille Packard Foundations, and by the Bloomberg Philanthropies through Rare. References (by country) Comoros AfDB. 2017. African Statistical Yearbook 2017. A.C.F. Statistics. Addis Ababa, Ethiopia: ECA Printing and
Publishing Unit. Anon. 2014. Statistiques Comores: Base de données socio-économiques, Banque Africaine de Développement. Doherty, B., M. Hauzer and F. Le Manach. 2015. Reconstructing catches for the Union of the Comoros: uniting
historical sources of catch data for Ngazidja, Ndzuwani and Mwali from 1950–2010, p.1-11. In: F. Le Manach and D. Pauly (eds). Fisheries catch reconstructions in the Western Indian Ocean, 1950–2010. Fisheries Centre Research Reports 23(2).
Doherty, B., M. Hauzer and F. Le Manach. 2016. Comoros, p. 225. In: D. Pauly and D. Zeller (eds). Global Atlas of Marine Fisheries: A Critical Appraisal of Catches and Ecosystem Impacts. Island Press, Washington, DC.
FAO. 2018. Fishery Statistical Collections [Online]. Food and Agriculture Organization of the United Nations (FAO), Rome (Italy).
Greer, K., D. Zeller, J. Woroniak, A. Coulter, M.L.D. Palomares and D. Pauly. 2019. Global trends in carbon dioxide (CO2) emissions from fuel combustion in marine fisheries from 1950-2016. Marine Policy, 107: 103382.
Hauzer, M., C. Poonian and C. Moussa Iboura. 2008. Mohéli marine park, comoros successes and challenges of the co-management approach, p. 83-92. In: D.O. Obura, J. Tamelander and O. Linden (Eds). Ten

Updating to 2018 the 1950-2010 marine catch reconstructions of the Sea Around Us: Part I – Africa, Antarctica, Europe and the North Atlantic
95
years after bleaching – facing the consequences of climate change in the Indian Ocean. CORDIO States Report 2008. Coastal Oceans Research and Development in the Indian Ocean/Sida-SAREC. Mombasa.
Marine Conservation Institute. 2020. MPAtlas [Online]. Seattle, WA. Available at: www.mpatlas.org Noël, S.-L. 2020. Semi-automation procedure for catch reconstruction forward carry, p. 15-20. In: B. Derrick,
M. Khalfallah, V. Relano, D. Zeller and D. Pauly (eds). Updating to 2018 the 1950-2010 Marine Catch Reconstructions of the Sea Around Us: Part I – Africa, Antarctica, Europe and the North Atlantic. Fisheries Centre Research Report 28(5).
Soilihi, A.S. 2013. Union des Comores - rapport national destiné au Comité scientifique de la Commission des thons de l'océan Indien, 2013. 16th Session of the Scientific Committee, Indian Ocean Tuna Commission, Pusan, Republic of Korea.
Soilihi, A.S. 2017. Union des Comores Rapport national destiné au Comité scientifique de la Commission des thons de l’Océan Indien, 2017, IOTC–2017–SC20–NR03. IOTC, Seychelles. 8 p.
UNEP-WCMC and IUCN. 2020. Protected Planet: Protected Area Profile for Komoros Island from the World Database of Protected Areas, June 2020. Available at: https://www.protectedplanet.net/country/KM
Youssouf Abdou, A. 2012. Scientific Information for marine protected areas in the Union of Comoros-EBSAs. Southern Indian Ocean regional workshop to facilitate the description of ecologically or biologically significant marine areas, Convention on Biological Diversity (CBD). Flic en Flac, Mauritius. 31 July to 2 August, 2012. Available at: www.cbd.int/doc/meetings/mar/ebsa-sio-01/other/ebsa-sio-01-comoros-en.pdf
Îles Éparses /Mozambique Channel Islands Anon. 2014. 2 navires de pêche épinglés aux Îles Éparses. LINFO.re, 1 January, 2014. Available at:
www.linfo.re/ocean-indien/madagascar/2-navires-de-peche-epingles-aux-iles-eparses. Anon. 2014. Opération de lutte contre la pêche illégale aux Îles Éparses. Archives, Missions, TAAF. Available
at: www.fagers.fr/2014/04/08/operation-de-lutte-contre-la-peche-illegale-aux-iles-eparses/ Anon. 2015. FAZSOI: pêche illicite dans l'archipel des Glorieuses. Communauté Défense, Ministère des
armées, France. Available at: www.defense.gouv.fr/actualites/communaute-defense/fazsoi-peche-illicite-dans-l-archipel-des-glorieuses
Anon. 2016. Canal du Mozambique: le Floréal lutte contre la pêche illégale. À la Une, Ministère des armées, France. Available at: www.defense.gouv.fr/marine/a-la-une/canal-du-mozambique-le-floreal-lutte-contre-la-peche-illegale
Le Manach, F. and D. Pauly. 2015. First estimate of unreported catch in the French Îles Éparses, 1950–2010, p. 27–35. In: F. Le Manach and D. Pauly (eds). Fisheries catch reconstructions in the Western Indian Ocean, 1950–2010. Fisheries Centre Research Reports 23(2).
Le Manach, F. and D. Pauly. 2016. France (Îles Éparses), p. 259. In: D. Pauly and D. Zeller (eds). Global Atlas of Marine Fisheries: A Critical Appraisal of Catches and Ecosystem Impacts. Island Press, Washington, DC.
Marine Conservation Institute. 2020. MPAtlas [Online]. Seattle, WA. Available at: www.mpatlas.org Noël, S.-L. 2020. Semi-automation procedure for catch reconstruction forward carry, p. 15-20. In: B. Derrick,
M. Khalfallah, V. Relano, D. Zeller and D. Pauly (eds). Updating to 2018 the 1950-2010 Marine Catch Reconstructions of the Sea Around Us: Part I – Africa, Antarctica, Europe and the North Atlantic. Fisheries Centre Research Report 28(5).
Obura, D. and J. Ardron. 2020. Iles Éparses (part of the Mozambique Channel). In: D. Obura, J. Church, and C. Gabrié (eds). UNESCO World Heritage report: Assessing Marine World Heritage from an Ecosystem Perspective: The Western Indian Ocean. Available at: www.cbd.int/doc/meetings/mar/ebsa-sio-01/other/ebsa-sio-01-cordio-03-en.pdf
Ramsar sites information service. 2020. Île d’Europa. Available at: rsis.ramsar.org/ris/2073 VLIZ. 2020. Assessing potential World Heritage marine sites in the Western Indian Ocean - The Iles Éparses
(Scattered Islands). Available at: www.vliz.be/projects/marineworldheritage/sites/1.4_Iles%20Eparses.php?item=The%20Indian%20Ocean
Zeller, D. and D. Pauly. 2016. Marine fisheries catch reconstruction: definitions, sources, methods and challenges, p. 1- 33. In: D. Pauly and D. Zeller (eds). Global Atlas of Marine Fisheries: A critical appraisal of catches and ecosystem impacts. Island Press, Washington D.C.

2020 Fisheries Centre Research Reports 28(5)
96
Madagascar Balgobin, D. and A. Iharimamy. 2016. Annuaire des statistiques environnementales sous le Cadre pour le
Développement des Statistiques sur l’Environnement (CDSE) – 2016. Madagascar, 126 p. Barnes-Mauthe, M., K.L.L. Oleson and B. Zafindrasilivonona. 2013. The total economic value of small-scale
fisheries with a characterization of post-landing trends: An application in Madagascar with global relevance. Fisheries Research, 147: 175-185.
Coulter, A., T. Cashion, A. Cisneros-Montemayor, S. Popov, G. Tsui, F. Le Manach, L. Schiller, M. Palomares, D. Zeller and D. Pauly. 2020. Using harmonized historical catch data to infer the expansion of global tuna fisheries. Fisheries Research, 221:105379. doi.org/10.1016/j.fishres.2019.105379.
FAO. 2020. FAO yearbook. Fishery and Aquaculture Statistics 2018/FAO annuaire. Statistiques des pêches et de l'aquaculture 2018/FAO anuario. Estadísticas de pesca y acuicultura 2018. Rome/Roma.
Le Manach, F., C. Gough, F. Humber, S. Harper and D. Zeller. 2011. Reconstruction of total marine fisheries catches for Madagascar (1950-2008), p. 21-37. In: S. Harper and D. Zeller (eds). Fisheries catch reconstructions: Islands, Part II. Fisheries Centre Research Reports 19(4).
Le Manach, F, C. Gough, A. Harris, F. Humber, S. Harper, and D. Zeller. 2016. Madagascar, p. 322. In: D. Pauly and D. Zeller (eds). Global Atlas of Marine Fisheries: A Critical Appraisal of Catches and Ecosystem Impacts. Island Press, Washington, DC.
Marine Conservation Institute. 2020. MPAtlas [Online]. Seattle, WA. Available at: www.mpatlas.org MIHARY. 2020. Madagascar Locally Managed Marine Area Network. Available at: mihari-network.org/ Noël, S.-L. 2020. Semi-automation procedure for catch reconstruction forward carry, p. 15-20. In: B. Derrick,
M. Khalfallah, V. Relano, D. Zeller and D. Pauly (eds). Updating to 2018 the 1950-2010 Marine Catch Reconstructions of the Sea Around Us: Part I – Africa, Antarctica, Europe and the North Atlantic. Fisheries Centre Research Report 28(5).
Palomares, M.L.D., B. Derrick, R. Froese, J. Meeuwig, S.-L. Noël, G. Tsui, J. Woroniak, D. Zeller, and D. Pauly. 2020. Fishery biomass trends of exploited fish populations in marine ecoregions, climatic zones and ocean basins. Estuarine, Coastal and Shelf Science 243 : 06896. doi.org/10.1016/j.ecss.2020.106896
Ratsimbazafy, H., T. Lavitra, M. Kochzius and J. Huge. 2019. Emergence and diversity of marine protected areas in Madagascar. Marine Policy, 105:91-108.
Razafimandimby, Y. and L.D. Joachim. 2017. Update on shark catch characteristics by national longline fleets in Madagascar (2010-2016), IOTC-2017-WPEB13-11. 13th Working Party on ecosystems and bycatch. IOTC, Spain. 11p.
The World Bank. 2018. World Population. Available at: data.worldbank.org/indicator/sp.pop.totl. WCSNewsroom. 2015. Madagascar Creates Nation’s First Community-Led Marine Protected Areas.
WCSNewsroom, April 22, 2015. Available at: newsroom.wcs.org/News-Releases/articleType/ArticleView/articleId/6709/April-22-Madagascar-Creates-Nations-First-Community-Led-Marine-Protected-Areas.aspx#:~:text=NEW%20YORK%20(April%2022%2C%202015,WCS%20(Wildlife%20Conservation%20Society).
Yvergniaux, Y. and D. Signa. 2013. Enhancing value-chain performance for mud crab in Madagascar. Smart Fiche 3, FAO.
Mauritius Anon. 2011. Survey of Inbound Tourism Year 2010. Statistics Mauritius. Republic of Mauritius. Anon. 2014. 2011 Housing and Population Census. Statistics Mauritius Population Data Evaluation. Ministry of
Finance and Economic Development, Republic of Mauritius. Anon. 2018. International Travel & Tourism Year 2017. Statistics Mauritius. Republic of Mauritius. Bhagooli, R. and D. Kaullysing. 2019. Seas of Mauritius, p. 253-277. In: C. Sheppard (ed). World Seas: An
Environmental Evaluation. Academic Press, London, UK. Boistol, L., S. Harper, S. Booth and D. Zeller. 2011. Reconstruction of marine fisheries catches for Mauritius and
its outer islands, 1950-2008, p. 39-61. In: S. Harper and D. Zeller (eds). Fisheries catch reconstructions: Islands, Part II. Fisheries Centre Research Reports 19(4).
Boistol, L., S. Harper, S. Booth, and D. Zeller. 2016. Mauritius, p. 330. In: D. Pauly and D. Zeller (eds). Global Atlas of Marine Fisheries: A Critical Appraisal of Catches and Ecosystem Impacts. Island Press, Washington, DC.
Coulter, A., T. Cashion, A. Cisneros-Montemayor, S. Popov, G. Tsui, F. Le Manach, L. Schiller, M. Palomares, D. Zeller and D. Pauly. 2020. Using harmonized historical catch data to infer the expansion of global tuna fisheries. Fisheries Research, 221:105379. doi.org/10.1016/j.fishres.2019.105379.

Updating to 2018 the 1950-2010 marine catch reconstructions of the Sea Around Us: Part I – Africa, Antarctica, Europe and the North Atlantic
97
FAO. 2020. Fishery Statistical Collections [Online]. Food and Agriculture Organization of the United Nations (FAO), Rome, Italy.
IOTC. 2019. IOTC Online Data Querying Service [Online]. Available: www.iotc.org/iotc-online-data-querying-service.
Marine Conservation Institute. 2020. MPAtlas [Online]. Seattle, WA. Available at: www.mpatlas.org Noël, S.-L. 2020. Semi-automation procedure for catch reconstruction forward carry, p. 15-20. In: B. Derrick,
M. Khalfallah, V. Relano, D. Zeller and D. Pauly (eds). Updating to 2018 the 1950-2010 Marine Catch Reconstructions of the Sea Around Us: Part I – Africa, Antarctica, Europe and the North Atlantic. Fisheries Centre Research Report 28(5).
Suet, L.F.C.K., D. Balgobin and L.K. Dindoyal. 2018. Digest of Environmental Statistics – 2017. Ministry of Finance and Economic Development, Port Louis, Mauritius.
Mayotte (France) Bigot, L., P. Chabanet, P. Cuet, B. Cauvin, P. Durville, T. Mulochau, O. Naim, J.B. Nicet, E. Tessier, B.
Thomassin and J. Wickel. 2019. French Territories in the Western Indian Ocean, p. 279-302. In: C. Sheppard (ed). World Seas: An Environmental Evaluation (Second Edition): Vol. II: the Indian Ocean to the Pacific. Academic Press, London, UK.
Chabanet, P. 2012. Impacts des perturbations sur les poissons récifaux océan indien. Presses Académiques Francophones (PAF), Saarbrücken, Germany. 165p.
Coulter, A., T. Cashion, A. Cisneros-Montemayor, S. Popov, G. Tsui, F. Le Manach, L. Schiller, M. Palomares, D. Zeller and D. Pauly. 2020. Using harmonized historical catch data to infer the expansion of global tuna fisheries. Fisheries Research, 221:105379. doi.org/10.1016/j.fishres.2019.105379.
Doherty, B., J. Herfaut, F. Le Manach, S. Harper and D. Zeller. 2015. Reconstructing domestic marine fisheries in Mayotte from 1950-2010, p.53-65. In: F. Le Manach and D. Pauly (eds). Fisheries catch reconstructions in the Western Indian Ocean, 1950-2010. Fisheries Centre Research Reports 23(2).
Doherty, B., F. Le Manach, and J. Herfaut. 2016. France (Mayotte), p. 262. In: D. Pauly and D. Zeller (eds). Global Atlas of Marine Fisheries: A Critical Appraisal of Catches and Ecosystem Impacts. Island Press, Washington, DC.
FAO. 2019. Fishery Statistical Collections [Online]. Food and Agriculture Organization of the United Nations (FAO), Rome (Italy).
IOTC. 2019. IOTC Online Data Querying Service. Available at: www.iotc.org/iotc-online-data-querying-service.
Le Manach, F., P. Chavance, A.M. Cisneros-Montemayor, A. Lindop, A. Padilla, L. Schiller, D. Zeller and D. Pauly. 2016. Global catches of large pelagic fishes, with emphasis on the High Seas, p. 34-45. In: D. Pauly and D. Zeller (eds). Global Atlas of Marine Fisheries: A critical appraisal of catches and ecosystem impacts. Island Press, Washington D.C.
Noël, S.-L. 2020. Semi-automation procedure for catch reconstruction forward carry, p. 15-20. In: B. Derrick, M. Khalfallah, V. Relano, D. Zeller and D. Pauly (eds). Updating to 2018 the 1950-2010 Marine Catch Reconstructions of the Sea Around Us: Part I – Africa, Antarctica, Europe and the North Atlantic. Fisheries Centre Research Report 28(5).
OFB. 2019. Parc naturel marin de Mayotte - Rapport d’activités 2018. Available at: www.aires-marines.fr/L-Office/Organisation/Parcs-naturels-marins/mayotte/Documents/Rapport-d-activites-2018-du-Parc-naturel-marin-de-Mayotte
Ramsar sites information service. 2020. La Vasière des Badamiers. Available at: rsis.ramsar.org/ris/2002 Terrigeol, L. and G. Gigot. 2019. Elaboration d'une liste d'espèces marines à protéger à Mayotte Diagnostic et
propositions. UMS PatriNat, AFB/CNRS/MNHN. doi.org/10.13140/RG.2.2.28043.44326 Réunion (France) Bigot, L. 2008. Evolution spatio-temporelle de la biodiversité et de la structure des communautés benthiques
entre 1998 et 2008 sur les stations sentinelles GCRMN de La Réunion. Programme BIOCOR. Rapport ECOMAR pour le compte de l’APMR. 32p +annexes.
Bigot, L., P. Chabanet, P. Cuet, B. Cauvin, P. Durville, T. Mulochau, O. Naim, J.B. Nicet, E. Tessier, B. Thomassin and J. Wickel. 2019. French Territories in the Western Indian Ocean, p. 279-302. In: C. Sheppard (ed). World Seas: An Environmental Evaluation (Second Edition): Vol. II: the Indian Ocean to the Pacific. Academic Press, London, UK.

2020 Fisheries Centre Research Reports 28(5)
98
Coulter, A., T. Cashion, A. Cisneros-Montemayor, S. Popov, G. Tsui, F. Le Manach, L. Schiller, M. Palomares, D. Zeller and D. Pauly. 2020. Using harmonized historical catch data to infer the expansion of global tuna fisheries. Fisheries Research, 221:105379. doi.org/10.1016/j.fishres.2019.105379.
INSEE. 2015. Populations légales du département de La Réunion, ses arrondissements, ses cantons et ses communes. Institut National de la Statistique et des Etudes Economiques (INSEE). Available at: www.insee.fr/fr/ppp/bases-de-donnees/recensement/populations-legales/pages2015/pdf/dep974.pdf.
IOTC. 2016. Nominal catches by species and gear, by vessel flag reporting country. Indian Ocean Tuna Commission (IOTC). Available at: www.iotc.org/documents/nominal-catch-species-and-gear-vessel-flag-reporting-country.
Le Manach, F., P. Bach, L. Barret, D. Guyomard, P.G. Fleury, P.S. Sabarros and D. Pauly. 2015. Reconstruction of the domestic and distant water fisheries catch of La Réunion (France), 1950–2010, p. 83–98 In: F. Le Manach and D. Pauly (eds). Fisheries catch reconstructions in the Western Indian Ocean, 1950–2010. Fisheries Centre Research Reports 23(2).
Le Manach, F., P. Bach, L. Barret, D. Guyomard, P.G. Fleury, P.S. Sabarros, and D. Pauly. 2016. France (La Réunion), p. 265. In: D. Pauly and D. Zeller (eds). Global Atlas of Marine Fisheries: A Critical Appraisal of Catches and Ecosystem Impacts. Island Press, Washington, DC.
Marine Conservation Institute. 2020. MPAtlas [Online]. Seattle, WA. Available at: www.mpatlas.org Noël, S.-L. 2020. Semi-automation procedure for catch reconstruction forward carry, p. 15-20. In: B. Derrick,
M. Khalfallah, V. Relano, D. Zeller and D. Pauly (eds). Updating to 2018 the 1950-2010 Marine Catch Reconstructions of the Sea Around Us: Part I – Africa, Antarctica, Europe and the North Atlantic. Fisheries Centre Research Report 28(5).
Seychelles Anon. 2012. Population and Housing Census 2010 Report. Seychelles National Bureau of Statistics, Victoria,
Seychelles. Anon. 2017. Third South West Indian Ocean Fisheries Governance and Shared Growth Project (SWIOFish3).
Process Framework for SWIOFish3 Project, Ministry of Finance, Trade and Economic Planning, Victoria, Seychelles.
Christ, H.J., R. White, L. Hood, G.M.S. Vianna and D. Zeller. 2020. A baseline for the blue economy: catch and effort history in the Republic of Seychelles’ domestic fisheries. Frontiers in Marine Science, 7(269): 1-13. doi.org/10.3389/fmars.2020.00269
Cockerell, L.M. and P.J. Jones. 2020. Governance Analysis of St Anne Marine National Park, Seychelles. Marine Policy, 103912.
Coulter, A., T. Cashion, A. Cisneros-Montemayor, S. Popov, G. Tsui, F. Le Manach, L. Schiller, M. Palomares, D. Zeller and D. Pauly. 2020. Using harmonized historical catch data to infer the expansion of global tuna fisheries. Fisheries Research, 221:105379. doi.org/10.1016/j.fishres.2019.105379.
Daly, R., C.A.K. Daly, A.E. Gray, L.R. Peel, L. Gordon, J.S. Lea, C.R. Clarke and K.C. Weng. 2020. Investigating the efficacy of a proposed marine protected area for the Endangered humphead wrasse Cheilinus undulatus at a remote island group in Seychelles. Endangered Species Research, 42: 7-20.
Daw, T.M., J. Robinson and N.A.J. Graham. 2011. Perceptions of trends in Seychelles artisanal trap fisheries: comparing catch monitoring, underwater visual census and fishers’ knowledge. Environmental Conservation 38: 75-88.
FAO. 2018. Fishery Statistical Collections [Online]. Food and Agriculture Organization of the United Nations (FAO), Rome, Italy.
Graham, N.A., J.P. Robinson, S.E. Smith, R. Govinden, G. Gendron and S.K. Wilson. 2020. Changing role of coral reef marine reserves in a warming climate. Nature Communications, 11(1): 1-8.
Hopf, J.K., G.P. Jones, D.H. Williamson and S.R. Connolly. 2019. Marine reserves stabilize fish populations and fisheries yields in disturbed coral reef systems. Ecological Applications, 29(5): e01905.
IOTC. 2019. IOTC Online Data Querying Service. Available at: www.iotc.org/iotc-online-data-querying-service.
Le Manach, F., P. Bach, L. Boistol, J. Robinson and D. Pauly. 2015. Artisanal fisheries in the world's second largest tuna fishing ground —Reconstruction of the Seychelles' marine fisheries catch, 1950–2010, p. 99–110 In: F. Le Manach and D. Pauly (eds). Fisheries catch reconstructions in the Western Indian Ocean, 1950–2010. Fisheries Centre Research Reports 23(2).
Le Manach, F., P. Bach, L. Boistol, J. Robinson, and D. Pauly. 2016. Seychelles, p. 385. In: D. Pauly and D. Zeller (eds). Global Atlas of Marine Fisheries: A Critical Appraisal of Catches and Ecosystem Impacts. Island Press, Washington, DC.
Marine Conservation Institute. 2020. MPAtlas [Online]. Seattle, WA. Available at: www.mpatlas.org

Updating to 2018 the 1950-2010 marine catch reconstructions of the Sea Around Us: Part I – Africa, Antarctica, Europe and the North Atlantic
99
Nevill, J.R., J. Robinson, F. Giroux and M. Isidore. 2007. Seychelles National Plan of Action for the Conservation and Management of Sharks. Seychelles Fishing Authority, Victoria, Seychelles. 59 p.
Noël, S.-L. 2020. Semi-automation procedure for catch reconstruction forward carry, p. 15-20. In: B. Derrick, M. Khalfallah, V. Relano, D. Zeller and D. Pauly (eds). Updating to 2018 the 1950-2010 Marine Catch Reconstructions of the Sea Around Us: Part I – Africa, Antarctica, Europe and the North Atlantic. Fisheries Centre Research Report 28(5).
Robinson, J.P., S.K. Wilson, J. Robinson, C. Gerry, J. Lucas, C. Assan, R. Govinden, S. Jennings and N.A. Graham. 2019. Productive instability of coral reef fisheries after climate-driven regime shifts. Nature Ecology & Evolution, 3(2): 183-190.
SFA. 1988. Seychelles Artisanal Fisheries Statistics for 1987. Seychelles Fishing Authority, Victoria, Seychelles. SFA. 1991. Seychelles Artisanal Fisheries Statistics for 1990. Seychelles Fishing Authority, Victoria, Seychelles. SFA. 2007. Seychelles National Plan of Action for the Conservation and Management of Sharks. Seychelles
Fishing Authority, Victoria, Seychelles. SFA. 2015. Seychelles Artisanal Fisheries Statistics for 2013. Seychelles Fishing Authority, Victoria, Seychelles. SFA. 2016a. Fisheries Statistical Report: Semester 1, Year 2016. Seychelles Fishing Authority, Victoria,
Seychelles. SFA. 2016b. Seychelles Artisanal Fisheries Statistics for 2015. Seychelles Fishing Authority, Victoria,
Seychelles. STMA. 2004. Fishes of Seychelles. Seychelles Tourism Marketing Authority, 3 p. The World Bank. 2018. World Population. Available at: data.worldbank.org/indicator/sp.pop.totl. Wilson, D. 1994. Unique by a Thousand Miles: Seychelles Tourism Revisited. Annals of Tourism Research, 21:
20-45.

2020 Fisheries Centre Research Reports 28(5)
100
Updating to 2018 the 1950-2010 catch reconstructions for islands off West Africa*
Brittany Derricka, Tim Cashiona, Darcy Dunstana, Maria Frias-Donagheya, Simon-Luc Noëla, Emmalai Pagea,
Veronica Relanoa, Christopher K. Phamb and Telmo Moratob a) Sea Around Us, Institute for the Oceans and Fisheries, University of British Columbia, 2202 Main
Mall, Vancouver, BC, V6T 1Z4, Canada b) Okeanos/IMAR – Instituto do Mar, Departamento de Oceanografia e Pesca, Universidade dos Açores,
Horta, Portugal Abstract This update to 2018 of marine fisheries catch reconstruction initially covering the years 1950 to 2010 deals with the following 7 small island states and territories: Ascension (U.K.); Canary Islands (Spain); Cape Verde; Madeira (Portugal); Saint Helena (U.K.), São Tomé and Príncipe and Tristan da Cunha (U.K.). For each country or territory, a short account is provided along with references documenting the main features of the fisheries and of their catch updates. Introduction The reconstructions of the catches taken from the Exclusive Economic Zones (or the corresponding marine areas prior to 1982) of the island entities off West Africa, namely Ascension (U.K.); Canary Islands (Spain); Cape Verde; Madeira (Portugal); Saint Helena (U.K.), São Tomé and Príncipe and Tristan da Cunha (U.K.) from 1950 to 2010 were presented in various contributions below. This contribution either updates or carries forward these reconstructions from their various end dates to 2018, using FAO landing data and various other datasets, here documented for each island entity separately. Ascension Island (United Kingdom) The reconstruction of Ascension Island’s marine fisheries was performed for 1950-2006 by Booth and Azar (2009); this was updated to 2010 (Booth et al. 2016), then updated to 2014 by the Sea Around Us. Here, the total catches and taxonomic breakdown from 2010 were carried forward to 2018 using the semi-automated procedure of Noël (2020) based on the FAO landing data to 2018. Marine biodiversity protection The Ascension Island Government Conservation Department is the management Authority which has agreed (in August 2019; UK Government 2020) to protect the local biological diversity. This will be done with the support of the UK Government’s Blue Belt Programme, funding from Darwin Plus, EU BEST and the Great British Oceans Coalition, as well as input from academic institutions and, most importantly, the elected Council and people of Ascension (Ascension Island Government 2020). In 2016, the United Kingdom announced that Ascension Island would be designated a marine reserve as of 2017 (Harrabin 2016) and that approximately half of the protected area would be closed to fishing (Harrabin 2016). Assessment of Ascension Island’s marine life over time was completed with interviews of Ascension’s population. The results showed recent declines in the catch per unit effort of yellowfin tuna (Thunnus albacares) and Galapagos sharks (Carcharhinus galapagensis), but, unlike many of the world’s other coastal
* Cite as: Derrick, B., T. Cashion, D. Dunstan, M. Frias-Donaghey, S.-L. Noël, E. Page, V. Relano, C. Pham and T. Morato. 2020. Updating to 2018 the 1950 – 2010 catch reconstructions for islands off West Africa, p. 100-114. In: B. Derrick, M. Khalfallah, V. Relano, D. Zeller and D. Pauly (eds). Updating to 2018 the 1950-2010 Marine Catch Reconstructions of the Sea Around Us: Part I – Africa, Antarctica, Europe and the North Atlantic. Fisheries Centre Research Report 28(5).

Updating to 2018 the 1950-2010 marine catch reconstructions of the Sea Around Us: Part I – Africa, Antarctica, Europe and the North Atlantic
101
fisheries, no indication of recent systemic declines in other taxa (Burns et al. 2020; Burns 2018). These changes will have to be considered in future updates and the spatialization by the Sea Around Us of the reconstructed catch from around Ascension Island. Ascension Island has one MPA, which occupies 445,390 km2 (100% of its EEZ). About half of it (221,762 km2) is a no-take area where commercial fishing and mineral extraction activities are prohibited (Ascension Island Government 2018). The first detailed scientific study of the pelagic megafauna communities of Ascension Island’s shallow water seamounts strongly recommended protection of the island’s seamounts (Weber et al. 2018). The Island’s southern seamounts are the ‘jewels in the crown’ of Ascension’s offshore ecosystem, and thus, they are of high importance for pelagic megafauna. “However, they are also a demonstrably fragile ecosystem that is likely to be quickly eroded by fisheries’ encroachment. […] It is important to recognize that establishing MPAs on seamounts may not in itself be enough to ensure their meaningful protection” (Weber et al. 2018). Effectively enforcing regulations, as well as designing and deploying monitoring or surveillance is key when designing very large and isolated MPAs. One of the solutions for continued monitoring in Ascension Islands could be satellite technologies (both S-AIS and SAR) providing information of spatial and temporal risks from fishing and other human activities at sea (Rowlands et al. 2019). “Effective monitoring of very large MPAs requires a commitment to follow-up with flag- and port-states, to determine the precise nature of possible violations identified through satellite monitoring (Rowlands et al. 2019). Canary Islands (Spain) The fisheries of the Canary Islands were reconstructed for the period of 1950 to 2010 (Castro et al. 2015, 2016); this was updated to 2016, and the reconstruction was carried forward to 2018 using the semi-automation procedure of Noël (2020) and Canary Islands Statistics Institute (ISTAC) landing data to 2018. Baseline statistics Spain’s national fisheries data does not separate out the catches of the Canary Islands. The data published by the Canary Islands Statistics Institute (ISTAC) are of varying quality; thus, for the 2011-2016 period, these data did not include non-tuna pelagic species. Therefore, the non-tuna pelagic fisheries catch was reconstructed using the ratio of non-tuna pelagic to total reported landings for the 2006-2010 period. Demersal fish, aggregated as a single category in national data, were disaggregated using the ratios of demersal fish from 2006 to 2010 based on Castro et al. (2015). Artisanal and subsistence fishing The total number of fishers operating in the Canary Islands was reconstructed for 2013 and 2014 using the ratio of fishers to boats in 2012, with the number of boats obtained from MAPyA (2016). The number of bait boats was left unchanged from 2010 to 2014, and the number of artisanal boats capturing demersal species was obtained from the balance of the total and tuna bait boats. The catch per unit effort (CPUE) of trap fisheries was carried forward from 2013 to 2014 unchanged. Based on these reconstructed time series of variables, unregulated catches of retired artisanal fishers, subsistence catches, bait catches, and discards were reconstructed following the methods of the original reconstruction (Castro et al. 2015).

2020 Fisheries Centre Research Reports 28(5)
102
Figure 1. Reconstructed domestic catch for the Canary Islands’ EEZ by fishing sector for 1950-2018, excluding industrial large pelagic fisheries. The number of bait boats was unavailable for 2016, and therefore the number of boats in 2015 was used for the 2016 calculations. A recent study has established that sharks and other elasmobranch bycatch from the artisanal trammel net fishery makes up 37% of total catch, including high catches of angel shark (Squatina squatina), a protected species (Mendoza et al. 2018). Recreational fishing Recreational fishing was originally reconstructed based on the number of fishing licenses for both domestic residents and charter operators, and on known catch rate and effort information (MAPyA 2006). However, the original reconstruction incorrectly assumed that the number of licenses reported was the number of licenses issued in a given year. This number, which was too low, was multiplied by three to get the total number of valid licenses. This correction and the adjustment to recreational fishing is reflected here (Figure 1). Recreational fishing continues to make up a major portion of the Canary Islands’ fisheries and has an important economic value to the islands’ economy (Leon et al. 2003). Therefore, it is important to consider all fisheries sectors when evaluating the importance of fisheries to the Canary Islands (Popescu and Ortega Gras 2013). For the 2015-2018 carry forward, recreational fishing license data were not available. Therefore, a rate of change was averaged and used to carry forward the trend in recreational licenses, then disaggregated with the 2010 taxon breakdown used for the recreational sector. Transition from 2016 to 2018 The catch reconstructed to 2016 was carried forward to 2018 using the semi-automated procedures outlined in Noël (2020), based on Canary Islands Statistics Institute (ISTAC) reported landings data available to 2018. Semi-automated reconstructed catch data will later be replaced by a more detailed, research-intensive update. Marine biodiversity protection The Canary Islands, as part of Spain, protect biological diversity through international agreements such us the Convention on Biological Diversity (Aichi) and the Ramsar Convention on Wetlands of International Importance, but also through regional treaties like Natura 2000. Spain is also a signatory to the Barcelona Convention and its commitments extend to NGOs and/or public bodies like the OSPAR Convention (Marine Conservation Institute 2020).

Updating to 2018 the 1950-2010 marine catch reconstructions of the Sea Around Us: Part I – Africa, Antarctica, Europe and the North Atlantic
103
In the Canary Islands, what stands out are the marine protected areas classified as “Special Protections Areas for Birds” (SPAs) and established under the European Birds Directive. The Canarian Fishing Law (Ley de Pescas de Canarias) was meant to protect, among others, all the sea floor with seagrass meadows. This law creates three different protection levels: a) marine reserves of fishing interest, b) marine remodeling zones and c) marine stocking areas. These categories helped to establish the rules for the declaration of MPAs, which regulate the use of marine resources and activities (Revenga et al. 2018). In the Canary Islands, 751 km2 are protected by the MPAs of Isla Graciosa e Islotes del Norte de Lanzarote, Isla de La Palma y Punta de la Restinga-Mar de las Calmas, which equals 0.16% of its EEZ (454,459 km2 of EEZ; Castro et al. 2015). These marine reserves of fishing interest, which cover almost three times more than the total extent of MPAs around the Spanish Mainland, are managed partly or completely by the SGP (the general Secretariat for Fisheries (Spanish: Secretaria General de Pesca; Marcos et al. 2005). However, the extent of the no-take area is 21,5 km2, nearly 3% of the total protected area (Marcos et al. 2005). This is not much considering the size of the Canarian EEZ. One of the largest marine reserves of fishing interest is the Reserva marina de Isla Graciosa e Islotes del Norte de Lanzarote with an extent of 704 km2. The marine reserve of Punta de La Restinga-Mar de Las Calmas with 11.8 km2 stands out as the southernmost European marine reserve (Revenga et al. 2018). Cape Verde The reconstruction of Cape Verde’s marine fisheries catches was completed for 1950-2010 by Santos et al. (2012) and Belhabib et al. (2016); it was then updated to 2017 by the Sea Around Us, and forward carried to 2018 using the semi-automatic procedure of Noël (2020) and FAO landing data to 2018. Discrepancies between national and FAO data During 2011-2014, the landings reported by the FAO on behalf of Cape Verde increased dramatically, while the landings reported in the statistics of Cape Verde remained relatively stable (Figure 2). Even though both FAO and national reported landings dropped during 2015-2017, FAO landings continued to be much greater than national landings. Thus, landings reported to FAO were assumed to include catches by re-flagged foreign vessels for 2011-2017 and, as a result, excess landings were assumed to be taken from outside Cape Verde’s EEZ, as in previous years. Thus, the national catch amounts were used as the EEZ reported baseline records.
Figure 2. Comparison of the FAO reported data with INDP nationally reported data for 2000-2018.

2020 Fisheries Centre Research Reports 28(5)
104
Artisanal and commercial catches Reported landings by domestic commercial fisheries were updated for 2011-2017 with national data (INE 2015, 2016, 2017). The percentage of tuna landings within total domestic landings was determined for 2010, 2014 and 2016-2017 (INE 2015-2017). For years without the percentage of tuna landings, these percentages were interpolated linearly to remove landings of tuna from domestic industrial catch. These industrial catches of tuna were estimated in a separate study (Coulter et al. 2020) and are not included here. Because taxonomic information was not available from national INE data for 2011-2017, total reported artisanal landings and reported domestic industrial landings were disaggregated using the 2010 taxonomic breakdown for each sector. Baitfish catches Unreported landings of baitfish from commercial fisheries were calculated for 2011-2017 by multiplying reported landings for each sector by the 2010 catch rate for baitfish. For 2011-2017, the discard rate for baitfish and the percentage of baitfish caught by dynamite fishing were held constant for each sector at the 2010 levels. The taxonomic breakdowns of baitfish landings and discards were also maintained at the 2010 percentages for each sector and gear-type. Recreational and subsistence fishing Recreational landings were updated to 2017 using updated tourism data obtained from INE (2015-2017). The percentage of tourists participating in recreational fishing and the catch per unit effort (CPUE) of recreational fishers were assumed constant for 2010-2017. Recreational landings were disaggregated by taxa based on the 2010 taxonomic breakdown. Subsistence catches were estimated for 2011-2017 based on the 2010 ratio of subsistence catch to domestic reported landings for each gear-type. The 2010 taxonomic breakdown of subsistence catch for each gear-type was maintained for 2011-2017. Transition from 2017 to 2018 The catch reconstructed to 2017 was carried forward to 2018 using the semi-automated procedures outlined in Noël (2020), based on FAO reported landings data available to 2018. Semi-automated reconstructed catch data will later be replaced by a more detailed, research-intensive update. Marine biodiversity protection Cape Verde has agreed to protect its biological diversity through the international agreements of the Convention on Biological Diversity (Aichi) and the Ramsar Convention on Wetlands of International Importance (Marine Conservation Institute 2020). There appear to be no MPAs in these waters (Marine Conservation Institute 2020), but there are three marine managed areas, i.e., Ramsar sites (Marine Conservation Institute 2020). According to the Government of Cape Verde, in 2016, the extent of MPAs was 1024 km2 (Da República de Cabo Verde 2016), which is about 0.13% of the entire EEZ (796,555 km2, Santos et al. 2013). This official document confirms that all the MPAs are being effectively operated except the Reserve of Santa Luzia, which has a management plan with some no-take areas (Da República de Cabo Verde 2016). The marine area of this reserve is 342 km2 (Da República de Cabo Verde 2016) and is declared as a priority key biodiversity area by the Critical Ecosystem Partnership Fund (Freitas et al. 2019). In Maio’s Island, the small-scale fishing community “[m]entioned industrial fishing and insufficient control by fisheries as major social issues. Fishermen's words express a growing need to gain independence from their territory” (Dancette and Brethes 2019). A fish seller stated that “[p]olitical divergences between us (Maienses)

Updating to 2018 the 1950-2010 marine catch reconstructions of the Sea Around Us: Part I – Africa, Antarctica, Europe and the North Atlantic
105
forbid us from uniting to protect this environment on which we rely. We must associate and stop illegal fishing (foreign fishermen in our waters). We can improve the ocean's state. We must sensitize, educate and act all together in this way” (Dancette and Brethes 2019). This research suggests that greater efforts in Cape Verde should focus on marine protection and marine resources management as the majority of local and managers from one of the islands demand, among other actions, resource protection, fishery control, and financial and human means to protect their waters and to limit their vulnerability. Other efforts towards marine protection in Cape Verde focus on integrating local communities with sustainable tourism. “However, these efforts are constrained by the local communities’ lack of access to capital/funding, lack of training opportunities, and lack of governmental support” (Neva 2020). Madeira Island (Portugal) The original marine fisheries reconstruction for the Madeira Islands from 1950-2010 was completed by Shon et al. (2015, 2016). This was updated to 2017 using reported data from the national statistical database of the Madeira Islands (Anon. 2018). This update was then carried forward to 2018 using the semi-automatic procedure of Noël (2020) and FAO landing data to 2018. Deep-water and other fishes The main commercial target fishery continues to be black Scabbardfish (Aphanopus carbo), averaging about 1,900 tonnes per year from 2011 to 2017. Black scabbardfish is caught in deep waters by industrial fisheries. However, with the exception of tuna, most of the other fisheries in Madeira Island are considered artisanal. A new species, leafscale gulper shark (Centrophorus squamosus) was reported in the national data from 2011-2014. The leafscale gulper shark is likely caught as bycatch of the black scabbardfish fishery because it is also a deep-water fish (Severino et al. 2009). For this update, the “others” category reported in national data was taxonomically disaggregated using the same ratios described in Shon et al. (2015). Frigate mackerel (Auxis thazard) and bonito (Sarda sarda) were separated from the “Tunas and similar” category using the same ratio from 2010 with the remainder of the category considered industrial catches of large pelagic taxa, which are not considered in this update, because their catch was estimated in a separate study (Coulter et al. 2020). However, the tuna baitfish fishery was reconstructed by using 5% of the total tuna catch amount to estimate how much baitfish was caught to catch the tuna. The baitfish taxa remain disaggregated into 50% blue jack mackerel (Trachurus picturatus) and 50% Atlantic chub mackerel (Scomber colias). Subsistence and recreational catches The reconstruction of subsistence and recreational fisheries both rely on Madeira Island’s resident population from Statistics Portugal (Anon. 2017) for 2011-2017. We assumed the same subsistence consumption rate from 2010 of 0.5 kg·person-1·year-1 and the same taxonomic breakdown from 2010 for 2011-2017. We also assumed the recreational catch rate from 2010 of 1.6 k·person-1·year-1, which continued to be allocated to ‘marine fishes not identified’. The discards from the black scabbardfish fishery were calculated by taking 2.25% of the reported amount and disaggregating them into taxa outlined by Shon et al. (2013). Transition from 2017 to 2018 The catch reconstructed to 2017 was carried forward to 2018 using the semi-automated procedures outlined in Noël (2020), based on reported landings data available to 2018 from the national statistical database of the Madeira Islands (Anon. 2018). Semi-automated reconstructed catch data will later be replaced by a more detailed, research-intensive update.

2020 Fisheries Centre Research Reports 28(5)
106
Marine biodiversity protection Portugal protects the biological diversity of Madeira through international agreements such us the Convention on Biological Diversity (Aichi) and through regional treaties like the Natura 2000. Its commitments also extend to NGOs and public bodies such as the OSPAR Convention (Marine Conservation Institute 2020). There are eight protected areas in Madeira that protect a total of 8,231 km2 and equal 1.8% of the EEZ (454,459 km2; Schon et al. 2015). One of the earliest designated MPA in these waters, dating back to 1971, is the Ilhas Selvagens (1245 km2), which was also the first MPA classified as a Marine Reserve at the national level (DRPI 2020) where any type of fishing or other extractive activity is prohibited. Without considering the site’s community importance for cetaceans, the islands’ reserve represents 86.6% of the total extent of MPAs in Madeira. The Ilhas Selvagens are important for biodiversity due to their isolation and difficult conditions for flora and fauna colonization. Moreover, “compared with other archipelagos, the richness of fish species reported for the Selvagens Islands is remarkable when one considers that the submerged area with depths less than 60 m is much smaller than that available in larger Macaronesian archipelagos” (DRPI 2020). Saint Helena (United Kingdom) The reconstruction of Saint Helena’s marine fisheries catches was performed for 1950-2006 by Booth and Azar (2009) and updated to 2010 (Booth et al. 2016), and then to 2014 by the Sea Around Us. This update was then carried forward to 2018 using the semi-automatic procedure of Noël (2020) and FAO landing data to 2018. Retroactive changes to the most recent versions of the FAO data were minor and were not addressed in this update, but should be addressed in future updates. Note that in 2013, Saint Helena did not export any fish because of low fish population and catches (Anon. 2014). Unreported industrial landings were estimated for 2011-2014 using the 2010 fraction of reported landings. Similarly, unreported artisanal landings were updated for 2011-2014 using the 2010 ratio of artisanal to reported landings. The taxonomic breakdown per sector was assumed to remain the same as in 2010 for 2011-2014, and thence to 2018. The population of Saint Helena reportedly declined by a third in 2002 after the United Kingdom repealed a law that had previously denied residents full British citizenship, leading to substantial migrations to the U.K. mainland (Anon. 2016). This drop in population is reflected in the original import- and export- based methods to reconstruct fisheries by Booth and Azar (2009) and was thus accounted for. In 2011, the United Kingdom announced plans to build an airport on Saint Helena, which was completed in 2015 and began regular scheduled operations in 2017 (see https://en.wikipedia.org/wiki/Saint_Helena_Airport). This may lead to the development of tourism and an increased demand for local fresh fish. Transition from 2014 to 2018 The catch reconstructed to 2014 was carried forward to 2018 using the semi-automated procedures outlined in Noël (2020), based on FAO reported landings data available to 2018. Semi-automated reconstructed catch data will later be replaced by a more detailed, research-intensive update. Marine biodiversity protection The U.K. government and the local authorities of Saint Helena have agreed to protect biological diversity of St. Helena through the international agreements of the Convention on Biological Diversity (Aichi) and the Ramsar Convention on Wetlands of International Importance (Marine Conservation Institute 2020).

Updating to 2018 the 1950-2010 marine catch reconstructions of the Sea Around Us: Part I – Africa, Antarctica, Europe and the North Atlantic
107
In 2016, Saint Helena declared a sustainable-use MPA (Johnson et al. 2019) that occupied the entire EEZ (444,898 km2; Booth and Azar 2009). The St Helena’s Government and the Attorney General’s Chambers, jointly with the UK government’s initiative to protect marine environments in the UK Overseas Territories and Blue Belt Programme offer assistance on new fisheries policies. These new policies are used to inform legislation and are now displayed as part of the aims of St Helena’s Marine Protected Area, which helps to empower St Helena’s Marine Enforcement Officer (UK Government 2020). “The Marine Enforcement Officer works with the St Helena Government to ensure compliance with the new fisheries legislation and other legislation. They will also deliver local training to support effective enforcement” (UK Government 2020). São Tomé and Príncipe A reconstruction of marine fisheries for São Tomé and Príncipe was completed for 1950-2010 by Belhabib (2015) and Belhabib and Pauly (2016), updated to 2014 by the Sea Around Us and carried forward to 2018 using the semi-automated procedure of Noël (2020) and FAO landing data to 2018. Retroactive changes were detected between the different versions of the FAO data and were accounted for in the most recent version of the dataset for 1998-2010 (Figure 3). Unreported landings were updated for 1998-2010 based on the assumption that total artisanal landings did not change.
Figure 3. Reconstructed domestic catch in the EEZ of São Tomé and Príncipe by fishing sector for 1950-2018. Small-scale fisheries Total landings from small scale fisheries were updated for 2011-2014 based on the coastal population’s food security needs. Updated total population data for São Tomé and Príncipe was obtained for 2011-2014 from the World Bank and converted to coastal population using the 2010 ratio of total population that was determined to be coastal (CIESIN 2012). The per capita consumption rate from 2010 was assumed to remain constant for 2011-2014, and this was multiplied by the coastal population to derive total demand for seafood from small-scale fisheries. The 2010 percentages of total small-scale landings attributed to subsistence and artisanal fisheries were held constant for 2011-2014. Unreported artisanal landings were equal to the difference between total artisanal landings and reported artisanal landings. The 2010 taxonomic breakdowns for unreported catch from artisanal and subsistence fisheries were carried forward unaltered for 2011-2014.

2020 Fisheries Centre Research Reports 28(5)
108
Industrial foreign fisheries Reported industrial landings by foreign fishing entities in São Tomé and Príncipe’s Exclusive Economic Zone (EEZ) were determined based on the 2010 breakdown of taxa per EEZ caught by each fishing entity in the Eastern Central Atlantic. Unreported landings by foreign fishing entities in São Tomé and Príncipe’s EEZ were calculated from reported landings by that fishing entity based on the 2010 ratio. Catches by Taiwan were determined using the same ratio to total Japanese catch as described in the original reconstruction. Because significant increases in China’s reported landings in 2012-2013 were assumed to be due to increased reporting in those years and not to an increase in actual catch, total landings by China in São Tomé and Príncipe’s EEZ were held constant from 2011-2014. All unreported industrial catch was assigned to ‘Marine fishes not identified’. Development initiatives The African Development Bank has provided programs and funding to develop São Tomé and Príncipe’s fisheries and increase exports, by constructing fish storage centers and providing training for fishers (Anon. 2016; Devey Malu Malu 2016; Pikitch and Doukakis, 2005). In 2015, São Tomé and Príncipe’s National Fisheries Monitoring Centre introduced a Vessel Monitoring System for vessels fishing in its EEZ under European Union fishing agreements; the Directorate of Fisheries of the archipelago signed an agreement with the National Coast Guard to patrol its EEZ (Devey Malu Malu 2016). As in much of West Africa, illegal foreign fishing is rampant in São Tomé and Príncipe. This situation made international news headlines in 2015 when a captain and two crew members of the Thunder, one of Interpol’s most-wanted illegal fishing vessels, were convicted on charges of illegal fishing (Urbina 2015). The effect of these initiatives on catches from São Tomé and Príncipe will need to be evaluated more carefully in the future. Transition from 2014 to 2018 The catch reconstructed to 2014 was carried forward to 2018 using the semi-automated procedures outlined in Noël (2020), based on FAO reported landings data available to 2018. Semi-automated reconstructed catch data will later be replaced by a more detailed, research-intensive update. Marine biodiversity protection São Tomé and Príncipe has agreed to protect its biological diversity through the international Convention on Biological Diversity (Aichi) and it is also part of the international network of UNESCO Man and the Biosphere (Marine Conservation Institute 2020). São Tomé and Príncipe has one MPA and one marine managed area. Jointly, they cover 6 km2 (Marine Conservation Institute 2020), which is far less than 1% of the entire EEZ (165,345 km2; Belhabib and Pauly 2016). The MPA is the Natural Park of Obô do Príncipe, designated in 2006. The marine managed area is the Biosphere Reserve of the Island of Principe, designated in 2012 with a marine area of 111 km2 (Marine Conservation Institute 2020). There are threats and potential issues to solve and regulate in the island in order to be able to provide marine conservation. Threats to marine conservation in São Tomé and Príncipe are overfishing, and agricultural and industrial pollution. Regarding overfishing, “As a result of the increased pressure on fish stocks, fishermen have to travel farther than ever before, some with limited navigational and safety equipment. They are also employing increasingly destructive methods of fishing, including the use of hand grenades or small mesh net, especially in coastal fisheries. These practices result in significant damage to ecosystems, increased risk to life,

Updating to 2018 the 1950-2010 marine catch reconstructions of the Sea Around Us: Part I – Africa, Antarctica, Europe and the North Atlantic
109
and overfishing. Further pressure on already overexploited fish stocks has caused the price of fish to rise at local markets. Given the central importance of fish as a source of protein for the population, these pressures are especially alarming (88 to 98 percent of STP households consume fish regularly, and fish represents 85 percent of locals’ protein intake. There have been reports that higher fish prices have encouraged locals to catch sea turtles on the beaches for meat (De Fountalbert et al. 2019). Among the policy recommendations are enforcement and educational investments to switch from the current unsustainable towards more sustainable practices. “The cost of establishing a proper maritime surveillance system and enforcement of fishing and dumping laws has a high upfront investment but is likely to be recouped by the increased revenues and improved protection and rehabilitation of fishing stocks, natural wildlife, and the marine capital vital to tourism” (De Fountalbert et al. 2019). Tristan da Cunha Island (United Kingdom) The original reconstruction of Tristan da Cunha’s marine fisheries catches was performed for 1950-2006 by Booth and Azar (2009), and updated to 2010 by Booth et al. (2016) and the Sea Around Us. The fisheries catch from around Tristan da Cunha Island were updated to 2014 and then carried forward to 2018 using the semi-automatic procedure of Noël (2020) and FAO landing data to 2018. Note that fish was not exported from Tristan da Cunha in 2013 due to low populations and catches (Anon. 2014). Retroactive changes to the FAO data were minor and were not addressed here. Unreported industrial landings were updated for 2011-2014 based on the 2010 ratio of unreported industrial to reported landings. Similarly, unreported artisanal landings were updated for 2011-2014 using the ratio of unreported artisanal landings to reported catch for 2010. The 2010 taxonomic breakdown for each sector was carried forward unaltered to 2014. A major resource around Tristan de Cunha is the Tristan rock lobster ‘Jasus tristani’. Groeneveld et al. (2012), noted a lack of genetic differentiation between Tristan de Cunha rock lobster and St Paul rock lobster and reunited the species under the older Latin name, Jasus paulensis. Transition from 2014 to 2018 The catch reconstructed to 2014 was carried forward to 2018 using the semi-automated procedures outlined in Noël (2020), based on FAO reported landings data available to 2018. Semi-automated reconstructed catch data will later be replaced by a more detailed, research-intensive update. Marine biodiversity protection The small community in Tristan da Cunha Island is highly dependent on a healthy marine environment to support its Marine Stewardship Council certified rock lobster fishery, which provides about 80% of the island’s income, enabling it to be self-sustaining. The marine life of the islands and offshore seamounts are also of high conservation importance (Hannah Thomas 2018). In September 2016, the Tristan Island Council, in consultation with the U.K. government, committed to protect the entire exclusive economic zone of the archipelago (The Pew Charitable Trusts 2020). In July 2017, the Government of Tristan da Cunha organized a workshop to assemble what was the current knowledge of the marine environment of the island to develop an action plan to bridge the gaps. After the establishment of this plan, the Blue Belt Programme and partners carried out a variety of scientific and management activities aimed at designing an evidence-based marine protection strategy (Thomas and Yates 2018). As a result, the Government of Tristan da Cunha committed to adopt a marine protection strategy by 2020 and developing an action plan allowing the sustainable development of fisheries (Hannah Thomas 2018). This protection strategy

2020 Fisheries Centre Research Reports 28(5)
110
will embrace actions to protect the inshore area, the highly productive seamounts and wider open ocean, “ensuring the community is able to continue making a living from well managed fisheries” (Thomas and Yates 2018). Discussion The island countries or territories presented above share several features, the key one being that their fisheries are more important to them than in the closest countries on the African mainland. This does not mean, however, that they are capable of properly monitoring or managing their domestic small-scale fisheries or the foreign industrial fishing fleets operating within in their EEZs well. Indeed, the opposite is more often the case. This is reflected by the scarcity of detailed catch data available for the current update. Under these circumstances, we have done the best we could do for these reconstructions. We hope that colleagues will help us improve on them and carry forward for the next update of the Sea Around Us database. Acknowledgments Funding for the work presented here was provided by the Minderoo Foundation, by the Marisla, Oak, and David and Lucille Packard Foundations, and by the Bloomberg Philanthropies through Rare. References (by country or territory) Ascension Ascension Island Government. 2018. Ascension Island Marine Protected Area Evidence and Options
Document. Available at: www.ascension-island.gov.ac/wp-content/uploads/2018/11/Ascension-Island-Marine-Protected-Area-Evidence-and-Options-Document-Second-draft-Nov-18-final.pdf
Ascension Island Government. 2020. Ascension Island Marine Protected Area. Available at: www.ascension.gov.ac/map-marker/mpa-marine-protected-area
Booth, S. and H. Azar. 2009. The fisheries of St Helena and its dependencies, p. 27-34 In: D. Zeller and S. Harper (eds). Fisheries catch reconstructions: Islands, Part I. Fisheries Centre Research Reports 17(5).
Booth, S., H. Azar, D. Knip, and M.L.D. Palomares. 2016. United Kingdom (Ascension Island), p. 426. In: D. Pauly and D. Zeller (eds). Global Atlas of Marine Fisheries: A Critical Appraisal of Catches and Ecosystem Impacts. Island Press, Washington, DC.
Burns, P., J. Hawkins and C. Roberts. 2020. Reconstructing the history of ocean wildlife around Ascension Island. Aquatic Conservation: Marine and Freshwater Ecosystems. doi.org/10.1002/aqc.3304
Burns, P. 2018. The old man and the sea: reconstructing the history of ocean life around Ascension Island. Master’s thesis, University of York, 234 p.
Harrabin, R. 2016. Ascension Island to become marine reserve. BBC News, 3 January, 2016. Available at: www.bbc.com/news/uk-35216313.
Marine Conservation Institute. 2020. MPAtlas [Online]. Seattle, WA. Available at: www.mpatlas.org Noël, S.-L. 2020. Semi-automation procedure for catch reconstruction forward carry, p. 15-20. In: B. Derrick,
M. Khalfallah, V. Relano, D. Zeller and D. Pauly (eds). Updating to 2018 the 1950-2010 Marine Catch Reconstructions of the Sea Around Us: Part I – Africa, Antarctica, Europe and the North Atlantic. Fisheries Centre Research Report 28(5).
Rowlands, G., J. Brown, B. Soule, P.T. Boluda and A.D. Rogers. 2019. Satellite surveillance of fishing vessel activity in the Ascension Island exclusive economic zone and marine protected area. Marine Policy, 101:39-50. doi.org/10.1016/j.marpol.2018.11.006
UK Government. 2020. Blue Belt Programme – Annual Update for Financial Year 2019-2020. Available at: assets.publishing.service.gov.uk/government/uploads/system/uploads/attachment_data/file/890468/Blue_Belt_Programme_Annual_Update_2019_2020.pdf
Weber, S.B., A.R. Richardson, A.C. Broderick, J. Brown, F. Campanella, B.J. Godley, F. Howard, N. Hussey, J. Meeuwig, P. Rose, M. Shepherd, C. Thompson, J. van der Kooij and M.J. Witt. 2018. A baseline ecological of Ascension Island’s shallow water seamounts as candidate marine protected areas. Ascension Island Government Conservation & Fisheries Department. 56 p. Available at:

Updating to 2018 the 1950-2010 marine catch reconstructions of the Sea Around Us: Part I – Africa, Antarctica, Europe and the North Atlantic
111
www.ascension-island.gov.ac/wp-content/uploads/2018/11/An-ecological-assessment-of-Ascension-Island%E2%80%99s-shallow-water-seamounts-as-candiate-Marine-Protected-Areas.pdf
Canary Islands Castro, J.J., E. Divovich, A.D.M. Acevedo and A. Barrera-Luján. 2015. Over-looked and under-reported: a
catch reconstruction of marine fisheries in the Canary Islands, Spain, 1950–2010. Fisheries Centre Working Paper #2015-26, 35 p.
Castro, J.J., E. Divovich, A.D.M. Acevedo and A. Barrera-Luján. 2016. Spain (Canary Islands), p. 395. In: D. Pauly and D. Zeller (eds). Global Atlas of Marine Fisheries: A Critical Appraisal of Catches and Ecosystem Impacts. Island Press, Washington, DC.
Leon, C.J., J.E. Arana and A. Melian. 2003. Tourist use and preservation benefits from big-game fishing in the Canary Islands. Tourism Economics, 9(1): 53-65.
MAPyA. 2006. Análisis y Ordenación de la Pesca de Recreo en el Ámbito de las Islas Canarias. Ministerio de Agricultura, Pesca y Alimentación.
MAPyA. 2016. Documentacion complementaria informe anual de la actividad de la flota pesquera española año 2016 (datos 2015). Ministerio de Agricultura, Pesca y Alimentación. Available at: www.mapa.gob.es/es/pesca/temas/registro-flota/anexo-informe-anual-2016_tcm30-500248.pdf
Marcos, P. 2005. Conservando nuestros paraísos marinos. Propuesta de Red Representativa de Áreas Marinas Protegidas en España. WWF/Adena, Madrid, Spain.
Marine Conservation Institute. 2020. MPAtlas [Online]. Seattle, WA. Available at: www.mpatlas.org Mendoza, J.C., C. Dorta, A. Brito and J.C. Hernandez. 2018. Elasmobranch bycatch on artisanal trammel net
fishery in the Canary Islands. Revista Scientia Insularum, 1: 87-102. doi.org/10.25145/j.SI.2018.01.006.
Noël, S.-L. 2020. Semi-automation procedure for catch reconstruction forward carry, p. 15-20. In: B. Derrick, M. Khalfallah, V. Relano, D. Zeller and D. Pauly (eds). Updating to 2018 the 1950-2010 Marine Catch Reconstructions of the Sea Around Us: Part I – Africa, Antarctica, Europe and the North Atlantic. Fisheries Centre Research Report 28(5).
Popescu, I. and J.J. Ortega Gras. 2013. Fisheries in the Canary Islands. European Parliament’s Committee on Fisheries. Directorate General for Internal Policies. Policy Department B: Structural and Cohesion Policies. 56 p. Available at: www.europarl.europa.eu/RegData/etudes/note/join/2013/495852/IPOL-PECH_NT(2013)495852_EN.pdf
Revenga, S., C. Laborda and M. Peterssen. 2018. Red de Reservas Marinas. Mas de 30 años protegiendo nuestros oceanos. Ministerio de Agricultura, Pesca y Alimentación, Madrid, Spain.
Cape Verde Belhabib, D., C. Monteiro, I.T. Santos, S. Harper, K. Zylich, D. Zeller and D. Pauly. 2016. Cape Verde, p. 217.
In: D. Pauly and D. Zeller (eds). Global Atlas of Marine Fisheries: A Critical Appraisal of Catches and Ecosystem Impacts. Island Press, Washington, DC.
Coulter, A., T. Cashion, A. Cisneros-Montemayor, S. Popov, G. Tsui, F. Le Manach, L. Schiller, M. Palomares, D. Zeller and D. Pauly. 2020. Using harmonized historical catch data to infer the expansion of global tuna fisheries. Fisheries Research, 221:105379. doi.org/10.1016/j.fishres.2019.105379.
Da República de Cabo Verde. 2016. Boletim Oficial No.17, I Serie. Available at: extwprlegs1.fao.org/docs/pdf/cvi154186.pdf
Dancette, R. and J.C. Brêthes. 2019. An analysis of actors' perceptions of Maio Island's (Cape Verde) marine governance. Marine Policy, 104:177-197.
Freitas, R., T.C. Mendes, C. Almeida, T. Melo, R.C. Villaça, R. Noguchi, S.R. Floeter, C.A. Rangel and C.E.L. Ferreira. 2019. Reef fish and benthic community structures of the Santa Luzia Marine Reserve in the Cabo Verde islands, eastern central Atlantic Ocean. African Journal of Marine Science, 41(2): 177-190. doi.org/10.2989/1814232X.2019.1616613
INE. 2015. Cabo Verde Anuário Estatístico 2015. Instituto Nacional de Estatística (INE), Lisboa, Cabo Verde. 227 p.
INE. 2016. Cabo Verde Anuário Estatístico 2016. Instituto Nacional de Estatística (INE), Lisboa, Cabo Verde. 301 p.
INE. 2017. Cabo Verde Anuário Estatístico 2017. Instituto Nacional de Estatística (INE), Lisboa, Cabo Verde. 211 p.
Marine Conservation Institute. 2020. MPAtlas [Online]. Seattle, WA. Available at: www.mpatlas.org Neva, L. 2020. Problematic blue growth: a thematic synthesis of social sustainability problems related to
growth in the marine and coastal tourism. Sustainability Science, 15(4):1233-1244.

2020 Fisheries Centre Research Reports 28(5)
112
Noël, S.-L. 2020. Semi-automation procedure for catch reconstruction forward carry, p. 15-20. In: B. Derrick, M. Khalfallah, V. Relano, D. Zeller and D. Pauly (eds). Updating to 2018 the 1950-2010 Marine Catch Reconstructions of the Sea Around Us: Part I – Africa, Antarctica, Europe and the North Atlantic. Fisheries Centre Research Report 28(5).
Santos, I.T., C.A. Monteiro, S. Harper, D. Zeller and D. Belhabib. 2012. Reconstruction of marine fisheries catches for the Republic of Cape Verde, 1950-2010, p. 79-90. In: D. Belhabib, D. Zeller, S. Harper and D. Pauly (eds). Marine fisheries catches in West Africa, Part 1. Fisheries Centre Research Reports 20(3).
Madeira Anon. 2017. Resident population of Madeira (2011-2017). Instituto Nacional De Estatistica. Statistics Portugal.
Available at: www.ine.pt/xportal/xmain?xpid=INE&xpgid=ine_indicadores&contecto=pi&indOcorrCod=0008273&selTab=tab0
Anon. 2018. Estatísticas da Agricultura e Pesca da Região Autónoma da Madeira (Ano 2011-2017). Indicadores de Atividade Económica. Direção Regional de Estatística da Madeira (DREM), Funchal, Madeira.
Coulter, A., T. Cashion, A. Cisneros-Montemayor, S. Popov, G. Tsui, F. Le Manach, L. Schiller, M. Palomares, D. Zeller and D. Pauly. 2020. Using harmonized historical catch data to infer the expansion of global tuna fisheries. Fisheries Research, 221:105379. doi.org/10.1016/j.fishres.2019.105379.
DRPI - Direção Regional do Património e Informática. 2020. Areas Protegidas. Available at: ifcn.madeira.gov.pt/areas-protegidas/ilhas-selvagens.html
Marine Conservation Institute. 2020. MPAtlas [Online]. Seattle, WA. Available at: www.mpatlas.org Noël, S.-L. 2020. Semi-automation procedure for catch reconstruction forward carry, p. 15-20. In: B. Derrick,
M. Khalfallah, V. Relano, D. Zeller and D. Pauly (eds). Updating to 2018 the 1950-2010 Marine Catch Reconstructions of the Sea Around Us: Part I – Africa, Antarctica, Europe and the North Atlantic. Fisheries Centre Research Report 28(5).
Severino, R.B., I. Afonso-Dias, J. Delgado and M. Afonso-Dias. 2009. Aspects of the biology of the leaf-scale gulper shark Centrophorus squamosus (Bonnaterre, 1788) off Madeira archipelago. Arquipelago. Life and Marine Sciences, 26: 57-61.
Shon, S., J.M. Delgado, T. Morato, C.K. Pham, K. Zylich, D. Zeller and D. Pauly. 2015. Reconstruction of marine fisheries catches for Madeira Island, Portugal from 1950-2010. Fisheries Centre Working Paper #2015-52, 13 p.
Shon, S., J.M. Delgado, T. Morato, C.K. Pham, D. Zeller and D. Pauly. 2016. Portugal (Madeira), p. 371. In: D. Pauly and D. Zeller (eds). Global Atlas of Marine Fisheries: A Critical Appraisal of Catches and Ecosystem Impacts. Island Press, Washington, DC.
Saint Helena Anon. 2014. Statistical Yearbook 2013/14. Statistics Office, Corporate Policy and Planning Unit, St Helena
Government Statistics Office. Available at: www.sainthelena.gov.sh/wp-content/uploads/2013/07/201314-Statistical-Yearbook.pdf.
Anon. 2016. St Helena, Ascension, Tristan da Cunha profiles. BBC News, 16 March 2016. Available at: www.bbc.com/news/world-africa-14123532.
Booth, S. and H. Azar. 2009. The fisheries of St Helena and its dependencies, p. 27-34. In: D. Zeller and S. Harper (eds). Fisheries catch reconstructions: Islands, Part I. Fisheries Centre Research Reports 17(5).
Booth, S., H. Azar and D. Knip. 2016. United Kingdom (St. Helena), p. 436. In: D. Pauly and D. Zeller (eds). Global Atlas of Marine Fisheries: A Critical Appraisal of Catches and Ecosystem Impacts. Island Press, Washington, DC.
Johnson, D.E., S.E. Rees, D. Diz, P.J. Jones, C. Roberts and C. Barrio Froján. 2019. Securing effective and equitable coverage of marine protected areas: The UK's progress towards achieving Convention on Biological Diversity commitments and lessons learned for the way forward. Aquatic Conservation: Marine and Freshwater Ecosystems, 29:181-194.
Marine Conservation Institute. 2020. MPAtlas [Online]. Seattle, WA. Available at: www.mpatlas.org Noël, S.-L. 2020. Semi-automation procedure for catch reconstruction forward carry, p. 15-20. In: B. Derrick,
M. Khalfallah, V. Relano, D. Zeller and D. Pauly (eds). Updating to 2018 the 1950-2010 Marine Catch Reconstructions of the Sea Around Us: Part I – Africa, Antarctica, Europe and the North Atlantic. Fisheries Centre Research Report 28(5).

Updating to 2018 the 1950-2010 marine catch reconstructions of the Sea Around Us: Part I – Africa, Antarctica, Europe and the North Atlantic
113
UK Government. 2020. Blue Belt Programme – Annual Update for Financial Year 2019-2020. Available at: assets.publishing.service.gov.uk/government/uploads/system/uploads/attachment_data/file/890468/Blue_Belt_Programme_Annual_Update_2019_2020.pdf
São Tomé and Príncipe Anon. 2016. ADB helps São Tomé and Príncipe improve agriculture and fisheries. Macau Hub, 20 January
2016. Available at: www.macauhub.com.mo/en/2016/01/20/adb-helps-sao-tome-and-principe-improve-agriculture-and-fisheries/.
Belhabib, D. 2015. Fisheries of São Tomé and Príncipe, a catch reconstruction 1950-2010. Fisheries Centre Working Paper #2015-67, 13 p.
Belhabib, D., D. Pauly. 2016. São Tomé and Príncipe, p. 381. In: D. Pauly and D. Zeller (eds). Global Atlas of Marine Fisheries: A Critical Appraisal of Catches and Ecosystem Impacts. Island Press, Washington, DC.
CIESIN 2012. National Aggregates of Geospatial Data Collection: Population, Landscape, And Climate Estimates, Version 3 (PLACE III). NASA Socioeconomic Data and Applications Center (SEDAC), Palisades, NY. Available at: http://sedac.ciesin.columbia.edu/data/set/nagdc-populationlandscape-climate-estimates-v3
De Fountalbert, C., N. Desramaut and P. Devine. 2019. Country Economic Memorandum for Sao Tome and Principe - Background Note #15: Blue Economy and Environmental Resiliency. World Bank, Washington, DC. Available at: openknowledge.worldbank.org/bitstream/handle/10986/32091/Sao-Tome-and-Principe-Country-Economic-Memorandum-Background-Note-15-Blue-Economy-and-Environmental-Resiliency.pdf?sequence=1&isAllowed=y
Devey Malu Malu, M. 2016. Fishing in São Tomé: small archipelago, huge EEZ. Jeune Afrique, 27 May 2016. Available at: www.jeuneafrique.com/mag/325378/economie/peche-a-sao-tome-petit-archipel-zee-immense/.
Marine Conservation Institute. 2020. MPAtlas [Online]. Seattle, WA. Available at: www.mpatlas.org Noël, S.-L. 2020. Semi-automation procedure for catch reconstruction forward carry, p. 15-20. In: B. Derrick,
M. Khalfallah, V. Relano, D. Zeller and D. Pauly (eds). Updating to 2018 the 1950-2010 Marine Catch Reconstructions of the Sea Around Us: Part I – Africa, Antarctica, Europe and the North Atlantic. Fisheries Centre Research Report 28(5).
Pikitch, E. and P. Doukakis. 2005. Recommendations for fisheries reform for São Tomé and Príncipe. Pew Institute for Ocean Science, Washington, D.C. 14 p.
Urbina, I. 2015. African court convicts captain of renegade ship in illegal fishing case. The New York Times, 12 October 2015. Available at: www.nytimes.com/2015/10/13/world/africa/african-court-convicts-captain-of-renegade-ship-in-illegal-fishing-case.html.
Tristan da Cunha Island (United Kingdom) Anon. 2014. Statistical Yearbook 2013/14. Statistics Office, Corporate Policy and Planning Unit, St Helena
Government Statistics Office. Available at: www.sainthelena.gov.sh/wp-content/uploads/2013/07/201314-Statistical-Yearbook.pdf.
Booth, S. and H. Azar. 2009. The fisheries of St Helena and its dependencies, p. 27-34. In: D. Zeller and S. Harper (eds). Fisheries catch reconstructions: Islands, Part I. Fisheries Centre Research Reports 17(5).
Booth, S., H. Azar and D. Knip. 2016. United Kingdom (Tristan de Cunha), p. 437. In: D. Pauly and D. Zeller (eds). Global Atlas of Marine Fisheries: A Critical Appraisal of Catches and Ecosystem Impacts. Island Press, Washington, DC.
Groeneveld, J.C., Von der Heyden, S. and Matthee, C.A., 2012. High connectivity and lack of mtDNA differentiation among two previously recognized spiny lobster species in the southern Atlantic and Indian Oceans. Marine Biology Research, 8(8), pp.764-770.
Noël, S.-L. 2020. Semi-automation procedure for catch reconstruction forward carry, p. 15-20. In: B. Derrick, M. Khalfallah, V. Relano, D. Zeller and D. Pauly (eds). Updating to 2018 the 1950-2010 Marine Catch Reconstructions of the Sea Around Us: Part I – Africa, Antarctica, Europe and the North Atlantic. Fisheries Centre Research Report 28(5).
Thomas, H. and O. Yates. 2018. Towards a Tristan da Cunha ‘Blue Belt’ Marine Protection Strategy – Meeting Report. Tristan da Cunha government. Available at: assets.publishing.service.gov.uk/government/uploads/system/uploads/attachment_data/file/757983/Tristan_da_Cunha_update_21_Nov_2018.pdf

2020 Fisheries Centre Research Reports 28(5)
114
The Pew Charitable Trusts. 2020. The Most Remote Islands in the Atlantic Ocean Need Protection. Available at: www.pewtrusts.org/en/research-and-analysis/issue-briefs/2020/03/the-most-remote-islands-in-the-atlantic-ocean-need-protection

Updating to 2018 the 1950-2010 marine catch reconstructions of the Sea Around Us: Part I – Africa, Antarctica, Europe and the North Atlantic
115
UPDATING TO 2018 THE CATCH RECONSTRUCTIONS FOR 14 COUNTRIES OF THE WEST AFRICAN MAINLAND*
Dyhia Belhabiba, Andrew Baiob, Ousmane Tagbé Camarac, Duncan Copelandd, Brittany Derricke, Alkaly
Doumbouyac, Sarah Harperf, Jeremias Francisco Intchamag, Josephus Mamieh, J.-P. Camille Maneli, Diene Ndiayej, Simon-Luc Noële, Daniel Paulye, Veronica Relanoe, Heiko Seilertk, Katherine Setol, Yonadav Anbare
and Dirk Zellerm a) Ecotrust Canada, Vancouver, BC, Canada.
b) Institute of Marine Biology and Oceanography, University of Sierra Leone, Sierra Leone c) Centre National des Sciences Halieutiques de Boussoura, République de Guinée
d) Trygg Mat Tracking, Postboks 1220 Sentrum, 5811 Bergen, Norway e) Sea Around Us, Institute for the Oceans and Fisheries, University of British Columbia, Canada
f) Fisheries Economics Research Unit, Institute for the Oceans and Fisheries, UBC, Canada g) Centro de Investimento Pesqueiro Aplicado, Guinea Bissau
h) Ministry of Fisheries and Marine Resources, Youyi Building, Freetown, Sierra Leone i) Department of Management and Exploitation of Seabed, Dakar, Senegal
j) Department of Fishing Industries and Processing, Dakar, Senegal k) Consultant, #62 Bell Mansion, Road 13, Bagong Pag-asa, Quezon City, Philippines l) Department of Environmental Science, Policy, and Management, U.C. at Berkeley,
m) Sea Around Us - Indian Ocean, School of Biological Sciences, University of Western Australia, Crawley 6009, WA, Australia
Abstract This original catch reconstructions for 1950-2010 for Benin, Congo (Brazzaville), Congo (Ex-Zaïre), Equatorial Guinea, Gabon, Guinea, Guinea-Bissau, Liberia, Morocco (Atlantic) Namibia, Nigeria, Senegal, Sierra Leone and Togo are here updated to 2018. The major challenge in updating catch reconstructions for countries of the African mainland, besides comprehensively accounting for domestic small-scale fisheries, is in estimating the reported and unreported catches of foreign fleets fishing within their Exclusive Economic Zones (EEZ). Data reported by fishing countries by the FAO statistical areas are presented in broad ocean areas (Eastern Central Atlantic and Southeast Atlantic) and must be assigned to the different EEZs. To do this, we used the ratios of reported landings per taxon, per fishing country that was assumed to fish within each EEZ in 2010, based on the original detailed research, and maintained these ratios to 2018, under consideration of the Sea Around Us fishing access database that contains foreign fishing access information between countries. Detailed descriptions of the methods used to update the data for each of the EEZs are presented by country. Introduction This contribution updates to 2018 the original catch reconstructions, covering the years 1950 to 2010 that were performed and published for Benin, Congo (Brazzaville), Congo (Ex-Zaïre), Equatorial Guinea, Gabon, Guinea, Guinea-Bissau, Liberia, Morocco (Atlantic) Namibia, Nigeria, Senegal, Sierra Leone and Togo. The major challenge in updating the catch reconstruction of countries of the African mainland, besides comprehensively accounting for domestic small-scale fisheries, is in estimating the reported and unreported catches of foreign fleets fishing within each Exclusive Economic Zone (EEZ). To address this challenge for
* Cite as: Belhabib, D., A. Baio, O.T. Camara, D. Copeland, B. Derrick, A. Doumbouya, S. Harper, J.F. Intchama, J. Mamie, J.-P.C. Manel, D. Ndiaye, S.-L. Noël, D. Pauly, V. Relano, H. Seilert, K. Seto, Y. Anbar and D. Zeller. 2020. Updating to 2018 the catch reconstructions for 14 countries of the West African mainland, p. 115-147. In: B. Derrick, M. Khalfallah, V. Relano, D. Zeller and D. Pauly (eds). Updating to 2018 the 1950-2010 Marine Catch Reconstructions of the Sea Around Us: Part I – Africa, Antarctica, Europe and the North Atlantic. Fisheries Centre Research Report 28(5).

2020 Fisheries Centre Research Reports 28(5)
116
West Africa, in July 2016, the first author, then with the Sea Around Us, organized a workshop at the Institute for the Oceans and Fisheries in Vancouver with several of the co-authors. Many of the insights presented herein originated from this workshop. Data reported by each West African country as well as by distant water fishing countries to the FAO are presented in broad FAO ocean areas (e.g., Eastern Central Atlantic, Southeast Atlantic) and must be assigned to the different EEZs. To do this, we have used the proportion of reported landings per taxon, per fishing country that was assumed fishing within each EEZ in 2010, based on the original detailed research, and maintained these ratios to 2018 with our database level application of fishing access information between fishing countries. Detailed descriptions of the methods used to update the data for each of 4 sectors for per EEZ are presented by country. The uncertainty associated with the reconstructed catch data presented below was assessed using the method presented in Pauly and Zeller (2016) and Zeller et al. (2016) and presented in this report in Derrick and Pauly (2020), but is not presented here by country. However, all catch data (reported as well as unreported) in the database of the Sea Around Us and available through its website (www.seaaroundus.org) are associated with a reliability score based on these uncertainty assessments. Benin Reconstructions of Benin’s marine fisheries catches were completed for 1950-2010 by Belhabib and Pauly (2015) and Belhabib et al. (2016). What follows are details of the update to 2015 and forward carry to 2018, by sector. Subsistence and lagoon (acadja) fisheries Here, the catch of subsistence fishers was updated for 2011-2015 using the methods described in the original reconstruction (Belhabib and Pauly 2015). The number of women fishers that glean was updated for 2011-2015 using the same ratio described in the original methods. The size of the household, CPUE, and consumption rate were all carried forward unaltered from 2010 to 2015 and used to calculate the subsistence catch. The taxonomic breakdown of subsistence catches was assumed the same as in 2010 for each fishing method. Gangbazo (2016) estimated the number of marine small-scale vessels to be 728 in 2014. The number of marine artisanal vessels in 2010 was interpolated to 728 in 2014 and multiplied by the household size and catch per unit effort (CPUE) per year. The rate of decline in small-scale boats between 2010 and 2014 was extrapolated for 2015.The total number of lagoon fishers was carried forward for 2011-2015 by interpolating between the 2010 anchor point and an anchor point of 61,650 lagoon fishers in 2012 (Ahouandjogbe et al. 2013). To update to 2015, the percentage of lagoon fishers in the total population was calculated for 2012 and used to calculate lagoon fishers for 2013-2015 based on updated total population data from the World Bank. The total number of lagoon subsistence fishers was separated between fishers who used acadja and those that did not based on the levels described in the original reconstruction (Belhabib and Pauly 2015). Artisanal and domestic industrial fishing Reported landings by commercial fisheries were updated for 2011-2015 using the FAO 2015 dataset and then assigned to the artisanal and industrial sectors based on the totals reported in national statistics (INSAE 2016). Unreported artisanal landings were calculated for 2011-2015 using the methods described in Belhabib and Pauly (2015) for 2010 and the anchor points described above for small-scale fishing vessels. Because national reported landings for this sector outweighed reconstructed catch, artisanal landings were assumed to

Updating to 2018 the 1950-2010 marine catch reconstructions of the Sea Around Us: Part I – Africa, Antarctica, Europe and the North Atlantic
117
be fully reported from 2013-2015. Similarly, total domestic industrial landings for 2011 were assumed to be the same in 2010 and unreported landings were determined as the difference between total landings and reported landings in 2011. Because reported landings for 2012-2015 were greater than the total catch estimated in 2010-2011, domestic industrial landings were assumed to be 100% reported for 2012-2015. Unreported landings from each sector were assigned to taxa for 2011-2015 based on the taxonomic breakdown in 2010. Because industrial landings in recent years are largely or perhaps entirely due to foreign fishing vessels (Ayoubi and Failler 2013; COMHAFAT/ATLAFCO 2014), domestic FAO reported landings in excess of nationally reported landings were assumed to have been due to foreign fishing in Nigeria and landed in Benin. Unless these vessels were registered as Benin vessels and thus flying the Benin flag while fishing, reporting such catches as Benin catches is flag-misreporting by Benin and is in contradiction to internationally agreed data reporting principles. More on foreign fishing Reported landings by foreign fishing entities were updated for 2011-2015 based on the percentages of reported taxa estimated to be caught in Benin’s EEZ in 2010. The large increase in reported landings in 2012-2014 by China was assumed to be the result of improved reporting rather than increased landings. Therefore, total landings by China in Benin in 2011-2015 were assumed to have remained as in 2010; unreported landings were determined to be the difference between total landings and reported landings. Unreported landings by Nigeria were held constant at the 2010 level because updated information was not available at this time. Commercially valuable bonga shad (Ethmalosa fimbriata) and Madeiran sardinella (Sardinella maderensis) continue to attract interest by foreign fishing entities (Petrossian 2018). Discards Discards from all industrial fisheries were updated for each fishing entity based on the ratio of discards to landings in 2010. Discarded taxa were assumed to remain at the 2010 ratio for 2011-2015. Transition from 2015 to 2018 The catch reconstructed to 2015 was carried forward to 2018 using the semi-automated procedures outlined in Noël (2020), based on FAO reported landings data available to 2018. Semi-automated reconstructed catch data will later be replaced by a more detailed, research-intensive update. Marine biodiversity protection Benin has an EEZ of 30,286 km2 that was declared in 1976 (Belhabib and Pauly 2015), and 30 % of the terrestrial area is protected (UNEP-WCMC and IUCN 2020). However, efforts towards management of marine resources and marine conservation are not prominent in the government’s agenda. The country is in the multilateral treaty of the Convention on Biological Diversity (Aichi), but currently there are no existing MPAs that protect Benin’s waters (Marine Conservation Institute 2020). Much of the coast of Benin is lined by seagrass beds, mangroves and saltmarshes, with seagrasses forming the predominant habitat (Bryan et al. 2020). Future MPAs would help preserve these rich ecosystems and their species from some of the current and potential threats, including concentration of population in coastal areas, offshore wind energy and climate change. Regarding the offshore wind energy viability in Benin, locations near the shore are the most suitable to offshore wind power generation (Aza-Gnandji et al. 2019).

2020 Fisheries Centre Research Reports 28(5)
118
Congo (Brazzaville) The catch of the marine fisheries of the People’s Republic of Congo, here: ‘Congo (Brazzaville)’, was originally reconstructed for the years 1950 to 2010 by Belhabib and Pauly (2015, 2016) and updated to 2014 by the Sea Around Us before being carried forward to 2018. Reported landings from artisanal and industrial fisheries were updated for 2011-2014 using the 2010 ratios assigned to each sector. The 2010 ratios of gear-types for each sector were maintained for 2011-2014. The taxa determined to be caught by demersal trawl or purse seine were allocated between gears using the 2010 ratios. The 2010 taxonomic breakdown of the FAO category “Marine fishes nei” was maintained for 2011-2014. The newly reported category of “Deep-water rose shrimp” in 2011-2014 was assumed to be caught by the artisanal and industrial sectors and using the same gears as “Penaeus shrimps nei”. Note that Congo has now banned blast fishing and small-mesh nets explicitly (Anon. 2011). A survey of demographics and estimates of catch from marine fisheries in the districts of Pointe Noire and Kouilou are available for 2006-2010 from a national study (Anon. 2013); however, the catch estimates therein are lower than our update estimates. Subsistence catches Subsistence catch were carried forward for 2011-2014 using the same methods as in the original reconstruction (Belhabib and Pauly 2015). The 2010 ratio of rural coastal population was used to calculate rural coastal population from total population information for 2011-2014 using data obtained from the World Bank. For 2011-2014, the consumption rate and the percentage of consumption attributed to subsistence fishing were held constant at the 2010 levels. The taxonomic breakdown of subsistence catch was maintained at the 2010 proportions for 2011-2014. Domestic industrial landings Domestic unreported landings were updated for 2011-2014 based on the 2010 ratio of unreported industrial landings to reported industrial landings. The ratio of gear-types and taxa breakdown for each gear-type was carried forward to 2014 at the 2010 ratio. Discards from industrial fisheries were carried forward for 2011-2014 using the percentage discarded for each fishery as described in the original methods. Foreign fishing Because no updated information was found, landings and discards from China fishing in the Congo (Brazzaville) were carried forward at the 2010 amounts unchanged. In 2011, Congo (Brazzaville) introduced a satellite surveillance system to monitor fishing vessels in national waters (Anon. 2011). To further dissuade illegal fishing in Congo’s EEZ, Congolese coastal patrol forces received training from the US Navy (Clark and Decalo 2012). In future updates to these changes may be reflected in the data through decreased illegal catch estimates.

Updating to 2018 the 1950-2010 marine catch reconstructions of the Sea Around Us: Part I – Africa, Antarctica, Europe and the North Atlantic
119
Figure 1. Reconstructed domestic catch in the EEZ of Congo (Brazzaville), by sector for 1950-2018. Transiting from 2014 to 2018 The catch reconstructed to 2014 was carried forward to 2018 using the semi-automated procedures outlined in Noël (2020), based on FAO reported landings data available to 2018. Semi-automated reconstructed catch data will later be replaced by a more detailed, research-intensive update. Marine biodiversity protection Congo (Brazzaville) has agreed to protect its biological diversity through the international Convention on Biological Diversity (Aichi) (Marine Conservation Institute 2020). Congo (Brazzaville) has one MPA and one marine managed area. The two areas’ extent is 3,896 km2, covering 10% of the entire EEZ (39,618 km2; Belhabib and Pauly 2016). The MPA is the Conkouati-Douli National Park (Parc National), which was designated in 1999 and covers 5049 km2 of terrestrial and water territories. The National Park is home to species such as Atlantic humpback dolphins (Sousa teuszii), humpback whales (Megaptera novaeangliae), West African manatees, and sea turtles, all of which are threatened by illegal commercial fishing in the region (Hoyt 2012). The marine managed area is called ‘Congo-Brazzaville Shark Sanctuary’. It was designated in 2001 and protects 966 km2 of water (Marine Conservation Institute 2020). The creation of this sanctuary was a response to an uncontrolled and illegal shark fishing industry that was very established along the country’s coastline. Due to the high price of shark fins in Asian markets, Congolese trawlers and professional small-scale fishers focused their efforts on this unauthorized practice (Marine Conservation Institute 2020). Even after the designation of the sanctuary and the fact that shark fishing was completely banned by the government, 126 shark-fishing permits were issued to private fishers from Benin, Congo and Ghana (Mikangou 2001). A fisher from a Beninese fishing village affirmed that “[s]ome of us don't have shark-fishing permits. […] Shark fishing brings in real money. In three days spent fishing, you can earn between 35,000 and 50,000 CFA francs”, i.e.,

2020 Fisheries Centre Research Reports 28(5)
120
50-75 USD at the time (Mikangou 2001). Moreover, enforcement of regulations is not remarkable prominent in the area (Marine Conservation Institute 2020). Congo (Ex-Zaïre) The reconstruction of marine fisheries catches in the Democratic Republic of Congo (DRC, Ex-Zaïre) was completed for 1950-2010 by Belhabib et al. (2015, 2016). Since this initial reconstruction, the FAO data have been retroactively changed. Thus, reported and unreported landings were corrected for the years 1987-1990 and 2000-2010, to consider the changes in the data reported by the FAO during the update to 2015 (Figure 1). Unreported landings were subsequently adjusted to maintain the total landings for the sector in years with retroactive changes; the most recent FAO statistics were used to carry forward the updated reconstruction to 2018. Subsistence fishing Catches by subsistence fishers were extrapolated for 2011-2015 based on the average decline in subsistence catch per year for 2000-2010. The earlier taxonomic breakdown of subsistence catches was maintained for the entire time series. Artisanal fishing Total artisanal landings were reconstructed for 2011-2015 using methods described in the original report. No recent estimates of the number of artisanal vessels were found at the time of update (Anon. 2012). An anchor point of 658 vessels was reported for 2009 in Anon. (2012), but this number was assumed an underestimate of the number of artisanal boats. As a result, the number of canoes in 2010 was assumed to remain the same for 2011-2015 and was multiplied by the catch per unit effort (CPUE) to estimate artisanal landings. The interpolated rate of decline in CPUE was determined for 1967-2010 and extrapolated to 2015. Unreported artisanal landings were determined to be the difference between total reconstructed artisanal catch and reported catch. Unreported artisanal landings were disaggregated with the same taxonomic breakdown throughout the time series. Foreign fishing Reported landings from China in DRC were updated for 2011-2015 based on the 2010 ratio of China’s catch in the Eastern Central Atlantic attributed to the DRC EEZ. The 2010 unreported landings by China in the DRC EEZ were carried forward unaltered to 2015. Discards were calculated for China’s total industrial landings in the DRC EEZ at the same ratio described in the original methods. The 2010 taxonomic breakdown of discards was used to disaggregate discards for 2011-2015. Transition from 2015 to 2018 The catch reconstructed to 2015 was carried forward to 2018 using the semi-automated procedures outlined in Noël (2020), based on FAO reported landings data available to 2018. Semi-automated reconstructed catch data will later be replaced by a more detailed, research-intensive update. Marine biodiversity protection Congo (ex-Zaire) has agreed to protect its biological diversity through the international Convention on Biological Diversity (Aichi) and the Ramsar Convention on Wetlands of International Importance and the World Heritage Convention (Marine Conservation Institute 2020). Congo (ex-Zaire) has one MPA and two marine managed areas. The three areas’ extent is 32 km2, which equals less than 1% of the entire EEZ (13,140 km2; Belhabib et al. 2016). The MPA is the ‘Parc National Marin des Mangroves’, designated in 1992 with 216 km2 (Marine Conservation Institute 2020).

Updating to 2018 the 1950-2010 marine catch reconstructions of the Sea Around Us: Part I – Africa, Antarctica, Europe and the North Atlantic
121
“The Mangrove Marine Park, like all the protected areas of the Democratic Republic of Congo, is under the responsibility of the Congolese Institute for the Conservation of Nature, abbreviated ‘ICCN’, a public establishment created by the Congolese State to monitor and protect the integrity of all these areas of high ecological value. […] Today, the Congolese Institute for the Conservation of Nature has more than 4,000 park wardens forming a veritable paramilitary troop, armed and dedicated, fully committed to monitoring protected areas. For the past thirty years, this troop has paid a heavy price to the cause of preservation through the supreme sacrifice of many of its members. The Democratic Republic of Congo is the country in the world where the largest number of Park rangers have been killed in the past three decades” (Le Parc Marin des Mangroves 2020). The two marine managed areas are the Natural Reserve of the Mangrove designated in 1992 with a total area of 1000 km2 and 12 km2 of reported marine area, and the Ramsar site (also in the Parc National des Mangroves), which was designated in 1996 and has a surface area of 660 km2. This Ramsar site “supports important fish and crustacean reserves for local fisheries. Nine species of rare or endangered mammals occur, including the manatee; six bird and eight reptile species, including marine turtles, are at risk from habitat destruction. Human activities include fishing, the gathering of medicinal plants, and subsistence cropping. Threats include extensive fuelwood cutting, refinery pollution, and uncontrolled urban development” (Ramsar sites information service, 2020). Equatorial Guinea The reconstruction of Equatorial Guinea’s marine fisheries catches for 1950-2010 was performed by Belhabib et al. (2015, 2016a, 2016b), updated to 2014 by the Sea Around Us, and carried forward to 2018. Updated information regarding Equatorial Guinea’s fisheries sectors was scarce, but Equatorial Guinea is currently ending a four-year project to improve its fisheries statistics and fisheries management (FAO 2015). When data from this project become available, they will be considered for the next reconstruction update. Artisanal, subsistence and recreational sectors Updated FAO data were used to update reported landings from artisanal fisheries for 2011-2014. Unreported landings from the artisanal and subsistence sectors were updated using the 2010 ratio of each sector to reported landings. The 2010 taxonomic breakdowns for unreported artisanal and subsistence catches were used unaltered for 2011-2014. Similarly, recreational landings were updated for 2011-2014 based on the ratio of recreational landings to reported landings in 2010. The 2010 ratios of taxa caught recreationally were held constant for 2011-2014. Industrial fisheries and their discards Unreported industrial landings were updated for each fishing entity based on the 2010 ratio of landings by that entity to reported domestic landings. The portion of a fishing entity’s catch estimated to have been caught illegally was held constant at the 2010 ratio. Unreported landings from 2011-2014 were disaggregated into taxa using the 2010 ratios for each fishing entity. Reported landings by China were updated for 2011-2014 based on the 2010 ratio of reported landings in the Eastern Central Atlantic assumed to be from Equatorial Guinea’s EEZ. Discards were updated to 2014 using the ratios of industrial landings described in the original reconstruction. The 2010 proportion of discards that arose from illegal fishing was held constant and used to calculate discards from illegal landings for 2011-2014. The taxonomic breakdown of discards remained unaltered for 2010-2014.

2020 Fisheries Centre Research Reports 28(5)
122
Updates from 2014 to 2018 The catch reconstructed to 2014 was carried forward to 2018 using the semi-automated procedures outlined in Noël (2020), based on FAO reported landings data available to 2018. Semi-automated reconstructed catch data will later be replaced by a more detailed, research-intensive update. Marine biodiversity protection Equatorial Guinea has agreed to protect its biological diversity through the international Convention on Biological Diversity (Aichi) and the Ramsar Convention on Wetlands of International Importance and the World Heritage Convention (Marine Conservation Institute 2020). Equatorial Guinea has six marine managed areas and one MPA. Together, these areas cover 521 km2 (Marine Conservation Institute 2020), which is tiny compared to the EEZ (308,275 km2; Belhabib et al. 2016b). The four marine managed areas are Annobón (Natural Reserve designated in 2000 with a total area of 221 km2), Isla de Annobón (Ramsar Site designated in 2003 with a total area of 230 km2), Playa Nendyi (Scientific Reserve designated in 2000 with a total area of 5 km2), Reserva Natural del Estuario del Muni (Ramsar Site designated in 2003 with a total area of 800 km2), Rio Campo (Natural Reserve designated in 2000 with a total area of 330 km2) and Río Ntem o Campo (Ramsar Site designated in 2003 with a total area of 330 km2) (Marine Conservation Institute 2020). The Ramsar sites are considered internationally important because of their protection of vulnerable habitats and species. The major activities in these sites are traditional fishing, hunting and subsistence agriculture (Ramsar sites information service 2020). The MPA of Corisco y Elobeyes is a Natural Reserve designated in 2000 with the intent to protect 462 km2 of marine and coastal ecosystems (i.e., 89% of all protected areas in Equatorial Guinean waters; Marine Conservation Institute 2020). A study indicates that marine megafauna would benefit from an expansion of this MPA, by creating a transboundary marine park with a newly established marine park in northern Gabon. “The results, however, also show that high impact areas are pervasive on the continental shelf, particularly near populated areas, highlighting that increasing protection of marine megafauna in this region will require more than just the implementation of MPAs. Specifically, turtle species were found to be highly impacted by access to nesting beaches, so the expansion of terrestrial protected areas in coastal areas also warrants further exploration. MPAs, however, will only be effective if they are supported by the development of national standards, best practice guidelines and management strategies to reduce the impact of terrestrial and marine human activities mentioned herein. Our results may therefore help initiate discussions among national implementing agencies, different sectors (e.g., fishing and industry) and key stakeholders by increasing awareness of current pressures on marine biodiversity, as well as facilitating the identification of viable strategies to mitigate and reduce pressures in areas of high impact” (Trew et al. 2019). Gabon The reconstruction of Gabon’s marine fisheries catches was performed for 1950-2010 as described in Belhabib (2015, 2016), and this account presents the update to 2014, which was then carried forward to 2018. Retroactive changes in the FAO 2014 dataset were identified which justified correction of the data for 2007-2010 (Figure 2); in years with retroactive changes to reported landings, the unreported landings were adjusted so that the total catch per sector remained the same. The original reconstruction was also updated to include the FAO reported landings of ‘Tilapias nei’, a brackish water taxon that is landed by artisanal fisheries in Gabon (FAO 2007).

Updating to 2018 the 1950-2010 marine catch reconstructions of the Sea Around Us: Part I – Africa, Antarctica, Europe and the North Atlantic
123
Figure 2. Reconstructed domestic catch in Gabon’s EEZ by fishing sector (1950-2018).
Subsistence fishing Subsistence catch was updated for 2011-2014 based on the 2010 ratio of subsistence catch to reported artisanal landings. The taxonomic breakdown of subsistence catch was carried forward unaltered at the 2010 proportions for 2011-2014. Domestic commercial fisheries: artisanal and industrial Reported landings for 2011-2014 were allocated to the artisanal and industrial sectors based on the 2010 ratios. Unreported artisanal landings were updated for 1996-2010 to account for the contribution of ‘Tilapias nei’ to the previously calculated total artisanal catch. Similarly, unreported industrial landings were updated for 2009-2010 based on the remainder of total catch that was not reported to FAO. Unreported landings from commercial fisheries were updated for 2011-2014 based on the 2010 ratio of unreported to reported landings for each sector. The taxonomic breakdown of unreported landings was held constant at the 1996 proportions for artisanal fisheries and the 2008 ratios for industrial fisheries. Since this update was completed, recent estimates of the catch and discards of the domestic and foreign industrial fleets in 2017 have become available from Anon. (2017). This information will be reviewed and incorporated in future updates. Discards from domestic fisheries were updated for 2011-2014 at the percentage of trawl landings described in the methods. The taxonomic breakdown of discards was held constant for 2011-2014. Foreign industrial fishing Landings by foreign fishing entities in Gabon for 2011-2014 were updated with FAO data using the 2010 ratios of catch allocated to Gabon’s EEZ. Unreported landings by South Korea were updated for 2011-2014 by assuming that total landings remained constant at the 2010 amount and that the difference between total landings and reported landings was determined to be unreported. Total landings by China in Gabon were assumed to remain constant for 2010-2014 because we assumed that large increases in reported landings by China in 2011-2012 were due to better reporting in those years rather than an increase in catch. Unreported

2020 Fisheries Centre Research Reports 28(5)
124
landings by fleets from Cameroon, Republic of Congo, Madagascar, and Togo were updated for 2011-2014 using the 2010 ratio for each fishing entity to total reported domestic landings for Gabon. Discards from foreign fishing entities were estimated using the 2010 ratios of discards to landings for each entity. The taxonomic breakdowns of discards and unreported landings by foreign fishing entities were held constant at the 2010 levels for 2011-2014. Transiting from 2014 to 2018 The catch reconstructed to 2014 was carried forward to 2018 using the semi-automated procedures outlined in Noël (2020), based on FAO reported landings data available to 2018. Semi-automated reconstructed catch data will later be replaced by a more detailed, research-intensive update. Recently, Gabon has taken steps to combat illegal fishing including signing the UN Port State Measures Agreement requiring vessels to request access to ports and to report their activities. In 2016, Gabon partnered with the Sea Shepherd organization to patrol Gabon’s EEZ for fisheries monitoring and enforcement (Anon. 2016; FAO 2016; MarEx 2016). Marine biodiversity protection Gabon has agreed to protect its biological diversity through the international Convention on Biological Diversity (Aichi) and the Ramsar Convention on Wetlands of International Importance (Marine Conservation Institute 2020). In 2014, Gabon announced plans to establish 23% of its EEZ as a no-take Marine Protected Area (Robinson 2014). Gabon has 32 MPAs and 11 marine managed areas. The MPAs span 52,075 km2 (Marine Conservation Institute 2020), which equals 27% of the entire EEZ (191,944 km2; Belhabib 2015). In 2002, the government of Gabon committed to create a network of MPAs in Gabonese waters, which currently host one of the largest MPA networks in Africa. The Reserve Aquatique du Grand Sud du Gabon, established in 2017, is one of the biggest MPAs, totalling 27,518 km2, contributing 52.8% of the area of all MPAs (Marine Conservation Institute 2020). One of the most famous MPAs is the Mayumba National Park, which is a no-take MPA of 908 km2 designated in 2003. It is well known because of the ecosystem services that it provides (from November to April) to the single largest population of nesting leatherback turtles, a critically endangered species and one of the main reasons for the creation of this MPA (Mayumba National Park 2011). In 1960, offshore oil and gas exploration began in Gabon and today there are about 40 offshore oil platforms in Gabon. These platforms act as artificial reefs on continental shelves and provide hard substrate in an area of sandy seafloors. There are several disadvantages associated with these structures, such as oil spills, noise, invasive species and vessel traffic. However, they may provide a unique habitat for some marine communities (Friedlander et al. 2014). “These platforms increase local production through enhanced settlement, increased reproductive output, and likely through reduced natural and fishing mortality. […] because they exclude trawl fishing and their large internal spaces offer shelter to fishes and other organisms. Platforms are complex structures, involving numerous crossbeams and large interstitial spaces” (Friedlander et al. 2014).

Updating to 2018 the 1950-2010 marine catch reconstructions of the Sea Around Us: Part I – Africa, Antarctica, Europe and the North Atlantic
125
Guinea The reconstruction of Guinea’s marine fisheries catches was completed for 1950-2010 by Belhabib et al. (2012, 2016); here, it was updated to 2015, then carried forward to 2018 using the semi-automation procedure of Noël (2020) and FAO landing data to 2018. Reported catch baseline The landings data reported to the FAO were compared to national industrial catch data reported by the Centre National des Sciences Halieutiques de Boussoura, provided by collaborators working specifically on the catch reconstruction for Guinea. Some inconsistencies in domestic industrial fisheries were noted during comparison between national and FAO datasets. These problems may result from the quality of industrial data. It may be that underestimation of industrial data has been reduced from 2011 to 2014, that an institutional change occurred, or that some foreign industrial landings were included. Due to inconsistencies in the national data, the FAO data was used to update reported landings. Unreported landings from commercial fishing Commercial fisheries in Guinea, as in all West African countries, includes a substantial artisanal sector deploying dugout canoes and a largely foreign industrial fishing sector deploying bottom trawlers. Unreported landings for commercial fisheries were estimated for 2011-2015 based on the 2010 ratio between unreported landings and reported landings. Discards were calculated for 2011-2015 using the original methods described for 2010 (Belhabib et al. 2012). The 2010 taxonomic composition was maintained to 2015 for unreported landings of each sector. Subsistence fishing Subsistence fisheries catches were reconstructed for 2011-2015 by multiplying updated population data available from the World Bank with the 2010 per capita consumption rate. Transition from 2015 to 2018 The catch reconstructed to 2015 was carried forward to 2018 using the semi-automated procedures outlined in Noël (2020), based on FAO reported landings data available to 2018. Semi-automated reconstructed catch data will later be replaced by a more detailed, research-intensive update. Marine biodiversity protection Guinea has agreed to protect its biological diversity through the international Convention on Biological Diversity (Aichi) and the Ramsar Convention on Wetlands of International Importance and the World Heritage Convention (Marine Conservation Institute 2020). Guinea has six marine managed areas and two MPAs6. Together, these areas cover 583 km2 (UNEP-WCMC and IUCN 2020), which is very small relative to its EEZ (109,439 km2; Belhabib et al. 2016). The major listed MPA, Tristao Faunal Reserve, was implemented by presidential decree in 2013 with an area of 1090 km2 but this information has gone largely unreported (Marine Conservation Institute 2020; UNEP-WCMC and IUCN 2020). Moreover, not much information is available about monitoring and enforcement of regulations governance type and management authority and the management plan from 2012 has not been updated until now. The marine managed areas are Ile Alcatraz (Ramsar Site with less than 1 km2 and designated in 1992 and Integral Natural Reserve since 2013), Ile Blanche (Ramsar Site with less than 1 km2 and designated in 1993), Iles Tristao (Ramsar Site with a total extent of 850 km2 and designated in 1992), Konkouré Delta (Ramsar Site
6 Natural Managed Reserve of the Tristao Islands and the Alcatraz Island Integral Reserve

2020 Fisheries Centre Research Reports 28(5)
126
with a total extent of 900 km2 and designated in 1992), Rio Kapatchez (Ramsar Site with a total extent of 200 km2 and designated in 1992) and Rio Pongo (Ramsar Site with a total extent of 300 km2 and designated in 1992) (Marine Conservation Institute 2020). The two smallest Ramsar sites are ecologically important and, for example, the Ile Alcatraz, which is covered by a thick layer of guano, also has the national, legal designation of “sanctuary” (Ramsar sites information service 2020a). The Ile Blanche is a rocky sand islet with coral. It provides refuge for the vulnerable olive ridley (Lepidochelys olivacea) turtle, which is threatened in the area by illegal activities, notably the collection of eggs (Ramsar sites information service 2020b). Guinea-Bissau The reconstruction of Guinea-Bissau’s marine fisheries catches was completed for 2011-2010 by Belhabib and Pauly (2015, 2016), updated to 2015 by Intchama et al. (2018), and carried forward using the semi-automation procedure outlined in Noël (2020) and FAO landing data to 2018. Illegal foreign fishing is rampant in Guinea-Bissau, including in its marine protected areas (Kaczynski and Djassi 2006), rendering all catch estimates from that country’s EEZ very uncertain. Subsistence and recreational fisheries The catches of subsistence fisheries were updated based on updated population data for 2011-2015 available from the World Bank and the per capita consumption rate from 2010. The total number of recreational fishers was extrapolated to 2015 based on the original methods for 2010-2012 and multiplied by the 2010 CPUE and the estimate of days fishers spent angling. The taxonomic breakdown from 2010 was used to disaggregate landings for all unreported landings and discards Artisanal and industrial fisheries The catches of the artisanal fisheries were updated using the methods in Belhabib and Pauly (2015). The annual numbers of artisanal vessels were available to 2015 and were multiplied by a CPUE of 150 kg·vessel-
1·day-1 and by the number of days that each vessel was assumed to operate per season. It was assumed that artisanal vessels operate 80% of the days during the fishing season. The Government of Guinea-Bissau reported industrial landings for 2011-2015. Reconstructed industrial landings were updated for 2011-2015 with a catch per unit effort (CPUE) of 14.8 kg·vessel-1·GRT-1·day-1 applied to national data on the number of vessels and days fished per year for the gear associated with the vessel. Discards were updated for 2011-2015 using the methods described for 2010 (Belhabib and Pauly 2015). Transition from 2015 to 2018 The catch reconstructed to 2015 was carried forward to 2018 using the semi-automated procedures outlined in Noël (2020), based on FAO reported landings data available to 2018. Semi-automated reconstructed catch data will later be replaced by a more detailed, research-intensive update. Marine biodiversity protection Guinea Bissau has agreed to protect its biological diversity through the international Convention on Biological Diversity (Aichi) and the Ramsar Convention on Wetlands of International Importance. Its commitments extend to NGOs and/or public bodies like the West Africa MPA Network or RAMPAO (Marine Conservation Institute 2020).

Updating to 2018 the 1950-2010 marine catch reconstructions of the Sea Around Us: Part I – Africa, Antarctica, Europe and the North Atlantic
127
Guinea Bissau has 12 MPAs and three marine managed areas. The MPAs’ extent is 8942 km2 (Marine Conservation Institute 2020), which represents 8.4 % of the entire EEZ (105,839 km2; Belhabib and Pauly 2015). The Bioguinea Foundation (a biodiversity conservation trust fund) supports protected area coverage and controls financial operations within Guinea-Bissau’s National Parks (Cross 2016). In some cases, like in the Urok Marine Protected Area (established in 2005 and occupying 618 km2), the zoning and the issuance of fishing licenses is a prerogative of the Ministry of Fisheries. Moreover, the Fisheries Monitoring Service (FISCAP) is in charge of the national regulations’ enforcement and surveillance of the Urok MPA. The rest of the management duties are performed by the Institute of Biodiversity and Protected Areas (IBAP). This may be an example of success where conservation and fisheries management are possible with a multi-stakeholder participatory approach at both the community and institutional level (Weigel et al. 2014). On the other hand, there is the case of the Orango National Park (designated in 2000 with 942 km2 of marine area), whose designation produced a series of issues between different stakeholders after fishers lost access to Ancopado beach. Nowadays, fishing persists in this MPA, demonstrating how an initially weak management plan can have detrimental effects to compliance, especially by small-scale fishers (Cross 2016). Liberia The reconstruction of Liberia’s marine fisheries catches was completed for 1950-2010 by Belhabib et al. (2016a, 2016b). Since the original reconstruction, updated FAO data became available and were used to update data for 2009-2015 (Figure 3), then the reconstructed data were carried forward to 2018, using the procedure in Noël (2020). In 2014-2015, Liberia experienced an outbreak of the Ebola epidemic (FAO 2014; Anon. 2016b). Here, , the impact of the Ebola epidemic on domestic fisheries is not accounted for in Liberia’s catch reconstruction due to a lack of available numerical estimates, but the likely change in seafood consumption during this period should be addressed in future updates. Basic considerations Reconstructed landings from small-scale and industrial fisheries were updated for 2011-2015 using the methods outlined in Belhabib et al. (2016a). Updated information on the number of artisanal and industrial vessels was available for 2015 (Kay 2016). Total number of vessels were interpolated between the 2010 and 2015 anchor for each vessel type. The catch per unit effort (CPUE) estimates for each vessel type were extrapolated to 2015 based on the 2009-2010 rate of decline. The number of artisanal Popoh fishers were estimated for 2011-2015 using the 2010 ratio between artisanal canoes and Popoh fishers. Updated population data were available from the World Bank and were multiplied by the percentage of the total population that was deemed rural coastal in 2010 in order to calculate subsistence catches from lagoon fishing. The taxonomic breakdown from 2010 for each sector was held constant for 2011-2015.

2020 Fisheries Centre Research Reports 28(5)
128
Figure 3. Comparison of retroactive changes to FAO data versions for Liberia within Eastern Central Atlantic for 2000-2018. European vessels in Liberia In 2015, Liberia signed a five-year fishing agreement with the European Union that permits European vessels to fish for tuna and other highly migratory taxa in Liberian waters (Anon. 2015). The funds from this agreement will be used to help Liberia to improve monitoring, control and surveillance of its waters to protect against illegal fishing (Anon. 2015). Ghana has also recently agreed to cooperate with Liberia in its fight against illegal fishing in its waters (Anon. 2016a). Other foreign fishing Estimates of landings and discards by foreign fishing entities fishing in Liberia were updated for 2011-2015. The ratio of landings by foreign fishing entities in the Eastern Central Atlantic taken from Liberia’s EEZ was determined for 2010 and was assumed to remain constant for 2011-2015. Angola, Ghana, and Senegal did not report landings in Liberia in 2010, therefore, unreported landings by these entities were held constant at the 2010 amount for 2011-2015. The 2010 taxonomic ratios were carried forward unaltered for unreported landings for each fishing entity. The discards of foreign fishing fleets were calculated for 2011-2015 based on the 2010 ratio of discards to landings for each fishing fleet. The ratio of discards attributed to illegal fishing was held constant at the 2010 levels. Discarded taxa were disaggregated using the 2010 ratios. Transition from 2015 to 2018 The catch reconstructed to 2015 was carried forward to 2018 using the semi-automated procedures outlined in Noël (2020), based on FAO reported landings data available to 2018. Semi-automated reconstructed catch data will later be replaced by a more detailed, research-intensive update. Marine biodiversity protection Liberia has agreed to protect its biodiversity through the international Convention on Biological Diversity (Aichi) and the Ramsar Convention on Wetlands of International Importance and the World Heritage Convention (Marine Conservation Institute 2020). Liberia has five marine managed areas and no MPAs. Together, these areas cover 256 km2 (UNEP-WCMC and IUCN 2020), which equals less than 1% of the entire EEZ (246,093 km2; Belhabib et al. 2016b).
Updating to 2018 the 1950-2010 marine catch reconstructions of the Sea Around Us: Part I – Africa, Antarctica, Europe and the North Atlantic
129
The five marine managed areas are Lake Piso Reserve (Multiple Sustainable Use Reserve designated in 2003 with a total area of 339 km2), Lake Piso (Ramsar Site designated in 2003 with a total area of 760 km2), Margibi Mangrove (National Park designated in 2003 with a total area of 238 km2), Marshall Wetlands (Ramsar Site designated in 2006 with a reported marine area of 67 km2) and Mesurado Wetlands (Ramsar Site designated in 2006 with a reported marine area of 22 km2) (Marine Conservation Institute 2020). The Ramsar site of Lake Piso, also called Fisherman’s Lake (Marine Conservation Institute 2020), is the largest of these marine managed areas and has the national legal designation of ‘Nature Conservation Unit’. “The site is important both as a nursery and spawning ground for fish and sea turtles and as feeding and roosting places for large numbers of shore and sea birds. Mammals such as antelopes, duikers, monkeys, bushbucks, and a few crocodiles are also found in the area” (Ramsar sites information service 2020). Morocco (Atlantic) The total fisheries catches for Morocco were reconstructed from 1950 to 2010 by Belhabib et al. (2012, 2016a, 2016b). Morocco was defined as comprising of three parts with respect to fisheries: (1) North, consisting of the Mediterranean coast of Morocco (FAO area 37), and updated in Khalfallah (2020; see also Derrick and Pauly 2020); (2) Central, consisting of the Atlantic coast of Morocco from the Strait of Gibraltar to the border of the former Spanish Sahara, and (3) South, consisting of the former Spanish Sahara, which Morocco claims as part of its territory. The catch reconstruction and updates of parts (1, North) is addressed in Khalfallah (2020), while parts (2, Central) and (3, South), representing ‘Morocco (Atlantic)’in FAO area 34 is updated here to 2014, and then carried forward to 2018, based on the semi-automation procedure in Noël (2020) and the FAO landing data to 2018. The catch data that were carried forward will later be replaced by a more detailed update. Reporting baseline The data reported by the FAO for FAO areas 34 and 37 on behalf of Morocco was compared to national statistical reports from the Office National des Pêches (ONP 2012, 2013, 2014, 2015), as well as stock and fishery assessments from the Institut National de Recherche Halieutique (INRH 2014, 2015). The FAO data were accepted as the reported catch baseline for 2011 to 2014 for domestic industrial catches, split spatially and taxonomically according to 2010 proportions between the North, Central, and South parts of Morocco’s Exclusive Economic Zone (EEZ). Reported catches in the Atlantic (i.e., Central and South) spiked considerably from 2012 to 2014. This increase may be due to improved reporting with the establishment of the Halieutis Strategy (MEF 2013) but may be a sign of catches by foreign ships flying Moroccan flags. No information on this latter re-flagging issue is currently available, though it is likely. A reported baseline for foreign fishing in Morocco was established by allocating a portion of catches from countries other than Morocco operating in FAO area 34 (Eastern Central Atlantic) to the Moroccan Atlantic EEZs, following 2010 proportions. Reports by the INRH (2014, 2015) indicate that fishing vessels from Russia and the EU may be catching more than is estimated with this method, potentially requiring a re-evaluation of foreign fishing in Moroccan waters. This adds considerable uncertainty around foreign fisheries catches in Moroccan waters. Artisanal fisheries Artisanal fisheries catches operating from barques were reconstructed using artisanal fleet size data (DPM 2011; Anon. 2012) and estimated catch per unit effort (CPUE) carried forward from Belhabib et al. (2012). Catch per unit effort (CPUE) in the Atlantic EEZ of Morocco was extended forward following the declining

2020 Fisheries Centre Research Reports 28(5)
130
CPUE trend from 2008-2010. Unreported artisanal catches from barques were estimated by multiplying the CPUE with the number of vessels, and taxonomically allocated as in 2010. The illegal artisanal cephalopod fishery catches were carried forward unchanged. Subsistence and recreational fisheries The subsistence fishery of Atlantic Morocco, composed of artisanal catch retained for subsistence purposes and bivalve catches for subsistence and bait, was reconstructed following the method from Belhabib et al. (2012) for each sector. The unreported recreational fishery was carried forward from 2010 unchanged. Industrial fisheries The unreported industrial fisheries catches were examined for 3 different sectors: the offshore fishery within the Moroccan Atlantic EEZ, and the large-scale coastal pelagic and coastal demersal fisheries. The ratio of the unreported catch of each of these components to the reported industrial landings for 2010 was derived and maintained to 2014 to estimate their catches and split spatially and taxonomically according to 2010 ratios. Foreign fisheries The unreported catch of foreign vessels in the Moroccan Atlantic EEZs was carried forward to 2014 using the original method as an average of estimated catches using the ratio of unreported-to-reported foreign catches and the ratio of unreported foreign-to-reported domestic catches for 2010. This average was allocated to the Central and South parts of the EEZs and the same fishing entities following the original 2010 ratios. Given the large spike in reported domestic catches from 2012 to 2014, it is likely that foreign vessel catches (or reflagged catches) may be mixed in with truly domestic catches. This should be looked at more closely in future research-intensive updates. Managing the Moroccan fisheries Morocco’s fisheries received close scrutiny from 2011 to 2014. Many projects assessed Morocco’s fisheries sustainability and worked to improve the country’s reporting infrastructure, which is currently fragmented between multiple departments (DPM 2011; Anon. 2012; MEF 2013). Morocco’s partnerships with countries in the EU remained strong, with the renewal of fishing agreements between the EU and Morocco (Anon. 2011) and research initiatives between Spain and Morocco addressing the state of the Atlantic bluefin tuna (Thunnus thynnus) population in the Mediterranean (Malouli Idrissi et al. 2013). Scientific stock assessment reports for major fished stocks in Morocco for 2013 and 2014 provide more granularity in understanding the fisheries sector of Morocco (INRH 2014, 2015); however, these were not considered in the current update. Transition from 2014 to 2018 The catch reconstructed to 2014 was carried forward to 2018 using the semi-automated procedures outlined in Noël (2020), based on FAO reported landings data available to 2018. Semi-automated reconstructed catch data will later be replaced by a more detailed, research-intensive update. Marine biodiversity protection Morocco has agreed to protect its biological diversity through the international Convention on Biological Diversity (Aichi) (Marine Conservation Institute 2020). The Moroccan Atlantic EEZ has one MPA that covers 129 km2 (Marine Conservation Institute 2020), which is minuscule compared to the EEZ of Morocco in the Atlantic (558,766 km2; Belhabib et al. 2016a, 2016b). This MPA is the National Park of Sous Massa and its marine area is a no-take reserve managed by the high Commission for Water and Forests and designated in 1991 (Marine Conservation Institute 2020).

Updating to 2018 the 1950-2010 marine catch reconstructions of the Sea Around Us: Part I – Africa, Antarctica, Europe and the North Atlantic
131
“This park protects continental and marine environments. It is crossed by [the] Souss and Massa river estuaries. The park administratively is under three provinces: Aït Melloul Inezgane, Chtouka Aït Baha, and Tiznit (Harif et al. 2008). The park consists of four areas [(Conservation area of natural resources, Natural resource management areas, Traditional use areas and Special use areas)] that are subject to a 5-year development plan and management” (Hirich et al. 2016). Some of the threats in the marine ecosystems of the Natural Park originate from agricultural run-off and discharge of sewage. “Nitrogen and phosphorus are the prime causative agents of eutrophication, the former tending to be more problematic in the marine environment, and the latter in freshwater systems. Adverse environmental impacts upon receiving waters, fresh and marine, are numerous. An extensive 4-year study found that most of the nitrogen entering the Bay stayed there and is assimilated there. Consequently, the report recommended a precautionary of at least a primary treatment, which allows a reduction of 50% nitrogen load” (Choukr-Allah et al. 2016). Namibia The original reconstruction of Namibia’s fisheries catches for 1950-2010 is detailed in Belhabib et al. (2015, 2016a, 2016b); this report details how the catch reconstruction was updated to 2014, and then forward carried to 2018. Subsistence and recreational fishing Subsistence fishers were estimated for 2011-2014 as a ratio of the total population based on the 2006 percentage of subsistence fishers in the total population. For 2011-2014, the number of days spent subsistence fishing were assumed to be the same as in 2010. Subsistence catch per unit effort (CPUE) was assumed to have continued to decline at the same rate for 2011-2014 as derived for 1996-2010. The taxonomic breakdown for subsistence catches were assumed to be unchanged since 2010. Recreational catches were updated for 2011-2014 using the 2010 ratio to reported catches. The 2010 taxonomic breakdown for recreational catches was carried forward unaltered to 2014. Industrial domestic fisheries The ratio of reported catch assigned to the industrial fishing sector was assumed to remain the same as in the original reconstruction. The 2010 ratio of unreported industrial landings to reported landings was used to update unreported catch for 2011-2014. The taxonomic breakdown of unreported industrial landings was assumed to be the same as the reported industrial landings for 2011-2014. Discards from the industrial fisheries were updated using the same discard rate and taxonomic ratios as in the original reconstruction. Foreign industrial fishing Reported landings by foreign fishing entities were determined for the Southeast Atlantic region (FAO area 47) using the FAO data. The 2010 taxa caught per fishing entity in Namibia’s EEZ were assumed to have remained the same for 2011-2014. Unreported landings by foreign fishing entities were calculated using the 2010 ratio of reported landings for each fishing entity and were assigned to the category “marine fishes not identified” as in the original reconstruction. However, it is known that foreign vessels heavily target European anchovy (Engraulis encrasicolus), South American pilchard (Sardinops sagax), Whitehead’s round herring (Etrumeus whiteheadi), Cape horse mackerel (Trachurus capensis), deep-water cape hake (Merluccius paradoxus), and snoek (Thyrsites atun) (Petrossian 2018). This information will be used to improve the taxonomic resolution of foreign catches in future updates.

2020 Fisheries Centre Research Reports 28(5)
132
Transition from 2014 to 2018 The catch reconstructed to 2014 was carried forward to 2018 using the semi-automated procedures outlined in Noël (2020), based on FAO reported landings data available to 2018. Semi-automated reconstructed catch data will later be replaced by a more detailed, research-intensive update. Recent literature presents both the successes and failures of Namibia’s fisheries management. Hake stocks have failed to recover since the high pressure placed on them by distant water fleets prior to 1990 (Paterson et al. 2013; Paterson and Kainge 2014). Paterson and Kainge (2014) stated that the Total Allowable Catch assigned to this fishery is too high to allow the stock to recover. Management of illegal fishing has been successful in Namibia because of strong deterrents including high penalties, effective monitoring, and enforced restrictions to Namibia’s EEZ (Sjöstedt and Sundström 2015). Marine biodiversity protection Namibia has agreed to protect its biological diversity through the international Convention on Biological Diversity (Aichi) and the Ramsar Convention on Wetlands of International Importance and the World Heritage Convention (Marine Conservation Institute 2020). Namibia has two MPA and five marine managed areas. Together, the MPAs cover 9,423 km2 (Marine Conservation Institute 2020), which equals 2% of the entire EEZ (560,101 km2; Belhabib et al. 2016b). The five marine managed areas are Namib-Naukluft (a National Park designated in 1986 with a reported marine area of 18 km2), Skeleton Coast Park (a National Park designated in 1973 with a marine reported area of 26 km2), Orange River Mouth (a Ramsar Site designated in 1995 with a total area of 5 km2), Sandwich Harbour (a Ramsar Site designated in 1995 with a total area of 165 km2) and Walvis Bay (a Ramsar Site designated in 1995 with a total area of 126 km2) (Marine Conservation Institute 2020). Sandwich Harbour is the largest of those Ramsar sites with a wetland fed from an aquifer that is slowly disappearing. This wetland is inside the largest MPA of Namibia, the Namib-Naukluft Park (designated in 2009), which is under tidal influence and supports endangered species and human activities such as fishing, guano collection, tourism and recreation (Ramsar sites information service 2020). The other MPA, Cape Cross Seal Reserve (designated in 1968; Marine Conservation Institute 2020, 60 km2; Ministry of Environment and Tourism Namibia 2020), is a so-called sanctuary for the world’s largest breeding colony of South African fur seals (Arctocephalus pusillus), with up to 210,000 individuals present during the breeding season in November and December. However, “[s]ustainable seal harvesting takes place in the reserve annually under the auspices of the Ministry of Fisheries and Marine Resources, which also sets the quota of seals to be harvested” (Ministry of Environment and Tourism Namibia 2020). Nigeria Nigeria’s marine fisheries catches were reconstructed for 1950-2010 by Etim et al. (2015, 2016). This section presents the details of an update to 2015 that was subsequently carried forward to 2018. Artisanal and domestic catch Increases in reported landings for 2011-2015 by Nigeria were assumed to be due to an improvement in reporting rather than actual catch increases. However, Nigerian marine resources are reportedly overexploited (Nsentip 1983, Moses 1989, Ajayi 1991, Ganapathiraju and Pitcher 2006 and Falaye 2008) and catches from several fisheries components continue to go unreported (Etim et al. 2015). Reported landings by industrial

Updating to 2018 the 1950-2010 marine catch reconstructions of the Sea Around Us: Part I – Africa, Antarctica, Europe and the North Atlantic
133
and artisanal fisheries were updated with the FAO data for 2000-2015 (Figure 4) based on the data allocations to each sector in the national reports in Akintola and Fakoya (2017) and NBS (2017).
Figure 4. Reconstructed domestic catch within Nigeria’s EEZ by fishing sector for 1950-2018. Total unreported industrial landings were extrapolated for 2011-2015 based on the 2010 rate of decline in the ratio of unreported landings from 2009. Unreported subsistence catches were assumed constant for 2010-2015. The 2010 percentage of industrial unreported catch attributed to fish trawlers and shrimp trawlers was assumed to remain constant for 2011-2015. Artisanal landings were held constant for 2011-2013 and fully reported from 2013 onward when reported landings were greater than reconstructed landings. Unreported landings were disaggregated to taxa for 2011-2015 based on the 2010 taxonomic breakdown for each sector. Discards were updated for 2011-2015 using the 2010 ratio of discards to total industrial landings. Transition from 2015 to 2018 The catch reconstructed to 2015 was carried forward to 2018 using the semi-automated procedures outlined in Noël (2020), based on FAO reported landings data available to 2018. Semi-automated reconstructed catch data will later be replaced by a more detailed, research-intensive update. While an estimated 90% of Nigeria’s coastal communities depend on fishing and fisheries for their livelihood, landings from fisheries in Nigeria have not been enough to keep up with the domestic demand for fish in recent years (Gbigbi and Enete 2014). Nigeria’s per capita fish consumption rate has been estimated at 11 kg per year (Anon. 2016). In order to meet this demand, approximately 200 million USD worth of frozen fish are imported by Nigeria each year (Gbigbi and Enete 2014). In 2014, Nigeria introduced a structured embargo with the hope of becoming self-sufficient in fishery products, but that embargo appears to have been lifted in 2016 (Davies 2016). Nigeria’s proximity to transshipment and ports of convenience locations puts it at high risk of illegal, unreported, and unregulated fishing (Petrossian 2018). Indeed, illegal foreign trawlers contribute to the problem, as they continue to fish in coastal areas in Nigeria with little threat from the over-stretched policing activities of the Nigerian Navy (Anon. 2016). A future update will have to concentrate on this issue.

2020 Fisheries Centre Research Reports 28(5)
134
Marine biodiversity protection Nigeria has agreed to protect its biological diversity through the international agreements of the Convention on Biological Diversity (Aichi) and the Ramsar Convention on Wetlands of International Importance (Marine Conservation Institute 2020). Currently, Nigeria has no MPAs. However, 128,070 km2 are proposed to be protected in the future. This extent would occupy nearly 60% of the entire EEZ (216,325 km2; Etim et al. 2015). The terrestrial protected areas cover 15.2% of the total landmass of Nigeria, but these areas are so degraded that they are far from the target 4 of the National Biodiversity Strategy and Action Plan (2016 – 2020) (Olaniyi et al. 2019). “There were stark evidences that people enter the protected areas (PAs) with ease either for farming activities and/or collection of fuel wood. The cattle herdsmen equally lead their animals into the PAs without hindrances. It was equally observed that some residents of communities located near the PAs scavenge for dried twigs of trees for fuel wood while some engaged in direct cutting of these trees. To these people, there was nothing extraordinary in the rate at which they make use of resources within the PAs. In their opinion, resources within the protected areas were seen as God-given endowment that is freely available to the people. It was also confirmed that many people especially the poor wouldn’t have survived the harsh economic reality in the society without these resources” (Olufemi and Kenneth 2019). If marine protected areas were to be established in Nigerian waters, they should involve the different stakeholders within planning, managing and monitoring. Otherwise, they would likely turn into paper MPAs similar to the terrestrial areas that are supposedly protected. Senegal The original reconstruction of Senegal’s marine fisheries catches was completed for 1950-2010 by Belhabib et al. (2013, 2014a, 2016b). It was updated to 2015 here and carried forward to 2018 using the semi-automation procedure of Noël (2020) and FAO landing statistics to 2018. Reported baseline catch data Data were gathered for artisanal and industrial landings for 2011-2015 for both domestic and foreign fleets operating in Senegalese waters. The number of industrial fishing vessels, vessel name, gear type, and GRT were collected from the Department of Surveillance and Protection of Fisheries (DPSP), and data on exports and imports were extracted from statistical reports of the Senegalese government. Industrial landings To reconstruct large-scale fisheries catches, we used the method developed by Belhabib et al. (2014). This allowed us to estimate the product of the daily catch per unit effort (CPUE) per unit of GRT (kg·GRT-1·day-1), the GRT for each vessel, the number of days of fishing operation of each vessel, we were then able to sum the result to obtain the total catch per year. The CPUE was estimated by Belhabib et al. (2014a) using the Monte-Carlo method (Pauly et al. 2013) as 14.8 kg·GRT-1·day-1 for 2010. The average number of fishing days for the trawl fleet (coastal and offshore demersal) was estimated at 275 fishing days per year (11 trips per year, and 25 fishing days per trip). Industrial discards Discards were estimated based on the discard rates described by Belhabib et al. (2014) and ter Hofstede and Dickey-Collas (2006), who estimated the discard rates at 38% for the demersal and shrimp trawl fleet catches and 12% for the purse seine and pelagic trawl fleet catches, respectively.

Updating to 2018 the 1950-2010 marine catch reconstructions of the Sea Around Us: Part I – Africa, Antarctica, Europe and the North Atlantic
135
Subsistence catches Subsistence catches were extrapolated for 2011-2015 based on the last 5 years of the previous reconstruction. The taxonomic breakdown for each sector was maintained at the 2010 composition. Recreational catches Recreational catches were estimated as the product of the number of tourists fishing per year (4% of the tourist population; Belhabib et al. 2014a), the CPUE of 35 kg·tourist-1 day-1 (Belhabib et al. 2016a), and five fishing days·tourist-1 year-1 (Belhabib et al. 2014a; 2016a). The tourist population was updated for 2011-2015 from World Bank data. Artisanal catches Artisanal catches caught in Senegal’s Exclusive Economic Zone (EEZ) can be difficult to distinguish from catches by the same fleet segments taken in neighboring countries’ waters but reported as caught in Senegalese waters. It is though that Senegalese artisanal fishers typically catch over 40% of their catch outside of Senegal (Belhabib et al. 2014a). We estimated unreported artisanal catches iteratively following the formula: country population x consumption per person per year = artisanal catch + industrial catch - exports + imports + recreational catch + subsistence catch. Updated population data were available from the World Bank. Import and export data were available in wet weight or converted from product weight to wet weight where necessary. The per capita consumption rate, obtained from surveys, is estimated as 29 kg·person-1 year-1 (Agence Nationale des Statistiques et de la Démographie, unpublished data). Overall, we assumed that 40% of total estimated artisanal catches (reported + unreported) are caught outside Senegal for 2011-2015 as in previous years (Belhabib et al. 2014a). The number of pirogues used in the original catch reconstruction was contested by Chaboud et al. (2015), but Belhabib et al. (2015) refuted their claims. However, it would be useful to revisit this issue, given the large role that artisanal fisheries play in Senegal. This research-intensive investigation should be done while also revising the semi-automatic carry forward to 2018. Updates to select taxa Bonga shad (Ethmalosa fimbriata) Reconstructed catches of Bonga shad (Ethmalosa fimbriata) were lower than artisanal catches reported by expert working group (FAO 2020). Because artisanal fishing by Senegalese pirogues occurs in neighbouring countries (classified by Sea Around Us as industrial), missing species-level catches of Ethmalosa fimbriata present in FAO (2020) were disaggregated from Senegalese catches of ‘Marine fishes not identified’ by artisanal pirogues fishing outside of Senegal for 1990-2017. Cunene horse mackerel (Trachurus trecae) Comparison of reconstructed catches of Cunene horse mackerel (Trachurus trecae) with catches reported by expert working group (FAO 2020) alerted us to missing catches at species-level from the original reconstruction (Belhabib et al. 2014a; Palomares et al. 2020). Similar to the methods for Bonga shad described above, we disaggregated missing catches of Trachurus trecae present in FAO (2020) from reconstructed catches of ‘Marine fishes not identified’ for artisanal pirogues and unreported industrial domestic landings for 1990-2011. Correction to original artisanal taxonomy 1950-1980 Following species level assessment using CMSY, the original use of Bergerard and Samba (1980) to taxonomically disaggregate artisanal unreported landings for 1950-1976 within the original reconstruction

2020 Fisheries Centre Research Reports 28(5)
136
(Belhabib et al. 2014a) was re-evaluated. Bergerard and Samba (1980) provided taxonomic information for average catch proportions per trip from two landing sites (Kayar and St Louis) and as a result, we deemed this information unlikely to be representative of unreported artisanal landings across Senegal’s coastline during this time period. Instead, the taxonomic breakdown from 1981 by Samba (1994) was held constant for 1950-1981 as it was deemed more representative of artisanal unreported landings at the national level. Transition from 2015 to 2018 The catch reconstructed to 2015 was carried forward to 2018 using the semi-automated procedures outlined in Noël (2020), based on FAO reported landings data available to 2018. The semi-automated reconstructed catch data will later be replaced by a more detailed, research-intensive update, which will also have to account for the increasing, but unreported fraction of Senegal’s artisanal and industrial catch of small pelagic fish that is diverted from local human consumption to fishmeal factories whose production is exported to East Asia (Pauly 2019a, 2019b). Marine biodiversity protection Senegal has agreed to protect its biological diversity through the international Convention on Biological Diversity (Aichi), the Ramsar Convention on Wetlands of International Importance and the World Heritage Convention and it is also part of the international network of UNESCO called Man and the Biosphere. Its commitments extend to NGOs and/or public bodies like the West Africa MPA Network (RAMPAO) (Marine Conservation Institute 2020). Senegal has 16 MPA and four marine managed areas. Together, the MPAs cover 1,528 km2 (Marine Conservation Institute 2020), which equals about 1% of its EEZ (157,709 km2; Belhabib et al. 2016b). The four marine managed areas are Delta du Saloum (a UNESCO-MAB Biosphere Reserve designated in 1980 with a reported marine area of 1,800 km2), Reserve ornithologique de Kalissaye (a Bird Reserve designated in 1978), Delta du Saloum (a Ramsar Site designated in 1984 with a total area of 730 km2) and Gueumbeul (a Ramsar Site designated in 1986 with a total area of 7 km2) (Marine Conservation Institute 2020). The Delta du Saloum is the largest of those Ramsar sites and “supports a varied fauna, including numerous species of notable mammals, four species of breeding turtles, and numerous species of nesting waterbirds and wintering Palearctic migrants. Human activities include nature conservation, tourism, and pastoralism. Management issues include illegal gathering of molluscs, and of bird and turtle eggs and unsustainable exploitation of plant products. Surrounding areas are used for agriculture, livestock rearing, fishing, and hunting” (Ramsar sites information service 2020). “[T]he Saint Louis MPA, covering a total area of 496 km2, is the largest in Senegal and responded to the need to repopulate the seabeds alongside one of the country’s main fishing grounds and to keep foreign trawlers away. […] We applaud the avowed desire of the Government and its departments to involve the Guet Ndariens (locals from area in Saint Louis) in the various stages of the process, from choosing the MPA site to defining the management plans. However, significant challenges and problems specific to this complex region emerged when the initiative was implemented. […] The steady increase in the number of fishermen has led to a high building density (traditionally, there are no two-storey houses in this district) and put growing pressure on fish resources against a general background of fish depletion and competition for access both to fishing zones, especially between small-scale fishermen, trawlers and shrimpers […]” (Cormier-Salem 2014). Sierra Leone Sierra Leone’s marine fisheries were described in Valily et al. (2012), and their catches were reconstructed for 1950-2010 by Seto et al. (2015, 2016) and updated to 2015 as described by Seto et al. (2017). Here, their catch

Updating to 2018 the 1950-2010 marine catch reconstructions of the Sea Around Us: Part I – Africa, Antarctica, Europe and the North Atlantic
137
is carried forward from 2015 to 2018 using the semi-automated procedure in Noël (2020) and using FAO landings data to 2018. Okeke-Ogbuafor et al. (2019) examined the various issues associated with the decline of fisheries resources in Sierra Leone. They noted a lack of political will to mitigate the damage caused by the most destructive foreign trawl fisheries and suggested that this issue could be addressed by a coalition of local fishers’ associations and a strong focus on environmental education and fish processing. Marine biodiversity protection Sierra Leone has agreed to protect its biological diversity through the international Convention on Biological Diversity (Aichi) and the Ramsar Convention on Wetlands of International Importance and the World Heritage Convention (Marine Conservation Institute 2020). Sierra Leone has eight marine managed areas and no MPAs. Together, these areas cover 863 km2 (UNEP-WCMC and IUCN 2020), which is less than 1% of the entire EEZ (159,300 km2; Seto et al. 2016). The eight marine managed areas are Scarcies River Estuary (Marine Protected Area designated in 2012 with a total marine area of 102 km2), Sewa-Waanje (Game Reserve with a total area of 100 km2), Sherbro River Estuary (Marine Protected Area designated in 2012 with a total marine area of 283 km2), Sierra Leone River Estuary (Marine Protected Area designated in 2012 with a total area of 248 km2), Sierra Leone River Estuary (Ramsar site designated in 1999 with a total area of 2950 km2), Yawri Bay (Marine Protected Area designated in 2012 with a total marine area of 760 km2), Bonthe Mangrove Swamp (Strict Nature Reserve with a total area of 998 km2), and Sulima Mangrove Swamp (Strict Nature Reserve with a total area of 25 km2) (Marine Conservation Institute 2020). The Ramsar site of Sierra Leone River Estuary encompasses 19% of Sierra Leone's total mangrove. “The Estuary is threatened by vegetation clearance and unsustainable fishing, and efforts are being made strictly to conserve certain core areas within the site. Vast areas of untouched mangrove forest still exist, however, and traditional fishing and agro-forestry for fuelwood can be managed sustainably in collaboration with an existing EU-funded Artisanal Fishing Community Development Programme. Fine beaches in some areas provide hope for well-managed tourist development, especially in light of the presence of an historic slave castle on Bunce Island, and so ecotourism development is considered promising” (Ramsar sites information service 2020). Togo The original reconstruction of Togo’s marine fisheries catches was completed for 1950-2010 by Belhabib et al. (2015, 2016). Here, data were updated for 2011-2015 using FAO data, then carried forward to 2018. Retroactive changes in reported data were assumed minor between the different versions of FAO datasets and were not addressed in the carry forward. Artisanal fisheries Artisanal fisheries catches from land-based gear and pirogues were updated for 2011-2015 based on the total artisanal marine catches reported by Anon. (2016). In 2015, the number of artisanal pirogues was estimated to be 370 and the artisanal catch by these pirogues was estimated at 7600 tonnes (Anon. 2016). Catch by land-based artisanal fishers was assumed equal to the total marine artisanal catch minus the pirogue catch in 2015. Reconstructed artisanal landings were allocated to land based or pirogue caught by interpolating between the percentage caught by each component in 2010 and in 2015. Unreported landings from each gear-type were estimated to be the remainder of total estimated catch after reported landings were accounted for. The 2010

2020 Fisheries Centre Research Reports 28(5)
138
taxonomic breakdown of unreported artisanal landings for each gear-type was carried forward unaltered for 2011-2015. Subsistence and recreational catches The catch from subsistence fisheries was updated for 2011-2014 based on the percentage of artisanal catch (see below) that is estimated to be taken home for family- or self-consumption. Approximately 10-13% of artisanal catch was estimated to be taken home by fishers in 2014 and, as a result, the subsistence catch was estimated for 2012-2015 as 11.5% of artisanal catch (Ali et al. 2016). Recreational fisheries catches were updated using the approach of Belhabib et al. (2015). The percentage of recreational fishers in the total Togolese population for 2010 was used to estimate the number recreational fishers for 2011-2015. The number of recreational fishing trips per fisher, per year in 2010 and CPUE for 2010 was held constant for 2011-2015. The 2010 taxonomic breakdown of recreational landings and subsistence catches was assumed to remain constant for 2011-2015. Domestic industrial landings and discards Domestic industrial landings were estimated for the single domestic trawler that was reported by Anon. (2016) to have been operating in 2011-2015 and whose catch is assumed to have been reported to FAO in 2012-2015 but not 2011. Thus, we interpolated between 2010 and 2012 to estimate domestic catch by this trawler for 2011. Discards from domestic trawling were estimated for 2011-2015 using the method of Belhabib et al. (2015). The taxonomic breakdowns for 2010 was used to disaggregate landings and discards for 2011-2015. Foreign industrial landings and discards An estimated 14% of landings reported by Togo to the FAO are assumed to have been caught in Togo’s EEZ by Spanish vessels and landed in Lomé in 2009-2010. Thus, this represents a flag-misreporting in the data reported by Togo to the FAO. China, Greece, Italy, and Spain also reported catches from the Eastern Central Atlantic and the percentage of reported landings that were estimated to have been taken from Togo’s EEZ by these fleets in 2010 was used to estimate reported catch by each fishing entity in Togo for 2011-2015. Total catch by China, Greece and Italy was assumed to remain constant for 2011-2015. Unreported landings by Spain fishing in Togo’s EEZ were calculated for 2011-2015 based on the 2010 percentage of unreported to reported landings. Unreported landings by Guinea and Ghana in Togo’s EEZ were carried forward for 2011-2015 based on the 2010 ratio of unreported landings by each fishing entity to Togo’s domestic reported landings. Discards from foreign fisheries in Togo were estimated for 2011-2015 as described by Belhabib et al. (2015). The 2010 taxonomic breakdowns of unreported landings and discards by foreign fishing entities were carried forward unaltered for 2011-2015. Transition from 2015 to 2018 The catch reconstructed to 2015 was carried forward to 2018 using the semi-automated procedures outlined in Noël (2020), based on FAO reported landings data available to 2018. Semi-automated reconstructed catch data will later be replaced by a more detailed, research-intensive update. Marine biodiversity protection Togo has agreed to protect its biological diversity through the international Convention on Biological Diversity (Aichi) and the Ramsar Convention on Wetlands of International Importance and the World Heritage Convention (Marine Conservation Institute 2020).

Updating to 2018 the 1950-2010 marine catch reconstructions of the Sea Around Us: Part I – Africa, Antarctica, Europe and the North Atlantic
139
Togo has no MPAs (Marine Conservation Institute 2020) but WDPA indicates that there is 31 km2 protected in its waters (UNEP-WCMC and IUCN 2020), which is only 0.2 % of the entire EEZ (15,442 km2; Belhabib et al. 2016). There are four Ramsar sites in Togo but only one is especially close to the coast – Zone Humides du Littoral du Togo – which was designated in 2008 and has 5,910 km2 (Ramsar sites information service 2020). “These different ecosystems of the littoral zone are of great natural biological, ecological and economic value and host a wide variety of bird, mammal, reptile, fish, mollusc and crustacean species. Endangered species found here include marine turtles (Chelonia mydas, Eretmochelys imbricata, Lepidochelys olivacea and Dermochelys coriacea), the African manatee (Trichechus senegalensis), hippopotami, etc. This zone contributes over 85 % of the total annual fish production in Togo and is also important for transportation of people and goods. The site is also exploited for construction and fuel wood, mollusks, crustaceans, bush meat and medicinal plants, both for subsistence and commercial purposes. There is presently no management plan for the site, but personnel from the Ministère de l'Environnement et des Ressources Forestières combat unsustainable logging and fishing and illegal hunting” (Ramsar sites information service 2020). Discussion The countries whose marine (and in some cases estuarine or lagoon) fisheries catch data were reconstructed here all suffer, if to a variable extent, from the fisheries in their EEZ being largely uncontrolled, whether they are small-scale and local or industrial and foreign. This leads to much uncertainty in the estimation of their catch, which may end up landed in the ports of the countries in question or elsewhere, or as discarded bycatch. It also substantially increases the uncertainty around any attempts to estimate the actual biomass status of the underlying fish stocks being exploited. This uncertainty should not lead, however, to the acceptance of ‘zero’ as an estimate of these catches in lieu of ‘no data’, whether fished legally or not, because no operating fishery generates catches of zero. Rather, we present here our best estimates, and look forward to feedback and collaborations that would allow them to be corrected. Acknowledgements Funding for the work presented here was provided by the Minderoo Foundation, by the Marisla, Oak, and David and Lucille Packard Foundations, and by the Bloomberg Philanthropies through Rare. References (by country) Derrick, B. and D. Pauly. 2020. Updating to 2018 the 1950-2020 marine catch reconstructions of the Sea
Around Us, p. 9-14. In: B. Derrick, M. Khalfallah, V. Relano, D. Zeller and D. Pauly (eds). Updating to 2018 the 1950-2010 Marine Catch Reconstructions of the Sea Around Us: Part I – Africa, Antarctica, Europe and the North Atlantic. Fisheries Centre Research Report 28(5).
Pauly, D. and D. Zeller. 2016. Catch reconstructions reveal that global marine fisheries catches are higher than reported and declining. Nature Communications, 7: 10244.
Zeller, D., M.L.D. Palomares, A. Tavakolie, M. Ang, D. Belhabib, W.W.L. Cheung, V.W.Y. Lam, E. Sy, G. Tsui, K. Zylich and D. Pauly. 2016. Still catching attention: Sea Around Us reconstructed global catch data, their spatial expression and public accessibility. Marine Policy, 70: 145-152.
Benin Ahouandjogbe, S., Y. Didavi, K.H. Gangbazo and D. Gnitassoun. 2013. Rapport National. Enquête cadre en
pêche continentale 2012. Ministère de l’Agriculture, de l’Elevage et de la Pêche, Cotonou. 124 p. Ayoubi, H.E. and P. Failler. 2013. Industrie des pêches et de l'aquaculture au Bénin. Rapport n°5 de la revue
de l'industrie des pêches et de l'aquaculture dans la zone de la COMHAFAT. Conférence Ministérielle sur la Coopération Halieutique entre les États Africains Riverains de l’Océan Atlantique (COMHAFAT)

2020 Fisheries Centre Research Reports 28(5)
140
& The Ministerial Conference on Fisheries Cooperation among African States Bordering the Atlantic Ocean (ATLAFCO). 127 p.
Aza-Gnandji, M.R., F.-X. Fifatin, F. Dubas, T.C. Nounangnonhou, C. Espanet and A. Vianou. 2019. Investigation on offshore wind energy potential in Benin Republic. Wind Engineering. doi.org/10.1177/0309524X19872768
Belhabib, D. and D. Pauly. 2015. Benin fisheries: a catch reconstruction, 1950-2010. Fisheries Centre Working Paper #2015-03, 13 p.
Belhabib, D., M.C. Villanueva and D. Pauly. 2016. Benin, p. 204. In: D. Pauly and D. Zeller (eds). Global Atlas of Marine Fisheries: A Critical Appraisal of Catches and Ecosystem Impacts. Island Press, Washington, DC.
Bryan, T., J. Virdin, T. Vegh, C.Y. Kot, J. Cleary and P.N. Halpin. 2020. Blue carbon conservation in West Africa: a first assessment of feasibility. Journal of Coastal Conservation, 24(1):8.
COMHAFAT/ATLAFCO. 2014. Synthèse de l’Etude sur les industries des pêches et de l’aquaculture: Bénin. Revue des industries des pêches et de l'aquaculture dans les pays de la COMHAFAT. Conférence Ministérielle sur la Coopération Halieutique entre les États Africains Riverains de l’Océan Atlantique (COMHAFAT) & The Ministerial Conference on Fisheries Cooperation among African States Bordering the Atlantic Ocean (ATLAFCO). 33 p.
Gangbazo, K.H. 2016. Etat des lieux des statistiques halieutiques au Bénin. Fishery Committee for the West Central Gulf of Guinea. 21 p. Available at: www.fcwc-fish.org/fisheries/statistics/benin
INSAE. 2016. Evolution de la production halieutique. Institut National de la Statistique et de l'Analyse Economique (INSAE). Available at: www.insae-bj.org/production-agricole.html.
Marine Conservation Institute. 2020. MPAtlas [Online]. Seattle, WA. Available at: www.mpatlas.org Noël, S.-L. 2020. Semi-automation procedure for catch reconstruction forward carry, p. 15-20. In: B. Derrick,
M. Khalfallah, V. Relano, D. Zeller and D. Pauly (eds). Updating to 2018 the 1950-2010 Marine Catch Reconstructions of the Sea Around Us: Part I – Africa, Antarctica, Europe and the North Atlantic. Fisheries Centre Research Report 28(5).
Petrossian, G.A. 2018. A micro-spatial analysis of opportunities for IUU fishing in 23 Western African countries. Biological Conservation, 225: 31-41.
UNEP-WCMC and IUCN. 2020. Protected Planet: Protected Area Profile for Benin from the World Database of Protected Areas, June 2020. Available at: www.protectedplanet.net/country/BJ
Congo (Brazzaville) Anon. 2011. High-tech measures to curb illegal fishing. IRIN news, 9 August 2011. Available at:
www.irinnews.org/report/93453/congo-high-tech-measures-curb-illegal-fishing Anon. 2013. Enquète de cloture du project de développement agricole et de réhabilitation des pistes rurales
(PDARP) Rapport Final. L'Institut National de la Statistique, Ministère de l'Agriculture et de l'Elevage, Congo. 142 p. Available at: www.cnsee.org/pdf/PDARP%20RAPPORT%20FINAL.pdf
Belhabib, D. and D. Pauly. 2015. The implications of misreporting on catch trends: a catch reconstruction for the People’s Republic of the Congo, 1950-2010, p. 95-106. In: D. Belhabib and D. Pauly (eds). Fisheries catch reconstructions: West Africa, Part II. Fisheries Centre Research Report 23(3).
Belhabib, D. and D. Pauly. 2016. Congo (Brazzaville), p. 226. In: D. Pauly and D. Zeller (eds). Global Atlas of Marine Fisheries: A Critical Appraisal of Catches and Ecosystem Impacts. Island Press, Washington, DC.
Clark, J. and S. Decalo. 2012. Historical Dictionary of Republic of the Congo (4th edition). Scarecrow Press, Lanham, Maryland. 570 p.
Hoyt, E. 2012. Marine Protected Areas for Whales, Dolphins and Porpoises: A world handbook for cetacean habitat conservation and planning (2nd Edition). Routledge.
Marine Conservation Institute. 2020. MPAtlas [Online]. Seattle, WA. Available at: www.mpatlas.org Mikangou, L. 2001. Shark fishing banned in Congo Brazzaville. Afrol News, 4 June, 2001. Available at:
afrol.com/News2001/cob005_shark_fishing.htm Noël, S.-L. 2020. Semi-automation procedure for catch reconstruction forward carry, p. 15-20. In: B. Derrick,
M. Khalfallah, V. Relano, D. Zeller and D. Pauly (eds). Updating to 2018 the 1950-2010 Marine Catch Reconstructions of the Sea Around Us: Part I – Africa, Antarctica, Europe and the North Atlantic. Fisheries Centre Research Report 28(5).

Updating to 2018 the 1950-2010 marine catch reconstructions of the Sea Around Us: Part I – Africa, Antarctica, Europe and the North Atlantic
141
Congo (ex-Zaïre) Anon. 2012. Renforcement du cadre légal des pêches et aquaculture: Elaboration/révision des textes
réglementaires des nouvelles lois de pêche au Congo et en RDC. ACP Fish II Programme, IBF International Consulting. 111 p.
Belhabib, D., S. Ramdeen and D. Pauly. 2015. An attempt at reconstructing the marine fisheries catches in the Congo (ex-Zaïre), 1950 to 2010, p. 107-114. In: D. Belhabib and D. Pauly (eds). Fisheries catch reconstructions: West Africa, Part II. Fisheries Centre Research Report 23(3).
Belhabib, D., S. Ramdeen and D. Pauly. 2016. Congo (ex-Zaïre), p. 227. In: D. Pauly and D. Zeller (eds). Global Atlas of Marine Fisheries: A Critical Appraisal of Catches and Ecosystem Impacts. Island Press, Washington, DC.
Le Parc Marin des Mangroves. 2020. Les deux piliers de la conservation. Congo Basin Biodiversity Conservation. Available at: mangroves-congo.net/
Marine Conservation Institute. 2020. MPAtlas [Online]. Seattle, WA. Available at: www.mpatlas.org Noël, S.-L. 2020. Semi-automation procedure for catch reconstruction forward carry, p. 15-20. In: B. Derrick,
M. Khalfallah, V. Relano, D. Zeller and D. Pauly (eds). Updating to 2018 the 1950-2010 Marine Catch Reconstructions of the Sea Around Us: Part I – Africa, Antarctica, Europe and the North Atlantic. Fisheries Centre Research Report 28(5).
Ramsar sites information service. 2020. Parc national des Mangroves. Available at: rsis.ramsar.org/ris/788
Equatorial Guinea Belhabib, D., D. Hellebrandt da Silva, E.H. Allison and D. Pauly. 2015. Equatorial Guinea: a catch
reconstruction (1950-2010). Fisheries Centre Working Paper #2015-71, 24 p. Belhabib, D., D. Hellebrandt Da Silva, E. Allison, D. Zeller and D. Pauly. 2016a. Filling a blank on the map: 60
years of fisheries in Equatorial Guinea. Fisheries Management and Ecology, 23(2): 119-132. doi.org/10.1111/fme.12161
Belhabib, D., D. Hellebrandt, E. Allison and D. Pauly. 2016b. Equatorial Guinea, p. 246. In: D. Pauly and D. Zeller (eds). Global Atlas of Marine Fisheries: A Critical Appraisal of Catches and Ecosystem Impacts. Island Press, Washington, DC.
FAO. 2015. Report of the Seventh Session of the Scientific Sub-committee. FAO Fisheries and Aquaculture Report, Fishery Committee for the Eastern Central Atlantic, Tenerife, Spain. 107 p.
Marine Conservation Institute. 2020. MPAtlas [Online]. Seattle, WA. Available at: www.mpatlas.org Noël, S.-L. 2020. Semi-automation procedure for catch reconstruction forward carry, p. 15-20. In: B. Derrick,
M. Khalfallah, V. Relano, D. Zeller and D. Pauly (eds). Updating to 2018 the 1950-2010 Marine Catch Reconstructions of the Sea Around Us: Part I – Africa, Antarctica, Europe and the North Atlantic. Fisheries Centre Research Report 28(5).
Ramsar sites information service. 2020. Isla de Annobón. Available at: https://rsis.ramsar.org/ris/1309?language=en
Trew, B.T., H.S. Grantham, C. Barrientos, T. Collins, P.D. Doherty, A. Formia, B.J. Godley, S.M. Maxwell, R.J. Parnell, S.K. Pikesley, D. Tilley, M.J. Witt and K. Metcalfe. 2019. Using Cumulative Impact Mapping to Prioritize Marine Conservation Efforts in Equatorial Guinea. Frontiers in Marine Science, 6(717): 1-17. doi.org/10.3389/fmars.2019.00717
Gabon Anon. 2016. UN agency announces world's first illegal fishing treaty now in force. UN News Centre, 5 June
2016. Available at: www.un.org/apps/news/story.asp?NewsID=54140#.V1myMrsrLIU Anon. 2017. Etat des lieux de la pêche industrielle - Résumé de L’année 2017. Programme des Observateurs de
pêche industrielle. 33 p. Belhabib, D. 2015. Gabon fisheries between 1950 and 2010: a catch reconstruction, p. 85-94. In: D. Belhabib
and D. Pauly (eds). Fisheries catch reconstructions: West Africa, Part II. Fisheries Centre Research Report 23(3).
Belhabib, D. 2016. Gabon, p. 271. In: D. Pauly and D. Zeller (eds). Global Atlas of Marine Fisheries: A Critical Appraisal of Catches and Ecosystem Impacts. Island Press, Washington, DC.
FAO. 2007. Profil de la pêche par pays: La République Gabonaise. Organisation des Nations Unies pour l'alimentation et l'agriculture. 33 p.
FAO. 2016. Agreement on Port State Measures to Prevent, Deter and Eliminate Illegal, Unreported and Unregulated Fishing, Rome, 115 p.

2020 Fisheries Centre Research Reports 28(5)
142
Friedlander, A.M., E. Ballesteros, M. Fay and E. Sala. 2014. Marine Communities on Oil Platforms in Gabon, West Africa: High Biodiversity Oases in a Low Biodiversity Environment. PLoS ONE, 9(8): e103709. doi.org/10.1371/journal.pone.0103709
MarEx. 2016. Sea Shepherd launches operation in Gabon. The Maritime Executive, 20 April 2016. Available at: www.maritime-executive.com/article/sea-shepherd-launches-operation-in-gabon
Marine Conservation Institute. 2020. MPAtlas [Online]. Seattle, WA. Available at: www.mpatlas.org Mayumba National Park. 2011. Protecting Gabon’s Wild Coast. Available at:
www.mayumbanationalpark.com/welcome.htm Noël, S.-L. 2020. Semi-automation procedure for catch reconstruction forward carry, p. 15-20. In: B. Derrick,
M. Khalfallah, V. Relano, D. Zeller and D. Pauly (eds). Updating to 2018 the 1950-2010 Marine Catch Reconstructions of the Sea Around Us: Part I – Africa, Antarctica, Europe and the North Atlantic. Fisheries Centre Research Report 28(5).
Robinson, J. 2014. A massive new marine protected area network in Gabon. National Geographic, 12 November 2014. Available at: voices.nationalgeographic.com/2014/11/12/a-massive-new-marine-protected-area-network-in-gabon/
Guinea Belhabib, D., A. Doumbouya, D. Copeland, B. Gorez, S. Harper, D. Zeller and D. Pauly. 2012. Guinean
fisheries, past, present and future? p. 91-104. In: D. Belhabib, D. Zeller, S. Harper and D. Pauly (eds). Marine fisheries catches in West Africa, Part I. Fisheries Centre Research Reports 20(3).
Belhabib, D., A. Doumbouya, I. Diallo, S. Traore, Y. Camara, D. Copeland, B. Gorez, S. Harper, D. Zeller and D. Pauly. 2016. Guinea, p. 284. In: D. Pauly and D. Zeller (eds). Global Atlas of Marine Fisheries: A Critical Appraisal of Catches and Ecosystem Impacts. Island Press, Washington, DC.
Marine Conservation Institute. 2020. MPAtlas [Online]. Seattle, WA. Available at: www.mpatlas.org Noël, S.-L. 2020. Semi-automation procedure for catch reconstruction forward carry, p. 15-20. In: B. Derrick,
M. Khalfallah, V. Relano, D. Zeller and D. Pauly (eds). Updating to 2018 the 1950-2010 Marine Catch Reconstructions of the Sea Around Us: Part I – Africa, Antarctica, Europe and the North Atlantic. Fisheries Centre Research Report 28(5).
UNEP-WCMC and IUCN. 2020. Protected Planet: Protected Area Profile for Guinea from the World Database of Protected Areas, June 2020. Available at: www.protectedplanet.net/country/GN
Ramsar sites information service. 2020a. Ile Alcatraz. Available at: rsis.ramsar.org/ris/571?language=en Ramsar sites information service. 2020b. Ile Blanche. Available at: rsis.ramsar.org/ris/618?language=en
Guinea-Bissau Belhabib, D. and D. Pauly. 2015. Fisheries in troubled waters: a catch reconstruction for Guinea-Bissau, 1950-
2010. Fisheries Centre Working Paper #2015-72, 21 p. Belhabib, D. and D. Pauly. 2016. Guinea-Bissau, p. 285. In: D. Pauly and D. Zeller (eds). Global Atlas of
Marine Fisheries: A Critical Appraisal of Catches and Ecosystem Impacts. Island Press, Washington, DC.
Cross, H. 2016. Displacement, disempowerment and corruption: Challenges at the interface of fisheries, management and conservation in the Bijagós Archipelago, Guinea-Bissau. Oryx, 50(4):693-701. doi.org/10.1017/S003060531500040X
Intchama, J.F., D. Belhabib, T. Jumpe and R. Joaquim. 2018. Assessing Guinea Bissau's legal and illegal unreported and unregulated fisheries and the surveillance efforts to tackle them. Frontiers in Marine Science, 5(79): 1-11.
Kaczynski, V.M. and S. Djassi. 2006. Illegal Activities in Marine Protected Areas: the case of Guinea-Bissau, West Africa. Unpublished manuscript, School of Marine Affairs and Jackson School of International Studies, University of Washington, Seattle and Ministry of the Interior, Republic of Guinea-Bissau, 11 p.
Marine Conservation Institute. 2020. MPAtlas [Online]. Seattle, WA. Available at: www.mpatlas.org Noël, S.-L. 2020. Semi-automation procedure for catch reconstruction forward carry, p. 15-20. In: B. Derrick,
M. Khalfallah, V. Relano, D. Zeller and D. Pauly (eds). Updating to 2018 the 1950-2010 Marine Catch Reconstructions of the Sea Around Us: Part I – Africa, Antarctica, Europe and the North Atlantic. Fisheries Centre Research Report 28(5).
Weigel, J.-Y., K.O. Mannle, N.J. Bennett, E. Carter, L. Westlund, V. Burgener, Z. Hoffman, A.S.D. Silva, E.A. Kane, J. Sanders, C. Piante, S. Wagiman, A. Hellman. 2014. Marine protected areas and fisheries: bridging the divide, Aquatic Conservation: Marine and Freshwater Ecosystems, 24(S2): 199-215. doi.org/10.1002/aqc.2514

Updating to 2018 the 1950-2010 marine catch reconstructions of the Sea Around Us: Part I – Africa, Antarctica, Europe and the North Atlantic
143
Liberia Anon. 2015. Liberia, EU sign fisheries deal. The New Dawn, 8 June 2015. Available at:
thenewdawnliberia.com/liberia-eu-sign-fisheries-deal/ Anon. 2016a. Liberia, Ghana to cooperate in defense, security, power and fishery. Liberia News Agency, 1
August 2016. Available at: allafrica.com/stories/201608020948.html Anon. 2016b. New case of Ebola confirmed in Liberia. The Guardian, 1 April 2016. Available at:
www.theguardian.com/world/2016/apr/01/new-case-of-ebola-confirmed-in-liberia Belhabib, D., A. Mendy, Y. Subah, N. Broh, A. Jueseah, N. Nipey, W. Boeh, N. Willemse, D. Zeller and D.
Pauly. 2016. Fisheries catch under-reporting in The Gambia, Liberia and Namibia, and the three Large Marine Ecosystems which they represent. Environmental Development, 17: 157-174.
Belhabib, D., Y. Subah, N.T. Broh, A.S. Jueseah, J.N. Nipey, W.Y. Boeh, D. Copeland, D. Zeller and D. Pauly. 2016b. Liberia, p. 319. In: D. Pauly and D. Zeller (eds). Global Atlas of Marine Fisheries: A Critical Appraisal of Catches and Ecosystem Impacts. Island, Washington, DC.
FAO. 2014. Serious food security concerns in Liberia. Food and Agriculture Organization (FAO) Regional Office for Africa. Available at: www.fao.org/emergencies/fao-in-action/stories/stories-detail/en/c/241614/
Kay, D.W. 2016. Liberia Fisheries Statistical Summary Report. Inception workshop of the FCWC FAO TCP project “Strengthening fisheries statistics in West Africa, Accra, 5 & 6 May 2016. Bureau of National Fisheries, Fishery Committee of the West Central Gulf of Guinea (FCWC). Available at: fcwc-fish.org/download/3160/statistics-research/6233/liberia-country-report-on-liberia-fisheries-statistics_2016-2.pdf
Marine Conservation Institute. 2020. MPAtlas [Online]. Seattle, WA. Available at: www.mpatlas.org Noël, S.-L. 2020. Semi-automation procedure for catch reconstruction forward carry, p. 15-20. In: B. Derrick,
M. Khalfallah, V. Relano, D. Zeller and D. Pauly (eds). Updating to 2018 the 1950-2010 Marine Catch Reconstructions of the Sea Around Us: Part I – Africa, Antarctica, Europe and the North Atlantic. Fisheries Centre Research Report 28(5).
Ramsar sites information service. 2020. Lake Piso. Available at: rsis.ramsar.org/ris/1306?language=en UNEP-WCMC and IUCN. 2020. Protected Planet: Protected Area Profile for Liberia from the World Database
of Protected Areas, June 2020. Available at: www.protectedplanet.net/country/LR
Morocco Anon. 2011. Protocol between the European Union and the Kingdom of Morocco setting out the fishing
opportunities and financial compensation provided for in the Fisheries Partnership Agreement between the European Community and the Kingdom of Morocco, European Union-Kingdom of Morocco, July 12, 2011, Non-legislative acts 2011/491/EU. Official Journal of the European Union. Available at: op.europa.eu/en/publication-detail/-/publication/39587679-d510-4fa1-8b3f-2d23404e1f9d/language-en
Anon. 2012. Flotte de pêche. Hout Bladi - Moroccan Seafood. Ministère de l'Agriculture et de la Pêche Maritime du Maroc, Morocco.
Belhabib, D., S. Harper, D. Zeller and D. Pauly. 2012. Reconstruction of marine fisheries catches for Morocco (north, central and south), 1950-2010, p. 23-40. In: D. Belhabib, D. Zeller, S. Harper and D. Pauly (eds). Marine fisheries catches in West Africa, 1950-2010, part I. Fisheries Centre Research Reports 20(3).
Belhabib, D., S. Harper, D. Zeller and D. Pauly. 2016a. Morocco (Central), p. 335. In: D. Pauly and D. Zeller (eds). Global Atlas of Marine Fisheries: A Critical Appraisal of Catches and Ecosystem Impacts. Island Press, Washington, DC.
Belhabib, D., S. Harper, D. Zeller and D. Pauly. 2016b. Morocco (South), p. 337. In: D. Pauly and D. Zeller (eds). Global Atlas of Marine Fisheries: A Critical Appraisal of Catches and Ecosystem Impacts. Island Press, Washington, DC.
Choukr-Allah, R., H. Belouali and A. Nghira. 2016. Environmental Risk Assessment of the Reuse of Treated Wastewaters in the Souss-Massa River Basin, p. 197-212. In: R. Choukr-Allah, R. Ragab, L. Bouchaou and D. Barceló (Eds). The Souss-Massa River Basin, Morocco. Springer, Cham, Switzerland. doi.org/10.1007/698_2016_80
Derrick, B. and D. Pauly. 2020. Updating to 2018 the 1950-2020 marine catch reconstructions of the Sea Around Us, p. 9-14. In: B. Derrick, M. Khalfallah, V. Relano, D. Zeller and D. Pauly (eds). Updating to 2018 the 1950-2010 Marine Catch Reconstructions of the Sea Around Us: Part I – Africa, Antarctica, Europe and the North Atlantic. Fisheries Centre Research Report 28(5).
2020 Fisheries Centre Research Reports 28(5)
144
DPM. 2011. Flotte de pêche nationale. Département de la pêche maritime (DPM). Available at: www.mpm.gov.ma/wps/portal/PortaIl-MPM/P%C3%AAche%20%20maritime/Flotte/!ut/p/b1/04_Sj9CPykssy0xPLMnMz0vMAfGjzOIN3Nx9_I0MzAwswsIsDDzNTQM8PT2dDS1cjPULsh0VAXa_PfU!/
Harif, R., F. Laurent, Y. Djellouli. 2008. L'écotourisme dans le parc national de Souss Massa-Maroc, p. 130-140. In: Colloque international “Tourisme, secteur de l'économie de substitution et de développement durable”, avril 2008. Université des Sciences et de la Technologie H. Boumediene, Institut d’Urbanisme de Paris et Ministère algérien de l’Aménagement du Territoire, de l’Environnement et du Tourisme. Alger, Algérie.
Hirich, A., R. Choukr-Allah and A. Nrhira. 2016. Groundwater-dependent ecosystems in the Souss-Massa River region: an economic valuation of ecosystem services, p. 163-196. In: R. Choukr-Allah, R. Ragab, L. Bouchaou and D. Barceló (Eds). The Souss-Massa River Basin, Morocco. Springer, Cham, Switzerland. doi.org/10.1007/698_2016_73
INRH. 2014. État des stocks des pêcheries au Maroc 2013. Institut National de Recherche Halieutique (INRH), Casablanca, Morocco. 209 p.
INRH. 2015. État des stocks et des pêcheries marocaines 2014. Institut National de Recherche Halieutique (INRH), Casablanca, Morocco. 318 p.
Khalfallah, M. 2020. Data-poor fisheries: Case studies from the southern Mediterranean and the Arabian Peninsula. PhD thesis, University of British Columbia, Vancouver, 349 p.
Malouli Idrissi, M., N. Abid, M. Bernardon and J.A. Caminas. 2013. Situation de la pêcherie artisanale au thon rouge dans le Détroit de Gibraltar, en Méditerranée marocaine. Développement durable de la pêche artisanale méditerranéenne au Maroc et en Tunisie, Food and Agriculture Organization (FAO), Malaga, Spain. CopeMed II- Technical Documents No 34. 39p.
MEF. 2013. Stratégie de développement et de compétitivité du secteur halieutique au Maroc: la stratégie Halieutis. Ministre de l’Économie, des Finances et de la Réforme de l’Administration (MEF), Casablanca, Morocco. Available at: www.finances.gov.ma/fr/pages/strat%C3%A9gies/strat%C3%A9gie-de-d%C3%A9veloppement-et-de-comp%C3%A9titivit%C3%A9-du-secteur-halieutique-au-maroc--la-strat%C3%A9gie-halieutis.aspx?m=Investisseur&m2=Investissement.
Marine Conservation Institute. 2020. MPAtlas [Online]. Seattle, WA. Available at: www.mpatlas.org Noël, S.-L. 2020. Semi-automation procedure for catch reconstruction forward carry, p. 15-20. In: B. Derrick,
M. Khalfallah, V. Relano, D. Zeller and D. Pauly (eds). Updating to 2018 the 1950-2010 Marine Catch Reconstructions of the Sea Around Us: Part I – Africa, Antarctica, Europe and the North Atlantic. Fisheries Centre Research Report 28(5).
ONP. 2012. La pêche côtière et artisanale au Maroc - Rapport statistiques 2012. Office Nationale des Pêches (ONP), Casablanca, Morocco. 28 p.
ONP. 2013. La pêche côtière et artisanale au Maroc - Rapport statistiques 2013. Office Nationale des Pêches (ONP), Casablanca, Morocco. 28 p.
ONP. 2014. La pêche côtière et artisanale au Maroc - Rapport statistiques 2014. Office Nationale des Pêches (ONP), Casablanca, Morocco. 28 p.
ONP. 2015. La pêche côtière et artisanale au Maroc - Rapport statistiques 2015. Office Nationale des Pêches (ONP), Casablanca, Morocco. 28 p.
Namibia Belhabib, D., N. Willemse and D. Pauly. 2015. A fishery tale: Namibian fisheries between 1950-2010. Fisheries
Centre Working Paper #2015-65, 17 p. Belhabib, D., A. Mendy, Y. Subah, N.T. Broh, A.S. Jueseah, N. Nipey, W.W. Boeh, N. Willemse, D. Zeller and
D. Pauly. 2016a. Fisheries catch under-reporting in The Gambia, Liberia and Namibia, and the three Large Marine Ecosystems which they represent. Environmental Development, 17: 157-174.
Belhabib, D., N.E. Willemse and D. Pauly. 2016b. Namibia, p. 340. In: D. Pauly and D. Zeller (eds). Global Atlas of Marine Fisheries: A Critical Appraisal of Catches and Ecosystem Impacts. Island Press, Washington, DC.
Marine Conservation Institute. 2020. MPAtlas [Online]. Seattle, WA. Available at: www.mpatlas.org Ministry of Environment and Tourism Namibia. 2020. Cape Cross Seal Reserve. Available at:
www.met.gov.na/national-parks/cape-cross-seal-reserve/214/ Noël, S.-L. 2020. Semi-automation procedure for catch reconstruction forward carry, p. 15-20. In: B. Derrick,
M. Khalfallah, V. Relano, D. Zeller and D. Pauly (eds). Updating to 2018 the 1950-2010 Marine Catch

Updating to 2018 the 1950-2010 marine catch reconstructions of the Sea Around Us: Part I – Africa, Antarctica, Europe and the North Atlantic
145
Reconstructions of the Sea Around Us: Part I – Africa, Antarctica, Europe and the North Atlantic. Fisheries Centre Research Report 28(5).
Paterson, B. and P. Kainge. 2014. Rebuilding the Namibian hake fishery: a case for collaboration between scientists and fishermen. Ecology and Society, 19(2): 49.
Paterson, B., C. Kirchner and R. Ommer. 2013. A short history of the Namibian hake fishery - a socio-ecological analysis. Ecology and Society, 18(4): 66.
Petrossian, G.A. 2018. A micro-spatial analysis of opportunities for IUU fishing in 23 Western African countries. Biological Conservation, 225: 31-41.
Ramsar sites information service. 2020. Sandwich Harbour. Available at: rsis.ramsar.org/ris/743?language=en
Sjöstedt, M. and A. Sundström. 2015. Coping with illegal fishing: An institutional account of success and failure in Namibia and South Africa. Biological Conservation, 189: 78-85.
Nigeria Ajayi, T.O. 1991. Highlights of achievements in the last 30 years by the Nigerian Institute for Oceanography
and Marine Research and its parent research division of the Federal Department of Fisheries, Lagos, 1960-1990. Nigerian Institute for Oceanography and Marine Research (NIOMR), Lagos, Nigeria. 23 p.
Akintola, S.L. and K.A. Fakoya. 2017. Small-scale fisheries in the context of traditional post-harvest practice and the quest for food and nutritional security in Nigeria. Agriculture & Food Security, 6(34): 1-17.
Anon. 2016. Illegal fishing threatens food security. Business Day, 7 July 2016. Available at: businessday.ng/exclusives/article/illegal-fishing-threatens-food-security/
Davies, R. 2016. Nigerian pelagics market 'has opened again'. Undercurrent News, 20 June 2016. Available at: www.undercurrentnews.com/2016/06/20/nigerian-pelagics-market-has-opened-again/
Etim, L., D. Belhabib and D. Pauly. 2015. An overview of the Nigerian marine fisheries subsector and a re-evaluation of its catch data over the past 60 years (1950-2010). Fisheries Centre Working Paper #2015-68, 16 p.
Etim, L., D. Belhabib and D. Pauly. 2016. Nigeria, p. 353. In: D. Pauly and D. Zeller (eds). Global Atlas of Marine Fisheries: A Critical Appraisal of Catches and Ecosystem Impacts. Island Press, Washington, DC.
Falaye, A.E. 2008. Illegal, Unreported and Unregulated (IUU) fishing in West Africa (Nigeria and Ghana). A report prepared for the Marine Resource Assessment Group Ltd (MRAG), London. 35 p.
Ganapathiraju, P. and T. Pitcher. 2006. An estimation of compliance of the fisheries of Nigeria with Article 7 (fisheries management) of the UN Code of Conduct for Responsible Fishing, p. 49 + 23 pages. In: T. Pitcher, D. Kalikoski and P. Ganapathiraju (eds). Evaluations of compliance with the FAO (UN) Code of Conduct for Responsible Fisheries. Fisheries Centre Research Reports 14(2).
Gbigbi, T.M. and A.A. Enete. 2014. Economic efficiency of artisanal fishing households under oil pollution environment in the Niger Delta Region of Nigeria. Tropicultura, 32(4): 183-190.
Marine Conservation Institute. 2020. MPAtlas [Online]. Seattle, WA. Available at: www.mpatlas.org Moses, B.S. 1989. The status of artisanal fisheries and fish resources conservation in south eastern Nigeria.
Nigerian Society for Biological Conservation, University of Cross River State, Uyo, Nigeria. 22 p. NBS. 2017. Nigeria's Fish Production (2010-2015). National Bureau of Statistics (NBS), Nigeria. Noël, S.-L. 2020. Semi-automation procedure for catch reconstruction forward carry, p. 15-20. In: B. Derrick,
M. Khalfallah, V. Relano, D. Zeller and D. Pauly (eds). Updating to 2018 the 1950-2010 Marine Catch Reconstructions of the Sea Around Us: Part I – Africa, Antarctica, Europe and the North Atlantic. Fisheries Centre Research Report 28(5).
Nsentip, U.N. 1983. A review of the commercially exploited marine fishery resources in Nigeria, p. 35-57. In: Anon. (ed). Proceedings of the Second Annual Conference of the Fisheries Society of Nigeria. Fisheries Society of Nigeria (FISON), Calabar, Nigeria.
Olaniyi, O.E., O.A. Akinsorotan, M. Zakaria, C.O. Martins, S.I. Adebola and O.J. Oyelowo. 2019. Taking the edge off host communities’ dependence on protected areas in Nigeria. IOP Conference Series: Earth and Environmental Science, 269:012039. doi.org/10.1088/1755-1315/269/1/012039
Olufemi, L.M. and I.Y. Kenneth. 2019. Biodiversity Conservation and Unmet Social and Health Needs in the Rural Communities of Niger State, Nigeria, p. 22-40. In: Q.R. Yasser (ed). Handbook of Research on Rural Sociology and Community Mobilization for Sustainable Growth. IGI Global. doi.org/10.4018/978-1-5225-7158-2.CH002
Petrossian, G.A. 2018. A micro-spatial analysis of opportunities for IUU fishing in 23 Western African countries. Biological Conservation, 225: 31-41.

2020 Fisheries Centre Research Reports 28(5)
146
Senegal Belhabib, D., P. Campredon, N. Lazar, U.R. Sumaila, B.C. Baye, E.A. Kane and D. Pauly. 2016a. Best for
pleasure, not for business: evaluating recreational marine fisheries in West Africa using unconventional sources of data. Palgrave Communications, 2.
Belhabib, D., V. Koutob, A. Sall, V.W.Y. Lam and D. Pauly. 2014a. Fisheries catch misreporting and its implications: The case of Senegal. Fisheries Research, 151:1-11.
Belhabib, D., V. Koutob, A. Sall, V.W.Y. Lam, D. Zeller and D. Pauly. 2015. Counting pirogues and missing the boat: Reply to Chaboud et al.’s comment on Belhabib et al. “Fisheries catch misreporting and its implications: the case of Senegal”. Fisheries Research, 164: 325-328.
Belhabib, D., V. Koutob, N. Gueye, I. Mbaye, C. Mathews, V.W.Y. Lam and D. Pauly. 2013. Lots of boat and fewer fishes: a preliminary catch reconstruction for Senegal, 1950-2010. Fisheries Centre Working Paper #2013-03, 31 p.
Belhabib, D., V. Koutob, N. Gueye, L. Mbaye, C. Mathews, V. Lam, and D. Pauly. 2016b. Senegal, p. 384. In: D. Pauly and D. Zeller (eds). Global Atlas of Marine Fisheries: A Critical Appraisal of Catches and Ecosystem Impacts. Island Press, Washington, DC.
Belhabib, D., V. Koutob, N. Lazar, V. Ndiaye, J. Tobey, C. Mathews, V.W.Y. Lam and D. Pauly. 2014b. Beyond the unseen: a first collaborative model towards estimating illegal, unreported and unregulated catches off Senegal. Fisheries Centre Working Paper #2014-05, 22 p.
Bergerard, P., and A. Samba. 1980. La pêche piroguière maritime au Sénégal. Débarquements à Saint Louis et Kayar en 1975-80, CRODT, Dakar. 20 p.
Chaboud, C., M. Fall, J. Ferraris, A. Fontana, A. Fonteneau, F. Laloë, A. Samba and D. Thiao. 2015. Comment on “Fisheries catch misreporting and its implications: The case of Senegal. Fisheries Research, (164): 322-324. doi.org/10.1016/j.fishres.2014.10.012
Cormier-Salem, M.C. 2014. Participatory governance of Marine Protected Areas: a political challenge, an ethical imperative, different trajectories. Senegal case studies. S.A.P.I.EN.S. Surveys and Perspectives Integrating Environment and Society, Article 7.2.
FAO. 2020. Report of the Working Group on the Assessment of Small Pelagic Fish of Northwest Africa Casablanca, Morocco, 8–13 July 2019 Rapport de groupe de travail sur l’évaluation des petits pêlagiques au large de l’Afrique Nord-Occidentale Casablanca, Maroc, 8-13 juillet 2019. Fishery Committee for the Eastern Central Atlantic (CECAF)/Comité des pêches pour l'Atlantique Centre-Est (COPACE). FAO Fisheries and Aquaculture Report No. 1309/FAO, Rapport sur les pêches et l’aquaculture no 1309. Rome. doi.org/10.4060/ca9562b
Noël, S.-L. 2020. Semi-automation procedure for catch reconstruction forward carry, p. 15-20. In: B. Derrick, M. Khalfallah, V. Relano, D. Zeller and D. Pauly (eds). Updating to 2018 the 1950-2010 Marine Catch Reconstructions of the Sea Around Us: Part I – Africa, Antarctica, Europe and the North Atlantic. Fisheries Centre Research Report 28(5).
Palomares, M.L.D., M. Khalfallah, J. Woroniak and D. Pauly. 2020. Assessment of 14 species of small pelagic fish caught along the coast of Northwest African countries. p. 77-108 In: M.L.D. Palomares, M. Khalfallah, J. Woroniak and D. Pauly D (eds.). Assessments of marine fisheries resources in West Africa with emphasis on small pelagics, Fisheries Centre Research Report 28(4).
Pauly, D. 2019a. Micronutrient richness of global catches. Nature https://doi.org/10.1038/d41586-019-02810-2; https://rdcu.be/bSRf8
Pauly, D. 2019b. Le marché mondial du poisson contribue aux carences alimentaires. Pour la Science (506 ; octobre 22; see : www.pourlascience.fr/sd/environnement/le-marche-mondial-du-poisson-contribue-aux-carences-alimentaires-18224.php
Pauly, D., D. Belhabib, D., R. Blomeyer, W. Cheung, A. Cisneros-Montemayor, D. Copeland, S. Harper, V. Lam, Y. Mai, F. Le Manach, H. Österblom, K.M. Mok, L. van der Meer, A. Sanz Antonio, S. Shon, U.R. Sumaila, W. Swartz, R. Watson, Y. Zhai and D. Zeller. 2013. China's distant-water fisheries in the 21st century. Fish and Fisheries, 15(3): 474-488. doi.org/10.1111/faf.12032.
Samba, A. 1994. Présentation sommaire des différentes pêcheries sénégalaises, p.1-9. In: M. Barry-Gérard, T. Diouf, A. Fonteneau. (eds). L'évaluation des ressources exploitables par la pêche artisanale Sénégalaise: documents scientifiques présentés lors du symposium. Actes du Symposium sur L'Evaluation des Ressources Exploitables par la Pêche Artisanale Sénégalaise, Dakar, Fevrier 8-13/1993. Institut Français de Recherche Scientifique pour le Développement en Coopération. ORSTOM, Paris.
Ter Hofstede, R. and M. Dickey-Collas. 2006. An investigation of seasonal and annual catches and discards of the Dutch pelagic freezer-trawlers in Mauritania, Northwest Africa. Fisheries Research, 77 (2): 184-191. doi.org/10.1016/j.fishres.2005.08.012

Updating to 2018 the 1950-2010 marine catch reconstructions of the Sea Around Us: Part I – Africa, Antarctica, Europe and the North Atlantic
147
Marine Conservation Institute. 2020. MPAtlas [Online]. Seattle, WA. Available at: www.mpatlas.org Ramsar sites information service. 2020. Parc national du Delta du Saloum. Available at:
https://rsis.ramsar.org/ris/288?language=en
Sierra Leone Marine Conservation Institute. 2020. MPAtlas [Online]. Seattle, WA. Available at: www.mpatlas.org Noël, S.-L. 2020. Semi-automation procedure for catch reconstruction forward carry, p. 15-20. In: B. Derrick,
M. Khalfallah, V. Relano, D. Zeller and D. Pauly (eds). Updating to 2018 the 1950-2010 Marine Catch Reconstructions of the Sea Around Us: Part I – Africa, Antarctica, Europe and the North Atlantic. Fisheries Centre Research Report 28(5).
Okeke-Ogbuafor, N., T. Gray and S.M. Stead. 2019. Is there a 'wicked problem' of small-scale coastal fisheries in Sierra Leone? Marine Policy, 118: 103471. doi.org/10.1016/j.marpol.2019.02.043
Ramsar sites information service. 2020. Sierra Leone River Estuary. Available at: https://rsis.ramsar.org/ris/1014?language=en
Seto, K., D. Belhabib, D. Copeland, M. Vakily, H. Seilert, S. Sankoh, A. Baio, I. Turay, S. Harper, D. Zeller, K. Zylich and D. Pauly. 2015. Colonialism, conflict and fish: a reconstruction of marine fisheries catches for Sierra Leone, 1950-2010. Fisheries Centre Working Paper #2015-74,23 p.
Seto, K., D. Belhabib, D. Copeland, M. Vakily, H. Seilert, S. Sankoh, A. Baio, I. Turay, S. Harper, D. Zeller, K. Zylich and D. Pauly. 2016. Sierra Leone, p. 386. In: D. Pauly and D. Zeller (eds). Global Atlas of Marine Fisheries: A Critical Appraisal of Catches and Ecosystem Impacts. Island Press, Washington, DC.
Seto, K., D. Belhabib, J. Mamie, D. Copeland, J. Michael Vakily, H.E.W. Seilert, S. Harper, D. Zeller, K. Zylich and D. Pauly. 2017. War, fish, and foreign fleets: The Marine Fisheries Catches of Sierra Leone 1950-2015. Marine Policy, (83): 153-163.
Vakily, J.M., K. Seto and D. Pauly (eds). 2012. The marine fisheries environment of Sierra Leone: belated proceedings of a national seminar held in Freetown, 25-29 November 1991. Fisheries Centre Research Report 20(4), 104 p.
UNEP-WCMC and IUCN. 2020. Protected Planet: Protected Area Profile for Sierra Leone from the World Database of Protected Areas, June 2020. Available at: www.protectedplanet.net/country/SL
Togo Ali, D., K. Ahoedo, E.E.A. Folikoue and P. Beigue Alfa. 2016. Enquête Cadre Pêche artisanale Maritime du
Togo - Année 2014. République Togolaise & Union Economique et Monetaire Ouest Africaine (UEMOA). 20 p.
Anon. 2016. Informations de référence sur l'état actuel de l'informations de la pêche et la collecte de données statistiques au Togo. La Direction des pêches et de l’aquaculture. 15 p. Available at: www.fcwc-fish.org/fisheries/statistics/togo
Belhabib, D., V. Koutob, D. Zeller and D. Pauly. 2015. The marine fisheries of Togo, the 'Heart of West Africa', 1950 to 2010. Fisheries Centre Working Paper #2015-70, 28 p.
Belhabib, D., V. Koutob, D. Zeller, and D. Pauly. 2016. Togo, p. 412. In: D. Pauly and D. Zeller (eds). Global Atlas of Marine Fisheries: A Critical Appraisal of Catches and Ecosystem Impacts. Island Press, Washington, DC.
Marine Conservation Institute. 2020. MPAtlas [Online]. Seattle, WA. Available at: www.mpatlas.org Noël, S.-L. 2020. Semi-automation procedure for catch reconstruction forward carry, p. 15-20. In: B. Derrick,
M. Khalfallah, V. Relano, D. Zeller and D. Pauly (eds). Updating to 2018 the 1950-2010 Marine Catch Reconstructions of the Sea Around Us: Part I – Africa, Antarctica, Europe and the North Atlantic. Fisheries Centre Research Report 28(5).
Ramsar sites information service. 2020. Zone Humides du Littoral du Togo. Available at: rsis.ramsar.org/ris/1722
UNEP-WCMC and IUCN. 2020. Protected Planet: Protected Area Profile for Togo from the World Database of Protected Areas, June 2020. Available at: www.protectedplanet.net/country/TG

2020 Fisheries Centre Research Reports 28(5)
148
ANTARCTICA AND SURROUNDING ISLANDS: UPDATED CATCH RECONSTRUCTIONS FOR 2011-2018*
Darcy Dunstana, Courtney Browna Simon-Luc Noëla, Veronica Relanoa, Rachel Whiteb and Dirk Zellerb
a) Sea Around Us, Institute for the Oceans and Fisheries, University of British Columbia, 2202 Main Mall, Vancouver, BC, V6T 1Z4, Canada
b) Sea Around Us- Indian Ocean, School of Biological Sciences, University of Western Australia, 35 Stirling Hwy, Crawley 6009, WA, Australia
Abstract This contribution presents updated catch reconstructions for 2011-2018 for Antarctica’s Large Marine Ecosystem and the Exclusive Economic Zones of Bouvet Island (Norway), Crozet Island (France), Falkland Islands (U.K.), South Georgia, South Sandwich, and South Orkney Islands (U.K.), Kerguelen Islands (France), St. Paul and Amsterdam Islands (France) and Prince Edward Island (South Africa). The major difficulties in updating the catch reconstructions for these countries were the remote nature of these areas and the data peculiarity of the Commission for the Conservation of Antarctic Marine Living Resources (CCAMLR) of reporting by fishing season (i.e., December of one year to November the next year) rather than standardized to calendar year. These difficulties were overcome by converting catches reported for the fishing season to calendar year, and applying literature estimates to estimate IUU fishing of commercially valuable species. Specific details on how each reconstruction was updated and carried forward are presented by island or island group. Introduction This contribution presents the basic methods used and assumptions made to update to 2018 the catch reconstructions initially covering the year 1950 to 2010 performed by the Sea Around Us and its international network of collaborators. As Antarctica itself has no Exclusive Economic Zone (EEZ), the areas covered here are the Large Marine Ecosystem (LME) around the Antarctic continent and the Exclusive Economic Zones (EEZ) around Bouvet Island (Norway), Crozet Island (France), Falkland Islands (United Kingdom), St. Paul and Amsterdam (France), South Georgia, South Sandwich and South Orkney Islands (U.K.), Kerguelen Islands (France) and Prince Edward Island (South Africa). The major difficulties in updating the catch reconstructions for these countries were the remote nature of these areas, which leads to IUU fishing and the peculiarity of the Commission for the Conservation of Antarctic Marine Living Resources (CCAMLR) of reporting by fishing season (i.e., December of one year to November the next year) rather than standardized to calendar year. These difficulties were overcome by converting catches reported by fishing season to calendar year and applying literature estimates to estimate IUU fishing of commercially valuable species. Specific details on how each reconstruction was updated and or carried forward are presented by island or island group. Antarctica (Large Marine Ecosystem) The original reconstruction of the fisheries catches of the continental margin of the Antarctic Large Marine Ecosystem was completed from 1950-2010 by Ainley and Pauly (2014, 2016). Since the original reconstruction, new data from CCAMLR have become available and used to update the reported baseline of
* Cite as: Dunstan, D., C. Brown, S.-L. Noël, V. Relano, R. White and D. Zeller. 2020. Antarctica and surrounding islands: Updated catch reconstruction for 2011 – 2018, p. 148-165. In: B. Derrick, M. Khalfallah, V. Relano, D. Zeller and D. Pauly (eds). Updating to 2018 the 1950-2010 Marine Catch Reconstructions of the Sea Around Us: Part I – Africa, Antarctica, Europe and the North Atlantic. Fisheries Centre Research Report 28(5).

Updating to 2018 the 1950-2010 marine catch reconstructions of the Sea Around Us: Part I – Africa, Antarctica, Europe and the North Atlantic
149
the reconstruction to 2017, which was then carried forward using the procedure in Noël (2020) and catch data to 2018 from CCAMLR (2018). Reported baseline data CCAMLR reported landings from FAO sub-areas 48.1, 48.5, 48.6 (partially), 58.4.1, 58.4.2, 88.1, 88.2 and 88.3 were assumed to encompass the Antarctic shelf and slope and were included in the reconstruction for 2011-2017. Additional areas previously not included in the original reconstruction (or anywhere else in the Sea Around Us database) are 58.4.3a/b and 58.4.4a/b. They were incorporated for this update. All catch data in the Antarctic Large Marine Ecosystem (LME) are considered industrial and assigned to high-seas waters because the LME does not overlap with any country’s EEZ. The main target species include toothfishes (Dissostichus spp.), Antarctic krill (Euphausia superba) and mackerel icefish (Champsocephalus gunnari). Most other species caught in this region are considered by-catch. Illegal, unreported and unregulated catches The CCAMLR fishery reports estimates of illegal, unreported and unregulated catch of Dissostichus spp. for each subarea, and these data are included as the unreported component of the reconstructed catch. However, the estimates stopped in 2011 due to uncertainties in the methodology of the CCAMLR assessment, even though IUU fishing is thought to still be occurring in some areas but remains undetected (CCAMLR 2016a). Therefore, we assumed the 2010 IUU amount was held constant for 2011-2017. According to CCAMLR (2010), discarding by-catch is prohibited south of 60⁰ S, which contains most of the Antarctic shelf and slope; thus, no discards were assumed for this region. This is likely incorrect, and future research-intensive updates need to examine this carefully. Transition from 2017 to 2018 The catch reconstructed to 2017 was carried forward to 2018 using the semi-automated procedures outlined in Noël (2020), based on CCAMLR data available to 2018. Semi-automated reconstructed catch data will later be replaced by a more detailed, research-intensive update. Marine biodiversity protection In Antarctica, the Commission for the Convention on Conservation of Antarctic Marine Living Resources (CCAMLR) and the OSPAR Commission (Marine Conservation Institute 2020) are the main organizations responsible for the protection of biological diversity. There are more than 49 MPAs around Antarctica (Marine Conservation Institute 2020), which jointly cover 2,686,567 km2. The South Orkney Islands southern shelf MPA covers 94,000 km2 in the south Atlantic and was established in 2009 by the CCAMLR as the world’s first high-seas MPA. In December 2017, the world’s largest Marine Protected Area, the Ross Sea Region MPA, came into force, protecting 1.55 million km2, of which 1.12 million km2 (New Zealand Government 2016) are fully protected, i.e., no fishing is permitted. This MPA has three main zones that provide marine protection, sustainable fishing and scientific interests. This MPA, also established by the CCAMLR, shields ecologically important habitats and iconic regional species such as Weddell seals, Antarctic petrels, Ross Sea killer whales and Emperor and Adelie penguins (New Zealand Foreign Affairs and Trade 2020). The 25 CCAMLR member countries will decide if the General Zone protection (i.e., no-take area) of the MPA continues beyond the 35-year duration of the initial agreement. CCAMLR assesses the scientific progress made every five years and evaluates the objectives every 10 years (New Zealand Foreign Affairs and Trade 2020).

2020 Fisheries Centre Research Reports 28(5)
150
Chown et al. (2017) provided a strategic plan to act effectively to prevent biodiversity loss by 2020 and assessed the outlook for Antarctica and the Southern Ocean as similar to the rest of the planet. The strongest opportunity to improve biodiversity protection was through the Antarctic Treaty System and expected to be effective in combination with wide support from governments, industry, and public (Chown et al. 2017). During the 38th Annual Meeting of the Commission for the Conservation of Antarctic Marine Living Resources (CCAMLR-38), held in Hobart, Tasmania, from 21 October to 1 November 2019, some members expressed concerns regarding the lack of transparency by CCAMLR. “They noted that the Antarctic Treaty System and other international organizations that manage fisheries are more transparent and that their meeting documents are often freely accessible and suggested that CCAMLR consider the release of meeting documents to support transparency” (CCAMLR 2016b). Bouvet Island (Norway) The original catch reconstruction of Bouvet Island from 1950-2010 was done by Padilla et al. (2015, 2016). Since the initial reconstruction, new data from CCAMLR have become available (CCAMLR 2018) which allow updating the reconstruction to 2017 with a subsequent carry-forward to 2018 using the procedure in Noël (2020). Reported baseline data The reported baseline data for the catch reconstruction in the Bouvet Island EEZ was derived from CCAMLR sub-area 48.6. The Bouvet Island Exclusive Economic Zone (EEZ) covers only a small portion of sub-area 48.6; thus, the reported catch was disaggregated into catches assumed to have been taken inside and outside the EEZ using the ratio of the taxon distributions that are found in the Bouvet Island EEZ. Illegal, unreported and unregulated catches In a recent CCAMLR fishery report (CCAMLR 2017), there is a mention of “compelling evidence of IUU activity in Subarea 48.6” from 2013-2016. According to Sumby (2012), unreported landings of target species (Dissostichus spp.) are 13.6% higher than the reported landings in the Antarctic, so this percentage was applied to all reported landings (target and non-target species) for both inside and outside the Bouvet Island EEZ. Thus, we kept the previous unreported rate at 13.6%. CCAMLR includes all discards in their reported data. Therefore, to estimate how much of the reported catch was actually discarded, a discard rate derived from Boonzaier et al. (2012) for Prince Edward Island (South Africa) was applied to the reported and unreported total catches of non-target taxa. The target species (Dissostichus spp.) was assumed to have negligible discards. Transition from 2017 to 2018 The catch reconstructed to 2017 was carried forward to 2018 using the semi-automated procedures outlined in Noël (2020), based on CCAMLR data available to 2018. Semi-automated reconstructed catch data will later be replaced by a more detailed, research-intensive update. Marine biodiversity protection The Norwegian government has agreed to protect the biological diversity of Bouvet Island through international agreements, i.e., the Convention on Biological Diversity (Aichi) and the Ramsar Convention on Wetlands of International Importance (Marine Conservation Institute, 2020).

Updating to 2018 the 1950-2010 marine catch reconstructions of the Sea Around Us: Part I – Africa, Antarctica, Europe and the North Atlantic
151
However, in 1971, even before these agreements, the island and four nautical miles of surrounding territorial waters were declared a Nature Reserve. Some species such as Arctocephalus gazella (fur seals) have been protected since 1935 (Huyser 2001). The Nyrøysa platform and the northern and southern beaches of Westwindstranda were declared a site of the Ecosystem Monitoring Programme by the CCAMLR (Commission for the Conservation of Antarctic Marine Living Resources). “[This is with the] objective of establishing a network of sites throughout the Southern Ocean for conducting long-term monitoring studies of the foraging ecology, demography and population trends of vertebrate predator populations. A draft management plan exists for Nyrøysa, but is not yet in force” (Huyser 2001). Some of the past and present projects of the Norwegian Polar Institute in Bouvet Island are focused on monitoring and evaluating ocean currents and sea ice variability (Fram Strait project, A-TWAIN, Fimbul ice-shelf, Nansen Legacy), as well as monitoring marine environments and evaluating the status of some species (Polar Bear Monitoring, SEAPOP, CEMP, Seabird Tracking, ICE-WHALES) (Norwegian Polar Institute 2020). “The Norwegian Polar Institute has authority delegated by the Ministry of Climate and Environment to grant permission for the use of off-road vehicles and aircraft landings, and to allow dispensation from other provisions for the purposes of research or other special activities. […] As an active contributor to processes and discussions at national and international levels, the Norwegian Polar Institute is involved in enhancing and defining new instruments in the North and South on the basis of knowledge and general policy development” (Norwegian Polar Institute 2020). Crozet Island (France) Following the completion of the original catch reconstruction by Pruvost et al. (2015, 2016), which covered the years 1950-2012, the Sea Around Us updated it to 2017, then carried the data forward to 2018 using CCAMLR data (CCAMLR 2018) and the procedure of Noël (2020). The CCAMLR statistics are reported by fishing season (i.e., December of one year to November of the next) and the original reconstruction (Pruvost 2015) followed this seasonal fishing year. In this update, the data in vol. 30 of CCAMLR’s Statistical Bulletin (CCAMLR 2018) were used to convert and update the reconstructed catches from the Crozet EEZ for 1977-2017 by calendar year (i.e., January to December; Figure 1). Reporting baseline All reported landings of the ridge-scaled rattail (Macrourus carinatus), whiteleg skate (Amblyraja taaf) and blue antimora (Antimora rostrata) were considered by-catch of the longline fishery for Patagonian toothfish (Dossostichus eleginoides). By-catch was considered to be 100% discarded until 2007 when the market value was high enough to retain and land bycatch taxa (Pruvost 2015). In the original reconstruction, reported discard amounts were categorized as “unreported” because the logic in the Sea Around Us database at the time did not allow a “reported discard.” All CCAMLR reported discards have now been changed to “reported.”

2020 Fisheries Centre Research Reports 28(5)
152
Figure 1. Reconstructed domestic (i.e., French) catch for Crozet Island’s EEZ by fishing sector by calendar year (Jan-Dec), 1977-2018, for the Crozet Islands sub-area of CCAMLR/FAO Area 58.5.1.
Illegal, unreported and unregulated catches Illegal, Unreported and Unregulated catches (IUU) of the Patagonian toothfish were estimated by CCAMLR (2018) by fishing season. These IUU catches were re-expressed in calendar years by applying the ratio of reported toothfish landings from December to the seasonal IUU catches (Table 1). The December ratio of IUU catch were reassigned to the previous year, e.g., the IUU December catch from fishing season 1990 (Dec 1989 to Nov 1990) was reassigned to calendar year 1989, etc.
Table 1. Legal reported catch and illegal, unreported and unregulated catch of Patagonian toothfish, Dissostichus eleginoides in the Crozet Islands EEZ (Subarea 58.6.), as reported by calendar year by CCAMLR (2019), in tonnes.
Calendar year
Reported catch
(tonnes)
IUU catch
(tonnes)
Total removal (tonnes)
Calendar year
Reported catch
(tonnes)
IUU catch
(tonnes)
Total removal (tonnes)
1983 17
17 2005 597 15 611 1987 488
488 2006 779 52 831
1988 21
21 2007 368 0 368 1994 56 0 56 2008 845 153 998 1995 115 0 115 2009 880 0 880 1996 3 7875 7878 2010 647 0 647 1997 88 11782 11870 2011 703 0 703 1998 978 2159 3136 2012 811 0 811 1999 696 1451 2147 2013 778 0 778
2000 1236 1551 2787 2014 733 0 733 2001 906 569 1475 2015 832 0 832 2002 1198 740 1938 2016 1054 0 1054 2003 475 275 751 2017 1144 0 1144 2004 498 353 851

Updating to 2018 the 1950-2010 marine catch reconstructions of the Sea Around Us: Part I – Africa, Antarctica, Europe and the North Atlantic
153
Under-reported bycatch and illegal by-catch of the Patagonian toothfish fishery were recalculated for bycatch species (including the ridge-scaled rattail, whiteleg skate and blue antimora) based on yearly reported and unreported toothfish landings (Table 2).
Table 2. Catch of bycatch species (ridge-scaled rattail, Macrourus carinatus; whiteleg skate, Amblyraja taaf; blue antimora, Antimora rostrata) taken by the longline fishery for Patagonian toothfish, Dissostichus eleginoides in the Crozet Islands EEZ (Subarea 58.6), as reported by calendar year by CCAMLR (2019), in tonnes.
Catch per year
Rattail Skate Antimora Catch per year
Rattail Skate Antimora
1997 13 3 0 2008 143 46 67 1998 0 0 0 2009 187 45 75 1999 37 1 0 2010 111 56 78
2000 62 9 0 2011 93 29 23 2001 63 14 0 2012 100 77 22 2002 201 49 0 2013 69 47 18 2003 132 78 0 2014 86 38 39 2004 83 59 0 2015 106 16 70 2005 85 13 90 2016 120 33 142 2006 72 32 70 2017 111 23 59 2007 66 3 0
Transition from 2017 to 2018 The catch reconstructed to 2017 was carried forward to 2018 using the semi-automated procedures outlined in Noël (2020), based on CCAMLR data available to 2018. Semi-automated reconstructed catch data will later be replaced by a more detailed, research-intensive update. Marine biodiversity protection France has agreed to protect biological diversity of the Crozet Islands through the international Convention on Biological Diversity (Aichi) and the Ramsar Convention on Wetlands of International Importance (Marine Conservation Institute 2020). The Ramsar site belongs to the Réserve naturelle nationale des Terres australes françaises, which includes a large variety of inland and coastal wetland types such as peatlands, marshes and lakes, rocky shores, estuaries and fjords (Ramsar sites information service 2020). The MPA in these islands is part of the national natural reserve of the Terres australes françaises and one of the first and largest protected areas in the world. In this MPA, no extractive activity is allowed (TAAF 2020a). Many species of penguins are represented in these islands, such as macaroni penguins (Eudyptes chrysolophus; 4 million individuals), and king (Aptenodytes patagonicus), rockhopper (Eudyptes chrysocome) and gentoo (Pygoscelis papua) penguins (TAAF 2020b). At Crozet islands the population of macaroni penguins first increased and then stabilized in the 2000s. However, while most penguin populations breeding in the French Southern Territories increased or were stable over the past 30–60 years, the northern rockhopper penguin, king and gentoo penguins’ populations of Crozet island did not exhibit the same positive trend (Barbraud et al. 2020). Other sea birds present in the Crozet Islands are Giant petrels, White-chinned petrels, Small petrels, Howler albatrosses, Gray-headed albatrosses, Black-browed albatrosses, Yellow-billed albatrosses, Sooty albatross, Skuas, and Dominican gulls. Some marine mammals that can be found in these Islands are sea lions, elephant

2020 Fisheries Centre Research Reports 28(5)
154
seals and orcas, or killer whales (TAAF 2020b). “The Crozet killer whales underwent a sharp decline in the 1990s and this was partly attributed to illegal fishers using lethal means to repel whales depredating toothfish (Poncelet et al. 2010; Tixier et al. 2015, 2017). However, it is likely that the illegal over-exploitation of toothfish stocks, paired with substantial decreases of southern elephant seals, king penguins and large whales (Guinet et al. 1992; Clapham et al. 1999; Weimerskirch et al. 2003, 2018; Pruvost et al. 2015), has also contributed to the decline of this population (Tixier et al. 2019). Decreased toothfish availability may also have caused dietary shifts for killer whales in areas where stocks were depleted” (Tixier et al. 2019). Falkland Islands (U.K.) The original reconstruction for the Falkland Islands, performed by Palomares and Pauly (2015, 2016) for 1950-2010, was updated here to 2017 using national data from the Falkland Islands Government, then carried forward to 2018 using the procedure documented in Noël (2020) and catch data from the Falkland Islands Government for 2018. Reported baseline data The 2011-2013 data extension used data from the 2014 edition of the Falkland Islands Government data, while the extension to 2014 used data from the same source published in 2015 (Falkland Islands Government 2015). The group “Rajidae” and “Others” were disaggregated into more specific taxa using the same methods applied by Palomares and Pauly (2015). The “Hakes” (Merluccius spp.) category was originally split 80% between Argentine hake (Merluccius hubbsi) and 20% southern hake (Merluccius australis) based on an assumption in the original reconstruction. However, new information provides a more detailed species split for 1987-2017 (Arkhipkin et al. 2015). Catches were updated for 1987-2017 using this revised taxonomic composition. FAO vs Falkland Islands Government data A comparison between the Falkland Island data and the FAO data was conducted to account for any extra catch reported by FAO for U.K. fishing in the Southwest Atlantic area. FAO catch data were generally higher than the national catch data. Thus, the excess catch reported to the FAO was assigned as U.K. fishing in waters outside the Falkland Islands EEZ. In addition, FAO data from 1950-1988 were added to the original reconstruction because the Falkland Islands’ data reporting only started in 1989 (Figure 1). Discards Discards were not originally included in the 1950-2010 reconstruction, but have been estimated for the full time series, i.e., from 1950 to 2017, then carried forward to 2018. Laptikhovsky et al. (2006) estimated an average discard rate of 4.2% during their study period from 2000-2005. From 1989-2006, discards were disaggregated to 45% longtail southern cod (Patagonotothen ramsayi) and 55% ‘marine fishes not identified’. However, starting in 2007, longtail southern cod became a more commercially valuable species and was likely retained. Therefore, discards from 2007-2017 were assigned 100% to ‘marine fishes not identified’.

Updating to 2018 the 1950-2010 marine catch reconstructions of the Sea Around Us: Part I – Africa, Antarctica, Europe and the North Atlantic
155
Figure 1. Reconstructed domestic catch within the Falkland Islands’ EEZ by fishing sector for 1950-2018. Recreational and subsistence catches are included but are too small to be visible separately. Artisanal and subsistence catches The unreported landings for the 2011-2017 period continued the same trend of small (<1 tonne) artisanal catches of Patagonian blennie (Eleginops maclovinus) and inanga (Galaxias maculatus) and the subsistence catch of miscellaneous marine fish. According to Falkland Islands Government (2015), from 2007, there was no longer a fishery for the Patagonian scallop (Zygochlamys patagonica). All catch of this species was considered discarded bycatch for the 2007-2017 period. Transition from 2017 to 2018 The catch reconstructed to 2017 was carried forward to 2018 using the semi-automated procedures outlined in Noël (2020), based on national data from the Falkland Islands Government to 2018. Semi-automated reconstructed catch data will later be replaced by a more detailed, research-intensive update. Marine biodiversity protection The Falkland Islands have agreed to protect their biological diversity through the international Convention on Biological Diversity (Aichi) and the Ramsar Convention on Wetlands of International Importance (Marine Conservation Institute 2020). The Falkland Islands MPAs’ extent is 52 km2, which is less than 0.01% of the entire EEZ (549,974 km2; Palomares and Pauly 2015). There are very small MPAs such as the Middle Island (1.63 km2) and the Arch Island East (2.17 km2). Both were established a long time ago (1966 and 1978) and have the designation of Nature Reserve or IUCN management category Ia (UNEP-WCMC and IUCN 2020), which is the strictest management category. Little is found in the literature about the effectiveness of these areas in protecting the biodiversity in Falkland Islands’ waters. However, a study focused on megafauna found that “for wide ranging species (for instance, southern elephant seals), the overall species core use areas may be found outside of the Falkland Islands EEZ most of the year. Marine Spatial Planning (MSP) within a country's waters can improve sustainable marine management and conservation at the national level. Nonetheless, for protection of wide-ranging species to be effective, cross-nation MSP will also be required” (Augé et al. 2018).

2020 Fisheries Centre Research Reports 28(5)
156
Kerguelen Islands (France) The reconstruction of marine fisheries catches in the Kerguelen Islands was completed for 1950-2010 by Palomares and Pauly (2011, 2016), updated to 2017 by the Sea Around Us and forward carried to 2018. As a French territory, the Kerguelen Islands’, reported landings remain aggregated within France’s FAO reported landings data. Therefore, reported landings for Kerguelen Islands were updated using France national data sources and the CCAMLR Statistical Bulletin (CCAMLR, 2018) for the Kerguelen Island region (CCAMLR area 58.5.1). The CCAMLR reports by fishing effort and tonnage with parameters, including fishing country and taxa. Legal and illegal catches In recent years, Patagonian toothfish (Dissostichus eleginoides) longlining by France was the only legal fishery in the Kerguelen Island region (CCAMLR, 2019). Reports included the target species Patagonian toothfish, by-catch species, such as grenadiers (Macrourus spp.) and rays (Raja spp.) and discards, e.g., blue antimora (Antimora rostrata). Illegal, unreported and unregulated fishing has occurred in the area since 2006. Although no vessels have been sighted since 2014, abandoned gear has been recovered, and it was assumed foreign fishing remains present despite the absence of any illegal catch estimates since 2011. Within the Kerguelen Islands, there are annual fishing season closures as well as catch and vessel limits (CCAMLR 2019). Due to the highly regulated nature of legal fishing in the area including strict monitoring via obligatory logbooks, observers and inspections with reports including tonnages for bycatch and discards, we continued to consider the entire catch as reported. Future research needs to more closely investigate the likely scale of illegal fishing in these waters. Transition from 2017 to 2018 The catch reconstructed to 2017 was carried forward to 2018 using the semi-automated procedures outlined in Noël (2020), based on CCAMLR landing data to 2018. Semi-automated reconstructed catch data will later be replaced by a more detailed, research-intensive update. Marine biodiversity protection France has agreed to protect biological diversity of the Kerguelen Islands through the international Convention on Biological Diversity (Aichi) and the Ramsar Convention on Wetlands of International Importance (Marine Conservation Institute 2020). The Ramsar site belongs to the Réserve naturelle nationale des Terres australes françaises, which includes a large variety of inland and coastal wetland types such as peatlands, marshes and lakes, rocky shores, estuaries and fjords (Ramsar sites information service 2020). The MPA in these islands is part of the national natural reserve of the Terres australes françaises and one of the first and largest protected areas in the world. In this MPA, no extractive activity is allowed (TAAF 2020a). The location of the Kerguelen Islands, where the cold Antarctic waters are mixed with the warmer waters of the Indian Ocean, is a place where animal populations are still abundant. Large breeding colonies of pinnipeds and penguins (king penguins, gentoo penguins, eastern rockhopper penguins, and macaroni penguins; Tixier et al., 2019) can be found on the coast, and the waters are home to populations of toothfish (Dissostichus spp.). The marine vegetation is abundant, and it is characterized by underwater forests of Macrocystis or by a coastal fringe of Durvillea antarctica (TAAF 2020b). “The original ecosystems were, however, deeply

Updating to 2018 the 1950-2010 marine catch reconstructions of the Sea Around Us: Part I – Africa, Antarctica, Europe and the North Atlantic
157
modified on the one hand by the overexploitation of resources (whaling and sealing throughout the 19th century, industrial fishing at the end of the 20th century) and on the other hand by voluntary or involuntary introduction exogenous animals that have acclimatized: rabbits, cats, rats, reindeer, trout, etc.” (TAAF 2020b). Prince Edward Island (South Africa) The original reconstruction of Prince Edward Island’s (PEI) fisheries catches from 1950–2010 was done by Boonzaier et al. (2012, 2016); here, it is updated to 2017, then carried forward to 2018. Baseline data We updated the reported landings utilizing new data from the CCAMLR Statistical Bulletin (CCAMLR 2018). Catches by South Africa from CCAMLR area 58.6 and 58.7, were allocated 100% inside the PEI Exclusive Economic Zone (EEZ). A portion of the EEZ lies just outside the CCAMLR convention area in FAO area Western Indian Ocean (area 51); thus, we added the South African catch of Patagonian toothfish (Dissostichus eleginoides, the main target species) reported in Western Indian Ocean (FAO area 51) as being taken within the PEI EEZ area within FAO area 51. A marine protected area including a ‘no-take’ zone within 12 nautical miles of the Prince Edward and Marion Islands was implemented in 2013 with the primary aim of protecting biodiversity (DAFF 2014). We assumed that no illegal fishing occurred in this no-take zone (see DAFF 2014). Catches of Patagonian toothfish To estimate the tonnage of Patagonian toothfish caught in the Western Indian Ocean, the total CCAMLR reported catch was subtracted from the estimated total catch taken from the EEZ of Prince Edward Island as presented by the South African Department of Agriculture, Forestry and Fisheries national report for 2011 and 2012 (DAFF 2014). The catch of Patagonian toothfish in the Western Indian Ocean for 2013 and 2014 was taken from CCAMLR (2015). For 2015 and 2016, the catch of Patagonian toothfish was taken from the CCAMLR (2016) report. For 2017, the South Africa CCAMLR area 58.6 and 58.7 catches were subtracted by the total amount in the CCAMLR (2017) report. The discard taxa and proportions for CCAMLR area 58.6 and 58.7 were used to estimate the associated discards from the area 51 D. eleginoides fishery from 2011–2017. Transition from 2017 to 2018 The catch reconstructed to 2017 was carried forward to 2018 using the semi-automated procedures outlined in Noël (2020), based on CCAMLR landing data to 2018. Semi-automated reconstructed catch data will later be replaced by a more detailed, research-intensive update. Marine biodiversity protection South Africa has agreed to protect the biological diversity of Prince Edward Island through international agreements, i.e., the Convention on Biological Diversity (Aichi), the United Nations Convention on the Law of the Sea, the Ramsar Convention on Wetlands of International Importance, the International Coral Reef Initiative and the World Heritage Convention. The country is also a signatory to Regional Treaties and Agreements such as the Regional Seas Convention (Marine Conservation Institute 2020). Prince Edward Island has an MPA of 181,229 km2 (Marine Conservation Institute 2020), which occupies 38% of the entire EEZ (473,371 km2 only Prince Edward Island; Boonzaier et al. 2016). This MPA has different zones: control, restricted and sanctuary. In the 4441 km2 of the sanctuary zone, fishing is prohibited and the passage and anchoring of vessels is limited. In the restricted zone, controlled commercial fishing is permitted.

2020 Fisheries Centre Research Reports 28(5)
158
In the control zone, fishing for toothfish (Dissostichus eleginoides) is allowed with a permit (Minister of water and environmental affairs 2013). A 38-year long study conducted on pinnipeds at Prince Edward Islands by the Marine Mammal Programme (MMP) found an increase in the southern elephant seals’ (Mirounga leonine) population and a subsequent increase of sympatric populations of Subantarctic fur seals Arctocephalus tropicalis and Antarctic fur seals A. gazella, especially after the ban of commercial sealing (Bester et al. 2011). St. Paul and Amsterdam Islands (France) The original reconstruction of fisheries catches around the remote French sub-Antarctic volcanic islands of St. Paul and Amsterdam was originally completed by Pruvost et al. (2015); see also Pruvost et al. (2016). This reconstruction was updated to 2018 using available French and FAO data for this region. Given that the St. Paul and Amsterdam Islands belong to the French ‘Southern and Antarctic Lands’ (‘Terres australes et antarctiques françaises’ or TAAF), the reported data sources from 2001 to 2010 for St. Paul and Amsterdam consisted of both French national and FAO data. FAO data to 2018 from the TAAF were included for catches of St. Paul rock lobster (Jasus paulensis) and miscellaneous marine fishes. National data collected by the Direction des pêches maritimes et de l’aquaculture, in collaboration with the National Museum of Natural History (NMNH) in Paris, were included for catches of yellowtail amberjack (Seriola lalandii), trumpeters (Family Latridae), St. Paul’s fingerfins and other cheilodactylids (Nemadactylus spp.), and others. Due to the fluctuating numbers from national data over the years, the overall linear trend of total catches recorded in national data from 2001 to 2010 was calculated, then carried forward to 2018. These calculated totals were then disaggregated based on the 10-year average ratios of the total catch calculated for each taxon. FAO data for the French Southern Territory (TAAF) in the Western Indian Ocean (FAO area 51) were assigned to this EEZ, as in the past reconstruction.
Figure 1. Catches in the St. Paul and Amsterdam EEZ for 1950-2018, by data sources, i.e., FAO and NMHN (French) data.

Updating to 2018 the 1950-2010 marine catch reconstructions of the Sea Around Us: Part I – Africa, Antarctica, Europe and the North Atlantic
159
Marine biodiversity protection France has agreed to protect the biological diversity of St. Paul and Amsterdam islands through the international Convention on Biological Diversity (Aichi) and the Ramsar Convention on Wetlands of International Importance (Marine Conservation Institute 2020). The Ramsar site belongs to the Réserve naturelle nationale des terres australes françaises, which includes a large variety of inland and coastal wetland types such as peatlands, marshes and lakes, rocky shores, estuaries and fjords (Ramsar sites information service 2020). St. Paul and Amsterdam islands also harbor ‘mIBAs’, i.e., Marine Important Bird and Biodiversity Areas (Heerah et al. 2019). The MPA in these islands, part of the national natural reserves of the French Southern Territories, was one of the first and largest protected areas in the world where any industrial or commercial extractive activity is prohibited, including fishing (TAAF 2020a). The productive waters that surround St. Paul and Amsterdam islands provide habitats and feeding and breeding grounds to benthic and pelagic fish species, seabirds, cetaceans and pinnipeds, including large population of Subantarctic fur seal (Arctocephalus tropicalis) (TAAF 2020b). The Amsterdam Islands stand out as the major breeding ground for Indian yellow-nosed albatross (Thalassarche carteri). However, from the 1980s to 2015, the colony decreased by 1.1% per year, resulting in an estimated decrease of 38.6% from 1983 to 2015. This was due to the increase of sea surface temperatures, fisheries bycatch, and mostly avian cholera (Weimerskirch 2018). South Georgia, South Sandwich and South Orkney Islands (United Kingdom) The original reconstructions of catches for the South Georgia, South Sandwich and South Orkney Islands were completed by Palomares and Pauly (2015, 2016a, 2016b). They were updated to 2017 here using data in CCAMLR (2018), then carried forward using the procedure in Noël (2020). Reported baseline data All of the CCAMLR sub-areas 48.3 and 48.4 data were allocated to the South Georgia and South Sandwich EEZs; data of sub-area 48.2 were allocated to the South Orkney ‘EEZ’. Note that the South Orkney Islands, in contrast to the South Georgia and South Sandwich Islands, do not have a formally claimed EEZ around them. Here, however, we follow Palomares and Pauly (2016b) in treating the waters up to 200 nautical miles around the South Orkney as forming their ‘EEZ’. Correcting for an omission Since the initial catch data reconstruction, it has come to our attention that there was some CCAMLR catch by the former USSR in area 48 (sub-area unspecified) that had not been included in the Sea Around Us database. A portion of this unspecified catch has been allocated to sub-areas 48.2, 48.3 and 48.4, and thus added into the reconstruction. All of the additional catch was allocated to specific CCAMLR areas by using the ratios of the existing catch with a sub-area assigned to it. FAO data for the former USSR targeting marbled rockcod (Notothenia rossii) in FAO area Antarctic Atlantic in the late 1960s (before CCAMLR started recording statistics) and was not included in the Sea Around Us database. This catch has been added to the South Georgia EEZ because this is where CCAMLR first started to report that the former USSR fished marbled rockcod in 1970, and there are no reports of the former USSR fishing anywhere else in FAO area Atlantic Antarctic at that time.

2020 Fisheries Centre Research Reports 28(5)
160
Discards The CCAMLR data include by-catch and discards in their total catch reports, but these are not taxonomically disaggregated. Thus, some by-catch taxa thought to be discarded, such as blue antimora (Antimora rostrata), grenadiers (Family Macrouridae) and rays (Order Rajiformes), have been labelled as ‘CCAMLR reported discards’. In 2012. a large marine protected area (MPA) was declared by the U.K. around the South Georgia and South Sandwich Islands to reduce biodiversity loss (Handley et al. 2020). Management boundaries within the MPA allow for multiple use zones and temporal closures (Trathan et al. 2014). Current management measures for fisheries within the MPA were evaluated to protect top predators, though unregulated fisheries outside of the MPAs boundaries may pose a threat to the protection of these species (Handley et al. 2020). Transition from 2017 to 2018 The catch reconstructed to 2017 was carried forward to 2018 using the semi-automated procedures outlined in Noël (2020), based on CCAMLR landing data to 2018. Semi-automated reconstructed catch data will later be replaced by a more detailed, research-intensive update. Marine biodiversity protection The United Kingdom has agreed to protect the biological diversity of the South Georgia, South Sandwich and the South Orkney islands through the international Commission for the Convention on Conservation of Antarctic Marine Living Resources (CCAMLR). Taken together, these islands protect over 80% (UNEP-WCMC and IUCN 2020a, 2020b) of the EEZ around them (i.e., 1,593,430 km2; Palomares and Pauly 2016a, 2016b). In 1982, the Commission for the Conservation of Antarctic Marine Living Resources (CCAMLR) was formed and in 1993 the South Georgia and South Sandwich Islands Maritime Zone was declared (Trathan et al. 2014). However, the CCAMLR recognized the need to create permanent spatial protection measures only in 2005 (Trathan et al. 2014). In 2009, the so-called MPA ‘South Orkney Islands Southern Shelf (SOI SS)’ was established. It was the first MPA to be designated by CCAMLR and also the first one designated entirely within internationally managed waters. Nevertheless, further designations in the Southern Ocean were slowed down due to divergent views of country members of CCAMLR and calls for additional scientific evidence. Therefore, it was not until 2012, when the Government of South Georgia and the South Sandwich Islands (GSGSSI) declared an MPA in its Maritime Zone. The Government of these islands agreed on a high-level of protection, based on scientific advice (Trathan et al. 2014). Some of the pressures affecting these waters are associated with illegal, unreported and unregulated fishing, even though the instruments of the Antarctic Treaty System offer a high level of environmental protection (Trathan et al. 2014). For the Antarctic Treaty System and the CCAMLR, it is important to enable “scientific studies in areas where the confounding effects of climate change, marine mammal recovery and other human induced factors can be studied in the absence of fishing” (Trathan and Grant 2020). Discussion Recent establishment of MPAs within the territories of islands surrounding Antarctica seek to protect the unique biodiversity of these remote areas. However, the difficulty of patrolling the waters around these distant territories and challenges to enforcing fishing access by CCAMLR have resulted in illegal, unreported and unregulated fishing for commercially valuable species such as Dissostichus eleginoides by foreign fleets. We

Updating to 2018 the 1950-2010 marine catch reconstructions of the Sea Around Us: Part I – Africa, Antarctica, Europe and the North Atlantic
161
have presented here our best estimates of these unreported catches based on information from CCAMLR estimates and other sources. Acknowledgments Funding for the work presented here was provided by the Minderoo Foundation, by the Marisla, Oak, and David and Lucille Packard Foundations, and by the Bloomberg Philanthropies through Rare. References Antarctica (Large Marine Ecosystem) Ainley, D. and D. Pauly. 2014. Fishing down the food web of the Antarctic continental shelf and slope. Polar
Record, 50(1): 92-107. Ainley, D. and D. Pauly. 2016. Antarctica, p. 188. In: D. Pauly and D. Zeller (eds). Global Atlas of Marine
Fisheries: A Critical Appraisal of Catches and Ecosystem Impacts. Island Press, Washington, DC. CCAMLR. 2010. Report of the Twenty-ninth Meeting of the Scientific Committee. Hobart, Australia. 322 p. CCAMLR. 2016a. Fishery Report 2016a: Exploratory fishery for Dissostichus spp. in Division 58.4.2.
Commission for the Conservation of Antarctic Marine Living Resources (CCAMLR), Hobart, Australia. CCAMLR. 2016b. Report of the Thirty-eighth Meeting of the Commission. Commission for the Conservation of
Antarctic Marine Living Resources (CCAMLR), Hobart, Australia. Available at https://www.ccamlr.org/en/system/files/e-cc-38_1.pdf
CCAMLR. 2018. CCAMLR Statistical Bulletin Volume 30. Commission for the Conservation of Antarctic Marine Living Resources (CCAMLR), Hobart, Australia. Available at: www.ccamlr.org/en/document/data/ccamlr-statistical-bulletin-vol-30
Chown, S., C. Brooks, A. Terauds, C. Le Bohec, C. van Klaveren-Impagliazzo, J. Whittington, S. Butchart, B. Coetzee, B. Collen, P. Convey, K. Gaston, N. Gilbert, M. Gill, R. Hoft, S. Johnston, M. Kennicutt, H. Kriesell, Y. Le Maho, H. Lynch, M. Palomares, R. Puig-Marco, P. Stoett and M.A. McGeoch. 2017. Antarctica and the strategic plan for biodiversity. PLOS Biology, 15(3): e2001656.
Marine Conservation Institute. 2020. MPAtlas [Online]. Seattle, WA. Available at: www.mpatlas.org New Zealand Government. 2016. Agreement to protect Ross Sea reached. Available at:
www.beehive.govt.nz/release/agreement-protect-ross-sea-reached New Zealand Foreign Affairs and Trade. 2020. Ross Sea region Marine Protected Area. Available at:
www.mfat.govt.nz/en/environment/antarctica/ross-sea-region-marine-protected-area/ Noël, S.-L. 2020. Semi-automation procedure for catch reconstruction forward carry, p. 15-20. In: B. Derrick,
M. Khalfallah, V. Relano, D. Zeller and D. Pauly (eds). Updating to 2018 the 1950-2010 Marine Catch Reconstructions of the Sea Around Us: Part I – Africa, Antarctica, Europe and the North Atlantic. Fisheries Centre Research Report 28(5).
Bouvet (Norway) Boonzaier, L., S. Harper, D. Zeller and D. Pauly. 2012. A brief history of fishing in the Prince Edward Islands,
South Africa, 1950-2010, p. 95-101. In: S. Harper, K. Zylich, L. Boonzaier, F. Le Manach, D. Pauly and D. Zeller (eds). Fisheries catch reconstructions: Islands, Part III. Fisheries Centre Research Report 20(5).
CCAMLR. 2017. Fishery Report: Exploratory fishery for Dissostichus mawsoni in Subarea 48.6. Commission for the Conservation of Antarctic Marine Living Resources (CCAMLR), Hobart, Australia.
CCAMLR. 2018. CCAMLR Statistical Bulletin Volume 30. Commission for the Conservation of Antarctic Marine Living Resources (CCAMLR), Hobart, Australia. Available at: www.ccamlr.org/en/document/data/ccamlr-statistical-bulletin-vol-30
Huyser, O. 2001. Bouvetøya (Bouvet Island), p.114. In: L.D.C. Fishpool and M.I. Evans (Eds). Important Bird Areas in Africa and Associated Islands: Priority Sites for Conservation. Birdlife International, Cambridge, UK.
Noël, S.-L. 2020. Semi-automation procedure for catch reconstruction forward carry, p. 15-20. In: B. Derrick, M. Khalfallah, V. Relano, D. Zeller and D. Pauly (eds). Updating to 2018 the 1950-2010 Marine Catch Reconstructions of the Sea Around Us: Part I – Africa, Antarctica, Europe and the North Atlantic. Fisheries Centre Research Report 28(5).
Norwegian Polar Institute. 2020a. Research. Available at: www.npolar.no/en/research/

2020 Fisheries Centre Research Reports 28(5)
162
Norwegian Polar Institute. 2020b. Advisory and administrative functions. Available at: www.npolar.no/en/advisory/
Padilla, A., D. Zeller and D. Pauly. 2015. The fish and fisheries of Bouvet Island, p. 21-30. In: M.L.D. Palomares and D. Pauly (eds). Marine Fisheries Catches of Sub Antarctic Islands, 1950-2010. Fisheries Centre Research Reports 23(1).
Padilla, A., D. Zeller, and D. Pauly. 2016. Norway (Bouvet Island), p. 356. In: D. Pauly and D. Zeller (eds). Global Atlas of Marine Fisheries: A Critical Appraisal of Catches and Ecosystem Impacts. Island Press, Washington, DC.
Sumby, J. 2012. The Empty Ocean. Tasmanian times, 25 March 2012. Available at: tasmaniantimes.com/wp-content/uploads/attachments/Jon_The_Empty_Ocean_TT_story.pdf
Crozet Island (France) Barbraud, C., K. Delord, C. Bost, A. Chaigne, C. Marteau and H. Weimerskirch. 2020. Population trends of
penguins in the French Southern Territories. Polar Biology, 43: 835-850. CCAMLR. 2018. CCAMLR Statistical Bulletin Volume 30. Commission for the Conservation of Antarctic
Marine Living Resources (CCAMLR), Hobart, Australia. Available at: www.ccamlr.org/en/document/data/ccamlr-statistical-bulletin-vol-30
CCAMLR. 2019. Fishery Report 2018: Dissostichus eleginoides. Crozet Island French EEZ (Subarea 58.6). Commission for the Conservation of Antarctic Marine Living Resources (CCAMLR), Hobart, Australia.
Clapham, P.J., S.B. Young and R.L. Brownell. 1999. Baleen whales: conservation issues and the status of the most endangered populations. Mammal Review, 29: 37−62.
Guinet, C. 1992. Comportement de chasse des orques (Orcinus orca) autour des iles Crozet. Canadian Journal of Zoology, 70: 1656−1667.
Marine Conservation Institute. 2020. MPAtlas [Online]. Seattle, WA. Available at: www.mpatlas.org Noël, S.-L. 2020. Semi-automation procedure for catch reconstruction forward carry, p. 15-20. In: B. Derrick,
M. Khalfallah, V. Relano, D. Zeller and D. Pauly (eds). Updating to 2018 the 1950-2010 Marine Catch Reconstructions of the Sea Around Us: Part I – Africa, Antarctica, Europe and the North Atlantic. Fisheries Centre Research Report 28(5).
Pruvost, P., G. Duhamel, N. Gasco and M.L.D. Palomares. 2015. A short history of the fisheries of Crozet Islands, p. 31-36. In: M.L.D. Palomares and D. Pauly (eds). Marine Fisheries Catches of Sub Antarctic Islands, 1950-2010. Fisheries Centre Research Reports 23(1).
Pruvost, P., G. Duhamel, N. Gasco and M. L. D. Palomares. 2016. France (Crozet Islands), p. 255. In: D. Pauly and D. Zeller (eds). Global Atlas of Marine Fisheries: A Critical Appraisal of Catches and Ecosystem Impacts. Island Press, Washington, DC.
Poncelet, É., C. Barbraud and C. Guinet. 2010. Population dynamics of killer whales (Orcinus orca) in the Crozet Archipelago, southern Indian Ocean: a mark−recapture study from 1977 to 2002. Journal of Cetacean Research and Management, 11(1): 41−48.
Ramsar sites information service. 2020. Réserve naturelle nationale des Terres australes françaises. Available at: rsis.ramsar.org/ris/1837
TAAF. 2020a. Terres australes françaises. Available at: www.reserves-naturelles.org/terres-australes-francaises
TAAF. 2020b. Les iles australes. Available at: taaf.fr/collectivites/presentation-des-territoires/les-iles-australes/
Tixier, P., M. Authier, N. Gasco and C. Guinet. 2015. Influence of artificial food provisioning from fisheries on killer whale reproductive output. Animal Conservation, 18: 207−218.
Tixier, P., C. Barbraud, D. Pardo, N. Gasco, G. Duhamel and C. Guinet. 2017. Demographic consequences of fisheries interaction within a killer whale (Orcinus orca) population. Marine Biology, 164: 170.
Tixier, P., J. Giménez, R.R. Reisinger, P. Méndez-Fernandez, J.P. Arnould, Y. Cherel and C. Guinet. 2019. Importance of toothfish in the diet of generalist subantarctic killer whales: Implications for fisheries interactions. Marine Ecology Progress Series, 613:197-210.
Weimerskirch, H., P. Inchausti, C. Guinet and C. Barbraud. 2003. Trends in bird and seal populations as indicators of a system shift in the Southern Ocean. Antarctic Science, 15: 249−256.
Weimerskirch, H., F. Le Bouard, P.G. Ryan and C.A. Bost. 2018. Massive decline of the world’s largest king penguin colony at Ile aux Cochons, Crozet. Antarctic Science, 30: 236−242.
Falkland Islands Arkhipkin, A.I., V.V. Laptikhovsky and A.J. Barton. 2015. Chapter 6: Biology and fishery of common hake
(Merluccius hubbsi) and southern hake (Merluccius australis) around Falkland/Malvinas Islands on

Updating to 2018 the 1950-2010 marine catch reconstructions of the Sea Around Us: Part I – Africa, Antarctica, Europe and the North Atlantic
163
the Patagonian Shelf of the Southwest Atlantic Ocean, p. 155-176. In: A. Hugo (ed). Hakes: Biology and Exploitation. First edition. Wiley-Blackwell, Oxford. 376 p.
Augé, A.A., M.P. Dias, B. Lascelles, A.M. Baylis, A. Black, P.D. Boersma, P. Catry, S. Crofts, F. Galimberti, J.P. Granadeiro, A. Hedd, K. Ludynia, J.F. Masello, W. Montevecchi, R.A. Phillips, K. Pütz, P. Quillfeldt, G.A. Rebstock, S. Sanvito, I.J. Staniland, A. Stanworth, D. Thompson, M. Tierney, P.N. Trathan, J.P. Croxall. 2018. Framework for mapping key areas for marine megafauna to inform Marine Spatial Planning: The Falkland Islands case study. Marine Policy, 92: 61-72.
Falkland Islands Government. 2015. Fishery statistics Volume 19 (2005-2014). Falkland Islands Fisheries Department, Stanley, Falkland Islands. 100 p.
Laptikhovsky, V., J. Pompert and P. Brickle. 2006. Fishery discards management and environmental impact in Falkland Islands Fisheries. Falkland Islands Fisheries Department, Stanley, Falkland Islands. 11p.
Marine Conservation Institute. 2020. MPAtlas [Online]. Seattle, WA. Available at: www.mpatlas.org Noël, S.-L. 2020. Semi-automation procedure for catch reconstruction forward carry, p. 15-20. In: B. Derrick,
M. Khalfallah, V. Relano, D. Zeller and D. Pauly (eds). Updating to 2018 the 1950-2010 Marine Catch Reconstructions of the Sea Around Us: Part I – Africa, Antarctica, Europe and the North Atlantic. Fisheries Centre Research Report 28(5).
Palomares, M.L.D. and D. Pauly. 2015. Fisheries of the Falkland Islands and the South Georgia, South Sandwich and South Orkney, p. 1-20. In: M.L.D. Palomares and D. Pauly (eds). Marine Fisheries Catches of Sub Antarctic Islands, 1950-2010. Fisheries Centre Research Reports 23(1).
Palomares, M.L.D. and D. Pauly. 2016. United Kingdom (Falkland Islands), p. 431. In: D. Pauly and D. Zeller (eds). Global Atlas of Marine Fisheries: A Critical Appraisal of Catches and Ecosystem Impacts. Island Press, Washington, DC.
UNEP-WCMC and IUCN. 2020. Protected Planet: Protected Area Profile for Falkland Islands (Malvinas) from the World Database of Protected Areas, June 2020. Available at: www.protectedplanet.net/country/FK
Kerguelen Island CCAMLR. 2018. CCAMLR Statistical Bulletin Volume 30. Commission for the Conservation of Antarctic
Marine Living Resources (CCAMLR), Hobart, Australia. Available at: www.ccamlr.org/en/document/data/ccamlr-statistical-bulletin-vol-30.
CCAMLR. 2019. Fishery Report 2018: Dissostichus eleginoides Kerguelen Islands French EEZ (Division 58.5.1). Commission for the Conservation of Antarctic Marine Living Resources (CCAMLR), Hobart, Australia.
Marine Conservation Institute. 2020. MPAtlas [Online]. Seattle, WA. Available at: www.mpatlas.org Noël, S.-L. 2020. Semi-automation procedure for catch reconstruction forward carry, p. 15-20. In: B. Derrick,
M. Khalfallah, V. Relano, D. Zeller and D. Pauly (eds). Updating to 2018 the 1950-2010 Marine Catch Reconstructions of the Sea Around Us: Part I – Africa, Antarctica, Europe and the North Atlantic. Fisheries Centre Research Report 28(5).
Palomares, M.L.D. and D. Pauly. 2011. A brief history of fishing in the Kerguelen Islands, France, p. 15-20. In: S. Harper and D. Zeller (eds). Fisheries catch reconstructions: Islands, Part II. Fisheries Centre Research Reports 19(4).
Palomares, M.L.D. and D. Pauly. 2016. France (Kerguelen Islands), p. 260. In: D. Pauly and D. Zeller (eds). Global Atlas of Marine Fisheries: A Critical Appraisal of Catches and Ecosystem Impacts. Island Press, Washington, DC.
Ramsar sites information service. 2020. Réserve naturelle nationale des Terres australes françaises. Available at: rsis.ramsar.org/ris/1837
TAAF. 2020a. Terres australes françaises. Available at: www.reserves-naturelles.org/terres-australes-francaises
TAAF. 2020b. Les iles australes. Available at: taaf.fr/collectivites/presentation-des-territoires/les-iles-australes/
Tixier, P., J. Giménez, R.R. Reisinger, P. Méndez-Fernandez, J.P. Arnould, Y. Cherel and C. Guinet. 2019. Importance of toothfish in the diet of generalist subantarctic killer whales: Implications for fisheries interactions. Marine Ecology Progress Series, 613:197-210.
Prince Edward Island Bester, M.N., P. de Bruyn, W.C. Oosthuizen, C.A. Tosh, T. McIntyre, R.R. Reisinger, M. Postma, D. van der
Merwe and M. Wege. 2011. The Marine Mammal Programme at the Prince Edward Islands: 38 years of research. African Journal of Marine Science, 33(3): 511–521.

2020 Fisheries Centre Research Reports 28(5)
164
Boonzaier, L., S. Harper, D. Zeller, and D. Pauly. 2012. A brief history of fishing in the Prince Edward Islands, South Africa, 1950-2010, p. 95-101. In: S. Harper, K. Zylich, L. Boonzaier, F. Le Manach, D. Pauly and D. Zeller (eds). Fisheries catch reconstructions: Islands, Part III. Fisheries Centre Research Reports 20(5).
Boonzaier, L., S. Harper, D. Zeller and D. Pauly. 2016. South Africa (Prince Edward Islands), p. 393. In: D. Pauly and D. Zeller (eds). Global Atlas of Marine Fisheries: A Critical Appraisal of Catches and Ecosystem Impacts. Island Press, Washington, DC.
CCAMLR. 2015. Fishery report 2015: Dissostichus eleginoides Prince Edward Islands South African EEZ (Subareas 58.6 and 58.7 and part of area 51). Commission for the Conservation of Antarctic Marine Living Resources (CCAMLR), Hobart, Australia.
CCAMLR. 2016. Fishery Report 2016: Dissostichus eleginoides Prince Edward Islands South African EEZ (Subarea 58.7 and part of Area 51). Commission for the Conservation of Antarctic Marine Living Resources (CCAMLR), Hobart, Australia.
CCAMLR. 2017. Fishery Report 2017: Dissostichus eleginoides Prince Edward Islands South African EEZ (Subarea 58.7 and part of Area 51). Commission for the Conservation of Antarctic Marine Living Resources (CCAMLR), Hobart, Australia.
CCAMLR. 2018. CCAMLR Statistical Bulletin Volume 30. Commission for the Conservation of Antarctic Marine Living Resources (CCAMLR), Hobart, Australia. Available at: www.ccamlr.org/en/document/data/ccamlr-statistical-bulletin-vol-30.
DAFF. 2014. Status of the South African marine fishery resources 2014. Department of Agriculture Forestry and Fisheries (DAFF), Cape Town, South Africa.
Marine Conservation Institute. 2020. MPAtlas [Online]. Seattle, WA. Available at: www.mpatlas.org Minister of water and environmental affairs. 2013. Regulations for the Management of the Prince Edward
Islands Marine Protected Area. Available at: cer.org.za/wp-content/uploads/2014/02/Regulations-for-the-management-of-Prince-Albert-MPA.pdf
Noël, S.-L. 2020. Semi-automation procedure for catch reconstruction forward carry, p. 15-20. In: B. Derrick, M. Khalfallah, V. Relano, D. Zeller and D. Pauly (eds). Updating to 2018 the 1950-2010 Marine Catch Reconstructions of the Sea Around Us: Part I – Africa, Antarctica, Europe and the North Atlantic. Fisheries Centre Research Report 28(5).
St. Paul and Amsterdam Islands Heerah, K., M.P. Dias, K. Delord, S. Oppel, C. Barbraud, H. Weimerskirch and C.A. Bost. 2019. Important
areas and conservation sites for a community of globally threatened marine predators of the Southern Indian Ocean. Biological Conservation, 234: 192-201.
Marine Conservation Institute. 2020. MPAtlas [Online]. Seattle, WA. Available at: www.mpatlas.org Pruvost, P., G. Duhamel, F. Le Manach and M.L.D. Palomares. 2015. La pêche aux îles Saint-Paul et
Amsterdam, p. 39-48. In: M.L.D. Palomares and D. Pauly (eds). Marine Fisheries Catches of SubAntarctic Islands, 1950-2010. Fisheries Centre Research Reports 23(1).
Pruvost, P., G. Duhamel, F. Le Manach and M.L.D. Palomares. 2016. France (St Paul et Amsterdam), p. 268. In: D. Pauly and D. Zeller (eds). Global Atlas of Marine Fisheries: A critical Appraisal of Catches and Ecosystem Impacts. Island Press, Washington, DC.
Ramsar sites information service. 2020. Réserve naturelle nationale des Terres australes françaises. Available at: rsis.ramsar.org/ris/1837
TAAF. 2020a. Terres australes françaises. Available at: www.reserves-naturelles.org/terres-australes-francaises
TAAF. 2020b. Les iles australes. Available at: taaf.fr/collectivites/presentation-des-territoires/les-iles-australes/
Weimerskirch, H., K. Delord, C. Barbraud, F. Le Bouard, P.G. Ryan, P. Fretwell and C. Marteau. 2018. Status and trends of albatrosses in the French Southern Territories, Western Indian Ocean. Polar Biology, 41(10): 1963-1972.
South Georgia, South Sandwich and South Orkney Islands Arkhipkin, A.I., V.V. Laptikhovsky, A.J. Barton. 2015. Chapter 6: Biology and fishery of common hake
(Merluccius hubbsi) and southern hake (Merluccius australis) around Falkland/Malvinas Islands on the Patagonian Shelf of the Southwest Atlantic Ocean, p.155-176. In: A. Hugo (ed). Hakes: Biology and Exploitation. First edition. Wiley-Blackwell, Oxford.
Updating to 2018 the 1950-2010 marine catch reconstructions of the Sea Around Us: Part I – Africa, Antarctica, Europe and the North Atlantic
165
CCAMLR. 2018. CCAMLR Statistical Bulletin Volume 30. Commission for the Conservation of Antarctic Marine Living Resources (CCAMLR), Hobart, Australia. Available at: www.ccamlr.org/en/document/data/ccamlr-statistical-bulletin-vol-30.
Handley, J.M., E.J. Pearmain, S. Oppel, A.P.B. Carneiro, C. Hazin, R.A. Phillips, N. Ratcliffe, I.J. Staniland, T.A. Clay, J. Hall, A. Scheffer, M. Fedak, L. Boehme, K. Pütz, M. Belchier, I. Boyd, P.N. Trathan and M.P. Dias. 2020. Evaluating the effectiveness of a large multi-use MPA in protecting Key Biodiversity Areas for marine predators. Diversity and Distributions, 26(6):715-729.
Noël, S.-L. 2020. Semi-automation procedure for catch reconstruction forward carry, p. 15-20. In: B. Derrick, M. Khalfallah, V. Relano, D. Zeller and D. Pauly (eds). Updating to 2018 the 1950-2010 Marine Catch Reconstructions of the Sea Around Us: Part I – Africa, Antarctica, Europe and the North Atlantic. Fisheries Centre Research Report 28(5).
Palomares, M.L.D. and D. Pauly. 2015. Fisheries of the Falkland Islands and the South Georgia, South Sandwich and South Orkney, p. 1-20. In: M.L.D. Palomares and D. Pauly (eds). Marine Fisheries Catches of Sub Antarctic Islands, 1950-2010. Fisheries Centre Research Reports 23(1).
Palomares, M.L.D. and D. Pauly. 2016a. United Kingdom (South Georgia and South Sandwich Islands), p. 434. In: D. Pauly and D. Zeller (eds). Global Atlas of Marine Fisheries: A Critical Appraisal of Catches and Ecosystem Impacts. Island Press, Washington, DC.
Palomares, M.L.D. and D. Pauly. 2016b. United Kingdom (South Orkney Islands), p. 435 In: D. Pauly and D. Zeller (eds). Global Atlas of Marine Fisheries: A critical appraisal of catches and ecosystem impacts. Island Press, Washington D.C.
Trathan, P.N., M.A. Collins, S.M. Grant, M. Belchier, D.K.A. Barnes, J. Brown and I.J. Staniland. 2014. The South Georgia and the South Sandwich Islands MPA: Protecting a biodiverse oceanic island chain situated in the flow of the Antarctic Circumpolar Current, p. 15-18. In: M.L. Johnson and J. Sandell (eds). Advances in Marine Biology, Vol. 69. Academic Press, Oxford.
UNEP-WCMC and IUCN. 2020a. Protected Planet: Protected Area Profile for South Georgia and the South Sandwich Islands a from the World Database of Protected Areas, June 2020. Available at: www.protectedplanet.net/country/GS
UNEP-WCMC and IUCN. 2020b. Protected Planet: Protected Area Profile for South Orkney Islands Southern Shelf Marine Protected Area from the World Database of Protected Areas, June 2020. Available at: www.protectedplanet.net/south-orkney-islands-southern-shelf-marine-protected-area-marine-protected-area-ccamlr
Trathan, P.N. and S.M. Grant. 2020. Chapter 4 – The South Orkney Islands Southern Shelf Marine Protected Area: Towards the establishment of marine spatial protection within international waters in the Southern Ocean, p. 67-98. In: J. Humphreys and R.W.E. Clark (Eds). Marine Protected Areas. Elsevier.

2020 Fisheries Centre Research Reports 28(5)
166
EUROPEAN COUNTRIES CATCH RECONSTRUCTION UPDATES This group of reports on European catch reconstructions includes 5 individual chapters covering Denmark’s Baltic Sea Exclusive Economic Zone, as well as Georgia, Greece (including Crete), Spain’s Mediterranean coastline, and Turkey. This section also includes 5 regional chapters. The first European regional chapter is entitled “Updating catch reconstructions for Islands in the North Atlantic fisheries to 2018” and includes the Azores, Bermuda, Faeroes Island, Greenland, Iceland, Ireland and the United Kingdom and Channel Islands. The second, “Baltic Sea: Updating catch reconstructions to 2018”, includes Estonia, Finland, Latvia, Lithuania, Poland, and the Baltic coastlines of Germany, Russia, and Sweden. The third, “Updated catch reconstruction to 2018 for countries of the Black Sea”, includes Bulgaria, Romania, Russia’s Black Sea coast and Ukraine.
The fourth, “Updated catch reconstruction to 2018 for countries of the northern Mediterranean Sea”, includes Albania, Balearic Islands (Spain), Bosnia and Herzegovina, Corsica (France), Croatia, Cyprus (North and South), Egypt, France’s Mediterranean coastline, Italy, Sardinia (Italy), Sicily (Italy), Malta, Montenegro, and Slovenia. The fifth, “Updating catch reconstructions to 2018 for countries of the Northeast Atlantic Ocean”, includes Belgium, Denmark’s North Sea EEZ, France’s Atlantic Ocean EEZ, Germany’s North Sea EEZ, The Netherlands, Norway, Jan Mayen (Norway) and Svalbard Islands (Norway), Portugal, Russia’s Barents Sea EEZ, Spain’s Atlantic coast EEZ and Sweden’s West coast EEZ.

Updating to 2018 the 1950-2010 marine catch reconstructions of the Sea Around Us: Part I – Africa, Antarctica, Europe and the North Atlantic
167
DENMARK (BALTIC SEA): UPDATED CATCH RECONSTRUCTION FOR 2011-2018*
Courtney Brown and Eric Sy
Sea Around Us, Institute for the Oceans and Fisheries, University of British Columbia, 2202 Main Mall, Vancouver, BC, V6T 1Z4, Canada
Abstract An earlier catch reconstruction for Denmark’s marine fisheries within the Baltic Sea for the years 1950 to 2010 was updated to 2018 using data from the International Council for the Exploration of the Sea (ICES) as the reported data baseline. Growing recognition of the importance of recreational fisheries have led to more studies into the impact of this fishing sector, and such studies were used to improve the recreational fisheries catches of Denmark in the Baltic Sea. Introduction The original reconstruction of Denmark’s marine fisheries catches within its Baltic Sea Exclusive Economic Zone (EEZ) was performed for 1950-2007 by Bale et al. (2010) and updated to 2010 by Zeller et al. (2011) and Bale et al. (2016). This account presents an update of this reconstruction to 2016, and a subsequent carry-forward to 2018. Materials and Methods Reported baseline data Nominal catch data from the International Council for the Exploration of the Sea (ICES) covering the years 2006-2016 were used as the reported baseline for 2011-2016 for the Baltic (ICES areas III b, c and d). Minor retroactive changes made to ICES catch statistics from 2006-2010 were implemented as well. Spatial assignment Catch data were spatially assigned inside and outside of Denmark’s Baltic EEZ using the percentages from the 1950-2007 reconstruction (Bale et al. 2010) and the 2008-2010 update by Zeller et al. (2011). Reported data were split into sectors (artisanal and industrial) using the same ratio of artisanal to industrial catch as the original reconstruction (Bale et al. 2010). ICES subdivisions (SD) 27.3d_NK was disaggregated into areas 24, 25, 26, 27, 28, 29, 32 using the 2007 percentages (15.6, 27.9, 23.2, 1.80, 21.1, 10.0 and 0.32%, respectively). Catch by taxon The most recent ICES Working Group Reports (WGR) were used to adjust reported catch estimates from 2011-2016 (ICES Advice 2018a, 2018b; ICES 2018c; ICES 2018d). Adjusted catch was estimated as the difference between WGR landings and ICES landings for cod (Gadus morhua), turbot (Scophthalmus maximus), dab (Limanda limanda), brill (Scophthalmus rhombus), flounder (Platichthys flesus), plaice (Pleuronectes platessa) and Atlantic salmon (Salmo salar, see Table 1). When WGR landings of a particular taxon were higher than ICES landings, the difference in catch was added as unreported catch, given that ICES data were considered the reported baseline data as reported by Europe to the FAO. If the unreported catch was small (i.e., less than 2 tonnes) it was excluded because WGR and ICES data show some small differences in rounding.
* Cite as: Brown, C. and E. Sy. 2020. Denmark (Baltic Sea): Updated catch reconstruction for 2011 – 2018, p. 167-173. In: B. Derrick, M. Khalfallah, V. Relano, D. Zeller and D. Pauly (eds). Updating to 2018 the 1950-2010 Marine Catch Reconstructions of the Sea Around Us: Part I – Africa, Antarctica, Europe and the North Atlantic. Fisheries Centre Research Report 28(5).

2020 Fisheries Centre Research Reports 28(5)
168
In rare cases, ICES landings were higher than WGR landings resulting in a negative adjustment of ICES data, based on the assumption that WGR data is more reliable. However, negative adjustment factors were only applied for cod and were ignored for other taxa following the methods of the last reconstruction (Zeller et al. 2011).
Unreported catch was determined separately for Eastern and Western Baltic Cod stocks based on the ICES stock assessment working group data (ICES 2018a, 2018b). The original reconstruction likely over-estimated the unreported landings of Atlantic cod (Gadus morhua); thus, here emphasis was placed on comparing the total Atlantic cod catch in the Baltic before comparing the catch spatially (i.e., by ICES management areas). Unreported catches Illegal, unreported and unregulated (IUU) catch was calculated as a percentage of total landings (ICES + adjustments) for 2011-2016. In the original reconstruction (Bale et al. 2010), Denmark’s ‘unallocated’ catch was assigned to Denmark based on the ratio of Denmark’s landings compared to the total landings in Europe (excluding Sweden). For cod, no unallocated catch was reported by the Working Groups for Europe from 2010-2016. Therefore, the most recent unreported catch rate was carried forward (0.04% since 2005 for western cod, and 9.1% since 2009 for western cod). The IUU rate for Atlantic salmon (11.2% in 2007) was carried forward unchanged because recent WGRs have started reporting a mode or median ‘unallocated’ catch whereas the ‘minimum’ has been used for the reconstructions previously. Using the ‘median’ increases the rate substantially and in order to remain conservative, the 2007 rate was carried forward to 2016 as was done previously. IUU rates for ‘other’ taxa were based on the cod and Atlantic salmon IUU rates. Since no adjustments were made to cod and salmon rates, the 2007 IUU rate of 11.2% was carried forward. Discards Discards were calculated as a percentage of total landings (ICES + adjustments + IUU) for 2011-2016. Neither the 2008-2010 update (Zeller et al. 2011), nor this update to 2016 include mortality from ghost fishing, underwater discards and seal damaged discards. Boat-based discard rates for Eastern and Western cod were updated from 2008-2017 (with retroactive changes to 2006 and 2007 for Eastern cod) using ICES Advice documents (ICES Advice 2018a, b) published for the Baltic Sea Ecoregion in 2018 (see shaded discard rates in Table 2). The rates were applied to total landings (i.e., ICES landings statistics + adjustments + unreported landings) of Eastern (SD 25-32) and
Table 1. Updated from Bale et al. (2010, table 3), years for which adjustments were made to reported landings data (ICES landings statistics) for Denmark by taxon. Data sources (ICES 2007, 2008, 2019).
Common name
Years
Original Reconstruction
2014 CF 2016 CF
Cod (eastern and western) -- 2008-2014 2015-2016 Atlantic salmon 1980, 1993, 1998-2006 -- 2007-2016 Flatfishes
Brill 1995, 2005 -- -- Common dab 2005 -- 2008, 2010, 2013,
2014, 2016 European flounder 1968-1970, 1973, 1989,
1992-1994 -- --
European plaice 1996, 2005 -- 2008, 2011, 2012, 2014
Turbot 1993 -- 2010, 2015, 2016

Updating to 2018 the 1950-2010 marine catch reconstructions of the Sea Around Us: Part I – Africa, Antarctica, Europe and the North Atlantic
169
Western (SD 22-24) cod stocks. The discard rates of all other taxa were described in the original reconstructions (Bale et al. 2010; Zeller et al. 2011) and held constant from 2010-2016.
Table. 2: Boat based discard rates (from Bale et al. 2010. For shaded discard rates of Eastern cod, see Table 13 in ICES Advice (2018a); for Western cod, see Table 8 in ICES Advice (2018b).
Years Eastern cod Discard rate
(%)
Western cod Discard rate
(%)
Years Eastern cod Discard rate
(%)
Western cod Discard rate
(%) 1950-1965 10.2a 65b 1992 3.5 19.2
1966 9.4 65 1993 3.5 14.5 1967 12.6 65 1994 2.1 10.6 1968 8.6 65 1995 1.7 11.3 1969 9.8 65 1996 1.2 15.7 1970 6.8 71.5 1997 3.9 10 1971 4.9 57 1998 3.4 17.4 1972 12.7 66.9 1999 2.5 11.6 1973 8.9 21.3 2000 6.8 12.5 1974 10.5 42.6 2001 3.2 11.2 1975 10.4 22.4 2002 2.2 10.4 1976 2.3 18.3 2003 2.8 15.8 1977 1.6 25.6 2004 1.8 10.1 1978 15.5 27.5 2005 3 18.6 1979 16 10.8 2006 7.1 8.6 1980 3.6 17.1 2007 8.2 8.3 1981 1.6 13.8 2008 8.9 3.2 1982 5.9 35.3 2009 6.9 4.8 1983 4.7 40.7 2010 7 10.7 1984 2.4 17.9 2011 7.6 3.1 1985 3.1 7.2 2012 13.3 4 1986 1.2 15.3 2013 16 12.2 1987 5.9 20.8 2014 33.3 10.7 1988 4.5 10.2 2015 15.9 5.4 1989 1.9 7.8 2016 12.3 2.5 1990 3 7.9 2017 12.8 4.9 1991 2.2 9.6
athree-year average, 1966-1968, applied as a constant. bthree-year average, 1970-1972, applied as a constant
Recreational fishery Since the initial reconstruction, literature has become available suggesting the need to reduce the number of recreational fishers previously assumed to operate in the Baltic part of the Danish EEZ. An angling survey in Denmark interviewing 18-66-year-olds (the age bracket that legally requires a fishing license; Toivonen et al. 2000) estimated that 425,000 people fished in 1996, which corresponds roughly to the about half a million Danes who consider themselves anglers (Bohn and Roth 1997). Similarly, a mail survey in 1999 estimated that Denmark had 451,000 recreational fishers in the 18-69 age group (Toivonen et al. 2000). Finally, in 2016, a

2020 Fisheries Centre Research Reports 28(5)
170
summary report of recreational fishing in the Baltic Sea Region estimated that approximately half a million Danes fished recreationally (Sporrong 2017; Ministeriet for Fødevarer 2015). These studies were used as anchor points to calculate the percentage of recreational fishers in the Danish population (see Table 3). As in the original reconstruction (Bale et
al. 2010), it was assumed that the ratio of anglers in the population in 1950 was 10% less than in 1996. The ratio of fishers was interpolated between anchor points. The total number of recreational fishers was then distributed between the gillnetters (using passive gears) and the anglers (using rod and reel). The number of gillnetters reported by Fiskeridirektoratet (2007) between 1999-2007 matches the number of passive gear licenses reported in Sparrevohn & Storr-Paulsen (2012) for 1999-2009. Additional anchor points were reported for 2011 and 2016 based on the number of passive licenses issued, which were 33,911 and 31,502, respectively (Sporrong 2017). Again, interpolation was performed between anchor points and the first anchor point in 1999 of 33,575 gillnetters was carried back unchanged to 1950 as per the reconstruction of Bale et al. (2010). The remainder of recreational fishers (those not passively fishing) were considered anglers (see Table 4). This assumption seems plausible considering the number of ‘angling licenses’ and the high rates of people fishing without a license (Bohn & Roth 1997; Sporrong 2017; Sparrevohn & Storr-Paulsen 2012).
Year Recreational fishers (RF)
Gillnetters (G)
Angler (A)
1950 311,147 33,575 277,572 1951-1998 See Table 10
in Bale et al. (2010) 33,575 A = RF - G
1999 451,000 33,575 417,425 2000 453,309 31,709 421,600 2001 455,738 33,715 422,023 2002 458,001 33,888 424,113 2003 460,055 33,516 426,540 2004 462,055 33,473* 428,582 2005 464,141 33,430 430,711 2006 466,483 34,277 432,206 2007 469,374 33,787 435,587 2008 472,962 35,221 437,741 2009 476,326 34,000 442,326 2010 Table 3 - A = RF - G 2011 482,088 33,911 448,177
2012-2015 Table 3 - A = RF - G 2016 500,000 31,502 468,498
*There are no data for 2004 in Sparrevohn and Storr-Paulsen (2012); 2004 was interpolated.
Table 3. Anchor points and assumption-based numbers of Danish anglers (1950-2007). World Bank (2018) data were used for Denmark’s population between 1960-2016. Data sources: Bohn and Roth (1997); Toivonen et al. (2000); Sporrong (2017); Ministeriet for Fødevarer (2015). Year Population
(103) Recreational fishing (%)
Recreational fishers (103)
1950 4,281 7.3 311 1996 5,263 8.1 425 1999 5,322 8.5 451 2016 5,728 8.7 500
Table 4. Numbers of recreational fishers (gillnetters and anglers) in Danish waters; data updated from Bale et al. (2010); other data from Fiskeridirektoratet (2007); Sparrevohn and Storr-Paulsen (2012) and Sporrong (2017).
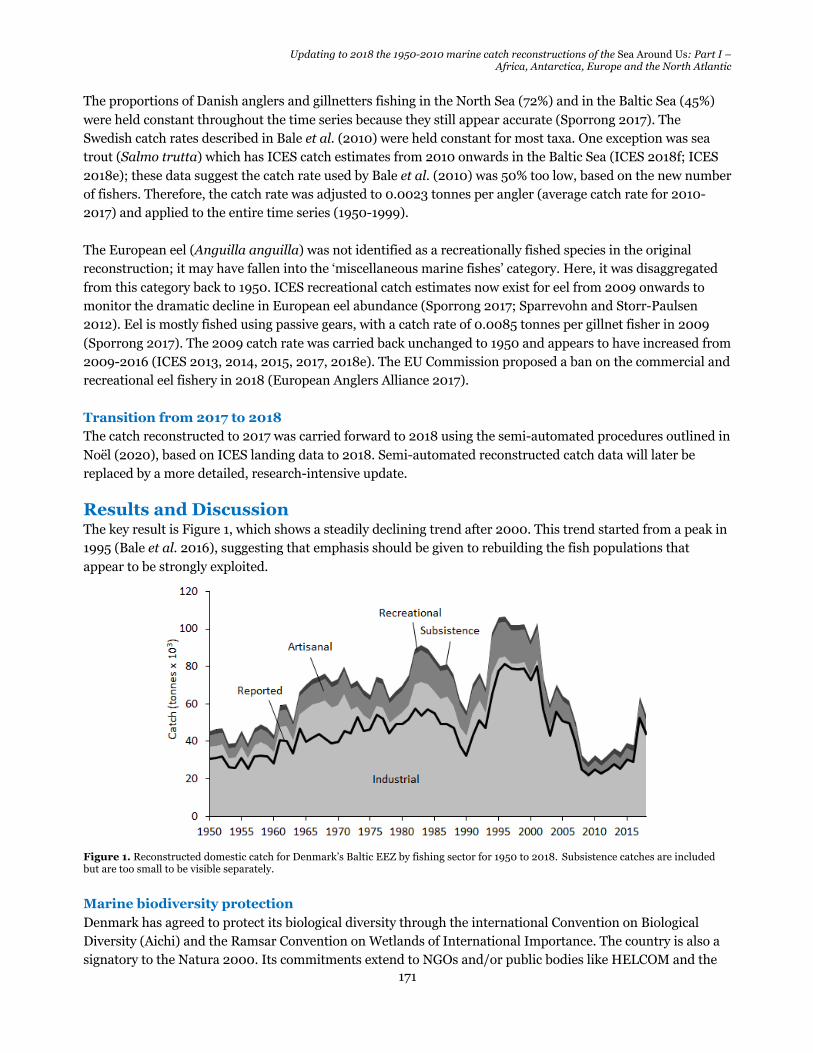
Updating to 2018 the 1950-2010 marine catch reconstructions of the Sea Around Us: Part I – Africa, Antarctica, Europe and the North Atlantic
171
The proportions of Danish anglers and gillnetters fishing in the North Sea (72%) and in the Baltic Sea (45%) were held constant throughout the time series because they still appear accurate (Sporrong 2017). The Swedish catch rates described in Bale et al. (2010) were held constant for most taxa. One exception was sea trout (Salmo trutta) which has ICES catch estimates from 2010 onwards in the Baltic Sea (ICES 2018f; ICES 2018e); these data suggest the catch rate used by Bale et al. (2010) was 50% too low, based on the new number of fishers. Therefore, the catch rate was adjusted to 0.0023 tonnes per angler (average catch rate for 2010-2017) and applied to the entire time series (1950-1999). The European eel (Anguilla anguilla) was not identified as a recreationally fished species in the original reconstruction; it may have fallen into the ‘miscellaneous marine fishes’ category. Here, it was disaggregated from this category back to 1950. ICES recreational catch estimates now exist for eel from 2009 onwards to monitor the dramatic decline in European eel abundance (Sporrong 2017; Sparrevohn and Storr-Paulsen 2012). Eel is mostly fished using passive gears, with a catch rate of 0.0085 tonnes per gillnet fisher in 2009 (Sporrong 2017). The 2009 catch rate was carried back unchanged to 1950 and appears to have increased from 2009-2016 (ICES 2013, 2014, 2015, 2017, 2018e). The EU Commission proposed a ban on the commercial and recreational eel fishery in 2018 (European Anglers Alliance 2017). Transition from 2017 to 2018 The catch reconstructed to 2017 was carried forward to 2018 using the semi-automated procedures outlined in Noël (2020), based on ICES landing data to 2018. Semi-automated reconstructed catch data will later be replaced by a more detailed, research-intensive update. Results and Discussion The key result is Figure 1, which shows a steadily declining trend after 2000. This trend started from a peak in 1995 (Bale et al. 2016), suggesting that emphasis should be given to rebuilding the fish populations that appear to be strongly exploited.
Figure 1. Reconstructed domestic catch for Denmark’s Baltic EEZ by fishing sector for 1950 to 2018. Subsistence catches are included but are too small to be visible separately. Marine biodiversity protection Denmark has agreed to protect its biological diversity through the international Convention on Biological Diversity (Aichi) and the Ramsar Convention on Wetlands of International Importance. The country is also a signatory to the Natura 2000. Its commitments extend to NGOs and/or public bodies like HELCOM and the

2020 Fisheries Centre Research Reports 28(5)
172
OSPAR Convention (Marine Conservation Institute 2020). For example, Denmark has the highest number of HELCOM Baltic Sea Protected Areas (66 areas), and they also cover the largest area (HELCOM 2013), occupying 38.6% of the entire Danish EEZ in the Baltic Sea (26979 km2; Bale et al. 2010). Denmark has 292 MPAs and 20 marine managed areas across the Baltic and North Sea together (Marine Conservation Institute 2020). Since the Danish Nature Protection Act came into force in 1917, the so-called Conservation Areas of Denmark, the oldest comprehensive tool to safeguard flora and fauna in the country, has been a crucial tool used to protect nature in this country (Garn et al. 2019). In 2018, the IUCN National Committee of Denmark undertook a project on behalf of the Danish Environmental Protection Agency to these Conservation Areas and to identify to which of these areas IUCN management categories could be assigned (Garn et al. 2019). The Marine Strategy Framework Directive (MSFD) adds additional EU requirements for spatial protection measures in order to support networks of coherent and representative marine protected areas. The Common Fisheries Policy (CFP) supports conservation measures of the MSFD and allows the establishment of protected areas of biological sensitivity (Edelvang et al. 2017). Additional protection efforts should focus on monitoring natural variations in salinity and temperature, which could eventually affect ecosystems and species composition. “In the Baltic Sea, salinity has declined due to a reduction in the frequency of saltwater intrusions. This has significantly affected species compositions and ecosystem structure, particularly in transitional areas where salinity and oxygen gradients are large” (Edelvang et al. 2017). Acknowledgements Funding for the work presented here was provided by the Minderoo Foundation, by the Marisla, Oak, and David and Lucille Packard Foundations, and by the Bloomberg Philanthropies through Rare. References Bale, S., P. Rossing, S. Booth and D. Zeller. 2010. Denmark’s marine fisheries catches in the Baltic Sea (1950-
2007), p. 36-62. In: P. Rossing, S. Booth and D. Zeller (eds). Total marine fisheries extractions by country in the Baltic Sea: 1950-present. Fisheries Centre Research Report 18(1).
Bale, S., P. Rossing, S. Booth and D. Zeller. 2016. Denmark (Baltic Sea), p. 236. In: D. Pauly and D. Zeller (eds). Global Atlas of Marine Fisheries: A critical appraisal of catches and ecosystem impacts. Island Press, Washington D.C.
Bohn, J. and E. Roth. 1997. Survey on angling in Denmark, 1997, p. 79-89. In: A.-L. Toivonen and P. Tuunainen (eds). Socio-economics of Recreational Fishery, TemaNord 1997: 604. Nordic Council of Ministers, Copenhagen.
Edelvang K., H. Gislason, F. Bastardie, A. Christensen, J. Egekvist, K. Dahl, C. Goeke, I.K. Petersen, S. Sveegaard, S. Heinänen, A.L. Middelboe, Z. Al-Hamdani, J.B. Jensen and J. Leth. 2017. Analysis of marine protected areas – in the Danish part of the North Sea and the Central Baltic around Bornholm. Part 1: The coherence of the present network of MPAs DTU Aqua Report No. 325-2017. National Institute for Aquatic Resources, Technical University of Denmark. 105 p.
European Anglers Alliance. 2017. EU Commission proposes eel fisheries ban in the Baltic Sea. www.eaa-europe.org/news/11866/eu-commission-proposes-eel-fisheries-ban-in-the-baltic-sea.html.
Fiskeridirektoratet. 2007. Fiskeristatistisk Årbog 2006 [Yearbook of Fishery Statistics 2006]. Fiskeridirektoratet [The Directorate of Fisheries]. 278 p.
Garn, A.K., J. Woollhead and A. Petersen. 2019. Lessons learned from a desktop review of conservation areas in Denmark: Applying IUCN Management categories for protected areas. Parks, 25(2):79-92.
HELCOM. 2013. HELCOM PROTECT- Overview of the status of the network of Baltic Sea marine protected areas. 31 p.
ICES. 2007. Report of the Baltic Fisheries Assessment Working Group (WGBFAS), 17 - 26 April 2007. ICES CM 2007/ACFM: 15, ICES Headquarters, Copenhagen. 727 p.

Updating to 2018 the 1950-2010 marine catch reconstructions of the Sea Around Us: Part I – Africa, Antarctica, Europe and the North Atlantic
173
ICES. 2008. Report of the Baltic Fisheries Assessment Working Group (WGBFAS), 8-17 April 2008. ICES CM 2008\ACOM:06, ICES Headquarters, Copenhagen. 692 p.
ICES. 2013. ICES Report from the Working Group on Recreational Fisheries Surveys. 2013 (WGRFS), 22-26 April 2013, Esporles, Spain. ICES CM 2013/ACOM:23. 49 p.
ICES. 2014. ICES Report from the Working Group on Recreational Fisheries Surveys (WGRFS), 2-6 June 2014, Sukarrieta, Spain. ICES CM 2014\ACOM:37. 662 p.
ICES. 2015. ICES Report from the Working Group on Recreational Fisheries Surveys (WGRFS), 1–5 June 2015, Sukarrieta, Spain. ICES CM 2015\SSGIEOM:10. 111 p.
ICES. 2017. ICES Report from the Working Group on Recreational Fisheries Surveys (WGRFS), 6–10 June 2016, Nea Peramos, Greece. ICES CM 2016/SSGIEOM:10. 76 p.
ICES. 2018a. Cod (Gadus morhua) in subdivisions 24–32, eastern Baltic stock (eastern Baltic Sea). Report of the ICES Advisory Committee, 2018. ICES Advice 2018, cod.27.24-32. doi.org/10.17895/ices.pub.4378.
ICES. 2018b. Cod (Gadus morhua) in subdivisions 22–24, western Baltic stock (western Baltic Sea). Report of the ICES Advisory Committee, 2018. ICES Advice 2018, cod.27.22-24. doi.org/10.17895/ices.pub.4377.
ICES. 2018c. ICES Baltic Fisheries Assessment Working Group (WGBFAS), 6–13 April 2018, ICES HQ, Copenhagen, Denmark. 748 p.
ICES. 2018d. ICES Report of the Baltic Salmon and Trout Assessment Working Group (WGBAST), 20–28 March 2018, Turku, Finland. ICES CM 2018/ACOM:10. 369 p.
ICES. 2018e. Report of the Working Group on Recreational Fisheries Surveys (WGRFS), 12–16 June 2017, Azores, Portugal. ICES CM 2017/EOSG:20. 113 p.
ICES. 2018f. ICES Report from the Working Group on Recreational Fisheries Surveys (WGRFS), 11–15 June 2018, Faro, Portugal. ICES CM 2018/EOSG:19. 111 p.
ICES. 2018g. Sea trout (Salmo trutta) in subdivisions 22–32 (Baltic Sea). Report of the ICES Advisory Committee, 2018. ICES Advice 2018, trs.27.22-32. doi.org/10.17895/ices.pub.3271.
ICES. 2019. Official Nominal Catches 2006-2017. ICES, Copenhagen. Available at: www.ices.dk/data/dataset-collections/Pages/Fish-catch-and-stock-assessment.aspx
Marine Conservation Institute. 2020. MPAtlas [Online]. Seattle, WA. Available at: www.mpatlas.org Ministeriet for Fødevarer. 2015. Vision for fremtidens lystog fritidsfiskeri. Ministeriet for Fødevarer, Landbrug
og Fiskeri, Copenhagen, Denmark. Noël, S.-L. 2020. Semi-automation procedure for catch reconstruction forward carry, p. 15-20. In: B. Derrick,
M. Khalfallah, V. Relano, D. Zeller and D. Pauly (eds). Updating to 2018 the 1950-2010 Marine Catch Reconstructions of the Sea Around Us: Part I – Africa, Antarctica, Europe and the North Atlantic. Fisheries Centre Research Report 28(5).
Sparrevohn, C.R. and M. Storr-Paulsen. 2012. Eel, cod and seatrout harvest in Danish recreational fishing during 2011. DTU aqua. DTU Aqua Report, No. 253-2012.
Sporrong, N. 2017. Recreational fishing in the Baltic Sea Region. Swedish Agency for Marine and Water Management. Coalition Clean Baltic, Uppsala, Sweden. 82 p.
World Bank. 2018. World Population, total [Online]. The World Bank Group. data.worldbank.org/indicator/sp.pop.totl
Toivonen, A.-L., H. Appelblad, B. Bengtsson, P. Geertz-Hansen, G. Gudbergsson, D. Kristofersson, H. Kyrkjebø, S. Navrud, E.R.P. Tuunainen and G. Weissglas. 2000. Economic value of recreational fisheries in the Nordic countries, TemaNord 2000:604. Nordic Council of Ministers, Copenhagen. 604 p.
Zeller, D., P. Rossing, S. Harper, L. Persson, S. Booth and D. Pauly. 2011. The Baltic Sea: estimates of total fisheries removals 1950-2007. Fisheries Research, 108: 356-363.

2020 Fisheries Centre Research Reports 28(5)
174
GEORGIA: UPDATED FISHERIES CATCH RECONSTRUCTION TO 2018*
Courtney Brown and Simon-Luc Noël Sea Around Us, Institute for the Oceans and Fisheries, University of British Columbia, 2202 Main Mall,
Vancouver, BC, V6T 1Z4, Canada
Abstract An update to the catch reconstruction for Georgia was performed for 2011-2017 and forward carried to 2018. The major challenge in updating Georgia’s catch reconstruction was accounting for the catches of anchovy (Engraulis encrasicolus) landed in Georgia. We reconstructed anchovy catch by accounting for fishmeal and fish oil exports, catches from outside of domestic waters and anchovy quota per year. A detailed description of the reconstruction update by fishing sector is presented below. Introduction The original reconstruction of the marine fisheries catches in Georgia’s entire Exclusive Economic Zone (EEZ; including the faux state of Abkhazia) was completed for the years 1950 to 2010 by Ulman and Divovich (2015; 2016), based mainly on data in Komakhidze et al. (2004). Here, this reconstruction is updated to 2017, and carried forward to 2018. Materials and Methods Reported baseline data Data from the Food and Agriculture Organization (FAO) were used as the reported baseline catch data from 2011 to 2017. Retroactive changes were made to previous years when discrepancies occurred between the newest FAO data version and the earlier data versions used as the reconstruction baseline (i.e., up to 2010). Unreported catches and/or foreign catches Unreported domestic catches of anchovy (Engraulis encrasicolus) by Georgia were estimated using fishmeal and fish oil export data from the FAO’s fishery products trade database, as used in Ulman and Divovich (2015). Because no export data were available for 2017 (Table 1), a retroactive change was made in 2010, and the 2016 tonnage was carried forward to 2017 unaltered.
Ulman and Divovich (2015) used anchor points in 2003 and 2009 to derive a percentage of Ukrainian catch taken in Georgia from total landings in Georgia (Georgian, Turkish and Ukrainian). However, FAO retroactive changes resulted in an increase in Georgia’s anchovy landings in 2009, and therefore, the lower percentage of Ukrainian catch in Georgia (reduced from 33% to 23%). The interpolated catch between 2003 and 2009 was updated and applied to the total estimated landings of Georgian and Turkish catch in Georgia, thus
* Cite as: Brown, C. and S.-L. Noël. 2020. Georgia: Updated fisheries catch reconstruction to 2018, p. 174-178. In: B. Derrick, M. Khalfallah, V. Relano, D. Zeller and D. Pauly (eds). Updating to 2018 the 1950-2010 Marine Catch Reconstructions of the Sea Around Us: Part I – Africa, Antarctica, Europe and the North Atlantic. Fisheries Centre Research Report 28(5).
Table 1. Fish meal/oil statistic from Georgia, excluding Abkhazia.
Year Equivalent Catch (t)
Year Equivalent Catch (t)
2004 2,594 2011 27,378 2005 9,243 2012 7,514 2006 11,0631 2013 95,524 2007 12,883 2014 128,434 2008 24,258 2015 89,167 2009 8,5615 2016 118,916 2010 39,338 2017 118,917
1 interpolation; 2 carried forward

Updating to 2018 the 1950-2010 marine catch reconstructions of the Sea Around Us: Part I – Africa, Antarctica, Europe and the North Atlantic
175
making retroactive changes to unreported Ukrainian anchovy catch from 2004 onwards. The anchovy quota was maintained at 2010 levels (i.e., 60,000 tonnes) for 2011, and we assumed the quota was fully utilized in 2011 as it was in 2010 and 2009. Total Allowable Catch (TAC) increased in subsequent years and was 85,000 tonnes in 2015 (Gücü et al. 2017). Total landings of anchovy fisheries on the Georgian coast were available for the 2011/2012 to 2014/2015 fishing seasons (see Table 2 from Gücü et al. 2017 and Guchmanidze 2015). Anchovy fishing seasons begin in late December/January and run to March/April the following year. Therefore, for simplicity’s sake, we assumed that ‘total landings’ are comprised mostly of catch from the next year (i.e., we assumed the 2014-2015 season total landings are the total landings for 2015). In 2017, the FAO reported anchovy landings of 99,288 tonnes -- almost quadruple the amount in 2016 and well over the 2015 quota of 85,000 tonnes. Therefore, we assumed there were no unreported landings by Turkey and Ukraine in 2017. For 2016 we interpolated total landings between 2015 (61,000 tonnes) and 2017 (99,288 tonnes). Unreported foreign anchovy catches were derived by subtracting the FAO reported data for Georgia from the total landing estimates for 2011-2017 (see Table 3). The foreign catch was then split between Ukraine (77%) and Turkey (23%) using the updated 2009 ratios.
Unreported anchovy landings in the Abkhazian region, including foreign catch by Turkey, Ukraine, and Russia, were carried forward from 2010 to 2017. Unreported industrial catches for taxa other than anchovy were carried forward for each fishing entity in Georgia’s EEZ to 2017, unchanged. Unreported artisanal fishing catches were carried forward to 2017, unchanged.
Table 2. Anchovy fisheries along the Georgian coast (Gücü et al. 2017). Season Start of
season End of season
Landings (t) TAC (t)
2011-12 23 Dec 2011 30 Jan 2012 11,006 70,000 2012-13 2 Jan 2013 2 April 2013 56,777 60,000 2013-14 14 Dec 2013 23 Mar 2014 70,795 80,000 2014-15 16 Dec 2014 14 Mar 2015 61,000 85,000
Table 3. Anchovy landings from Georgian waters, assumed to include domestic landings (FAO landing from Georgia) and foreign catches (from Turkey and Ukraine).
Year Total landings Georgia (FAO) Foreign catch
Turkey Ukraine
2009 60000 31338 22173a 6489
2010 60000 39857 15583 4560
2011 60000b 25919 26365 7716
2012 11006c 11007 0 0
2013 56777c 14500 32706 9571
2014 70795c 18000 40842 11953
2015 61000c 21500 30557 8943
2016 80144d 25921 41947 12276
2017 99288 99288 0 0 a) Turkish catch of anchovy in Georgian from Oztürk et al. (2011); b) carried forward; c) Total landings from the Georgian coast from Guchmanidze (2015) and Gücü et al. (2017); d) interpolation.

2020 Fisheries Centre Research Reports 28(5)
176
Discards from the industrial fisheries were derived as described by Ulman and Divovich (2015). Discards were recalculated for years in which retroactive changes had been made to the FAO baseline or unreported landings. Retroactive changes were made to bottom trawl discards from 1950-2010 due to an error in the bottom trawl discard rate. The updated data now reflects a conservative bottom trawl discard rate of 30% as described in Ulman and Divovich (2015). Finally, the recreational and subsistence fisheries catches in Georgian waters were derived for 2011-2017 as per Ulman and Divovich (2015). Due to inconsistencies in the national population data, the original reconstruction used a time-series from Tsiklauri and Sulaberidze (2013) for Georgia’s population. Using information from Tsiklauri and Sulaberidze (2013), it was assumed that the population was increasing at half the rate between 2010 and 2014 as was calculated between 2009 and 2010. The World Bank data shows a similar trend of a declining population to about ~3.7million in 2015, after which the population plateaus. Our reconstructed population estimate converges with the World Bank population in 2015, and therefore it was unrealistic to project the rate of decline beyond 2015. Thus, the current World Bank data were used to estimate population from 2015-2017. To estimate total recreational catch, the population was multiplied by the same recreational fishing participation rate (1%) and catch rate (49 kg per fisher per year) from the original reconstruction (Ulman and Divovich 2015). Subsistence catches followed Ulman and Divovich (2015) and used the 1992-2010 fishing rate (1.5%) and catch rate (32.6kg per fisher per year) for 2010-2017. An error was noticed in the subsistence catch rate used from 1986-2010, and the subsistence catch for these years was recalculated following Ulman and Divovich (2015). Subsistence catches and recreational catch estimates were taxonomically disaggregated using the 1950-2010 ratios (see table 4 in Ulman and Divovich 2015). Transition from 2017 to 2018 The catch reconstructed to 2017 was carried forward to 2018 using the semi-automated procedures outlined in Noël (2020), based on FAO landings data to 2018. Semi-automated reconstructed catch data will later be replaced by a more detailed, research-intensive update. Results and Discussion Figure 1 presents the updated marine catches from Georgia.
Figure 1. Reconstructed domestic catch from Georgia’s EEZ, by fishing sector for 1950-2018. Artisanal, subsistence and recreational are all included but are small and difficult to distinguish separately.

Updating to 2018 the 1950-2010 marine catch reconstructions of the Sea Around Us: Part I – Africa, Antarctica, Europe and the North Atlantic
177
The reconstruction of Georgia’s marine fisheries catches documents that anchovy continued to be the major fishery of Georgia (and in neighboring EEZs), both for domestic and foreign fleets. Much of the anchovy catch is exported as fishmeal and fish oil. Marine biodiversity protection Georgia has agreed to protect its biological diversity through the international Convention on Biological Diversity (Aichi) and the Ramsar Convention on Wetlands of International Importance (Marine Conservation Institute 2020). Georgia has two MPAs and two marine managed areas. The MPAs’ extent is 172 km2, which occupies 0.75% of the entire EEZ (22,947 km2; Ulman and Divovich 2015). These two MPAs are the Bichvinta-Miusera Strict Nature Reserve (designated in 1965) and the Kolkheti National Park (designated in 1998; (Marine Conservation Institute 2020). The National Park covers five different administrative regions in western Georgia, with the aim of protecting wetland ecosystems of International importance (Agency of Protected Areas 2014). However, the number of protected areas differs depending on the source. We thus expect that the number of MPAs is also different to the one from MPAtlas presented above. “The number and coverage of protected areas existing in Georgia by law, differs from the data provided by the Agency of Protected Areas and other official sources. […] The information provided in the Law of Georgia on the Status of Protected Areas and on the APA website on the protected areas existing in Abkhazia and their coverage differs from each other and requires verification (in terms of both number and coverage). As for the multi-purpose use areas, it is absolutely incorrect that today in Georgia there are no protected areas of this category as it is referred to in the information available on the APA website as well as mentioned in various official documents and surveys of public officials and experts. […] It should also be noted that there are many actual mistakes and inconsistencies in the normative acts related to the protected areas (laws on the establishment of protected areas and management plans of the same protected areas) that complicates both the research of the management of protected areas and their management process” (Matcharashvili 2018). It appears that no management evaluation of the Bichvinta-Miusera Strict Nature Reserve has been performed, whereas for the Kolkheti National Park an assessment of the Management Effectiveness was performed using RAPPAM criteria (Rapid Assessment and Prioritization of Protected Area Management) in 2009 and 2012 (MEPNR and KfW 2011). The features that rated low and needed better management in this National Park were: boundary demarcation, staff performance and review of targets’ progress, visitor facilities and the monitoring of the impact of legal and illegal uses (MEPNR and KfW 2011). Acknowledgements Funding for the work presented here was provided by the Minderoo Foundation, by the Marisla, Oak, and David and Lucille Packard Foundations, and by the Bloomberg Philanthropies through Rare. References Agency of Protected Areas. 2014. Kolkheti National Park Administration. Available at:
apa.gov.ge/en/protected-areas/cattestone/kolxetis-erovnuli-parkis-administracia Guchmanidze, A. 2015. FOMLR Reporting Georgia 2014–2015. In: FAO. Report of the fourth meeting of the
ad hoc Working Group on the Black Sea. Joint 20th CBD AG & 18th FOMLR Meeting, March 31st–April 1st, 2015. Istanbul, Turkey.
Gücü, A., Y. Genç, M. Dağtekin, S. Sakınan, O. Ak, M. Ok and İ. Aydın. 2017. On Black Sea Anchovy and its Fishery. Reviews in Fisheries Science & Aquaculture, 25(3): 230-244. doi.org/10.1080/23308249.2016.1276152.

2020 Fisheries Centre Research Reports 28(5)
178
Oztürk, B., C. Keskin and S. Engin. 2011. Some remarks on the catches of anchovy, Engraulis encrasicolus (Linnaeus, 1758), in Georgian waters by Turkish fleet between 2003 and 2009. Journal of the Black Sea/Mediterranean Environment, 17(2): 145-158.
Komakhidze, A., R. Goradze, R. Diasamidze, N. Mazmanidi and G. Komakhidze. 2004. Fish, fisheries and dolphins as indicators of ecosystem health along the Georgian coast of the Black Sea, p. 251-260. In: A.I.L. Payne, C.M.S. O’Brianand and S.I. Rogers (eds). Management of Shared Fish Stocks. Blackwell Publishing, Cornwall, U.K. Matcharashvili, I., T. Arveladze, I. Svanidze, M. Archuadze, D. Kobakhidze, I. Kutateladze. 2018. Monitoring of Biodiversity in Protected Areas, Green Alternative. Available at: greenalt.org/wp-content/uploads/2018/07/Monitoring_of_Biodiversity_in_Protected_Areas.pdf
Marine Conservation Institute. 2020. MPAtlas [Online]. Seattle, WA. Available at: www.mpatlas.org MEPNR and KfW. 2011. Eco-regional Nature Conservation Programme for the Southern Caucasus (ENCP),
Phase III: Annexes to the Final Report- Consulting Services for the Preparation of a Programme Based Thematic Approach. Available at: tjs-caucasus.org/wp-content/uploads/2013/09/Final-Report-2011-Preparation-of-Programme-Based-Thematic-Approach_Annexes.pdf
Noël, S.-L. 2020. Semi-automation procedure for catch reconstruction forward carry, p. 15-20. In: B. Derrick, M. Khalfallah, V. Relano, D. Zeller and D. Pauly (eds). Updating to 2018 the 1950-2010 Marine Catch Reconstructions of the Sea Around Us: Part I – Africa, Antarctica, Europe and the North Atlantic. Fisheries Centre Research Report 28(5).
Tsiklauri, S. and A. Sulaberidze. 2013. Qualitative and methodological aspects of populations projections in Georgia; Georgian Population Prospects: 1950-2050. EUROSTAT international symposium “Demographic projections”. Rome, Italy. 11 p.
Ulman, A. and E. Divovich. 2015. The marine fishery catch of Georgia (including Abkhazia), 1950-2010. Fisheries Centre Working Paper #2015-88, 25 p.
Ulman, A. and E. Divovich. 2016. Georgia, p. 274. In: D. Pauly and D. Zeller (eds). Global Atlas of Marine Fisheries: A critical appraisal of catches and ecosystem impacts. Island Press, Washington D.C.

Updating to 2018 the 1950-2010 marine catch reconstructions of the Sea Around Us: Part I – Africa, Antarctica, Europe and the North Atlantic
179
GREECE INCLUDING THE ISLAND OF CRETE: UPDATED CATCH RECONSTRUCTION TO 2018*
Dimitrios K. Moutopoulos
University of Patras, Animal Production, Fisheries & Aquaculture, 30200 Mesolonghi, Greece Abstract The original reconstructions of the catches of Greek marine fisheries for the years 1950 to 2010 were completed for Greece and, separately, for the island of Crete. These reconstructions are here updated to 2017, then carried forward to 2018. As of 2011, the Hellenic Statistical Authority no longer recorded data on catches from vessels with 19 horsepower or less. This reflects a deterioration of the quality of the data collected by the government of Greece. To assign catches to fishing sector in the absence of information on smaller veseels, the ratio of catch caught by vessels above 20 horsepower and of 19 horsepower or less for each taxon and each Greek subarea was calculated for the period 2011-2015 using the species and subarea landings from the time series of landings in 1975-2010 estimated in the earlier reconstructions. Introduction The original reconstructions of the catches of Greek marine fisheries for the years 1950 to 2010 were completed by Moutopoulos et al. (2015, 2016a) for Greece (excluding Crete) and by Moutopoulos et al. (2016b) for the island of Crete. These reconstructions are here updated to 2017, then carried forward to 2018. Materials and Methods Commercial catch data The time series of the reconstructed landings per taxon (i.e., 75 species or taxonomic groupings), subarea (16 subareas: Fig. 1) and gear (i.e., trawls, purse-seines, beach-seines and small-scale vessels) during 1950-2010 (Moutopoulos et al. 2015) were updated up to 2017 using the following methodology. From 2011-2015, the Hellenic Statistical Authority (HELSTAT) provided baseline landings for all professional fishing motor-vessels, apart from small-scale vessels with engine power < 19 HP (data provided to us by Ms Elizabeth Vrontou, HELSTAT). Starting from 2016, the reported landings from HELSTAT began to incorporate landings from vessels with 19 horsepower and less with information on taxa and spatial breakdown. As a result, catch data from HELSTAT were considered to be the total reported landings. However, reported catches in 2017 from HELSTAT were not separated based on the engine power of the vessels used. Therefore, the ratio of catch caught by vessels of 20 horsepower and above and under 19 horsepower for each taxon and each Greek subarea in 2016 was carried forward to 2017. The above ratio was also used for the estimation of the landings per taxon and subarea caught by vessels with engine-power of under 19 horsepower for the period 2011-2015, using the combined taxon and subarea landings extrapolated from the time series of landings during 1975-2010 estimated from Moutopoulos et al. (2015).
* Cite as: Moutopoulos, D.K. 2020. Greece (including Crete): Updated catch reconstruction to 2018, p. 179-187. In: B. Derrick, M. Khalfallah, V. Relano, D. Zeller and D. Pauly (eds). Updating to 2018 the 1950-2010 Marine Catch Reconstructions of the Sea Around Us: Part I – Africa, Antarctica, Europe and the North Atlantic. Fisheries Centre Research Report 28(5).

2020 Fisheries Centre Research Reports 28(5)
180
Note that bivalves (Galinou-Misoudi et al. 2006) and large pelagic taxa were excluded from the reconstruction of the fisheries landings from both large-engine and small-engine vessels provided by the above sources, an issue also occurring in Moutopoulos and Stergiou (2012). This is because a large proportion of the reported values of bivalves is derived from intensive aquaculture farming along the coast (Mitsoudi et al. 2006), and thus was not considered here. For the estimation of large pelagic taxa landings caught by small-scale vessels with engine power < 19 HP, we followed Moutopoulos and Stergiou (2012). The same methodology was also used for estimation of the landings of large pelagic fishes, mainly bullet tuna (Auxis rochei), little tunny (Euthynnus alletteratus), bonito (Sarda sarda), Thunnus spp. and swordfish (Xiphias gladius) from the data reported by ICCAT. From the above large pelagic taxa, only the last two were caught by small-scale fishing gear, such as driftnets, whereas the remaining were caught by purse seine vessels. Landings reported for Thunnus spp. were disaggregated in bluefin tuna (Thunnus thynnus) and albacore tuna (Thunnus alalunga), based on the corresponding landings per subarea provided by HELSTAT for the period 2015-2017. Due to the change in reporting methods by HELSTAT, there is a stark difference between reported landings before and after 2015 (see Tsikliras et al. 2020; Zeller and Pauly 2018). For that reason, until more research can be done on the new data reporting method, a portion of unreported landings has been added to the 2016-2017 landings data so that the total landings will be held constant at the 2015 level. Unreported landings were estimated for industrial fisheries for 1950-2017 using 5% of reported landings as unreported landings throughout the time series. Unreported commercial landings were disaggregated by gear and taxa based on reported landings per year. Commercial discards From 2011-2017 discards for the above mentioned commercial reported catches were estimated based on the discard ratios derived from the HCMR database (for details see Moutopoulos et al. 2018) and from Table 3 in Moutopoulos et al. (2015). In Greek fisheries, the discard ratios differed for each taxon both within and among gears according to: (a) taxa that were discarded due to their non-commercial value; (b) the fraction of the undersized individuals of the marketable taxa that were discarded according to European (ER 1967/2006) and National (P.D. 666/66) legislation; and (c) damaged individuals of the marketable species due to fishing operations (for trawlers: Machias et al. 2001; for small-scale vessels: Gonçalves et al. 2007; Tzanatos et al. 2007). Because these species are not being recorded by HELSTAT. Thus, our discards are minimal estimates, the reconstruction of discards did not include taxa that always are discarded, which are mainly caught by trawlers (see Table 2 in Machias et al. 2001). Recreational catch Recreational catches were separated into vessel-based catches and shore-based catches. Vessel-based recreational catches were estimated by carrying forward to 2017 the linear trend of recreational catch in 2007 and 2010, weighted by the number of recreational vessels per subarea reported by a recent study on the spatial distribution of recreational vessel-based fisheries in 2017 (Keramidas et al. 2018). New data on the number of recreational vessels and fishers were retrieved from the grey literature for the years 1970-1974 (see Table A2), and an updated reconstructed data series of recreational landings was estimated following the methodology of Moutopoulos et al. (2015) for the years 1950-1974. In the original reconstruction, shore based recreational catch was calculated based on the population of Greece through a survey done every decade, with the last survey completed in 2010. Since the next survey is

Updating to 2018 the 1950-2010 marine catch reconstructions of the Sea Around Us: Part I – Africa, Antarctica, Europe and the North Atlantic
181
not until 2020, a constant rate of change is applied to the amounts from 2010 to 2017. This is the same method used throughout the entire time series in the original reconstruction. Catches from both vessel-based and shore-based recreational fisheries were further taxonomically and spatially broken down based on 2010 proportions. Kapiris and Kavadas (2016) noted, based on the number of active recreational fishers in Greek waters, that the catch from recreational fisheries in Greece may be severely underestimated. Thus, future research should carefully and thoroughly examine recreational fishing in Greece. Discards for recreational landings are reconstructed by carrying forward the discard ratios at 2010 levels unchanged for each species in each sub region. Subsistence catch Similar to the methods for estimating the shore-based recreational catch, subsistence catch was also calculated based on the population survey of Greece, which is completed every decade. Since new population data are not yet available until after the 2020 survey, subsistence catches were carried forward unchanged at 2010 levels to 2017. Note that in 2013, Greece issued a ban on beach seining. However, there is still a small amount of beach seining catch being reported in the official landings. Effort data For the industrial and artisanal fisheries in Greek waters, fishing effort data (i.e., number of fishing vessels, engine capacity expressed in engine horsepower (HP), and vessel tonnage in gross tonnage (GT)) were based on data provided by different statistical organizations from 1950 to 2017 (see Table A1). In particular, fishing effort data per gear (i.e., trawls, purse-seines, beach-seines and small-vessels) were derived from the numbers of vessels, divided by engine power and related measures (see Table A1) and from the records of HELSTAT and ASG for the period 1964-1990. For the years 1991 to 2017, fishing effort data were obtained from the Common Fisheries Register (CFR) database (European Commission Regulation 2090/98). Since 1991, CFR has registered all Community fishing vessels based on the national registers of the EC Member States (European Commission Regulation 2090/98). Data include, among others, engine power, tonnage, construction date, homeport, and allowed fishing gear. Fishing effort data for the period 1964-1990 was disaggregated by Greek subareas based on the bootstrapped mean of the ratios of the fishing effort values per each subarea derived from DCR data collected between 1991 and 2000 (Cardinale et. al. 2012). For the vessel-based recreational fishery, fishing effort data (i.e., number of fishing vessels and number of fishers) were based on data provided by different statistical organizations for Greek waters during 1950-2017 (Table A2). Fishing days per unit area for the artisanal fishery were estimated based on the sources listed in Table A3. For the vessel-based recreational fishery, the number of active fishing days was estimated as (approximately) 60 days per year for all subareas (Moutopoulos et al. 2015). Transition from 2017 to 2018 The catch reconstructed to 2017 was carried forward to 2018 using the semi-automated procedures outlined in Noël (2020), based on Hellenic Statistical Authority (HELSTAT) landings data to 2018. Semi-automated reconstructed catch data will later be replaced by a more detailed, research-intensive update.

2020 Fisheries Centre Research Reports 28(5)
182
Results and Discussion The update did not alter the broad trend of marine catches in Greece (Figure 1), which peaked in the mid-1990s, and in the early 1990s around Crete (Moutopoulos et al. 2016a, 2016b).
Figure 1. Reconstructed domestic catch in Greece and the island of Crete for 1950 to 2018. That Greek fisheries peaked in the 1990s and failed to recover since is likely a result of widespread overfishing (Stergiou et al. 2007). Moreover, the Eastern Mediterranean and Greek waters in particular are rapidly warming, which further stresses the fish species upon which the fisheries depend (Tsikliras et al. 2015). Addressing these and related issues will be a challenge for Greece. Marine biodiversity protection Greece has agreed to protect its biological diversity through the international Convention on Biological Diversity (Aichi) and the Ramsar Convention on Wetlands of International Importance. The country is also a signatory to Regional Treaties and Agreements such as the Natura 2000. Its commitments extend to NGOs and/or public bodies like the Mediterranean MPA Network or its acronym MedPAN (Marine Conservation Institute 2020). Greece has 214 MPAs and 49 marine managed areas (Marine Conservation Institute 2020). The MPAs’ extent is 10,587 km2 (Marine Conservation Institute 2020), which represents 2% of EEZ (493,708 km2; Moutopoulos et al. 2015). The implemented highly protected areas occupy 225 km2 (Marine Conservation Institute 2020), which equals 2.1% of the entire MPAs’ extent and 0.05% of the EEZ. The Zakynthos and Vories Sporades and two national parks with marine areas, the Schinia-Marathona Park and Mesologgi-Etoliko lagoons, as well as the estuaries of Acheloos river and Evinos river, and the Echinades islands stand out for their clear restrictions (Tzanatos et al. 2020). In Greece, small-scale fisheries are very important, especially in remote insular areas, and consist of a large number of vessels and fishers who usually do not focus on a single target species and use a variety of fishing gears (Tzanatos et al. 2020). “The declaration of one large MPA or several small MPAs is unrealistic and consequently not completely suitable to Greek small-scale fisheries” (Tzanatos et al. 2020). The National Marine Park of Alonissos (NMPANS) was established in 1992, mainly for the conservation of the endangered Mediterranean monk seal (Monachus monachus). “Fishermen expressed dissatisfaction, mistrust

Updating to 2018 the 1950-2010 marine catch reconstructions of the Sea Around Us: Part I – Africa, Antarctica, Europe and the North Atlantic
183
and a lack of communication with the NMPANS’s management body. They believe that their fishing grounds have decreased in actual geographic extent because of the prohibitive measures that fish stocks are declining and that compensation for damage to fishery equipment by the Mediterranean monk seal and for the prohibitive measures should be provided” (Oikonomou 2008). Acknowledgments We wish to the Sea Around Us team by their support. We also want to thank all the people who give us information on different regions and topics. References Cardinale, M., J.A. Abella, P. Martin, G. Scarcella, F. Colloca, M. Giannoulaki, B. Guijarro, D.K. Moutopoulos,
K.I. Stergiou, A.O. Charef and G. Chato. 2012. Report of the Ad-hoc working group on the assessment of some Greek stocks. Scientific, Technical and Economic Committee for Fisheries. SGMED-08-03 Working Group on the Mediterranean Part III, Joint Black Sea Subgroup. Available at: http://stecf.jrc.ec.europa.eu
European Commission. 1998. European Commission Regulation 2091/98 of 30 September 1998 concerning the segmentation of the Community fishing fleet and fishing effort in relation to the multiannual guidance programmes. Publication Office of the European Union, Brussels, Belgium. 11p. Available at: extwprlegs1.fao.org/docs/pdf/eur18320.pdf
Galinou-Mitsoudi, S., G. Vlahavas, O. Papoutsi. 2006. Population study of the reported bivalve Pinna nobilis (Linnaeus, 1758) in Thermaikos Gulf (North Aegean Sea). Journal of Biological Research, 5: 47-53.
Gonçalves, J.M.S., K.I. Stergiou, D.K. Moutopoulos, J.A. Hernando Casal, E. Puente, R. Coelho, K. Erzini. 2007. Discards from experimental trammel nets in southern European small-scale fisheries. Fisheries Research, 88: 5-14.
HELSTAT. 2011-2017. Quantity of catch by species of catch, category of fishery and type of fishing gear., Hellenic Statistical Authority, Piraeus, Greece. Available at: www.statistics.gr/en/statistics/-/publication/SPA03/.
Kapiris, K. and A. Kavadas. 2016. The recreational fishery in Greece. A comparison to the small-scale fishery. ICES Annual Science Conference Extended Abstracts 2016, G:173.
Keramidas I, D. Dimarchopoulou, A. Pardalou and A.C. Tsikliras. 2018. Estimating recreational fishing fleet using satellite data in the Aegean and Ionian Seas (Mediterranean Sea). Fisheries Research, 208:1-6. doi.org/10.1016/j.fishres.2018.07.001
Machias, A., V. Vassilopoulou, D. Vatsos, P. Bekas, A. Kallianiotis, C. Papaconstantinou and N. Tsimenides. 2001. Bottom trawl discards in the northeastern Mediterranean Sea. Fisheries Research, 53: 181-195.
Marine Conservation Institute. 2020. MPAtlas [Online]. Seattle, WA. Available at: www.mpatlas.org Moutopoulos, D.K. and K.I. Stergiou. 2012. Spatial disentangling of Greek commercial fisheries landings by
gear between 1928-2007. Journal of Biological Research, 18: 265-279. Moutopoulos, D.K., N. Bailly, A.C. Tsikliras and K.I. Stergiou. 2016a. Greece (Crete), p. 279 In: D. Pauly and
D. Zeller (eds). Global Atlas of Marine Fisheries: A critical appraisal of catches and ecosystem impacts. Island Press, Washington D.C.
Moutopoulos, D.K., K. Tsagarakis and A. Machias. 2018. Assessing ecological and fisheries implications of the EU landing obligation in Eastern Mediterranean. Journal of Sea Research, 141: 99-111.
Moutopoulos, D.K., A.C. Tsikliras and K.I. Stergiou. 2015. Reconstruction of Greek fishery catches by fishing gear and area (1950-2010). Fisheries Centre Working Paper #2015-11, 14 p.
Moutopoulos, D.K., A.C. Tsikliras and K.I. Stergiou. 2016b. Greece (Excluding Crete), p. 278. In: D. Pauly and D. Zeller (eds). Global Atlas of Marine Fisheries: A critical appraisal of catches and ecosystem impacts. Island Press, Washington D.C.
Noël, S.-L. 2020. Semi-automation procedure for catch reconstruction forward carry, p. 15-20. In: B. Derrick, M. Khalfallah, V. Relano, D. Zeller and D. Pauly (eds). Updating to 2018 the 1950-2010 Marine Catch Reconstructions of the Sea Around Us: Part I – Africa, Antarctica, Europe and the North Atlantic. Fisheries Centre Research Report 28(5).
Oikonomou, Z. and A. Dikou. 2008. Integrating Conservation and Development at the National Marine Park of Alonissos, Northern Sporades, Greece: Perception and Practice. Environmental Management, 42:847. doi.org/10.1007/s00267-008-9163-x
2020 Fisheries Centre Research Reports 28(5)
184
Stergiou K.I., D.K. Moutopoulos, A.C. Tsikliras and C. Papaconstantinou. 2007. Hellenic marine fisheries: a general perspective from the National Statistical Service data, p. 132–140. In: C. Papaconstantinou, A. Zenetos, V. Vassilopoulou and G. Tserpes (eds). State of Hellenic Fisheries. Hellenic Center for Marine Research, Athens.
Tsikliras, A.C., P. Peristeraki, G. Tserpes and K.I. Stergiou. 2015. Mean temperature of the catch (MTC) in the Greek Seas based on landings and survey data. Frontiers in Marine Science, 2(23): 1-6.
Tsikliras A.C, D. Dimarchopoulou and A. Pardalou. 2020. Artificial upward trends in Greek marine landings: A case of presentist bias in European fisheries. Marine Policy: 103886.
Tzanatos, E., S. Somarakis, G. Tserpes and C. Koutsikopoulos. 2007. Discarding practices in a Mediterranean small-scale fishing fleet (Patraikos Gulf, Greece). Fisheries Management and Ecology, 14: 277-285.
Tzanatos, E., M. Georgiadis and P. Peristeraki. 2020. Small-Scale Fisheries in Greece: Status, Problems, and Management, p. 125-150. In: J.J. Pascual-Fernández, C. Pita, M. Bavinck (Eds). Small-Scale Fisheries in Europe: Status, Resilience and Governance. Springer, Cham.
Zeller, D. and D. Pauly. 2018. The ’presentist bias’ in time-series data: implications for fisheries science and policy. Marine Policy 90: 14-19.

Updating to 2018 the 1950-2010 marine catch reconstructions of the Sea Around Us: Part I – Africa, Antarctica, Europe and the North Atlantic
185
Appendix TABLE A1. Summary of the fisheries effort statistics for the professional fishery recorded by the different statistical organizations for Greek waters, 1950-2017. Period Fishing effort type Gear type Spatial resolution Source
1950-1963
Scattered number of vessels / engine horsepower (HP) / vessel tonnage (GT) / number of fishers
Per gear type (i.e., trawl, purse-seine, beach-seine and other small-scale) Per Greek subarea.1
Anon. 1951. Krisimi kampi tis alieias. Monthly review of Greek sea resources, 50: 25-27. [In Greek.] Anon. 1954. Apologismos tou etous 1953. Monthly review of Greek sea resources, 79: 149-150. [In Greek.] Tsakakis, Sp. 1956. I Aieia en Elladi and is proigmenas choras. Athens. [In Greek.] Tsakakis, Sp. 1950. Fisheries in Greece, p. 1479-1484. In: Newer Encyclopeadic Dictionnaire “Helios”- Vol.7. Athens. [In Greek.] Kalydopoulos, G.L., 1958. I alieia en Elladi kai ta provlimata tis. Monthly review of Greek sea resources, 133: 12-17. Anon. 1959. Basiki Epitropi Protogenous Paragogis. Epitropi Erevnis & Organoseos Oikonomikou Programmatismou. Chapter 7th, Fisheries. March 1959, Athens. Anon. 1962. Alieftikos apologismos tou etous 1961. Monthly review of Greek sea resources, 175: 199. [In Greek.] Anon. 1963. Alieftikos apologismos tou etous 1962. Monthly review of Greek sea resources, 187: 261-262. [In Greek.]
1964-1990 Number of vessels / engine horsepower (HP) / vessel tonnage (GT) / number of fishers
Per gear type (i.e., trawl, purse-seine, beach-seine and other small-scale) excluding small-scale vessels with engine power < 19 HP
Per Greek subarea2 HELSTAT
1970-1974 Number of vessels / engine horsepower (HP)3
Small-scale vessels with engine power < 19 HP
Total for Greek waters4 Moutopoulos et al. (2015)
1975-2006 For 41 prefectures ASG (Agricultural Statistics of Greece). 1977-2006. Statistical Year-Book. Thirty one issues (for the years 1975-2004), Athens, Greece.
1991-2017 Number of vessels / engine horsepower (HP) / vessel tonnage (GT) / number of fishers
Per gear type (i.e., trawl, purse-seine, beach-seine and other small-scale) For 178 fishing ports Common Fisheries Registry-CFR (EC, 1998)
1estimate from the spatial resolution data of the number of fishing vessels reported in HELSTAT for the years 1964-1969 2Based on the bootstrapped mean of the proportions of the fishing effort values per each subarea derived from DCR data collected between 1991 and 2000 (Cardinale et. al. 2012). 3A mean estimate of 10 HP was considered for the estimation of the fishing effort based on Anonymous (2000) (Anonymous. 2000. Coastal Fisheries practiced by vessels below 20 HP in Greece: Biological, economic and social framework, Final Report, Project no 97/0051 EC DG XIV Directorate-General for Fisheries, 163 p. 4Estimate from the spatial resolution data from ASG for the period 1975-1980.

2020 Fisheries Centre Research Reports 28(5)
186
TABLE A2. Summary of the fisheries effort statistics for the vessel-based recreational fishery recorded by the different statistical organizations for Greek waters, 1950-2017. Period Fishing effort type Spatial resolution Source
1950-1974 Scattered number of vessels / number of fishers
Per Greek subareaI
Ananiadis, K.I. 1972. I simerini katastasi tis alieias kai ta anagkaia metra dia tin anaptixin tis B. Monthly review of Greek sea resources, 295: 201-203. [In Greek.] Ananiadis, K.I. 1971. I simerini katastasi tis alieias kai ta anagkaia metra dia tin anaptixin tis A. Monthly review of Greek sea resources, 294: 167-176. [In Greek.] Anon. 1951. Krisimi kampi tis alieias. Monthly review of Greek sea resources, 50: 25-27. [In Greek.] Anon. 1954. Apologismos tou etous 1953. Monthly review of Greek sea resources, 79: 149-150. [In Greek.] Tsakakis, Sp. 1956. I Aieia en Elladi and is proigmenas choras. Athens. [In Greek.] Tsakakis, Sp. 1950. Fisheries in Greece, p. 1479-1484. In: Newer Encyclopeadic Dictionnaire “Helios”- Vol. 7. Athens. [In Greek.] Kalydopoulos, G.L. 1958. I alieia en Elladi kai ta provlimata tis. Monthly review of Greek sea resources, 133: 12-17. Anon. 1959. Basiki Epitropi Protogenous Paragogis. Epitropi Erevnis & Organoseos Oikonomikou Programmatismou. Chapter 7th, Fisheries. Athens, March 1959. Anon. 1962. Alieftikos apologismos tou etous 1961. Monthly review of Greek sea resources, 175: 199. [In Greek.] Anon. 1963. Alieftikos apologismos tou etous 1962. Monthly review of Greek sea resources, 187: 261-262. [In Greek.] Anon. 1970. I Elliniki alieia kata to etos 1969. Monthly review of Greek sea resources, 272: 247-248. [In Greek.] Anon. 1971. I Elliniki alieia kata to etos 1970. Monthly review of Greek sea resources, 283: 183-184. [In Greek.] Anon. 1972. I Elliniki alieia kata to 1971. Monthly review of Greek sea resources, 296: 223-224. [In Greek.] Anon. 1973. I Elliniki alieia kata to 1972. Monthly review of Greek sea resources, 308: 211-213. [In Greek.] Anon. 1974. Alieftikos apologismos tou etous 1973. Monthly review of Greek sea resources, 325: 24. [In Greek.] Anon. 1975. I Elliniki alieia kata to 1974. Monthly review of Greek sea resources, 332: 175-177. [In Greek.]
1975-2006 Number of vessels For 41 prefectures ASG (Agricultural Statistics of Greece). 1977-2006. Statistical Year-Book. Thirty one issues (for the years 1975-2004), Athens, Greece.
2007-2017 Number of vessels Per Greek subareaII Keramidas et al. (2017) IEstimated from the spatial resolution data of the number of fishing vessels reported in ASG for the years 1975-1980. IIExtrapolation of the 2000-2006 data-series of ASG weighted by the estimates of the number of fishing vessels by area reported in Keramidas et al. (2018) for the year 2017.

Updating to 2018 the 1950-2010 marine catch reconstructions of the Sea Around Us: Part I – Africa, Antarctica, Europe and the North Atlantic
187
TABLE A3. Summary of the number of fishing days operated per fishery for the professional fishery recorded by various sources, 1950-2017. Period Fishing days GSA 20 GSA 22-23 Source 1950-1963
Trawls 150 150 Tsakakis, Sp. 1956. I Aieia en Elladi and is proigmenas choras. Athens. [In Greek.]
1964-2017 182 182 Ananiadis, K.I. 1968. Greek fisheries. Prospects and perspectives of development. Athens, Centre of National Programme & Economic Research. 281 p.
1950-1952
Purse seines
160 160 Tsakakis, Sp. 1956. I Aieia en Elladi and is proigmenas choras. Athens. [In Greek.]
1953-2017 151 158 Anon. 1959. Basiki Epitropi Protogenous Paragogis. Epitropi Erevnis & Organoseos Oikonomikou Programmatismou. Chapter 7th, Fisheries. Athens, March 1959. Ananiadis, K.I. 1968. Greek fisheries. Prospects and perspectives of development. Athens, Centre of National Programme & Economic Research. 281 p.
1950-1966 Beach seines
160 160 Ananiadis, K.I. 1968. Greek fisheries. Prospects and perspectives of development. Athens, Centre of National Programme & Economic Research. 281 p.
1967-2017 105 114 Ananiadis, K.I. 1984. History of Fishery. Athens, 222 p. (Reprint from Marine Encyclopedia (1962). Athens, 450 p.).
1950-2017 Small-scales 220 189 Tzanatos, E., E. Dimitriou, G. Katselis, M. Georgiadis and C. Koutsikopoulos. 2005. Composition, temporal dynamics and regional characteristics of small-scale fisheries in Greece. Fisheries Research 73: 147–158. doi.org/10.1016/j.fishres.2004.12.006

2020 Fisheries Centre Research Reports 28(5)
188
SPAIN (MEDITERRANEAN AND GULF OF CADIZ): CATCH RECONSTRUCTION UPDATE TO 2018*
Iván Solaa, José-Luis Sánchez-Lizasoa, Brittany Derrickb and Daniel Paulyb
a) Department Marine Sciences and Applied Biology, University of Alicante, Carr. de San Vicente del Raspeig, s/n, 03690 San Vicente del Raspeig, Alicante, Spain
b) Sea Around Us, Institute for the Oceans and Fisheries, University of British Columbia, 2202 Main Mall, Vancouver, BC, V6T 1Z4, Canada
Abstract This contribution updates to 2018 a reconstruction of the catches of the Spanish marine fisheries in the Mediterranean (excluding the Balearic Islands) and the Gulf of Cadiz region (i.e., in the Atlantic) that initially covered the years 1950 to 2010. One major issue in this update was the absence of fishing gear information for catch per taxon. To overcome this limitation, datasets from autonomous communities within the two regions were used to estimate the taxon proportions of catch taken by each fishing gear. The other major issue is that we used official landings for the Gulf of Cadiz region from 1985-1999 that were not available for the initial reconstruction to retroactively update catch from 1985-2009 for the Gulf of Cadiz. Assumptions for the reconstruction are explicitly stated in the description below. Introduction This contribution updates to 2018 a reconstruction of the catches of the Spanish marine fisheries in the Mediterranean and the Gulf of Cadiz region (i.e., in the Atlantic) that initially covered the years 1950 to 2010 (Coll et al. 2015, 2016). Updates to the catch reconstructions of the Northwest coast of Spain and to the Balearic Islands are covered elsewhere within this volume by Noël et al. (2020) and Khalfallah et al. (2020) respectively and have been disaggregated from the statistics presented here. In the previous reconstruction by Coll et al. (2015, 2016), a ratio was derived to separate landings data for the Gulf of Cadiz from the data for the entire Northeast Atlantic Ocean (FAO area 27) for 1986 onward. We observed that this approach overestimated landings in this region; therefore, we used official landings from 1985-2010 to retroactively adjust the catch reconstructed for the Gulf of Cadiz. Materials and Methods Reported catch baseline data for the Spanish Mediterranean and the Gulf of Cadiz region We collected time series of reported landings from regional (i.e., Autonomous Regions), fisher guilds (called Cofradías), national (MAPA and other government bodies) and international agencies (i.e., FAO, ICCAT STECF). After reviewing the various databases available, we chose as our main reported landing data source the statistics of the Ministry of Agriculture, Fisheries and Food (MAPA), which are available from 1992 to 2018 for the Spanish Mediterranean7. For the Gulf of Cadiz, we used data from the Andalucia Autonomous Region8 that have data from 1985 to 2018.
* Cite as: Sola, I., J.-L.S. Sánchez-Lizaso, B. Derrick and D. Pauly. 2020. Spain (Mediterranean and Gulf of Cadiz): catch reconstruction update to 2018, p. 188-196. In: B. Derrick, M. Khalfallah, V. Relano, D. Zeller and D. Pauly (eds). Updating to 2018 the 1950-2010 Marine Catch Reconstructions of the Sea Around Us: Part I – Africa, Antarctica, Europe and the North Atlantic. Fisheries Centre Research Report 28(5). 7 https://www.mapa.gob.es/es/estadistica/temas/estadisticas-pesqueras/pesca-maritima/estadistica-capturas-desembarcos/default.aspx 8 https://ws142.juntadeandalucia.es/agriculturaypesca/idapes/servlet/FrontController?ec=observatorio

Updating to 2018 the 1950-2010 marine catch reconstructions of the Sea Around Us: Part I – Africa, Antarctica, Europe and the North Atlantic
189
The main limitation of both databases is that they have no information on the fishing gear used. Therefore, we used the datasets from two Autonomous Communities (Catalonia and Valencian Region) to estimate, for each taxon, the proportion of catch from each gear type. The average ratio of landings per gear type (trawling, various artisanal gears, purse seine, bottom longline and surface longline) for each taxon present was applied to the MAPA catch data for the Mediterranean. We used a similar approach for the Gulf of Cadiz, which was also adjusted slightly to incorporate the opinions of the local experts and the ratios between different fleets in the region. Discards Recently, several studies have been carried out that provide additional information about discards in European fisheries, including the Spanish Mediterranean fisheries. Among them included some initial studies (Soriano 2000; Mayoll 2005), the ‘MINOUW’ project9 (2015-2019), and the EU Data Collection Framework (DCF 2012-2014)10 documented in Bellido et al. (2014), which estimated discards from bottom trawling. In the case of artisanal fisheries (e.g., gillnets, bottom longline and longline fishing) we used data from the ‘EMPAFISH’ project11 (2003-2005), the ‘MINOUW’ project (2015-2019), and the published literature (Bellido et al. 2014). We reviewed the data available from these projects and derived from them the ‘anchor points’ to estimate the discards from 2010 to 2018. When information was not available for a taxon/gear combination, we used average rates of discards for the gear in question. Finally, to estimate the discards of purse seiners, we used the published literature (Bellido et al. 2014), press releases and interviews of fishers along Spain’s Mediterranean coast. Unreported catch Unreported catches in the Spanish Mediterranean are, as elsewhere, poorly documented. To compensate for this, in 2019, we conducted informal interviews with fishers, fisheries scientists and other experts in the fisheries sector along Spain’s Mediterranean coast. We also included personal observations made during visits to fishing guilds (Cofradías) and fishing ports and used comparisons between on-board sampling and landings. These different sources of information suggest that unreported landings along Spain’s Mediterranean coast have declined to 5-7% from 15-20 % of reported landings a decade ago. There is wide agreement among those who study Spanish domestic fisheries that unreported catches are higher in small scale fisheries than in domestic industrial fishing and that some high value species may have higher unreported catches than the average. Whether a relatively lower unreporting rate also holds for the industrial Spanish distant water fleets fishing outside of Spanish waters remains to be determined. However, in the Gulf of Cadiz, our interviews suggest that unreported catches are around 20% without a decreasing trend. Species with Total Allowable Catches (TACs) such as European anchovy (Engraulis encrasicolus) and Norway lobster (Nephrops norvegicus) probably have higher unreported catches than the average.
9 http://minouw-project.eu/ 10 https://datacollection.jrc.ec.europa.eu/index.html 11 https://www.um.es/empafish/index.php?option=com_content&task=view&id=19&Itemid=49

2020 Fisheries Centre Research Reports 28(5)
190
Subsistence catches Subsistence catches are here defined as catches taken home by commercial fishers for family consumption or gifting. However, we also considered an additional estimate for retired fishers who are usually present during fish landing operations and who collect fish for themselves and for their families. Thus, we do not estimate true subsistence fishing, which was deemed to not occur in modern day Spain. We used the published literature (Coll et al. 2015) and fisher interviews to estimate the amount of fish taken home per fisher or person involved, i.e., 1.5 kg of fish per person, per day. We applied this information to estimate the subsistence catch based on the number of fishers, plus 20 % for other persons involved, by year, from 2010 to 2018. Since this had not been considered by Coll et al. (2015), we applied this increase retroactively. Recreational fishing We reviewed the published literature on recreational fishing (notably Morales-Nin et al. 2005; Soliva 2006; Lloret et al. 2008; Font and Lloret 2011; Cardona 2011; Cardona and Morales-Nin 2013; Alos et al. 2014; Morales-Nin et al. 2015; Gordoa et al. 2019; Dedeu et al. 2019). The catch composition and average catch per day tended to be consistent between different studies. However, there is an issue with the estimation of fishing effort in the recreational fishery (RF). It is known that fishers who agree to share their data are the most avid and involved (Strehlow et al. 2012), which may cause overall angling effort to be overestimated (Rocklin et al. 2014). Gordoa et al. (2019) presented two quite different estimates of recreational fishing effort in Spain. We used the more conservative estimation of fishing effort (Gordoa et al. 2019) to avoid the overestimation of recreational fisheries catches. We also assumed that the temporal development of fishing effort is related to the development of recreational fishing licenses. We used the intra-regional distribution of fishing licenses in Andalusia to separate the recreational catches between the Mediterranean and the Gulf of Cadiz. Based on the recent comprehensive study of Spain’s marine recreational fisheries by Gordoa et al. (2019), the original estimate of recreational catches by Coll et al. (2015, 2016) was assumed to be too conservative. Thus, we retroactively raised the original estimates for 1950-2010 from 13.2% of commercial landings in the mid-2000s to 18.3% and half that for the 1950-1970s following the original methods by Coll et al. (2015, 2016). Updating the reconstruction of the Gulf of Cadiz region Coll et al. (2015) estimated landings from the Gulf of Cadiz from Spanish landings in the Northeast Atlantic Ocean (FAO area 27) with a linear regression model for 1986-2009. When we compared official landings from the regional government of Andalusia with the original estimates, we observed that they overestimated landings in this region. We have updated their reconstruction using official landings per taxon from 1985 to 2010 and maintained the ratios between landings and the unreported catches. This correction was applied retroactively for 1985-2010 by applying the sectoral and gear allocation per taxon assigned to reported catch by taxon for the Gulf of Cadiz for 2010-2018. Due to the improvement in taxonomic resolution in catch reporting in later years, the taxonomic breakdown was adjusted for the reported catch for 1950-1984. The five-year average ratio of species-level catch per broad taxonomic group (e.g. ‘Marine fishes not identified’, ‘Elasmobranchii’, etc.) was used to disaggregate species, genus and family level catch from broader taxonomic groups for reported industrial landings for 1950-1984.

Updating to 2018 the 1950-2010 marine catch reconstructions of the Sea Around Us: Part I – Africa, Antarctica, Europe and the North Atlantic
191
Separating out reconstructed catches of the Balearic Islands The reconstruction of the Balearic Islands catches was updated separately by Khalfallah et al. (2020). In order to avoid double-counting of Balearic Island catch, landings and discards per sector were subtracted from the total landings and discards per sector reconstructed for the Mediterranean coast for 2010-2018. Improved taxonomic resolution of reported catches for Mediterranean coast Similar to the improvement in taxonomic resolution of the Gulf of Cadiz data, reported landings by Spanish vessels fishing within the Mediterranean were also disaggregated back to 1950 following the sectoral allocation per taxon assigned for 2010 onward. The five-year average ratio of species, genus and family level catch within broad taxonomic groups (e.g., Marine invertebrates not identified) for 2010-2014 and was applied to reported catches assigned to the broad taxonomic group for 1950-2009. Landings from outside the Spanish EEZ It is important to note that some catches landed and reported in ports of the Gulf of Cadiz region were taken outside the Spanish Exclusive Economic Zone (EEZ), e.g., in the waters of Morocco and Mauritania (Sobrino et al. 1994; Guénette et al. 2001; Gascuel et al. 2007). Spanish fisheries off Morocco whose catches traditionally landed in the Gulf of Cadiz region started at the end of the 19th century and ended in 1996, with a clear decline of catches beginning in the late 1980s (Sobrino et al. 1994). However, some boats were allowed to fish in Morocco between 2014 and 2018. We used Caillart et al. (2017) to estimate landings in Gulf of Cadiz ports that originated from Moroccan waters and subtracted them from the landings of the Gulf of Cadiz region. Moreover, fishing in Mauritania by Spanish vessels based in ports of the Gulf of Cadiz region started during the 1960s and continues today, if at low levels (Coll et al. 2015). We assumed that landings of Senegalese hake (Merluccius senegalensis) and Benguela hake (Merluccius polli) originated from the Mauritanian EEZ. We also have assumed a Mauritanian origin for landings of West coast sole (Austroglossus microlepis), whose distribution includes Namibia and the West coast of South Africa (see FishBase, www.fishbase.org). Results and Discussion In the Spanish Mediterranean EEZ (excluding the Balearic Islands, Carreras et al. 2015), maximum catches were observed in 1994 (Figure 1), while in the Gulf of Cadiz, the maximum was observed in 1958 (Figure 2). After these peaks, catches gradually decreased. In both regions, catches are dominated by small trawlers and purse-seiners targeting small pelagic species that traditionally have been considered industrial fisheries, as opposed to the fleets using fixed nets and traps usually considered for small scale fisheries. However, the only real large industrial fleets are purse-seiners targeting tuna and surface long-liners, while trawlers and purse-seiners targeting small pelagic species may be considered as semi-industrial. In any case, we decided to maintain all trawlers and purse-seiners catches as industrial in our reconstruction, and thus follow the Sea Around Us sectoral principles and Martín (2012), although the differentiation between small and large-scale fisheries in both regions is unclear.

2020 Fisheries Centre Research Reports 28(5)
192
Figure 1. Reconstructed domestic catch within Spain’s Mediterranean EEZ (excluding the Balearic Islands) by fishing sector for 1950-2018.
Figure 2. Reconstructed domestic catch within Spain’s Gulf of Cadiz by fishing sector for 1950-2018. Total fisheries removals were estimated by summing all catch components investigated here: official reported landings, unreported landings and unreported discards. These three components represent important portions of total removals in both regions. In 2018, official landings represented 67% of total removal in the Mediterranean and 54% in the Gulf of Cadiz. In recent years, the Gulf of Cadiz has experienced a significant decrease of landings, dropping from 36,500 tonnes in 2016 to 25,000 tonnes in 2017 and 2018.
In both regions, discards have been estimated to average around 10% of total removals. On the Spanish Mediterranean coast, unreported landings are decreasing, likely by half or more in the last decade. This implies that the decrease in total removals is stronger than the decrease observed in official landings, mirroring the global pattern after 1996 (Pauly and Zeller 2016). This trend is not observed in the Gulf of Cadiz. In fact, the recent introduction of management-based Total Allowable Catch limits (TACs) for some species may have increased the incidence of unreported landings.

Updating to 2018 the 1950-2010 marine catch reconstructions of the Sea Around Us: Part I – Africa, Antarctica, Europe and the North Atlantic
193
Recreational fisheries also make a significant contribution to total catch in both regions and it has been estimated that this contribution is increasing. In 2010, recreational catch represented around 14% of the total catch in both regions. In 2018, the percentages increased to 17.5 and 22 in the Mediterranean and Gulf of Cadiz, respectively. Subsistence catch represents a small portion of total removals, about 2% in both regions. Sola and Maynou (2018) show that the portion of catches below the legal minimum size of two relevant commercial species such as Merluccius merluccius and Mullus barbatus (mainly taken home by commercial fishermen for family consumption), is relatively low in terms of overall volume of catches for the Spanish Mediterranean bottom trawl fishery. Marine biodiversity protection Spain protects the biological diversity of the Mediterranean and Gulf of Cadiz through international agreements such as the Convention on Biological Diversity (Aichi) and the Ramsar Convention on Wetlands of International Importance as well as through regional treaties like Natura 2000. Spain is also a signatory to the Barcelona Convention and to the international network of UNESCO Man and the Biosphere, and its commitments extend to NGOs and/or public bodies like the OSPAR Convention (Marine Conservation Institute 2020). The central government has exclusive authority over the EEZ. The regional governments are responsible for coastal waters (‘internal waters’). A number of Marine Protected Areas (MPAs) have been established along the Spanish Mediterranean coast by the Autonomous Regions and the Central Government in Catalonia (4), Valencia (3), Murcia (3), Andalusia (9), as well as the Autonomous Cities of Ceuta and Melilla (on the coast of Morocco), where the Special Areas of Conservation of the Chafarinas Island and the Special Areas of Conservation Monte Hacho (Ceuta) have been created (Otero 2015). “The concept of Marine Reserve of Fishing Interest in the Spanish legislation (Law 3/2001 of 26th March, State Marine Fisheries) was, until recently, the only one supported by the Ministry of Agriculture, Fisheries and Food. It is defined as a tool to improve fisheries management and as a by-product of its implementation may potentially protect certain species or their habitats (by reducing the fishing effort or permanent closure of some areas)” (Otero 2015). After the Law of Natural Heritage and Biodiversity (Law 42/2007, of December 13th), the Spanish concept of MPAs’ shifted towards maintaining the sustainability of the oceans and biodiversity, founded in the Law of Natural Heritage and Biodiversity (Law 42/2007, of December 13th) that first defined the new concept and provides for the creation of a Network of Marine Protected Areas (‘RAMPE’)” (Otero 2015). In the Mediterranean, the ‘fishing interest reserves’ protect 272 km2, which is less than 1% of Spain’s Mediterranean EEZ (148,159 km2 of EEZ; Coll et al. 2016). The no-take areas’ extent is 83 km2, which is 30% of the total extent of the ‘reserves of fishing interest’. The MPA of ‘Levante de Mallorca-Cala Rajada’ has the greatest total extent (113 km2), and the MPA of ‘Islas Columbretes’ has the largest no-take zone (31 km2), with a total extent of 55 km2. The smallest MPA is ‘Masia Blanca’ with a total extent of 5 km2 and a tiny no-take area of 0.43 km2 in an area with valuable exploited species such as the common cuttlefish (Sepia officinalis), surmullet (Mullus surmuletus), gilthead seabream (Sparus aurata) and European seabass (Dicentrarchus labrax) (Revenga et al. 2018).

2020 Fisheries Centre Research Reports 28(5)
194
The “Marine Reserves had a positive effect on the recovery of the flagship species [Posidonia] oceanica, although such data only derive from the Tabarca Marine Reserve” (Gonzalez Correa et al 2015; Merkohasanaj et al. 2019). Various initiatives receive funds from the European Fisheries Fund or other EU programs, for example for placing buoys and installing artificial reefs in Natura 2000 sites in Andalusia or the creation and management of the oldest Marine Reserve, the Tabarca Island (declared in 1986), which was initially funded primarily through European Structural and Cohesion Funds (Otero 2015). “Profitable commercial Palinurus elephas fisheries in the Mediterranean occur around archipelagos and islands, such as the Balearic Islands and around the Columbretes Marine Reserve (MR). These fisheries have been used as controls in a long-term study that monitored the recovery of P. elephas within the MR since 2000. Although information on lobster abundance before MR implementation is not available, local fishermen corroborate that prior to MR creation catch rates were at a minimum. Density of P. elephas within the MR at the end of the 20th century was estimated to be 6–20 times greater than in comparable fished areas depending on the season (Goñi et al. 2001) and spillover supplied lobster to the adjacent fishery (Goñi et al. 2006), providing a net annual benefit to the local fishery of 12% of the catch in weight (Goñi et al. 2010)” (Díaz et al. 2016). Spillover effect have been observed in other MRs and commercial species (Goñi et al 2008, Forcada et al 2009). Acknowledgments We wish to thank Dr. Marta Coll for the information she provided about previous reconstruction and the Sea Around Us UBC team for their support. We also thank all the people who have provided us with information on different regions and topics. References Alós, J., M. Palmer, M. Linde-Medina and R. Arlinghaus. 2014. Consistent size-independent harvest selection
on fish body shape in two recreationally exploited marine species. Ecology and Evolution, 4(11): 2154–2164. doi.org/10.1002/ece3.1075
Bellido, J.M., A.C Quetglas, M.G. Rodriguez, T.G. Jimenez and M.G. Aguilar. 2014. The Obligation to Land All Catches – Consequences For The Mediterranean: In-Depth Analysis. IP/B/PECH/IC/2013-168. Directorate-General for Internal Policies. Policy Department B: Structural and Cohesion Policies. European Union. 52p.
Caillart, B. 2017. Research for PECH Committee – The management of fishing fleets in Outermost Regions. IP/B/PECH/IC/2016_100. Directorate-General for Internal Policies. Policy Department B: Structural and Cohesion Policies. European Union. 49 p. Available at: http://www.europarl.europa.eu/RegData/etudes/STUD/2016/585901/IPOL_STU(2016)585901_EN.pdf
Cardona, F. 2011. El qué y el cuánto de la pesca recreativa en la isla de Mallorca. PhD thesis, Universidad de las Isla Baleres, Palma, Spain, 212 p.
Cardona, F. and B. Morales-Nin. 2013. Anglers’ perceptions of recreational fisheries and fisheries management in Mallorca. Ocean & Coastal Management, 82: 146-150. doi.org/10.1016/j.ocecoaman.2013.06.006
Carreras, M., M. Coll, A. Quetglas, R. Goni, X. Pastor, M.J. Cornax, M. Iglesias, E. Massutí, P. Oliver, R. Aguilar, A. Au, K. Zylich and D. Pauly. 2015. Estimates of total fisheries removal from the Balearic Islands (1950-2010). Fisheries Centre Working Paper #2015-9, 46 p.
Coll, M., M. Carreras, M.J. Cornax, E. Massutí, E. Morote, X. Pastor, A. Quetglas, R. Sáez, L. Silva, I. Sobrino, M.A. Torres, S. Tudela, S. Harper, D. Zeller and D. Pauly. 2015. An estimate of the total catch in the Spanish Mediterranean Sea and Gulf of Cadiz regions (1950-2010). Fisheries Centre Working Paper #2015-60, 52 p.
Coll, M., M. Carreras, M.J. Cornax, E. Massutí, E. Morote, X. Pastor, A. Quetglas, R. Sáez, L. Silva, I. Sobrino, M.A. Torres, S. Tudela, S. Harper, D. Zeller and D. Pauly. 2016. Spain (Mediterranean and Gulf of

Updating to 2018 the 1950-2010 marine catch reconstructions of the Sea Around Us: Part I – Africa, Antarctica, Europe and the North Atlantic
195
Cadiz), p. 396. In: D. Pauly and D. Zeller (eds). Global Atlas of Marine Fisheries: A critical appraisal of catches and ecosystem impacts. Island Press, Washington D.C.
Dedeu, A.L., J. Boada and A. Gordoa. 2019. The first estimates of species compositions of Spanish marine recreational fishing reveal the activity’s inner and geographical variability. Fisheries Research, 216: 65-73. doi.org/10.1016/j.fishres.2019.03.025
Díaz, D., S. Mallol, A.M. Parma and R. Goñi. 2016. A 25-year marine reserve as proxy for the unfished condition of an exploited species. Biological Conservation, 203: 97-107.
Gascuel, D., D. Zeller, Mahfoud O Taleb Sidi and D. Pauly. 2007. Reconstructed catches in the Mauritanian EEZ, p. 105-119. In: D. Zeller and D. Pauly (eds). Reconstruction of Marine Fisheries Catches for Key Countries and Regions (1950-2005). Fisheries Centre Research Reports 15(2).
González-Correa, J.M., J.L. Sánchez Lizaso, Y. Fernández Torquemada and A. Forcada. 2015. Long-term population dynamics in a healthy Posidonia oceanica meadow. Thalassas. 31: 63 – 72.
Goñi, R., O. Reñones, A. Quetglas. 2001. Dynamics of a protected Western Mediterranean population of the European spiny lobster Palinurus elephas (Fabricius, 1787) assessed by trap surveys. Marine and Freshwater Research, 52: 1577–1587.
Goñi, R., A. Quetglas, O. Reñones. 2006. Spillover of lobster Palinurus elephas from a Western Mediterranean marine reserve. Marine Ecology Progress Series, 308: 207–219.
Goñi, R., R. Hilborn, D. Díaz, S. Mallol and S. Adlerstein. 2010. Net contribution of spillover from a marine reserve to fishery catches. Marine Ecology Progress Series, 400: 233–243.
Goñi, R., S. Adlerstein, D. Alvarez-Berastegui, A. Forcada, O. Reñones, G. Criquet, S. Polti, G. Cadiou, C. Valle, P. Lenfant, P. Bonhomme, A. Pérez-Ruzafa, J. L. Sánchez-Lizaso, J. A. García-Charton. 2008. Spillover from six western Mediterranean marine protected areas: evidence from artisanal fisheries. Marine Ecology-Progress Series. 366:159 - 174.
Gordoa, A., A.L. Dedeu and J. Boada. 2019. Recreational fishing in Spain: First national estimates of fisher population size, fishing activity and fisher social profile. Fisheries Research, 211: 1-12.
Guénette, S., E. Balguerías and M.T.G. Santamaría. 2001. Part III: South-eastern North Atlantic: Spanish fishing activities along the Saharan and Moroccan coasts, p. 206-213. In: D. Zeller, R. Watson and D. Pauly (eds). Fisheries Impacts on North Atlantic Ecosystems: Catch, Effort and National/Regional Data Sets. Fisheries Centre Research Report 9(3).
Font, T., J. Lloret. 2011. Biological implications of recreational shore angling and harvest in a marine reserve: the case of Cape Creus. Aquatic Conservation: Marine and Freshwater Ecosystems, 21(2): 210–217.
Forcada, A., C. Valle, P. Bonhomme, G. Criquet, G. Cadiou, P. Lenfant and J.L. Sánchez-Lizaso. 2009 Effects of habitat on spillover from marine protected areas to artisanal fisheries. Marine Ecology-Progress Series. 379: 197-211.
Khalfallah, M., C. Piroddi, C. Brown, S.-L. Noël, T. Cashion, B. Derrick, D. Dunstan, E. Page, G. Tsui, A. Pierucci, B. Marčeta, Ç. Keskin, D. Moutopolous, E. Shakman, H.H. Mahmoud, H.M. Ghmati, M. Carreras, M. Abudaya, R.M. Fahim, R. Bakiu, S. Matić-Skoko, S. Villasante, T. Russo and K. Zylich. 2020. Mediterranean: updated catch reconstructions to 2018, p. 251-293. In: Derrick, B., Khalfallah, M., Relano, V., Zeller, D. and Pauly, D. (eds). Updating to 2018 the 1950-2010 Marine Catch Reconstructions of the Sea Around Us: Part I – Africa, Antarctica, Europe and the North Atlantic. Fisheries Centre Research Report 28(5).
Lloret, J., N. Zaragoza, D. Caballero and V. Riera. 2008. Biological and socioeconomic implications of recreational boat fishing for the management of fishery resources in the marine reserve of Cap de Creus (NW Mediterranean). Fisheries Research, 91(2-3): 252-259.
Marine Conservation Institute. 2020. MPAtlas [Online]. Seattle, WA. Available at: www.mpatlas.org Martín, J.I. 2012. The small-scale coastal fleet in the reform of the common fisheries policy.
IP/B/PECH/NT/2012_08. Directorate-General for internal policies of the Union. Policy Department B: Structural and Cohesion Policies. European Parliament. 44 p.
Mayoll, S. 2005. Anàlisi dels descartaments efectuats per la flota d’arrossegament en el Golf de Lleó. PhD Thesis, University of Girona, Spain. 281 p.
Morales-Nin, B., F. Cardona-Pons, F. Maynou, A.M. Grau. 2015. How relevant are recreational fisheries? Motivation and activity of resident and tourist anglers in Majorca. Fisheries Research, 164: 45-49. doi.org/10.1016/j.fishres.2014.10.010
Morales-Nin, B., J. Moranta, C. Garcia, M.P. Tugores, A.M. Grau, F. Riera and M. Cerda. 2005. The recreational fishery off Majorca Island (western Mediterranean): some implications for coastal resource management. ICES Journal of Marine Science, 62(4): 727-739.

2020 Fisheries Centre Research Reports 28(5)
196
Merkohasanaj, M., D. Rodríguez-Rodríguez, M.C. García-Martínez, M. Vargas-Yáñez, J. Guillén and D.A. Malak. 2019. Assessing the environmental effectiveness of the Spanish Marine Reserve Network using remote sensing. Ecological Indicators, 107: 105583.
Noël, S.-L., E. Page, E. Chu, E. Sy, C. Brown, T. Cashion, D. Dunstan, M. Frias-Donaghey, R. Hernandez, S. Popov, G. Tsui and S. Villasante. 2020. Northwestern and Northern Continental Europe: updated catch reconstructions to 2018, p. 294-320. In: B. Derrick, M. Khalfallah, V. Relano, D. Zeller and D. Pauly (eds). Updating to 2018 the 1950-2010 Marine Catch Reconstructions of the Sea Around Us: Part I – Africa, Antarctica, Europe and the North Atlantic. Fisheries Centre Research Report 28(5).
Otero, M. 2015. Fishing governance in MPAS: potentialities for blue economy (FISHMPABLUE Project). WP2 Technical component - Act. 1.4 Country Policy survey: Spain. International Union for Conservation of Nature (IUCN). 24 p.
Pauly, D. and D. Zeller. 2016. Catch reconstructions reveal that global marine fisheries catches are higher than reported and declining. Nature Communications, 7: 10244.
Revenga, S., C. Laborda and M. Peterssen. 2018. Red de Reservas Marinas. Mas de 30 anos protegiendo nuestros oceanos. Ministerio de Agricultura, Pesca y Alimentación, Madrid, Spain. Available at: www.mapa.gob.es/es/pesca/publicaciones/maquetarevistapesca_ene_2018_web_tcm30-503347.pdf
Rocklin, D., H. Levrel, M. Drogou, J. Herfaut and G. Veron. 2014. Combining telephone surveys and fishing catches self-report: The French sea bass recreational fishery assessment. PLoS ONE, 9: e87271.
Sobrino, I., M.P. Jimenez, F. Ramos and J. Baro. 1994. Descripción de las pesquerías demersales de la Región Suratlántica Española. Informes Informes técnicos (Instituto Español de Oceanografía), 151: 3-79.
Sola, I., F. Maynou. 2018. Bioeconomic analysis of the effects of modifying the trawl extension piece with T90 netting. Scientia Marina, 82: 27-37. doi.org/10.3989/scimar.04715.06A
Soliva, A.M. 2006. La pesca marítima recreativa en Cataluña: Aspectos biológicos, sociales y económicos. Master Thesis, University of Barcelona. 177 p. Available at: https://acpr.cat/wp-content/uploads/2019/11/5-Pesca-recreativa-a-Catalunya-2006.pdf
Soriano, S.Z. 2000. Descarts de la pesca de rossec al talus superior de la provincia d'Alacant. Undergraduate degree, Universitat d'Alacant, Alacant, Spain.
Strehlow, H.V., N. Schultz, C. Zimmermann and C. Hammer. 2012. Cod catches taken by the German recreational fishery in the western Baltic Sea, 2005–2010: Implications for stock assessment and management. ICES Journal of Marine Science, 69: 1769– 1780.

Updating to 2018 the 1950-2010 marine catch reconstructions of the Sea Around Us: Part I – Africa, Antarctica, Europe and the North Atlantic
197
TURKEY (BLACK, MARMARA, AND MEDITERRANEAN SEA): UPDATED CATCH RECONSTRUCTION TO 2018*
Courtney Brown and Tim Cashion
Sea Around Us, Institute for the Oceans and Fisheries, University of British Columbia, 2202 Main Mall, Vancouver, BC, V6T 1Z4, Canada
Abstract Earlier catch reconstructions of Turkey’s marine fisheries catches covering the years 1950 to 2010 in the Black Sea, Marmara Sea and Mediterranean Sea were updated to 2018. In the process, discrepancies were noted between the FAO statistics and data reported nationally by Turkstat, notably regarding ‘blue whiting’, an FAO taxonomic category which was not reported by Turkstat. Communication with local experts led us to reassign erroneously reported landings of blue whiting (Micromesistius poutassou) to the European hake (Merluccius merluccius). Detailed descriptions of the methods used for this update are provided by fishing sector. Introduction Turkey’s marine fisheries catches were originally reconstructed for 1950-2010 by Ulman et al. (2013) for three bodies of water: Turkey’s EEZ in the Black Sea (Ulman et al. 2016a), the Marmara Sea, including the Bosphorus and Dardanelle Straits (Ulman et al. 2016b), and the Turkish coastal waters in the Mediterranean (Ulman et al. 2016c). Here, these reconstructions were updated to 2017, then carried forward to 2018. Turkey’s fisheries catches demonstrate a ‘boom-and-bust’ pattern of fisheries exploitation common to fisheries dependent on small pelagic species, while other species have been extirpated by overfishing (Ulman et al. 2020). While some have alluded to over-capacity of small pelagic fisheries in the Black Sea region (Castilla-Espino et al. 2014), environmental influences are also influencing these changes (Gücü et al. 2016). Materials and Methods Reported baseline data National data were accessed from TurkStat for the years 2000 to 2017; these reported landings matched very closely with the FAO reported landings for Turkey. Since these two datasets differed from the data in the previous reconstructions, the former data were used as the new reported baseline for the years 2000 to 2017. Unreported landings, discards and gear breakdowns were recalculated from 2000-2010 following the original reconstruction methods (Ulman et al. 2013), but based on this new national reported baseline. Species-specific issues In 2007, the national data began reporting shrimps and prawns (Dendrobranchiata) at species level, i.e., giant gamba prawn (Aristaeomorpha foliacea), caramote prawn (Melicertus kerathurus), speckled shrimp (Metapenaeus monoceros), deepwater rose prawn (Parapenaeus longirostris), and green tiger prawn (Penaeus semisulcatus). The broad taxonomic group of Dendrobranchiata was disaggregated from 1950-2006 using a five-year average species breakdown for each water body (Black, Marmara, and Levantine and Aegean Seas, the last two being two areas of the Turkish Mediterranean coast).
* Cite as: Brown, C. and T. Cashion. 2020. Turkey (Black Sea, Marmara Sea, and Mediterranean Sea): updated catch reconstruction to 2018, p. 197-204. In: B. Derrick, M. Khalfallah, V. Relano, D. Zeller and D. Pauly (eds). Updating to 2018 the 1950-2010 Marine Catch Reconstructions of the Sea Around Us: Part I – Africa, Antarctica, Europe and the North Atlantic. Fisheries Centre Research Report 28(5).

2020 Fisheries Centre Research Reports 28(5)
198
Inconsistencies in the naming of blue whiting (Micromesistius poutassou) and European hake (Merluccius merluccius) were noted between the FAO, Turkstat and Sea Around Us databases, leading us to reach out to local collaborators. It appears that blue whiting is not reported nationally and that FAO reports landings of European hake as blue whiting (Kaykaç 2010; Avşar et al. 2016). Therefore, all reported landings of blue whiting were transferred to European hake. This update assumes an unreported catch rate of 40% following the original methods of Ulman et al. (2013). The only exception was the Mediterranean mussel (Mytilus galloprovincialis), which we retroactively corrected to include previously unreported mussel landings (see Appendix 1). These additional mussel landings were derived from a survey conducted in 2013, which estimated catch rates for the different types of mussel fishing: Elif fishers, dredgers, scuba divers, and skin divers. The inclusion of these findings added slightly over 2.2 million tonnes to the total reconstructed catches from 1950-2010. The three-year average (2008-2010 = 51,438 tonnes) of total landings of M. galloprovincialis was carried forward from 2011-2017 and reported landings were subtracted from this total to determine unreported landings. Catches by fishing sector Reported and unreported catch was assigned to artisanal and industrial sectors based on the target species, as described by the original methods (Ulman et al. 2013). Discards (including those connected with high grading) of the bottom trawlers were estimated for 2011 to 2017, as were those of shrimp trawlers, purse seiners, pelagic trawlers, and dredges, using the same methods as Ulman et al. (2013) for 2010. The recreational and subsistence sectors are entirely unreported and were calculated with updated population data multiplied by the 2010 recreational and subsistence catch rates. Updated population data were available for Canakkale12 (i.e., the Dardanelles Strait), Istanbul13 and Turkey14 as a whole; however, they were unavailable for other regions (Black Sea, Marmara Sea, Aegean Sea, and Levantine Sea coastal populations). For the regions with no population data available, the 2010 population numbers were used to calculate the regional ratio in the Turkish population. These ratios were then applied to the total Turkish population from 2011 to 2017. The 2010 taxonomic breakdown of catch from each sector was carried forward unaltered for 2011-2017. Illegal catches While Turkish newspapers frequently carry accounts of illegal operation by foreign fishers in Turkish waters, they occasionally refer to Turkish vessels operating illegally in other countries’ waters (Keskin and Turan 2018). One such case is anchovy caught in Georgia’s EEZ by Turkey and reported as ‘Turkish’. In the catch reconstruction of Georgia (Ulman and Divovich 2015), these catches are assigned to the EEZ from which they were taken (i.e., Georgia’s EEZ) and subtracted from Turkey’s reported landings in the Black Sea. Another case is the poaching of turbot (Scophthalmus maximus), which is a major threat to the Black Sea stock of this species, driven by a high economic value coupled with increasing demand (Zengin et al. 2018; Öztürk 2013). Turbot catches by Turkish fishers outside of Turkey’s EEZ (e.g., in Bulgaria, Ukraine and Romania) were estimated by Ulman et al. (2013) at 1,000 tonnes per year as a minimum. Illegal fishing of turbot in the late 2010s still appears to be a problem, although more stringent regulations and controls may be deterring illegal activities (Öztürk 2013; Belova 2015). For the years 2011-2017, the conservative estimate of 1,000 tonnes per year made by Ulman et al. (2013) was carried forward to 2017 unchanged.
12 http://www.citypopulation.de/Turkey-C20.html 13 https://biruni.tuik.gov.tr/medas/?kn=97&locale=en 14 http://www.citypopulation.de/Turkey-C20.html

Updating to 2018 the 1950-2010 marine catch reconstructions of the Sea Around Us: Part I – Africa, Antarctica, Europe and the North Atlantic
199
Transition from 2017 to 2018 The catch reconstructed to 2017 was carried forward to 2018 using the semi-automated procedures outlined in Noël (2020), based on TurkStat landings data to 2018. Semi-automated reconstructed catch data will later be replaced by a more detailed, research-intensive update. Results and Discussion Overall, Turkey’s marine catches show a downward trend following a peak in the 1980s (Figure 1), mainly due to declining catches of the Black Sea fishery for anchovy and the disappearance of several populations of pelagic fish, likely due to historical overfishing, that migrated either between the Black and the Aegean Seas or the Black and Marmara Seas, e.g., mackerel Scomber scombrus (Pauly and Keskin 2017). Ulman and Pauly (2016) demonstrated evidence of shifting baselines based on interviews with local fishers. A 40-fold decline was estimated in the catch per unit effort (CPUE) of artisanal and recreational fisheries when compared to 1950 data. While the eastern Mediterranean (i.e., the Aegean and Levantine Seas) is rapidly warming, leading notably via Lessepsian migrants to changes in the composition of fish communities and fisheries catches (Keskin and Pauly 2014; Tsikliras et al. 2015), this is (or was) not the case in the Black Sea, whose eastern part did not warm much (Keskin and Pauly 2018). In combination with the massive ecological havoc brought about by the introduction of the comb jelly Mnemiopsis leidy, for the Black Sea this has tended to mask trends affecting fisheries elsewhere, i.e., ‘fishing down’ (Pauly et al. 1998; Liang and Pauly 2017) and the increasing ‘mean temperature of the catch’ (Cheung et al. 2013; Liang et al. 2018). However, these trends are now becoming obvious even in the Black Sea. In combination with massive overfishing reported by Demirel et al. (2020), they do not bode well for the marine fisheries of Turkey.
Figure 1. Reconstructed catch for Turkey’s domestic fisheries (Black, Marmara, and Mediterranean Seas) by fishing sector for 1950-2018.
Marine biodiversity protection Turkey has agreed to protect its biological diversity through the international agreements of the Convention on Biological Diversity (Aichi), United Nations Convention on the Law of the Sea, the Ramsar Convention on Wetlands of International Importance and the World Heritage Convention. The country is also a signatory to

2020 Fisheries Centre Research Reports 28(5)
200
Regional Treaties and Agreements such as the Regional Seas Convention and Barcelona Convention. Its commitments extend to NGOs and/or public bodies such as the Mediterranean MPA Network or MedPAN (Marine Conservation Institute 2020). Turkey has two MPAs and five marine managed areas. The MPAs cover 100 km2 (Marine Conservation Institute 2020), which is tiny given the area that Turkey claims as its EEZ in the Black Sea alone (172,000 km2; Ulman et al. 2016a). The two MPAs listed in MPAtlas are Kaş-Kekova (a Special Environmental Protected Area with some no-take areas designated in 2006 with a total area of 300 km2) and Yumurtalik Lagoons (a Ramsar Site designated in 2005 with a total area of 198 km2). The five marine managed areas are Akyatan Lagoon Ramsar Site, Gediz Delta Ramsar Site, Göksu Delta Ramsar Site, Kizilirmak Delta Ramsar Site and Yumurtalik Lagoons Nature Conservation Site (Marine Conservation Institute 2020). The MPAtlas does not mention the Gökova Bay MPA, established in 2010 as a no-take area with 827 km2 and which was intended to provide nursery habitats for, and facilitate the rebuilding of fished stocks in adjacent areas (Ünal and Ulman 2020; Sala et al. 2016). About 100 fishing vessels and 200 small-scale fishers operate in the wider Gökova Bay, and since 2012, these fishers experienced a revenue increase over 53% (Kızılkaya et al. 2015). This increase in revenue led to efforts to create other no-fishing zones, and eventually four more were created in the Gulf of Hisarönü (Ünal and Ulman 2020). “In the Gökova MPA, small-scale fishers use various types of gillnets and longlines. Three fishery cooperatives established and run by small-scale fishers exist in the bay. These cooperatives support their members by providing marketing facilities, facilitating legal procedures, and representing the fishers in relevant platforms and have been engaged with several projects to encourage sustainable fishing in the bay” (Ünal and Ulman 2020). Also note that many ‘recreational’ fishers operating in this area sell their catch, and thus act as illegal competitors of artisanal fishers (Tunca et al. 2016). In an attempt to enhance the biodiversity of Turkish waters and support fishers, the Government, with a budget of US$2.7 million, implemented a national artificial reef project in the Gulf of Edremit in 2012 (Ünal and Ulman 2020). Acknowledgements Funding for the work presented here was provided by the Minderoo Foundation, by the Marisla, Oak, and David and Lucille Packard Foundations, and by the Bloomberg Philanthropies through Rare. References Avşar, D., S. Mavruk, İ. Saygu and E.Ö. Özbek. 2016. An Evaluation of the Fishery Landing Statistics of the
Mediterranean Coast of Turkey: Statistics of Which Species? p. 275-304. In: C. Turan, B. Salihoğlu, E.Ö. ÖzbeK and B. Öztürk (Eds). The Turkish Part of the Mediterranean Sea; Marine Biodiversity, Fisheries, Conservation and Governance. Turkish Marine Research Foundation (TUDAV), Publication No: 43. Istanbul, Turkey.
Belova, G. 2015. Illegal Unreported and Unregulated Fishing in the Black Sea. International conference on Knowledge-Based Organization, 21(2) 408-412. doi.org/10.1515/kbo-2015-0069
Castilla-Espino D., J.J. García-del-Hoyo, M. Metreveli and K. Bilashvili. 2014. Fishing capacity of the southeastern Black Sea anchovy fishery. Journal of Marine Systems, 135: 160-169.
Cheung, W. W. L., R. Watson, and D. Pauly. 2013. Signature of ocean warming in global fisheries catch, Nature 497, 365—368. doi.org/10.1038/nature12156
Demirel, N., M. Zengin and A. Ulman. 2020. First large-scale Eastern Mediterranean and Black Sea stock assessment reveals a dramatic decline. Frontiers in Marine Science, 7(103): 1-13. doi.org/10.3389/fmars.2020.00103

Updating to 2018 the 1950-2010 marine catch reconstructions of the Sea Around Us: Part I – Africa, Antarctica, Europe and the North Atlantic
201
Gücü, A.C., Ö.E. Inanmaz, M. Ok and S. Sakinan. 2016. Recent changes in the spawning grounds of Black Sea anchovy, Engraulis encrasicolus. Fisheries Oceanography, 25(1): 67-84.
Kaykaç, H. 2010. Size selectivity of commercial (300 MC) and larger square mesh top panel (LSMTPC) trawl codends for blue whiting (Micromesistius poutassou Risso, 1826) in the Aegean Sea. African Journal of Biotechnology, 9 (53): 9037-9041.
Keskin, C. and A. Turan. 2018. The coverage of illegal fishing in Turkish newspapers, p. 38-39. In: Pauly D. and V. Ruiz-Leotaud (eds). Marine and Freshwater Miscellanea. Fisheries Centre Research Reports 26(2).
Keskin, Ç. and D. Pauly. 2018. Reconciling Trends of Mean Trophic Level and Mean Temperature of the Catch in the Eastern Mediterranean and Black Seas. Mediterranean Marine Science 19(1): 79-83.
Keskin, Ç. and D. Pauly. 2014. Changes in the ‘Mean Temperature of the Catch’: application of a new concept to the North-eastern Aegean Sea. Acta Adriatica, 55(2): 213-218.
Kızılkaya, Z., V. Ünal, D. Yıldırım. 2015. Three years’ experience with small-scale fishers and no-take Zones in Gökova Bay (Eastern Mediterranean), Turkey, p. 297-305. In: A. Srour, N. Ferri, D. Bourdenet, N. Fezzardi, A. Nastasi (eds). First regional symposium on sustainable small-scale fisheries in the Mediterranean and Black Sea, FAO Fisheries and Aquaculture Proceedings 39. Food and Agriculture Organization of the United Nations (FAO), Saint Julian’s, Malta.
Liang, C. and D. Pauly. 2017. Fisheries Impacts on China's Coastal Ecosystems: Unmasking a Pervasive 'Fishing Down' Effect. PLOS ONE, 12(3): e0173296. doi.org/10.1371/journal.pone.0173296
Liang, C., W. Xian and D. Pauly. 2018. Impacts of Ocean Warming on China’s Fisheries Catch: Application of the ‘Mean Temperature of the Catch’. Frontiers in Marine Science, 5(26): 1-7. doi.org/10.3389/fmars.2018.00026
Marine Conservation Institute. 2020. MPAtlas [Online]. Seattle, WA. Available at: www.mpatlas.org Noël, S.-L. 2020. Semi-automation procedure for catch reconstruction forward carry, p. 15-20. In: B. Derrick,
M. Khalfallah, V. Relano, D. Zeller and D. Pauly (eds). Updating to 2018 the 1950-2010 Marine Catch Reconstructions of the Sea Around Us: Part I – Africa, Antarctica, Europe and the North Atlantic. Fisheries Centre Research Report 28(5).
Öztürk, B. 2013. Some remarks of Illegal, Unreported and Unregulated (IUU) fishing in Turkish part of the Black Sea. Journal of the Black Sea/Mediterranean Environment, 19(2): 256˗267.
Pauly, D. and Ç. Keskin. 2017. Temperature constraints shaped the migration routes of mackerel (Scomber scombrus) in the Black Sea. Acta Adriatica, 58(2): 339-346.
Pauly, D., V. Christensen, J. Dalsgaard, R. Froese and F.C. Torres. 1998. Fishing down marine food webs. Science, 279: 860-863.
Sala, E., C. Costello, J.D.B. Parme, M. Fiorese, G. Heal, K. Kelleher, R. Moffitt, L. Morgan, J. Plunkett, K.D. Rechberger and A.A. Rosenberg. 2016. Fish banks: An economic model to scale marine conservation. Marine Policy, 73: 154-161.
Tsikliras, A.C., P. Peristeraki, G. Tserpes, K.I. Stergiou. 2015. Mean temperature of the catch (MTC) in the Greek Seas based on landings and survey data. Frontiers in Marine Science, 2(23): 1-6. doi.org/10.3389/fmars.2015.00023
Tunca, S., V. Ünal, B. Miran, H. Güçlüsoy and A. Gordoa. 2016. Biosocioeconomic analysis of marine recreational fisheries: a comparative case study from the Eastern Mediterranean, Turkey. Fisheries Research, 174: 270-279.
Ulman, A. and E. Divovich. 2015. The marine fishery catch of Georgia (including Abkhazia), 1950-2010. Fisheries Centre Working Paper #2015-88, 25 p.
Ulman, A. and D. Pauly. 2016. Making history count: The shifting baseline of Turkish fisheries. Fisheries Research, 183: 74-79.
Ulman, A., Ş. Bekişoǧlu, M. Zengin, S. Knudsen, V. Ünal, C. Mathews, S. Harper, D. Zeller and D. Pauly. 2013. From bonito to anchovy: A reconstruction of Turkey's marine fisheries catches (1950-2010). Mediterranean Marine Science, 14(2): 309-342.
Ulman, A., M. Zengin and S. Knudsen. 2016a. Turkey (Black Sea), p. 416. In: D. Pauly and D. Zeller (eds). Global Atlas of Marine Fisheries: A critical appraisal of catches and ecosystem impacts. Island Press, Washington D.C.
Ulman, A, M. Zengin, N. Demirel and D. Pauly. 2020. The fish of Turkey’s past: a recent history of disappeared species and commercial fishery extinction from the Black and Marmara Seas. Frontiers in Marines Science 14, doi.org/10.3389/fmars.2020.00650 [with modified/corrected map; doi.org/19.3389/fmars.2020.600242]

2020 Fisheries Centre Research Reports 28(5)
202
Ulman, A., V. Ünal and C. Matthews. 2016b. Turkey (Marmara Sea), p. 410. In: D. Pauly and D. Zeller (eds). Global Atlas of Marine Fisheries: A critical appraisal of catches and ecosystem impacts. Island Press, Washington D.C.
Ulman, A., V. Ünal and Ş. Bekişoğlu. 2016c. Turkey (Mediterranean), p. 418. In: D. Pauly and D. Zeller (eds). Global Atlas of Marine Fisheries: A critical appraisal of catches and ecosystem impacts. Island Press, Washington D.C.
Ünal, V. and A. Ulman. 2020. The Current Status and Challenges Facing the Small-Scale Fisheries of Turkey, p. 83-103. In: J.J. Pascual-Fernández, C. Pita, M. Bavinck (Eds). Small-Scale Fisheries in Europe: Status, Resilience and Governance. Springer, Cham.
Zengin, M., V. Mihneva, E. Dungunes. 2018. Analysing the Need of Communication to Improve Black Sea Fisheries Management Policies in the Riparian Countries. Turkish Journal of Fisheries and Aquatic Sciences, 18: 199-209. doi.org/10.4194/1303-2712-v18_1_23

Updating to 2018 the 1950-2010 marine catch reconstructions of the Sea Around Us: Part I – Africa, Antarctica, Europe and the North Atlantic
203
Appendix 1: Addendum for unreported mussel catch The original Turkish reconstruction presented and updated in this technical report and as published by Ulman et al. (2013) missed some unreported mussel catches. These catches have been updated in the Sea Around Us global catch database (www.seaaroundus.org). Hence, we provide information on this correction. Unreported Mediterranean mussel The Mediterranean mussel (Mytilus galloprovincialis) has always been a part of traditional Turkish cuisine. The bulk of mussel catches have been unreported and are estimated here for the first time. Through surveys conducted in 2013 (A. Ulman, pers. obs.), details of this fishery were obtained, and four types of mussel fishers and their catch rates were derived: 1) Elif fishers; 2) dredgers; 3) scuba divers; and, 4) skin divers. It is illegal to catch mussels in the Bosphorus Strait, the Marmara Sea and the Dardanelles unless one has a difficult-to-obtain, special license. Hence, the bulk of the fishery operates illegally and (very) often must pay fines to local authorities. In recent years, there have been many local news articles about mussel fishers being caught and fined; however, since population density is so high (especially in Istanbul), and control is sparse, the majority of illegal operations go unnoticed. Elif fishers: This is a new type of vacuum-style compressor called ‘Elif’. There have been three known Elif compressors operating in Turkey since 2009, two in the Sea of Marmara and one in the Aegean Sea. They run from May to September and can collect four 26 kg bags of mussels a minute for a total of 1,500 bags a day, which results in 39 t·vessel-1·day-1. For the five-month fishing season, it was assumed each of these three boats collects mussels for 30 days a season (this is a part-time operation, conducted while holding other jobs), resulting in ~1,170 t·vessel-1·year-1 of unreported mussels. Thus, for 2009 and 2010, 2,340 t·year-1 (i.e., two operators) of mussels was allocated to the Sea of Marmara and 1,170 t·year-1 (one operator) was allocated to the Aegean Sea. The mussel catches and the dredger catches below were allocated as unreported small-scale commercial catches. Dredgers: There are several known mussel landing and processing centers located on the Bosphorus Strait from which dredgers operate (A. Ulman, pers. obs.). One such area on the Bosphorus collected between 1,000 and 1,500 bags ·day-1, each bag containing approximately 26 kg of mussels. A conservative average of 1,000 bags was used, which equaled 26 t·day-1 for this site alone. This site operated daily from May to September and was assumed to operate 120 days·year-1, producing 3,120 t·year-1 of catch. It was assumed at least five such illegal processing sites exist on the Turkish Black Sea coast, six such illegal processing sites in the Bosphorus-Marmara-Dardanelles region, and one such illegal processing site on the Aegean Sea coast. The dredgers began collecting mussels around 1955, but their catch rate was lower by 75% (i.e., to 2,340 t·year-1) in 1965 to reflect lower fishing pressure due to lower demand by the smaller human population; however, by 1980, 3,120 t·year-1 per site was deemed appropriate. Scuba: One professional scuba diver collects ~0.7 t·day-1 and operates about 20 days·year-1 (as an income supplement, A. Ulman, pers. obs.) which equates to catches of 14 t·diver-1·year-1. All mussel collectors using scuba were assigned half the catch rate in 1950 (7 t·diver-1·year-1), which was linearly increased to 14 t·diver-
1·year-1 by 1980, and this rate was held constant until 2010. It was assumed that in 1950 there were 100 scuba divers collecting mussels in the Marmara Sea region (including Istanbul and the Dardanelles), which was linearly increased to 500 by 1980, then held constant to 2010. The Black Sea was assumed to have 20 mussel scuba divers in 1950, which was linearly increased to 200 divers by 1980, and held constant to 2010. The

2020 Fisheries Centre Research Reports 28(5)
204
Aegean Sea was assumed to have 10 divers in 1950, which was linearly increased to 50 by 1980 and held constant to 2010. Mussels were not known to be collected from the Turkish Mediterranean coast. Skin divers: Mussels collected for bait by skin divers were estimated at 20 kg·fisher-1·day-1 for 100 days·year-1, corresponding to 2 t·fisher-1·year-1. It was assumed that there were 100 such skin-diving fishers operating in the Istanbul, Marmara and Dardanelles areas beginning in 1965, which was linearly increased to a (very conservative) 1,000 fishers·year-1 by 1980 and held constant to 2010. The Aegean Sea was assumed to have 20 skin diving fishers in 1950, which was linearly increased to 200 by 1980 and held constant to 2010. Other seas were not considered here. These catches and catches using scuba were allocated as recreational catches. Results These additional unreported mussel catches added slightly over 2.2 million t to the total reconstructed catches from 1950-2010, increasing from 910 t·year-1 in 1950 to nearly 54, 000 t·year-1 by 2010. The Black Sea had a total of nearly 810,000 t of mussels added to the small-scale commercial sector for the 1950-2010 period. The Marmara Sea had a total of ~77,000 t of mussels added to the recreational sector and ~1.1 million t added to the small-scale commercial sector for the 1950-2010 period. The Aegean Sea had a total of ~15,000 t of mussels added to the recreational sector and ~170,000 t added to the small-scale commercial sector for the 1950-2010 period. References Ulman, A., Ş. Bekişoǧlu, M. Zengin, S. Knudsen, V. Ünal, C. Mathews, S. Harper, D. Zeller and D. Pauly. 2013.
From bonito to anchovy: A reconstruction of Turkey's marine fisheries catches (1950-2010). Mediterranean Marine Science, 14(2): 309-342.

Updating to 2018 the 1950-2010 marine catch reconstructions of the Sea Around Us: Part I – Africa, Antarctica, Europe and the North Atlantic
205
BLACK SEA: UPDATED CATCH RECONSTRUCTIONS TO 2018*
Sarah Popov, Tim Cashion, Brittany Derrick, Maria Frias-Donaghey, Myriam Khalfallah, Veronica Relano, Gordon Tsui, Kyrstn Zylich, and Daniel Pauly
Sea Around Us, Institute for the Oceans and Fisheries, University of British Columbia, 2202 Main Mall, Vancouver, BC, V6T 1Z4, Canada
Abstract Marine fisheries catches for the countries around the Black Sea were initially reconstructed for the years 1950 to 2010. This contribution updates these reconstructions to 2018 for Bulgaria, Romania, Russia (Black Sea) and Ukraine (including Crimea) but omits Georgia and Turkey, which are dealt with elsewhere. The updating was done in two steps, i.e., an update to 2014 that considered a wide range of data sources and a carry-forward to 2018 constrained by landing statistics reported for 2018 by the Food and Agriculture Organization of the United Nations (FAO). Introduction The Black Sea is a semi-enclosed (marginal) sea situated in the northeast of the Mediterranean basin between Eastern Europe and Western Asia. It is surrounded by Ukraine, Romania, Bulgaria, Turkey, Georgia, and Russia. Since the end of WWII, the Black Sea Large Marine Ecosystem (Sherman and Hempel 2008), which supported extensive fisheries (Pauly et al. 2008), has experienced major ecological upheavals which, combined with massive overfishing, have led to the decline of many of its exploited fish and invertebrate populations (Daskalov 2002; Tsikliras et al. 2013). Marine fisheries catches for the Exclusive Economic Zones (EEZs) of countries of the Black Sea were initially reconstructed for the years 1950 to 2010. This contribution updates these reconstructions to 2018 for Bulgaria, Romania, Russia (Black Sea) and Ukraine (including Crimea), but omits Georgia and Turkey, which are dealt with in Brown and Noël (2020) and Brown and Cashion (2020), respectively. Note that this updating was done in two steps, i.e., a ‘manual’ update to 2014 that in some cases considered a range of data sources and a carry-forward to 2018 constrained by landing statistics reported for 2018 by the Food and Agriculture Organization of the United Nations (FAO). Taxonomic resolution of reported catches of Elasmobranchii were evaluated and improved upon as documented by Cashion et al. (2019). Methods (by country) Bulgaria Bulgaria is a southeastern European country that borders the Black Sea. It is characterized by a fishing industry that was already being modernized in the 1950s. A reconstruction of Bulgaria’s marine fisheries catches covering the years 1950-2010 was completed by Keskin et al. (2015, 2016) and updated to 2013 by Keskin et al. (2017). Here, we briefly mention how this reconstruction was updated to 2014, then carried forward to 2018. Baseline data Reported landings data for Bulgaria were available by year and taxon for 2011-2014 from the FAO Fishstat database. They were used here as the reported baseline to which unreported commercial, subsistence and
* Cite as: Popov, S., T. Cashion, B. Derrick, M. Frias-Donaghey, M. Khalfallah, V. Relano, G. Tsui, K. Zylich and D. Pauly. 2020. Black Sea: updated catch reconstructions to 2018, p. 205-215. In: B. Derrick, M. Khalfallah, V. Relano, D. Zeller and D. Pauly (eds). Updating to 2018 the 1950-2010 Marine Catch Reconstructions of the Sea Around Us: Part I – Africa, Antarctica, Europe and the North Atlantic. Fisheries Centre Research Report 28(5).

2020 Fisheries Centre Research Reports 28(5)
206
recreational catches as well as discards were added. The methods applied to update the catches for 2011-2013 are summarized in Keskin et al. (2017b) and were used for the 2014 update. Transition from 2014 to 2018 The catch reconstructed to 2014 was carried forward to 2018 using the semi-automated procedures outlined in Noël (2020), based on FAO landings data to 2018. Semi-automated reconstructed catch data will later be replaced by a more detailed, research-intensive update. Marine biodiversity protection Bulgaria has agreed to protect its biological diversity through the international Convention on Biological Diversity (Aichi). The country is also a signatory to Regional Treaties and Agreements such as the Natura 2000 (Marine Conservation Institute 2020). The Natura 2000 sites implementation is coordinated and managed by the Ministry of Environment and Water (Stancheva et al. 2016). Bulgaria has 54 MPAs and four marine managed areas; the MPAs’ extent is 512 km2, which occupies 1.46% of the entire EEZ (35,132 km2; Keskin et al. 2015). One of the first protected areas in Bulgaria was declared in Cape Kaliakra in 1941. In 1966, this MPA passed from a designation as Natural Park to a strict nature reserve of 0.53 km2. In 1980, the reserve was extended to 6.88 km2, which includes 4 km2 of marine ecosystems. A small buffer zone of 1.1 km2 was included three years later. The reserve is a no-take area, which prohibits mining, harvesting of any fauna and flora, and destroying bird nests and animal lairs, among other activities (Marine Conservation Institute 2020). While some progress has been made in terms of designating Natura 2000 sites, some challenges regarding their management exist. For example, in the most northern district of Dobrich, where the Reserve of Kaliakra is located, a large fraction of the nominally protected areas is affected by the consequences of poor planning and management and lack of public awareness (Stancheva et al. 2016). “Education and information programmes, as well as regulations aimed at restricting visitor behaviour, may be necessary in addition to limits of use. New skills and tools need to be developed by management authorities in Bulgaria to address the challenges that emerge from planning, monitoring and managing protected areas and historical sites along the coast” (Stancheva et al. 2016). Romania The marine fisheries catches by Romania from 1950 to 2010 were reconstructed by Bӑnaru et al. (2015, 2016). We document here how these were updated to 2014, then carried forward to 2018. Romania has an intensive trawl fishery until 1989 when the fishery collapsed. Since then, the Romanian fishing industry has consisted of relatively small-scale commercial and subsistence fisheries (Bӑnaru et al. 2015). Reported data Official marine fisheries catches were available by year and taxa for 2011-2014 from the FAO database. The total catch started increasing after 2011 due to landings of Rapana venosa, a large sea snail (Radu et al. 2013a; Radu et al. 2013b). R. venosa is caught by beam trawlers, which are classified as ‘small-scale’ in Romania, but which are here considered as ‘industrial’ following Martín (2012).

Updating to 2018 the 1950-2010 marine catch reconstructions of the Sea Around Us: Part I – Africa, Antarctica, Europe and the North Atlantic
207
Unreported catch The 2010 ratio of coastal to total population was used to estimate the coastal population of Romania from 2011 to 2014 based on updated population data from the World Bank. The annual unreported subsistence catch rate was extrapolated forward to 2014 and multiplied by the coastal population to estimate subsistence catch. The 2010 taxonomic breakdown of subsistence catches was maintained to 2014. Discards from artisanal landings were calculated for 2011-2014 using the original methods. Transition from 2014 to 2018 The catch reconstructed to 2014 was carried forward to 2018 using the semi-automated procedures outlined in Noël (2020), based on FAO landings data to 2018. Semi-automated reconstructed catch data will later be replaced by a more detailed, research-intensive update. Marine biodiversity protection Romania has agreed to protect its biological diversity through the international Convention on Biological Diversity (Aichi) and the Ramsar Convention on Wetlands of International Importance (Marine Conservation Institute 2020). Romania is also a signatory to Regional Treaties and Agreements such as the Natura 2000, and it is also part of the international network of UNESCO Man and the Biosphere (Marine Conservation Institute 2020). Romania has 21 MPAs and three marine managed areas. The MPAs’ extent is 1,530 km2 (Marine Conservation Institute 2020), which represents 5% of the entire EEZ (29,756 km2; Bănaru et al. 2016). When planning and establishing MPAs in Romania, one of the first steps was to identify the marine habitat types, according to the Habitats Directive, and elaborate a specific typology for the Romanian Black Sea. Moreover, biological diversity protection in Romania also counts with the so-called ‘Romanian Network of MPAs’ (RO). Within this network “the scientists started from the main target of MPAs: preserving the marine resources (biodiversity and underwater landscape) for the benefit of the present and future generations. It was assumed that the implementation of proper management could ensure permanent benefits in these marine areas while minimizing eventual conflicts with the users. The RO scientists also considered the necessity of preserving the species and habitats of European importance, including in the network the marine sites already proposed to be part of the NATURA 2000 network” (Marine Conservation Institute 2020). The Danube Delta MPA is the only UNESCO-MAB Biosphere Reserve in Romania and is of great importance for the fisheries of the country. The fisheries are dominated by the small-scale sector since the Common Fisheries Policy was introduced and the industrial fleet completely disappeared (Teodorescu and van den Kommer 2020). “Bad management of the Danube Delta and stories of corruption scandals do not make it easier to implement policies and strategies or to utilize available funds to their fullest potential. Hence, a balance between nature conservation and sustainable use of fish stocks and more economic opportunities for local small-scale fisheries is still, in the short run, inconceivable. Given the importance of the Danube Reserve as a conservation area for a region that is wider than the Romanian borders, it is not very likely that environmental regulations of the Danube Reserve, such as the sturgeon ban and policies on restricted fishing areas, will be lifted in the near future” (Teodorescu and van den Kommer 2020).

2020 Fisheries Centre Research Reports 28(5)
208
There are also other threats that affect marine habitats and species in this reserve. The pollution that occurred in the Danube Delta Biosphere Reserve over time has various sources, including improper management of industrial, agricultural and domestic discharge, as well as accidental water pollution (Despina et al. 2020). Russia (Black Sea) Russia has coasts on the Arctic, North Atlantic, and Pacific oceans, and two semi-enclosed seas (the Baltic and Black Seas). An earlier reconstruction of fisheries catches in what was previously the Russian Black Sea EEZ for 1950-2010 was presented by Divovich et al. (2015, 2016). Here, we document how this initial reconstruction was updated to 2014, then carried forward to 2018. The initial reconstruction, which covered the years 1950 to 2010, did not account for the fact that the Crimea (annexed by Russia from the Ottoman Empire in 1783) was a part of Russia until 1954 when it was handed over to Ukraine at a time when both countries were part the Union of Soviet Socialist Republics (USSR). Consequently, its 2014 re-annexation by Russia is not considered here, i.e., fisheries catches around the Crimea are considered Ukrainian catches from 1950 to 2018. This is unsatisfactory; a more elegant solution, which will be implemented in the next update, would be to identify the catches made by Russian, Ukrainian, and Crimea-based vessels around the Crimea (including part of the Sea of Azov) from 1950 to the present, which can then be assigned to either country or none, depending on the framework of the analysis that is performed. Reported data Official marine fisheries catch data were reported by year and taxon for the Black Sea EEZ of Russia by the FAO database and were used here as the reported data baseline. The reported catch was disaggregated into the artisanal and industrial sectors using the same ratios in 2010 from the original reconstruction (Divovich et al. 2015). The overall percentage catch contribution of the industrial and artisanal fisheries to total reported catch was applied to disaggregate the miscellaneous group ‘Marine Fishes nei’. Unreported commercial catch Following Divovich et al. (2015), unreported catch for all taxa were calculated at 150% of reported landings except valuable sturgeon (Acipenser spp.) and turbot (Scophthalmus maximus). The FAO data do not report sturgeon catches for 2011-2014, but it is unlikely that the fishery just stopped. Here, it was assumed that the total reconstructed landings of sturgeon remained at the 2010 level for 2011-2014 following Divovich et al. (2015). The reconstructed catch of turbot from 2010 was used as a baseline, and catch were assumed to increase or decrease in proportion to follow the Turkish trend of FAO-reported turbot catch for 2011-2014 to estimate the unreported catch of turbot. Discards Discards were estimated according to the original reconstruction. Discard rates were estimated by target species, species distributions, and by artisanal and industrial sector categorization (Divovich et al. 2015). Subsistence and recreational Subsistence and recreational catches were derived by applying a per capita consumption rate of fish to a select population.

Updating to 2018 the 1950-2010 marine catch reconstructions of the Sea Around Us: Part I – Africa, Antarctica, Europe and the North Atlantic
209
Estimates of the local Russian population15 were updated to 2014; the ratio of the population living along the the Black Sea coast was maintained at the 2010 ratio. The Russian population living along the Black Sea within urban and rural areas was updated for 2011-2014 based on 52% urban and 47% rural according to Russia’s 2010 census16. Following the methods by Divovich et al. (2015), it was assumed that the tourist population continued to be equivalent to an estimated 25% of the calculated Russian Black Sea population for 2011 to 2014. The recreational catch was calculated based on the assumption that 3% of tourists engaged in recreational fishing and that there was a catch-per-unit-effort of 49 kg, per fishing tourist per year, following the original reconstruction (Divovich et al. 2015). The Organisation for Economic Co-operation and Development (OECD 2013) estimated the annual Russian per capita consumption of fish at 21.2 kg. Following the original methods by Divovich et al. (2015), the proportion of fish consumption caught within the Black Sea by the rural population for subsistence remained at 26% for 2011-2014. Transition from 2014 to 2018 The catch reconstructed to 2014 was carried forward to 2018 using the semi-automated procedures outlined in Noël (2020), based on FAO landings data to 2018. Semi-automated reconstructed catch data will later be replaced by a more detailed, research-intensive update. Marine biodiversity protection Russia has agreed to protect the biological diversity of its waters in the Black Sea through the international Convention on Biological Diversity (Aichi), the United Nations Convention on the Law of the Sea, the Ramsar Convention on Wetlands of International Importance and the World Heritage Convention (Marine Conservation Institute 2020). Russia is also a signatory to the international network of UNESCO Man and the Biosphere, and its commitments extend to intergovernmental organizations such as the Helsinki Commission (HELCOM; Marine Conservation Institute 2020). “The Post-War fishing history of Russia in the Black Sea was additionally characterized by crisis phenomena in the Russian fishery sector manifested in the operation of the Fishery Protection Agencies, serving to control and monitor the harvesting. This resulted in widespread poaching on commercially valuable fish species in coastal waters of the former Soviet Union and within its territorial water area by both Russian and foreign commercial fishermen from the early 1990s onwards” (Fashchuk 2019). Between 1993 and 1994, a number of Presidential Decrees relevant to ‘Integrated Coastal Zone Management’ (ICZM) were adopted. After this, the ICZM considering the Task of Rational Use of Natural Resources in the Black Sea and Adjacent Territory was prepared and approved. Nevertheless, the programme was suspended in 1997 (Vlasyuk 2005). “In the Russian Federation’s legislation, the coastal zone is not yet regarded as an integral, natural ‘land-sea’ complex. Instead, there are various sectoral regulations for the protection and management of coastal and marine resources and various government bodies are responsible for their implementation. This situation is not beneficial for the implementation of an integrated management approach, which is listed in the Maritime Doctrine of Russian Federation 2020 (27 July 2001) as one of the
15 http://www.gks.ru/bgd/regl/b15_12/IssWWW.exe/stg/d01/05-01.htm 16 http://www.gks.ru/free_doc/new_site/perepis2010/croc/perepis_itogi1612.htm

2020 Fisheries Centre Research Reports 28(5)
210
principles of the future national maritime policy (an ‘integrated approach to maritime activities’)” (Goriup 2017). Ukraine Total marine fisheries catches for Ukraine were reconstructed from 1950 to 2010 by Ulman et al. (2015, 2016); this section documents how this initial reconstruction was updated to 2017, then carried forward to 2018. The initial reconstruction did not account for the fact that the Crimea (annexed by Russia from the Ottoman Empire in 1783) was a part of Russia until 1954, when it was handed over to Ukraine at a time when both countries were part the Union of Soviet Socialist Republics (USSR). Consequently, the 2014 re-annexation of Crimea by Russia is not considered here, i.e., all fisheries catches around the Crimea are considered Ukrainian catches from 1950 to 2018. This is unsatisfactory; a more elegant solution, which will be implemented in the next update, would be to identify the catches made by Russian, Ukrainian and Crimea-based vessels around the Crimea (including part of the Sea of Azov) from 1950 to the present, which can then be assigned to either country or none, depending on the framework of the analysis performed. Reported catch Marine fisheries catches were reported by year and taxa by the FAO database on behalf of Ukraine and were considered to solely represent industrial catch. Unreported commercial catch Unreported catches of sturgeon (Acipenser spp.) were assumed to be included from 2009 in the reconstructed catch estimates for each sector and were therefore not reconstructed separately. An additional 20% of unreported industrial landings was assumed in addition to the reported landings for 2011-2017. Catches by the artisanal sector were estimated for 2011-2017 using the methods of Ulman et al. (2015). The number of commercial fishers was calculated for 2011-2017 based on the 2010 ratio of the total Ukrainian population available from the World Bank. The percentage of artisanal fishers was maintained at 60% of total fishers, as for 2010 (Ulman et al. 2015). The 2010 artisanal catch rate of 1.5 t·fisher-1·year-1 was held constant to 2017 and applied to the number of artisanal fishers. Artisanal landings were disaggregated by taxa for 2011-2017 based on the 2010 taxonomic disaggregation. Discards Discards were estimated for artisanal fisheries at 1% of total reconstructed artisanal landings and for industrial fisheries at 1% of reconstructed industrial landings for 2011-2017 based on the original methods used for 2010 (Ulman et al. 2015). Discards were calculated separately for the pelagic trawl fishery for European sprat (Sprattus sprattus), where the 8% discard rate from 2010 was carried forward to 2017. These discards were assumed to be composed of juvenile sprat and whiting (Merlangius merlangus), as described for 2010 by Ulman et al. (2015). Recreational and subsistence fishing Recreational and subsistence fisheries catches were reconstructed for 2011-2017 following the methods of the previous reconstruction (Ulman et al. 2015). The updated number of fishers was estimated at 1% of the Ukrainian population (available from the World Bank). The 2010 catch rate (49 kg·fisher-1·year-1) and the taxonomic disaggregation for recreational and subsistence fishing were carried forward to 2017. The subsistence and recreational catches were split 30% and 70% respectively for 2011-2017 based on 2010 figures.
Updating to 2018 the 1950-2010 marine catch reconstructions of the Sea Around Us: Part I – Africa, Antarctica, Europe and the North Atlantic
211
Illegal fishing The annexation of Crimea by Russia (see above) may have caused a sharp decline in industrial landings in 2014 because total reported catches were at their lowest; the catches have been increasing again since then. While Turkey appears to continue to fish illegally in Ukrainian waters, representatives from both countries formed a Joint Ukrainian-Turkish Committee on Fisheries which recently discussed strategies to combat Illegal, Unreported, and Unregulated (IUU) fisheries in the Black Sea17. Catches from IUU fisheries in Ukrainian waters are reconstructed for Turkey in a separate report (Ulman et al. 2013). Transition from 2017 to 2018 The catch reconstructed to 2017 was carried forward to 2018 using the semi-automated procedures outlined in Noël (2020), based on FAO landings data to 2018. Semi-automated reconstructed catch data will later be replaced by a more detailed, research-intensive update. Marine biodiversity protection Ukraine has agreed to protect its biological diversity through the international agreements of the Convention on Biological Diversity (Aichi), and the Ramsar Convention on Wetlands of International Importance and the World Heritage Convention (Marine Conservation Institute 2020). Ukraine has 20 MPAs and 53 marine managed areas. The MPAs cover 1,427 km2 (Marine Conservation Institute 2020), which equals about 1% of the entire EEZ (132,414 km2; Ulman et al. 2016). The two greatest MPAs are National Biosphere areas, Chernomorskiy (designated in 1927 with a total marine area of 564 km2) and the Danube Delta (designated in 1998 with a total marine area of 109 km2) (Marine Conservation Institute 2020). The two largest Ramsar sites are Eastern Syvash (designated in 1995 with a total area of 1,650 km2) and Karkinitska and Dzharylgatska Bays (designated in 1976 with a total area of 870 km2). The Eastern Syvash site belongs to a National Nature Park and is a shallow water bay that is part of a large coastal lagoon with islets and peninsulas. “The area serves as an important nesting, wintering, molting and staging area for internationally important numbers of various species of water birds and waders. A number of these species are rare, vulnerable or endangered” (Ramsar sites information service 2020a). Karkinitska and Dzharylgatska Bays have the international designation of UNESCO Biosphere Reserve and the national, legal designations of ornithological game reserve, natural reserve and botanical reserve. This site is an embayment of the Black Sea with great importance for migratory and endemic birds providing also nesting habitats. Moreover, “[m]arine mammals include three species of dolphin, all nationally rare, as well as several nationally rare and relic fish species” (Ramsar sites information service 2020b). Results and Discussion Figure 1 presents our reconstructed catches within the Black Sea from all countries for 1950-2018.
17 http://darg.gov.ua/index.php?lang_id=1.&content_id=5695&lp=44

2020 Fisheries Centre Research Reports 28(5)
212
Figure 1. Reconstructed catches within the Black Sea from all countries for 1950-2018 by fishing sectors. The Black Sea is a peculiar body of water. Mighty rivers – the Danube, the Dnieper, Dniester, and the Don and numerous smaller ones – discharge vast quantities of freshwater into the Black Sea. Unlike the Mediterranean, where evaporation increases the salinity of surface water which then sinks and aerates its deeper basins, the low-salinity brackish water of the Black Sea forms a cap on the sea’s surface, and its deeper layers are never aerated. The result is that below 150-200 m depth, the Black Sea contains only anoxic water, which is inhabited only by bacteria. Moreover, the relatively shallow layer of water that contains oxygen and can support metazoans was invaded in the 1980s by a comb jelly (Mnemiopsis leidyi) from the US East Coast which initially had no predator in the Black Sea. By eating the eggs of teleost fish, the comb jelly has had an enormous impact on fish populations. Combined with extremely high fishing pressure from completely unregulated fisheries, this brought about cascading changes in the functioning of the Black Sea ecosystem, resulting in a ‘fished down’ state in the EEZs of all countries surrounding the Black Sea (Daskalov 2002). The large fish (notably sturgeon) are almost entirely gone, as are bluefin tuna (Thunnus thynnus) and bonito (Sarda sarda), both of which historically migrated between the Eastern Mediterranean Sea and the Black Sea. Indeed, even a population of mackerel (Scomber scombrus) migrating between the Black and Marmara Seas was wiped out by overfishing (Pauly and Keskin 2017). In the meantime, a predator for Mnemiopsis leidyi – another comb jelly (Beroe ovata) – has been introduced into the Black Sea, and some semblance of predator-prey dynamic has now been established. We now know that fish populations can recover when the fishing pressure on them recedes, especially when aided by effective marine protected areas (Pascual et al. 2016). Thus, while the Black Sea is currently still in deep trouble, there is no reason why its former glory cannot re-emerge. It is only a matter of us letting nature do her work. Acknowledgments The work involved in the catch updates and carry forwards documented here was supported mainly by the Minderoo Foundation

Updating to 2018 the 1950-2010 marine catch reconstructions of the Sea Around Us: Part I – Africa, Antarctica, Europe and the North Atlantic
213
References (for the Black Sea, then by country) Brown, C. and T. Cashion. 2020. Turkey (Black Sea, Marmara Sea, and Mediterranean Sea): updated catch
reconstruction to 2018, p. 197-204. In: B. Derrick, M. Khalfallah, V. Relano, D. Zeller and D. Pauly (eds). Updating to 2018 the 1950-2010 Marine Catch Reconstructions of the Sea Around Us: Part I – Africa, Antarctica, Europe and the North Atlantic. Fisheries Centre Research Report 28(5).
Brown, C. and S.-L. Noël. 2020. Georgia: Updated fisheries catch reconstruction to 2018, p. 174-178. In: B. Derrick, M. Khalfallah, V. Relano, D. Zeller and D. Pauly (eds). Updating to 2018 the 1950-2010 Marine Catch Reconstructions of the Sea Around Us: Part I – Africa, Antarctica, Europe and the North Atlantic. Fisheries Centre Research Report 28(5).
Cashion, M, N. Bailly and D. Pauly. 2019. Official catch data underrepresent shark and ray taxa caught in Mediterranean and Black Sea fisheries. Marine Policy, 105: 1-9.
Daskalov, G.M. 2002. Overfishing drives a trophic cascade in the Black Sea. Marine Ecology Progress Series, 225: 53-63.
Pascual, M., M. Rossetto, E. Ojea, N. Milchakova, S. Giakoumi, S. Kark, D. Korolesova and P. Melià. 2016. Socioeconomic impacts of marine protected areas in the Mediterranean and Black Seas. Ocean & Coastal Management, 133: 1-10.
Pauly, D., J. Alder, S. Booth, W.W.L. Cheung, V. Christensen, C. Close, U.R. Sumaila, W. Swartz, A. Tavakolie, R. Watson, L.J. Wood and D. Zeller. 2008. Fisheries in Large Marine Ecosystems: Descriptions and Diagnoses, p. 23-40. In: K. Sherman and G. Hempel (eds). The UNEP Large Marine Ecosystem Report: A Perspective on Changing Conditions in LMEs of the World’s Regional Seas. UNEP Regional Seas Reports and Studies No. 182. United Nations Environment Programme, Nairobi, Kenya.
Pauly, D. and Ç. Keskin. 2017. Temperature constraints shaped the migration routes of mackerel (Scomber scombrus) in the Black Sea. Acta Adriatica, 58(2): 339-346.
Sherman, K. and G. Hempel (Eds). 2008. The UNEP Large Marine Ecosystem report: A Perspective on Changing Conditions in LMEs of the World's Regional Seas. UNEP Regional Seas Reports and Studies No. 182. United Nations Environment Programme, Nairobi. 852 p.
Tsikliras, A.C., A. Dinouli and E. Tsalkou. 2013. Exploitation trends of the Mediterranean and Black Sea fisheries. Acta Adriatica, 54(2): 273-282.
Bulgaria Keskin, Ç., A. Ulman, K. Zylich, V. Raykov, G.M. Daskalov, D. Pauly and D. Zeller. 2015. Reconstruction of
fisheries catches for Bulgaria: 1950-2010. Fisheries Centre working paper #2015-20, 18 p. Keskin, Ç., A. Ulman, K. Zylich, V. Raykov, G.M. Daskalov, D. Pauly and D. Zeller. 2016. Bulgaria, p. 211. In:
D. Pauly and D. Zeller (eds). Global Atlas of Marine Fisheries: A critical Appraisal of Catches and Ecosystem Impacts. Island Press, Washington, DC.
Keskin, Ç., A. Ulman, K. Zylich, V. Raykov, G.M. Daskalov, D. Pauly and D. Zeller. 2017. The marine fisheries in Bulgaria’s Exclusive Economic Zone, 1950-2013. Frontiers in Marine Science, 4(53): 1-10. doi.org/10.3389/fmars.2017.00053
Marine Conservation Institute. 2020. MPAtlas [Online]. Seattle, WA. Available at: www.mpatlas.org Noël, S.-L. 2020. Semi-automation procedure for catch reconstruction forward carry, p. 15-20. In: B. Derrick,
M. Khalfallah, V. Relano, D. Zeller and D. Pauly (eds). Updating to 2018 the 1950-2010 Marine Catch Reconstructions of the Sea Around Us: Part I – Africa, Antarctica, Europe and the North Atlantic. Fisheries Centre Research Report 28(5).
Stancheva, M., H. Stanchev, P. Peev, G. Anfuso and A.T. Willliams. 2016. Coastal protected areas and historical sites in North Bulgaria–Challenges, mismanagement and future perspectives. Ocean & coastal management, 130: 340-354.
Romania Bӑnaru, D., F. Le Manach, L. Färber, K. Zylich and D. Pauly. 2016. Romania, p 373. In: D. Pauly and D. Zeller
(eds). Global Atlas of Marine Fisheries: A critical Appraisal of Catches and Ecosystem Impacts. Island Press, Washington, DC.
Bӑnaru, D., F. Le Manach, L. Färber, K. Zylich and D. Pauly. 2015. From bluefin tuna to gobies: a reconstruction of the fisheries catch statistics in Romania, 1950-2010. Fisheries Centre Working Paper #2015-48, 10 p.
Martín, J.I. 2012. The small-scale coastal fleet in the reform of the common fisheries policy. IP/B/PECH/NT/2012_08. Directorate-General for internal policies of the Union. Policy Department B: Structural and Cohesion Policies. European Parliament. 44 p.

2020 Fisheries Centre Research Reports 28(5)
214
Noël, S.-L. 2020. Semi-automation procedure for catch reconstruction forward carry, p. 15-20. In: B. Derrick, M. Khalfallah, V. Relano, D. Zeller and D. Pauly (eds). Updating to 2018 the 1950-2010 Marine Catch Reconstructions of the Sea Around Us: Part I – Africa, Antarctica, Europe and the North Atlantic. Fisheries Centre Research Report 28(5).
Radu, G., V. Maximov, E. Anton, M. Cristea, G. Ţiganov, A. Ţoţoiu and A.D. Spînu. 2013a. State of the fishery resources in the Romanian marine area. Cercetări Marine, 43:268-295.
Radu, G., S. Nicolaev, E. Anton and V. Maximov. 2013b. Evolution of Romanian marine fisheries following EU accession. Cercetări Marine, 43:249-267.
Marine Conservation Institute. 2020. MPAtlas [Online]. Seattle, WA. Available at: www.mpatlas.org Despina, C., L. Teodorof, A. Burada, D. Seceleanu-Odor, I.M. Tudor, O. Ibram, A. Năstase, C. Trifanov, C.
Spiridon and M. Tudor. 2020. Danube Delta Biosphere Reserve—Long-Term Assessment of Water Quality, p. 21-43. In: A.M. Negm, G. Romanescu and M. Zelenáková (Eds). Water Resources Management in Balkan Countries. Springer, Cham.
Teodorescu, D. and M. van den Kommer. 2020. Economic Decline, Fishing Bans, and Obstructive Politics: Is there a Future for Small-Scale Fisheries in Romania’s Danube Delta? p. 47-67. In: J.J. Pascual-Fernández, C. Pita and M. Bavinck (Eds). Small-Scale Fisheries in Europe: Status, Resilience and Governance. Springer, Cham.
Russia (Black Sea) Divovich, E., B. Jovanović, K. Zylich, S. Harper, D. Zeller and D. Pauly. 2016. Russia (Black Sea), p. 376. In: D.
Pauly and D. Zeller (eds). Global Atlas of Marine Fisheries: A critical Appraisal of Catches and Ecosystem Impacts. Island Press, Washington, DC.
Divovich, E., B. Jovanović, K. Zylich, S. Harper, D. Zeller and D. Pauly. 2015. Caviar and politics: A reconstruction of Russia’s marine fisheries in the Black Sea and Sea of Azov from 1950 to 2010. Fisheries Centre Working Paper #2015-84, 24 p.
Fashchuk, D.Y. 2019. The Black Sea Bioresource Potential and Its Exploitation in National Commercial Fisheries in the 20th–21st Centuries. Herald of the Russian Academy of Sciences, 89(6): 584-598.
Goriup, P.D. (ed). 2017. Management of marine protected areas: a network perspective. Wiley-Blackwell, Hoboken, NJ. 312 p.
Marine Conservation Institute. 2020. MPAtlas [Online]. Seattle, WA. Available at: www.mpatlas.org Noël, S.-L. 2020. Semi-automation procedure for catch reconstruction forward carry, p. 15-20. In: B. Derrick,
M. Khalfallah, V. Relano, D. Zeller and D. Pauly (eds). Updating to 2018 the 1950-2010 Marine Catch Reconstructions of the Sea Around Us: Part I – Africa, Antarctica, Europe and the North Atlantic. Fisheries Centre Research Report 28(5).
OECD. 2013. OECD Review of Fisheries: Policies and Summary Statistics 2013. OECD Publishing, Paris. doi.org/10.1787/rev_fish-2013-en
OECD. 2015. OECD Review of Fisheries: Policies and Summary Statistics 2015. OECD Publishing, Paris. 112 p. doi.org/10.1787/9789264240223-en
Vlasyuk, K. 2005. Inventory of Policies and Regulatory Acts and Practices of Its Implementation: Development of Proposals in Sphere of Water Protection, Water Management and Integrated Coastal Zone Management. UNDP-GEF Black Sea Ecosystem Recovery Project, Phase II, Istanbul.
Ukraine Marine Conservation Institute. 2020. MPAtlas [Online]. Seattle, WA. Available at: www.mpatlas.org Noël, S.-L. 2020. Semi-automation procedure for catch reconstruction forward carry, p. 15-20. In: B. Derrick,
M. Khalfallah, V. Relano, D. Zeller and D. Pauly (eds). Updating to 2018 the 1950-2010 Marine Catch Reconstructions of the Sea Around Us: Part I – Africa, Antarctica, Europe and the North Atlantic. Fisheries Centre Research Report 28(5).
Ramsar sites information service. 2020a. Eastern Syvash. Available at: rsis.ramsar.org/ris/769 Ramsar sites information service. 2020b. Karkinitska and Dzharylgatska Bays. Available at:
rsis.ramsar.org/ris/114 Ulman, A., Ş. Bekişoǧlu, M. Zengin, S. Knudsen, V. Ünal, C. Mathews, S. Harper, D. Zeller and D. Pauly. 2013.
From bonito to anchovy: A reconstruction of Turkey's marine fisheries catches (1950-2010). Mediterranean Marine Science, 14(2): 309-342.
Ulman, A., V. Shlyakhov, S. Jatsenko and D. Pauly. 2016. Ukraine, p. 421. In: D. Pauly and D. Zeller (eds). Global Atlas of Marine Fisheries: A critical Appraisal of Catches and Ecosystem Impacts. Island Press, Washington, DC.

Updating to 2018 the 1950-2010 marine catch reconstructions of the Sea Around Us: Part I – Africa, Antarctica, Europe and the North Atlantic
215
Ulman, A., V. Shlyakhov, S. Jatsenko and D. Pauly. 2015. A reconstruction of the Ukraine's marine fisheries catches, 1950-2010. Fisheries Centre Working Paper #2015-86, 23 p.
2020 Fisheries Centre Research Reports 28(5)
216
ISLANDS IN THE NORTH ATLANTIC: UPDATING CATCH RECONSTRUCTIONS TO 2018*
Elaine Chua, Gordon Tsuia, Tim Cashiona, Maria Frias-Donagheya, Rennier Hernandeza, Simon-Luc Noëla,
Sarah Popova, Veronica Relanoa, Eric Sya, Christopher K. Phamb and Telmo Moratob a) Sea Around Us, Institute for the Oceans and Fisheries, University of British Columbia, 2202 Main
Mall, Vancouver, BC, V6T 1Z4, Canada b) Okeanos/IMAR – Instituto do Mar, Departamento de Oceanografia e Pesca, Universidade dos Açores,
Horta, Portugal Abstract This contribution presents updates to 2018 of the fisheries catches initially reconstructed for the years 1950 to 2010 that were taken from the waters around island states and territories in the North Atlantic. This covers the Azores (Portugal), Bermuda (UK), Faeroe Islands (Denmark), Greenland (Denmark), Iceland, Ireland, Jan Mayen (Norway), Svalbard (Norway), and the United Kingdom and the Channel Islands, but excluding Saint Pierre et Miquelon. The International Council for the Exploration of the Sea (ICES), which provides reported landings for catches within most of this area at a greater spatial resolution than the data reported to the FAO, was used as the reported catch data baseline whenever possible. However, neither ICES nor FAO data account for discards. We used fishery specific and gear specific information to estimate the discards and taxonomic composition of discarded catch for 2011-2016 for these islands’ areas, which were also considered in the subsequent carry-forward to 2018, based mainly on ICES and/or FAO landings data. Detailed methods on the catch reconstructions for each of the island’s EEZs are presented in island-specific sections. Introduction This contribution presents updates to 2018 of the fisheries catches initially reconstructed for the years 1950 to 2010 that were taken from the waters around island states and territories in the North Atlantic. This covers the Azores (Portugal), Bermuda (UK), Faeroe Islands (Denmark), Greenland (Denmark), Iceland, Ireland, Jan Mayen (Norway), Svalbard (Norway), and the United Kingdom and the Channel Islands. The French territory of Saint Pierre et Miquelon is covered by Page et al. (2020), and is not addressed here. The updating of these island-specific reconstructions was performed in two steps. The first step involved a detailed update (usually to 2014, 2015 or 2016) based on data from the International Council for the Exploration of the Sea (ICES), Northwest Atlantic Fisheries Organization (NAFO) and/or the Food and Agriculture Organization of the United Nation (FAO) plus other, mostly local, sources. The second step consisted of a carry-forward to 2018 using landing statistics from FAO and/or ICES to 2018. Detailed description of the methods used to update the catch in the Exclusive Economic Zones (EEZs) of the listed North Atlantic islands are given below by island entity.
* Cite as: Chu, E., G. Tsui, T. Cashion, M. Frias-Donaghey, R. Hernandez, S.-L. Noël, S. Popov, V. Relano, E. Sy, C. Pham, and T. Morato. 2020. Islands in the North Atlantic: Updated catch reconstructions for 2011 – 2018, p. 216-231. In: B. Derrick, M. Khalfallah, V. Relano, D. Zeller and D. Pauly (eds). Updating to 2018 the 1950-2010 Marine Catch Reconstructions of the Sea Around Us: Part I – Africa, Antarctica, Europe and the North Atlantic. Fisheries Centre Research Report 28(5).

Updating to 2018 the 1950-2010 marine catch reconstructions of the Sea Around Us: Part I – Africa, Antarctica, Europe and the North Atlantic
217
Methods (by country or territory) Azores Islands (Portugal) An initial reconstruction of the Azores Islands’ marine fisheries catches from 1950 to 2010 was completed by Pham et al. (2013, 2016). This was updated to 2018 by two of the original authors (Chris Pham and Telmo Morato) using local catch statistics, the reconstruction methods described in Pham et al. (2013) and new estimates of discarded fish described in Fauconnet et al. (2019). Recent attention has focused on the work of women in fisheries in the Azores Islands, which had been overlooked and undervalued for many years (Neilson et al. 2019). Future updates to the reconstruction will continue to incorporate new and updated information. Marine biodiversity protection Portugal protects the biological diversity of the Azores through international agreements such us the Convention on Biological Diversity (Aichi) and regional treaties such as Natura 2000. Its commitments equally extend to NGOs and public bodies such as the OSPAR Convention (Marine Conservation Institute 2020). The Azores have nine marine parks: Ilha do Corvo, Ilha das Flores, Ilha do Faial, Ilha do Pico, Ilha do São Jorge, Ilha do Graciosa, Ilha Terceira, Ilha de São Miguel, Ilha de Santa Maria and Marine Park of Azores. Jointly, these marine parks comprise 52 protected areas, which cover a total of 35,487 km2 (3.7%) of the EEZ (955,644 km2; Pham et al. 2013) and 231,127 km2 in the ECS (Extended Continental Shelf, 8,051,544 km2; Peran et al. 2016). The protection levels of these areas vary from IUCN category Ia and Ib in the nine designated Reserves up to the category IV and VI, which correspond to the existing 36 marine protected areas and protected areas for resource management. In the ECS, there are six MPAs belonging to the Marine Park of Azores and one MPA called Josephine Seamount. Two of the biggest MPAs of Portugal, the Submarine archipelago of Meteor and the Marine Protected area of Marna (108,823 km2 and 93,570 km2, Martinez et al. 2017), are situated here. If they were part of the Azores’s EEZ they would constitute 21% of the entire EEZ. Fishing is regulated but not prohibited. As in any multizone MPA, different challenges are associated with fishing. “When fishing effort is very high, the catchability of each gear may be reduced, affecting the expected benefits from protection” (Horta e Costa et al. 2013). Bermuda (United Kingdom) The catch reconstruction of fisheries in Bermuda’s marine waters was carried out for 1950-2010 by Teh et al. (2014) and Divovich et al. (2015, 2016). Here, we updated the catch time series to 2016, followed by a carry-forward to 2018. Reported baseline data Landings reported to the FAO were compared to nationally reported data for 1990-2010. As catch discrepancies were minimal between FAO and nationally sourced data for 1950-2010, FAO data were accepted as the reported baseline for 2011-2016. There are concerns of overexploitation of the Bermudian reef system by the local artisanal fishers. A recent study indicates that it is likely that fishers discount long-term benefits of the resource in favor of extracting all the benefits as soon as possible (Teh et al. 2015), likely exacerbating the overexploited status of the reefs in these waters.

2020 Fisheries Centre Research Reports 28(5)
218
Recreational and subsistence catches The unreported components of Bermudian fisheries consisted of the recreational and subsistence sectors, often tightly bound together (Pitt and Trott 2013). Because there did not appear to be any obvious changes in Bermuda’s fisheries sector since 2010, the method used in Divovich et al. (2015) was carried forward unchanged to reconstruct the combined unreported recreational/subsistence fisheries catches from 2011 to 2016. The portion of the total combined recreational/subsistence catch assigned to subsistence fishing remained constant, as did the unreported recreational catch of Caribbean spiny lobster (Panulirus argus). Population estimates for Bermuda were obtained from the World Bank18 for 2011-2016. The number of foreign vessels participating in recreational billfish tournaments was interpolated for the years between 2011 and 2017 in which there were 22 and 38 visiting vessels respectively (Bermuda Tourism Authority 2018). These data were used to update catches to 2016. Transition from 2016 to 2018 The catch reconstructed to 2016 was carried forward to 2018 using the semi-automated procedures outlined in Noël (2020), based on FAO landings data to 2018. Semi-automated reconstructed catch data will later be replaced by a more detailed, research-intensive update. Marine biodiversity protection The Islands of Bermuda are a British overseas territory and their EEZ’s extent is 450,347 km2 (Divovich et al. 2015). Currently, there are no MPAs in the EEZ of Bermuda (UNEP-WCMC and IUCN 2020). However, Bermuda has a long history (dating back to the 17th century) of proactive and reactive conservation legislation and policy concerning marine resources. In 2010, Bermuda formed the Sargasso Sea Alliance (SSA) with other nations with the aim of evaluating the Sargasso Sea’s ecosystems and species. In 2014, the Sargasso Sea Commission was formed in order to support international collaboration towards marine protection in this area (Smith and Warren 2019). There was an attempt to establish a LMPA (Large Marine Protected Area) by some organizations, including the International Commission for the Conservation of Atlantic Tuna (Laffoley et al. 2011), but after public consultation, a town hall meeting, and an opinion poll, the Bermuda Government did not proceed further and requested more information about potential restrictions and economic costs (Smith and Warren 2019). The Sargasso Sea is an area tightly connected with Bermuda’s people and its rich cultural maritime history (Laffoley et al. 2011). However, some Bermudians were not sure about the LMPA’s benefits, and they were worried about the possible future restrictions of access to these waters’ resources for fisheries and mining (Smith and Warren 2019). The Sargasso Sea’s health is of concern for the international community due to the clear impacts of climate change and other human activities on this area (Smith and Warren 2019). For example, this area is extremely vulnerable to abandoned fishing gear, IUU fishing and purse-seining because nets set close to floating objects, e.g. rafts of Sargassum, take more by-catch (Laffoley et al. 2011). Moreover, “Bermuda is not a signatory to the Convention on Biological Diversity and is not actively pursuing the set goals for 2020. Efforts have been considered to declare parts of Bermuda’s marine environment as ‘Other Areas of Effective Conservation Measures’ (OECM), but the process and affirmation of these designations are still under discussion. […] Recreational fishing remains very loosely controlled, with no licensing or reporting, except for lobster diving and spearfishing, but there must be a significant impact on some species. Cultural heritage concerns appear to
18 www.worldbank.com

Updating to 2018 the 1950-2010 marine catch reconstructions of the Sea Around Us: Part I – Africa, Antarctica, Europe and the North Atlantic
219
preclude robust discussion about the need for regulation of recreational hook-and-line fishing” (Smith and Warren 2019). Faeroe Islands (Denmark) The original reconstruction of the Faeroe Islands’ marine fisheries catches for the years 1950 to 2010 was completed by Gibson et al. (2015, 2016). The following serves to document how this initial reconstruction was updated to 2017, then carried forward to 2018. Reported baseline data Landings from the ICES area outside the Faeroe Islands’ EEZ are now included in the reconstruction for the entire time series. In 2014, the Faeroe Islands agreed to the EU terms of a 40,000 tonnes Atlantic herring (Clupea harengus) catch limit (Anon. 2014). This agreement came after the Faeroe Islands caught over 100,000 tonnes of Atlantic herring in 2013. Recreational and subsistence catches Subsistence and recreational catches for 2011-2017 were calculated following the original methods (Gibson et al. 2015) and using updated World Bank population data. The ICES statistical area proportions as well as the fishing sector proportions and the taxonomic breakdown were carried forward at 2010 levels for 2011 – 2017. Discards were recalculated for the entire time series using methods from Gibson et al. (2015) to include the ICES areas not included in previous reconstruction. The discard rate from 2010 was carried forward for 2011-2017. Transition from 2017 to 2018 The catch reconstructed to 2017 was carried forward to 2018 using the semi-automated procedures outlined in Noël (2020), based on ICES landings data to 2018. Semi-automated reconstructed catch data will later be replaced by a more detailed, research-intensive update. Marine biodiversity protection The Faeroe Islands is a self-governing archipelago that is nominally part of the Kingdom of Denmark. Regarding protection and conservation, the Faroes independently govern protected areas (Hytönen 2020). The Faroes has agreed to protect biological diversity through the international Convention on Biological Diversity (Aichi), the International Convention for the Regulation of Whaling and the Ramsar Convention on Wetlands of International Importance. The country is also a signatory to the Natura 2000 and the Convention on Migratory Species of Wild Animals. Its commitments extend to NGOs and/or public bodies like HELCOM and the OSPAR Convention (Hytönen 2020). In 2018, through the Ramsar convention, the Faroes focused on protecting birdlife from the negative effects of marine traffic. In certain periods of the year boat speeds are regulated and unnecessary noises are prohibited (Hytönen 2020). The islands’ MPAs’ extent is 29 km2 (UNEP-WCMC and IUCN 2020), which is 0.01% of the entire EEZ of the Faroe Islands (267,833 km2; Gibson et al. 2015). Greenland (Denmark) The original reconstruction of marine fisheries catches for Greenland, nominally a territory of Denmark, was completed for 1950 to 2010 by Booth and Knip (2014, 2016).
2020 Fisheries Centre Research Reports 28(5)
220
Reported catch baseline data Information on the spatial distribution of catches in the Atlantic Northwest (FAO Statistical Area 21) from the Northwest Atlantic Fisheries Organization (NAFO) data was incorporated into the reported landings for the entire time series. Catches from the NAFO Area Division 1 were assigned to have been caught within Greenland’s Exclusive Economic Zone (EEZ), whereas catches from the other NAFO area division were assigned to be outside of Greenland’s EEZ. Note that there is an emergence of new fisheries along the east coast of Greenland due to increasing water temperatures from climate change increasing the ice-free areas (Berthelsen 2014, Mackenzie et al. 2014), confirming the scenario in Cheung et al. (2010). Thus, the reported landing of mackerel (Scomber scombrus) was 62 tonnes in 2011 but had increased to 46,623 tonnes by 2017. Similarly, Atlantic herring (Clupea harengus) catches increased from 2,290 tonnes in 2011 to 12,986 tonnes in 2017. However, Greenland’s fisheries still appear not to operate within the Arctic Ocean proper (FAO Statistical Area 18). Commercial fisheries Assignment of reported and unreported catches to artisanal and industrial sectors used the proportions from 2010 based on the original reconstruction (Booth and Knip 2014). Positive adjustments to the amount of Atlantic salmon (Salmo salar) landings were made for 2009-2017 based on information from an ICES Advisory Report (ICES 2018). Discards from reported landings were calculated using the same rates as used in Booth and Knip (2014). Subsistence catches The subsistence catches were estimated using the original methods (Booth and Knip 2014) with updated population estimates from the World Bank for 2011-2017. The subsistence catch for 2010 was recalculated as it had originally been carried forward from the 2009 total unaltered. The average consumption rate and FAO area assignments for 2007-2009 were used and carried forward to 2017. Taxonomic breakdown of subsistence catches remained unchanged at the 2010 ratios for 2011-2017. Transition from 2017 to 2018 The catch reconstructed to 2017 was carried forward to 2018 using the semi-automated procedures outlined in Noël (2020), based on ICES landings data to 2018. Semi-automated reconstructed catch data will later be replaced by a more detailed, research-intensive update. Marine biodiversity protection Greenland, an autonomous territory within the Kingdom of Denmark, has agreed to protect its biological diversity through the international Convention on Biological Diversity (Aichi) and the Ramsar Convention on Wetlands of International Importance. There are 12 designated Ramsar sites (Rigét et al. 2019), including some that cover marine environments. MPAs extent is 102,254 km2 (UNEP-WCMC and IUCN 2020), which is 4.5% of the entire EEZ of Greenland (227,8113 km2; Booth and Knip 2014). Around 90% of the total protected areas extent is covered by five MPAs that are recognized as MPAs according to IUCN-WCPA (Rigét et al. 2019). Greenland also counts with the UNESCO World Heritage Site of Ilulissat Ice fjord and the UNESCO Man & Biosphere Reserve of the National Park in North and Northeast Greenland. Some threats to marine life and ecosystems are related to oil spills and marine wildlife hunting. Management plans and assessment on the global scale and on the national scale have been performed to evaluate the risk of extinction of the seabirds and marine mammals of Greenland. In 2010, harbor seal became completely protected and large whales other than minke and humpback whales are also fully protected. However, very few marine mammals are actually protected in Greenland and most are hunted (Rigét et al. 2019).

Updating to 2018 the 1950-2010 marine catch reconstructions of the Sea Around Us: Part I – Africa, Antarctica, Europe and the North Atlantic
221
“The hunt is regulated by open seasons and quotas for the less numerous species with conservations concerns. Quotas for large whales are set by the International Whaling Commission (IWC), while quotas for narwhal, beluga, and walrus are set taking into consideration local needs and the scientific advice from the Canada/Greenland Joint Commission for the Conservation and Management of Narwhal and Beluga (JCNB) (for narwhal and beluga in West Greenland) and the North Atlantic Marine Mammal Commission (NAMMCO) (for walrus and narwhal in East Greenland). Open seasons for seabirds and quotas for polar bears are established with basis on local needs and scientific advice from the Greenland Institute of Natural resources. Pending on an ongoing bilateral process, the recently formed Canada/Greenland Joint Commission on Polar Bear plans to recommend quotas in 2017 for polar bear hunting for Baffin Bay and Kane Basin” (Rigét et al. 2019). Iceland The original reconstruction of Iceland’s marine fisheries catches was completed for 1950 to 2010 by Valtýsson (2014, 2016). This reconstruction was updated to 2017 as detailed here, then carried forward to 2018. Reported catch baseline data The ICES data were accepted as the reported catch baseline data for the Northeast Atlantic, and NAFO data were accepted as the reported baseline data for the Northwest Atlantic. Icelandic catches were assigned to the EEZ based on which ICES statistical area/EEZ overlapped. If the ICES statistical area overlapped with the Iceland EEZ, it was assumed that the catches were landed within Iceland’s EEZ. In most cases, this procedure followed the methodology and assumptions of the original reconstruction (Valtýsson 2014) and is consistent with the spatially explicit national data. Industrial and artisanal catches The original reconstruction (Valtýsson 2014) used catch by vessel data from Statistics Iceland (Anon. 2019a) to determine the percentage assignment to industrial and artisanal sectors for each taxon. Following the original method, all catch from costal fisheries, undecked boats, and small boats with limited fishing day or catch quotas were assigned to the artisanal sector. Catch from trawlers, decked vessels with catch quotas, and vessels over 50 GRT were assigned to the industrial sector. In the original methods, any boat above 26 GRT was considered to be part of the industrial sector. However, in the national data the lowest category of vessel size was ‘0 - 50 GRT’, and Valtýsson (2014) had not specified how vessels (hook and line boats fishing with catch quota and other quota class boats) ranging from ‘0’ to ‘50 GRT’ were allotted to the artisanal or industrial sectors. The other boat types had their catches assigned overwhelmingly (>90%) to the industrial sector. Thus, all of the catch from these categories were assigned to the industrial sector. These sector breakdown percentages from the national data were then applied to each taxon in the ICES data. For new taxa, based on trends in the original data, molluscs or echinoderms were assigned 100% to artisanal catch, while fishes were assigned 100% to the industrial sector for 2011-2017. Commercial fishing gear Data on catch by gear type from Statistics Iceland (Anon. 2019b) were used to determine the breakdown of gear type used for each taxon in the industrial sector. The ratio of gear per taxon for artisanal catch from 2010 was carried forward to 2017.

2020 Fisheries Centre Research Reports 28(5)
222
Discards Discards were calculated based on the reported catch using the percentages listed in Table 3 of Valtýsson (2014). Discard rates in 2010 were applied to 2017. For newly reported taxa, the discard rate was assigned based on whether or not the taxon was pelagic or demersal. Subsistence fishing Iceland’s subsistence fisheries catches were calculated based on population data and the estimated per capita fish consumption rate. Because no new estimates were found, updated population data were obtained from Statistics Iceland (Anon. 2019c) and the per capita subsistence catch rate was maintained at 22.5 kg of fish per person per year for 2010-2017. The total tonnage was then assigned to taxa using the same proportions as used in the original reconstruction. Recreational fishing For recreational fisheries, a web search was conducted which identified 17 operators offering sea angling trips to tourists in 2019. This number was used as an anchor point to interpolate the number of operators for 2011-2017. Because license regulations remained the same from 2011-2016 (Anon. 2012 - 2017), the number of operators per year for 2011-2016 was multiplied by 60 fishing days a year, each day with 7 recreational fishers, each catching 7 fish per day and each fish weighting 2 kg to tentatively estimate unreported recreational catch amounts. The taxonomic composition was assumed to have remained the same as in 2010. Transition from 2017 to 2018 The catch reconstructed to 2017 was carried forward to 2018 using the semi-automated procedures outlined in Noël (2020), based on ICES landings data to 2018. Semi-automated reconstructed catch data will later be replaced by a more detailed, research-intensive update. Marine biodiversity protection Iceland has agreed to protect its biological diversity through the international Convention on Biological Diversity (Aichi). Its commitments extend to NGOs and/or public bodies like the OSPAR Convention (Marine Conservation Institute 2020). Iceland has 41 MPAs and three marine managed areas. The MPAs’ extent is 2,904 km2, which corresponds to 0.38% of its EEZ (75,6112 km2; Valtýsson 2014). The efforts to fully protect some of its waters dates back to 1965 when the Nature Reserve of Surtey (65 km2; Marine Conservation Institute 2020) was being managed de facto under IUCN category 1a (protected area managed mainly for science, but fishing is allowed within the buffer zone). Since 1965, scientific work in this area is coordinated by the Surtsey Research Society, which also functions as an official guardian of the island. After the declaration of Surtsey Nature Reserve (1974), the Environment and Food Agency of Iceland supported monitoring and enforcement of the regulations (Baldursson and Ingadóttir 2007). In 2006, the reserve was expanded to include the underwater slopes of the volcano and the submarine islets. In 2008, it became a World Heritage site (Claudino-Sales 2019). The area is also protected as a nature reserve according to the Act on Nature Conservation, No. 44/1999 (Baldursson and Ingadóttir 2007). Although the site is highly controlled and visits are prohibited, it is still currently threatened by potential invasive alien species, large vessels, fishing boats, and dumping of waste at sea. Thus, vigilance is required to ensure that oil spills, and the discharge of sewage or solid waste from fishing boats or cruise ships are prevented (Claudino-Sales 2019).

Updating to 2018 the 1950-2010 marine catch reconstructions of the Sea Around Us: Part I – Africa, Antarctica, Europe and the North Atlantic
223
Ireland The original reconstruction of the catch of Ireland’s marine fisheries was completed for the years 1950 to 2010 by Miller and Zeller (2013, 2016). Here, we document the update of this reconstruction to 2017, and its carry-forward to 2018. Reported catch baseline data Updated ICES landings statistics for Ireland from 2011-2017 were used as the baseline reported landings for this update. Tuna and large pelagic fish landings were excluded from this report as they are being reconstructed separately (Coulter et al. 2020). Within each ICES statistical area, ICES landings were spatially assigned to their corresponding EEZ area as per the original reconstruction methods (Miller and Zeller 2013). Within each EEZ area, ICES landings were assigned to sector (industrial and artisanal) and gear type as per the original reconstruction (Miller and Zeller 2013). Unreported landings Unreported landings were updated using the ICES unallocated catch records reported in Ireland’s annual Marine Institute Stock Book (Marine Institute 2016; 2017; 2018). Ireland’s portion of the total unallocated catch was based, for 2011-2017, on the ratio of Ireland’s reported landings to the total reported landings from all fishing entities for each individual stock. Due to limited information on catch rates of Ireland’s recreational anglers, recreational catches were kept constant at 2010 levels. Spatial and taxonomic assignments were also kept constant for the 2011-2017 recreational catches. Discards Discard rates for 2011-2017 were estimated as a proportion of total reported catch, as per the original reconstruction methods (Miller and Zeller 2013). Discard rates per taxon per ICES area were carried forward from 2010, or the most recent year with reported landings. Transition from 2017 to 2018 The catch reconstructed to 2017 was carried forward to 2018 using the semi-automated procedures outlined in Noël (2020), based on ICES landings data to 2018. Semi-automated reconstructed catch data will later be replaced by a more detailed, research-intensive update. Marine biodiversity protection Ireland has agreed to protect its biological diversity through the international Convention on Biological Diversity (Aichi), the United Nations Convention on the Law of the Sea and the Ramsar Convention on Wetlands of International Importance and the World Heritage Convention. The country is also a signatory to Regional Treaties and Agreements such as Natura 2000. Its commitments extend to NGOs and/or public bodies like the Atlantic Arc Network of MPAs (MAIA) and OSPAR Convention (Marine Conservation Institute 2020). Ireland has 242 MPAs and 37 marine managed areas. The MPAs’ extent is 5,081 km2, which occupies 1.2% of the entire EEZ (409,929 km2; Miller and Zeller 2013). Europe’s first Marine Nature Reserve (Cork County Council 2017) was designated in 1981, in West Cork under the Wildlife Act of 1976. It is the only marine area in Ireland that is a no-take area, even though recreational activities like SCUBA and kayaking are permitted (NPWS 2014). It is a giant rock pool that is connected to the sea only on high tides (NPWS 2014), and its varying environmental conditions support a large diversity of flora and fauna communities, which have been the subject of scientific research for over 100 years (Cork

2020 Fisheries Centre Research Reports 28(5)
224
County Council 2017). The gullies, submarine cliffs and ledges of Lough Hyne support diverse assemblages of sponges, corals and anemone (Cork County Council 2017). However, because of the physical characteristics of the reserve, which is nearly land-locked with relatively little tidal exchange of water, the area is very vulnerable to the effects of eutrophication, pollution and other potential threats derived from permitted recreational activities (Department of Art, Heritage and the Gaeltacht 2013). Some of the studies in this area have revealed that the designation of the marine reserve has led to an increase in predatory indicative of a trophic cascade (O’Sullivan and Emmerson 2011). Moreover, the Marine Reserve label does not entitle total protection against non-native species, and management plans for marine reserves should include guidelines for managing and preventing non-native species (Burfeind et al. 2013). Jan Mayen and Svalbard Islands (Norway) Catch reconstructions for the waters around Jan Mayen Island and the Svalbard Islands, covering the years 1950 to 2010, were performed by Nedreaas et al. (2015); see also Nedreaas et al. (2016a, 2016b). The paragraphs below briefly mentions the main features of the updates for these reconstructions to 2018. Norwegian national data from the Directorate of Fisheries were used as the reported baseline for 2011-2018. The catch data are presented in multiple tables with information on catch by taxon, by ICES area and by zone (i.e. EEZ, international waters, etc.). Following the method from the original catch reconstruction, the reported catch was spatialized following the distribution by species and ICES area, then weighted by zone. For example, if some of the catch of a particular species came from an ICES area that overlaps the EEZs of Norway and Russia, but only catch from the Norwegian EEZ was recorded, the catch of this species was allocated solely to Norway’s EEZ in that particular ICES area. Marine biodiversity protection Jan Mayen and Svalbard, as territories under the sovereignty of Norway, have agreed to protect biological diversity through the international agreements of the Convention on Biological Diversity (Aichi) and the Ramsar Convention on Wetlands of International Importance. Its commitments extend to NGOs and/or public bodies like OSPAR Convention (Marine Conservation Institute 2020). MPAs in Jan Mayen and Svalbard together protect 82,714 km2, which equals 7.5% of both EEZs (1,097,000 km2; Nedreaas et al. 2015). Conservation efforts started with single species, i.e., polar bears in 1939 and walrus in 1952. Since 1920, the Norwegian Polar Institute has studied the area, and together with the broader conservation movement of the 1960s informed the subsequent creation of marine protected areas. In 1973, the two biggest nature reserves (Nordaust-Svalbard, Søraust-Svalbard) were established, together with three large national parks (Nordvest-Spitsbergen, Forlandet, Sør-Spitsbergen) and fifteen bird reserves. The philosophy and goals were to offer protection to certain relatively pristine areas while promoting connectivity (Ziaja 2019). The three national parks established in 1973 currently offer a greater protection than others more recently established (The Governor of Svalbard et al. n.d.). Svalbard’s 29 protected areas (National Parks and Nature Reserves) cover 78,000 km2 of territorial waters (94.3% of the total extent of MPAs in Jan Mayen and Svalbard; The Governor of Svalbard et al. n.d). The Nordaust-Svalbard Nature Reserve is the largest protected area in Svalbard (36,691 km2, 44.4% of the MPA’s extent). It embraces the whole of Nordaustlandet and covers the largest glaciers in Norway, the north-eastern part of Spitsbergen, Kvitøya and Kong Karls Land (The Governor of Svalbard et al. n.d.).

Updating to 2018 the 1950-2010 marine catch reconstructions of the Sea Around Us: Part I – Africa, Antarctica, Europe and the North Atlantic
225
The second largest reserve is the Søraust-Svalbard Nature Reserve (15,426 km2, 18.6%), which covers Edgeøya, Barentsøya, Tusenøyane, Ryke Yseøyane and Halvmåneøya. “The Governor of Svalbard is responsible for the day-to-day practical management of the protected areas in Svalbard. The office carries out this work under the direction of the Ministry of the Environment, the Norwegian Directorate for Nature Management, the Directorate for Cultural Heritage and the Norwegian Pollution Control Authority. The Norwegian Polar Institute does not have management authority in Svalbard, but has several important tasks in the archipelago, including mapping, monitoring, advising and performing research” (The Governor of Svalbard et al. n.d.). United Kingdom and Channel Islands (UK) The original reconstructions of the catches of the United Kingdom (UK) and the UK Channel Islands marine fisheries for the years 1950 to 2010 were completed by Gibson et al. (2015); see also Gibson et al. (2016a) and (2016b). Here, we document the update of these reconstructions to 2017 and their carry-forward to 2018. Reported catch baseline data Since the original reconstruction, updated ICES landings statistics have become available to 2017 and were used as the reported baseline. The proportion of reported catch caught within the UK’s Exclusive Economic Zone (EEZ) were determined based on national data obtained through an access to information request to the Marine Management Organization (MMO) of the UK19. Similarly, the proportions of landings by the industrial and artisanal sector were also determined based on the data from the MMO. At the time of the request, the MMO was able to provide information on landings from 2012-2017 only. Thus, the proportions for 2011 were determined by interpolating between the 2010 and 2012 proportions. Discards Since January 1, 2015, the UK has been gradually implementing a phased banning of fish discards. The ban came into full force on January 1, 2019 (House of Lords 2019). However, there is little evidence of the effectiveness of this ban since little effort at enforcement has been made (House of Lords 2019). Therefore, discards have been reconstructed for 2011-2017 using the same percentages as described for 2010 in the original methods (Gibson et al. 2015). Because no new discard rates were available, discard rates for Atlantic scallop (Pecten maximus), Norway lobster (Nephrops norvegicus), cod (Gadus morhua), haddock (Melanogrammus aeglefinus), and mackerel (Scomber scombrus) were carried forward to 2017 at 2010 rates. On the other hand, discard rates for whiting (Merlangius merlangus) and herring (Clupea harengus) were calculated for each ICES area using information from ICES working group reports (ICES 2019a, ICES 2019b). Recreational catches Recreational landings were reconstructed for 2011-2017 using the same methods as the original reconstruction based on the 2010 recreational participation rates in Ireland and updated population information from the World Bank database.
19 https://www.gov.uk/government/organisations/marine-management-organisation

2020 Fisheries Centre Research Reports 28(5)
226
Transition from 2017 to 2018 The catch reconstructed to 2017 was carried forward to 2018 using the semi-automated procedures outlined in Noël (2020), based on ICES landings data to 2018. Semi-automated reconstructed catch data will later be replaced by a more detailed, research-intensive update. Marine biodiversity protection The United Kingdom has agreed to protect its biological diversity through the international agreements of the Convention on Biological Diversity (Aichi) and the Ramsar Convention on Wetlands of International Importance. The country is also a signatory to the Natura 2000. Its commitments extend to NGOs and/or public bodies such as the OSPAR Convention (Marine Conservation Institute 2020). The United Kingdom has 1638 MPAs and 161 marine managed areas (Marine Conservation Institute 2020). However, bottom trawling is allowed in many of these areas. There are few sites with no-take areas such as Lundy, Flamborough Head and Lamlash Bay, which together constitute less than 20 km2 of highly protected areas (Johnson et al. 2019). Currently, the percentage of MPA coverage in the UK’s EEZ appears as follows: Western Channel and Celtic Sea 17.7%, Eastern Channel 21.3%, Southern North Sea 74.1%, Northern North Sea 11.9%, Scottish Continental Shelf 15.2%, Irish Sea 43.9%, Minches and Western Scotland 50.3% and Atlantic North-West Approaches 19.6%. The UK Government created the ‘Blue Belt’ (in 2015) in order to offer marine protection across its 14 Overseas Territories. “By 2020, this initiative will have designated over 4 × 10⁶ km2 of ocean” (Johnson et al. 2019). Under these circumstances, many experts question the real protection that these remote MPAs offer. “Thus, whilst the UK has made exceptional progress with quantitative MPA coverage (and promises ambitious further progress still), it is imperative to substantiate that these areas offer effective protection. The UK has applied OSPAR Commission questions to evaluate progress towards being well managed; namely, whether management is documented, measures are implemented, monitoring is in place and how well the network is moving towards conservation objectives (OSPAR Commission 2017, p. 34). In 2016, whilst shortcomings were acknowledged, partial progress in all four areas was significant and endorsed by a repeat evaluation in 2018. Detailed monitoring strategies have been produced by the JNCC and Marine Scotland (in partnership with the JNCC and Scottish Natural Heritage) to help address this as part of a cost-efficient and integrative approach. Furthermore, the UK has recognized the value of an effective stakeholder process as part of establishing MPA networks, and has made significant efforts to be open and transparent (e.g. House of Commons Environmental Audit Committee 2017; which was critical of the UK Government's communications strategy for both UK and UK Overseas Territories MPAs)’’ (Johnson et al. 2019). Discussion The fisheries catches from the waters that are now the EEZ of all island states and territories in the North Atlantic (except for the French territory of Saint Pierre and Miquelon, a part of the North America section) were reconstructed mainly by local experts for the years 1950 to 2018 (Figure 1). Less local expertise was available for the updates presented here; however, the abundant data publicly available on the fisheries in the North Atlantic in recent years may have compensated for this.

Updating to 2018 the 1950-2010 marine catch reconstructions of the Sea Around Us: Part I – Africa, Antarctica, Europe and the North Atlantic
227
Figure 1. Reconstructed domestic catches by fishing sector for Azores (Portugal), Bermuda (UK), Faeroe Islands (Denmark), Greenland
(Denmark), Iceland, Ireland, Jan Mayen (Norway), Svalbard (Norway), and the United Kingdom and the Channel Islands. Saint Pierre et
Miquelon is excluded here as it is addressed within the North American chapter (Page et al. 2020). While these reconstructions are based mainly on reliable ICES reported ‘catch’ data, it should be noted that discards were not included in ICES data. However, it is important for management that catch statistics include the total removal of each taxa to estimate the true impact of fishing activities on stocks. Here, the discards and previously unreported catch were added mainly from ICES ‘Working Group’ data. We welcome comments and corrections, all of which will be considered and incorporated into the R database and website of the Sea Around Us (www.seaaroundus.org) and in the next documentation of updates. Acknowledgements Funding for the work presented here was provided by the Minderoo Foundation, by the Marisla, Oak, and David and Lucille Packard Foundations, and by the Bloomberg Philanthropies through Rare. References (by country or territory) Page, E., S.-L. Noël and F. Teletchea. 2020. Update to the catch reconstruction of Saint-Pierre et Miquelon
(France) to 2018, p. 140-143. In: B. Derrick, M. Khalfallah, V. Relano, D. Zeller and D. Pauly (eds). Updating to 2018 the 1950-2010 Marine Catch Reconstructions of the Sea Around Us. Part II: The Americas and Asia-Pacific. Fisheries Centre Research Report 28(6).
Azores Island Fauconnet, L., C.K. Pham, A. Canha, P. Afonso, H. Diogo, M. Machete, H.M. Silva, F. Vandeperre and T.
Morato. 2019. An overview of fisheries discards in the Azores. Fisheries Research, 209: 230-241. doi.org/10.1016/j.fishres.2018.10.001
Horta e Costa, B., M.I. Batista, L. Gonçalves, K. Erzini, J.E. Caselle, H.N. Cabral and E.J. Gonçalves. 2013. Fishers’ behaviour in response to the implementation of a marine protected area. PLoS One, 8(6): e65057.
Marine Conservation Institute. 2020. MPAtlas [Online]. Seattle, WA. Available at: www.mpatlas.org Martinez, C., S. Rockel, and C. Vieux. 2017. European Overseas coastal and marine protected areas - overview
of coastal and marine conservation efforts in the European Union’s Overseas Countries and Territories and Outermost Regions. IUCN, Gland, Switzerland. xxvii + 182 p. Available at: portals.iucn.org/library/sites/library/files/documents/2017-047.pdf

2020 Fisheries Centre Research Reports 28(5)
228
Neilson, A.L., R.S. Marcos, K. Sempere, L. Sousa and C. Canha. 2019. A vision at sea: women in fisheries in the Azores Islands, Portugal. Maritime Studies, 18: 385-397.
Noël, S.-L. 2020. Semi-automation procedure for catch reconstruction forward carry, p. 15-20. In: B. Derrick, M. Khalfallah, V. Relano, D. Zeller and D. Pauly (eds). Updating to 2018 the 1950-2010 Marine Catch Reconstructions of the Sea Around Us: Part I – Africa, Antarctica, Europe and the North Atlantic. Fisheries Centre Research Report 28(5).
Peran, A.D., C.K. Pham, P. Amorim, F. Cardigos, F. Tempera and T. Morato. 2016. Seafloor characteristics in the Azores region (North Atlantic). Frontiers in Marine Science, 3(204): 1-4.
Pham, C.K., A. Canha, H. Diogo, J.G. Pereira, R. Prieto and T. Morato. 2013. Total marine fishery catch for the Azores (1950-2010). ICES Journal of Marine Science, 70(3): 564-577.
Pham, C.K., A. Canha, H. Diogo, J.G. Pereira, R. Prieto and T. Morato. 2016. Portugal (Azores), p. 370. In: D. Pauly and D. Zeller (eds). Global Atlas of Marine Fisheries: A critical appraisal of catches and ecosystem impacts. Island Press, Washington D.C.
Bermuda Bermuda Tourism Authority. 2018. Fishing Event Hooks Big Return for Bermuda [Press release]. 26 January,
2018. Available at: www.gotobermuda.com/bta/press-release/fishing-event-hooks-big-return-bermuda Divovich, E., L.C.L. Teh, K. Zylich and D. Zeller. 2015. Updated reconstruction of Bermuda’s marine fisheries
catches, 1950-2010. Fisheries Centre Working Paper #2015-96, 18 p. Divovich, E., L.C.L. Teh, K. Zylich and D. Zeller. 2016. United Kingdom (Bermuda), p. 427. In: D. Pauly and D.
Zeller (eds). Global Atlas of Marine Fisheries: A critical appraisal of catches and ecosystem impacts. Island Press, Washington D.C.
Laffoley, D.D.A., H.S.J. Roe, M.V. Angel, J. Ardron, N.R. Bates, L.L. Boyd, S. Brooke, K.N. Buck, C.A. Carlson, B. Causey, M.H. Conte, S. Christiansen, J. Clearly, J. Donnelly, S.A. Earle, R. Edwards, K.M. Gjerde, S.J. Giovannoni, S. Gulick, M. Gollock, J. Hallett, P. Halpin, R. Hanel, A. Hemphill, R.J. Johnson, A.H. Knap, M.W. Lomas, S.A. McKenna, M.J. Miller, P.I. Miller, F.W. Ming, R. Moffitt, N.B. Nelson, L. Parson, A.J. Peters, J. Pitt, P. Rouja, J. Roberts, J. Roberts, D.A. Seigel, A.N.S. Siuda, D.K. Steinberg, A. Stevenson, V.R. Sumalia, W. Swartz, S. Thorrold, T.M. Trott, V. Vat. 2011. The protection and management of the Sargasso Sea: The golden floating rainforest of the Atlantic Ocean: Summary Science and Supporting Evidence Case. Sargasso Sea Alliance, 44 p.
Noël, S.-L. 2020. Semi-automation procedure for catch reconstruction forward carry, p. 15-20. In: B. Derrick, M. Khalfallah, V. Relano, D. Zeller and D. Pauly (eds). Updating to 2018 the 1950-2010 Marine Catch Reconstructions of the Sea Around Us: Part I – Africa, Antarctica, Europe and the North Atlantic. Fisheries Centre Research Report 28(5).
Pitt, J.M. and T.M. Trott. 2013. Insights from a survey of the recreational fishery in Bermuda. Proceedings of the Gulf and Caribbean Fisheries Institute, 65: 254-261.
Smith, S.R. and T. Warren. 2019. Bermuda and the Sargasso Sea, p. 531-547. In: C. Sheppard (ed). World Seas: An Environmental Evaluation. Academic Press.
Teh, L., K. Zylich and D. Zeller. 2014. Preliminary reconstruction of Bermuda’s marine fisheries catches, 1950-2010. Fisheries Centre Working Paper #2014-24, 17 p.
Teh, L.S.L., L.C.L. Teh, U.R. Sumaila and W. Cheung. 2015. Time discounting and the overexploitation of coral reefs. Environmental Resource Economics, 2015(61): 24.
UNEP-WCMC and IUCN. 2020. Protected Planet: Protected Area Profile for Bermuda from the World Database of Protected Areas, June 2020. Available at: www.protectedplanet.net/country/BM
Faeroe Islands Anon. 2014. EU lifts fish sanctions on Faroe Islands, WTO Dispute closed. International Centre for Trade and
Sustainable Development, 27 August, 2014. Available at: ictsd.iisd.org/bridges-news/biores/news/eu-lifts-fish-sanctions-on-faroe-islands-wto-dispute-closed
Gibson, G., K. Zylich and D. Zeller. 2015. Preliminary reconstruction of total marine fisheries catches for the Faeroe Islands in EEZ-equivalent waters (1950-2010). Fisheries Centre Working Paper #2015-36, 12 p.
Gibson, G., K. Zylich and D. Zeller. 2016. Faeroe Islands, p. 249. In: D. Pauly and D. Zeller (eds). Global Atlas of Marine Fisheries: A critical appraisal of catches and ecosystem impacts. Island Press, Washington D.C.
Hytönen, M. (ed). 2020. Local knowledge in nature conservation management: Situation in Finland, Sweden, Norway, Iceland, Greenland and the Faroe Islands. Natural resources and bioeconomy studies 14/2020. Natural Resources Institute Finland, Helsinki. 66 p.

Updating to 2018 the 1950-2010 marine catch reconstructions of the Sea Around Us: Part I – Africa, Antarctica, Europe and the North Atlantic
229
Noël, S.-L. 2020. Semi-automation procedure for catch reconstruction forward carry, p. 15-20. In: B. Derrick, M. Khalfallah, V. Relano, D. Zeller and D. Pauly (eds). Updating to 2018 the 1950-2010 Marine Catch Reconstructions of the Sea Around Us: Part I – Africa, Antarctica, Europe and the North Atlantic. Fisheries Centre Research Report 28(5).
UNEP-WCMC and IUCN. 2020. Protected Planet: Protected Area Profile for Faeroe Islands from the World Database of Protected Areas, June 2020. Available at: https://www.protectedplanet.net/country/FO
Greenland (Denmark) Berthelsen, T. 2014. Coastal fisheries in Greenland. KNAPK, Nuuk, Greenland. 17 p. Booth, S. and D. Knip. 2014. The catch of living marine resources around Greenland from 1950-2010, p. 55-
72. In: K. Zylich, D. Zeller, M. Ang and D. Pauly (eds). Fisheries catch reconstructions: Islands, Part IV. Fisheries Centre Research Reports 22(2).
Booth, S. and D. Knip. 2016. Greenland, p. 280. In: D. Pauly and D. Zeller (eds). Global Atlas of Marine Fisheries: A critical appraisal of catches and ecosystem impacts. Island Press, Washington D.C.
Cheung, W.W.L., V.W.Y. Lam, J.L. Sarmiento, K. Kearney, R. Watson, D. Zeller and D. Pauly. 2010. Large-scale redistribution of maximum fisheries catch potential in the global ocean under climate change. Global Change Biology, 16: 24-35. doi.org/10.1111/j.1365-2486.2009.01995.x
ICES. 2018. Report of the Working Group on North Atlantic Salmon (WGNAS), 4–13 April 2018, Woods Hole, MA, USA. ICES CM 2018/ACOM:21. 386 p.
MacKenzie, B.R., M.R. Payne, J. Boje, J.L. Høyer and H. Siegstad. 2014. A cascade of warming impacts brings bluefin tuna to Greenland waters. Global Change Biology, 20: 2484–2491.
Noël, S.-L. 2020. Semi-automation procedure for catch reconstruction forward carry, p. 15-20. In: B. Derrick, M. Khalfallah, V. Relano, D. Zeller and D. Pauly (eds). Updating to 2018 the 1950-2010 Marine Catch Reconstructions of the Sea Around Us: Part I – Africa, Antarctica, Europe and the North Atlantic. Fisheries Centre Research Report 28(5).
Rigét, F., A. Mosbech, D. Boertmann, S. Wegeberg, F. Merkel, P. Aastrup, T. Christensen, F. Ugarte, R. Hedeholm and J. Fritt-Rasmussen. 2019. The Seas Around Greenland: An Environmental Status and Future Perspective, p. 45-68. In: C. Sheppard (ed). World Seas: An Environmental Evaluation. Academic Press.
UNEP-WCMC and IUCN. 2020. Protected Planet: Protected Area Profile for Greenland from the World Database of Protected Areas, June 2020. Available at: www.protectedplanet.net/country/GL
Iceland Anon. 2012. Aflahefti Fiskistofu 2011/2012 [Catch Fishery 2011/2012]. Directorate of Fisheries, Reykjavík,
Iceland. 12 p. Anon. 2013. Aflahefti Fiskistofu 2011/2012 [Catch Fishery 2012/2013]. Directorate of Fisheries, Reykjavík,
Iceland. 12 p. Anon. 2014. Aflahefti Fiskistofu 2011/2012 [Catch Fishery 2013/2014]. Directorate of Fisheries, Reykjavík,
Iceland. 12 p. Anon. 2015. Aflahefti Fiskistofu 2011/2012 [Catch Fishery 2014/2015]. Directorate of Fisheries, Reykjavík,
Iceland. 12 p. Anon. 2016. Aflahefti Fiskistofu 2011/2012 [Catch Fishery 2015/2016]. Directorate of Fisheries, Reykjavík,
Iceland. 15 p. Anon. 2017. Aflahefti Fiskistofu 2011/2012 [Catch Fishery 2016/2017]. Directorate of Fisheries, Reykjavík,
Iceland. 16 p. Anon. 2019a. Catch by species, size/type of vessels and quota class 2003-2018. Statistics Iceland, Reykjavik,
Iceland. Available at: px.hagstofa.is/pxen/pxweb/en/Atvinnuvegir/Atvinnuvegir__sjavarutvegur__aflatolur__skipagerd_veidarfaeri/SJA09010.px/?rxid=71df52c0-faf0-4425-bb32-fb59f1d40392
Anon. 2019b. Catch by category of vessels and fishing gear, January 2005 - July 2019. Statistics Iceland, Reykjavik, Iceland. Available at: px.hagstofa.is/pxen/pxweb/en/Atvinnuvegir/Atvinnuvegir__sjavarutvegur__aflatolur__afli_manudir/SJA01102.px/?rxid=71df52c0-faf0-4425-bb32-fb59f1d40392
Anon. 2019c. Population - key figures 1703-2019. Statistics Iceland, Reykjavik, Iceland. Available at: px.hagstofa.is/pxen/pxweb/en/Ibuar/Ibuar__mannfjoldi__1_yfirlit__yfirlit_mannfjolda/MAN00000.px
Baldursson, S. and Á. Ingadóttir (eds). 2007. Nomination of Surtsey for the UNESCO World Heritage List. Icelandic Institute of Natural History, Reykjavík. 123 p.

2020 Fisheries Centre Research Reports 28(5)
230
Claudino-Sales, V. 2019. Surtsey, Iceland, p. 237-242. In: V. Claudino-Sales. Coastal World Heritage Sites. Springer, Dordrecht.
Marine Conservation Institute. 2020. MPAtlas [Online]. Seattle, WA. Available at: www.mpatlas.org Noël, S.-L. 2020. Semi-automation procedure for catch reconstruction forward carry, p. 15-20. In: B. Derrick,
M. Khalfallah, V. Relano, D. Zeller and D. Pauly (eds). Updating to 2018 the 1950-2010 Marine Catch Reconstructions of the Sea Around Us: Part I – Africa, Antarctica, Europe and the North Atlantic. Fisheries Centre Research Report 28(5).
Valtýsson, H. 2014. Reconstructing Icelandic catches from 1950-2010, p. 73-88. In: K. Zylich, D. Zeller, M. Ang and D. Pauly (eds). Fisheries catch reconstructions: Islands, Part IV. Fisheries Centre Research Reports 22(2).
Valtýsson, H. 2016. Iceland, p. 290. In: D. Pauly and D. Zeller (eds). Global Atlas of Marine Fisheries: A critical appraisal of catches and ecosystem impacts. Island Press, Washington D.C.
Ireland Burfeind, D.D., K.A. Pitt, R.M. Connolly, J.E. Byers. 2012. Performance of non-native species within marine
reserves. Biological Invasions, 15: 17–28. doi.org/10.1007/s10530-012-0265-2 Cork County Council. 2017. County Cork Biodiversity Action Plan 2009-2014. Available at:
www.corkcoco.ie/sites/default/files/2017-04/County%20Cork%20Biodiversity%20Plan.pdf Coulter, A., T. Cashion, A. Cisneros-Montemayor, S. Popov, G. Tsui, F. Le Manach, L. Schiller, M. Palomares,
D. Zeller and D. Pauly. 2020. Using harmonized historical catch data to infer the expansion of global tuna fisheries. Fisheries Research, 221:105379. doi.org/10.1016/j.fishres.2019.105379.
Department of Art, Heritage and the Gaeltacht. 2013. Site Synopsis: Lough Hyne Nature Reserve and Environs SAC. National Parks and Wildlife Service (NPWS). Available at: www.npws.ie/sites/default/files/protected-sites/synopsis/SY000097.pdf
Marine Conservation Institute. 2020. MPAtlas [Online]. Seattle, WA. Available at: www.mpatlas.org Marine Institute. 2016. The Stock Book 2016: Annual Review of Fish Stocks in 2016 with Management Advice
for 2017. Fisheries Ecosystems Advisory Services, Galway, Ireland. Marine Institute. 2017.The Stock Book 2017: Annual Review of Fish Stocks in 2017 with Management Advice
for 2018. Fisheries Ecosystems Advisory Services, Galway, Ireland. Marine Institute. 2018. The Stock Book 2018: Annual Review of Fish Stocks in 2018 with Management Advice
for 2019. Fisheries Ecosystems Advisory Services, Galway, Ireland. Miller, D.D. and D. Zeller. 2013. Reconstructing Ireland’s marine fisheries catches: 1950-2010. Fisheries
Centre Working Paper #2013-10, 48 p. Miller, D.D. and D. Zeller. 2016. Ireland, p. 299. In: D. Pauly and D. Zeller (eds). Global Atlas of Marine
Fisheries: A critical appraisal of catches and ecosystem impacts. Island Press, Washington D.C. Noël, S.-L. 2020. Semi-automation procedure for catch reconstruction forward carry, p. 15-20. In: B. Derrick,
M. Khalfallah, V. Relano, D. Zeller and D. Pauly (eds). Updating to 2018 the 1950-2010 Marine Catch Reconstructions of the Sea Around Us: Part I – Africa, Antarctica, Europe and the North Atlantic. Fisheries Centre Research Report 28(5).
NPWS. 2014. Lough Hyne Nature Reserve and Environs SAC: Conservation objectives supporting document - Marine Habitats. National Parks and Wildlife Service (NPWS). Available at: www.npws.ie/sites/default/files/publications/pdf/Lough%20Hyne%20Nature%20Reserve%20and%20Environs%20SAC%20(000097)%20Conservation%20objectives%20supporting%20document%20-%20Marine%20habitats%20[Version%201].pdf
O’Sullivan, D. and M. Emmerson. 2011. Marine reserve designation, trophic cascades and altered community dynamics. Marine Ecology Progress Series, 440:115-125. doi.org/10.3354/meps09294
Jan Mayen and Svalbard (Norway) Marine Conservation Institute. 2020. MPAtlas [Online]. Seattle, WA. Available at: www.mpatlas.org Nedreaas, K., S. Iversen and G. Kuhnle. 2016a. Norway (Jan Mayen), p. 357. In: D. Pauly and D. Zeller (eds).
Global Atlas of Marine Fisheries: A critical appraisal of catches and ecosystem impacts. Island Press, Washington D.C.
Nedreaas, K., S. Iversen and G. Kuhnle. 2016b. Norway (Svalbard), p. 358. In: D. Pauly and D. Zeller (eds). Global Atlas of Marine Fisheries: A critical appraisal of catches and ecosystem impacts. Island Press, Washington D.C.
Nedreaas, K., S. Iversen and G. Kuhnle. 2015. Preliminary estimates of total removals by the Norwegian marine fisheries, 1950-2010. Fisheries Centre Working Paper #2015-94, 15 p.

Updating to 2018 the 1950-2010 marine catch reconstructions of the Sea Around Us: Part I – Africa, Antarctica, Europe and the North Atlantic
231
Nedreaas, K., S. Iversen and G. Kuhnle. 2015. Preliminary estimates of total removals by the Norwegian marine fisheries, 1950-2010. Fisheries Centre Working Paper #2015-94, 15 p.
The Governor of Svalbard, Norwegian Polar Institute, Directorate for Cultural Heritage and Norwegian Directorate for Nature Management. N.d. Protected areas in Svalbard - Securing internationally valuable cultural and natural heritage. Available at: en.visitsvalbard.com/dbimgs/Eng_brosj_SvalbardProtectedareas.pdf
Ziaja, W. 2019. Geographical investigations in the management of the svalbard environment. Quaestiones Geographicae, 38(3): 51-57.
United Kingdom and Channel Islands Gibson, D., E. Cardwell, K. Zylich and D. Zeller. 2015. Preliminary reconstruction of total marine fisheries
catches for the United Kingdom and the Channel Islands in EEZ equivalent waters (1950-2010). Fisheries Centre Working Paper #2015-76, 20 p.
Gibson, D., E. Cardwell, K. Zylich and D. Zeller. 2016a. United Kingdom, p. 424. In: D. Pauly and D. Zeller (eds). Global Atlas of Marine Fisheries: A critical appraisal of catches and ecosystem impacts. Island Press, Washington D.C.
Gibson, D., E. Cardwell, K. Zylich and D. Zeller. 2016b. United Kingdom (Channel Islands), p. 430. In: D. Pauly and D. Zeller (eds). Global Atlas of Marine Fisheries: A critical appraisal of catches and ecosystem impacts. Island Press, Washington D.C.
House of Commons Environmental Audit Committee. 2017. Marine protected areas revisited. Tenth report of session 2016–17. HC 597. Available at: publications.parliament.uk/pa/cm201617/cmselect/cmenvaud/597/597.pdf
House of Lords. 2019. Fisheries: implementation and enforcement of the EU landing obligation. (HL 2017-2019 (276)). The Stationery Office, London.
ICES. 2019a. Whiting (Merlangius merlangus) in Subarea 4 and Division 7.d (North Sea and eastern English Channel). Report of the ICES Advisory Committee, 2019. ICES Advice 2019, whg.27.47d. doi.org/10.17895/ices.advice.4878
ICES. 2019b. Herring Assessment Working Group for the Area South of 62° N (HAWG). ICES Scientific Reports, 1:2. www.ices.dk/sites/pub/Publication%20Reports/Expert%20Group%20Report/Fisheries%20Resources%20Steering%20Group/2019/HAWG/01%20HAWG%20Report%202019.pdf
Johnson, D.E., S.E. Rees, D. Diz, P.J. Jones, C. Roberts and C. Barrio Froján. 2019. Securing effective and equitable coverage of marine protected areas: The UK's progress towards achieving Convention on Biological Diversity commitments and lessons learned for the way forward. Aquatic Conservation: Marine and Freshwater Ecosystems, 29: 181-194.
Marine Conservation Institute. 2020. MPAtlas [Online]. Seattle, WA. Available at: www.mpatlas.org Noël, S.-L. 2020. Semi-automation procedure for catch reconstruction forward carry, p. 15-20. In: B. Derrick,
M. Khalfallah, V. Relano, D. Zeller and D. Pauly (eds). Updating to 2018 the 1950-2010 Marine Catch Reconstructions of the Sea Around Us: Part I – Africa, Antarctica, Europe and the North Atlantic. Fisheries Centre Research Report 28(5).
OSPAR Commission. 2017. 2016 status report on the OSPAR network of marine protected areas. Biodiversity and Ecosystems Series. Publication Number: 693/2017.

2020 Fisheries Centre Research Reports 28(5)
232
BALTIC SEA: UPDATED CATCH RECONSTRUCTIONS TO 2018*
Sarah Popov, Emmalai Page, Maria Frias-Donaghey, Rennier Hernandez and Veronica Relano
Sea Around Us, Institute for the Oceans and Fisheries, University of British Columbia,
2202 Main Mall, Vancouver, BC, V6T 1Z4, Canada Abstract The earlier reconstructions of the marine fisheries catches of Baltic Sea countries for 1950 to 2010 were updated to 2016, then carried forward to 2018. This included the Exclusive Economic Zones (EEZs) of Estonia, Finland, Latvia, Lithuania, Poland, and the Baltic Sea part of the EEZ of Germany, Russia, and Sweden (the Baltic Sea part of Denmark’s EEZ was reported on separately). Although the International Council for the Exploration of the Sea’s (ICES) reported fisheries statistics were considered reliable, discards are not covered; also, unreported landings can be substantial. The unreported landings and associated discards of select commercially target species such as Atlantic salmon (Salmo salar), European sprat (Sprattus sprattus), and European flounder (Platichthys flesus) were estimated primarily by reports from the ICES Baltic Fisheries Assessment Working Group. The assumptions and other details of the updates are presented in country-specific sections. Introduction The earlier reconstruction of the marine fisheries catches of Baltic Sea countries for 1950 to 2010 (summarized for 1950-2007 in Zeller et al. 2011) was updated to 2016, then carried forward to 2018. This included Exclusive Economic Zones (EEZs) of Estonia, Finland, Latvia, Lithuania, Poland, and the parts of the EEZ of Germany, Russia, and Sweden that are in the Baltic Sea. The Baltic Sea part of Denmark’s EEZ is reported on by Brown et al. (2020). Although the reported fisheries statistics from the International Council for the Exploration of the Sea (ICES) were considered reliable, discards are not covered; also, unreported landings can be substantial. The unreported landings and associated discards of select commercially targeted species such as Atlantic salmon (Salmo salar), European sprat (Sprattus sprattus), and European flounder (Platichthys flesus) were estimated mainly using reports from the ICES Baltic Fisheries Assessment Working Group. The Baltic Sea reconstructions and their updates below do not include ‘discards’ from ghost fishing, underwater discards, or seal-damaged discards (‘depredation’), even though they are often mentioned in ICES Working Group Reports. The assumptions and other details of the updates are presented in country-specific sections below. Estonia The original reconstruction of Estonia’s marine fisheries catches was undertaken by Viech et al. (2010), partly based on Ojveer (1999), and covered the years 1950-2007. It was updated to 2010 by Zeller et al. (2011); see Viech et al. (2016). Here, we document how this work was updated to 2017, then carried forward to 2018.
* Cite as: Popov, S., E. Page, M. Frias-Donaghey, R. Hernandez and V. Relano. 2020. Baltic Sea: Updated catch reconstructions to 2018, p. 232-250. In: B. Derrick, M. Khalfallah, V. Relano, D. Zeller and D. Pauly (eds). Updating to 2018 the 1950-2010 Marine Catch Reconstructions of the Sea Around Us: Part I – Africa, Antarctica, Europe and the North Atlantic. Fisheries Centre Research Report 28(5).

Updating to 2018 the 1950-2010 marine catch reconstructions of the Sea Around Us: Part I – Africa, Antarctica, Europe and the North Atlantic
233
Reported catch baseline data ICES landings statistics for Estonia from 2011-2017 were accepted as the reported baseline landings; retroactive changes were not made to account for small differences in previous years between the 2017 ICES dataset and earlier data versions. Catch data were spatially assigned to inside and outside of Estonia’s Exclusive Economic Zone (EEZ) using spatial allocations from the 1950-2007 reconstruction (Zeller et al. 2011) and the 2008-2010 update (Veitch et al. 2010). Industrial vs. artisanal fisheries The reported data were split between the artisanal and industrial sectors using the same ratio of artisanal to industrial catch as in the previous reconstruction. In ICES areas not overlapping with Estonia’s EEZ (Areas III d 24, 25, 26, and 27), catches were assigned as 100% industrial; in ICES areas overlapping with Estonia’s EEZ (Areas III d 28, 28.1, 28.2, 29 and 32), catches were split between 9% artisanal and 91% industrial. Of the 91% catch assigned to the industrial sector in the latter ICES areas, catch was spatially assigned to Estonia’s EEZ (“Estonia”) and outside of Estonia’s EEZ (“Outside of EEZ”) within each subarea. Overall, the catches in subareas 28, 28.1, 28.2, 29, and 32 were split as 28.3% within Estonia’s EEZ and 71.7% outside. Note that in the 2008-2010 update (Veitch et al. 2016), all taxa except for cod (Gadus morhua) follow the 9% - 91% artisanal-industrial split. However, since cod was split 9%-91% earlier (1950 to 2007, Zeller et al. 2011), as were all other taxa, here, we returned to splitting cod catches into 9% artisanal and 91% industrial. Taxonomic considerations Catch statistics were adjusted for sea trout (Salmo trutta) according to data from the 2015 Report of the Baltic Salmon and Trout Assessment Working Group, which showed slightly higher landings of sea trout by Estonia than were reported in the ICES data (ICES 2015). This was considered to be unreported but legal catch. All unreported landings were calculated using the 2007-2010 carry forward rates. If the taxon did not appear in the previous reconstruction, the default unreported rate of 11.2% was applied. The recreational catch by taxon was linearly extrapolated forward to 2017 from the 2010 anchor points and divided into ICES area subdivisions using the 2010 ratios. Discards Discard rates were held constant from the previous 2007-2010 period and were applied equally to both the industrial and artisanal sectors. In the case of Atlantic salmon (Salmo salar), the previous 1950-2010 discard rate of 2% was applied, and the zero-discard rate for Atlantic herring (Clupea harengus) was continued. The default discard rate of 6.2% was applied to any taxon not a part of the 1950-2010 reconstruction. From 2015 to 2019, the European Union phased in its reformed Common Fisheries Policy on Landing Obligation with the goal of reducing marine fisheries discard rates. The impacts of this on Estonia’s fisheries are still to be determined (Guillen et al. 2018; Uhlmann et al. 2019). Transition from 2017 to 2018 The catch reconstructed to 2017 was carried forward to 2018 using the semi-automated procedures outlined in Noël (2020), based on ICES landings data to 2018. Semi-automated reconstructed catch data will later be replaced by a more detailed, research-intensive update. Marine biodiversity protection Estonia has agreed to protect its biological diversity through the international Convention on Biological Diversity (Aichi) and the Ramsar Convention on Wetlands of International Importance. The country is also a

2020 Fisheries Centre Research Reports 28(5)
234
signatory to Regional Treaties and Agreements such as Natura 2000. Its commitments extend to NGOs and/or public bodies like the Helsinki Commission (HELCOM; Marine Conservation Institute 2020). The main goal of the HELCOM Baltic Sea Protected Areas (BSPAs) is to protect valuable marine and coastal habitats in the Baltic Sea. This is done by designating areas of particular natural value as protected areas and by managing human activities within those areas (HELCOM 2003). Estonia has 418 MPAs and nine marine managed areas. The MPAs cover 6,698 km2, i.e., 18.3% of the entire EEZ (3,6512 km2; Veitch et al. 2010). One of the largest MPAs in these waters is the Väinameri Baltic Sea Protected Area, which has 2,288 km2 of reported marine area and represents 34.2% of the whole area of Estonian MPAs (Marine Conservation Institute 2020). In the 1990s, the transition from the Soviet system to a free-market economy had negative effects on small-scale fisheries. To this day the sector is characterized by low incomes (Plaan 2020). Nowadays, “the self-organisation in community of practice among coastal fishers is slowly progressing by negotiating common resources and voicing concerns about ecological, economic, and social sustainability” (Printsmann et al. 2019). Finland The original reconstruction of the catches of Finland’s Baltic Sea marine fisheries was performed for the years 1950 to 2007 by Rossing et al. (2010) and updated to 2010 by Rossing et al. (2016). This account presents the steps undertaken to update this reconstruction to 2017 and carry it forward to 2018. Reported catch baseline data The ICES landings statistics for Finland in the Baltic Sea area associated with Finland (ICES area III d), used in previous updates were adjusted to match national data provided by the Finnish Game and Fisheries Research Institute (FGFRI). Minor retroactive changes to ICES landings statistics from 1950-2010 were not accounted for in this update; the FGFRI data, as spatially allocated by ICES area, were accepted as the new baseline. It should be noted that all taxa present in the national data were also accounted for in the ICES data, except for the introduced rainbow trout (Oncorhynchus mykiss). In this case, ICES data for “Trouts nei” roughly matched catch statistics for Oncorhynchus mykiss in the national data. The category “Trouts nei” was therefore treated as corresponding to rainbow trout. Industrial vs. artisanal fisheries Catch data were spatially assigned to inside and outside of Finland’s Exclusive Economic Zone (EEZ) using the spatial assignments from the 1950-2007 reconstruction and first update. Reported data were split into artisanal and industrial sectors using the same ratio used in the previous reconstruction. In ICES areas not overlapping with Finland’s EEZ (Areas III d 24-28), catch was assigned as 100% industrial; in ICES areas overlapping with Finland’s EEZ (Areas III d 29-32), catch was split 9% artisanal and 91% industrial. The 91% industrial catch for these subareas was spatially assigned as either within Finland’s EEZ (“Finland”) or outside of Finland’s EEZ (“Outside of EEZ”) for each subarea. For the unreported component of this reconstruction, species specific unreported landings rates were taken from the Baltic Fisheries Assessment Working Group (WGBFAS, ICES 2018a) and the Baltic Salmon and Trout Assessment Working Group (WGBAST, ICES 2018b) where applicable. For taxa for which no specific information was available, the default Baltic Sea unreported landings rate of 11.2% was applied.

Updating to 2018 the 1950-2010 marine catch reconstructions of the Sea Around Us: Part I – Africa, Antarctica, Europe and the North Atlantic
235
Discards Most discards were estimated using the Baltic-wide standard rate of 6.24% discards, which was here applied equally to the industrial and artisanal sectors. Updated species-specific discard rates were taken either from the WGBFAS report (ICES 2018a) and applied where available or carried forward from the years prior. Atlantic herring (Clupea harengus) and European sprat (Sprattus sprattus) both had discard rates of zero because of the WGBFAS indication that herring and sprat discards were negligible (ICES 2018a). Data from the WGBAST report (ICES 2018b) were used to recalculate and update the discard rate for Atlantic salmon (Salmo salar) from 1982 onwards. For taxa without updated information, the standard 6.24% discard rate was applied. Recreational catches The FGFRI20 carries out surveys to estimate recreational landings in Finnish waters every two years, the results of which were accepted as reported recreational landings. For the years in- between FGFRI data estimates a linear interpolation of reported data was done. The data were assigned to the same ICES areas as in the FGFRI data. For the year 2017, the recreational landings were carried forward from the 2016 FGFRI data. Transition from 2017 to 2018 The catch reconstructed to 2017 was carried forward to 2018 using the semi-automated procedures outlined in Noël (2020), based on Finnish Game and Fisheries Research Institute (FGFRI) and ICES landings data to 2018. Semi-automated reconstructed catch data will later be replaced by a more detailed, research-intensive update. Marine biodiversity protection Finland has agreed to protect its biological diversity through the international Convention on Biological Diversity (Aichi) and the Ramsar Convention on Wetlands of International Importance. The country is also a signatory to Regional Treaties and Agreements such as the Natura 2000. Its commitments extend to NGOs and/or public bodies like the Helsinki Commission (HELCOM) (Marine Conservation Institute 2020). The main goal of the HELCOM Baltic Sea Protected Areas (BSPAs) is to protect valuable marine and coastal habitats in the Baltic Sea. This is done by designating suitable areas of particular value as protected areas and by managing human activities within those areas (HELCOM 2003). In Finland, maritime spatial planning (MSP) was included in the Land Use and Building Act of 2016, and the preparation of the plans started in the same year. Some of the planning themes are fisheries and aquaculture, nature protection, cultural heritage, recreational use and improvement of environment (Hytönen 2020). “Finland’s eight coastal regions will develop three maritime spatial plans by the end of March 2021. The plans will cover 1) the Gulf of Finland 2) the Archipelago Sea and southern Bothnian Sea, and 3) the northern Bothnian Sea, Kvarken and Bothnian Bay. The Åland Islands will compile its own plan” (Hytönen 2020). In Finland, science-based and hierarchical modes of governance are the approaches that are used in conservation and decision making in fisheries and environmental issues (Salmi et al. 2020). Finland has 1578 MPAs and 14 marine managed areas. The MPAs’ extent is 7,525.4 km2, which occupies 9.23% of the entire EEZ (81,522 km2, Rossing et al. 2010).
20 https://stat.luke.fi/en/recreational-fishing

2020 Fisheries Centre Research Reports 28(5)
236
“Since the 1930s Finland has systematically built a comprehensive protected area network that has become an important part of the growing terrestrial and marine networks in Northern Europe” (Marine Conservation Institute 2020). One of the Finnish MPAs is the Archipelago Sea Biosphere Reserve (ABR), situated in Southwestern Finland in the Baltic Sea within the Archipelago Sea National Park, which is one of the most popular national parks in Finland with around 80,000 visitors/year. Since 1994 it has been part of the UNESCO’s Man and Biosphere program and has stood out for its rich biodiversity and culturally valuable environments. The ABR’s marine extent is 4,580 km2, which occupies about 61% of the total area of Finish MPAs, and it has three different zones for conservation purposes: the collaboration zone, the core zone, and the buffer zone around the core one (Viirret et al. 2019). Germany (Baltic Sea) The original reconstruction of the catches of marine fisheries in the Baltic Sea part of Germany’s EEZ was performed for the years 1950 to 2007 by Rossing et al. (2010) and updated to 2010 by Zeller et al. (2011); see Rossing et al. (2016). This account summarizes how this reconstruction was updated to 2017 and carried forward to 2018. Reported catch baseline data ICES landings statistics for Germany in the Baltic Sea (ICES areas III b, c, and d) used for years 2011-2017 were accepted as baseline landings. Minor retroactive changes in ICES catch statistics from 1950-2010 were not accounted for. Catch data were spatially assigned to inside and outside of Germany’s EEZ for 2011-2017 using the spatial assignments from the 1950-2007 reconstruction and its update to 2010. Reported data were split into sectors (artisanal and industrial) using the same ratio of artisanal to industrial catch as in the previous reconstruction. In ICES areas outside Germany’s EEZ (23, 25-32), catch was assigned as 100% industrial; in ICES areas within Germany’s EEZ, catch was split 9% artisanal and 91% industrial. The 91% industrial catch was spatially assigned to within Germany’s EEZ (“Germany (Baltic)”) and outside of Germany’s EEZ (“Outside of EEZ”). The catch in subarea 22 was split 28.4% within Germany’s EEZ; the catch in subarea 24 was split 43.2% within Germany’s EEZ. Recreational fishing Since no recent statistics on marine recreational fisheries by the German government or another entity were identified, the catches of recreational fishers were extrapolated in proportion to reported catch from 2010. Under-reported species Catch statistics were adjusted for European sprat (Sprattus sprattus) for the years 2011-2013 based on stock assessment data from the Baltic Fisheries Assessment Working Group (WGBFAS, ICES 2015), which reported between 31 and 122 extra tonnes of catch. This extra catch was split spatially, by year, into different subareas using the same ratios as the overall sprat catch reported by the ICES Working Group. This was considered unreported but legal catch. Nearly all taxa in the previous reconstruction had the Baltic-wide standard unreported landings rate of 11.2% applied, as derived from Rossing et al. (2010a). This standard rate was lowered to 6.5% to reflect updated information in the 2015 WGBFAS report stating that “Misreporting significantly declined in 2008-2009 and amounted to 6-7%,” (ICES 2015). All species except for higher-value species including Atlantic cod (Gadus morhua), Atlantic salmon (Salmo salar), European sprat (Sprattus sprattus), and certain flatfishes (Pleuronectiformes) were carried forward with the updated 6.5% unreported landings rate. For other species,

Updating to 2018 the 1950-2010 marine catch reconstructions of the Sea Around Us: Part I – Africa, Antarctica, Europe and the North Atlantic
237
the previous 2008-2010 unreported landings rate was used for 2017 because no updated information was found pertaining to the unreported landings of these species. Discards The discard rates were held constant from the 2008-2010 time period and were applied equally to both the industrial and artisanal sectors. Transition from 2017 to 2018 The catch reconstructed to 2017 was carried forward to 2018 using the semi-automated procedures outlined in Noël (2020), based on ICES landings data to 2018. Semi-automated reconstructed catch data will later be replaced by a more detailed, research-intensive update. Marine biodiversity protection Germany has agreed to protect biological diversity of the Baltic Sea through the international Convention on Biological Diversity (Aichi), United Nations Convention on the Law of the Sea, the Ramsar Convention on Wetlands of International Importance and the World Heritage Convention (Marine Conservation Institute 2020). Germany is also a signatory to Regional Treaties and Agreements such as the Regional Seas Convention, Natura 2000, and it is also part of the international network of UNESCO Man and the Biosphere. Its commitments extend to intergovernmental organization such as the OSPAR Convention and the Helsinki Commission (HELCOM; Marine Conservation Institute 2020). Germany was the first EU Member State to nominate a list of ten Natura 2000 marine sites to the European Commission (in 2004) (Pike et al. 2004). “Conflict between fishing activities and conservation objectives continue to pose a problem across the Natura 2000 sites, and there remain only two “zero-use” reserves in the country’s waters” (Pike et al. 2004). Germany has 233 MPAs and 13 marine managed areas between the Baltic and the North Sea. The MPAs’ extent together with nature conservation areas and conservation features in the Baltic is 6,278 km2 (BfN 2020), and they occupy 41% of the German Baltic EEZ (15,465 km2; Rossing et al. 2016). Germany’s Baltic EEZ supports many species of commercial and ecological interest. In an assessment carried out in 2016, the estimated abundance of harbour porpoises (Phocoena phocoena) was 549 individuals, which is a density of 0.05 individuals·km-², much lower than the numbers of the German North Sea populations (0.70 individuals·km-², Nachtsheim et al. 2019). The larger vessels that fish in the Baltic Sea are equipped with (pelagic) trawls, while the smaller ones predominantly use passive fishing gear such as set nets. Generally, vessels are smaller than in the North Sea. “The main fishing method used by 88 percent of the German fishing vessels registered in the Baltic Sea comprises (anchored) set nets, whereas about 9% are recorded as using trawls” (BfN 2020b). Moreover, debris and pollution are still unresolved issues. A study on marine mammals stranded in Germany’s beaches (both North Sea and Baltic Sea) suggested that “0.5 % of all carcasses collected between 1990–2014 showed external or internal marine debris findings. 64.9% of all findings were fishing related debris and 35.1% were objects that comprised general debris” (Unger et al. 2017) Latvia The original reconstruction of the catches of marine fisheries in the EEZ of Latvia was performed for the years 1950 to 2007 by Rossing et al. (2010) and was updated to 2010 by Rossing et al. (2016). This account documents the update of this reconstruction to 2017 and the carry-forward to 2018.

2020 Fisheries Centre Research Reports 28(5)
238
Reported catch baseline data ICES landings statistics for Latvia were accepted as the baseline landings for this update. Minor retroactive changes to the ICES catch statistics were not accounted for. Catch data were spatially assigned to inside and outside Latvia’s Exclusive Economic Zone (EEZ) using the previous spatial assignments from the 1950-2007 reconstruction and its earlier update. Reported data were split into two sectors (artisanal and industrial) using the same ratio of artisanal to industrial catch used in the previous reconstruction. In ICES areas not overlapping with Latvia’s EEZ (Areas III d 22, 24, 25, 27, 29, and 32), catch was assigned as 100% industrial; in ICES areas overlapping with Latvia’s EEZ (Areas III d 26, 28, 28.1, and 28.2), the catch was split into 9% artisanal and 91% industrial. Of the 91% industrial catch (Areas III d 26, 28, 28.1, and 28.2), some was allocated to either within Latvia’s EEZ (‘Latvia’) or outside Latvia’s EEZ (‘Outside of EEZ’) for each subarea. The catch in subarea 26 was split 15.3% within Latvia’s EEZ and 84.7% outside Latvia’s EEZ, while catch in subareas 28, 28.1, and 28.2 was split into 40.9% within Latvia’s EEZ and 59.1% outside Latvia’s EEZ. Recreational catch Recreational catches, by taxon, were linearly extrapolated forward to 2017 from the 2010 anchor point and divided into ICES area subdivisions using the 2010 ratios. Under-reported species The catch statistics for European sprat (Sprattus sprattus) were adjusted according to data from the Baltic Fisheries Assessment Working Group (WGBFAS, ICES 2015), which reported 292 extra tonnes of catch in subarea 28 for 2011 not reported in the original ICES data (ICES 2015). This was considered to be unreported but legal catch. Unreported landings were calculated using the 2007-2010 rates. If a taxon did not exist in the previous reconstruction, the default rate of 11.2% of unreported landings was applied. The only taxa to which the standard 11.2% rate was not applied were Atlantic cod (Gadus morhua; 75%), Atlantic salmon (Salmo salar; 21.4%), and Atlantic herring (Clupea harengus; 13.3%). Note that the 13.3% unreported landings rate for herring is unique to the Latvia reconstruction when compared with other Baltic states. Discards Most discard rates were held constant from the previous 2007-2010 period and were applied equally to both the industrial and artisanal sectors. Atlantic cod (Gadus morhua) did not have a consistent discard rate from 2007-2010; therefore, the average discard rate for the years 2007-2010 (11.3%) was used. Several taxa had either no discard rate or sudden drastic changes in discard rate from one year to the next but without information about why the rates were changed; this applied particularly to European smelt (Osmerus eperlanus), European perch (Perca fluviatilis), Atlantic salmon (Salmo salar), and turbot (Scopthalmus maximus). In these cases, either the standard discard rate of 6.24% or the 2007 discard rate from the original reconstruction was applied. As was the case with unreported landings, the default discard rate of 6.24% was applied for any taxon not part of the 1950-2010 reconstruction. Transition from 2017 to 2018 The catch reconstructed to 2017 was carried forward to 2018 using the semi-automated procedures outlined in Noël (2020), based on ICES landings data to 2018. Semi-automated reconstructed catch data will later be replaced by a more detailed, research-intensive update.

Updating to 2018 the 1950-2010 marine catch reconstructions of the Sea Around Us: Part I – Africa, Antarctica, Europe and the North Atlantic
239
Marine biodiversity protection Latvia has agreed to protect its biological diversity through the international Convention on Biological Diversity (Aichi) and is also a signatory to Regional Treaties and Agreements such as the Natura 2000. Its commitments extend to intergovernmental organization such as the Helsinki Commission (HELCOM; Marine Conservation Institute 2020). Between 2015 and 2016, a long-term Maritime Spatial Plan development was carried out which included Internal Waters, Territorial Waters and Economic Exclusive Zone of the Republic of Latvia. This Plan incorporated an assessment of ecosystem services in order to provide stakeholders and policymakers with a strategic framework. The approach aimed to address a complex social–ecological system in a spatially explicit manner (Veidemane et al. 2019). Latvia has 39 MPAs and two marine managed areas. The MPAs’ extent is 4472 km2 (Marine Conservation Institute 2020), which occupies 15.4% of the entire EEZ (28,986 km2; Rossing et al. 2010). One of the biggest MPAs in these waters is called Irbes Šaurums (designated in 2010), which covers 1724 km2 (Marine Conservation Institute 2020), representing 38.6% of all protected areas. The management authority is the Ministry of Environmental Protection and Regional Development (Marine Conservation Institute 2020). Lithuania The original reconstruction of Lithuania’s Baltic Sea marine fisheries catches for 1950-2007 was performed by Veitch et al. (2010) and updated to 2010 by Veitch et al. (2016). The account below presents a further update to 2017 and its carry-forward to 2018. Reported catch baseline data ICES landings statistics for Lithuania in ICES subarea III d for 2011-2017 were accepted as the reported baseline data. Because only statistics from III d were used, the catch of herring (Clupea harengus) reported in ICES subarea III a (Skagerrak and Kattegat) was not included here; neither did we consider minor retroactive changes in ICES landings statistics for 1950-2010. Catch data were spatially assigned to inside and outside Lithuania’s EEZ using the spatial assignments from the 1950-2007 reconstruction and its 2008-2010 update. Reported data were split into two sectors (artisanal and industrial) using the same ratio of artisanal to industrial catch as in the previous reconstructions. In ICES areas outside Lithuania’s EEZ (Areas III d 24, 25, 27, 28, and 29), catch was considered 100% industrial; in ICES areas within Lithuania’s EEZ (Area III d 26), catch was split into 9% artisanal and 91% industrial. Of the 91% industrial catch, 15.1% was allocated to within Lithuania’s EEZ (“Lithuania”) and 84.9% was allocated to outside Lithuania’s EEZ (“Outside of EEZ”) in subarea 26. Catch statistics were adjusted for European sprat (Sprattus sprattus) according to data from the Baltic Fisheries Assessment Working Group (WGBFAS, ICES 2015), which reported several hundred extra tonnes of sprat catch in 2012 and 2013 in ICES subareas 24-29 compared to ICES data (ICES 2015). This was considered to be unreported but legal catch. Unreported landings and recreational catch Unreported landings were calculated using the 2008-2010 rates. If a taxon did not exist in the previous reconstruction, the default rate of 11.2% was applied. The only species to which the standard 11.2% unreported landings rate was not applied were Atlantic cod (Gadus morhua, 75%) and Atlantic salmon (Salmo salar, 21.4%).

2020 Fisheries Centre Research Reports 28(5)
240
Recreational catches by taxon were linearly extrapolated forward to 2017 from the 2010 anchor point and divided into ICES area subdivisions using the 2010 ratios. Discards Discard rates were held constant from the 2008-2010 period and were applied to both the industrial and artisanal sectors. The default discard rate of 6.24% was applied to any taxa not part of the 1950-2010 reconstruction. It should be noted that while all other Baltic countries had discards calculated for Atlantic cod, the Lithuania reconstruction used a discard rate of zero. Transition from 2017 to 2018 The catch reconstructed to 2017 was carried forward to 2018 using the semi-automated procedures outlined in Noël (2020), based on ICES landings data to 2018. Semi-automated reconstructed catch data will later be replaced by a more detailed, research-intensive update. Marine biodiversity protection Lithuania has agreed to protect its biological diversity through the international Convention on Biological Diversity (Aichi), and it is also a signatory to Regional Treaties and Agreements such as the Natura 2000. Its commitments extend to intergovernmental organization such as the Helsinki Commission (HELCOM; Marine Conservation Institute 2020). The project “Marine Protected Areas in the Eastern Baltic Sea” (Baltic MPAs) was implemented by the Baltic Environmental Forum-Latvia and supported by the European Commission LIFE programme since 1st August 2005 until 31st July 2009 (Marine Protected Areas in the Eastern Baltic Sea, n.d.). Some of the goals of this project are reducing by-catch or increasing public awareness of MPAs, among others (Marine Protected Areas in the Eastern Baltic Sea, n.d.). Lithuania has 27 MPAs and one marine managed area. The MPAs’ extent is 1,559 km2 (Marine Conservation Institute 2020), which occupies 25.40% of the entire EEZ (6139 km2, Veitch et al. 2010). Since February 2010, when the last overview on the status of BSPAs (Baltic Sea Protected Areas) was compiled, two new MPAs were established in Lithuania, and by that time they did not have a management plan (HELCOM 2013). One of those is the Curonian National Park, which is an UNESCO World Heritage Site that stands out for its unique sand dunes landscape. The total area of the Park is 264 km2, and it protects 166 km2 of marine ecosystems (Marine Conservation Institute 2020), i.e., 10.65% of the total extent of MPAs in this country. However, it has been observed that “transboundary effects of potential oil spills from the D6- Platform (Kaliningrad Region) can affect valuable fish provisioning areas and coastal cultural values in the Curonian Spit” (Depellegrin et al. 2020). Poland The original reconstruction of the catches from Poland’s EEZ in the Baltic Sea from 1950 to 2007 was performed by Bale et al. (2010) and updated to 2010 by Bale et al. (2016). The following documents how this work was updated to 2017, then carried forward to 2018. Reported catch baseline data ICES landing statistics for Poland for 2011-2017 were accepted as the reported baseline landings, but minor retroactive changes to the ICES catch statistics from 1950-2010 were not taken into account here. Catch data were spatially assigned to within and outside Poland’s EEZ using the previous spatial assignments described

Updating to 2018 the 1950-2010 marine catch reconstructions of the Sea Around Us: Part I – Africa, Antarctica, Europe and the North Atlantic
241
in the 1950-2007 reconstruction and its 2008-2010 update. Reported data were split into the two commercial sectors using the same ratio of artisanal to industrial catch, as in the previous reconstruction. In ICES areas outside of Poland’s EEZ (Areas III d 27, 28, 28.2, and 29), the catch was assigned as 100% industrial; in ICES areas overlapping with Poland’s EEZ (Areas III d 24, 25, and 26), the catch was split by sector into 9% artisanal and 91% industrial. Of the industrial catch in areas overlapping with Poland’s EEZ, the catch was spatially allocated to within Poland’s EEZ (‘Poland’) and outside of Poland’s EEZ (‘Outside of EEZ’) for each subarea. The catches in ICES subareas 24, 25, and 26 were split into 33.1% within Poland’s EEZ and 66.9% outside Poland’s EEZ. Flounder, cod and herring catches The catch statistics were adjusted for European flounder (Platichthys flesus) according to data from the Baltic Fisheries Assessment Working Group (WGBFAS, ICES 2015), which reported 70 extra tonnes of catch in subareas 24-26 in 2012 not reported in the original ICES data (ICES 2015). This is considered unreported but legal catch. Unreported landings were calculated using the 2008-2010 rates (Bale et al. 2016). If a taxon did not exist in the original reconstruction, the default rate of 11.2% of unreported catch was applied. The only species to which the standard 11.2% rate was not applied were Atlantic cod (Gadus morhua, 300%), Atlantic salmon (Salmo salar, 50%), and Atlantic herring (Clupea harengus, 134%) following Bale et al. (2016). Discards Most discard rates were held constant from the 2008-2010 period and were applied equally to both the industrial and artisanal sectors for 2011-2017. The average discard rate for Atlantic cod for 2008-2010 (11%) was used for 2011-2017. Asp (Leuciscus aspius) had a drastically reduced discard rate of 0.06% from 2008 to 2010; however, the default discard rate of 6.24% was applied to the species for 2011-2017. As was the case with unreported landings, the default discard rate of 6.24% was applied for any taxon not present in the 1950-2010 reconstruction. Recreational catches Since the original reconstruction used Polish population data to estimate the recreational catch, trends in yearly population changes for Poland from 2011-2017 (from Poland’s Central Statistics Office; Stańczak et al. 2016) were continued, using the 2010 recreational catch as anchor point. Transition from 2017 to 2018 The catch reconstructed to 2017 was carried forward to 2018 using the semi-automated procedures outlined in Noël (2020), based on ICES landings data to 2018. Semi-automated reconstructed catch data will later be replaced by a more detailed, research-intensive update. Marine biodiversity protection Poland has agreed to protect its biological diversity through the international Convention on Biological Diversity (Aichi) and the Ramsar Convention on Wetlands of International Importance (Marine Conservation Institute 2020). Poland is also a signatory to Regional Treaties and Agreements such as the Natura 2000, and its commitments extend to intergovernmental organization such as the Helsinki Commission (HELCOM; Marine Conservation Institute 2020). Poland has 46 MPAs and two marine managed areas. The MPAs’ extent is 7,253 km2 (Marine Conservation Institute 2020), which represents 23% of the Polish EEZ (32,058 km2; Bale et al. 2016). “The use of gillnets is

2020 Fisheries Centre Research Reports 28(5)
242
considered as the main threat to marine birds in their wintering and resting area and the protection plans for Natura 2000 areas impose many restrictions on small-scale fisheries. These plans caused a lot of protest and are still pending. Their enforcement is expected to cause negative changes in small-scale fisheries catch possibilities” (Rakowski et al. 2020). One of the most important areas for migratory water birds is the mouth of the Vistula River, which is a Ramsar site designated in 2015 and the largest estuary in Poland. This site covers Nature Reserves, wetlands and a marine area. It is home to the main population of grey seals and the only breeding location of harbor seals in Poland (Ramsar sites information service 2020). However, near this site some of the threats are pollution (Marine Conservation Institute 2020) and fishing activities (Weslawski et al. 2010). “The deployment of fixed gear (for flounder, salmon, trout, cod, pike perch) is concentrated around the Vistula mouth and along the outer part of Puck Bay. Fixed gear poses serious threats to sea mammals and seabirds; attracted to this gear by the readily available food resources, the animals become entangled in them” (Weslawski et al. 2010). Russia (Baltic Sea) The original reconstruction of the 1950-2007 catches from Russia’s EEZs in the Baltic Sea was performed by Harper et al. (2010) and updated to 2010 by Harper et al. (2016). The following documents how this reconstruction was updated to 2017, then carried forward to 2018. Note that Russia’s EEZ in the Baltic consist of two spatially separate components: one EEZ off Saint Petersburg in the Gulf of Finland and a second EEZ off Kaliningrad (the formerly German city of Königsberg), which jointly cover only 23,240 km2. Reported catch baseline data ICES landing statistic data were used as Russia’s reported baseline data for 2011-2017. If no specific ICES subarea was assigned to ICES data, national data from the Russian Federation Federal State Statistics Service21 were used to assign spatial areas. ICES reported landings from areas 26 and 32 were spatially assigned to inside or outside their corresponding EEZs using the previous reconstruction’s spatial assignments. Reported ICES landings were split into artisanal and industrial sectors using the same ratios as the previous reconstruction. In ICES area 26, 35.1% of reported landings were allocated to inside the EEZ, of which 25.6% was allocated to the artisanal sector and 74.4% to the industrial sector. In ICES area 32, 42.8% of reported landings were allocated to inside the EEZ, of which 21% was allocated to the artisanal sector and 79% to the industrial sector. The reported landings allocated to outside the EEZ in area 26 and 32 were all considered to be industrial. Unreported landings In addition to the baseline landings (ICES 2015a), separate catch statistics from both Russian national data and ICES Working Group reports were used to assign extra unreported catch. Unreported illegal landings were calculated using the same rates and taxonomic breakdowns as in the 2007-2010 update. Discards Discards for all taxa, aside from Atlantic salmon (Salmo salar), were calculated using the same 2007-2010 discard rates and applied to both reported and unreported landings. For Atlantic salmon (Salmo salar), the Baltic Salmon and Trout Assessment Working Group (WGBAST) indicated that discards of salmon were negligible; hence, no salmon discards were included in this carry forward (ICES 2015b).
21 http://www.gks.ru/

Updating to 2018 the 1950-2010 marine catch reconstructions of the Sea Around Us: Part I – Africa, Antarctica, Europe and the North Atlantic
243
Recreational fisheries The number of recreational fishers was carried forward using the rate of population change and estimated 2010 population extrapolated to 2017, which was used jointly with the 2010 assumed catch rate of 5 kg of fish per fisher per year to estimate recreational fisheries catches. While the original publication (Harper et al. 2010) lists separate taxonomic compositions for the Vistula and Curonia lagoons (near Kaliningrad), this update used the same taxonomic composition as in the 2007-2010 update for both lagoons. Transition from 2017 to 2018 The catch reconstructed to 2017 was carried forward to 2018 using the semi-automated procedures outlined in Noël (2020), based on ICES landings data to 2018. Semi-automated reconstructed catch data will later be replaced by a more detailed, research-intensive update. Marine biodiversity protection Russia has agreed to protect the biological diversity in its part of the Baltic Sea through the international Convention on Biological Diversity (Aichi), United Nations Convention on the Law of the Sea, the Ramsar Convention on Wetlands of International Importance and the World Heritage Convention (Marine Conservation Institute 2020). Russia is also a signatory to the international network of UNESCO Man and the Biosphere, and its commitments extend to intergovernmental organization such as the Helsinki Commission (HELCOM; Marine Conservation Institute 2020). In the Baltic Sea, the EU Habitats Directive’s marine Natura 2000 network is also considered to protect and conserve marine ecosystems. However, it is not applicable in Russian waters, as Russia is not an EU Member; it is only expected to meet commitments under the HELCOM recommendations and agree to its policies (WWF 2016). HELCOM MPAs’ extent in the Russian waters of the Baltic Sea was ca. 900 km2 in 2016 (WWF 2016), which equals 4% the Baltic Sea EEZ of Russia (23,241 km2; Harper et al. 2016). Marine protected areas (MPAs) in Russia are areas managed by federal, regional and local governments; they are designated as national parks, zakazniks, i.e., wildlife refuges and zapovedniks, i.e., strict nature reserves (Marine Conservation Institute 2020). “There is considerable complexity in the management structure of MPAs in the Baltic Sea. Several types of protection overlap each other partly or fully, plans are missing for 30 percent of HELCOM MPAs, and 12 percent of the areas are only partially covered by plans. Further, management plans are not easily accessible and are usually not available in English. This situation needs further attention in order to improve the potential for Baltic MPAs to actually protect biological diversity including the genetic level” (Laikre et al. 2016). Other authors also agree with the lack of data transparency, “[g]etting more data from Russia about their marine protection efforts seems unlikely, but a better understanding of Russian MPAs is necessary to implementing a coherent network in the Baltic” (Morton 2017). From the accessible information, it appears that in the last decades, Russia has not designated many sites, and one-third of the designated sites fail to meet the recommended size (WWF 2016). The implementation rate of MPAs in Russia is very low, and its neighbors around the Baltic Sea appear to implement MPAs up to four times faster (Morton 2017). One of the explanations is the lack of funding towards conservation and especially marine conservation, resulting in very scarce enforcement, monitoring, public outreach and scientific research (Marine Conservation Institute 2020).
2020 Fisheries Centre Research Reports 28(5)
244
Sweden (Baltic) The original reconstruction of the catches from Sweden’s EEZ in the Baltic Sea for 1950 to 2007 was performed by Persson (2010) and updated to 2010 by Persson (2016). The account below presents the update to 2017 and the carry-forward to 2018. Reported catch baseline data ICES landings statistics for Sweden in the Baltic Sea (ICES area III d) 2011-2017 were accepted as the baseline landings. Minor retroactive changes to the ICES catch statistics from 1950-2010 were not accounted for in this reconstruction update. Reported catch data were spatially assigned to inside and outside of Sweden’s EEZ by ICES area using the spatial assignments from the 1950-2010 reconstruction (Persson 2010, 2016). Reported data were also disaggregated by artisanal and industrial sectors using the same ratio as in the previous reconstruction. In ICES areas not overlapping with Sweden’s EEZ (22 and 32), the catch was assigned as 100% industrial; in ICES areas within Sweden’s EEZ (24-31), the catch was disaggregated to 9% artisanal and 91% industrial. The 91% industrial catch was spatially allocated to within Sweden’s EEZ (‘Sweden’) and outside Sweden’s EEZ (‘Outside of EEZ’). The previous reconstruction and its update allocated all catch in ICES area III d 23 to outside Sweden’s EEZ, despite the fact that Sweden’s EEZ does fall within subarea 23. This was not corrected here, but it will have to be in the future. Species-specific catches Catch statistics were updated for Atlantic salmon (Salmo salar) for 2011-2014 based on stock assessment data from the Baltic Salmon and Trout Assessment Working Group (WGBAST), which reported between 49 and 72 extra tonnes catch for 2011-2014 (ICES 2015b). Because the WGBAST report did not indicate from which subareas the salmon catch originated, it was spatially split with the same ratios reported in ICES data. This was considered unreported but legal catch. The catch statistics were updated for European flounder (Platichthys flesus) for 2011-2013 based on data from the Baltic Fisheries Assessment Working Group (WGBFAS), which reported 25-34 extra tonnes in 2011 to 2013 (ICES 2015a). This was considered unreported but legal catch. For 2015-2017, the ICES working group reports closely matched the ICES reported data and thus no adjustments were made. Unreported vs. reported catches Nearly all taxa in the previous reconstruction had a standard rate of unreported landings of 6.74%. The standard rate was lowered slightly to 6.5% to reflect information in the 2015 WGBFAS report, which states that “Misreporting significantly declined in 2008-2009 and amounted to 6-7%,” (ICES 2015a). All species except European eel (Anguilla Anguilla), vendace (Coregonus albula), cod (Gadus morhua), and Atlantic salmon were carried forward with the updated 6.5% unreported landings rate. For the four other species, the previous 2008-2010 unreported landings rate was assumed to apply to 2017 because no updated information was found pertaining to the unreported landings of these four species. Discards All discard rates were held constant from the 2008-2010 time period and were applied to both the industrial and artisanal sectors for 2011-2017.
Updating to 2018 the 1950-2010 marine catch reconstructions of the Sea Around Us: Part I – Africa, Antarctica, Europe and the North Atlantic
245
Recreational catches Statistics Sweden provided data for 2013 and 2016 on recreational catches in Swedish waters (Anon. 2014, 2017). While Statistics Sweden differentiates between marine and freshwater recreational catches, their data do not indicate from which ICES subarea marine the recreational catches originated. Reported national marine recreational catches from 2013 were therefore split between ICES areas 24-31 according to the average split between those areas from 1950-2010. The original reconstruction also assigned recreational catches to areas 22, 23, and 32 with the result that some of that catch was assigned to ‘Outside of EEZ’; however, recreational fishing is assumed to not occur outsides one’s EEZ. Thus, retroactive changes were made. Therefore, recreational catches are no longer assigned to those areas for 1950-2010. For the years 2011-2012, a linear interpolation was performed for each taxon between the adjusted 2010 assignment and the 2013 national data unless the taxon was not present in the 2010 data but present in the 2013 data. In those cases, the catch of the new taxon was simply reported in the year 2013 and not added to 2011 or 2012. For 2014, a linear projection was performed for species in both the 2010 data and the 2013 data to carry forward the trend. For species present in the 2013 data but not the 2010 data, 2013 statistics were used for 2014. This interpolation and projection were done for 2015 and 2017 based on the 2016 anchor point. Transition from 2017 to 2018 The catch reconstructed to 2017 was carried forward to 2018 using the semi-automated procedures outlined in Noël (2020), based on ICES landings data to 2018. Semi-automated reconstructed catch data will later be replaced by a more detailed, research-intensive update. Marine biodiversity protection Sweden has agreed to protect the marine biological diversity of the Baltic Sea through the international Convention on Biological Diversity (Aichi) and the Ramsar Convention on Wetlands of International Importance (Marine Conservation Institute 2020). Sweden is also a signatory to Regional Treaties and Agreements such as the Natura 2000, and it is also part of the international network of UNESCO Man and the Biosphere. Its commitments extend to intergovernmental organizations such as the OSPAR Convention and the Helsinki Commission (HELCOM; Marine Conservation Institute 2020). “Sweden has transposed the EU Framework Directive on Maritime Spatial Planning into Swedish legislation through the Swedish Environmental Code and the Marine Spatial Planning Ordinance. According to the Code, there will be three national plans – one for the Gulf of Bothnia, one for the Baltic Sea, and one for Skagerrak and Kattegat. The plans provide guidance to public authorities and municipalities in the planning and review of claims for the use of the areas. [Moreover,] SEPA ([Swedish Environmental Protection Agency]) coordinates Natura 2000 at national level, and develops strategies for area protection, produces practical guidelines” (Hytönen et al. 2020). Sweden MPAs’ occupies about 15% (Marine Conservation Institute 2020) of the Baltic EEZ of Sweden (22,214 km2; Persson 2016). However, some reviews pointed out that despite the fact that the number of marine nature reserves in Sweden has increased, the establishment rate of these reserves is still lower than terrestrial protected areas (Grip and Blomqvist 2018). Some of the reasons seem to be grounded in conflicts of interest by different stakeholders and users. “Most of the interviewed Swedish CAB [(County Administrative Board)] officers emphasized that, compared to other marine activities, the commercial fishery in Sweden has a disproportionately profound influence on the establishment of marine nature reserves. This has been the case even though most of the Swedish fishing revenue comes from fishing outside the territorial waters, whereas all MNRs [(Marine Nature Reserves)] are located inside. Proposals for MNRs with strict protection have usually met strong opposition from property owners (which in archipelago areas can be many), fishermen, and local

2020 Fisheries Centre Research Reports 28(5)
246
municipalities (Redpath 2015). Such conflicts have delayed or prevented the establishment of most MNRs in Sweden” (Grip 2018). Results and Discussion The reconstructions of the fisheries in the countries of the Baltic Sea share reliance on reported landings from the International Council for the Exploration of the Sea (ICES). For Denmark’s Baltic Sea EEZ, see Brown et al. (2020). Despite the reliability of ICES reported data and the taxonomic and spatial resolution of these data, discards and some unreported landings are not covered by the ICES data. The unreported landings and discards of some commercially targeted species such as Atlantic salmon (Salmo salar), European sprat (Sprattus sprattus) and European flounder (Platichthys flesus) were estimated using reports of the ICES Baltic Fisheries Assessment Working Group.
Figure 1. Reconstructed domestic catches from the Baltic Sea for all EEZs for 1950-2018 including catches by foreign fishing entities. This figure excludes Denmark’s Baltic Sea EEZ which has been addressed separately. Reconstructed catches from the Baltic Sea have remained fairly level since 2010, reflecting consistent management of Baltic fisheries. Acknowledgments Funding for the work presented here was provided by the Minderoo Foundation, by the Marisla, Oak, and David and Lucille Packard Foundations, and by the Bloomberg Philanthropies through Rare. References (by country) Brown, C. and Sy, E. 2020. Denmark (Baltic Sea): Updated catch reconstruction for 2011 – 2018, p. 167-173.
In: B. Derrick, M. Khalfallah, V. Relano, D. Zeller and D. Pauly (eds). Updating to 2018 the 1950-2010 Marine Catch Reconstructions of the Sea Around Us: Part I – Africa, Antarctica, Europe and the North Atlantic. Fisheries Centre Research Report 28(5).
Zeller, D., P. Rossing, S. Harper, L. Persson, S. Booth and D. Pauly. 2011 The Baltic Sea: estimates of total fisheries removals 1950-2007. Fisheries Research, 108(2-3): 356-363.
Estonia Guillen, J., S. Holmes, N. Carvalho, J. Casey, H. Dörner, M. Gibin, A. Mannini, P. Vasilakopoulos, A. Zanzi.
2018. A review of the European Union landing obligation focusing on its implications for fisheries and the environment. Sustainability, 10(4): 900.

Updating to 2018 the 1950-2010 marine catch reconstructions of the Sea Around Us: Part I – Africa, Antarctica, Europe and the North Atlantic
247
HELCOM. 2003. Guidelines for Designating Marine and Coastal Baltic Sea Protected Areas (BSPA) and Proposed Protection Categories. Updated and approved by HELCOM HOD 11/2003. Available at: www.helcom.fi/Recommendations/guidelines/en_GB/guide15_5/
ICES. 2015. Report of the Baltic Salmon and Trout Assessment Working Group (WGBAST). 23-31 March 2015, Rostock, Germany. ICES CM 2015\ACOM:08. 362 p.
Marine Conservation Institute. 2020. MPAtlas [Online]. Seattle, WA. Available at: www.mpatlas.org Noël, S.-L. 2020. Semi-automation procedure for catch reconstruction forward carry, p. 15-20. In: B. Derrick,
M. Khalfallah, V. Relano, D. Zeller and D. Pauly (eds). Updating to 2018 the 1950-2010 Marine Catch Reconstructions of the Sea Around Us: Part I – Africa, Antarctica, Europe and the North Atlantic. Fisheries Centre Research Report 28(5).
Ojaveer, H. 1999. Exploitation of biological resources by Estonia in 1928-1995. Limnologica, 29: 224-226. Plaan, J. 2020. A Critical Insight into Fisheries Policies and Its Effects on Small-Scale Fisheries in Estonia, p.
519-536. In: J.J. Pascual-Fernández, C. Pita, M. Bavinck (eds). Small-Scale Fisheries in Europe: Status, Resilience and Governance. Springer, Cham.
Printsmann, A. and T. Pikner. 2019. The Role of Culture in the Self-Organisation of Coastal Fishers Sustaining Coastal Landscapes: A Case Study in Estonia. Sustainability, 11(14): 3951.
Uhlmann, S.S., C. Ulrich and S.J. Kennelly (eds). 2019. The European Landing Obligation: Reducing Discards in Complex, Multi-Species and Multi-Jurisdictional Fisheries. Springer, Cham, Switzerland.
Veitch, L., S. Booth, S. Harper, P. Rossing and D. Zeller. 2010. Catch reconstruction for Estonia in the Baltic Sea from 1950-2007, p. 63-84. In: P. Rossing, S. Booth and D. Zeller (eds). Total marine fisheries extractions by country in the Baltic Sea: 1950-present. Fisheries Centre Research Reports 18(1).
Veitch, L., S. Booth, S. Harper, P. Rossing and D. Zeller. 2016. Estonia, p. 248. In: D. Pauly and D. Zeller (eds). Global Atlas of Marine Fisheries: A critical appraisal of catches and ecosystem impacts. Island Press, Washington D.C.
Veitch, L., S. Booth, S. Harper, P. Rossing and D. Zeller. 2010. Catch reconstruction for Estonia in the Baltic Sea from 1950-2007, p. 63-84. In: Rossing, P., S. Booth and D. Zeller (eds). Total marine fisheries extractions by country in the Baltic Sea: 1950-present. Fisheries Centre Research Reports 18 (1).
Zeller, D., P. Rossing, S. Harper, L. Persson, S. Booth and D. Pauly. 2011. The Baltic Sea: estimates of total fisheries removals 1950-2007. Fisheries Research, 108: 356-363.
Finland HELCOM. 2003. Guidelines for Designating Marine and Coastal Baltic Sea Protected Areas (BSPA) and
Proposed Protection Categories. Updated and approved by HELCOM HOD 11/2003. Available at: www.helcom.fi/Recommendations/guidelines/en_GB/guide15_5/
Hytönen, M. (ed). 2020. Local knowledge in nature conservation management: Situation in Finland, Sweden, Norway, Iceland, Greenland and the Faroe Islands. Natural resources and bioeconomy studies 14/2020. Natural Resources Institute Finland, Helsinki. 66 p.
ICES. 2018a. Baltic Fisheries Assessment Working Group (WGBFAS), 6–13 April 2018, ICES HQ, Copenhagen, Denmark. 748 p.
ICES. 2018b. Report of the Baltic Salmon and Trout Assessment Working Group (WGBAST), 20–28 March 2018, Turku, Finland. ICES CM 2018/ACOM:10. 369 p.
Marine Conservation Institute. 2020. MPAtlas [Online]. Seattle, WA. Available at: www.mpatlas.org Noël, S.-L. 2020. Semi-automation procedure for catch reconstruction forward carry, p. 15-20. In: B. Derrick,
M. Khalfallah, V. Relano, D. Zeller and D. Pauly (eds). Updating to 2018 the 1950-2010 Marine Catch Reconstructions of the Sea Around Us: Part I – Africa, Antarctica, Europe and the North Atlantic. Fisheries Centre Research Report 28(5).
Rossing, P., S. Bale, S. Harper and D. Zeller. 2010. Baltic Sea fisheries catches for Finland (1950-2007), p. 85-106. In: P. Rossing, S. Booth and D. Zeller (eds). Total marine fisheries extractions by country in the Baltic Sea: 1950-present. Fisheries Centre Research Reports 18(1).
Rossing, P., S. Bale, S. Harper and D. Zeller. 2016. Finland, p. 251. In: D. Pauly and D. Zeller (eds). Global Atlas of Marine Fisheries: A critical appraisal of catches and ecosystem impacts. Island Press, Washington D.C.
Salmi, P. and J. Mellanoura. 2020. Finnish Small-Scale Fisheries: Marginalisation or Revival? p. 537-557. In: J.J. Pascual-Fernández, C. Pita, M. Bavinck (eds). Small-Scale Fisheries in Europe: Status, Resilience and Governance. Springer, Cham.
Viirret, E., K.J. Raatikainen, N. Fagerholm, N. Käyhkö and P. Vihervaara. 2019. Ecosystem services at the Archipelago Sea biosphere reserve in Finland: A visitor perspective. Sustainability, 11(2): 421.

2020 Fisheries Centre Research Reports 28(5)
248
Germany (Baltic) BfN. 2020. Protected Areas: Overview and key facts. Federal Agency for Nature Conservation. Available at:
www.bfn.de/en/activities/marine-nature-conservation/national-marine-protected-areas/overview-and-key-facts.html
BfN. 2020b. German Fisheries in the North Sea and Baltic Sea. Federal Agency for Nature Conservation. Available at: https://www.bfn.de/en/activities/marine-nature-conservation/pressures-on-the-marine-environment/fisheries-and-fish-stocks/german-fisheries-in-the-north-sea-and-baltic-sea.html
ICES. 2015. Report of the Baltic Fisheries Assessment Working Group (WGBFAS), 14– 21 April 2015, ICES HQ, Copenhagen, Denmark. ICES CM 2015/ACOM:10. 826 p.
Marine Conservation Institute. 2020. MPAtlas [Online]. Seattle, WA. Available at: www.mpatlas.org Nachtsheim, D., B. Unger, N.R. Martínez, J. Lemmel, S. Viquerat, A. Gilles, U. Siebert. 2019. Monitoring of
marine mammals in the German North and Baltic Sea in 2016. Available at: www.bfn.de/fileadmin/BfN/meeresundkuestenschutz/Dokumente/Berichte-zum-Monitoring/2016_monitoring_report_harbour_porpoises.pdf
Noël, S.-L. 2020. Semi-automation procedure for catch reconstruction forward carry, p. 15-20. In: B. Derrick, M. Khalfallah, V. Relano, D. Zeller and D. Pauly (eds). Updating to 2018 the 1950-2010 Marine Catch Reconstructions of the Sea Around Us: Part I – Africa, Antarctica, Europe and the North Atlantic. Fisheries Centre Research Report 28(5).
Pike, E.P., K.L.P. Shugart-Schmidt, R.A. Moffitt, V.R. Saccomanno, L.E. Morgan. 2014. SeaStates G20 2014. Marine Conservation Institute, Seattle. 18 p. Available at: marine-conservation.org/wp-content/uploads/2020/07/mci_seastates_g20_2014.pdf
Rossing, P., C. Hammer, S. Bale, S. Harper, S. Booth and D. Zeller. 2010. Germany’s marine fisheries catches in the Baltic Sea (1950-2007), p. 107-126. In: Rossing P, Booth S and Zeller D (eds). Total marine fisheries extractions by country in the Baltic Sea: 1950-present. Fisheries Centre Research Reports 18(1).
Rossing, P., C. Hammer, S. Bale, S. Harper, S. Booth and D. Zeller. 2016. Germany (Baltic), p. 275. In: D. Pauly and D. Zeller (eds). Global Atlas of Marine Fisheries: A critical appraisal of catches and ecosystem impacts. Island Press, Washington D.C.
Unger, B., H. Herr, H. Benke, M. Böhmert, P. Burkhardt-Holm, M. Dähne, M. Hillmann, K. Wolff-Schmidt, P. Wohlsein and U. Siebert. 2017. Marine debris in harbour porpoises and seals from German waters. Marine Environmental Research, 130: 77-84.
Zeller, D., P. Rossing, S. Harper, L. Persson, S. Booth and D. Pauly. 2011. The Baltic Sea: estimates of total fisheries removals 1950-2007. Fisheries Research, 108: 356-363.
Latvia ICES. 2015. Report of the Baltic Fisheries Assessment Working Group (WGBFAS), 14– 21 April 2015, ICES
HQ, Copenhagen, Denmark. ICES CM 2015/ACOM:10. 826 p. Marine Conservation Institute. 2020. MPAtlas [Online]. Seattle, WA. Available at: www.mpatlas.org Noël, S.-L. 2020. Semi-automation procedure for catch reconstruction forward carry, p. 15-20. In: B. Derrick,
M. Khalfallah, V. Relano, D. Zeller and D. Pauly (eds). Updating to 2018 the 1950-2010 Marine Catch Reconstructions of the Sea Around Us: Part I – Africa, Antarctica, Europe and the North Atlantic. Fisheries Centre Research Report 28(5).
Rossing, P., M. Plikshs, S. Booth, L. Veitch and D. Zeller. 2010. Catch reconstruction for Latvia in the Baltic Sea from 1950 – 2007, p. 127-144. In: P. Rossing, S. Booth and D. Zeller (eds). Total marine fisheries extractions by country in the Baltic Sea: 1950-present. Fisheries Centre Research Reports 18(1).
Rossing, P., M. Plikshs, S. Booth, L. Veitch and D. Zeller. 2016. Latvia, p. 317. In: D. Pauly and D. Zeller (eds). Global Atlas of Marine Fisheries: A critical appraisal of catches and ecosystem impacts. Island Press, Washington D.C.
Veidemane, K., A. Ruskule, S. Strake, I. Purina, J. Aigars, S. Sprukta, D. Ustups, I. Putnis and A. Klepers. 2017. Application of the marine ecosystem services approach in the development of the maritime spatial plan of Latvia. International Journal of Biodiversity Science, Ecosystem Services & Management, 13(1): 398-411. doi.org/10.1080/21513732.2017.1398185
Lithuania Depellegrin, D., S. Menegon, L. Gusatu, S. Roy and I. Misiunė. 2020. Assessing marine ecosystem services
richness and exposure to anthropogenic threats in small sea areas: A case study for the Lithuanian sea space. Ecological Indicators, 108: 105730.

Updating to 2018 the 1950-2010 marine catch reconstructions of the Sea Around Us: Part I – Africa, Antarctica, Europe and the North Atlantic
249
HELCOM 2013. HELCOM PROTECT- Overview of the status of the network of Baltic Sea marine protected areas. 31 p.
ICES. 2015. Report of the Baltic Fisheries Assessment Working Group (WGBFAS), 14– 21 April 2015, ICES HQ, Copenhagen, Denmark. ICES CM 2015/ACOM:10. 826 p.
Marine Conservation Institute. 2020. MPAtlas [Online]. Seattle, WA. Available at: www.mpatlas.org Marine Protected Areas in the Eastern Baltic Sea. n.d. Introduction to the project. Available at:
www.balticseaportal.net/bsp_section/web/?id=396 Noël, S.-L. 2020. Semi-automation procedure for catch reconstruction forward carry, p. 15-20. In: B. Derrick,
M. Khalfallah, V. Relano, D. Zeller and D. Pauly (eds). Updating to 2018 the 1950-2010 Marine Catch Reconstructions of the Sea Around Us: Part I – Africa, Antarctica, Europe and the North Atlantic. Fisheries Centre Research Report 28(5).
Veitch, L., S. Toliusis, S. Booth, P. Rossing, S. Harper and D. Zeller. 2010. Catch reconstruction for Lithuania in the Baltic Sea from 1950–2007, p. 145-164. In: P. Rossing, S. Booth and D. Zeller (eds). Total marine fisheries extractions by country in the Baltic Sea: 1950-present. Fisheries Centre Research Reports 18(1).
Veitch, L., S. Toliusis, S. Booth, P. Rossing, S. Harper and D. Zeller. 2016. Lithuania, p. 321. In: D. Pauly and D. Zeller (eds). Global Atlas of Marine Fisheries: A critical appraisal of catches and ecosystem impacts. Island Press, Washington D.C.
Poland Bale, S., P. Rossing, S. Booth, P. Wowkonowicz and D. Zeller. 2010. Poland’s fisheries catches in the Baltic Sea
(1950-2007), p. 165-188. In: P. Rossing, S. Booth and D. Zeller (eds). Total marine fisheries extractions by country in the Baltic Sea: 1950-present. Fisheries Centre Research Reports 18(1).
Bale, S., P. Rossing, S. Booth, P. Wowkonowicz and D. Zeller. 2016. Poland, p. 368. In: D. Pauly and D. Zeller (eds). Global Atlas of Marine Fisheries: A critical appraisal of catches and ecosystem impacts. Island Press, Washington D.C.
ICES. 2015. Report of the Baltic Fisheries Assessment Working Group (WGBFAS), 14– 21 April 2015, ICES HQ, Copenhagen, Denmark. ICES CM 2015/ACOM:10. 826 p.
Marine Conservation Institute. 2020. MPAtlas [Online]. Seattle, WA. Available at: www.mpatlas.org Noël, S.-L. 2020. Semi-automation procedure for catch reconstruction forward carry, p. 15-20. In: B. Derrick,
M. Khalfallah, V. Relano, D. Zeller and D. Pauly (eds). Updating to 2018 the 1950-2010 Marine Catch Reconstructions of the Sea Around Us: Part I – Africa, Antarctica, Europe and the North Atlantic. Fisheries Centre Research Report 28(5).
Rakowski, M., A. Mytlewski and I. Psuty. 2020. Small-Scale Fisheries in Poland, p. 503-517. In: J.J. Pascual-Fernández, C. Pita, M. Bavinck (eds). Small-Scale Fisheries in Europe: Status, Resilience and Governance. Springer, Cham.
Ramsar sites information service. 2020. Vistula River Mouth. Available at: rsis.ramsar.org/ris/2321 Stańczak, J., A. Znajewska, M. Cierniak-Piotrowska, K. Stelmach, M. Urbanowicz, M. Potyra, L. Rutkowska
and M. Waligórska. 2016. Ludność. Stan i struktura ludności oraz ruch naturalny w przekroju terytorialnym. Stan w dniu 31 grudnia 2015 roku [Population. Size and structure and vital statistics in Poland by territorial division in 2015 As of December 31]. Statistical Information and Elaborations, Central Statistics Office, Warsaw, Poland. Available at: stat.gov.pl/obszary-tematyczne/ludnosc/ludnosc/ludnosc-stan-i-struktura-ludnosci-oraz-ruch-naturalny-w-przekroju-terytorialnym-stan-w-dniu-31-grudnia-2015-roku,6,19.html
Weslawski, J.M., J. Urbanski, L. Kryla-Staszewska, E. Andrulewicz, T. Linkowski, E. Kuzebski, W. Meissner, Z. Otremba and J. Piwowarczyk. 2010. The different uses of sea space in Polish Marine Areas: is conflict inevitable? Oceanologia, 52(3): 513-530.
Russia (Baltic) Harper, S., S.V. Shibaev, O. Baryshnikova, P. Rossing, S. Booth and D. Zeller. 2010. Russian fisheries catches
in the Baltic Sea from 1950-2007, p. 189-224. In: P. Rossing, S. Booth and D. Zeller (eds). Total marine fisheries extractions by country in the Baltic Sea: 1950-present. Fisheries Centre Research Reports 18 (1).
Harper, S., S.V. Shibaev, O. Baryshnikova, P. Rossing, S. Booth and D. Zeller. 2016. Russia (Baltic), p. 374. In: D. Pauly and D. Zeller (eds). Global Atlas of Marine Fisheries: A critical appraisal of catches and ecosystem impacts. Island Press, Washington D.C.

2020 Fisheries Centre Research Reports 28(5)
250
ICES. 2015a. Report of the Baltic Fisheries Assessment Working Group (WGBFAS), 14– 21 April 2015, ICES HQ, Copenhagen, Denmark. ICES CM 2015/ACOM:10. 826 p.
ICES. 2015b. Report of the Baltic Salmon and Trout Assessment Working Group (WGBAST). 23-31 March 2015, Rostock, Germany. ICES CM 2015\ACOM:08. 362 p.
Laikre, L., C. Lundmark, E. Jansson, L. Wennerström, M. Edman and A. Sandström. 2016. Lack of recognition of genetic biodiversity: International policy and its implementation in Baltic Sea marine protected areas. Ambio, 45(6): 661-680.
Marine Conservation Institute. 2020. MPAtlas [Online]. Seattle, WA. Available at: www.mpatlas.org Morton, K. 2017. Marine Protection in the Baltic Sea: An Analysis of the Implementation Duration for Marine
Protected Areas. Available at: dukespace.lib.duke.edu/dspace/bitstream/handle/10161/14963/Morton_Kayla_4_12_Submission.pdf?sequence=1
Noël, S.-L. 2020. Semi-automation procedure for catch reconstruction forward carry, p. 15-20. In: B. Derrick, M. Khalfallah, V. Relano, D. Zeller and D. Pauly (eds). Updating to 2018 the 1950-2010 Marine Catch Reconstructions of the Sea Around Us: Part I – Africa, Antarctica, Europe and the North Atlantic. Fisheries Centre Research Report 28(5).
WWF. 2016. Scorecard 2016: Marine Protected Areas in the Baltic Sea. Available at: d2ouvy59p0dg6k.cloudfront.net/downloads/wwf_mpa_scorecard_2016_nov.pdf
Zeller, D., P. Rossing, S. Harper, L. Persson, S. Booth and D. Pauly. 2011. The Baltic Sea: estimates of total fisheries removals 1950-2007. Fisheries Research, 108: 356-363
Sweden (Baltic) Anon. 2014. Fritidsfisket i Sverige 2013. Jordbruk, skogsbruk och fiske [Agriculture, forestry, and fishing].
Statistics Sweden, Sweden. Anon. 2017. Fritidsfisket i Sverige 2016. Jordbruk, skogsbruk och fiske [Agriculture, forestry, and fishing].
Statistics Sweden, Sweden. Grip, K. 2018. Marine environmental governance and management in Sweden from the 1960s until today: Did
the actions suit the needs? Doctoral dissertation, Department of Ecology, Environment and Plant Sciences, Stockholm University.
Grip, K. and S. Blomqvist. 2018. Establishing marine protected areas in Sweden: Internal resistance versus global influence. Ambio, 47(1): 1-14.
Hytönen, M., P. Sandström, S. Sandström. 2020. Sweden, p. 8-18. In: M. Hytönen (ed). Local knowledge in nature conservation management: Situation in Finland, Sweden, Norway, Iceland, Greenland and the Faroe Islands. Natural resources and Bioeconomy Studies 14/2020. Natural Resources Institute Finland, Helsinki.
ICES. 2015a. Report of the Baltic Fisheries Assessment Working Group (WGBFAS), 14– 21 April 2015, ICES HQ, Copenhagen, Denmark. ICES CM 2015/ACOM:10. 826 p.
ICES. 2015b. Report of the Baltic Salmon and Trout Assessment Working Group (WGBAST). 23-31 March 2015, Rostock, Germany. ICES CM 2015\ACOM:08. 362 p.
Marine Conservation Institute. 2020. MPAtlas [Online]. Seattle, WA. Available at: www.mpatlas.org Noël, S.-L. 2020. Semi-automation procedure for catch reconstruction forward carry, p. 15-20. In: B. Derrick,
M. Khalfallah, V. Relano, D. Zeller and D. Pauly (eds). Updating to 2018 the 1950-2010 Marine Catch Reconstructions of the Sea Around Us: Part I – Africa, Antarctica, Europe and the North Atlantic. Fisheries Centre Research Report 28(5).
Persson, L. 2010. Sweden’s fisheries catches in the Baltic Sea (1950 – 2007), p. 225-263. In: P. Rossing, S. Booth and D. Zeller (eds). Total marine fisheries extractions by country in the Baltic Sea: 1950-2007. Fisheries Centre Research Reports 18(1).
Persson, L. 2016. Sweden (Baltic), p. 404. In: D. Pauly and D. Zeller (eds). Global Atlas of Marine Fisheries: A critical appraisal of catches and ecosystem impacts. Island Press, Washington D.C.
Redpath S.M. and W.J. Sutherland. 2015. The value of ecological information in conservation conflict, p. 35-48. In: S.M. Redpath, R.J. Gutiérrez, K.A. Wood and J.C. Young (eds). Conflicts in Conservation. Navigation Towards Solutions. Cambridge University Press, United Kingdom.

Updating to 2018 the 1950-2010 marine catch reconstructions of the Sea Around Us: Part I – Africa, Antarctica, Europe and the North Atlantic
251
MEDITERRANEAN: UPDATED CATCH RECONSTRUCTIONS TO 2018*
Myriam Khalfallaha, Chiara Piroddib, Courtney Browna Simon-Luc Noëla, Tim Cashiona, Brittany Derricka, Darcy Dunstana, Emmalai Pagea, Gordon Tsuia, Andrea Pieruccic, Bojan Marčetad, Çetin Keskine, Dimitrios
Moutopolousf, Esmail Shakmang, Hatem Hanafy Mahmoudh, Hisham M. Ghmatii, Marta Carrerasj, Mohamed Abudayak, Reda M. Fahimh, Rigers Bakiul, Sanja Matić-Skokom, Sebastián Villasanten,o, Veronica Relanoa,
Tommaso Russoo, and Kyrstn Zylicha a) Sea Around Us, Institute for the Oceans and Fisheries, University of British Columbia, 2202 Main
Mall, Vancouver, BC, V6T 1Z4, Canada b) Institute for Environment and Sustainability, Joint Research Centre, Ispra, Italy
c) Università degli Studi di Cagliari, Via Università, 40, 09124 Cagliari CA, Italy d) Fisheries Research Institute of Slovenia, Spodnje Gameljne 61a, 1211 Ljubljana - Šmartno, Slovenia
e) Faculty of Fisheries; Istanbul University, Beyazıt, 34452 Fatih/İstanbul, Turkey f) Technological Educational Institute of Mesolonghi, Department of Aquaculture and Fisheries
Management, Mesolonghi, Greece g) Oceanography Unit - Zoology Department - Tripoli University - Tripoli - Libya
h) College of Fisheries and Aquaculture Technology, the Arab Academy for Science, Technology and Maritime Transport, Alexandria, Egypt
i) Marine Biology Research Center, Tajoura, Tripoli, Libya j) Independent researcher, Balearic Islands, Spain
k) Environment and Earth Sciences Dept. The Islamic university of Gaza, Palestine l) Department of Aquaculture and Fisheries, Faculty of Agriculture and Environment, Agricultural
University of Tirana, Universiteti Bujqesor i Tiranes, Kamez, Tirane, Albania. m) Institute of Oceanography and Fisheries, IZOR, Laboratory of Ichthyology and Coastal Fishery,
Šetalište Ivana Meštrovića 63, 21000, Split, Croatia n) Cross-Research in Environmental Technologies (CRETUS), University of Santiago de Compostela,
Campus Sur, Santiago de Compostela, A Coruña, Spain o) Campus Do Mar, International Campus of Excellence, Spain
p) Ecology- Laboratory of Experimental Ecology and Aquaculture, Department of Biology, University of Rome Tor Vergata, via della Ricerca Scientifica s.n.c. - 00133 - Rome
Abstract The original marine fisheries catch reconstructions for all countries and territories (or islands) surrounding the Mediterranean Sea for the years 1950 to 2010 were here updated for most entities to 2015, 2016 or 2017, then carried forward to 2018 using statistics from the Food and Agriculture Organization of the United Nations (FAO). The exceptions are Greece, Spain (mainland), and Turkey, whose reconstruction updates are documented elsewhere in this report. The methods applied for each catch reconstruction update, mainly derived from the previous catch reconstruction(s) for the country or territory in question, are presented in specific sections, jointly with any additional dataset. The resulting catch trends for the Mediterranean Sea as a whole are briefly discussed.
* Cite as: Khalfallah, M., C. Piroddi, C. Brown, S.-L. Noël, T. Cashion, B. Derrick, D. Dunstan, E. Page, G. Tsui, A. Pierucci, B. Marčeta, Ç. Keskin, D. Moutopolous, E. Shakman, H.H. Mahmoud, H.M. Ghmati, M. Carreras, M. Abudaya, R.M. Fahim, R. Bakiu, S. Matić-Skoko, S. Villasante, V. Relano, T. Russo and K. Zylich. 2020. Mediterranean: updated catch reconstructions to 2018, p. 251-294. In: B. Derrick, M. Khalfallah, V. Relano, D. Zeller and D. Pauly (eds). Updating to 2018 the 1950-2010 Marine Catch Reconstructions of the Sea Around Us: Part I – Africa, Antarctica, Europe and the North Atlantic. Fisheries Centre Research Report 28(5).

2020 Fisheries Centre Research Reports 28(5)
252
Introduction The Mediterranean Sea and the Black Sea form FAO Area 3722, two semi-enclosed seas characterized by narrow shelf areas. Mediterranean countries have established territorial waters and some have declared ‘Exclusive Fishing Zones’, but most have not officially claimed Exclusive Economic Zones (EEZs) under UNCLOS (Lleonart et al. 1998; Cacaud 2005). However, in order to remain globally consistent, the Sea Around Us assigned theoretical EEZs to all Mediterranean nations according to the basic UNCLOS principles of 200 nm off-shore or the mid-lines between neighboring countries as mapped by the Flanders Marine Institute23. Note that the EEZ boundaries and areas used here are not to be considered as an authority on the delimitation of any international maritime boundaries. They serve solely as spatial entities for fisheries catch accounting and assignment. For catch reconstruction updates for countries around the Black Sea, see Popov et al. (2020). In comparison with similar water bodies elsewhere, the biology of Mediterranean marine organisms is reasonably well studied - as are its fisheries, if the disparities between its northern and southern coast are discounted. This theme is elaborated upon further in the Results and Discussion section. Former and current members of the Sea Around Us have participated in many of the contributions dealing with the biology of Mediterranean organisms and/or their fisheries and aquaculture. Examples of such contributions are Coll et al. (2012), Brotz and Pauly (2012), Froese et al. (2004), Keskin and Pauly (2018), Mouillot et al. (2011), and Stergiou et al. (2009). Some of these contributions deal indirectly or directly with the Mediterranean fisheries catches, i.e., the topic of this contribution (Cashion et al. 2019; Pauly and Palomares. 2000; Pauly et al. 2014). The marine fisheries catches for the countries, territories and large islands of the Mediterranean were originally reconstructed for 1950 to 2010; see contributions in Pauly and Zeller (2016). This chapter summarizes the methods used to update most of these reconstructions to 2018, which was done in two steps: (1) updating manually, often using a variety of additional datasets and sources, generally to 2015, 2016 or 2017 and (2) a carry-forward to 2018 using the procedure of Noël (2020) based on FAO data. The countries whose detailed update required chapters of their own are Greece, Spain (mainland), and Turkey; these countries are thus omitted here. The countries or territories included here are Albania, Algeria, Bosnia and Herzegovina, Croatia, Cyprus (North and South), Egypt (Mediterranean), France (mainland and Corsica), Italy (mainland and the islands of Sardinia and Sicily), Lebanon, Libya, Malta, Montenegro, Morocco (Mediterranean), Palestine (Gaza Strip), Spain (Balearic Islands only), Slovenia, Syria, and Tunisia. Territorial entities that have no domestic fisheries, or whose fisheries are negligible, were omitted; they were Monaco (on the French coast), Gibraltar (on the Spanish coast), and Ceuta, and Melilla (on the Moroccan coast). The following sections include descriptions ranging from very brief to extensive of the methods applied to update the catch in the EEZs or EEZ-equivalent waters of the above-mentioned entities.
22 FAO Major Fishing Areas (online) available at http://www.fao.org/fishery/area/search/en [accessed 10/11/2019]; 23 Flanders Marine Institute (2020); www.marineregions.org.

Updating to 2018 the 1950-2010 marine catch reconstructions of the Sea Around Us: Part I – Africa, Antarctica, Europe and the North Atlantic
253
Methods (by country, territory or island) Albania The original reconstruction of Albania’s fisheries catches for 1950-2010 was completed by Moutopoulos et al. (2015, 2016). Here, we present a brief description of the fisheries of Albania, and then document the update of this reconstruction to 2018. Although Albania has inland and estuarine fisheries, the main contribution of fisheries catches comes from the marine industrial (large-scale) fishery, which relies on purse seiners, seiners and trawlers (Table 1).
Table 1. Catch reported by fishing sector (Albanian National Statistics Summary 2019)
Year Large-scale fisheries catch (t)
Small-scale fisheries catch (t)
2014 5211 1312 2015 5052 614 2016 4646 952 2017 4609 1074 2018 5537 315
In 2018, the reported catch of artisanal fisheries decreased by about 70% from the previous year’s level. How this relates to the reported increase in the number of fishing vessels (Table 2) cannot be ascertained at this point. However, as the declining small-scale catch coincides with an increase in large-scale catch for 2018 (Table 1), it may simply reflect a change in definitional attributions of vessel/gears to sectors. As may be seen from Table 2, the Albanian fishing fleet is composed of trawlers, seiners, purse seiners, dredgers, gill-netters and multipurpose fishing vessels, but the gill netters are dominant. Dredgers appeared for the first time in the fishing ports of Durrës and Shëngjin in 2015.
Table 2. Composition of the marine fishing fleet of the Republic of Albania (Albanian National Statistics Summary 2019)
Year Trawlers Seiners Purse
seiners Dredgers Gill
netters Multipurpose
vessels Total 2014 166 4 9 0 389 13 581 2015 156 3 8 5 367 25 564 2016 156 3 8 5 368 25 565 2017 157 5 8 5 360 24 559 2018 170 4 7 5 424 22 632
Reported catch baseline data There were slight differences between the 2010 and 2017 FAO dataset versions, but for this update changes were not made to account for these small differences. The total reported tonnage for each year was divided into gear types following an average ratio from 2001-2010 from the Albanian National Statistics Summary (2011). The catch of pelagic trawlers, purse seiners, seiners and bottom trawlers are considered industrial catches, whereas the ‘other’ catch is split into 95% artisanal and 5% subsistence.

2020 Fisheries Centre Research Reports 28(5)
254
Unreported catch Discards represent the only unreported catch estimated in this reconstruction. The discard rate by taxon and gear type for 2010 was used for the update of 2011-2018. Taxonomic disaggregation The 2010 taxonomic composition by gear was available from the previous catch reconstruction for Albania and were applied to the reported catch data to 2018. A few taxonomic groups reported by the FAO, i.e., ‘European eel’, ‘Mediterranean mussel’, ‘Stoney sea urchin’ and ‘Striped venus,’ were initially excluded from the original reconstruction but were added to this update as 95% artisanal and 5% subsistence. Only ‘European eel’ was reported by the FAO between 2011 and 2018 but excluded in the reported or discard calculations of 2011-2018. Marine biodiversity protection Albania has agreed to protect its biological diversity through the Convention on Biological Diversity (Aichi) (Marine Conservation Institute 2020), notably through its 13 MPAs and three marine managed areas. The MPAs’ extent is 122 km2, which represents 1.1% of its EEZ (11,105 km2; Moutopoulos et al. 2015). The country has implemented only one highly protected MPA, the Karaburun–Sazan National Marine Park, which stretches one mile along the Western and Eastern coast of the Karaburun Peninsula and one mile around Sazani Island, excluding the military port. Within the entire MPA, fishing has been prohibited in an area of 0.126 km2 since 2010 (MedReAct 2016), while actually fishing is prohibited even in those areas previously accessible by the small-scale fishers after getting permission by the Regional Administrate of Protected Areas (RAPA) in Vlore . “However, conservation measures have been poorly enforced to date. Several studies on marine habitats have documented the impacts on fish assemblages in this area, although most of these studies are not related to fish stock or fisheries assessments. […] In June 2015, the Waitt Expedition assessed the ecological state of fish assemblages in Albanian coastal waters, revealing low numbers of species and low abundance. Even in the Karaburun - Sazan MPA, the fish biomass seems to be far from the average value found in other Mediterranean MPAs. The main reasons could be related to overfishing and illegal fishing compounded by scarce enforcement and controls. During the Expedition's survey, at least four or five trawlers and several other small fishing boats were found fishing illegally in the MPA and close to the protected western coast of the Karaburun Peninsula” (MedReAct 2016). Algeria Algeria is a North African country with a long Mediterranean coastline. Because of its narrow continental shelf, the main fisheries in Algeria are artisanal, targeting a wide range of species using a multitude of fishing gears (Oliver 1983; Coppola 2001; Zeghdoudi 2006). The large-scale sector consists of industrial bottom trawling, which targets valuable commercial species (Maurin 1962; Belhabib et al. 2012). Babali at al. (2018) reviewed the Algerian marine recreational fishery, which currently catches over 6,000 tonnes per year. However, this catch reaches commercial markets, competing directly with the small-scale artisanal sector despite the fact that selling recreationally caught fish is illegal. Marine fisheries catches were reconstructed for 1950-2010 by Belhabib et al. (2012, 2016) and updated to 2016 by Khalfallah (2020) using the methods in the initial reconstruction and carried forward to 2018.

Updating to 2018 the 1950-2010 marine catch reconstructions of the Sea Around Us: Part I – Africa, Antarctica, Europe and the North Atlantic
255
Transition from 2016 to 2018 The catch reconstructed to 2016 was carried forward to 2018 using the semi-automated procedures outlined in Noël (2020), based on ICES landings data to 2018. Semi-automated reconstructed catch data will later be replaced by a more detailed, research-intensive update. Marine biodiversity protection Algeria is a signatory to Regional Treaties and Agreements such as the Regional Seas Convention, Barcelona Convention (Marine Conservation Institute 2020). Algeria has a framework for dealing with fisheries management. However, “Algeria has still a long way to fully implement the ICZM (Integrated Coastal Zone Management) approach. Mainly regarding data management and the implementation of coastal monitoring systems, enhancing the coordination and participation of stakeholders, particularly the local communities and NGO's. [...] The awareness and capacity building are still insufficient. Finally, sustainable funding for ICZM projects must be ensured” (Khelil et al. 2019). Algeria has five MPAs and four marine managed areas. The MPAs’ extent is 30 km2, which occupies 0.02% of the entire EEZ (128,843 km2; Belhabib et al. 2013). Some of these MPAs count on the support of the MedPAN network (MPA managers in the Mediterranean). For example, the establishment of an MPA in the marine area covered by the Taza National Park started with the support from MedPAN in 2009. In that area, the most predominant economic activities were artisanal fishing and illegal fishing. A key element for the implementation and enforcement of this MPA was “understanding the dynamics of the fishery and the behavior of the fishers are two fundamental elements that must be integrated into the management approach, strictly conditioned by close collaboration between scientists, fishers, and local managers” (Boubekri et al. 2018). MPAs in Algerian waters may also help to protect some endangered species, such as the loggerhead turtle, that visits its coasts, coming from the Atlantic and moving eastward into the Mediterranean. This species suffers from human activities, boat collisions and fisheries (Belmahi et al. 2020). Bosnia and Herzegovina The marine fisheries catches were reconstructed for Bosnia and Herzegovina’s very small coastline for 1950 to 2010 by Iritani et al. (2015; 2016). Here we summarize the methods applied to update the catch reconstruction for Bosnia and Herzegovina to 2014, then carry it forward to 2018. Reported data Reported catch data for 2011-2014 were available by year from the FAO database; however, all catches were categorized as ‘Marine fishes nei’. Thus, further taxonomic disaggregation was performed using the 2010 taxonomic composition. Unreported catch The annual ratios of reported artisanal landings to unreported artisanal landings from the catch reconstruction for Croatia (Matić-Skoko et al. 2014) were divided by half and used to determine an assumed unreported artisanal landings component for Bosnia and Herzegovina for 2011-2014 following the methods described by Matić-Skoko et al. (2014). By multiplying reported catches for Bosnia and Herzegovina by the new ratio, we were able to estimate likely unreported artisanal landings for 2011-2014. The taxonomic disaggregation from 2010 was extended to 2014.

2020 Fisheries Centre Research Reports 28(5)
256
The annual ratios of the artisanal discards to total artisanal catch for Croatia for 2011-2014 were applied to the total artisanal catch for Bosnia and Herzegovina. The taxonomic composition of discards from the Croatian reconstruction was applied to the estimated discards for Bosnia and Herzegovina. The subsistence and recreational catches were calculated as in the initial catch reconstruction. Since no new coastal population data were available for Bosnia and Herzegovina, we extrapolated the 2000-2010 population data to 2014. The recreational and subsistence per capita consumption rate was assumed to be half of the per capita consumption rate for Croatia and was then multiplied by Bosnia and Herzegovina’s coastal population. The taxonomic disaggregation for each of the subsistence and recreational catch sectors applied in the Croatian catch reconstruction was used here. Transition from 2014 to 2018 The catch reconstructed to 2014 was carried forward to 2018 using the semi-automated procedures outlined in Noël (2020), based on ICES landings data to 2018. Semi-automated reconstructed catch data will later be replaced by a more detailed, research-intensive update. Marine biodiversity protection Bosnia and Herzegovina have a very small EEZ of 14 km2, declared in 1994 (Iritani et al. 2015). This country is a member of the Convention on Biological Diversity (Aichi), but currently, there are no MPAs that protect Bosnia and Herzegovina’s waters (Marine Conservation Institute 2020). The MedMPANet project of the RAC/SPA (Regional Activity Centre for Specially Protected Areas), which aims at developing a Mediterranean Network of Marine and Coastal Protected Areas, has planned efforts towards the creation and management of MPAs in Bosnia and Herzegovina. Other countries with similar efforts from the MedMPANet project are Albania, Algeria, Croatia, Egypt, Lebanon, Libya, Morocco, Montenegro, Syria, Tunisia and Turkey (Gabrié et al. 2012). Only 1.4% of total terrestrial extent is protected (UNEP-WCMC and IUCN 2020; Gabrié et al. 2012) and their main threats are invasive alien species, hunting and fishing and unsolved property rights (Porej and Matić 2009). Serious issues that affect the management and protection of these protected areas have been identified. In the future, when MPAs are designed and established, it will be important to consider the lessons learned. For example, “managers have stated the highest level of security regarding objectives defining for PA, with certain problems with local community, resources for law enforcement and use of land inside and around PA. It has been pointed out that Protected Areas are not interconnected. […] The park managers identified problems preventing enforcement of legal obligations as illegal logging, poaching, etc. It has been pointed out that the main reason for such an inadequate situation lies in insufficient resources and lack of equipment and trained personnel. […] [Regarding financing], according to the majority of managers, financial stability is very questionable [and] none of the Protected Areas is adequately equipped for data collection. […] We may conclude that there are certain problems in staffing, as well as in communication through data processing” (Porej and Matić 2009). Croatia Croatia is a south-eastern European country with a long coast on the northeastern part of the Adriatic Sea. Total marine fisheries catches were reconstructed for 1950-2013 by Matić-Skoko et al. (2014) and summarized in Matić-Skoko et al. (2016). Here, we describe how these reconstructed catches were updated to 2017, then carried forward to 2018.

Updating to 2018 the 1950-2010 marine catch reconstructions of the Sea Around Us: Part I – Africa, Antarctica, Europe and the North Atlantic
257
Reported and unreported commercial catches Reported data were available, by year and taxon, for 2014-2017 from the FAO database and from national sources. National data were used as a baseline in the previous reconstruction for 1950-2013. When both datasets were compared, only slight differences (less than 0.5% on average) were noticed for 2005-2017. Thus, the FAO data were used here as a baseline for the 2014-2017 update. The 2013 artisanal/industrial sector disaggregation from the previous reconstruction was applied to allocate reported data for 2014-2017 into the appropriate sectors. Industrial catches were further split into trawl and purse seine catches following the same method. The ratio of unreported landings to the total catch for 2013 was applied to estimate unreported landings for 2014-2017. In the initial reconstruction, it was assumed that there was a subsidy incentive to over-report catch in the purse seine fishery. The same was assumed here, and thus the 15% adjustment was applied for the 2014-2017 updated catch. This assumption will require careful examination in future updates. For example, it is estimated that overreporting has declined since 2017 with approximately 90% and 9% of sardine and anchovy landings caught by purse seiners going to factories and tuna aquaculture, respectively. Rates of unreported landings and discards from the trawl fishery and the artisanal fishery for 2014-2017 were assumed to remain the same as in 2013. Subsistence fishery As part of the regulations that came into effect with the accession of Croatia to the European Union (EU) on the 1st of July 201324, subsistence fishers were required to be registered in the commercial category. Of the original 11,000 vessels registered under Croatia’s non-commercial fishery licenses, 3,500 vessels were registered as belonging to ‘small coastal commercial’ fisheries. Age requirements (60 years and above) and requirements of low income (monthly income < 400 EUR) were basic prerequisites to receive small coastal fishery licenses. The remaining fishers either joined the recreational fishery or became inactive as many were previously fishing part-time and did not rely on fishing as their primary source of livelihood. Because many previous small-scale coastal fishers were unable to fulfil the legal requirements (e.g., keeping accounting books, invoicing) to register as small coastal fishers, many of them ceased fishing. Meanwhile, many of the fishers who opted for the recreational category were prohibited from using nets. Recreational fishery Much of the local population and a growing number of visiting tourists engage in recreational fishing. Despite such fishing being an old and popular activity, recreational catches are not reported and thus data on the recreational fishery are scarce. The number of recreational fishers in Croatia was reported to be 25,000 for 1979-2007 (Basioli 1979; Vodopija 1997; Par et al. 2006; Fredotović et al. 2007). According to expert opinion (A. Soldo, IZOR, Croatia, unpubl. data), the number of recreational fishers tripled, but their catches decreased in recent years. Taxonomic disaggregation The same taxonomic disaggregation applied to each sector in the previous catch reconstruction for 2013 was applied to reconstruct catches for the different sectors for the 2014-2017 update.
24 https://ec.europa.eu/neighbourhood-enlargement/countries/detailed-country-information/croatia_en

2020 Fisheries Centre Research Reports 28(5)
258
Transition from 2017 to 2018 The catch reconstructed to 2017 was carried forward to 2018 using the semi-automated procedures outlined in Noël (2020), based on national landings data to 2018. Semi-automated reconstructed catch data will later be replaced by a more detailed, research-intensive update. Marine biodiversity protection Croatia has agreed to protect its biological diversity mainly through the international Convention on Biological Diversity (Aichi), although it is a signatory to Natura 2000 (Marine Conservation Institute 2020). Croatia has 304 MPAs and one marine managed area. Note, however, that some MPAs that are zoned or are managed by various actors are counted as different MPAs (Marine Conservation Institute 2020). The MPAs’ extent is 1475 km2 (Marine Conservation Institute 2020) and it occupies 2.6% of the entire EEZ (55961 km2; Matic-Skoko et al. 2014). Kornati National Park has 215 km2 in total. The marine area of the park comprises 166 km2, of which 11.2 km2 (6.6%) are designated as no-take area. The park was established in 1980, eleven years before the Yugoslav War. After the war, the Lastovo Park of Nature and the Cres-Lošinj Special Reserve was created. Their establishment was supposedly based on scientific criteria in cooperation with NGOs considering the Habitats Directive (CEC 1992, Council Directive 92/43/EEC). These two areas account for 68.3% of the Croatian spaces created to protect marine biodiversity (Mackelworth et al. 2011). Several other marine parks exist, including Brijuni National Park and Telaščica Park of Nature. The government of Croatia portrays the country as progressive (Mackelworth et al. 2011) and recognizes the Adriatic Sea as one of the areas it wants to protect. However, the de facto decisions regarding the use of Croatia’s Adriatic coast may be motivated in part by electoral politics. More open and public political discourse about the use of the area could improve management decisions to better inform the preservation of the marine environment and make it less vulnerable to opaque lobbying (Marine Conservation Institute 2020). On top of that, small-scale fisheries and tourism, two important sectors in Croatia, do not necessarily contribute to biodiversity protection. Small-scale fisheries are popular along Croatian coasts. High numbers of participants, different fishing gears, species caught, as well as a multitude of landing sites make this sector one of the most complex in terms of monitoring and management (Tzanatos et al. 2020). Finally, an ecological issue faced by the MPAs of this area and by the Mediterranean Sea in general is the deterioration of Posidonia oceanica meadows. To protect this vital ecosystem at least three actions for reducing mechanical impacts should be implemented in Croatia: monitoring of boat activities, ecological state of the meadows and impact of repeated beach embankment, raising awareness on correct anchoring methods, and installing ecological mooring (Guala et al. 2012). Cyprus (North and South) The marine fisheries catches for the island of Cyprus were originally reconstructed for 1950 to 2010 by Ulman et al. (2013, 2015, 2016a, and 2016b) taking explicitly into account its division into two entities in 1974: the Republic of Cyprus (hereafter ‘South Cyprus’), which is part of the European Union, and the Turkish Republic of Northern Cyprus (hereafter ‘North Cyprus’). Here marine fisheries catches were updated for 2011-2017 for each entity, then carried forward to 2018. Reported data Marine fisheries catches were reported by the FAO on behalf of ‘South Cyprus’ only after 1974, and thus excluded the catches of the artisanal sector from North Cyprus’.

Updating to 2018 the 1950-2010 marine catch reconstructions of the Sea Around Us: Part I – Africa, Antarctica, Europe and the North Atlantic
259
FAO catch data reported on behalf of South Cyprus were split between the artisanal and industrial components (56% and 44%, respectively) using the 2010 ratios from the initial reconstruction. Artisanal fisheries in North Cyprus Due to the scarcity of data regarding the artisanal fisheries in North Cyprus, artisanal catches were reconstructed for 2011-2017 using the original methods, i.e., a CPUE estimate was applied to an estimated number of artisanal vessels. The 2010 ratio of boats allocated to North Cyprus from the total number of inshore Cypriot vessels (from North and South Cyprus) as reported in the original reconstructions was used to estimate the number of vessels in North Cyprus. This ratio was applied to the number of South Cypriot inshore vessels from 2011-2017, available for 2011-2014 in Dentes de Carvalho Gaspar et al. (2016) and for 2015-2017 from South Cyprus’ annual fleet reports (15% of reported catch; European Union 2007; Anon. 2016). The taxonomic breakdown for artisanal catch for 2011-2017 was assumed to have remained the same as in 2010. Unreported commercial fisheries Ulman et al. (2015) estimated unreported commercial landings to be around 20% of total catch. Discards were apportioned for 2011-2017 based on 2010 rates (Ulman et al. 2015), but discards of silver-cheeked toadfish (Lagocephalus sceleratus) were increased to 50% of commercial catches in North Cyprus from 2011 onward based on A. Ulman (pers. obs. 2018). Recreational and subsistence fisheries Recreational catches in North Cyprus were reconstructed assuming the number of recreational fishers (anglers, recreational vessels, and spear fishers) was a function of the population between 2011 and 2017. According to two censuses, in 2011 and 201425,26, the population of North Cyprus was 294,906 and 320,000, respectively. The population for the remaining years was estimated by performing interpolations and extrapolations.
Recreational and subsistence catches of South Cyprus were assumed to continue to be 15% of reported commercial catches for 2011-2014, as in the previous reconstruction, of which 60% were assigned to recreational catches and 40% to subsistence. These catches were taxonomically disaggregated for 2011-2017 according to the data in Table 3. Additional subsistence components were calculated as take-home catch of commercial fishers, as 5% of trawlers’ total catch (15% of reported catch; European Union 2007) and 5% of artisanal catch for South Cyprus (Ulman et al. 2015).
25 http://www.studyinnorthcyprus.org/?page_id=3450 26 https://sapientaeconomics.com/2015/04/25-april-2015-northern-cyprus-demographics-who-is-voting-anyway/ ; https://theculturetrip.com/europe/cyprus/articles/a-brief-guide-to-northern-cyprus/#
Table 3. Taxonomic disaggregation of artisanal and subsistence catches for South Cyprus, 2010-2017 (Ulman et al. 2013, 2015, 2016a and 2016b).
Taxa Proportion (%)
Siganidae 21 Sparisoma cretense 15 Sparidae 14 Epinephelus marginatus 12 Mycteroperca rubra 10 Thunnus alalunga 10 Sarda sarda 8 Seriola dumerili 6 Lichia amia 4

2020 Fisheries Centre Research Reports 28(5)
260
Transition from 2014 to 2018 The catch reconstructed to 2014 for South Cyprus was carried forward to 2018 using the semi-automated procedures outlined in Noël (2020), based on FAO landings data to 2018. The catches for North Cyprus were carried forward to 2018 by using the three-year running average of reconstructed catches. Semi-automated reconstructed catch data will later be replaced by a more detailed, research-intensive update. Marine biodiversity protection Cyprus (i.e., ‘South Cyprus’) has agreed to protect its biological diversity through the international Convention on Biological Diversity (Aichi), and the country is a signatory to Regional Treaties and Agreements such as the Barcelona Convention and Natura 2000. Its commitments extend to NGOs like ENALIA (Enalia Physis Environmental Research Centre), and the country also has instruments such as Cyprus’ Environmental Protection Law in place to protect marine biodiversity (Marine Conservation Institute 2020). Cyprus (North and South) has 14 MPAs and four marine managed areas. The MPAs’ extent is 14.8 km2, which covers 0.01% of the EEZ of North and South Cyprus, i.e., 98,088 km2, Ulman et al. 2014). The Kakoskali MPA is the most recent MPA established in the north-western coast of Cyprus (Jimenez et al. 2019). It is partly a no-take zone (no fishing allowed), with a buffer zone where only professional fishers are allowed to fish. The beauty of this MPA is that it protects very important habitats such as a submarine cave, rocky reefs (including coralligenous reefs), and seagrass patches in a relatively small area. These three ecosystems are protected by the European Union (Habitat Directive 92/43 EEC) and the Barcelona Convention (UNEP-MAP-RAC/SPA 2008 2015). In these MPA there are also endemic species, such as the sponge Petrosia weinbergi, known exclusively from eastern Mediterranean caves (Jimenez et al. 2019). Before the establishment of this MPA, the area was not frequented by professional fishers due to the complex structure of the rock; this helped towards the MPA’s support by the local small/scale fishers. “They were asked how they would feel if the area was closed to all commercial and sport fish activities. The response was immediate, especially from the older more experienced fishers. “Create the MPA today if you can, we will benefit since the place is a ‘fish farm’. With this, it was clear that a potential and major obstacle to the creation of an MPA, did not exist. Furthermore, the closing of the area would benefit the fishermen directly since they utilise the nearby areas only in the winter/spring seasons for the fishing of picarel (Spicara smaris), which locally is considered an important species, and the creation of an MPA with a buffer zone, would give them sole access to the fishing grounds” (Jimenez et al. 2019). Conclusion The future of South Cyprus’ fisheries sector is being bolstered by funding from the EU27, while artisanal fishers are being displaced by the growth in mariculture (Hadjimichael et al. 2014). Fishing off both South and North Cyprus is also hampered by the increase in invasive and non-marketable species in the catch, notably the silver-cheeked toadfish Lagocephalus sceleratus (Ulman et al. 2015). Given this context, it is important to continue to provide information on total marine catches rather than relying on what is reported based on landings. Egypt (Mediterranean) Egypt, in the northeastern corner of North Africa, is characterized by three different fisheries, i.e., along its Mediterranean coast, in the Red Sea, and along the banks and in the delta of the river Nile. Also, freshwater aquaculture has been operating in Egypt since the Pharaoh’s era. Two main events have impacted the Egyptian
27 https://www.undercurrentnews.com/2015/07/09/e53m-investment-approved-for-cyprus-fisheries-sector/

Updating to 2018 the 1950-2010 marine catch reconstructions of the Sea Around Us: Part I – Africa, Antarctica, Europe and the North Atlantic
261
marine fisheries: the opening of the Suez Canal that connected the Red Sea to the Mediterranean in 1869 and the building and completion in 1965 of the Aswan High Dam on the Nile. The impact of these two events is discussed in Khalfallah (2020), who extended to 2017 the original marine fisheries catch reconstruction of Egypt’s fisheries in the Mediterranean that Mahmoud et al. (2015, 2016) had completed 1950 to 2010. Transition from 2017 to 2018 The catch reconstructed to 2017 was carried forward to 2018 using the semi-automated procedures outlined in Noël (2020), based on FAO landings data to 2018. Semi-automated reconstructed catch data will later be replaced by a more detailed, research-intensive update. Marine biodiversity protection Egypt has agreed to protect its biological diversity through the international Convention on Biological Diversity (Aichi) and the Ramsar Convention on Wetlands of International Importance (Marine Conservation Institute 2020). In the Mediterranean, Egypt has one MPA: El-Salum. It was designated in 2010 and its extent is 293 km2
(Marine Conservation Institute, 2020), which is tiny relative to Egypt’s Mediterranean EEZ (170,000 km2; Mahmoud et al. 2016). The present nesting distribution of green turtles (Chelonia mydas) is mainly restricted to Turkey and Cyprus. However, one nest was found in Egypt in 1998 and three in 2000. In Egypt, turtles are still exploited by fishers. In some cases, sea turtles may have been caught incidentally, but then, they are sold for human consumption (Kasparek et al. 2001). Two of the largest Ramsar sites closer to the Mediterranean Sea in Egypt are Lake Bardawil (designated in 1988, with 595 km2) and Lake Burullus (designated in 1988, with 462 km2). Lake Bardawil is formed by two hypersaline lagoons and provides “[…] important spawning area for fish28, supports commercially important fish populations, and is an important wintering and staging area for about 500,000 birds. Considerable ecological changes have occurred due to the extension of salt extraction and the constant formation of sand bars (siltation), which close the channels connecting the lagoons with the sea” (Ramsar sites information service 2020a). Lake Burullus is a saline and shallow lagoon that provides breeding grounds for birds. “[However, this lake] is subject to a strong salinity gradient and suffers from the inflow of large amounts of water contaminated with fertilizers and pesticides causing nutrient-enrichment” (Ramsar sites information service 2020b). France (Corsica) Corsica is a French island located off France’s south-eastern Mediterranean coast. The marine fisheries catches for the French EEZ around Corsica were reconstructed by Le Manach et al. (2011) from 1950 to 2008 and subsequently updated to 2010 by Le Manach and Pauly 2015); see also Le Manach et al. (2016). Here, we
28 Very few fishes spawn within the lagoon; however, the larvae and early juveniles of many fish species use lagoons as nurseries (Editors’ note).

2020 Fisheries Centre Research Reports 28(5)
262
summarize the methods applied to update the data to 2014, then carry-forward the catch reconstruction for Corsica to 2018. Reported catch Official catch data for Corsica were available, by year and taxon, from the FAO’s General Fishery Council for the Mediterranean (GCFM; Mediterranean and Black Sea) regional database29. As per the original reconstruction by Le Manach et al. (2011), catches by France reported from around the waters of Sardinia in area 37.1.3 were assumed to be caught within Corsica’s EEZ. Upon comparing the extracted FAO’s Fishery Council for the Mediterranean data with the reported data baseline from the original reconstruction, small differences were found from 1970 to 2008 due to the addition of catches of European eel (Anguilla anguilla). Also, bigger differences were found in the reported catch for 2009 and 2010. This was due to both a greater number of reported taxa and hen increase in the catch for previously reported taxa. The reconstruction update was performed from 2009 to 2014 to account for and address these differences in the data (Figure 1).
Figure 1. Reconstructed domestic catches within Corsica’s EEZ for 1950-2018 by fishing sectors. The lobster fishery The catches of common spiny lobster (Palinurus elephas) were assigned to the trammel net fishery of Corsica but reconstructed separately using data compiled by Père (2012) from 2009 to 2011. A linear regression was applied to the lobster catches of 2009-2011 to estimate lobster catches up to 2014. This provided a total reconstructed catch for lobsters from which the reported catch could be subtracted to identify the unreported portion. Decreasing catches of spiny lobster in Corsica are causing an increase in the catch of other large crustaceans, such as European lobster (Homarus gammarus) or pink spiny lobster (Palinurus mauritanicus) (Anon. 2014). The trammel net and trawl fisheries The reconstruction of landings by trammel nets and trawls for 2008-2010 relied on catch per unit of effort (CPUE) data from 1970 to 1992. These landings were not affected by the change in FAO reported data. To estimate the CPUE for vessels and fishers for 2011-2014, reconstructed catches from 2008 to 2010 were
29 http://www.fao.org/gfcm/data/capture-production/en/

Updating to 2018 the 1950-2010 marine catch reconstructions of the Sea Around Us: Part I – Africa, Antarctica, Europe and the North Atlantic
263
divided by the corresponding number of vessels or fishers (Leblond et al. 2010; Leblond et al. 2011; Macher et al. 2012). A linear regression was applied to the estimated 2008-2010 CPUE to derive the CPUE for 2011-2014, which was applied to the number of vessels or fishers for those years (Leblond et al. 2013, 2014). Fisher and vessel data were not available for 2013 and 2014, and were therefore estimated using the average numbers of fishers and vessels from 2009 -2012. The unreported catches of trammel nets and trawlers were calculated by subtracting reported catches from the total reconstructed catch. It was assumed that trammel nets and bottom trawls contributed equally to the reported and unreported landings. Bycatch and discards Both trammel nets and bottom trawls involve discarding of non-target species. The trammel net fishery’s discards and bycatch were estimated at 10% of its total catch and taxonomically disaggregated by Le Manach and Pauly (2015), based on a study in the Bonifacio MPA, in the south of Corsica. However, according to a recent study conducted between 2001 and 2012 in the Scandola MPA in northwest Corsica, the discards rate is higher on average in that area. The bycatch consists of large numbers of sharks and rays (Le Diréach et al. 2013). Thus, the following changes were made to the discarded bycatch calculations for the trammel net fishery: • The annual average discard rate was assumed to be 13% of the total trammel net catch (the average of the
two discard rates); • The contribution of sharks and finfishes to the total discards was averaged between the two studies
(approximately 30% and 70% respectively), accounting for a portion of miscellaneous marine fish bycatch being assigned to the elasmobranch taxa described by Le Diréach et al. (2013); and
• The taxonomic disaggregation applied in Le Manach and Pauly (2015) and Le Diréach et al. (2013) was applied here.
Bycatch and discards in the bottom trawl fishery were reconstructed following the methods applied in Le Manach and Pauly (2015), accounting for discards of non-target species and landings and discards of depredated commercial species. Recreational fisheries The recreational fisheries catches for Corsica were updated using methods from Le Manach et al. (2011) and Le Manach and Pauly (2015), with the same set of assumptions about fisher participation and per-fisher catch rates as used for 2008. The local population numbers were obtained from Institut National de la Statistique et des Études Économiques (INSEE)30 and used for local fishers, while the tourist population was linearly extrapolated from 2008 to 2010. Catches were taxonomically disaggregated as in 2008. In 2014, a bylaw was enacted in Corsica prohibiting the recreational catch of various species including lobsters, spider crab (Maja squinado), a species of cowry (Lurida lurida), and two species of seahorses (Mirmand 2014), indicating that these species may have been disproportionately targeted by recreational fishers. However, this catch reconstruction does not address recreational catches of these species; they will be considered in future reconstructions.
30 https://www.insee.fr/fr/statistiques/3680694

2020 Fisheries Centre Research Reports 28(5)
264
Transition from 2014 to 2018 The catch reconstructed to 2014 was carried forward to 2018 using the semi-automated procedures outlined in Noël (2020), based on FAO landings data to 2018. Semi-automated reconstructed catch data will later be replaced by a more detailed, research-intensive update. Marine biodiversity protection France has agreed to protect the marine biological diversity around the Island of Corsica through the international agreements of the Convention on Biological Diversity (Aichi), United Nations Convention on the Law of the Sea, Ramsar Convention on Wetlands of International Importance, International Coral Reef Initiative and the World Heritage Convention. France is also a signatory to Regional Treaties and Agreements such as the Regional Seas Convention, Barcelona Convention and Natura 2000. Its commitments extend to NGOs and/or public bodies like the Atlantic Arc Network of MPAs (MAIA), Caribbean MPA Network (CaMPAM), Mediterranean MPA Network (MedPAN) and OSPAR Convention (Marine Conservation Institute 2020). “The law of 14 April 2006 has widened the legal notion of national parks and enabled the technical and legal specificities of the marine environment to be considered. France has applied the notion of a marine protected area arising from international commitments and European directives into its own laws. By defining an open list of 15 categories of marine protected areas, the state now has tools that can work together in the same area and that can be combined into regional seas with the result of creating a coherent network of marine protected areas […]. […] The majority of marine protected areas combine protection and the sustainable development of activities. The Agence des Aires Marines Protégées [(AAMP, which in 2017 became the OFB, French Biodiversity Agency)] is the support to all MPA managers [and] it is the manager and co-manager of certain MPAs such as natural marine parks or certain Natura 2000 sites” (OFB 2020). In the Mediterranean, especially in the Island of Corsica, some of the goals in the 2015 national strategy developed by the French Ministry of Ecology, Sustainable Development and Energy aim to undertake a survey prior to the creation of the Cap Corse marine park and implement the PSSA (particularly sensitive sea area) approach in the Strait of Bonifacio and jointly manage the international marine park with Italy (Ministry of Ecology, Sustainable Development and Energy 2015). In Corsica, tourism is the main economic driver, but this entails stress for the environment, such us boat traffic and noise (Poupard et al. 2019); this has led to some associations and locals to close some areas of the reserves to tourism, including ‘eco-tourism’ (Manigault 2019). France (Mainland) The fisheries catches from France’s mainland Mediterranean EEZ were originally reconstructed for 1950 to 2010 by Bultel et al. (2015b, 2016). Here, we document how this reconstruction was updated to 2017, then carried forward to 2018. Reported data Reported data for the French Mediterranean Sea catches were available from the FAO’s GFCM regional database of nominal catches in the Mediterranean and Black Sea area (FAO 2016), as well as from the ICCAT’s nominal catches database for tunas and other large pelagic species (ICCAT 2015). Industrial landings of tunas, billfish and other highly migratory large pelagic species were estimated by Coulter et al. (2020) and are not described here.

Updating to 2018 the 1950-2010 marine catch reconstructions of the Sea Around Us: Part I – Africa, Antarctica, Europe and the North Atlantic
265
The French catch in the Mediterranean was allocated spatially as in Bultel et al. (2015b) using the Gulf of Lions FAO subarea as the mainland EEZ equivalent. For the reconstructed catches in Corsica, see Corsica (France) above. Gear and sectoral allocations of reported catches were completed for 2011-2017 with the same method as in Bultel et al. (2015b). Taxa that did not occur in the initial reconstruction were assigned to gears following earlier gear associations (e.g., new species of Sparidae were assigned to the same gear as Sparidae in 2010). Discards Data suggesting an underestimation and high spatial variability of the discard rates for the French Mediterranean fisheries were presented by Tsagarakis et al. (2013), especially for towed nets and dredges. However, we continue to trust the work done by Bultel et al. (2015b) in identifying discard rates for the different gears in French Mediterranean fisheries, and their rates for 2010 were applied to 2017. Recreational and subsistence catches Recreational catches were estimated for 2011-2017 using the same method as in Bultel et al. (2015b), i.e., using the updated population data from the Institut National de la Statistique et des Études Économiques31 (INSEE) and assumptions on fishery participation and per capita catch rates. The total mainland population of France was used to estimate the population over 15 years of age (18.6% of the total mainland population from 2010-2014). The reconstructed recreational catch for 2010 was used to estimate the number of fishers. By assuming the reconstructed Mediterranean recreational catch equal to 1/3 of the total French recreational catch, with a catch rate of 10 kg·fisher-1·year-1, it was possible to estimate the ratio of fishers within the population of 15 years of age and older. This ratio was held constant for 2011-2017 and used to estimate the number of French Mediterranean fishers. Subsistence catches were carried forward unaltered from 2010 to 2017. Tuna and large pelagic fisheries Artisanal catches of major tunas and other large pelagic species were estimated by gear type or by subtracting industrial catches of these species from ICCAT’s nominal catch database, as was done for 2010. Catches extracted from the GFCM dataset for France but assigned to areas outside the Gulf of Lions subarea were spatially allocated to foreign EEZs or EEZ equivalent areas according to their FAO subarea. This excludes catches from the GFCM Sardinia subarea, which have already been accounted for in the Corsica catch reconstruction to 2017 (see above). Catches recorded in the Adriatic and Ionian subareas were equally assigned to the Greek and Italian mainland EEZs. Catches in the Aegean were fully assigned to Greek mainland EEZ. Catches in the Balearic subarea were assigned to Spain’s mainland EEZ, and catches in the Levant subarea were assigned to the South Cyprus EEZ. Many catches were recorded in the GFCM dataset as “Not known (GFCM area)” and in the absence of additional information, these catches were split evenly between Italy, Greece and Spanish EEZs based on previous years (Bultel et al. 2015b). This assumption will be further investigated in future updates. Some species in 2016, such as the common octopus (Octopus vulgaris) and common sole (Solea solea), were erroneously reported in Sardinia and were reallocated to France’s mainland EEZ.
31 http://www.insee.fr/fr/

2020 Fisheries Centre Research Reports 28(5)
266
Transition from 2017 to 2018 The catch reconstructed to 2017 was carried forward to 2018 using the semi-automated procedures outlined in Noël (2020), based on FAO landings data to 2018. Semi-automated reconstructed catch data will later be replaced by a more detailed, research-intensive update. Marine biodiversity protection France has agreed to protect the biological diversity of its Mediterranean coast through the international agreements of the Convention on Biological Diversity (Aichi), United Nations Convention on the Law of the Sea, Ramsar Convention on Wetlands of International Importance, International Coral Reef Initiative and the World Heritage Convention. France is also a signatory to Regional Treaties and Agreements such as the Regional Seas Convention, Barcelona Convention and Natura 2000. Its commitments extend to NGOs and/or public bodies like the Atlantic Arc Network of MPAs (MAIA), Caribbean MPA Network (CaMPAM), Mediterranean MPA Network (MedPAN) and OSPAR Convention (Marine Conservation Institute 2020). In the French Mediterranean Sea, there is an old fishers’ institution called ‘Prud’homies’. Unlike all other brotherhoods from the Old Regime (i.e., before the French Revolution), prud’homies were not eradicated during the French Revolution because the fishers of Marseille could explain their role during the revolutionary process (Feral 1990; Faget 2011). “Since then, prud’homies were established in each coastal village with the objective of managing, regulating and monitoring fisheries activity within an allocated territory. […] The main scope of prud’homies was to ensure an equitable distribution of resources among fishers, not the management of resources per se. The prud’homies contribute to the management of marine resources by implementing pragmatic conservation measures at a local scale, which they are able to enforce through regulatory, jurisdictional and disciplinary powers. In 2003, the prud’homie of Saint-Raphael designated an area of 450 hectares at Cap-Roux as a reserve (Decugis 2009), whose depth reached up to 80 m. In 2013, the marine reserve was extended for six more years. Fisheries assessments performed by the University of Nice pointed out that a remarkable number of fish species were present in the marine reserve, including emblematic species such as groupers. Within this area, professional and recreational fishing is prohibited. The reserve has been marked off and it is monitored by the prud’homie, which is even entitled to control recreational fishers. This example shows the capacity of small-scale fishers to manage locally the fishing activities in order to sustain the marine ecosystem and biodiversity of their area” (Frangoudes et al. 2020). In the Mediterranean, some of the goals in the national strategy 2015 developed by the French Ministry of Ecology, Sustainable Development and Energy aim to better manage the Gulf of Lion Marine Nature Park developing cooperation with Spain, manage the Calanques National Park, and ensure the coherence of the different tools such as Natura 2000 and General Fisheries Commission for the Mediterranean (Ministry of Ecology, Sustainable Development and Energy 2015). Conclusion Fisheries management within the European Mediterranean EEZs continue to be a point of concern. Networks of Marine Protected Areas (MPAs) have been established in the area, but as of 2013, these appear to be insufficient in providing the protection needed for marine areas that require it most (Meinesz and Blanfuné 2015). However, numerous initiatives to better understand and manage Mediterranean fisheries are underway, including legislation aimed at eliminating discards (STECF 2013) and sustainability audits by the Marine Stewardship Council (MSC 2016), though the latter may also be questionable (Le Manach et al. 2020).

Updating to 2018 the 1950-2010 marine catch reconstructions of the Sea Around Us: Part I – Africa, Antarctica, Europe and the North Atlantic
267
Israel (Mediterranean) Israel’s catches in the Mediterranean Sea were reconstructed from 1950 to 2010 by Edelist et al. (2013, 2016). Here, we summarize the methods applied to update these fisheries catches to 2017, then carry them forward to 2018. Due to intense pressure from Israeli fishers over an extended period of time, fisheries around the state are in decline (Angel et al. 2016). To stem this decline, recent changes in gear allowance and temporal closures have been made for recreational and industrial fisheries during the spawning period in early summer32. Reported data Marine fisheries catches were reported, by year and taxon, by the FAO on behalf of Israel for 2011-2017 (FAO 2019). However, we preferred Israeli national data as a baseline for this update. FAO taxon names were matched as closely as possible to the reconstruction. Reported landings were split into artisanal and industrial on a taxonomic level using ratios from 2009, when the national data were last disaggregated by sector. If a taxon was not reported in 2009, the 2010 sectoral ratios were used. Unreported landings and discards Subsistence catches were assumed to be about 2% of total reported landings for 2011-2017 and were distributed among taxa using the 1977-2010 species breakdown. Bottom trawl discards were estimated to be 47.2% of total annual industrial landings, and were disaggregated using the 2009/2010 taxonomic breakdown (Edelist et al. 2013). Artisanal discards were estimated separately for each taxon as a percentage (3%) of the reported artisanal landings. Recreational catches were carried forward from 2010 to 2017 at 837 tonnes per year with the same taxon breakdown. Artisanal large pelagic species fishery Artisanal longline catch of Atlantic bluefin tuna (Thunnus thynnus) and swordfish (Xiphias gladius) were reconstructed for 2011-2017 following the methods of the original reconstruction (Edelist et al. 2013). Unreported catches of swordfish were carried forward from 2010 at 4 t per year for 2011-2017. Unreported catches of Atlantic bluefin tuna were interpolated between 20 tonnes in 2010 and 10 tonnes in 2017. Transition from 2017 to 2018 The catch reconstructed to 2017 was carried forward to 2018 using the semi-automated procedures outlined in Noël (2020), based on FAO landings data to 2018. Semi-automated reconstructed catch data will later be replaced by a more detailed, research-intensive update. Marine biodiversity protection Israel has agreed to protect its biological diversity through the international Convention on Biological Diversity (Aichi). Its commitments extend to NGOs and/or public bodies like the Mediterranean MPA Network (MedPAN) (Marine Conservation Institute 2020).
32 http://www.haaretz.com/israel-news/.premium-1.712306 https://www.jpost.com/Magazine/Israels-Mediterranean-A-Wild-West-but-with-waves-of-progress-477560 https://www.isfa.org.il/ https://www.moag.gov.il/yhidotmisrad/fishery/publication/2015/pages/Limiting_fishing_Public_comment.aspx

2020 Fisheries Centre Research Reports 28(5)
268
Israel has 13 MPAs and four marine managed areas. The MPAs’ extent is 10 km2 (Marine Conservation Institute 2020), which is tiny even when we consider that the EEZ is not very large (25,100 km2; Edelist et al. 2016). These 17 areas were established in one of the following categories: Marine Protected Area, National Park or Nature Reserve; Israel Nature and Parks Authority (INPA) is the management authority for all the Israeli MPAs (Marine Conservation Institute 2020). Israel’s Institute of Technology developed the Israel Marine Plan, which is a comprehensive policy aiming to “integrate, accompany and support parallel measures of planning, legislation, research and study of the sea in Israel. […] The Israel Marine Plan’s basic approach emphasizes that the marine space is essentially (ultimately) public. It aspires to view the different interests of all the stakeholders fairly and guarantees the provision of its ecosystem services over time. […] Also lacking is a national policy for the management of data and information about the marine space, and for making such information accessible to potential users” (Technion 2015). The main threats to Israeli waters are terrigenous input from the densely populated coastlines as well as vessel traffic and oil exploration. Thus, the above-mentioned plan proposes that MPAs cover 10.3% of the marine space that contains vulnerable habitats and underwater elevations (Technion 2015). Despite various threats, the marine ecosystems along Israel’s coastline remain very diverse. For example, there are 300 species of seaweeds in this small extent of waters compared with the ca. 1200 species described in the entire Eastern Mediterranean (Israel et al. 2020). Italy (mainland, Sardinia and Sicily) Italy’s marine fisheries catches were reconstructed for 1950 to 2010 by Piroddi et al. (2015, see also Pauly et al. 2014) and the marine fisheries catch reconstructions for Italy (mainland), Sardinia and Sicily were summarized in Piroddi et al. (2016a, 2016b, 2016c). Here we summarize the methods applied to update these catches to 2016, which were then carried forward to 2018. Reported data Reported data were available, by gear and by taxon, for 2011-2016 from the Italian national statistical organization ‘ISTAT’ and from the FAO database. The national dataset was used as a baseline. The group ‘marine fishes nei’ was split into several species and/or higher taxonomic groups according to the taxonomic disaggregation of the FAO reported data. Recreational fisheries Information on the number of fishers and the total recreational catches per region and per gear (from shore, boat or by SCUBA) for 2011 were available from the Italian Ministry of Agriculture and Forestry (MIPAAF). Population data for 2011–2016 were extracted from Istituto Nazionale di Statistica (ISTAT)33 to estimate total recreational catches by region for the missing years. We used the percentage of observed number of fishers and catches by fishers to establish a time series of number of recreational fishers and total catches for the missing years. Taxa were then distributed using percentages from the previous reconstruction. New information on the remaining Italian unreported sectors, i.e., discards, subsistence, and illegal catches was not identified. Thus, we applied the percentage used for 2010 in the previous reconstruction, assuming that little or no change occurred in the following 6 years. For example, discards in industrial and artisanal fisheries continue to be demonstrated to be substantial (GFCM and FAO 2016; Sala 2016).
33 https://www.istat.it/en/population-and-households

Updating to 2018 the 1950-2010 marine catch reconstructions of the Sea Around Us: Part I – Africa, Antarctica, Europe and the North Atlantic
269
Sicilian industrial catch reallocation Italian fleets fish in many parts of the Mediterranean (e.g. Tunisia, Malta, Libya, Greece) and land their catch in Sicily (UNEP-MAP-RAC/SPA 2015; Vaccara 2007). During the update of catch data for Sicily, we sought to retroactively change the original catch reconstruction for Sicily by reallocating the relevant portions of catch to their actual physical catch EEZ location instead of their landing and reporting location of Sicily. In order to achieve this, we used fishing effort data, i.e., fishing hours per industrial gear, per Geographical Subarea (GSA), per year in the Mediterranean, for 2009-2018. Allocating catch using the ratios of fishing hours per area relied on the assumption that catch per hour per gear was equivalent across all fishing areas. This assumption was made tentatively until location-specific CPUE information can be located for different fishing grounds, at which point the methods to reallocate catch landed in Sicily will be revised. For 2009-2018, VMS effort data of fishing hours per gear were obtained for Mediterranean GSA using the procedure detailed by Russo et al. (2011a; 2011b; 2014; 2018). GSAs were assigned to the corresponding EEZs within the Mediterranean Sea. The ratio per gear type in each year was applied to industrial catch by gear for 2009-2018. For years prior to 2009, we relied on information from UNEP-MAP-RAC/SPA (2015) and Vaccara (2007), notably that the Sicilian fishing boats expanded further to the eastern Mediterranean in 2004 and were fishing outside of the Italian EEZ-equivalent waters as early as the 1960s. We used the average of the first three years of VMS data, applied it back to 2004 and reproportioned it to exclude Eastern Mediterranean for years prior to 2004. Transition from 2016 to 2018 The catch reconstructed to 2016 was carried forward to 2018 using the semi-automated procedures outlined in Noël (2020), based on FAO landings data to 2018. Semi-automated reconstructed catch data will later be replaced by a more detailed, research-intensive update. Marine biodiversity protection Italy has agreed to protect its biological diversity through the international Convention on Biological Diversity (Aichi), United Nation Convention on the Law of the Sea, the Ramsar Convention on Wetlands of International Importance and the World Heritage Convention. Italy is also a signatory to Regional Treaties and Agreements such as the Regional Seas Convention, the Barcelona Convention and Natura 2000. Its commitments extend to NGOs and/or public bodies like the Mediterranean MPA Network (MedPAN) (Marine Conservation Institute 2020). Italy has 429 MPAs and 22 marine managed areas. The MPAs cover 4,702 km2 (Marine Conservation Institute 2020), which equals less than 1% of the entire EEZ (considering mainland and the islands of Sardinia and Sicily, 538,216 km2; Piroddi et al. 2016a, 2016b, 2016c). Of these MPAs, those that are highly protected reserves cover only 177 km2. The extent of ‘unimplemented MPAs’ is 2,168 km2 (0.4% of the entire EEZ). These MPAs are small compared to the MPAs of other countries, but the difference is that, by law, all MPAs must have a core zone with strict protection. Within the other zones, destructive activities that alter seabed, hydrological, geophysical and biological environments are allowed. “The heart of the protected area is identified as Zone A, the "integral reserve", and it is almost always what Italians term a "no entry, no take" zone, usually prohibiting access except for scientific research and prohibiting all removal or harvest of plants and animals. Zone B, the "general reserve", surrounds Zone A to provide a buffer to human activities and for the resources within the protected area. Generally, in Zone B, human access is allowed but can be limited by permits for boating and diving, for

2020 Fisheries Centre Research Reports 28(5)
270
instance; fishing is restricted to recreational fishing, or sometimes, permitted for local fishermen only. Typically, in Zone C, the "partial reserve", access is open to most general navigation, and the fishing activity typically prohibited is for trawl nets and spear fishing. Restrictions within zones are site specific, and like regulations in national marine sanctuaries, have evolved differently over the past 10-20 years” (National Ocean Service 2019). A recent study that assessed the value of marine natural capital stocks within MPAs located in the Campania Region stressed the importance of effective management and preservation through a network of MPAs (Buonocore et al. 2020). These protected areas, apart from being rich in biodiversity and marine resources, are also important because of their historical heritage (Ministero dell’ Ambiente 2019). To reduce the ‘race to fish’ or resource overexploitation in these waters, the EU adopted a new Local Management Plans for small-scale fisheries, which will implement territorial use rights for fishing (Raicevich et al. 2020). Lebanon The Lebanese fishing industry is mainly artisanal in nature. Lebanon endured several wars in the past four decades, notably a 15-years long civil war that started in 1973 and the Lebanese-Israeli war of 2006, which resulted in huge damage to the fishing industry. Much of the infrastructure was destroyed, along with the bulk of the archived fisheries statistics material. Also, the 2006 war led to a considerable oil spill in Lebanese waters, which decreased the demand for local seafood (Pinello and Dimech 2013). Marine fisheries catches were originally reconstructed for Lebanon for 1950-2010 by Nader et al. (2014, 2016); the update to 2016 by Khalfallah (2020) included retroactive corrections back to 2007. Transition from 2016 to 2018 The catch reconstructed to 2016 was carried forward to 2018 using the semi-automated procedures outlined in Noël (2020), based on FAO landings data to 2018. Semi-automated reconstructed catch data will later be replaced by a more detailed, research-intensive update. Marine biodiversity protection Lebanon has agreed to protect its biological diversity through the international Convention on Biological Diversity (Aichi), United Nations Convention on the Law of the Sea, the Ramsar Convention on Wetlands of International Importance and the World Heritage Convention. Lebanon is also a signatory to Regional Treaties and Agreements such as the Regional Seas Convention and the Barcelona Convention and Natura 2000. Its commitments extend to the Mediterranean MPA Network (MedPAN) (Marine Conservation Institute 2020). Lebanon has two MPAs and one marine-managed area. The MPAs cover less than 1 km2 (Marine Conservation Institute 2020) for an EEZ of 19,265 km2 (Nader et al. 2016). However, the WDPA states that the total area of marine protection in the country is 41 km2 (UNEP-WCMC and IUCN 2020). Between 2010-2012, there was an initiative to support the development of a network of effective Lebanese MPAs, called “Supporting Management of Important Marine Habitats and Species in Lebanon”. This project

Updating to 2018 the 1950-2010 marine catch reconstructions of the Sea Around Us: Part I – Africa, Antarctica, Europe and the North Atlantic
271
evaluated biodiversity in those waters in order to assess the feasibility of declaring three marine protected areas: Ras El Chekaa cliff, Batroun site and the Medfoun site (Marine Conservation Institute 2020). The two MPAs are Palm Islands (a Nature Reserve of 0.4 km2 designated in 1992 after a big campaign by the NGO, Friends of Nature; Kingswood and Khairallah 2001) and the Tyre Coast (a Nature Reserve designated in 1998). The marine managed area is the Deir el Nouriyeh cliffs of Ras Chekaa (a Ramsar Site designated in 2007 with a total area of 63 km2). This Ramsar site is surrounded by large cultivation of olive trees and stands out by “[…] its position as a coastal headland on the Middle East bird migration route: notable bird species include the White Pelican and Purple Heron” (Ramsar sites information service 2020). Libya Marine fisheries in Libya gained importance around the 1980s (Khalfallah 2020). However, since the start of the civil war in Libya in 2011, fishing boats have been used for smuggling people to Europe (Khalfallah 2020). The initial marine fisheries catch reconstruction for Libya covering the years 1950 to 2010 was performed by Khalfallah et al. (2015, 2016) and updated to 2017 by Khalfallah (2020). Taxonomic resolution Taxonomic resolution was noted to improve in FAO catch reporting throughout the time series, but it was likely that species had been caught earlier in the time series and were reported in a broader taxonomic category. In order to disaggregate taxa from broader taxonomic groups, two sets of disaggregation were performed following years where improvements in reported taxonomic resolution were noted to exist. For artisanal and industrial reported and unreported landings, we first disaggregated catches of broad taxonomic groups for 1950-1982 based on the 5-year average (1983-1987) proportion of catches at taxa level per family or broader taxonomic grouping. Next, we further disaggregated the first round of disaggregation and following years (1950-2006) using the 5-year (2007-2011) average reported taxonomic breakdown per family or broader taxonomic group in order to add greater taxonomic resolution throughout the time series. Transition from 2017 to 2018 The catch reconstructed to 2017 was carried forward to 2018 using the semi-automated procedures outlined in Noël (2020), based on FAO landings data to 2018. Semi-automated reconstructed catch data will later be replaced by a more detailed, research-intensive update. Marine biodiversity protection Libya has agreed to protect its biological diversity through the international Convention on Biological Diversity (Aichi) and the Ramsar Convention on Wetlands of International Importance (Marine Conservation Institute 2020), but the present civil war renders many of these commitments aspirational. Libya has two MPAs and two marine managed areas. These areas together cover 2,278 km2 (UNEP-WCMC and IUCN 2020), which equals less than 1 % of the entire EEZ (355,604 km2; Khalfallah et al. 2016). The two MPAs are Ain Zayanah and the Naggaza (a National Park designated in 1992 with a total area of 4000 km2). The marine managed areas are the El Kauf (a National Park designated in 2000) and the Ain Elshakika (a Ramsar Site designated in 2000 with a total area of 0.3 km2). This Ramsar site is inside the Natural Park of El Kauf and is important for habitat waterbirds with potential for ecotourism. It is characterized by “[a]n hypersaline coastal sebkha with limestone rock formations to the south, dunes and mudflats with extensive shrubs from west to east. The site has two connections to the sea, and at high tide seawater reaches the sebkha
2020 Fisheries Centre Research Reports 28(5)
272
during winter and raises the water level to about one meter, but freshwater springs decrease the salinity to some degree” (Ramsar sites information service 2020). Malta Malta, a member of the European Union, is an archipelagic country situated in the center of the Mediterranean, between Tunisia and Sicily. The Maltese fishing industry consists of a multi-species multi-gear commercial fishery and an important recreational fishery (Khalfallah et al. 2017, Darmanin and Vella 2019). The marine fisheries catches of Malta were reconstructed for 1950 to 2010 by Khalfallah et al. (2015, 2016) and updated to 2014 by Khalfallah (2017) before being carried forward to 2018. Since the original reconstruction, unreported landings were added to artisanal and industrial fisheries based on a ratio of 5% of the reported landings per sector for 1950 to 2014. Unreported commercial landings were disaggregated by taxa and gears by sector based on the breakdown per sector, per year across the time series. Transition from for 2014 to 2018 The catch reconstructed to 2014 was carried forward to 2018 using the semi-automated procedures outlined in Noël (2020), based on FAO landings data to 2018. Semi-automated reconstructed catch data will later be replaced by a more detailed, research-intensive update. Marine biodiversity protection Malta has agreed to protect its biological diversity through the international Convention on Biological Diversity (Aichi), the United Nations Convention on the Law of the Sea, the Ramsar Convention on Wetlands of International Importance and the World Heritage Convention. Malta is also a signatory to Regional Treaties and Agreements, such as the Regional Seas Convention, Barcelona Convention and Natura 2000. Its commitments extend to NGOs and/or public bodies like the Atlantic Arc Network of MPAs (MAIA) and Mediterranean MPA Network (MedPAN; Marine Conservation Institute 2020). Malta has 78 MPAs and one marine managed area. The MPAs’ extent is 3,481 km2, which occupies 6.3% of its EEZ (55,542 km2; Khalfallah et al. 2015). The MPA of Rdum Majjiesa lies on the northwest coast of mainland Malta and it has 14 km2 (Marine Conservation Institute 2020). It was the first Marine Protected Area declared under the Environment Protection Act (in 2005) and, in 2008, the first marine Natura 2000 designated in (Ministry for Foreign Affairs and Trade Promotion. 2020.). As we saw in other countries, the creation of MPAs does not protect against all potential stresses. For example, the North-East Malta MPA in the Special Area of Conservation called Zona fil-bahar fil-Grigal ta Malta, which is 351 km2 and was designated in 2016 (Marine Conservation Institute 2020), has been found to be full of plastic trash discarded from ships (more than 70%) and from the city of Birkirkara (nearly 25%) (Liubartseva et al. 2019). At the same time, “the livelihood of most of the local fishermen depends on the sale of highly priced species that is made available to the consumer as fresh fish caught by traditional methods during very short fishing trips. […] Marine protected areas (MPAs) comprise almost half of the inshore fishing zones that, together with several fishing restrictions of numerous wreck conservation sites make the ability of small-scale fishers to fish increasingly challenging” (Vella and Vella 2020). Montenegro Marine fisheries catches for Montenegro were reconstructed for the years 1950 to 2010 by Keskin et al. (2014, 2016); here we document their update to 2016, and their subsequent carry-forward to 2018.

Updating to 2018 the 1950-2010 marine catch reconstructions of the Sea Around Us: Part I – Africa, Antarctica, Europe and the North Atlantic
273
Reported data Reported catch data were available by year and taxon for 2011-2016 from the FAO database and were used here as the reported data baseline. The reported ‘marine fishes nei’ category was about 233 tonnes for 2015-2016 (28% in 2015 and 25% in 2016). To disaggregate this category, the original taxonomic composition from 2010 (Keskin et al. 2014, 2016) was applied for 2011 to 2016. Discards Based on the catch reconstruction for Croatia, discards were estimated to be 30% for the industrial sector and 20% for the artisanal sectors for 2011-2016. The taxonomic disaggregation of discards in the previous reconstruction was applied here. Subsistence and recreational fisheries Subsistence and recreational catches were updated to 2016 by applying a per capita catch rate estimated in the previous reconstruction to the population of Montenegro (www.worldbank.org ). Subsistence and recreational fisheries for 2015 and 2016 were estimated using averages from the last 5 years. The taxonomic compositions used to disaggregate the subsistence and recreational catches in the previous reconstruction were applied here. Transition from for 2016 to 2018 The catch reconstructed to 2016 was carried forward to 2018 using the semi-automated procedures outlined in Noël (2020), based on FAO landings data to 2018. Semi-automated reconstructed catch data will later be replaced by a more detailed, research-intensive update. Marine biodiversity protection Montenegro has agreed to protect its biological diversity through the international agreements of the Convention on Biological Diversity (Aichi) and the Ramsar Convention on Wetlands of International Importance (Marine Conservation Institute 2020). Even though Montenegro is supposed to have 49 MPAs, the MPAtlas suggests a zero coverage by MPAs (Marine Conservation Institute 2020) in its small EEZ (7,460 km2; Keskin et al. 2016), while the WDPA suggests that 10 km2 are being protected. The only Ramsar site that is mentioned in MPAtlas and the only one with a closer connection to the sea is the Tivat Saline (‘Tivatska solila’) in the coastal strip of Tivat Bay. This site has several designations, including Special Flora and Fauna Reserve, Emerald Network, Important Bird Area, Strict Nature Reserve. In addition to supporting migratory birds and unique vegetation, the area provides habitats for several endangered species, notably the European legless lizard (Ophisaurus apodus), the loggerhead turtle (Caretta caretta), and the Albanian water frog (Rana shqiperica). Poaching, pollution, and touristic pressure are threats to this area, as is recreational hunting (Ramsar sites information service 2020). In the Mediterranean, and especially in Montenegro’s waters, vessel activity related with tourism, maritime transports and oil exploration has increased, aggravating direct and indirect threats to cetaceans. It has been found that in the presence of tourism dolphins suffer behavioral changes, such as less diving and absence of milling, socializing and surface feeding. “[…] The future growth of the tourism industry in Montenegro should be given careful consideration, particularly in Herceg-Novi [a location with a high abundance of bottlenose dolphin (Tursiops truncatus) and greatest density of tourism vessels…; however, the] Montenegrin coastline currently lacks effective protective measures for both bottlenose dolphins and marine ecosystems despite their national and international protection status” (Clarkson et al. 2020).

2020 Fisheries Centre Research Reports 28(5)
274
Within Montenegrin waters, it is also possible to find critically endangered species such as the blue shark (Prionace glauca), which use these waters as pupping areas. Among other activities, recreational fishing has the potential to significantly increase their mortality (Cetkovic et al. 2019). “[Moreover,] in Montenegro, the species is not protected by national law and therefore requires the better protection of its population in the coastal waters of this Mediterranean country” (Cetkovic et al. 2019). Morocco (Mediterranean) Morocco, which has most of its coast along the North Atlantic, also has a coast in the southwest of the Mediterranean. The fisheries catches from the Mediterranean part of Morocco’s EEZ were reconstructed by Belhabib (2013, 2016) for 1950 to 2010 and updated to 2016 by Khalfallah (2020). Transition from 2016 to 2018 The catch reconstructed to 2016 was carried forward to 2018 using the semi-automated procedures outlined in Noël (2020), based on FAO landings data to 2018. Semi-automated reconstructed catch data will later be replaced by a more detailed, research-intensive update. Marine biodiversity protection Morocco has agreed to protect its biological diversity through the international Convention on Biological Diversity (Aichi) and the Ramsar Convention on Wetlands of International Importance. Morocco is also a signatory to Regional Treaties and Agreements such as the Barcelona Convention (Marine Conservation Institute 2020). The Mediterranean coast of Morocco has 13 MPAs that cover 222 km2 (Marine Conservation Institute 2020), which equals 1% of the EEZ of Morocco in the Mediterranean Sea (18,302 km2; Belhabib et al. 2016). One of the MPAs is the Al Hoceima National Park, managed by the High Commission for Water and Forests and designated in 2004. Out of its total area of 465 km2, 192 km2 are reported as marine area (Marine Conservation Institute 2020). A seaweeds checklist study in the National Park found that this MPA contains two thirds of the species recorded from the Mediterranean coast of Morocco (Moussa et al. 2018). Regarding marine animals, “accounts from interviews conducted with fishers during the establishment of the marine park of Al Hoceima reported monk seal sightings until 2002 in the area of Al Hoceima and as far east as Cap Trois Fourches (Mo et al. 2004)” (Mo et al. 2011). However, the current Mediterranean monk seal (Monachus monachus) distribution in the Mediterranean is mainly limited to the Greek and Turkish waters. The research suggests further conservation measures in Al Hoceima National Park in order to avoid further population fragmentation in this area of the western Mediterranean (Mo et al. 2011). Moreover, the main threat that affects Osprey (Pandion haliaetus) habitats and the Osprey breeding population in this area are harmful fishing activities such as dynamite and poison fishing (Monti et al. 2013). Palestine (Gaza Strip) The Palestinian coast off the Gaza Strip has a small Exclusive Economic Zone (EEZ). However, access to the EEZ by Palestinian fishers is limited by heavy restrictions imposed by Israel (Anon 2010; Melon 2011). The fisheries catches from the Gaza’s Strip’s EEZ were originally reconstructed for 1950 to 2010 by Abudaya et al. (2013, 2016) and updated to 2015 by Khalfallah (2020).

Updating to 2018 the 1950-2010 marine catch reconstructions of the Sea Around Us: Part I – Africa, Antarctica, Europe and the North Atlantic
275
Transition from 2015 to 2018 The catch reconstructed to 2015 was carried forward to 2018 using the semi-automated procedures outlined in Noël (2020), based on FAO landings data to 2018. Semi-automated reconstructed catch data will later be replaced by a more detailed, research-intensive update. Marine biodiversity protection It seems that there is little to no literature about marine biodiversity and its legal protection in the Gaza Strip, i.e., in Palestine. Some of the main threats for this biodiversity, beside fishing itself, are likely connected to pesticides and wastewater. Aerial application of pesticides is one of the likely causes of death for the early stage of farmed fish (El-Nahhal and Hams 2020). Moreover, remediation measures are required to sanitize the areas around hospitals that are being affected by medical waste (Al-Khatib et al. 2020), which may eventually affect coastal species. The Palestinian authorities of this area who are in charge of managing waste infrastructures such as landfills, incinerators, and sewage treatment plants tend to prefer temporal structures rather than more expensive permanent structures. However, these short-term solutions are more susceptible to failure subsequently causing environmental harm (Stamatopoulou-Robbins 2020). On the other hand, some sectors of the population do care for their surroundings and health of the environment (Omran and Sharaf 2020). A Palestinian study to evaluate the current participation of women in the environment in Gaza City, found that “[…] the majority of the female participants (62.9%) reported that they clean their surroundings daily in the Gaza Strip. Furthermore, the results contend that the large proportions of the participants were involved in different environmental activities, such as agriculture, solid waste management, sewerage, and management of waste resources in their living area” (Omran and Sharaf 2020). Slovenia The marine fisheries catches for Slovenia were reconstructed for 1950 to 2010 by Bolje et al. (2015, 2016). Here, we describe how this reconstruction was updated to 2018. Reported data Updated national data were obtained for 2011-2018 from the Fisheries Research Institute of Slovenia and from the FAO database, and slight differences were detected between these two datasets. These differences were likely due to rounding errors when Slovenian data were submitted to the FAO. The national data, which were more detailed, were used as the reported data baseline for this update. Subsistence fishery Subsistence catches were estimated using the original reconstruction methods (Bolje et al. 2015) where 1% of Slovenia’s population was considered coastal and the per capita subsistence catch rate was assumed to be equal to half of that of Croatia (Matić-Skoko et al. 2014). The taxonomic breakdown for the subsistence catch was assumed to be the same as that for Croatia (Matić-Skoko et al. 2014).

2020 Fisheries Centre Research Reports 28(5)
276
Recreational fishery Recreational catch data have been collected by the Ministry of Agriculture, Forestry and Food for 2016-2018 and were provided through personal communication (Polona Bunič, pers. comm.). Recreational landings were disaggregated by taxa based on the breakdown in Bolje et al. (2015). Marine biodiversity protection Slovenia has agreed to protect its biological diversity through the international Convention on Biological Diversity (Aichi) and the Ramsar Convention on Wetlands of International Importance (Marine Conservation Institute 2020). Slovenia is also a signatory to Regional Treaties and Agreements such as the Natura 2000, and it is also part of the network of Managers of Marine Protected Areas in the Mediterranean (MedPAN) (Marine Conservation Institute 2020). As in other European countries, the Slovenian Fisheries Local Action Group (FLAG) was organized with inputs from the European Fisheries Fund. The main aim was to develop a local strategy for a sustainable development of economic, social and environmental welfare (Spreizer and Caf 2020). The very small Slovenian coast is impacted by water drainage, shoreline buildings and ports (Hrvatin 2020). Thus, even before the Nature Conservation Act in 1999 the government adopted the Law on Natural and Cultural Heritage in 1981 (Vidmar and Turk 2011). It is believed that “[t]he advantage of protected areas lies in the fact that they have their own legal acts, which define conservation measures, management, monitoring and surveillance and thus leave less space to inconsistency and misinterpretation” (Vidmar and Turk 2011). However, in Slovenia “[a]major effort would be needed in the near future in order to define appropriate administrative, financial and technical solutions for the management of marine protected areas. Beside the need for new, properly managed marine protected areas that would, together with the existing ones, encompass the great majority of the typical marine and coastal habitat types as well as habitats of rare and endangered species”. (Vidmar and Turk 2011). Slovenia has 39 MPAs and four marine managed areas. The first MPAs established in the 1990s were two nature parks, Sečovlje salina and Strunjan, and two natural monuments, Rt Madona and Debeli rtič (Vidmar and Turk 2011). Some fish communities’ recovery has already been observed in the Gulf of Trieste, especially in the Debeli rtič area where densities of some labrid species (Symphodus cinereus and Symphodus roissali) were higher than in unprotected areas, notably due to the extended and densely vegetated infralittoral belt of the Debeli rtič area (Lipej et al. 2003). Spain (Balearic Islands) Spain’s Balearic Islands in the western Mediterranean basin are an archipelago of four islands. The marine fisheries catches around the Balearic Islands were reconstructed for 1950 to 2010 by Carreras et al. (2015, 2016). Here we summarize the methods used to update this reconstruction to 2017, and carry it forward to 2018. Baseline data Reported catch data were available by year and taxa for 2011 and 2017 from official fishery reports of the ‘Government of the Balearic Islands’ (Govern de les Illes Balears 2015, 2017). These were deemed the reported catch data baseline for this catch reconstruction update.

Updating to 2018 the 1950-2010 marine catch reconstructions of the Sea Around Us: Part I – Africa, Antarctica, Europe and the North Atlantic
277
A taxonomic group of ‘other finfishes’ was reported in the national data but was disaggregated according to the taxonomic composition of 2010 (Carreras et al. 2015). Landings of calamars, ‘pota’ (squids), and other molluscs were assigned to ‘Mollusca’. Unreported commercial catch The taxonomic catch contribution of the unreported artisanal black-market-based fishery to the total reconstructed catch of 2008-2010 available from Carreras et al. (2015) was averaged and applied to 2017. Unreported trawl catch by fishing vessels from mainland Spain was calculated for 2011-2017 in the same fashion as in Carreras et al. (2015) and allocated to taxa given their mean proportions from 2008 to 2010. Subsistence catch The subsistence catch rate per fisher was carried forward from 2010 to 2017 and applied to the number of fishers (Govern de les Illes Balears 2015) to estimate subsistence catches. The taxonomic disaggregation of subsistence catches for 2008-2010 was applied to the 2011-2017 reconstructed subsistence catch. Recreational catch Recreational fishing in the Balearic Islands is practiced by its permanent residents as well as by tourists. To reconstruct recreational catches, Carreras et al. (2015) estimated and applied a per capita catch rate to each of these two groups. The same was applied here for 2011-2017 using the per capita catch rates of 2010 from the previous reconstructions and updated population estimates. The averaged taxonomic disaggregation for 2008-2010 was applied to the recreational catch of 2011-2017. Discards Discards were calculated for the artisanal and industrial fisheries for 2011-2017 using the discarded contribution to the total reconstructed catch of 2008-2010 from the previous reconstruction. Transition from 2017 to 2018 The catch reconstructed to 2017 was carried forward to 2018 using the semi-automated procedures outlined in Noël (2020), based on landings data to 2018 from the Government of the Balearic Islands. Semi-automated reconstructed catch data will later be replaced by a more detailed, research-intensive update. Marine biodiversity protection Spain protects the biological diversity of the Balearic Islands through international agreements such as the Convention on Biological Diversity (Aichi) and the Ramsar Convention on Wetlands of International Importance, but also through regional treaties like Natura 2000. Spain is also a signatory to the Barcelona Convention and to the international network of UNESCO Man and the Biosphere, and its commitments extend to NGOs and/or public bodies like the OSPAR Convention (Marine Conservation Institute 2020). Moreover, in order to establish and manage MPAs in a more integrated way, MPAs count with “steering committees formed by representatives of different organizations and groups, such as government, fishermen associations (i.e. cofradias), recreational fishermen associations, yacht clubs, conservation organizations (NGOs), scientific institutions, and others are also implemented in each of the regionally declared marine reserve of Balearic Islands. These committees are advisory bodies with public participation that offer their opinion about the management and make proposals and suggestions to the managers, while informing the different social sectors on the condition and operation of the reserves” (Otero et al. 2015). The MPAs in the Balearic Islands that are established by the Autonomous Regions and the Central Government are: ‘Cabrera island National Park’, ‘Parque Natural de Sa Dragonera’, ‘Parque Natural de Ses

2020 Fisheries Centre Research Reports 28(5)
278
Salines d´Eivisa i Formentera’, ‘Parque Natural de la Peninsula de Llevant’, ‘Parque Natural de s’Albufera des Grau’, ‘Reserva Natural Des Vedrà’ and ‘Es Vedranell i Els Illots de Ponent’. For example, in the Cabrera National Park, the Steering Committee (central and regional government, NGOs, cofradias, universities and research institutes) evaluates and approves the annual management plan. “[In this park,] patrolling is carried out with the support also of other administrations, such as the Seprona (Nature Protection Service) of the Spanish Civil Guard, an institution responsible for state nature conservation and management of the hunting and fishing industry. […] The National Parks Authority has an annual budget dedicated to reinforce the network of National Parks and can provide additional financial resources through negotiation with the regional governments. In the case of Cabrera National Park, there are also government funds available for socioeconomic programmes in the area of influence of the Park” (Otero 2015). Despite having a large steering committee and funds, MPAs, such as the Cabrera Island, suffer from insufficient patrolling and monitoring (López-Ornat et al. 2014). Syria The Syrian marine fishery is mainly small-scale, multi-gear, and multi-species. It includes, however, a small but heavily-subsidized industrial bottom trawl fishery (Saad 2010). Syria has been entangled in a civil war since 2011, and most of its infrastructure has been destroyed, leading to a humanitarian and economic crisis. Millions of Syrians have fled Syria for refuge in other countries, resulting in one of the worst refugee crises in the world. It is expected that there has not been any fisheries monitoring and/or control since the start of the civil war in Syria in 2011. Marine fisheries catches were originally reconstructed for Syria for 1950 to 2010 by Ulman et al. (2015a; 2015b; 2016) and were updated to 2015 by Khalfallah (2020). Transition from 2015 to 2018 The catch reconstructed to 2015 was carried forward to 2018 using the semi-automated procedures outlined in Noël (2020), based on FAO landings data to 2018. Semi-automated reconstructed catch data will later be replaced by a more detailed, research-intensive update. Marine biodiversity protection It appears that there is no English-language literature on marine biodiversity and its legal protection in Syria. However, Syria has agreed to protect biological diversity through the international Convention on Biological Diversity (Aichi) (Marine Conservation Institute 2020) and the Ramsar Convention on Wetlands of International Importance (Ramsar sites information service 2020). The MPAtlas reports five MPAs in the EEZ of Syria (10,189 km2, Ulman et al. 2016). However, their extent is unknown or so small that it doesn’t appear on the MPAtlas of the Marine Conservation Institute (2020). Protected Planet states that the marine protected areas cover 25 km2 (UNEP-WCMC and IUCN 2020). The five mentioned MPAs are Cedar-Fir Protected Area (designated in 1996 with a total area of 13 km2), Fanar Ibn Hani Protected Area (designated in 2000 with a total area of 10 km2), Ferunluk Protected Area (designated in 1999 with a total area of 15 km2), Om Al Toyour Protected Area (designated in 1999 with a total area of 10 km2) and Ras El Bassit Protected Area (designated in 1999 with a total area of 30 km2). The MPAs of Ras El Bassit and Om Al Toyour, published in Resolution No. N026/T of 1999 and 15/T of 1999 respectively, prohibit spearfishing, scuba diving and commercial fisheries (Gaudin and De Young 2007).

Updating to 2018 the 1950-2010 marine catch reconstructions of the Sea Around Us: Part I – Africa, Antarctica, Europe and the North Atlantic
279
Far from the sea there is a Nature Reserve, Sabkhat al-Jabbul, which is a Ramsar site (with 100 km2 and designated in 1998) with a “large permanent saline lake surrounded by semi-arid steppe, the lake is an important staging, wintering and breeding area for large numbers of water birds; it regularly supports more than 1% of the world population of Greater Flamingo” (Ramsar sites information service 2020). Tunisia Overall, Tunisia has a relatively good fisheries data collection system. Notably, correction coefficients are applied to nominal trawl, purse seine, and artisanal fisheries catches to account for unreported commercial catches and discards as well as the fraction of the catch allocated to subsistence. Marine fisheries catches were reconstructed for 1950-2010 by Halouani et al. (2015, 2016) and updated to 2016 by Khalfallah (2020). Transition from 2016 to 2018 The catch reconstructed to 2016 was carried forward to 2018 using the semi-automated procedures outlined in Noël (2020), based on FAO landings data to 2018. Semi-automated reconstructed catch data will later be replaced by a more detailed, research-intensive update. Marine biodiversity protection Tunisia has agreed to protect its biological diversity through the international Convention on Biological Diversity (Aichi) and the Ramsar Convention on Wetlands of International Importance. Tunisia is also a signatory to Regional Treaties and Agreements such as the Barcelona Convention. Its commitments extend to NGOs and/or public bodies like the Mediterranean MPA Network (MedPAN) (Marine Conservation Institute 2020). According to the MPAtlas, Tunisia has 28 MPAs and 15 marine managed areas. Some sources say that the MPAs cover 761 km2 (Marine Conservation Institute 2020), while other sources suggests that 1,042 km2
(www.protectedplanet.net/country/TN) are protected; whichever source is used, only about 1% of the entire EEZ (102,047 km2; Halouani et al. 2016). Tunisia’s first National Park was established by decree in April 1977 in the Zembra Archipelago (Zarrouk et al. 2016). In 2001 it was classified as a Specially Protected Area of Mediterranean Importance, protecting 47 km2 of marine area. The management plan of the marine area was implemented by the MedMPA Project (Marine Conservation Institute 2020). On paper the archipelago is a no-take area, as all fishing activities are completely prohibited within 1.5 nautical miles from the archipelago (SPA/RAC 2020a). Even though the island is not inhabited and the National Park management plan forbids spearfishing and commercial fishing (Gaudin and De Young 2007), illegal fishing and poaching do occur (Marine Conservation Institute 2020). “In Tunisia and in other south-eastern Mediterranean countries, it is of crucial importance, in addition to monitoring fish assemblages, that the proposed zoning of MPAs is applied and that restrictions, especially in no-take zones, are enforced in order to enable fish assemblages to recover. Otherwise, the expected benefits for fish assemblages, overall biodiversity and ecosystems, along with a number of positive effects for society [are less likely to be achieved]” (Lamine et al. 2018). Many endangered marine species depend on the Zembra Archipelago habitats. The most representative species (regarding population size and conservation status) are the Scopoli’s shearwater Calonectris diomedea and Patella ferruginea (Zarrouk et al. 2016). This limpet is one of the most endangered endemic marine

2020 Fisheries Centre Research Reports 28(5)
280
invertebrates of the western Mediterranean rocky shores, mainly due to the extensive illegal practice of poaching, which imbalances the population. This is why it is so important to develop and implement a well-designed and long-term monitoring plan, especially in the Zembra National Park, which could help reduce the loss of reproductive potential of this threatened species. (Zarrouk et al. 2016). There are two additional Specially Protected Areas of Mediterranean importance in Tunisia' waters, La Galite Archipelago in the North and Kneiss Island in the Gulf of Gabes (Emmanouilidou et al. 2019). Illegal fishing is reported to still occur in La Galite (SPA/RAC 2020b). An MPA has been planned for the North of the inhabited Kerkennah Islands (Le Port et al. 2019). Results and Discussion Marine fisheries catches were reconstructed for the countries of the Mediterranean basin for 2011-2018 (Figure 1), updating the previous reconstructions that covered the 1950-2010 time period as summarized in Pauly and Zeller (2016).
Figure 1. Reconstructed catches within the Mediterranean Sea for all countries’ Exclusive Economic Zones countries for 1950-2018 including catches by foreign fishing entities. The category ‘Others' includes remaining Mediterranean countries which are too small to be visible separately. Overall, results suggest a high fishing pressure in the relatively small Mediterranean Sea that has led to the overexploitation of regional fish stocks. While completing this work, we noticed that there was a knowledge gap regarding the state of marine fisheries within the countries of the Southern Mediterranean compared to those of the Northern Mediterranean. This is due to a combination of factors described in detail in Khalfallah (2020). Notably, most of the Northern Mediterranean countries are part of the European Union and are economically developed, with enough financial resources for scientific research and classical fisheries stock assessments. In contrast, the countries of the southern Mediterranean are developing economically and have fewer financial resources for research. Most of these countries have also been subject to political turmoil/conflict that deeply affected their economies and, in some cases, led to the increase of unreported and foreign illegal fishing activities. Acknowledgements Funding for the work presented here was provided by the Minderoo Foundation, by the Marisla, Oak, and David and Lucille Packard Foundations, and by the Bloomberg Philanthropies through Rare.

Updating to 2018 the 1950-2010 marine catch reconstructions of the Sea Around Us: Part I – Africa, Antarctica, Europe and the North Atlantic
281
References (Mediterranean Sea) Brotz, L. and D. Pauly. 2012. Jellyfish populations in the Mediterranean Sea. Acta Adriatica, 52(2): 159-172. Cacaud, P. 2005. Fisheries laws and regulations in the Mediterranean: a comparative study. Studies and
Reviews. GFCM 75, FAO, Rome. 40 p. Cashion, M, N. Bailly and D. Pauly. 2019. Official catch data underrepresent shark and ray taxa caught in
Mediterranean and Black Sea fisheries. Marine Policy, 105: 1-9. Coll, M., C. Piroddi, C. Albouy, F. Ben Rais Lasram, W.W.L. Cheung, V. Christensen, V.S. Karpouzi, F.
Guilhaumon, D. Mouillot, M. Paleczny, M.L.D. Palomares, D. Pauly, J. Steenbeek, P. Trujillo and R. Watson. 2012. The Mediterranean Sea under siege: spatial overlap between marine biodiversity, cumulative threats and marine reserves. Global Ecology and Biogeography 21(4): 465-480. doi.org/10.1111/j.1466-8238.2011.00697.x
Froese, R., S. Garthe, U. Piatowski and D. Pauly. 2004. Trophic signatures of marine organisms in the Mediterranean as compared with other ecosystems. Belgian Journal of Zoology, 134 (Supplement 1): 31-36.
Keskin, Ç. and D. Pauly. 2018. Reconciling Trends of Mean Trophic Level and Mean Temperature of the Catch in the Eastern Mediterranean and Black Seas. Mediterranean Marine Science, 19(1): 79-83.
Khalfallah, M. 2020. Data-poor fisheries: Case studies form the Southern Mediterranean and the Arabian Peninsula. Ph.D. thesis, the University of British Columbia, Vancouver, 349p.
Lleonart, J., J. Lloret, S. Touzeau, J. Salat, L. Recasens and F. Sardà. 1998. Mediterranean fisheries, an overview. SAP meeting 13-17/10/1998, Barcelona. 17 p.
Mouillot D., C. Albouy, F. Guilhaumon, F. Ben Rais Lasram, M. Coll, V. Devictor, C.N. Meynard, D. Pauly, J.A. Tomasini, M. Troussellier, L. Velez, R. Watson, E.J.P. Douzery and N. Mouquet. 2011. Protected and threatened components of fish biodiversity in the Mediterranean Sea. Current Biology, 21(12): 1044-1050. doi.org/10.1016/j.cub.2011.05.005
Noël, S.-L. 2020. Semi-automation procedure for catch reconstruction forward carry, p. 15-20. In: B. Derrick, M. Khalfallah, V. Relano, D. Zeller and D. Pauly (eds). Updating to 2018 the 1950-2010 Marine Catch Reconstructions of the Sea Around Us: Part I – Africa, Antarctica, Europe and the North Atlantic. Fisheries Centre Research Report 28(5).
Pauly, D. and M.L.D. Palomares. 2000. Approaches for dealing with three sources of bias when studying the fishing down marine food web phenomenon., p. 61-66. In: F. Durand (ed). Fishing down the Mediterranean food webs? Proceedings of a CIESM Workshop held in Kerkyra, Greece, 26-30 July 2000. CIESM Workshop Series No. 12.
Pauly, D., A. Ulman, C. Piroddi, E. Bultel and M. Coll. 2014. ‘Reported’ versus ‘likely’ fisheries catches of four Mediterranean countries, p. 11-17. In: J. Lleonart and F. Maynou (eds). The Ecosystem approach to fisheries in the Mediterranean and Black Seas. Scientia Marina. 78S1.
Pauly, D. and D. Zeller (eds). 2016. Global Atlas of Marine Fisheries: A critical appraisal of catches and ecosystem impacts. Island Press, Washington D.C., xii +497 p.
Popov, S., T. Cashion, B. Derrick, M. Frias-Donaghey and M. Khalfallah. 2020. Black Sea: updated catch reconstructions to 2018, p. 205-215. In: B. Derrick, M. Khalfallah, V. Relano, D. Zeller and D. Pauly (eds). Updating to 2018 the 1950-2010 Marine Catch Reconstructions of the Sea Around Us: Part I – Africa, Antarctica, Europe and the North Atlantic. Fisheries Centre Research Report 28(5).
Stergiou, K.I., A.C. Tsikliras and D. Pauly. 2009. Farming up the Mediterranean food webs. Conservation Biology, 23(1): 230-232. doi.org/10.1111/j.1523-1739.2008.01077.x

2020 Fisheries Centre Research Reports 28(5)
282
References (by country) Albania Albanian National Statistics Summary. 2011. Ministry of Environment, Forestry and Water Administration,
Directorate of Fishing Policies, Albanian Institute of Statistics. Albanian National Statistics Summary. 2019. Ministry of Agriculture and Rural Development, Albanian
Institute of Statistics. Marine Conservation Institute. 2020. MPAtlas [Online]. Seattle, WA. Available at: www.mpatlas.org MedReAct, Association for Protection of Aquatic Wildlife of Albania. 2016. Promoting fish recovery in the
Karaburun – Sazan Marine Protected Area. Available at: medreact.files.wordpress.com/2017/02/project-report.pdf
Moutopoulos, D.K., B. Bradshaw and D. Pauly. 2015. Reconstruction of Albania fishery catches by fishing gear (1950-2010). Fisheries Centre Working Paper #2015-12, 12 p.
Moutopoulos, D.K., B. Bradshaw and D. Pauly. 2016. Albania, p. 185. In: D. Pauly and D. Zeller (eds). Global Atlas of Marine Fisheries: A critical appraisal of catches and ecosystem impacts. Island Press, Washington D.C.
Noël, S.-L. 2020. Semi-automation procedure for catch reconstruction forward carry, p. 15-20. In: B. Derrick, M. Khalfallah, V. Relano, D. Zeller and D. Pauly (eds). Updating to 2018 the 1950-2010 Marine Catch Reconstructions of the Sea Around Us: Part I – Africa, Antarctica, Europe and the North Atlantic. Fisheries Centre Research Report 28(5).
Algeria Babali, N., D. Belhabib, M. Kacher, F. Louanchi and D. Pauly. 2018. Recreational fisheries economics between
illusion and reality: the case of Algeria. PLOS ONE, 13(8): e0201602. Belhabib, D., D. Pauly, S. Harper and D. Zeller. 2012. Reconstruction of Marine Fisheries Catches for Algeria,
1950-2010, p. 1-22. In: D. Belhabib, D. Zeller, S. Harper and D. Pauly (eds). Marine Fisheries Catches in West Africa, 1950-2010, Part I. Fisheries Centre Research Reports 20(3).
Belhabib, D., D. Pauly, S. Harper and D. Zeller. 2016. Algeria, p. 186. In: D. Pauly and D. Zeller (eds). Global Atlas of Marine Fisheries: A critical Appraisal of Catches and Ecosystem Impacts. Island Press, Washington, DC.
Belmahi, A.E., Y. Belmahi, M. Benabdi, A.L. Bouziani, S.A. Darna, Y. Bouslah, M. Bendoula and M. Bouderbala. 2020. First study of sea turtle strandings in Algeria (western Mediterranean) and associated threats: 2016–2017. Herpetozoa, 33: 113-120.
Boubekri, I., A. Caveen, A.B. Djebar, R. Amara, H. Mazurek. 2018. Structure and spatio-temporal dynamics of the artisanal small-scale fisheries at the future MPA of “Taza” (Algerian coast, SW Mediterranean). Mediterranean Marine Science, 19 (3): 555-571. doi.org/10.12681/mms.16192
Coppola, S.R. 2001. Inventory of Artisanal Fishery Communities in the Western-Central Mediterranean. FAO, Rome. 64 p.
Khalfallah, M. 2020. Data-poor fisheries: Case studies form the Southern Mediterranean and the Arabian Peninsula. Ph.D. thesis, the University of British Columbia, Vancouver, 349p.
Khelil, N., M. Larid, S. Grimes, I. Le Berre and I. Peuziat. 2019. Challenges and opportunities in promoting integrated coastal zone management in Algeria: Demonstration from the Algiers coast. Ocean & Coastal Management, 168: 185-196.
Maurin, C. 1962. Etude des fonds chalutables de la Méditerranée occidentale (écologie et pêche): Résultats des compagnes des navires océanographiques «Président-Théodore-Tissier» 1957 à 1960 et « Thalassa » 1960 et 1961. Revue des Travaux de l'Institut des Peches Maritimes 26(2). 218 p.
Marine Conservation Institute. 2020. MPAtlas [Online]. Seattle, WA. Available at: www.mpatlas.org Noël, S.-L. 2020. Semi-automation procedure for catch reconstruction forward carry, p. 15-20. In: B. Derrick,
M. Khalfallah, V. Relano, D. Zeller and D. Pauly (eds). Updating to 2018 the 1950-2010 Marine Catch

Updating to 2018 the 1950-2010 marine catch reconstructions of the Sea Around Us: Part I – Africa, Antarctica, Europe and the North Atlantic
283
Reconstructions of the Sea Around Us: Part I – Africa, Antarctica, Europe and the North Atlantic. Fisheries Centre Research Report 28(5).
Oliver, P. 1983. Les ressources halieutiques de la Méditerranée. Première partie: Méditerranée occidentale. FAO, Rome. 135 p.
Zeghdoudi, E. 2006. Modélisation bioéconomique des pêcheries méditerraneénnes: Application aux petits pélagiques de la baie de Bouismail (Algérie). MSc thesis, University of Universitat de Barcelona, Barcelona, 71 p.
Bosnia & Herzegovina Iritani, D., L. Färber, K. Zylich and D. Zeller. 2015. Reconstruction of fisheries catches for Bosnia-
Herzegovina: 1950-2010. Fisheries Centre Working Paper #2015-15, 7 p. Iritani, D., L. Färber, K. Zylich and D. Zeller. 2016. Bosnia- Herzegovnia, p. 205. In: D. Pauly and D. Zeller
(eds). Global Atlas of Marine Fisheries: A critical Appraisal of Catches and Ecosystem Impacts. Island Press, Washington, DC.
Marine Conservation Institute. 2020. MPAtlas [Online]. Seattle, WA. Available at: www.mpatlas.org Matić-Skoko, S., A. Soldo, N. Stagličić, D. Blažević and D. Iritani. 2014. Croatian marine fisheries (Adriatic
Sea): 1950-2010. Fisheries Centre Working Paper #2014-26, 16 p. Noël, S.-L. 2020. Semi-automation procedure for catch reconstruction forward carry, p. 15-20. In: B. Derrick,
M. Khalfallah, V. Relano, D. Zeller and D. Pauly (eds). Updating to 2018 the 1950-2010 Marine Catch Reconstructions of the Sea Around Us: Part I – Africa, Antarctica, Europe and the North Atlantic. Fisheries Centre Research Report 28(5).
UNEP-WCMC and IUCN. 2020. Protected Planet: Protected Area Profile for Bosnia and Herzegovina from the World Database of Protected Areas, June 2020. Available at: www.protectedplanet.net/country/BA
Gabrié C., E. Lagabrielle, C. Bissery, E. Crochelet, B. Meola, C. Webster, J. Claudet, A. Chassanite, S. Marinesque, P. Robert, M. Goutx and C. Quod. 2012. The Status of Marine Protected Areas in the Mediterranean Sea. MedPAN & RAC/SPA. 256 p.
Porej, D. and S. Matić. 2009. Protected area management effectiveness in Bosnia and Herzegovina, Final report of the RAPPAM analysis. Bosnia and Herzegovina Federal Ministry of Environment and Tourism and WWF Mediterranean Programme.
Croatia Basioli, J. 1979. Uspon sredstava malog obalnog ribolova ne donosi povećanje morske lovine. Morsko
ribarstvo, 1: 19-23. Fredotović, M., A. Pallaoro, G. Sinovčić, A. Soldo, V. Tičina and N. Vrgoč. 2007. Procjena očekivanih koristi i troškova pridruživanja Hrvatske EU na području ribarstva. Ekonomski Institut, Zagreb, Croatia. 81 p. Guala I., G. Di Carlo, Z. Jakl, M. Šijan, M. Prvan, M. Radman, V. Matas, N. Sinjkević, H. Čižmek, I. Zubak, S.
Budimir, M. Pavičić, S. Bratinčević, M. Bilan, I. Bušelić, A. Vrbatović, M. Špika, A. Žuljević, V. Nikolić, N. Stagličić, N. Baković, M. Ramov, O. Pečar and M.M. Podvinski. 2012. Monitoring of Posidonia oceanica meadows in Croatian Protected Areas. Association Sunce Technical Report, 49 p + annexes.
Le Diréach, L., P. Bonhomme, M. Ourgaud, C. Boudouresque, and G. Cadiou. 2013. By-catch and discards of elasmobranchs in the artisanal net fishery in a Corsican MPA (north-western Mediterranean). Rapp. Comm. Int. Mer Médit., 40: 493.
Mackelworth, P., D. Holcer, J. Jovanović and C. Fortuna. 2011. Marine conservation and accession: the future for the Croatian Adriatic. Environmental management, 47(4): 644-655.
Marine Conservation Institute. 2020. MPAtlas [Online]. Seattle, WA. Available at: www.mpatlas.org Matić-Skoko, S., N. Stagličić, D. Blažević, J. Šiljić and D. Iritani. 2014. Croatian marine fisheries (Adriatic
Sea): 1950-2013. Fisheries Centre Working Paper #2014-26, 16 p.

2020 Fisheries Centre Research Reports 28(5)
284
Matić-Skoko, S., N. Stagličić, D. Blažević, J. Šiljić and D. Iritani. 2016. Croatia, p. 232. In: D. Pauly and D. Zeller (eds). Global Atlas of Marine Fisheries: A critical Appraisal of Catches and Ecosystem Impacts. Island Press, Washington, DC.
Mirmand, C. 2014. Arrêté n°2014177-001 portant interdiction de pêche de certaines espèces marines aux pêcheurs de loisir dans les eaux territoriales autor de las Corse, June 26, 2014. Direction Interrégionale de la Mer Méditerranée Service Rêglementation Contrôle, République Française.
Noël, S.-L. 2020. Semi-automation procedure for catch reconstruction forward carry, p. 15-20. In: B. Derrick, M. Khalfallah, V. Relano, D. Zeller and D. Pauly (eds). Updating to 2018 the 1950-2010 Marine Catch Reconstructions of the Sea Around Us: Part I – Africa, Antarctica, Europe and the North Atlantic. Fisheries Centre Research Report 28(5).
Par, V., D. Kovačić, M. Lovrinov, L. Bavčević and T. Vodopija. 2006. Studija izvodivosti izgradnje ribarske infrastrukture sukladno pravnoj stečevini EU. Agronomski fakultet, Sveučilište u Zagrebu. 116 p.
Tzanatos, E., M. Georgiadis and P. Peristeraki. 2020. Small-Scale Fisheries in Greece: Status, Problems, and Management, p.125-150. In: J.J. Pascual-Fernández, C. Pita, M. Bavinck (eds). Small-Scale Fisheries in Europe: Status, Resilience and Governance. Springer, Cham.
Vodopija, T. 1997. Stanje i pravci razvitka hrvatskog morskog ribarstva, p. 427-437. In: F. Božidar (ed). Tisuću godina prvog spomena ribarstva u Hrvata. HAZU, Zagreb.
Cyprus (North and South) Anon. 2016. Cyprus annual report on efforts during 2015 to achieve a sustainable balance between fishing
capacity and fishing opportunities. Republic of Cyprus Ministry of Agriculture Natural Resources and Environment and Department of Fisheries and Marine Research 1416 Nicosia, Nicosia. 24 p.
Dentes de Carvalho Gaspar, N., M. Keatinge and J. Guillen Garcia. 2016. The 2016 Annual Economic Report on the EU Fishing Fleet (STECF 16-11). EUR 28375 EN. Publications Office of the European Union, Luxembourg. Scientific, Technical and Economic Committee for Fisheries (STECF) 48 p. doi.org/10.2788/842673
European Union. 2007. Pilot study report on the evaluation of discards of the Cyprus fishery. As part of Cyprus's national fisheries data collection programme 2006, EU Data Collection Regulation (DCR) No 1543/2000, No 1639/2001 and No 1581/2004. 41 p.
Hadjimichael, M., A. Bruggeman and M.A. Lange. 2014. Tragedy of the few? A political ecology perspective of the right to the sea: The Cyprus marine aquaculture sector. Marine Policy, 49: 12-19.
Jimenez, C., K. Achilleos, A. Petrou, I. Hadjioannou, A. Guido, A. Rosso, V. Gerovasileiou, P.G. Albano, D. Di Franco, V. Andreou and R.A. Alhaija. 2019. A dream within a dream: Kakoskali Cave, a unique marine ecosystem in Cyprus (Levantine Sea), p. 91-110. In: B. Öztürk (ed). Marine Caves of the Eastern Mediterranean Sea. Biodiversity, Threats and Conservation. Publication no. 53. Turkish Marine Reaserch Foundation (TUDAV), Istanbul, Turkey.
Marine Conservation Institute. 2020. MPAtlas [Online]. Seattle, WA. Available at: www.mpatlas.org Noël, S.-L. 2020. Semi-automation procedure for catch reconstruction forward carry, p. 15-20. In: B. Derrick,
M. Khalfallah, V. Relano, D. Zeller and D. Pauly (eds). Updating to 2018 the 1950-2010 Marine Catch Reconstructions of the Sea Around Us: Part I – Africa, Antarctica, Europe and the North Atlantic. Fisheries Centre Research Report 28(5).
Ulman, A., B.A. Çiçek, I. Salihoglu, A. Petrou, M. Patsalidou, D. Pauly and D. Zeller. 2013. The reconstruction and unification of Cyprus’s marine fisheries catch data, 1950-2010. Fisheries Centre Working Paper #2013-09, 69 p.
Ulman, A., B.A. Çiçek, I. Salihoglu, A. Petrou, M. Patsalidou, D. Pauly and D. Zeller. 2015. Unifying the catch data of a divided island: Cyprus’s marine fisheries catches, 1950–2010. Environment, Development and Sustainability, 17(4): 801-821.

Updating to 2018 the 1950-2010 marine catch reconstructions of the Sea Around Us: Part I – Africa, Antarctica, Europe and the North Atlantic
285
Ulman, A., B.A. Çiçek, I. Salihoglu, A. Petrou, M. Patsalidou, D. Pauly and D. Zeller, D. 2016a. Cyprus (North), p 234. In: D. Pauly and D. Zeller (eds). Global Atlas of Marine Fisheries: A critical Appraisal of Catches and Ecosystem Impacts. Island Press, Washington, DC.
Ulman, A., B.A. Çiçek, I. Salihoglu, A. Petrou, M. Patsalidou, D. Pauly and D. Zeller. 2016b. Cyprus (South), p 235. In: D. Pauly and D. Zeller (eds). Global Atlas of Marine Fisheries: A critical Appraisal of Catches and Ecosystem Impacts. Island Press, Washington, DC.
Egypt (Mediterranean) Kasparek, M., B.J. Godley and A.C. Broderick. 2001. Nesting of the green turtle, Chelonia mydas, in the
Mediterranean: a review of status and conservation needs. Zoology in the Middle East, 24(1): 45-74. Khalfallah, M. 2020. Data-poor fisheries: Case studies form the Southern Mediterranean and the Arabian
Peninsula. Ph.D. thesis, the University of British Columbia, Vancouver, 349p. Mahmoud, H.H., L. Teh, M. Khalfallah and D. Pauly. 2015. Reconstruction of marine fisheries statistics in the
Egyptian Mediterranean Sea, 1950-2010. Fisheries Centre Working Paper #2015-85, 16 p. Mahmoud, H.H., L. Teh, M. Khalfallah and D. Pauly. 2016. Egypt, p 243. In: D. Pauly and D. Zeller (eds).
Global Atlas of Marine Fisheries: A critical Appraisal of Catches and Ecosystem Impacts. Island Press, Washington, DC.
Marine Conservation Institute. 2020. MPAtlas [Online]. Seattle, WA. Available at: www.mpatlas.org Noël, S.-L. 2020. Semi-automation procedure for catch reconstruction forward carry, p. 15-20. In: B. Derrick,
M. Khalfallah, V. Relano, D. Zeller and D. Pauly (eds). Updating to 2018 the 1950-2010 Marine Catch Reconstructions of the Sea Around Us: Part I – Africa, Antarctica, Europe and the North Atlantic. Fisheries Centre Research Report 28(5).
Ramsar sites information service. 2020a. Lake Bardawil. Available at: rsis.ramsar.org/ris/407 Ramsar sites information service. 2020b. Lake Burullus. Available at: rsis.ramsar.org/ris/408
France (Corsica) Anon. 2014. Le homard, une alternative à la langouste en Corse. France 3 Corse ViaStella, 7 June, 2016.
Available at: france3-regions.francetvinfo.fr/corse/haute-corse/le-homard-une-alternative-la-langouste-en-corse-493921.html
Le Manach, F., D. Dura, A. Père, J.-J. Riutort, P. Lejeune, M.-C. Santoni, J.-M. Culioli and D. Pauly. 2011. Preliminary estimate of total marine fisheries catches in Corsica, France (1950-2008), p. 3-14. In: S. Harper and D. Zeller (eds). Fisheries catch reconstructions: Islands, Part II. Fisheries Centre Research Report 19(4).
Le Manach, F. and D. Pauly. 2015. Update of the fisheries catch reconstruction of Corsica (France), 1950-2010. Fisheries Centre Working Paper #2015-33, 5 p.
Le Manach, F., D. Dura, A. Père, J.-J. Riutort, P. Lejeune, M.-C. Santoni, J.-M. Culioli and D. Pauly. 2016. France (Corsica), p. 254. In: D. Pauly and D. Zeller (eds). Global Atlas of Marine Fisheries: A critical Appraisal of Catches and Ecosystem Impacts. Island Press, Washington, DC.
Leblond, E., F. Daurès, C. Merrien, S. Demaneche, S. Le-Blond, P. Berthou, C. Macher and G.L. Corre. 2014. Activité 2012 des navires de pêche de la région Corse. Système d'Informations Halieutiques. 9 p.
Leblond, E., F. Daurès, C. Merrien, S. Demaneche, S. Le-Blond, P. Berthou, C. Macher and P. Lespagnol. 2013. Activité 2011 des navires de pêche de la région Corse. Système d'Informations Halieutiques. 10 p.
Leblond, E., S. Demaneche, S.L. Blond, C. Merrien, P. Berthou and F. Daurès. 2011. Activité 2009 des navires de pêche de la région Corse. Système d'Informations Halieutiques. 9 p.
Leblond, E., S. Demaneche, S.L. Blond, C. Merrien, P. Berthou, F. Daurès and M. Pitel-Roudaut. 2010. Bilan des données d'activité des navires de pêche français en 2008 - Tendances récentes. Système d'Informations Halieutiques. 12 p.

2020 Fisheries Centre Research Reports 28(5)
286
Macher, C., E. Leblond, F. Daurès, C. Merrien, S. Demaneche, S. Le-Blond, P. Lespagnol and P. Berthou. 2012. Activité 2010 des navires de pêche de la région Corse. Système d'Informations Halieutiques. 9 p.
Manigault, C. 2019. Develop strategies in ecotourism: case study of Corsica (France). Bachelor’s Thesis, Turku Univeristy of Applied Sciences, Finland, 43 p.
Marine Conservation Institute. 2020. MPAtlas [Online]. Seattle, WA. Available at: www.mpatlas.org Ministry of Ecology, Sustainable Development and Energy. 2015. National strategy for the creation and
management of marine protected areas. Available at: www.sprep.org/attachments/VirLib/French_Polynesia/national-strategy-management-mpa-france.pdf
Noël, S.-L. 2020. Semi-automation procedure for catch reconstruction forward carry, p. 15-20. In: B. Derrick, M. Khalfallah, V. Relano, D. Zeller and D. Pauly (eds). Updating to 2018 the 1950-2010 Marine Catch Reconstructions of the Sea Around Us: Part I – Africa, Antarctica, Europe and the North Atlantic. Fisheries Centre Research Report 28(5).
OFB. 2020. Marine protected areas: tools to manage and preserve the marine environment. Available at: www.aires-marines.com/Marine-Protected-Areas
Père, A. 2012. Déclin des populations de langouste rouge et baisse de la ressource halieutique en Corse - causes et perspectives. Doctoral Thesis in Marine Biology, Université de Corse-Pascal Paoli, École Doctorale Environnement et Société, Corsica, 480 p.
Poupard, M., M. Ferrari, J. Schluter, P. Astruch, T. Schohn, B. Rouanet, A. Goujard, A. Lyonnet, P. Giraudet, V. Barchasz, V. Gies, P. Best, J.-M. Dominici, T. Lengagne, T. Soriano and H. Glotin. 2019. Passive acoustics to monitor flagship species near boat traffic in the UNESCO World Heritage natural reserve of Scandola, p. 260-270. In: C. Gargiulo and C. Zoppi (eds). Planning, nature and ecosystem services. FedOAPress, Naples.
France (Mainland) Bultel, E., D. Gascuel, F. Le Manach, D. Pauly and K. Zylich. 2015a. Catch reconstruction for the French
Atlantic coast, 1950-2010. Fisheries Centre Working Paper #2015-37, 20 p. Bultel, E., F. Le Manach, A. Ulman and D. Pauly. 2015b. Catch reconstruction for the French Mediterranean
Sea, 1950-2010. Fisheries Centre Working Paper #2015-38, 20 p. Bultel, E., F. Le Manach, A. Ulman and D. Pauly. 2016. France (Mediterranean), p. 263. In: D. Pauly and D.
Zeller (eds). Global Atlas of Marine Fisheries: A critical Appraisal of Catches and Ecosystem Impacts. Island Press, Washington, DC.
Coulter, A., T. Cashion, A. Cisneros-Montemayor, S. Popov, G. Tsui, F. Le Manach, L. Schiller, M. Palomares, D. Zeller and D. Pauly. 2020. Using harmonized historical catch data to infer the expansion of global tuna fisheries. Fisheries Research, 221:105379. doi.org/10.1016/j.fishres.2019.105379
Decugis, C. 2009. Les Prud’homies, collective fisheries management in the Mediterranean, p. 76-79. In: P. Prouzet, S. Sicot, F. Véronneau, J. Allardi, N. Susperregui. International Meeting of Small-scale Professional Sea nad Inshore Fishers: The official records. Biarritz, France, 25-27 November, 2009. CNPNEM, Paris, France.
Faget, D. 2011. Marseille et la Mer, Hommes et Environnement marin (XVIII-XX siècle). Presses Universitaires de Provence-Presses Universitaires de Rennes, Rennes. 394 p.
FAO. 2016. Fisheries and aquaculture software. FishStatJ - software for fishery statistical time series. Food and Agriculture Organization, Rome. Available at: www.fao.org/fishery/statistics/software/fishstatj/en
Feral, F. 1990. La prud’homie des pêcheurs de Palavas, droit et économie de l’environnement. Lyon Publications Périodiques Spécialisées, Lyon.
Frangoudes, K., M. Bellanger, O. Curtil and O. Guyader. 2020. Small-Scale Fisheries in France: Activities and Governance Issues, p. 231-252. In: J.J. Pascual-Fernández, C. Pita, M. Bavinck (eds). Small-Scale Fisheries in Europe: Status, Resilience and Governance. Springer, Cham.

Updating to 2018 the 1950-2010 marine catch reconstructions of the Sea Around Us: Part I – Africa, Antarctica, Europe and the North Atlantic
287
ICCAT. 2015. Task-I nominal catch from 1950 to 2014. Task-I nominal catch. Available at: www.iccat.int/en/accesingdb.HTM
Le Manach, F., J.L. Jacquet, M. Bailey, C. Jouanneau and C. Nouvian, C. 2020. Small is beautiful, but large is certified: A comparison between fisheries the Marine Stewardship Council (MSC) features in its promotional materials and MSC-certified fisheries. PLoS ONE, 15(5): e0231073.
Marine Conservation Institute. 2020. MPAtlas [Online]. Seattle, WA. Available at: www.mpatlas.org Meinesz, A. and A. Blanfuné. 2015. 1983-2013: Development of marine protected areas along the French
Mediterranean coasts and perspectives for achievement of the Aichi target. Marine Policy, 54: 6. Ministry of Ecology, Sustainable Development and Energy. 2015. National strategy for the creation and
management of marine protected areas. Available at: www.sprep.org/attachments/VirLib/French_Polynesia/national-strategy-management-mpa-france.pdf
MSC. 2016. Mediterranean fisheries selected for sustainability audit [Press release]. 18 July, 2016. Available at: www.msc.org/newsroom/news/mediterranean-fisheries-selected-for-sustainability-audit
Noël, S.-L. 2020. Semi-automation procedure for catch reconstruction forward carry, p. 15-20. In: B. Derrick, M. Khalfallah, V. Relano, D. Zeller and D. Pauly (eds). Updating to 2018 the 1950-2010 Marine Catch Reconstructions of the Sea Around Us: Part I – Africa, Antarctica, Europe and the North Atlantic. Fisheries Centre Research Report 28(5).
STECF. 2013. Landing obligation in EU fisheries (STECF-13-23). EUR 26330 EN, JRC 86112. Publications Office of the European Union, Luxembourg. 115 p.
Tsagarakis, K., A. Palialexis and V. Vassilopoulou. 2013. Mediterranean fishery discards: review of the existing knowledge. ICES Journal of Marine Science, 6.
Israel (Mediterranean) Angel, D., D. Edelist and S. Freeman. 2016. Local perspectives on regional challenges: jellyfish proliferation
and fish stock management along the Israeli Mediterranean coast. Regional Environmental Change, 16: 315-323.
Edelist, D., A. Scheinin, O. Sonin, J. Shapiro, P. Salameh, G. Rilov, Y. Benayahu, D. Schulz and D. Zeller. 2013. Israel: Reconstructed estimates of total fisheries removals in the Mediterranean, 1950-2010. Acta Adriatica, 54(2): 253-263.
Edelist, D., A. Scheinin, O. Sonin, J. Shapiro, P. Salameh, G. Rilov, Y. Benayahu, D. Schulz and D. Zeller. 2016. Israel (Mediterranean), p. 300. In: D. Pauly and D. Zeller (eds). Global Atlas of Marine Fisheries: A critical Appraisal of Catches and Ecosystem Impacts. Island Press, Washington, DC.
FAO. 2019. The state of world fisheries and aquaculture: contributing to food security and nutrition for all. Food and Agriculture Organization, Rome.
Israel, A., A. Golberg and A. Neori. 2020. The seaweed resources of Israel in the Eastern Mediterranean Sea. Botanica Marina, 63(1): 85-95. doi.org/10.1515/bot-2019-0048
Marine Conservation Institute. 2020. MPAtlas [Online]. Seattle, WA. Available at: www.mpatlas.org Noël, S.-L. 2020. Semi-automation procedure for catch reconstruction forward carry, p. 15-20. In: B. Derrick,
M. Khalfallah, V. Relano, D. Zeller and D. Pauly (eds). Updating to 2018 the 1950-2010 Marine Catch Reconstructions of the Sea Around Us: Part I – Africa, Antarctica, Europe and the North Atlantic. Fisheries Centre Research Report 28(5).
Technion, 2015. The Israel Marine Plan. Available at: msp-israel.net.technion.ac.il/files/2015/12/MSP_plan.compressed.pdf
Italy (Mainland, Sardinia and Sicily) Buonocore, E., L. Appolloni, G.F. Russo and P.P. Franzese. 2020. Assessing natural capital value in marine
ecosystems through an environmental accounting model: A case study in Southern Italy. Ecological modelling, 419: 108958.

2020 Fisheries Centre Research Reports 28(5)
288
GFCM and FAO. 2016. The State of Mediterranean and Black Sea Fisheries. Food and Agriculture Organization, Rome. 152 p.
Marine Conservation Institute. 2020. MPAtlas [Online]. Seattle, WA. Available at: www.mpatlas.org Ministero dell’ Ambiente. 2019. Aree Naturali Protette. Available at: www.minambiente.it/pagina/aree-
naturali-protette National Ocean Service. 2019. Italy’s “Sanctuaries”-called “Marine Protected Areas”. Available at:
montereybay.noaa.gov/international/italia/mpa.html Noël, S.-L. 2020. Semi-automation procedure for catch reconstruction forward carry, p. 15-20. In: B. Derrick,
M. Khalfallah, V. Relano, D. Zeller and D. Pauly (eds). Updating to 2018 the 1950-2010 Marine Catch Reconstructions of the Sea Around Us: Part I – Africa, Antarctica, Europe and the North Atlantic. Fisheries Centre Research Report 28(5).
Pauly, D., A. Ulman, C. Piroddi, E. Bultel and M. Coll. 2014. 'Reported' versus 'likely' fisheries catches of four Mediterranean countries. Scientia Marina, 78(S1): 11-17.
Piroddi, C., M. Gristina, K. Zylich, K. Greer, A. Ulman, D. Zeller and D. Pauly. 2015. Reconstruction of Italy’s marine fisheries removals and fishing capacity, 1950–2010. Fisheries Research, 172: 137-147.
Piroddi, C., M. Gristina, K. Zylich, K. Greer, A. Ulman, D. Zeller and D. Pauly. 2016a. Italy (Mainland), p. 302. In: D. Pauly and D. Zeller (eds). Global Atlas of Marine Fisheries: A critical Appraisal of Catches and Ecosystem Impacts. Island Press, Washington, DC.
Piroddi, C., M. Gristina, K. Zylich, K. Greer, A. Ulman, D. Zeller and D. Pauly. 2016b. Italy (Sardinia), p. 303. In: D. Pauly and D. Zeller (eds). Global Atlas of Marine Fisheries: A critical Appraisal of Catches and Ecosystem Impacts. Island Press, Washington, DC.
Piroddi, C., M. Gristina, K. Zylich, K. Greer, A. Ulman, D. Zeller and D. Pauly. 2016c. Italy (Sicily), p. 304. In: D. Pauly and D. Zeller (eds). Global Atlas of Marine Fisheries: A critical Appraisal of Catches and Ecosystem Impacts. Island Press, Washington, DC.
Raicevich, S., F. Grati, O. Giovanardi, P. Sartor, M. Sbrana, R. Silvestri, R.T. Baino, F. Andaloro, P. Battaglia, T. Romeo and M. Spagnolo. 2020. The Unexploited Potential of Small-Scale Fisheries in Italy: Analysis and Perspectives on the Status and Resilience of a Neglected Fishery Sector, p. 191-211. In: J.J. Pascual-Fernández, C. Pita, M. Bavinck (eds). Small-Scale Fisheries in Europe: Status, Resilience and Governance. Springer, Cham.
Russo, T., A. Parisi, M. Prorgi, F. Boccoli, I. Cignini, M. Tordoni and S. Cataudella. 2011a. When behaviour reveals activity: inferring fishing métier from VMS data by artificial neural network. Fisheries Research, 111: 53–64.
Russo, T., A. Parisi and S. Cataudella. 2011b. New insights in interpolating fishing tracks from VMS data for different métiers. Fisheries Research, 108: 184–194.
Russo, T., L. D'Andrea, A. Parisi and S. Cataudella. 2014. VMSbase: An R-Package for VMS and Logbook Data Management and Analysis in Fisheries Ecology. PLoS ONE, 9(6): e100195. doi.org/10.1371/journal.pone.0100195
Russo, T., E.B. Morello, A. Parisi, G. Scarcella, S. Angelini, L. Labanchi, M. Martinelli, L. D’Andrea, A. Santojanni, E. Arneri and S. Cataudella. 2018. A model combining landings and VMS data to estimate landings by fishing ground and harbor. Fisheries Research, 199: 218-230.
Sala, A. 2016. Review of the EU small-scale driftnet fisheries. Marine Policy, 74: 236-244. UNEP-MAP-RAC/SPA. 2015. Sicily Channel/Tunisian Plateau: Status and conservation of fisheries.
Regional Activity Centre for Specially Protected Areas (RAC/SPA), Tunis. 76 p. Vaccara, V.L. 2007. Preliminare ai Piani de Gestione della Pesca Siciliana. Instituto per l'Ambiente Marino
Costiero (IAMC) - U.O.D. Di Mazara del Vallo, Italy. 54 p.

Updating to 2018 the 1950-2010 marine catch reconstructions of the Sea Around Us: Part I – Africa, Antarctica, Europe and the North Atlantic
289
Lebanon Khalfallah, M. 2020. Data-poor fisheries: Case studies form the Southern Mediterranean and the Arabian
Peninsula. Ph.D. thesis, the University of British Columbia, Vancouver, 349p. Kingswood, S.C. and N.H. Khairallah. 2001. Lebanon, p. 99-101. In:D.P. Mallon and S.C. Kingswood
(compilers). Antelopes.Part 4: North Africa, the Middle East and Asia. Global Surey and Regional Action Plans. SSC Antelope Specialist Group, IUCN, Gland, Switzerland and Cambridge, UK.
Marine Conservation Institute. 2020. MPAtlas [Online]. Seattle, WA. Available at: www.mpatlas.org Nader, M.R., S. Indary and N.R. Moniri. 2014. Historical Fisheries Catch Reconstruction for Lebanon (GSA
27), 1950-2010. Fisheries Centre Working Paper #2014-11, 19 p. Nader, M.R., S. Indary and N.R. Moniri. 2016. Lebanon, p. 318. In: D. Pauly and D. Zeller (eds). Global Atlas
of Marine Fisheries: A critical Appraisal of Catches and Ecosystem Impacts. Island Press, Washington, DC.
Noël, S.-L. 2020. Semi-automation procedure for catch reconstruction forward carry, p. 15-20. In: B. Derrick, M. Khalfallah, V. Relano, D. Zeller and D. Pauly (eds). Updating to 2018 the 1950-2010 Marine Catch Reconstructions of the Sea Around Us: Part I – Africa, Antarctica, Europe and the North Atlantic. Fisheries Centre Research Report 28(5).
Pinello, D. and M. Dimech. 2013. Socio-Economic Analysis of the Lebanese Fishing Fleet.Scientific and Institutional Cooperation to Support Responsible Fisheries in the Eastern Mediterranean. Food and Agriculture Organization, Athens 78 p.
Ramsar sites information service. 2020. Deir el Nouriyeh cliffs of Ras Chekaa. Available at: rsis.ramsar.org/ris/979
UNEP-WCMC and IUCN. 2020. Protected Planet: Protected Area Profile for Lebanon from the World Database of Protected Areas, June 2020. Available at: www.protectedplanet.net/country/LB
Libya Khalfallah, M. 2020. Data-poor fisheries: Case studies form the Southern Mediterranean and the Arabian
Peninsula. Ph.D. thesis, the University of British Columbia, Vancouver, 349p. Khalfallah, M., D. Belhabib, D. Zeller and D. Pauly. 2015. Reconstruction of Marine Fisheries catches for Libya
(1950-2010). Fisheries Centre Working paper #2015-47, 15p. Khalfallah, M., D. Belhabib, D. Zeller and D. Pauly. 2016. Libya, p. 320. In: D. Pauly and D. Zeller (eds).
Global Atlas of Marine Fisheries: A Critical Appraisal of Catches and Ecosystem Impacts. Island Press, Washington, DC.
Marine Conservation Institute. 2020. MPAtlas [Online]. Seattle, WA. Available at: www.mpatlas.org Noël, S.-L. 2020. Semi-automation procedure for catch reconstruction forward carry, p. 15-20. In: B. Derrick,
M. Khalfallah, V. Relano, D. Zeller and D. Pauly (eds). Updating to 2018 the 1950-2010 Marine Catch Reconstructions of the Sea Around Us: Part I – Africa, Antarctica, Europe and the North Atlantic. Fisheries Centre Research Report 28(5).
Ramsar sites information service. 2020. Ain Elshakika. Available at: rsis.ramsar.org/ris/1026?language=en UNEP-WCMC and IUCN. 2020. Protected Planet: Protected Area Profile for Libya from the World Database
of Protected Areas, June 2020. Available at: www.protectedplanet.net/country/LY
Malta Darmanin, S.A. and A. Vella. 2019. First Central Mediterranean Scientific Field Study on Recreational Fishing
Targeting the Ecosystem Approach to Sustainability. Frontiers in Marine Science, 6(390): 1-16. Khalfallah, M., Dimech, M., Ulman, A., Zeller, D. and Pauly, D. 2015. Reconstruction of marine fisheries
catches for the Republic of Malta (1950-2010). Fisheries Centre Working Paper #2015-43, 13p.

2020 Fisheries Centre Research Reports 28(5)
290
Khalfallah, M., M. Dimech, A. Ulman, D. Zeller and D. Pauly. 2016. Malta, p. 327. In: D. Pauly and D. Zeller (eds). Global Atlas of Marine Fisheries: A critical Appraisal of Catches and Ecosystem Impacts. Island Press, Washington, DC.
Khalfallah, M., M. Dimech, A. Ulman, D. Zeller and D. Pauly. 2017. Reconstruction of Marine Fisheries Catches for the Republic of Malta (1950-2010). Mediterranean Marine Science, 18(2):42-49.
Noël, S.-L. 2020. Semi-automation procedure for catch reconstruction forward carry, p. 15-20. In: B. Derrick, M. Khalfallah, V. Relano, D. Zeller and D. Pauly (eds). Updating to 2018 the 1950-2010 Marine Catch Reconstructions of the Sea Around Us: Part I – Africa, Antarctica, Europe and the North Atlantic. Fisheries Centre Research Report 28(5).
Marine Conservation Institute. 2020. MPAtlas [Online]. Seattle, WA. Available at: www.mpatlas.org Ministry for Foreign Affairs and Trade Promotion. 2020. Malta substantially enlarges its Marine Protected
Areas to an area larger than the country itself. Available at: https://oceanconference.un.org/commitments/?id=18578
Liubartseva, S., G. Coppini and R. Lecci. 2019. Are Mediterranean Marine Protected Areas sheltered from plastic pollution? Marine pollution bulletin, 140: 579-587.
Vella, A. and N. Vella. 2020. Maltese small-scale fisheries: halting the decline, p. 213-229. In: J.J. Pascual-Fernández, C. Pita, M. Bavinck (eds). Small-Scale Fisheries in Europe: Status, Resilience and Governance. Springer, Cham.
Montenegro Ćetković, I.Ć., A. Pešić, A. Joksimović, J. Tomanić and S. Ralević. 2019. Morphometric measurements of
newborn blue shark Prionace glauca (Linnaeus, 1758) and characteristics of its potential parturition areas in coastal waters of Montenegro (Southeastern Adriatic). Acta Adriatica, 60(1): 61-68.
Clarkson, J., F. Christiansen, T. Awbery, L. Abbiss, N. Nikpaljevic and A. Akkaya. 2020. Non-targeted tourism affects the behavioural budgets of bottlenose dolphins Tursiops truncatus in the South Adriatic (Montenegro). Marine Ecology Progress Series, 638: 165-176.
Keskin, C., A. Ulman, D. Iritani and D. Zeller. 2014. Reconstruction of fisheries catches for Montenegro: 1950-2010. Fisheries Centre Working Paper #2014-27, 11 p.
Keskin, C., A. Ulman, D. Iritani and D. Zeller. 2016. Montenegro, p. 334. In: D. Pauly and D. Zeller (eds). Global Atlas of Marine Fisheries: A critical Appraisal of Catches and Ecosystem Impacts. Island Press, Washington, DC.
Marine Conservation Institute. 2020. MPAtlas [Online]. Seattle, WA. Available at: www.mpatlas.org Noël, S.-L. 2020. Semi-automation procedure for catch reconstruction forward carry, p. 15-20. In: B. Derrick,
M. Khalfallah, V. Relano, D. Zeller and D. Pauly (eds). Updating to 2018 the 1950-2010 Marine Catch Reconstructions of the Sea Around Us: Part I – Africa, Antarctica, Europe and the North Atlantic. Fisheries Centre Research Report 28(5).
Ramsar sites information service. 2020. Tivat Saline. Available at: rsis.ramsar.org/ris/2135
Morocco Belhabib, D., S. Harper, D. Zeller and D. Pauly. 2013. Reconstruction of marine fisheries catches from
Morocco (north, central and south), 1950-2010, p. 23-40. In: D. Belhabib, D. Zeller, S. Harper and D. Pauly (eds). Marine fisheries catches in West Africa, 1950-2010, part I. Fisheries Centre Research Reports 20(3).
Belhabib, D., S. Harper, D. Zeller and D. Pauly. 2016. Morocco, p. 336. In: D. Pauly and D. Zeller (eds). Global Atlas of Marine Fisheries: A critical Appraisal of Catches and Ecosystem Impacts. Island Press, Washington, DC.
Khalfallah, M. 2020. Data-poor fisheries: Case studies form the Southern Mediterranean and the Arabian Peninsula. Ph.D. thesis, the University of British Columbia, Vancouver, 349p.

Updating to 2018 the 1950-2010 marine catch reconstructions of the Sea Around Us: Part I – Africa, Antarctica, Europe and the North Atlantic
291
Marine Conservation Institute. 2020. MPAtlas [Online]. Seattle, WA. Available at: www.mpatlas.org Mo, G., H. Bazairi, E. Salvati, S. Agnesi, A. Limam, L.D. Nachite, C. Rais, I. Sadki, L. Tunesi, N. Zine. 2004.
Habitat suitability and sightings of the Mediterranean monk seal in the National Park of Hocemia (Morocco). Rapports et Procès-Verbaux des Réunions de la Commission Internationale pour l'Exploration Scientifique de la Mer Méditerranée, 37: 538.
Mo, G., H. Bazairi, A. Bayed and S. Agnesi. 2011. Survey on Mediterranean Monk Seal (Monachus monachus) Sightings in Mediterranean Morocco. Aquatic Mammals, 37(3): 248-255.
Monti, F., H. Nibani, J.M. Dominici, H.R. Idrissi, M. Thévenet, P.C. Beaubrun and O. Duriez. 2013. The vulnerable Osprey breeding population of the Al Hoceima National Park, Morocco: present status and threats. Ostrich, 84(3): 199-204.
Moussa, H., M. Hassoun, G. Salhi, H. Zbakh, H. y Riadi. 2018. Checklist of seaweeds of Al-Hoceima National Park of Morocco (Mediterranean Marine Protected Area). Acta Botanica Malacitana, 430: 91-109. doi.org/10.24310/abm.v43i0.4966
Noël, S.-L. 2020. Semi-automation procedure for catch reconstruction forward carry, p. 15-20. In: B. Derrick, M. Khalfallah, V. Relano, D. Zeller and D. Pauly (eds). Updating to 2018 the 1950-2010 Marine Catch Reconstructions of the Sea Around Us: Part I – Africa, Antarctica, Europe and the North Atlantic. Fisheries Centre Research Report 28(5).
Palestine (Gaza Strip) Abudaya, M., S. Harper, A. Ulman and D. Zeller. 2013. Correcting mis- and under-reported marine fisheries
catches for the Gaza Strip: 1950-2010. Acta Adriatica, 54(2): 241-252. Abudaya, M., S. Harper, A. Ulman and D. Zeller. 2016. Gaza Strip, p. 273. In: D. Pauly and D. Zeller (eds).
Global Atlas of Marine Fisheries: A critical Appraisal of Catches and Ecosystem Impacts. Island Press, Washington, DC.
Al-Khatib, I.A., A.S. Khalaf, M.I. Al-Sari and F. Anayah. 2020. Medical waste management at three hospitals in Jenin district, Palestine. Environmental Monitoring and Assessment, 192(1): 10.
Anon. 2010. Between the Fence and a Hard place: The humanitarian impact of Israeli-imposed restrictions on access to land and sea in the Gaza Strip. Special Focus (August 2010). Office for the Coordination of Humanitarian Affairs – Occupied Palestinian territory and World Food Programme, United Nations. 36 p.
El-Nahhal, Y. and S. Hams. 2020. Effects of Some Pesticides on Tilapia nilotica and Daphnia magna Life. IUG Journal of Natural Studies, 28(1): 28-37.
Khalfallah, M. 2020. Data-poor fisheries: Case studies form the Southern Mediterranean and the Arabian Peninsula. Ph.D. thesis, the University of British Columbia, Vancouver, Canada: 349 p.
Melon, M. 2011. Shifting Paradigms: Israel’s Enforcement of the Buffer Zone in the Gaza Strip. Al-Haq, West Bank, Palestine. 24 p.
Noël, S.-L. 2020. Semi-automation procedure for catch reconstruction forward carry, p. 15-20. In: B. Derrick, M. Khalfallah, V. Relano, D. Zeller and D. Pauly (eds). Updating to 2018 the 1950-2010 Marine Catch Reconstructions of the Sea Around Us: Part I – Africa, Antarctica, Europe and the North Atlantic. Fisheries Centre Research Report 28(5).
Omran, A. and Sharaf, F.I., 2020. Relationship Between Women and Environment Toward Sustainable Development: A Case Study from Palestine, p. 63-73. In: A. Omran and O. Schwarz-Herion. Sustaining our Environment for Better Future. Springer, Singapore.
Stamatopoulou-Robbins, S.C. 2020. Failure to build: Sewage and the choppy temporality of infrastructure in Palestine. Environment and Planning E: Nature and Space, 1-15. doi.org/10.1177/2514848620908193

2020 Fisheries Centre Research Reports 28(5)
292
Slovenia Bolje, A., B. Marčeta, A. Blejec and A. Lindop. 2015. Marine fish catches in Slovenia between 1950 and 2010.
Fisheries Centre Working Paper #2015-58, 13 p. Bolje, A., B. Marčeta, A. Blejec and A. Lindop. 2016. Slovenia, p. 388. In: D. Pauly and D. Zeller (eds). Global
Atlas of Marine Fisheries: A critical Appraisal of Catches and Ecosystem Impacts. Island Press, Washington, DC.
Hrvatin, M., B. Komac and M. Zorn. 2020. Water Resources in Slovenia, p. 47-79. In: A. Negm, G. Romanescu, M. Zelenáková. Water Resources Management in Balkan Countries. Springer, Cham.
Lipej, L., M.O. Bonaca and M. Šiško. 2003. Coastal fish diversity in three marine protected areas and one unprotected area in the Gulf of Trieste (Northern Adriatic). Marine ecology, 24(4): 259-273.
Marine Conservation Institute. 2020. MPAtlas [Online]. Seattle, WA. Available at: www.mpatlas.org Matić-Skoko, S., N. Stagličić, D. Blažević, J. Šiljić and D. Iritani. 2014. Croatian marine fisheries (Adriatic Sea):
1950-2013. Fisheries Centre Working Paper #2014-26, 16 p. Spreizer, A.J. and N.R. Caf. 2020. Small-Scale Fisheries in Slovenia (Northeastern Adriatic): From Borders to
Projects, p. 171-189. In: J.J. Pascual-Fernández, C. Pita, M. Bavinck (eds). Small-Scale Fisheries in Europe: Status, Resilience and Governance. Springer, Cham.
Vidmar, B. and R. Turk. 2011. Marine protected areas in Slovenia: how far are we from the 2012/2020 target. Varstvo Narave, 24 (Suplement 1):159-170.
Spain (Balearic Islands) Carreras, M., M. Coll, A. Quetglas, R. Goni, X. Pastor, M.J. Cornax, M. Iglesias, E. Massutí, P. Oliver, R.
Aguilar, A. Au, K. Zylich and D. Pauly. 2015. Estimates of total fisheries removal from the Balearic Islands (1950-2010). Fisheries Centre Working Paper #2015-9, 46 p.
Carreras, M., M. Coll, A. Quetglas, R. Goni, X. Pastor, M.J. Cornax, M. Iglesias, E. Massutí, P. Oliver, R. Aguilar, A. Au, K. Zylich and D. Pauly. 2016. Spain (Balearic Islands), p. 394. In: D. Pauly and D. Zeller (eds). Global Atlas of Marine Fisheries: A critical Appraisal of Catches and Ecosystem Impacts. Island Press, Washington, DC.
Govern de les Illes Balears. 2015. Estadístiques de l'agricultura, la ramaderia i la pesca a les Illes Balears. Estadístiques Agràries - Pesqueres, Govern de les Illes Balears. 90 p.
Govern de les Illes Balears. 2017. Estadístiques de l'agricultura, la ramaderia i la pesca a les Illes Balears. Estadístiques Agràries - Pesqueres, Govern de les Illes Balears. 90 p.
López-Ornat, A., J.A. Atauri, C. Ruiz, M. Múgica. 2014. Beneficios sociales y ambientales de las reservas marinas de interés pesquero. Fundación Fernando González Bernáldez.
Marine Conservation Institute. 2020. MPAtlas [Online]. Seattle, WA. Available at: www.mpatlas.org Noël, S.-L. 2020. Semi-automation procedure for catch reconstruction forward carry, p. 15-20. In: B. Derrick,
M. Khalfallah, V. Relano, D. Zeller and D. Pauly (eds). Updating to 2018 the 1950-2010 Marine Catch Reconstructions of the Sea Around Us: Part I – Africa, Antarctica, Europe and the North Atlantic. Fisheries Centre Research Report 28(5).
Otero, M. 2015. Fishing governance in MPAS: potentialities for blue economy (FISHMPABLUE Project). WP2 Technical component - Act. 1.4 Country Policy survey: Spain. International Union for Conservation of Nature (IUCN). 24 p.
Otero M., Jeudy de Grissac A., Di Franco A., Francour P., Guidetti P., Santarosa L., Sainz Trapaga S. 2015. Reviewing existing Mediterranean models of governance of MPAs with artisanal fisheries. Fishing governance in MPAs: potentialities for blue economy (FISHMPABLUE). 54p.
Syria Gaudin, C. and C. De Young. 2007. Recreational fisheries in the Mediterranean countries: a review of existing
legal frameworks (Vol. 81). Food and Agriculture Organization, Rome.

Updating to 2018 the 1950-2010 marine catch reconstructions of the Sea Around Us: Part I – Africa, Antarctica, Europe and the North Atlantic
293
Khalfallah, M. 2020. Data-poor fisheries: Case studies form the Southern Mediterranean and the Arabian Peninsula. Ph.D. thesis, the University of British Columbia, Vancouver, Canada: 349p.
Marine Conservation Institute. 2020. MPAtlas [Online]. Seattle, WA. Available at: www.mpatlas.org Noël, S.-L. 2020. Semi-automation procedure for catch reconstruction forward carry, p. 15-20. In: B. Derrick,
M. Khalfallah, V. Relano, D. Zeller and D. Pauly (eds). Updating to 2018 the 1950-2010 Marine Catch Reconstructions of the Sea Around Us: Part I – Africa, Antarctica, Europe and the North Atlantic. Fisheries Centre Research Report 28(5).
Ramsar sites information service. 2020. Sabkhat al-Jabbul Nature Reserve. Available at: rsis.ramsar.org/ris/935
Saad, A. 2010. The fisheries and aquaculture in Syria, status and development perspective in Syria (in Arabic). Syrian Economic Bulletin, Ed. Economic Technical Team, Prime Ministry, Syria 1(1): 113-136.
Ulman, A., A. Saad, K. Zylich, D. Pauly and D. Zeller. 2015a. Reconstruction of Syria’s fisheries catches from 1950-2010: Signs of overexploitation. Fisheries Centre Working Paper #2015-80, 26p.
Ulman, A., A. Saad, K. Zylich, D. Pauly and D. Zeller. 2015b. Reconstruction of Syria's Fisheries Catches from 1950-2010: Signs of Overexploitation. Acta Ichthyologica et Piscatoria, 15: 259.
Ulman, A., A. Saad, K. Zylich, D. Pauly and D. Zeller. 2016. Syria, p. 406. In: D. Pauly and D. Zeller (eds). Global Atlas of Marine Fisheries: A critical Appraisal of Catches and Ecosystem Impacts. Island Press, Washington, DC.
UNEP-WCMC and IUCN. 2020. Protected Planet: Protected Area Profile for Syria from the World Database of Protected Areas, June 2020. Available at: www.protectedplanet.net/country/SY
Tunisia Emmanouilidou, P., W. Seddik, C. Webster, S. El Asmi and A. Kheriji. 2019. Le cadre juridique des Aires
Marines Protégées en Tunisie: Fiches synthétiques. SPA/RAC and Projet MedMPA Network, Tunis. 11 p.
Gaudin, C. and C. De Young. 2007. Recreational fisheries in the Mediterranean countries: a review of existing legal frameworks (Vol. 81). Food and Agriculture Organization, Rome.
Halouani, G., F. Ben-Rais-Lasram, M. Khalfallah, D. Zeller and D. Pauly. 2015. Reconstruction of Marine Fisheries Catches for Tunisia (1950-2015). Fisheries Centre Working Paper #2015-95, 11 p.
Halouani, G., F. Ben-Rais-Lasram, M. Khalfallah, D. Zeller and D. Pauly. 2016. Tunisia, p. 415. In: D. Pauly and D. Zeller (eds). Global Atlas of Marine Fisheries: A critical Appraisal of Catches and Ecosystem Impacts. Island Press, Washington, DC.
Khalfallah, M. 2020. Data-poor fisheries: Case studies form the Southern Mediterranean and the Arabian Peninsula. Ph.D. thesis, the University of British Columbia, Vancouver, Canada: 349p.
Lamine, E.B., P. Guidetti, M.S. Romdhane and P. Francour. 2018. Fish assemblages along the coasts of Tunisia: a baseline study to assess the effectiveness of future Marine Protected Areas. Mediterranean Marine Science, 19(1): 11-20.
Le Port, G., A. De Toma, T. Binet. 2019. Plan de financement de la future Aire marine et côtière protégée des îlots nord de l’archipel de Kerkennah (Tunisie). SPA/RAC and Projet MedMPA Network, Tunis. 35 p + appendices.
Marine Conservation Institute. 2020. MPAtlas [Online]. Seattle, WA. Available at: www.mpatlas.org Noël, S.-L. 2020. Semi-automation procedure for catch reconstruction forward carry, p. 15-20. In: B. Derrick,
M. Khalfallah, V. Relano, D. Zeller and D. Pauly (eds). Updating to 2018 the 1950-2010 Marine Catch Reconstructions of the Sea Around Us: Part I – Africa, Antarctica, Europe and the North Atlantic. Fisheries Centre Research Report 28(5).
SPA/RAC. 2020a. Specially Protected Areas Regional Activity Centre. Available at: www.rac-spa.org/sites/default/files/doc_spamis/spamis/24_zembra_zembretta.pdf

2020 Fisheries Centre Research Reports 28(5)
294
SPA/RAC. 2020b. La Galite Archipelago. Available at: www.rac-spa.org/node/896 Zarrouk, A., M.S. Romdhane and F. Espinosa. 2016. Usefulness of marine protected areas as tools for
preserving the highly endangered limpet, Patella ferruginea, in the Mediterranean Sea. Marine Biology Research, 12(9): 917-931.

Updating to 2018 the 1950-2010 marine catch reconstructions of the Sea Around Us: Part I – Africa, Antarctica, Europe and the North Atlantic
295
NORTHWESTERN AND NORTHERN CONTINENTAL EUROPE: UPDATED CATCH RECONSTRUCTIONS TO 2018*
Simon-Luc Noëla, Emmalai Pagea, Elaine Chua, Eric Sya, Courtney Browna, Tim Cashiona, Darcy Dunstana,
Maria Frias-Donagheya, Rennier Hernandeza, Sarah Popova, Veronica Relanoa, Gordon Tsuia and Sebastián Villasanteb,c
a) Sea Around Us, Institute for the Oceans and Fisheries, University of British Columbia, 2202 Main Mall, Vancouver, BC, V6T 1Z4, Canada
b) Cross-Research in Environmental Technologies (CRETUS), University of Santiago de Compostela, Campus Sur, Santiago de Compostela, A Coruña, Spain
c) Campus Do Mar, International Campus of Excellence, Spain Abstract Reconstructions of the 1950-2010 marine fisheries catches for mainland countries in northwestern and Northern Europe (excluding the Baltic Sea) were published earlier. Here, these reconstructions are updated to 2018. Details on how this was done are presented in country-specific sections for Belgium, Denmark (North Sea), France (Atlantic Coast), Germany (North Sea), The Netherlands, Norway (Mainland), Portugal (Mainland), Russia (Barents Seas), Spain (Northwest Atlantic EEZ), and Sweden (West Coast). While the International Council for the Exploration of the Sea (ICES) provides reported landings data within this area at a more detailed spatial resolution than data reported by the FAO on behalf of these countries, neither source accounts for discards that occur during fishing, nor are all small-scale catches, e.g., recreational catches, comprehensively accounted for in many cases. Thus, we used fishery-specific and gear-specific information to estimate the unreported landings and discards for the updates. Introduction Reconstructions of the 1950 to 2010 marine fisheries catches for the countries in northwestern and Northern Europe were earlier published. Here, these reconstructions are updated to 2018. However, territories (e.g., the Azores, or Svalbard) and island states (the UK, or Ireland) are omitted here, and dealt with in Chu et al. (2020). Details on how each original reconstruction was updated are provided in country-specific sections for Belgium, Denmark (North Sea), France (Atlantic Coast), Germany (North Sea), The Netherlands, Norway (Mainland), Portugal (Mainland), Russia (Barents Sea), Spain (Northwest coast), and Sweden (West Coast). The Baltic Sea region is treated separately (see Popov et al. 2020). While the International Council for the Exploration of the Sea (ICES) provides reported landings data for this area at a more detailed spatial resolution than data reported by the FAO on behalf of these countries, neither source accounts for discards that occur during fishing, nor are all small-scale catches, e.g., recreational catches, comprehensively accounted for in many cases. Thus, we used fishery specific and gear specific information to estimate the discards and taxonomic composition of discarded catch for the updates, occasionally adding information on otherwise neglected fisheries.
* Cite as: Noël, S.-L., E. Page, E. Chu, E. Sy, C. Brown, T. Cashion, D. Dunstan, M. Frias-Donaghey, R. Hernandez, S. Popov, V. Relano, G. Tsui and S. Villasante. 2020. Northwestern and Northern Continental Europe: updated catch reconstructions to 2018, p. 295-321. In: B. Derrick, M. Khalfallah, V. Relano, D. Zeller and D. Pauly (eds). Updating to 2018 the 1950-2010 Marine Catch Reconstructions of the Sea Around Us: Part I – Africa, Antarctica, Europe and the North Atlantic. Fisheries Centre Research Report 28(5).

2020 Fisheries Centre Research Reports 28(5)
296
In the interest of timeliness, the updates we performed in two steps: (i) as a continuation of the previous, detailed reconstructions (generally to 2017), and (ii) as a carry-forward, using ICES or FAO statistics to 2018. Details are provided in the country-specific sections. Belgium The reconstruction of total catches by Belgium within and outside of its Exclusive Economic Zone (EEZ) from 1950-2010 was carried out by Lescrauwaet et al. (2015, 2016). This section describes key features of the update to 2017 and the subsequent carry-forward to 2018. Reported baseline The reported baseline data of catches for Belgian fisheries was extracted from ICES’ Nominal Catch Database’ for 2006-2017. ICES catch data included various levels of spatialization for catches of each taxon and was compared to FAO data for any discrepancies. Minor discrepancies were found but ultimately ignored, and the ICES data were accepted as the reported baseline for the reconstruction. Data were spatially distributed to EEZ or ‘outside of EEZ’ according to their distributions per ICES area as in the original reconstruction (Lescrauwaet et al. 2015). Once this was done, the specific Belgian fisheries outlined in Lescrauwaet et al. (2015) were examined to estimate their unreported catch as well as discarded catch. Fisheries for ‘common shrimp’ (Crangon crangon) The catches for the Crangon crangon trawl fishery were allocated to Belgian and foreign EEZs according to nationally-reported proportions (Tessens 2012, 2013, 2014, 2015). Unreported catch and associated discards for each component of the fisheries for common shrimp were derived following the assumptions and methods of Lescrauwaet et al. (2015). Discard estimates For all other fisheries identified in Lescrauwaet et al. (2015), the methods for estimating unreported catch and associated discards were carried forward to 2017 unchanged. These discards may be a product of non-target catch (the discarded taxon is not the one the fishery is seeking) or high-grading (the catch of target taxa that does not fit length/weight/other requirements and is disposed of). The likelihood of discards being non-target or high-graded was evaluated for each fishery to determine which associated taxa should be used to spatially distribute discards for a given fishery. Table 1 indicates which taxon’s reported catch spatial distributions are used to spatially disaggregate discards for each fishery. For example, the discards of common sole (Solea solea) in the common shrimp fishery were spatially distributed according to the fraction used for distributing the reported catches of common shrimp. The semi-industrial and recreational catches of common shrimp and the recreational catches of cod (Gadus morhua) and bass (Dicentrarchus labrax) were allocated 100% to the Belgian EEZ and ICES area 27.4.c.

Updating to 2018 the 1950-2010 marine catch reconstructions of the Sea Around Us: Part I – Africa, Antarctica, Europe and the North Atlantic
297
Transition from 2017 to 2018 The catch reconstructed to 2017 was carried forward to 2018 using the semi-automated procedures outlined in Noël (2020), based on ICES landings data to 2018. Semi-automated reconstructed catch data will later be replaced by a more detailed, research-intensive update. Marine biodiversity protection Belgium has agreed to protect its biological diversity mainly through the Convention on Biological Diversity (Aichi). The country is also a signatory to the Natura 2000, and its commitments extend to NGOs and/or public bodies like the OSPAR Convention (Marine Conservation Institute 2020). Belgium has 24 MPAs and four marine managed areas. The MPAs’ extent is 1242 km2 (Marine Conservation Institute 2020) and in total occupies 35.7% of its EEZ (3479 km2; Lescrauwaet et al. 2010). However, in the Royal decree establishing the marine spatial planning for the period 2020 to 2026, only five MPAs are mentioned: three for the protection of birds (under the EU Birds Directive) and two for habitat protection under the EU Habitats Directive (Vlaamse Banken; Vlakte van de Raan) (King of the Belgians 2020). Since the thirteenth century, Belgian authorities have been placing restrictions on gear and mandatory landing sites for certain species (Verlé et al. 2020). There are MPAs where there have been considerable efforts to regulate fishing activities leading towards more sustainable and innovative fishing practices. However, currently there is still no designated no-take MPA. For example, this is the case of the Vlaamse Banken (“Flemish Banks” Special Area of Conservation), designed to preserve valuable species and habitats within the Framework of Natura 2000 (Verlé et al. 2020). This MPA has three zones, and even though the strictest zone of this MPA bans any technique that disrupts the seabed, certain types of fishing, such as sport fishing (e.g., line fishing), horseback shrimp fishing and recreational shrimp fishing by boat, are still allowed. The only place where any type of fishing is completely prohibited is in the area dedicated to wind farms. In 2015 there were 182 operating windmills (Verlé et al. 2020), and in 2020 there were over 400 operating windmills (Belgian Federal Public Service (FPS) Health, Food Chain Safety and Environment 2015) in this area, which makes Belgium a world leader, with the largest area dedicated to offshore wind farming (Belgian Federal Public Service (FPS) Health, Food Chain Safety and Environment 2020). “The zones where the Belgian offshore wind farms are being constructed are located on offshore sandbanks characterized by relatively poor benthic and demersal fish fauna. As a result, expectations of ecosystem restoration have generally been limited, but less than a year after the first park became partly operational, a preliminary study found a positive effect on presence and size of some demersal fish species (Derweduwen et al. 2012)” (Belgian Federal Public Service (FPS) Health, Food Chain Safety and Environment 2015). This is a clear example of the consequences that fishing activities have in marine ecosystems and especially in
Table 1. Target fisheries and their associated discards are spatially disaggregated based on reported catches of associated species.
Fishery Discards are associated with fishing for… Commercial crangon Crangon crangon Semi-industrial crangon Crangon crangon; allocated 100% to Belgian EEZ Recreational crangon n/a Pelagic trawl: herring and sprat Clupea harengus and Sprattus sprattus Gadoid and round fishes Targeted taxa Flatfishes Plaice (Pleuronectes platessa) and sole (Solea solea) Nephrops trawling Nephrops norvegicus

2020 Fisheries Centre Research Reports 28(5)
298
European Natura 2000 sites where fishing has been identified as one of the major threats to MPAs (Mazaris et al. 2019). Denmark (North Sea) The catches of Denmark’s marine fisheries from 1950 to 2010 were reconstructed separately for the North Sea part of the country’s Exclusive Economic Zone (EEZ) (Gibson et al. 2014, 2016) and for the Baltic Sea part (Bale et al. 2010, 2016). This account refers only to the update to 2016 of the catches for the North Sea part of the Danish EEZ and to the carry-forward of these catches to 2018. Reported baseline catch data ICES official nominal catches for 2006-2016 were used as the reported baseline data for 2011-2016 for the North Sea (ICES areas 3a and IV). The retroactive changes made to ICES catch statistics from 2006-2010 were all considered. Catch data were spatially assigned to inside and outside of Denmark’s Exclusive Economic Zone (EEZ) and split among sectors (artisanal and industrial) using the 2010 percentages from Gibson et al. (2014). ICES landings statistics were adjusted using the most recent Working Group Reports (WGR) because they are thought to utilize more accurate data (Gibson et al. 2014). However, the WGR estimates changed considerably between report years, and a series of retroactive changes were made to both the reported baseline data (negative adjustments) and unreported landings (positive adjustments) for Atlantic cod (Gadus morhua), Atlantic herring (Clupea harengus), haddock (Melanogrammus aeglefinus), whiting (Merlangius merlangus), saithe (Pollachius virens), Atlantic mackerel (Scomber scombrus), common sole (Solea solea), Atlantic horse mackerel (Trachurus trachurus), European plaice (Pleuronectes platessa), and Northern prawn (Pandalus borealis; Table 2). Adjusted catch was estimated as the difference between ICES landings and WGR landings, which included ‘unallocated’, i.e., unreported catch. When WGR landings of a particular species were higher than ICES landings, the difference was added on as unreported catch. When ICES landings were higher than WGR landings, a negative adjustment was made to the ICES baseline. Discard rates for the species listed in Table 2 were based on estimates in recent WG Reports (ICES 2012, 2018a, 2018b, 2018c, 2018d, 2018e, 2018f). Discard rates were applied to total landings (ICES + adjustments) and retroactive changes were made as per Table 2. Discards for all other species were calculated using discard rates determined by Gibson et al. (2014).

Updating to 2018 the 1950-2010 marine catch reconstructions of the Sea Around Us: Part I – Africa, Antarctica, Europe and the North Atlantic
299
In 2015, the Technical University of Denmark (DTU) released a new report on recreational fishing (Olesen and Storr-Paulsen 2015). Using data from this report, the major recreational species outlined in Gibson et al. (2014) were updated for 2011 and 2012. The period from 2013-2016 was carried forward at the 2012 level unaltered (Figure 1).
Figure 1. Reconstructed domestic catch within Denmark’s North Sea EEZ by fishing sector for 1950-2018. Recreational and subsistence are included but are too small to be visible separately. Transition from 2016 to 2018 The catch reconstructed to 2016 was carried forward to 2018 using the semi-automated procedures outlined in Noël (2020), based on ICES landings data to 2018. Semi-automated reconstructed catch data will later be replaced by a more detailed, research-intensive update. Marine biodiversity protection Denmark has agreed to protect its biological diversity through the international Convention on Biological Diversity (Aichi) and the Ramsar Convention on Wetlands of International Importance. The country is also a
Table 2. Retroactive changes and updates made to the North Sea (Areas iv_b), and the Kattegat (iii_a21) and Skagerrak (iii_a20) using Working Group Reports (WGR). Retroactive changes are negative adjustments, unreported landing adjustments and discard rate adjustments.
Species Area iv_b Area iii_a ICES WGR reports Atlantic cod 2002-2016 1992-2016 WGNSSK Report (ICES 2018b; table 4.1); ICES
Advice for Cod (ICES 2018e; table 9);WGNSSK Report (ICES 2012)
Atlantic herring 2011-2016 - HAWG Report (ICES 2018a; table 2.1.4) Haddock 2002-2016 - WGNSSK Report (ICES 2018b; tables 13.2.1. &
13.2.5);ICES Advice for Haddock (ICES 2018d). Whiting 1990-2016 - WGNSSK Report (ICES 2018b) table 23.1.1. Saithe 2001-2016 2001-2016 WGNSSK Report (ICES 2018b) table 17.3.1. Sole 2004-2016 - WGNSSK Report (ICES 2018b) table 18.2.1 Atlantic mackerel 2003-2016 2003-2016 WGWIDE Report (ICES 2018c) table 8.4.2.2 Atlantic horse mackerel
1989-2016 1960-2016 WGWIDE Report (ICES 2018c) table 7.1.1.2
Plaice - 2001-2016 WGNSSK Report (ICES 2018b) table 14.2.1 Northern prawn 2011-2016 2011-2016 ICES Advice Northern shrimp (ICES 2018f)

2020 Fisheries Centre Research Reports 28(5)
300
signatory to the Natura 2000. Its commitments extend to NGOs and/or public bodies like HELCOM and the OSPAR Convention (Marine Conservation Institute 2020). Denmark has a total of 292 MPAs and 20 marine managed areas across the Baltic and North Sea. In the North Sea, the MPAs Network occupies 58,755 km2, which is 77.6% of its EEZ in the North Sea (75,714 km2; Gibson et al. 2014). Since the Danish Nature Protection Act came into force in 1917, the so-called Conservation Areas of Denmark, the oldest comprehensive tool to safeguard flora and fauna in the country, have been a crucial tool in protecting nature in this country (Garn et al. 2019). In 2018, the IUCN National Committee of Denmark undertook a project on behalf of the Danish Environmental Protection Agency to these Conservation Areas and to identify which of these areas could be assigned IUCN management categories (Garn et al. 2019). The Marine Strategy Framework Directive (MSFD) adds additional EU requirements for spatial protection measures in order to support networks of coherent and representative marine protected areas. The Common Fisheries Policy (CFP) supports conservation measures of the MSFD and allows the establishment of protected areas of biological sensitivity (Edelvang et al. 2017). Fish protection in this zone of Denmark is more within the objectives of the CFP than under the jurisdiction of the MPAs (Edelvang et al. 2017). In the North Sea, within the percentage covered by the Natura 2000 areas, the only protected marine mammal is the harbor porpoise. “The distribution data are based on year-round satellite tracking of porpoises in the Skagerrak. These data have proven to give a reliable representation of the porpoise distribution” (Edelvang et al. 2017). In the North Sea, Skagerrak, along the coast of Jutland has one of the highest ecological values of the area (Edelvang et al. 2017). However, species distribution and composition could vary due to “natural variations in temperature and salinity generated by changes in meteorological forcing, [which] have affected the North Sea and Baltic ecosystems significantly in the recent past, and will most likely continue to do so in the future. Furthermore, global warming has increased the average annual water temperature significantly in both areas, generating well documented changes in relative species composition and distribution due e.g. to influx or increases in abundance of species with a southern affinity, in particular in the North Sea” (Edelvang et al. 2017). France (Atlantic Coast) The reconstruction of fisheries catches in the Atlantic part of France’s Exclusive Economic Zone (EEZ) from 1950-2010 was performed by Bultel et al. (2015, 2016). Here, these data are updated to 2017 and carried forward to 2018. Reported baseline data The reported baseline data were sourced from the ICES nominal catch database34 for 2006-2017 and compared to the FAO reported data. Minor discrepancies were found between the two datasets. Due to the better spatial and taxonomic resolution of the ICES data, they were accepted as the reported baseline data for this update. The reported data for France were assigned to within and outside of the French Atlantic EEZ following the 2010 ratios from Bultel et al. (2015) for each ICES area. Catches assigned to ICES area 27_NK were considered to be wholly from outside the EEZ and split between ICES areas based on the distributions of taxa between areas in each year. Catches were then assigned to different gears and sectors in the same fashion, as in Bultel et al. (2015), according to their EEZ assignment. New information on sectoral allocation of artisanal
34 http://www.ices.dk/marine-data/dataset-collections/Pages/Fish-catch-and-stock-assessment.aspx

Updating to 2018 the 1950-2010 marine catch reconstructions of the Sea Around Us: Part I – Africa, Antarctica, Europe and the North Atlantic
301
fishing vessels was found pertaining to the French Atlantic fleet, which should be reviewed and potentially implemented in a future reconstruction update (García-Flórez et al. 2013). Unreported catches Unreported artisanal catches were assumed to be equal to 33% of reported artisanal catches from 2011 to 2017, following Bultel et al. (2015). Discards from the artisanal and industrial fleets were also evaluated using the same rates and taxonomic breakdown for each gear, as described in Bultel et al. (2015). Mainland French fisheries remain fairly unchanged since the last reconstruction, though reported catches have increased to the early 2000s level (approx. 350,000 tonnes), with the vast majority of the increase since 2010 occurring outside of the Atlantic EEZ. Considering that many stocks in the ICES areas are heavily overexploited and that fisheries along the Atlantic coast do not operate in an economically efficient way (Merino et al. 2014), this spike in catches (and the considerable discards that likely accompany those catches) shows that France’s efforts to reduce its fleet capacity, which has limited entry of new fishers into the fishery (van Putten et al. 2012), may require further measures. Transition from 2017 to 2018 The catch reconstructed to 2017 was carried forward to 2018 using the semi-automated procedures outlined in Noël (2020), based on ICES landings data to 2018. Semi-automated reconstructed catch data will later be replaced by a more detailed, research-intensive update. Marine biodiversity protection France has agreed to protect its biological diversity through the international agreements of the Convention on Biological Diversity (Aichi), United Nations Convention on the Law of the Sea, Ramsar Convention on Wetlands of International Importance, International Coral Reef Initiative and the World Heritage Convention. France is also a signatory to Regional Treaties and Agreements such as the Regional Seas Convention, Barcelona Convention and Natura 2000. Its commitments extend to NGOs and/or public bodies like the Atlantic Arc Network of MPAs (MAIA), Caribbean MPA Network (CaMPAM), Mediterranean MPA Network (MedPAN) and OSPAR Convention (Marine Conservation Institute 2020). The Marine Protected Areas Agency of France (Agence des Aires Marines Protégées, ‘AAMP’ which became the OFB or French Biodiversity Agency in 2017) was created in 2006 as a public agency to protect the marine environment. Among its main tasks are the creation, management, and support of MPAs. Also, the OFB is tasked with representing France in international negotiations concerning the sea (Marine Conservation Institute 2020). France has 555 MPAs and 24 marine managed areas along its Atlantic and Mediterranean coasts. “In France, MPA’s plan development was done differently for each MPA designation, not only in the form of drawing the draft but also in who developed the plan” (Alvarez-Fernandez et al. 2020a). Management bodies in the Atlantic French MPAs are strong, and as result it is expected that MPAs governance is effective. However, MPAs need operational tools with strategies to manage MPAs, and this is a weak point in France. Furthermore, periodic MPAs’ evaluations and monitoring are necessary to accomplish an efficient management, and they seem to be scarce. Community engagement could also help to improve the management of these MPAs, which only occurs in half of the cases (Alvarez-Fernandez et al. 2020b). For the Atlantic coast, some of the goals of the 2015 national strategy developed by the Ministry of Ecology, Sustainable Development and Energy of France are: to better introduce management measure for offshore

2020 Fisheries Centre Research Reports 28(5)
302
MPAs, to address management issues of for the shelf and deeper area in the Bay of Biscay, to initiate management measures for the Gironde Estuary and Pertuis Sea marine nature park, and to implement a regional strategic analysis of southern Aquitaine in conjunction with the Spanish authorities (Ministry of Ecology, Sustainable Development and Energy 2015). Germany (North Sea) The marine fisheries catches of Germany in the North Sea were originally reconstructed by Gibson et al. (2015, 2016). Their update to 2017 is documented here, along with a carry-forward to 2018. Reported baseline To update the reconstruction, ICES landings statistics were used as the reported data baseline for 2011-2017 and were adjusted using the information from ICES stock assessment Working Group Reports (ICES 2016a, 2016b, 2016c). Minor retroactive changes to the ICES catch statistics were noted but not implemented during this update. Note that the spatial assignment of catch for flatfish and invertebrate species was adjusted from 1950-2010. These new proportions were acquired through personal communication with the lead author of the original reconstruction (Darah Gibson, personal communication). Trawl fisheries Because most of Germany’s commercial fisheries continue to use trawls, the majority of reported landings were considered to be industrial catch. ICES stock assessments (ICES 2016a, 2016b, 2016c) were used as supplementary information sources to estimate unreported landings and discards. The average discard rates of the European plaice (Pleuronectes platessa), common sole (Solea solea), saithe (Pollachius virens), Atlantic cod (Gadus morhua), and brown shrimp (Crangon crangon) fisheries were carried forward with the same rates that were applied to the 1950-2010 period. The 2010 taxonomic breakdown of these discards were maintained. In 2012, ICES reported catch of blue mussel (Mytilus edulis), and the split of 90% industrial and 10% artisanal used in 2010 was carried forward, unaltered. Recreational and subsistence fisheries The estimation of recreational catches in the original reconstruction relied heavily on personal communication by field researchers and fishers to the authors and is considered reliable. Thus, the increasing or decreasing trends of catch per taxon were extrapolated to 2017, except for taxa whose catch was already very small. In such cases, the catch was kept constant. Subsistence catches in the original reconstruction also relied heavily on personal communication by field researchers and fishers. Here we assumed that from 2011 onward subsistence catches became negligible. Transition from 2017 to 2018 The catch reconstructed to 2017 was carried forward to 2018 using the semi-automated procedures outlined in Noël (2020), based on ICES landings data to 2018. Semi-automated reconstructed catch data will later be replaced by a more detailed, research-intensive update. Marine biodiversity protection Germany has agreed to protect the biological diversity of the North Sea through the international Convention on Biological Diversity (Aichi), United Nations Convention on the Law of the Sea, the Ramsar Convention on Wetlands of International Importance and the World Heritage Convention (Marine Conservation Institute 2020). Germany is also a signatory to Regional Treaties and Agreements such as the Regional Seas Convention and Natura 2000, and it is also part of the international network of UNESCO Man and the

Updating to 2018 the 1950-2010 marine catch reconstructions of the Sea Around Us: Part I – Africa, Antarctica, Europe and the North Atlantic
303
Biosphere. Its commitments extend to intergovernmental organizations such as the OSPAR Convention and the Helsinki Commission (HELCOM; Marine Conservation Institute 2020). Germany has 233 MPAs and 13 marine managed areas in the Baltic and the North Sea. The MPAs’ extent together with nature conservation areas and conservation features in the North Sea is 18,698 km2 (BfN 2020), and they occupy 46% of the German North Sea EEZ (40,999 km2; Gibson et al. 2016). The North Sea is a complex socio-ecological system due to its ecological variability and the different interests of several stakeholders and countries (Caveen et al. 2014). Where an MPA is to be established in a transboundary area of European waters, the relevant Member States must reach a joint agreement (Wakefield 2019). This was the case with the Dogger Bank MPA (established in 2017 between Germany, the Netherlands and the United Kingdoms with 1,687 km2 in German waters; Marine Conservation Institute 2020). “The North Sea Dogger Bank site falls within the exclusive economic zones of Germany, the Netherlands, and the United Kingdom. Each country has designated SAC [(Special Area of Conservation)] under the Habitats Directive within the site. Following agreement between those Member States, the Dogger Bank site was notified to the Commission for inclusion in the EU’s Natura 2000 network. As such, the site has been approved by the European Commission as a Site of Community Importance (SCI); thus, it has a status of greater significance than a site of only national importance. In 2016, a joint recommendation was adopted by the Member States and put to the European Commission in accordance with the CFP [(Common Fisheries Policy)]. The proposal is for management zones and open zones. All zones are closed to bottom trawls and dredges and in the German Management Zone to seines (Dogger Bank Background Document 2016). These zones comprise approximately one-third of the combined SCI [(Site of Community importance)], although the NGOs had pressed for the prohibitions to apply to half the area” (Wakefield 2019). The Dogger Bank is an area well-known for overfishing and the use of bottom-trawling (Doering et al. 2017). Therefore, it is important to create no-take areas to conserve and restore what is left in these waters. “[However,] full no-take zones (or marine reserves) are conspicuously lacking in the North Sea. Some conservationists argue that to achieve the latter, no-trawl MPAs (preferably no-take) must be designated in areas of greatest biological productivity, typically (but not always) where fishing effort would be most concentrated (Roberts and Mason 2008). However, to date, planning has generally focused on avoiding core fishing areas as it is politically less contentious—this issue is not unique to the North Sea (Devillers et al. 2014)” (Caveen et al. 2014). The Netherlands The original reconstruction of Netherland’s marine fisheries catches was performed by Gibson et al. (2015, 2016) for 1950-2010. Here, the updating to 2016 is documented, followed by a carry-forward to 2018. Reported baseline data ICES landings statistics were used as the reported baseline for 2011-2016 and adjusted per taxon using the information from ICES stock assessment Working Group Reports (ICES 2018a, 2018b, 2018c). The scope of this update is limited to the years following the original reconstruction, and minor retroactive changes to the ICES catch statistics from 1950-2010 were not considered. However, the original reconstruction report likely over-estimated The Netherland’s domestic catch; therefore, the catch data thought to be taken inside and outside its EEZ were re-proportioned within ICES management areas IV b and IV c.

2020 Fisheries Centre Research Reports 28(5)
304
Reported landings were assigned to sectors (artisanal or industrial) based on gear types as in Gibson et al. (2015), while the ICES stock assessments (ICES 2018a, 2018b, 2018c) were used as supplementary information to estimate unreported landings and discards. It should be noted that these ICES stock assessments appear to have retroactively changed their methods for calculating unreported landings and discards quite frequently; therefore, in the process of updating the years 2015-2016, only the most updated version was used, and no retroactive changes were made for years prior to 2015. Moving forward, details on the estimation methods should be obtained to assess whether or not retroactive changes to the methods are necessary. Note that the discards for haddock (Melanogrammus aeglefinus) were revaluated from 2002-2010 due to an error in the original baseline. Recreational catches To estimate recreational catches, population totals from 2011-2014 were based on the World Bank35 while the per capita rate of catch for 2010 from the original reconstruction was carried forward, unaltered. The 2010 anchor points for Atlantic cod (Gadus morhua) and European eel (Anguilla anguilla) were re-calculated using the tonnage from an ICES Working Group Report (ICES 2014) that relied on a reasonable length-weight relationship for these species. Intermediate tonnages of these species were then interpolated to 2014 using data from a recreational fisheries survey (ICES 2015). To estimate recreational catches for 2015 and 2016, the recreational landings tonnages were taken directly from the ICES Working Group on Recreational Fisheries Surveys, which was approportioned into the appropriate ICES management areas. Transition from 2016 to 2018 The catch reconstructed to 2016 was carried forward to 2018 using the semi-automated procedures outlined in Noël (2020), based on ICES landings data to 2018. Semi-automated reconstructed catch data will later be replaced by a more detailed, research-intensive update. Marine biodiversity protection The Netherlands has agreed to protect the biological diversity of its North Sea waters mainly through the Convention on Biological Diversity (Aichi) and the Ramsar Convention on Wetlands of International Importance. The country is also a signatory to Natura 2000 and its commitments extend to NGOs and/or public bodies like the OSPAR Convention (Marine Conservation Institute 2020). The Dutch Ministry of Agriculture, Nature and Food Quality designated parts of the North Sea, the Wadden Sea, all the Natura 2000 sites, national parks and wetlands as part of the ‘National Ecological Network’, with the goal of preserving their biodiversity (Hugenholtz 2008). The Netherlands has 86 MPAs and twelve marine managed areas. The MPAs’ extent is 19,261 km2 (Marine Conservation Institute 2020), and they occupy 31% of the entire EEZ (61,869 km2; Gibson et al. 2016). The MPA of Waddenzee (2,717 km2, 14% of the total extent of MPAs in the Netherlands) and its surroundings are very vulnerable (Marine Conservation Institute 2020). Despite being protected under the RAMSAR Convention, World Heritage Convention, Natura 2000 and the Water Framework Directive, the area is in bad shape according to the Wadden Sea Association. “Although there is some emphasis on conservation and approximately 50% of the Wadden Sea is protected area, the area is managed mainly for sustainable uses of natural resources and for the economic and social wellbeing of the regional population. Many activities are still allowed to a certain extent, such as shipping, gas and oil drilling, fishing, recreation. […] When MPAs do not provide adequate protection from fishing, they may fail in their conservation objectives. This happened in
35 http://data.worldbank.org/indicator/SP.POP.TOTL?locations=NL

Updating to 2018 the 1950-2010 marine catch reconstructions of the Sea Around Us: Part I – Africa, Antarctica, Europe and the North Atlantic
305
the Wadden Sea, where mechanized fishery for cockle (Cerastoderma edule) was still allowed for 75% of the intertidal flats until 2004” (Hugenholtz 2008). The North Sea is one of the most threatened seas. Some of the activities happening in Dutch waters are coastal development, chemical and wastewater discharge, noise from shipping, sand extraction, military exercises, destructive fishing gear and spatial pressure from wind energy parks, among others (Hugenholtz 2008; Álvarez 2020). The Government supports the growth of the offshore wind energy sector in the Dutch water (Spijkerboer et al. 2020) and by 2030 they could cover up to 5% of the Dutch North Sea. These energy farms are associated with environmental risks (e.g., ecosystems alteration, noise, sea bird collision, etc.). The ban on fishing in these parks could result in a total of 15-25% of the seafloor being safeguarded from bottom impacts, such as trawling, and also reduce bycatch (De Nordzee 2018). Bycatch is one of the many threats that affects the marine mammals of Dutch waters, e.g. the harbour porpoise (Phocoena phocoena), which is found mainly as a bycatch in gillnet fisheries. Even though this species is endangered in the North Sea (Birkun and Frantzis 2008), it is estimated that the Dutch continental Shelf is home of a fifth of the North Sea population. “The highly mobile harbour porpoise reacts quickly to changes in the food availability, and as such is an indicator in the ecosystem. It is also a species considered especially vulnerable to a number of human activities and as such is a good indicator species for the impacts these can have on its population as well as the system” (Geelhoed et al. 2020). Norway (Mainland) The original reconstruction of marine fisheries catches for the EEZs of Norway for 1950-2010 was carried out by Nedreaas et al. (2015, 2016) and was updated to 2018 by the Sea Around Us. Reported baseline data Reported catches from Norway’s Directorate of Fisheries were used as the reported baseline data for 2011-2018. The catch data are presented in multiple tables with information on catch by taxon, by ICES area, by zone (i.e., EEZ, international waters, etc.), and by vessel length. As in the original catch reconstruction, the reported catch was spatialized following the distribution by taxon and ICES area, then weighted by zone. For example, if some of the catch of a particular taxon came from an ICES area overlapping the EEZs of Norway and Russia, but only catch from the Norwegian EEZ was recorded, the catch of this taxon was allocated solely to Norway’s EEZ in that particular ICES area. Industrial and artisanal catches Once the catch of each taxon was spatially allocated, catches within Norway’s EEZ were split between the artisanal and industrial sectors based on catch by vessel length. Catches made by vessels less than 15 meters in length were considered artisanal, while catches by vessels greater than or equal to 15 meters were considered industrial. Trawl vessels were considered industrial regardless of vessel length following Sea Around Us definitions. Unreported artisanal landings of cod (Gadus morhua) and saithe (Pollachius virens) were carried forward to 2018 unchanged at the 2010 levels. Discards for both industrial and artisanal fisheries were calculated for 2011-2018 as a percentage of reported landings for taxa for specific ICES areas and EEZs using the average ratio between discards and reported landings for 2008 and 2010.

2020 Fisheries Centre Research Reports 28(5)
306
Recreational catches Recreational fishing in Norway continues to rise in importance. However, catch and size limits have been imposed on tourists fishing in Norway since 201036. To reflect the decrease in tourist-driven catches, the average rate of increase in recreational catches between 2008 and 2010 was calculated for each taxon in each ICES area, and the largest rate of increase was halved and applied to the years 2011-2014. Catches of saithe and golden redfish (Sebastes norvegicus) in ICES area 27.1.b were estimated for 2011-2014 at the average rate of increase for 2008-2010 and were not halved because catches of these taxa were increasing at a slower rate. The recreational landing amounts for 2014 were then carried forward unchanged to 2018. Subsistence catches Unreported subsistence catches were estimated by multiplying updated population estimates by per capita fishing rate for 2011-2018. The per capita fishing rate was determined for 2011-2018 by calculating the per capita subsistence fishing rate for 2008 to 2010 and extrapolating the trend in per capita fishing rate to 2018. Marine biodiversity protection Norway has agreed to protect its biological diversity through the international agreements of the Convention on Biological Diversity (Aichi) and Ramsar Convention on Wetlands of International Importance. Its commitments extend to NGOs and/or public bodies like OSPAR Convention (Marine Conservation Institute 2020). Nature conservation management is mainly carried out by local protected area management boards and advisory councils. In Norway, a decentralization trend has led to an approach to nature conservation management in which responsibilities are delegated from the central to the local level. In coastal areas, for example, one of the environmental policy tools used in protection is regional planning (Hytönen 2020). Norway has 750 MPAs and 275 marine managed areas (including some protected areas located in other territories under Norwegian jurisdiction) (Marine Conservation Institute 2020). The MPAs extent is 88,872 km2 (Marine Conservation Institute 2020), which occupies 9.5% of the EEZ of Norway’s mainland (935,397 km2; Nedreaas et al. 2015). Some of the MPAs in these waters are, for example, the Raet National Park and the Jomfruland National Park. They were both designated in 2016, Raet with 597 km2 (0.67% of the total MPAs extent) and Jomfruland with 113 km2 (0.12%) (Marine Conservation Institute 2020). They cover lush kelp forests, sea grass beds, and shell sand areas (Hytönen 2020). These MPAs are not very large and may serve as an agent of selection by offering more protection to individuals having relatively small home ranges (Villegas-Ríos et al. 2017). Moreover, “in September 2006, four experimental lobster reserves (0.5 to 1 km2 area) were established along the Norwegian Skagerrak coast in order to generate knowledge regarding population dynamics, behaviour and the development of local lobster populations in areas unaffected by extractive fishing” (Moland et al. 2011). Results suggested that if one of the objectives is the long-term protection of European lobster, these small MPAs must contain the appropriate habitat such as deeper habitats (30-50m) (Moland et al. 2011). However, small no-take areas could be beneficial for some anadromous species such as the brown trout. A study carried out in Southern Norway, on the Skagerrak coast, “revealed that even a relatively small no-take marine reserve has potential to protect the full home range of sea trout displaying small to intermediate home
36 http://www.fiskeridir.no/English/Recreational-fishing/Regulations-for-foreign-tourists/Fishing-by-tourists-in-Norway

Updating to 2018 the 1950-2010 marine catch reconstructions of the Sea Around Us: Part I – Africa, Antarctica, Europe and the North Atlantic
307
range size while residing in the marine habitat. Furthermore, sea trout initially tagged in the reserve received more protection than individuals tagged outside the reserve” (Thorbjørnsen et al. 2019). Portugal (Mainland) The reconstruction of Portugal’s marine fisheries catches was completed for 1950-2010 (Leitão et al. 2014, 2016). This account documents how the original reconstruction was updated to 2017, then carried forward to 2018. Note that the ‘Portugal’ page (Leitão et al. 2016) of the Sea Around Us Global Atlas of Marine Fisheries (Pauly and Zeller 2016) has a regrettable error in which ‘Figure 2’ on page 369 reproduces the catch of Poland on page 368. This error has been corrected in the e-book version of this Atlas and does not occur on the Sea Around Us website (www.searoundus.org). Reported baseline data Reported landings were updated for 2011-2017 with data produced by the Portuguese National Statistical Office (INE, Instituto Nacional de Estatistica) and split into industrial and artisanal sectors based on the reported gear used. The INE reports bottom trawl and purse seine catches that are assigned as industrial; the remaining catch is assumed artisanal. Purse seine continues to be the dominant fishery, primarily targeting European sardine (Sardina pilchardus), chub mackerel (Scomber japonicus), and Atlantic horse mackerel (Trachurus trachurus). Taxonomic issues The “marine fished not identified” category reported by Leitão et al. (2014) consisted of multiple taxa originally reported by the INE but which were grouped to more easily compare larger taxonomic categories from 1950 to 2010. Since this method results in a loss of taxonomic resolution, the “marine fishes not identified” category has been revised to ensure the highest taxonomic breakdown. The INE reported taxa that previously comprised the “marine fishes not identified” category were separated out from 2000-2017 (i.e., the years that INE data were available), and the ICES taxonomic breakdown for area 27.9.a was used from 1950-1999. Subsistence and recreational catches The subsistence and recreational catches were estimated using the same methods as Leitão et al. (2014); combined these sectors contribute 8% of total reconstructed landings. The division of catch by these sectors uses the same ratio as 2010 (10% subsistence and 90% recreational). The taxonomic breakdown remains constant for the entire time series. It is important to note that a current project being carried out by PESCARDATA on the data collection of the Portuguese recreational fishery (Rangel et al. 2018); however, its reports were not released at the time of this update. Industrial fishing and discarding The taxonomic composition and discard rates of the industrial bottom trawl and purse seine fisheries were assumed to remain constant at the original ratio (Leitão et al. 2014) for the 2011-2017 period. Artisanal discards were calculated separately for each specific small-scale fishery including demersal purse seine (Sardina pilchardus), hake (Merluccius merluccius), traps (Octopus vulgaris), dredge (bivalves), and trammel nets (all remaining artisanal catch). The European Union has reformed their Common Fisheries Policy to implement a discard ban for all commercial fisheries (Leitao and Baptista 2017). At this time, it is

2020 Fisheries Centre Research Reports 28(5)
308
unclear how this discard ban has affected Portugal’s discard rate or fishing behaviour, but as the ban is enforced, discards are expected to decrease and eventually be eliminated.
Figure 2. Reconstructed domestic catch for Portugal by sector for 1950-2018. Recreational and subsistence catch are included, but are too small to be visible separately.
Transition from 2017 to 2018 The catch reconstructed to 2017 was carried forward to 2018 using the semi-automated procedures outlined in Noël (2020), based on Portuguese National Statistical Office (INE, Instituto Nacional de Estatistica) landings data to 2018. Semi-automated reconstructed catch data will later be replaced by a more detailed, research-intensive update. Marine biodiversity protection Portugal has agreed to protect its biological diversity through international agreements such as the Convention on Biological Diversity (Aichi) and through regional treaties, such as Natura 2000. Its commitments also extend to NGOs and public bodies like the OSPAR Convention (Marine Conservation Institute 2020). Portugal’s mainland protected areas are managed by the National Network of Protect Areas (Portuguese acronym: RNAP), by the Red Natura 2000 or both in some cases. There are seven protected areas under the regulations of the RNAP and 20 under the Red Natura 2000. These 27 MPAs extent over 29,404 km2, which equals 9.44% of the entire EEZ (311,648 km2; Leitão et al. 2014). One of the first designations on the continental shelf of Portugal was Berlengas (Republica Portuguesa 2018) in 1981. Since then, the size and the number of MPAs on this shelf has been increased with the ultimate goal of creating a well-connected network of MPAs that protects 14% of the national area by 2020 (Republica Portuguesa 2018). However, the extent of the areas that prohibit any type of extractive activity is still very small and efforts have focused on particular problems in coastal waters. For example, spatial distribution of anthropogenic impacts, identifying priority areas for conservation and proposing a representative network based on the spatial distribution of species and habitats within the Natura 2000 EU Directive (Republica Portuguesa 2018).

Updating to 2018 the 1950-2010 marine catch reconstructions of the Sea Around Us: Part I – Africa, Antarctica, Europe and the North Atlantic
309
Russia (Barents Sea) A first reconstruction of the catches in the Barents Sea, part of the Russian EEZ for 1950 to 2010, was partly based on Rejwan et al. (2001), was presented by Javanović et al. (2015, 2016), and was updated to 2014 by Popov and Zeller (2018; 2019). Here, we document how these catches were updated to 2016, then carried forward to 2018. Baseline data ICES Official Nominal Catches (2006-2016) were used for this update. The Russian statistics from the Barents Sea (ICES statistical area 1) were spatially disaggregated, allocating catch to each subarea proportionally based on surface area (see Table 2 in Popov et al. 2018). Species with low taxonomic resolution were disaggregated using breakdowns from Table 1 in Popov et al. (2018). The reported baseline was purely industrial and the same species-specific gear breakdowns as used previously were applied to 2016. Unreported landings Unreported legal landings data were derived based on discrepancies between ICES reported statistics and ICES Working Group reports. The same nine species identified in the original reconstruction were investigated for discrepancies using data from several ICES Working Group reports (ICES 2002a, 2002b, 2006, 2018a, 2018b, 2018c). Minor retroactive changes were made when the data were updated in the recent ICES Working Group reports. An underreporting rate was applied to the reported landings for each species. The underreporting rate was 5% in 2014, and the 2018 Arctic Fisheries Working Group (AFWG) report continues to estimate little to no unreported illegal catch in recent years (ICES 2018a). The AFWG report set unreported catches at zero in 2016 because reported catches of cod and haddock fell within 1% of the estimates made by the analysis group (ICES 2018a). Therefore, we gradually lowered the unreported rate by interpolating between 5% in 2014 to 0% in 2016. This underreporting rate was applied to all species except for Atlantic salmon (Salmo salar), which has been held at a 50% underreporting rate since 1994. Discards Discard rates for each gear type were applied to industrial landings (reported and unreported) from 16 different fisheries. Discards were allocated to the various taxonomic groups depending on the year, species and gear type used. The 2014 discard rates and taxonomic breakdowns were applied to 2015 and 2016. Artisanal landings Artisanal landings from the White Sea were equivalent to 0.2% of reported Russian Barents Sea landings. Because no updated national data for the White Sea were available, artisanal catch was broken down by taxa using the same ratios as in the original reconstruction. The species-specific gear breakdowns for 2014 were used for 2015 and 2016. Recreational fisheries Data on the number of Atlantic salmon (Salmo salar) caught recreationally each year as well as release and retention rates were obtained from the 2018 Report of the Working Group on North Atlantic Salmon (ICES 2018b). The number of salmon caught was converted into wet weight using mean annual weights for Atlantic salmon published in NOAA (2018). Previously, mean annual weights were available only to 2012, while the recent NOAA (2018) report allowed us to update our data from 2013 to 2016.

2020 Fisheries Centre Research Reports 28(5)
310
Total recreational catch was calculated as a percentage of ICES reported baseline landings (2.04%), as per the reconstruction. Recreational Atlantic salmon landings were removed from of the total recreational catch, and the remaining recreational catch was divided equally between seven species. Subsistence fisheries The total Russian population for 1897-2018 was available from Russia’ Federal State Statistics Service (FSS 2018) and was used to update the population estimates. To determine the percentage of the population fishing for subsistence, we used a statistics breakdown of urban and rural populations in various Districts and Oblasts of Russia. The 2017 rural and urban population statistics for Murmansk Oblast, Nenets Oblast, and Arkhangelsk Oblasts were used as new anchor points to calculate the percentage of people that were assumed to fish for subsistence. The last population anchor points were in 2010, and population ratios were linearly interpolated between 2010 and the new 2017 anchor value. Russia’s official per capita fish consumption rate reached a high of 22.7 kg in 2014 and has been falling ever since (Flanders Investment & Trade 2017). The decline is mainly the result of rising prices and reduced household incomes. The fish consumption rates dropped to 19.9 kg in 2015 (Flanders Investment & Trade 2017) and reportedly dropped to 12 kg in 2017 (World Fishing and Aquaculture 2018). The increasing price of fish means people can only afford to buy less (USDA Foreign Agricultural Services 2015), which could lead to more subsistence fishing. However, we could not find evidence to support this last inference, and thus the 26% subsistence fishing rate was carried forward from 2014. Total subsistence catch was divided equally between eight species as per the reconstruction. Transition from 2016 to 2018 The catch reconstructed to 2016 was carried forward to 2018 using the semi-automated procedures outlined in Noël (2020), based on ICES landings data to 2018. Semi-automated reconstructed catch data will later be replaced by a more detailed, research-intensive update. Marine biodiversity protection Russia has agreed to protect the biological diversity of the Barents Sea through the international Convention on Biological Diversity (Aichi), United Nations Convention on the Law of the Sea, the Ramsar Convention on Wetlands of International Importance and the World Heritage Convention (Marine Conservation Institute 2020). Russia is also a signatory to the international network of UNESCO Man and the Biosphere and its commitments extend to intergovernmental organizations such as the Helsinki Commission (HELCOM; Marine Conservation Institute 2020). The Barents Sea is a politically complex system due to its location in the Arctic Sea between Norway, Russia and the high seas. The Barents Sea Region has seen cooperation between both countries to enforce issues and coordinate scientific activities since 1957 (von Quillfeldt et al. 2009). In 2005, the Joint Norwegian–Russian Commission on Environmental Protection, which has a group focused on marine environmental cooperation, aimed to reach an integrated ocean management for the whole Barents Sea Region (BaSR). In 2010, the jurisdictional dispute was settled thanks to the Norwegian–Russian Treaty, which also included annexes to deal with fisheries and energy development. “A working group operating under the auspices of this commission released a plan in November 2016 for Norwegian–Russian cooperation to protect polar bears and other key species in the BaSR. It will be essential to proceed with care, assessing the relationship between high-priority areas from the perspective of ecosystem

Updating to 2018 the 1950-2010 marine catch reconstructions of the Sea Around Us: Part I – Africa, Antarctica, Europe and the North Atlantic
311
protection and areas of particular interest to fishing, energy, and shipping interests. Experience elsewhere makes it clear that it is difficult to identify areas for various forms of protection that are acceptable to all concerned parties. […] In the Barents Sea, the main areas of overlap or interplay involve fishing, gas fields, shipping lanes, and marine protected areas. Undoubtedly, some of the resultant issues can be handled on an ad hoc basis” (Vylegzhanin et al. 2018). In the Murmansk Province of northern Russia, where the mining industry is the basis of the regional economy (Makarov et al. 2020), the Kandalakshsky Zapovednik (Reserve) is located within Kandalakshsky Bay, a part of the White Sea. The reserve was established in 1937 with 495 km2 of protection in the marine realm (Marine Conservation Institute 2020). “The Murmansk region can be considered an example of a "polarized landscape" according to the concept proposed by Rodoman (1974), where the environmental effect of regulating and supporting ecosystem services in [protected areas] is greatly reduced in the areas accommodating major mining and metals projects, and the scope of economic damage caused by the environmental impacts of the industry is not compensated by adequate environmental protection efforts” (Makarov et al. 2020). Spain (Northwest) The original reconstruction of catches by Spain in its northwest Atlantic EEZ for 1950 to 2010 was completed by Villasante et al. (2015, 2016). Here, we document how this initial reconstruction was updated to 2017, then carried forward to 2018. Reported catch baseline data ICES data from 2011-2017 were used as the reported baseline of catches for the Spanish Northwest coast and EEZ. Reported catches for 2011-2017 were allocated spatially based on the percentage of the ICES area within the EEZ by ICES area: 100% of catches were assigned within the EEZ from area 27.8.c, 33% from area d.2, and 33% from area e.2 were counted as being caught from within the EEZ, as described in Villasante et al. (2015). Catch from area 27.8.c were distributed among the artisanal and industrial sectors according to the allocation given to specific taxa in 2010 (Villasante et al. 2015) for 2011-2017. Catch taken outside of Spain’s EEZ were considered industrial as per Sea Around Us definitions. If taxa reported by ICES were not previously present in the 2010 reconstruction (Villasante et al. 2015), their allocation to fishing sector was approximated based on the nearest taxonomic relative for catch assigned within Spain’s EEZ. Unreported catches Unreported industrial and artisanal landings were calculated as a percentage of reported catches for each taxon for 2011-2017. For taxa in which the unreported percentage varied, the 2008-2010 average ratio of unreported to reported catch was used to reconstruct unreported catch for 2011-2017. Unreported recreational and subsistence catches were calculated using per capita catch rates obtained by dividing the 2008-2010 total recreational and subsistence catch for divisions 27.8.c and 27.9.a by the combined population of the provinces of Galicia, Asturias, Cantabria, and Basque Country (division 28)37. These north coast per-capita catch rates for recreational and subsistence fisheries were averaged from 2008-2010 and multiplied by the updated north coast population for 2011 to 2017 to obtain an estimate of recreational and subsistence catch for 2011-2017. This catch was allocated to the two ICES divisions (27.8.c and 27.9.a) within Spain’s Northwest EEZ according to 2010 proportions (Villasante et al. 2015) and taxonomically disaggregated following 2008-2010 proportions for both divisions.
37 http://www.citypopulation.de/Spain-Cities.html

2020 Fisheries Centre Research Reports 28(5)
312
Discards Discards were estimated for industrial and artisanal landings in each ICES division for 2011-2017 using the 2010 discard rates and taxonomic allocations by Villasante et al. (2015). The northeast Atlantic has been experiencing considerable change in fishing pressure and regulations of fisheries in recent years. The European Union has phased in the Landing Obligation Policy during 2015-2019 in hopes of reducing marine fisheries discard rates. However, the impacts of this policy on discarding practices in Spain’s fisheries are still to be determined (Uhlmann et al. 2019, Guillen et al. 2018). Transition from 2017 to 2018 The catch reconstructed to 2017 was carried forward to 2018 using the semi-automated procedures outlined in Noël (2020), based on ICES landings data to 2018. Semi-automated reconstructed catch data will later be replaced by a more detailed, research-intensive update. Marine biodiversity protection Spain protects biological diversity along its northwest coast through international agreements such as the Convention on Biological Diversity (Aichi) and the Ramsar Convention on Wetlands of International Importance, but also through regional treaties like Natura 2000. Spain is also a signatory to the Barcelona Convention and to the international network of UNESCO Man and the Biosphere, and its commitments extend to NGOs and/or public bodies like the OSPAR Convention (Marine Conservation Institute 2020). “Spain distinguishes itself from most other countries by having strong local fishers’ organizations to represent their constituents, with historical roots and formal roles in the overall fisheries governance of the country. These local fishers’ organizations called ‘cofradías’, are corporations with legal jurisdiction and decision-making capacity that are defined with territorial limits of action and represent different fishing communities. Through the ‘cofradías’, local fishers are a key formal stakeholder, recognized by state law and are therefore entitled to be involved in the implementation of MPAs. Their involvement is particularly present in marine reserves with fisheries interests. The best recognized examples where fishermen are involved in the declaration and implementation of MPAs are in Lira (Os Miñarzos Marine Reserve) and Cedeira, two marine reserves in the Atlantic coast of Galicia. Here, the management body is made up of an equal number of representatives of public administration and fisheries professional groups” (Otero 2015). One of the first MPAs created in Spain under the Spanish Network of Marine Protected Areas (RAMPE) was in these Atlantic waters, 60 km off the coast of Asturias. It was the seamount called “El Cachucho”, also known as ‘Le Danois Bank’ (Otero 2015). Nevertheless, Spanish MPAs are very often managed individually without considering adjacent areas such as terrestrial zones and sharing management responsibilities is not well-established among authorities and other stakeholders (Otero 2015). In the North of Spain, as in other parts of Spain, the gathering of shellfish (e.g. clams, cockles) on the beaches have been a subsistence activity performed by women from coastal communities without much control or stock surveillance. “Traditionally, these resources were accessible to all, as they were viewed as food for the poor (Macho et al. 2013). The open access regime ended when the Galician regional government, given the right to regulate the sector, introduced new rules. For women, the process also implied a new vision of themselves as capable of managing an organisation. The role of the regional administration in the transition was essential, as facilitators provided training, technical assistance, and legal advice. In only a few years, women transformed shellfish gathering from an individual activity under a regime of open access into a collective endeavour. As a result of these changes, the profitability of shellfish gathering tripled between 1995 and 2000, to the benefit of the shellfish gatherers themselves” (Pascual-Fernández et al. 2015).

Updating to 2018 the 1950-2010 marine catch reconstructions of the Sea Around Us: Part I – Africa, Antarctica, Europe and the North Atlantic
313
In the North of Spain, Galicia is the most important Autonomous Community in terms of the octopus (Octopus vulgaris) fishery. “[While,] the illegal catch of Octopus vulgaris, which is estimated to range between 20–50% of total reported catches in 2010 (Villasante et al. 2015), better control and monitoring programs for more sustainable fishing appear to have contributed to a substantial reduction of illegal practices over the last years” (Pascual-Fernández et al. 2020). Sweden (West Coast) The original reconstruction of Sweden’s West Coast marine fisheries catches for 1950-2010 was carried out by Persson (2015, 2016); this account documents its update to 2017 and carry-forward to 2018. Reported catch baseline data Since the previous reconstruction included Swedish catch within the greater Northeast Atlantic region and not just the North Sea and Swedish West Coast waters, this update includes catch in those regions as well. ICES catch statistics from ICES areas I through VII were accepted as baseline reported landings for 2011-2017. Data reported to area IIIa (which contains the part of Sweden’s EEZ in the North Sea) were split into sectors (artisanal and industrial) using the same ratio of artisanal to industrial catch as in the original reconstruction: 2% artisanal, 98% industrial. All catch assigned to the artisanal sector was assumed to have been taken within Sweden’s EEZ, while the industrial catch was split proportionally to within and outside Sweden’s EEZ depending on the ratios per ICES area for 2011-2017. Sweden’s west coast EEZ covers 23.45% of the area within IIIa, and as such, 23.45% of the industrial catch was assigned to ‘Sweden (West Coast)’ while the other 76.55% was assigned to ‘Outside of EEZ’. Catch reported to all other ICES areas were assigned 100% industrial and to ‘Outside of EEZ’. ICES catch statistics per species were compared to those of various ICES working group reports (ICES 2015, 2016) to identify discrepancies between officially reported ICES data and ICES stock assessments data. No such discrepancies were found and reported catch statistics did not require adjustment. Taxonomic catch composition of unreported landings Unreported catches were calculated as a percentage of reported landings for 2011-2017. In the original reconstruction, the proportion of unreported landings declined at a rate of 0.29% per year for all species except herring (Clupea harengus), sprat (Sprattus sprattus), and cod (Gadus morhua). This trend was continued from the 2010 unreported landings rate (5.8%) to 2014 for a rate of 4.6%. The unreported landings rate for herring and sprat declined by 0.33% per year to an unreported landings rate of 5.0% in 2010. This trend was continued until 2017, resulting in a rate of 3.66% unreported landings in 2014. The rate of unreported landings for cod declined by 0.78% per year, resulting in an unreported landings rate of 10% by 2010. The average rate was carried forward to 2017, resulting in an unreported landings rate of 6.9% in 2017. Discards Discards were calculated for all species except for herring and sprat for 2011-2017 by continuing discard rates from the previous reconstruction (Persson 2015). Discard rates were held constant at the 2010 level for all species except for cod. For all non-cod roundfish species, the discard rate was 6.40% (Persson 2015). For flatfishes (Limanda limanda, Pleuronectes platessa, Scophthalmus rhombus, and Platichthys flesus), the discard rate varied by species, from 33.4% to 48.0% (Persson 2015). These discard rates were accepted for the update to 2017 as they are still largely consistent with discard rates reported by the ICES assessment of demersal stocks in the North Sea (ICES 2015). Cod had a variable discard rate that increased every year by 0.27%. The 2014 discard rate of 13.6% was extended to 2017.

2020 Fisheries Centre Research Reports 28(5)
314
Recreational and subsistence catches Recreational and subsistence catches were carried forward proportionally to 2017. The 70%-30% split between recreational and subsistence catch, respectively, was maintained. Transition from 2017 to 2018 The catch reconstructed to 2017 was carried forward to 2018 using the semi-automated procedures outlined in Noël (2020), based on ICES landings data to 2018. Semi-automated reconstructed catch data will later be replaced by a more detailed, research-intensive update. Marine biodiversity protection Sweden has agreed to protect its biological diversity through the international Convention on Biological Diversity (Aichi) and the Ramsar Convention on Wetlands of International Importance (Marine Conservation Institute 2020). Sweden is also a signatory to Regional Treaties and Agreements such as the Natura 2000, and it is also part of the international network of UNESCO Man and the Biosphere. Its commitments extend to intergovernmental organizations such as the OSPAR Convention and the Helsinki Commission (HELCOM; Marine Conservation Institute 2020). Kosterhavet marine national park (KHNP) covers a marine area of 370 km2 (Marine Conservation Institute 2020), which corresponds to about 3% of the West Coast EEZ of Sweden (14,468 km2; Persson 2016). It was designated in 2009, and it was Sweden’s first marine national park (Marine Conservation Institute 2020; Pantzar 2020). Two areas in Koster were designated as Natura 2000 sites in 2005, aiming to protect harbour seal (Phoca vitulina), harbour porpoise (Phocoena phocoena) and Lophelia pertusa, the cold-water coral also known as ‘spider hazard’ (Pantzar 2020). Based on the Swedish Fisheries Act, this marine National Park is situated inside a no-trawling zone, but the Swedish Environmental Protection Agency (SEPA) allows shrimp trawling in the National Park. The small-scale shrimp fishery focuses on the Northern Shrimp (Pandalus borealis), which uses the fjords as breeding grounds. Two of the reasons given for allowing this fishery were its long tradition and the fact that it was a popular tourist attraction in the late 1880s (SEPA 2009). There is an agreement between authorities, fisheries, and scientists to ban shrimp trawling in areas where there were signs of coral reefs and to limit trawling to ships with lighter trawl boards, larger net mesh size and a special aluminum structure aimed at minimizing bycatch (SEPA 2009). How these weak restrictions affect fisheries and benefit ecosystems (or not) is unclear. “As interviewees suggest, it is difficult to determine the impact of the national park on the local fisheries sector and to what extent, if any, the conservation measures in place result in improved stocks and catches. That said, it is evident that the market demand for seafood harvested in KHNP is strong and increasing. According to one fisherman, the demand for local seafood has increased in general, and the restaurants located in the area that he sells to frequently request seafood caught inside the national park (Interviewee F 2017)” (Pantzar 2020). A local shrimp trawl operator who spent most of his time in the national park water and who has seen many species returning to the park stated, “It is not really a detour for me to go around the closed areas. […] The credibility of conservation is closely linked to the justification of why they are necessary and follow-up of their results’ (Interviewee E, 2017)” (Pantzar 2020). Representatives of the tourism sector also show understanding about measures that are explained to stakeholders and are science-based (Pantzar 2020). Results and Discussion The fisheries of the countries detailed above share detailed spatialized data reporting to the International Council for the Exploration of the Sea (ICES). While reported data includes finer spatial resolution compared

Updating to 2018 the 1950-2010 marine catch reconstructions of the Sea Around Us: Part I – Africa, Antarctica, Europe and the North Atlantic
315
to FAO data, ICES reported data continue to exclude sectors such as recreational and subsistence fisheries and catch amounts discarded at sea. The methods above use gear-specific information to estimate discards and working group information to estimate unreported landings. Reconstruction of these fishing practices and sectors remains important to estimate the total impact of fisheries on fish stocks in the Northeast Atlantic. We welcome feedback from colleagues and strive to continually improve upon our catch reconstructions. Acknowledgements Funding for the work presented here was provided by the Minderoo Foundation, by the Marisla, Oak, and David and Lucille Packard Foundations, and by the Bloomberg Philanthropies through Rare. References (Northwestern and Northern Continental Europe) Chu, E., G. Tsui, T. Cashion, M. Frias-Donaghey, R. Hernandez, S.-L. Noël, S. Popov, E. Sy, C. Pham and T.
Morato. 2020. Islands in the North Atlantic: Updated catch reconstructions for 2011 – 2018, p. 216-231. In: B. Derrick, M. Khalfallah, V. Relano, D. Zeller and D. Pauly (eds). Updating to 2018 the 1950-2010 Marine Catch Reconstructions of the Sea Around Us: Part I – Africa, Antarctica, Europe and the North Atlantic. Fisheries Centre Research Report 28(5).
Popov, S., E. Page, M. Frias-Donaghey and R. Hernandez. 2020. Baltic Sea: Updated catch reconstructions to 2018, p. 232-250. In: B. Derrick, M. Khalfallah, V. Relano, D. Zeller and D. Pauly (eds). Updating to 2018 the 1950-2010 Marine Catch Reconstructions of the Sea Around Us: Part I – Africa, Antarctica, Europe and the North Atlantic. Fisheries Centre Research Report 28(5).
References (by country) Belgium Belgian Federal Public Service (FPS) Health, Food Chain Safety and Environment. 2015. Something is moving
at sea…A marine spatial plan for the Belgian part of the North Sea. Available at: www.health.belgium.be/sites/default/files/uploads/fields/fpshealth_theme_file/19103366/Brochure%20Something%20is%20moving%20at%20sea%20ed.2015.pdf
Belgian Federal Public Service (FPS) Health, Food Chain Safety and Environment. 2020. Something is moving at sea - The marine Spatial Plan for 2020-2026. Available at: https://www.health.belgium.be/sites/default/files/uploads/fields/fpshealth_theme_file/brochure_something_is_moving_at_sea_2020.pdf
Derweduwen, J., K. Hostens, J. Reubens J et al (2012) Do windmill parks function as a refugium? p. 28. In: J. Mees and J. Seys (eds). Book of abstracts – VLIZ Young Scientists’ Day, Brugge, Belgium 24 February 2012. VLIZ Special Publication 55. Flanders Marine Institute (VLIZ), Oostende.
Lescrauwaet, A.K., H. Debergh, M. Vincx and J. Mees. 2010. Fishing in the past: Historical data on sea fisheries landings in Belgium. Marine Policy, 34(6): 1279-1289. doi.org/10.1016/j.marpol.2010.05.006
Lescrauwaet, A.-K., E. Torreele, M. Vincx, H. Polet, J. Mees, A. Lindop and K. Zylich K. 2015. Invisible catch: a century of bycatch and unreported removals in sea fisheries, Belgium 1950-2010. Fisheries Centre Working Paper #2015-18, 18 p.
Lescrauwaet, A.-K., E. Torreele, M. Vincx, H. Polet, J. Mees. 2016. Belgium, p. 202. In: D. Pauly and D. Zeller (eds). Global Atlas of Marine Fisheries: A critical appraisal of catches and ecosystem impacts. Island Press, Washington D.C.
King of the Belgians. 2020. Marine Spatial Planning- Royal Decree establishing the marine spatial planning for the period 2020 to 2026 in the Belgian sea-areas. Available at: www.health.belgium.be/sites/default/files/uploads/fields/fpshealth_theme_file/msp-2020-englishtranslation.pdf
Marine Conservation Institute. 2020. MPAtlas [Online]. Seattle, WA. Available at: www.mpatlas.org Mazaris, A.D., A. Kallimanis, E. Gissi, C. Pipitone, R. Danovaro, J. Claudet, G. Rilov, F. Badalamenti, V.
Stelzenmüller, L. Thiault, L. Benedetti-Cecchi, P. Goriup, S. Katsanevakis and S. Fraschetti. 2019. Threats to marine biodiversity in European protected areas. Science of The Total Environment, 677: 418-426
Noël, S.-L. 2020. Semi-automation procedure for catch reconstruction forward carry, p. 15-20. In: B. Derrick, M. Khalfallah, V. Relano, D. Zeller and D. Pauly (eds). Updating to 2018 the 1950-2010 Marine Catch

2020 Fisheries Centre Research Reports 28(5)
316
Reconstructions of the Sea Around Us: Part I – Africa, Antarctica, Europe and the North Atlantic. Fisheries Centre Research Report 28(5).
Tessens, E. 2012. De Belgische zeevisserij 2011- Aanvoer en besomming. De Belgische zeevisserij, Departement Landbow en Visserij, Oostende, Belgium. 120 p.
Tessens, E. 2013. De Belgische zeevisserij 2012- aanvoer en besomming. De Belgische zeevisserij, Departement Landbow en Visserij, Oostende, Belgium. 121 p.
Tessens, E. 2014. De Belgische zeevisserij 2013- aanvoer en besomming. De Belgische zeevisserij Departement Landbow en Visserij, Oostende, Belgium. 116 p.
Tessens, E. 2015. De Belgische zeevisserij 2014- aanvoer en besomming. De Belgische zeevisserij, Departement Landbouw en Visserij, Oostende, Belgium. 117 p.
Verlé, K., K. Sys, E. Pecceu, T. Verleye, F. van Winsen and A.K. Lescrauwaet. 2020. The Re-Emergence of Small-Scale Fisheries in Belgium? – An Enquiry, p. 369-394. In: J.J. Pascual-Fernández, C. Pita, M. Bavinck (eds). Small-Scale Fisheries in Europe: Status, Resilience and Governance. Springer, Cham.
Denmark (North Sea) Bale, S., P. Rossing, S. Booth and D. Zeller. 2010. Denmark’s marine fisheries catches in the Baltic Sea (1950-
2007), p. 36-62. In: P. Rossing, S. Booth and D. Zeller (eds). Total marine fisheries extractions by country in the Baltic Sea: 1950-present. Fisheries Centre Research Report 18(1).
Bale, S., P. Rossing, S. Booth and D. Zeller. 2016. Denmark (Baltic Sea), p. 236. In: D. Pauly and D. Zeller (eds). Global Atlas of Marine Fisheries: A critical appraisal of catches and ecosystem impacts. Island Press, Washington D.C.
Edelvang, K., H. Gislason, F. Bastardie, A. Christensen, J. Egekvist, K. Dahl, C. Goeke, I.K. Petersen, S. Sveegaard, S. Heinänen, A.L. Middelboe, Z. Al-Hamdani, J.B. Jensen and J. Leth. 2017. Analysis of marine protected areas – in the Danish part of the North Sea and the Central Baltic around Bornholm. Part 1: The coherence of the present network of MPAs DTU Aqua Report No. 325-2017. National Institute for Aquatic Resources, Technical University of Denmark. 105 p.
Garn, A.K., J. Woollhead and A. Petersen. 2019. Lessons learned from a desktop review of conservation areas in Denmark: Applying IUCN Management categories for protected areas. Parks, 25(2):79-92.
Gibson, D., B. Uberschär, K. Zylich and D. Zeller. 2014. Preliminary reconstruction of total marine fisheries catches for Denmark in the Kattegat, the Skagerrak and the North Sea (1950-2010). Fisheries Centre Working Paper #2014-25, 12 p.
Gibson, D., B. Uberschär, K. Zylich and D. Zeller. 2016. Denmark (North Sea), p. 237. In: D. Pauly and D. Zeller (eds). Global Atlas of Marine Fisheries: A critical appraisal of catches and ecosystem impacts. Island Press, Washington D.C.
ICES. 2012. ICES Report of the Working Group on the Assessment of Demersal Stocks in the North Sea and Skagerrak (WGNSSK), 27 April - 3 May 2012, ICES Headquarters, Copenhagen. ICES CM 2012/ACOM:13. 1346 p.
ICES. 2018a. ICES Report of the Herring Assessment Working Group for the Area South of 62°N (HAWG). 29-31 January 2018 and 12-20 March 2018. ICES HQ, Copenhagen, Denmark. ICES CM 2018/ACOM:07. 960 p.
ICES. 2018b. ICES Report of the Working Group on the Assessment of Demersal Stocks in the North Sea and Skagerrak (WGNSSK). 24 April - 3 May 2018, Oostende, Belgium. ICES CM 2018/ACOM:22. 1250 p.
ICES. 2018c. ICES Report of the Working Group on Widely Distributed Stocks (WGWIDE), 28 August- 3 September 2018, Torshavn, Faroe Islands. ICES CM 2018/ACOM: 23. 488 p.
ICES. 2018d. Advice on fishing opportunities, catch, and effort Celtic Seas and Greater North Sea Ecoregions- Haddock (Melanogrammus aeglefinus) in Subarea 4, Division 6.a, and Subdivision 20 (North Sea, West of Scotland, Skagerrak). doi.org/10.17895/ices.pub.4435
ICES. 2018e. Advice on fishing opportunities, catch, and effort Greater North Sea Ecoregion- Cod (Gadus morhua) in Subarea 4, Division 7.d, and Subdivision 20 (North Sea, eastern English Channel, Skagerrak). doi.org/10.17895/ices.pub.4436
ICES. 2018f. Advice on fishing opportunities, catch, and effort Greater North Sea Ecoregion- Northern shrimp (Pandalus borealis) in divisions 3.a and 4.a East (Skagerrak and Kattegat and northern North Sea in the Norwegian Deep). doi.org/10.17895/ices.pub.4594
Marine Conservation Institute. 2020. MPAtlas [Online]. Seattle, WA. Available at: www.mpatlas.org Noël, S.-L. 2020. Semi-automation procedure for catch reconstruction forward carry, p. 15-20. In: B. Derrick,
M. Khalfallah, V. Relano, D. Zeller and D. Pauly (eds). Updating to 2018 the 1950-2010 Marine Catch Reconstructions of the Sea Around Us: Part I – Africa, Antarctica, Europe and the North Atlantic. Fisheries Centre Research Report 28(5).

Updating to 2018 the 1950-2010 marine catch reconstructions of the Sea Around Us: Part I – Africa, Antarctica, Europe and the North Atlantic
317
Olesen, H.J. and M. Storr-Paulsen. 2015. Eel, cod and seatrout harvest in Danish recreational fishing during 2012. DTU Aqua report no. 293-2015. National Institute of Aquatic Resources, Charlottenlund. 21 p.
France (Atlantic coast) Álvarez-Fernández, I., J. Freire, I. Naya, N. Fernández and N. Sánchez-Carnero. 2020a. Failures in the design
and implementation of management plans of Marine Protected Areas: An empirical analysis for the North-east Atlantic Ocean. Ocean & Coastal Management, 192: 105178.
Álvarez-Fernández, I., J. Freire and N. Sánchez-Carnero. 2020b. Low-quality management of Marine Protected Areas in the North-East Atlantic. Marine Policy, 117: 103922.
Bultel, E., D. Gascuel, F. Le Manach, D. Pauly and K. Zylich. 2015. Catch reconstruction for the French Atlantic coast, 1950-2010. Fisheries Centre Working Paper #2015-37, 20 p.
Bultel, E., D. Gascuel, F. Le Manach, D. Pauly and K. Zylich. 2016. France (Atlantic coast), p. 252. In: D. Pauly and D. Zeller (eds). Global Atlas of Marine Fisheries: A critical appraisal of catches and ecosystem impacts. Island Press, Washington D.C.
García-Flórez, L., J. Morales, M.B. Gaspar, D. Castilla, E. Mugerza, P. Berthou, L. García de la Fuente, M. Oliveira, O. Moreno, J.J. García del Hoyo, L. Arregi, C. Vignot, R. Chapela and A. Murillas. 2013. A novel and simple approach to define artisanal fisheries in Europe. Marine Policy, 44: 152-159.
Marine Conservation Institute. 2020. MPAtlas [Online]. Seattle, WA. Available at: www.mpatlas.org Merino, G., M. Barange, J.A Fernandes, C. Mullon, W. Cheung, V. Trenkel and V. Lam. 2014. Estimating the
economic loss of recent North Atlantic fisheries management. Progress in Oceanography, 129: 9. Ministry of Ecology, Sustainable Development and Energy. 2015. National strategy for the creation and
management of marine protected areas. Available at: www.sprep.org/attachments/VirLib/French_Polynesia/national-strategy-management-mpa-france.pdf
Noël, S.-L. 2020. Semi-automation procedure for catch reconstruction forward carry, p. 15-20. In: B. Derrick, M. Khalfallah, V. Relano, D. Zeller and D. Pauly (eds). Updating to 2018 the 1950-2010 Marine Catch Reconstructions of the Sea Around Us: Part I – Africa, Antarctica, Europe and the North Atlantic. Fisheries Centre Research Report 28(5).
van Putten, I.E., E. Quillérou and O. Guyader. 2012. How constrained? Entry into the French Atlantic fishery through second-hand vessel purchase. Ocean & Coastal Management, 69: 50-57.
Germany (North Sea) BfN. 2020. Protected Areas: Overview and key facts. Federal Agency for Nature Conservation. Available at:
www.bfn.de/en/activities/marine-nature-conservation/national-marine-protected-areas/overview-and-key-facts.html
Caveen, A.J., C. Fitzsimmons, M. Pieraccini, E. Dunn, C.J. Sweeting, M.L. Johnson, H. Bloomfield, E.V. Jones, P. Lightfoot, T.S. Gray and S.M. Stead. 2014. Diverging strategies to planning an ecologically coherent network of MPAs in the North Sea: the roles of advocacy, evidence and pragmatism in the face of uncertainty. In Advances in Marine Biology, 69: 325-370.
Devillers, R., R.L. Pressey, A. Grech, J.N. Kittinger, G.J. Edgar, T. Ward and R. Watson. 2014. Reinventing residual reserves in the sea: are we favouring ease of establishment over need for protection? Aquatic Conservation: Marine and Freshwater Ecosystems, 25(4): 480–504. doi.org/10.1002/aqc.2445
Doering, R., A. Kempf, T. Belschner, J. Berkenhagen, M. Bernreuther, S. Hentsch, G. Kraus, H.-J. Raetz, N. Rohlf, S. Simons, C. Stransky, J. Ulleweit. 2017. Research for PECH Committee – BREXIT Consequences for the Common Fisheries Policy-Resources and Fisheries-a Case Study. IP/B/PECH/IC/2017-034. Directorate-General for Internal Policies. Policy Department for Structural and Cohesion Policies. European Parliament.
Dogger Bank Background Document. 2016. Background Document to the draft Joint Recommendation for Offshore Fisheries Management on the International Dogger Bank under the revised Common Fisheries Policy. The Hague, Bonn, London. Available at: https://fiskeristyrelsen.dk/media/8992/20160531_dogger_bank_background_document_final.pdf
Gibson, D., R. Froese, B. Ueberschär, K. Zylich and D. Zeller. 2015. Reconstruction of total marine fisheries catches for Germany in the North Sea (1950-2010). Fisheries Centre Working Paper #2015-09, 11 p.
Gibson, D., R. Froese, B. Ueberschär, K. Zylich and D. Zeller. 2016. Germany (North Sea), p. 276. In: D. Pauly and D. Zeller (eds). Global Atlas of Marine Fisheries: A critical appraisal of catches and ecosystem impacts. Island Press, Washington D.C.
ICES. 2016a. Report of the Herring Assessment Working Group for the Area South of 62˚N (HAWG). ICES HQ, Copenhagen, Denmark.

2020 Fisheries Centre Research Reports 28(5)
318
ICES. 2016b. Report of the Working Group on the Assessment of Demersal Stocks in the North Sea and Skagerrak (WGNSSK). Hamburg, Germany. 16 p.
ICES. 2016c. Report of the Working Group on Widely Distributed Stocks (WGWIDE). 31 August – 6 September 2016, ICES HQ, Copenhagen, Denmark. ICES CM 2016/ACOM:16. 500 p.
Marine Conservation Institute. 2020. MPAtlas [Online]. Seattle, WA. Available at: www.mpatlas.org Noël, S.-L. 2020. Semi-automation procedure for catch reconstruction forward carry, p. 15-20. In: B. Derrick,
M. Khalfallah, V. Relano, D. Zeller and D. Pauly (eds). Updating to 2018 the 1950-2010 Marine Catch Reconstructions of the Sea Around Us: Part I – Africa, Antarctica, Europe and the North Atlantic. Fisheries Centre Research Report 28(5).
Roberts, C. and L. Mason. 2008. Return to Abundance: A case for Marine Reserves in the North Sea. A report for WWF-UK. University of York, England. 48 p.
Wakefield, J. 2019. European Protection of Fisheries in the North East Atlantic, p. 173-182. In: C. Sheppard (ed). World Seas: An Environmental Evaluation. Academic Press.
The Netherlands Álvarez, H., A.L. Perry, J. Blanco, S. Garcia, R. Aguilar. 2020. Protecting the North Sea: New research for
biodiversity recovery. Oceana. doi.org/10.31230/osf.io/6dukn Birkun Jr., A.A. and A. Frantzis. 2008. Phocoena phocoena ssp. relicta. The IUCN Red List of Threatened
Species, 2008:e.T17030A6737111. dx.doi.org/10.2305/IUCN.UK.2008.RLTS.T17030A6737111.en De Noordzee. 2018. Marine Protected Areas in the Dutch North Sea. Available at: www.noordzee.nl/marine-
protected-areas-in-the-dutch-north-sea/ Geelhoed, S.C., N. Janinhoff, S. Lagerveld and H. Verdaat. 2020. Marine mammal surveys in Dutch North Sea
waters in 2019 (No. C016/20). Wageningen Marine Research. Gibson, D., K. Zylich and D. Zeller. 2015. Preliminary reconstruction of total marine fisheries catches for the
Netherlands in the North Sea (1950-2010). Fisheries Centre Working Paper #2015-46, 15 p. Gibson, D., K. Zylich and D. Zeller. 2016. Netherland, p. 342. In: D. Pauly and D. Zeller (eds). Global Atlas of
Marine Fisheries: A critical appraisal of catches and ecosystem impacts. Island Press, Washington D.C.
Hugenholtz, E. 2008. The Dutch Case: a network of marine protected areas. WWF, Zeist, The Netherlands. 48 p. Available at: wwfeu.awsassets.panda.org/downloads/the_dutch_case___a_network_of_marine_protected_areas_by_e_hugenholtz_2008.pdf
ICES. 2014. Report of the Working Group on Recreational Fisheries Surveys (WGRFS). ICES, Sukarrieta, Spain. 662 p.
ICES. 2015. ICES Report from the Working Group on Recreational Fisheries Surveys (WGRFS), 1–5 June 2015, Sukarrieta, Spain. ICES CM 2015\SSGIEOM:10. 111 p.
ICES. 2017. ICES Report from the Working Group on Recreational Fisheries Surveys (WGRFS), 6–10 June 2016, Nea Peramos, Greece. ICES CM 2016/SSGIEOM:10. 76 p.
ICES. 2018a. ICES Report of the Herring Assessment Working Group for the Area South of 62°N (HAWG). 29-31 January 2018 and 12-20 March 2018. ICES HQ, Copenhagen, Denmark. ICES CM 2018/ACOM:07. 960 p.
ICES. 2018b. ICES Report of the Working Group on the Assessment of Demersal Stocks in the North Sea and Skagerrak (WGNSSK). 24 April - 3 May 2018, Oostende, Belgium. ICES CM 2018/ACOM:22. 1250 p.
ICES. 2018c. ICES Report of the Working Group on Widely Distributed Stocks (WGWIDE), 28 August- 3 September 2018, Torshavn, Faroe Islands. ICES CM 2018/ACOM: 23. 488 p.
Marine Conservation Institute. 2020. MPAtlas [Online]. Seattle, WA. Available at: www.mpatlas.org Noël, S.-L. 2020. Semi-automation procedure for catch reconstruction forward carry, p. 15-20. In: B. Derrick,
M. Khalfallah, V. Relano, D. Zeller and D. Pauly (eds). Updating to 2018 the 1950-2010 Marine Catch Reconstructions of the Sea Around Us: Part I – Africa, Antarctica, Europe and the North Atlantic. Fisheries Centre Research Report 28(5).
Spijkerboer, R.C., C. Zuidema, T. Busscher and J. Arts. 2020. The performance of marine spatial planning in coordinating offshore wind energy with other sea-uses: The case of the Dutch North Sea. Marine Policy, 115: 103860.
Norway Hytönen, M. (ed). 2020. Local knowledge in nature conservation management: Situation in Finland, Sweden,
Norway, Iceland, Greenland and the Faroe Islands. Natural resources and bioeconomy studies 14/2020. Natural Resources Institute Finland, Helsinki. 66 p.

Updating to 2018 the 1950-2010 marine catch reconstructions of the Sea Around Us: Part I – Africa, Antarctica, Europe and the North Atlantic
319
Marine Conservation Institute. 2020. MPAtlas [Online]. Seattle, WA. Available at: www.mpatlas.org Moland, E., E. Moland Olsen, H. Knutsen, J.A. Knutsen, S.E. Enersen, C. André, N.C. Stenseth. 2011. Activity
patterns of wild European lobster Homarus gammarus in coastal marine reserves: implications for future reserve design. Marine Ecology Progress Series, 429:197-207. doi.org/10.3354/meps09102
Nedreaas, K., S. Iversen and G. Kuhnle. 2015. Preliminary estimates of total removals by the Norwegian marine fisheries, 1950-2010. Fisheries Centre Working Paper #2015-94, 15 p.
Nedreaas, K., S. Iversen and G. Kuhnle. 2016. Norway, p. 355. In: D. Pauly and D. Zeller (eds). Global Atlas of Marine Fisheries: A critical appraisal of catches and ecosystem impacts. Island Press, Washington D.C.
Thorbjørnsen, S.H., E. Moland, C. Simpfendorfer, M. Heupel, H. Knutsen and E.M. Olsen. 2019. Potential of a no-take marine reserve to protect home ranges of anadromous brown trout (Salmo trutta). Ecology and evolution, 9(1): 417-426.
Villegas-Ríos, D., E. Moland and E.M. Olsen. 2017. Potential of contemporary evolution to erode fishery benefits from marine reserves. Fish and Fisheries, 18(3): 571-577.
Portugal Leitão, F. and V. Baptista. 2017. The discard ban policy, economic trends and opportunities for the Portuguese
fisheries sector. Marine Policy, 75: 75-83. Leitão, F., V. Baptista, K. Erzini, D. Iritani and D. Zeller. 2016. Portugal (Mainland), p. 369. In: D. Pauly and
D. Zeller (eds). Global Atlas of Marine Fisheries: A critical appraisal of catches and ecosystem impacts. Island Press, Washington D.C.
Leitão, F., V. Baptista, K. Erzini, D. Iritani and D. Zeller. 2014. Reconstruction of mainland Portugal fisheries catches 1950-2010. Fisheries Centre Working Paper #2014-08, 29 p.
Leitão, F., V. Baptista, D. Zeller and K. Erzini. 2014. Reconstructed catches and trends for mainland Portugal fisheries between 1938 and 2009: implications for sustainability, domestic fish supply and imports. Fisheries Research, 155: 33-50. doi.org/10.1016/j.fishres.2014.02.012
Marine Conservation Institute. 2020. MPAtlas [Online]. Seattle, WA. Available at: www.mpatlas.org Noël, S.-L. 2020. Semi-automation procedure for catch reconstruction forward carry, p. 15-20. In: B. Derrick,
M. Khalfallah, V. Relano, D. Zeller and D. Pauly (eds). Updating to 2018 the 1950-2010 Marine Catch Reconstructions of the Sea Around Us: Part I – Africa, Antarctica, Europe and the North Atlantic. Fisheries Centre Research Report 28(5).
Pauly, D. and D. Zeller (eds). 2016. Global Atlas of Marine Fisheries: A critical appraisal of catches and ecosystem impacts. Island Press, Washington D.C., xii +497 p.
Rangel, M., L. Bentes, P. Monteiro, P. Veiga, A. Guerreiro, D. Pio-Quinto, F. Oliveira, G. Araújo, H. Pais, I. Sousa, I. Silva, J. Pontes, S. Carvalho, P. Pita, S. Villasante, R. Coelho, J.M. Gonçalves and K. Erzini. 2018. PESCARDATA – Recreational fisheries in mainland Portugal. International Symposium on Marine Recreational Fishing. 14th-15th September 2018, Vigo, Spain.
Republica Portuguesa. 2018. Áreas marinhas protegidas- Anexos, Junho 2018. Available at: www.dgrm.mm.gov.pt/documents/20143/43971/relatorio+GTAMP+junho+18.pdf/4142bf84-0ba2-10ee-2751-426a9f0d3f9b
Russia (Barents Sea) Federal State Statistics Service (FSS). 2018. Федеральная служба государственной статистики Введите
свой запрос. Retrieved from: http://www.gks.ru/wps/wcm/connect/rosstat_main/rosstat/ru/statistics/population/demography/
Flanders Investment and Trade Market Survey. 2017. Fishery Sector Overview 2017: Russian and North-West Region. Saint Petersburg, Russia.
ICES. 2002b. ICES Cooperative Research Report no. 255. Report of the ICES Advisory Committee on Fishery Management, 2002. Copenhagen, Denmark.
ICES. 2002a. Section 9 - AFWG Report, Shrimp (Pandalus borealis) (subareas I and II). ACFM WGREPS AFWG Reports. Available at: ices.dk/sites/pub/Publication%20Reports/Expert%20Group%20Report/acfm/2002/afwg/Shrimp%20(Pandalus%20Borealis)%20(Subareas%20I%20and%20II).pdf
ICES. 2006. Report of the NAFO/ICES Pandalus Assessment Group, 25 October-2 November 2006. NAFO SCS Doc. 06/27. Serial No. N5336. ICES CM 206/ACFM:37. 64 p.
ICES. 2018a. Report of the Arctic Fisheries Working Group (AFWG), 18-24 April 2018, Ispra, Italy. ICES CM 2018/ACOM: 06. 859 p.

2020 Fisheries Centre Research Reports 28(5)
320
ICES. 2018b. Report of the Working Group on North Atlantic Salmon (WGNAS), 4–13 April 2018, Woods Hole, MA, USA. ICES CM 2018/ACOM:21. 386 p.
ICES. 2018c. ICES Report of the Working Group on Widely Distributed Stocks (WGWIDE), 28 August- 3 September 2018, Torshavn, Faroe Islands. ICES CM 2018/ACOM: 23. 488 p.
Javanović, B., E. Divovich, S. Harper, D. Zeller and D. Pauly 2016. Russia (Barents Sea), p. 375. In: D. Pauly and D. Zeller (eds). Global Atlas of Marine Fisheries: A critical appraisal of catches and ecosystem impacts. Island Press, Washington D.C.
Jovanović, B., E. Divovich, S. Harper, D. Zeller and D. Pauly. 2015. Estimates of total Russian fisheries catches in the Barents Sea region (FAO 27 subarea I) between 1950 and 2010. Fisheries Centre Working Paper #2015-59, 16 p.
Makarov, D.V., E.A. Borovichev, E.M. Klyuchnikova and V.A. Masloboev. 2020. Environmental protection and sustainable development of the mining industry in Murmansk Region, Russia. Vestnik of MSTU, 23(1): 63-71.
Marine Conservation Institute. 2020. MPAtlas [Online]. Seattle, WA. Available at: www.mpatlas.org NOAA. 2018. The International Sampling Program: Continent of Origin and Biological Characteristics of
Atlantic Salmon Collected in West Greenland in 2016. Northeast Fisheries Science Center Reference Document 18-15.
Noël, S.-L. 2020. Semi-automation procedure for catch reconstruction forward carry, p. 15-20. In: B. Derrick, M. Khalfallah, V. Relano, D. Zeller and D. Pauly (eds). Updating to 2018 the 1950-2010 Marine Catch Reconstructions of the Sea Around Us: Part I – Africa, Antarctica, Europe and the North Atlantic. Fisheries Centre Research Report 28(5).
Popov, S. and D. Zeller. 2018. Reconstructed Russian Fisheries Catches in the Barents Sea: 1950-2014. Frontiers in Marine Science, 5(266): 1-14.
Popov, S. and D. Zeller. 2019. Corrigendum: Reconstructed Russian Fisheries Catches in the Barents Sea: 1950-2014. Frontiers in Marine Science, 6(33): 1-2.
von Quillfeldt, C., E. Olsen, A. Dommasnes and D. Vongraven. 2009. Integrated ecosystem-based management of the Barents Sea–Lofoten area. Meeting Document for the Expert Workshop to Develop Options for Modifying the Description of Ecologically or Biologically Significant Marine Areas (EBSAs), for describing new areas, and for strengthening the scientific credibility and transparency of this process. Convention on Biological Diversity. 5-8 December 2017, Berlin, Germany.
Rodoman, B. V. 1974. Landscape polarization as a means of preserving the biosphere and recreational resources, p. 150-162. In: coll. articles. Resources, Environment, Resettlement. Moscow, Russia.
Rejwan, C., S. Boot and D. Zeller. 2001. Unreported catches in the Barents Sea and adjacent waters for periods from 1950 to 1998. p. 99-106. In: D. Zeller, R. Watson and D. Pauly (eds). Fisheries Impacts on North Atlantic Ecosystems: Catch, Effort and National/Regional Data Sets. Fisheries Centre Research Reports 9(3).
USDA Foreign Agricultural Services. 2015. Russian Federation Fish and Seafood Production and Trade Update. GAIN Report No. RS1527. Available at: gain.fas.usda.gov/Recent%20GAIN%20Publications/Fish%20and%20Seafood%20Production%20and%20Trade%20Update_Moscow_Russian%20Federation_4-29-2015.pdf.
Vylegzhanin, A.N., O.R. Young and P.A. Berkman. 2018. Governing the Barents Sea region: current status, emerging issues, and future options. Ocean Development & International Law, 49(1): 52-78.
World Fishing and Aquaculture. 2018. Russia Seeks to Boost Domestic Aquaculture. Available at: www.worldfishing.net/news101/fish-farming/russia-seeks-to-boost-domestic-aquaculture.
Spain (Northwest) Guillen, J., S. Holmes, N. Carvalho, J. Casey, H. Dörner, M. Gibin, A. Mannini, P. Vasilakopoulos, A. Zanzi.
2018. A review of the European Union landing obligation focusing on its implications for fisheries and the environment. Sustainability, 10(4): 900.
Macho, G., I. Naya, J. Freire, S. Villasante and J. Molares. 2013. The key role of the barefoot fisheries advisors in the co-managed TURF system of Galicia (NW Spain). Ambio, 42:1057–1069. doi.org/10.1007/s13280-013-0460-0
Marine Conservation Institute. 2020. MPAtlas [Online]. Seattle, WA. Available at: www.mpatlas.org Noël, S.-L. 2020. Semi-automation procedure for catch reconstruction forward carry, p. 15-20. In: B. Derrick,
M. Khalfallah, V. Relano, D. Zeller and D. Pauly (eds). Updating to 2018 the 1950-2010 Marine Catch Reconstructions of the Sea Around Us: Part I – Africa, Antarctica, Europe and the North Atlantic. Fisheries Centre Research Report 28(5).

Updating to 2018 the 1950-2010 marine catch reconstructions of the Sea Around Us: Part I – Africa, Antarctica, Europe and the North Atlantic
321
Otero, M. 2015. Fishing governance in MPAS: potentialities for blue economy (FISHMPABLUE Project). WP2 Technical component - Act. 1.4 Country Policy survey: Spain. International Union for Conservation of Nature (IUCN). 24 p.
Pascual-Fernández, J.J., D. Florido-del-Corral, R. De la Cruz-Modino and S. Villasante, S., 2020. Small-Scale Fisheries in Spain: Diversity and Challenges, p. 253-281. In: J.J. Pascual-Fernández, C. Pita, M. Bavinck (eds). Small-Scale Fisheries in Europe: Status, Resilience and Governance. Springer, Cham.
Uhlmann, S.S., C. Ulrich and S.J. Kennelly (eds). 2019. The European Landing Obligation: Reducing Discards in Complex, Multi-Species and Multi-Jurisdictional Fisheries. Springer, Cham, Switzerland.
Villasante, S., G. Macho, J. Giráldez, S.R. Rodriguez, J.I. de Rivero, E. Divovich, S. Harper, D. Zeller and D. Pauly. 2015. Estimates of total marine fisheries removals from the Northwest of Spain, 1950-2010. Fisheries Centre Working Paper #2015-51, 21 p.
Villasante, S., G. Macho, J. Giráldez, S.R. Rodriguez, J.I. de Rivero, E. Divovich, S. Harper, D. Zeller and D. Pauly. 2016. Spain (Northwest), p. 397. In: D. Pauly and D. Zeller (eds). Global Atlas of Marine Fisheries: A critical appraisal of catches and ecosystem impacts. Island Press, Washington D.C.
Sweden (West Coast) ICES. 2015. Report of the Working Group on the Assessment of Demersal Stocks in the North Sea and
Skagerrak (WGNSSK). 28 April – 7 May 2015, ICES HQ, Copenhagen, Denmark. ICES CM 2015/ACOM:13. 1229 p.
ICES. 2016. Report of the Working Group on Widely Distributed Stocks (WGWIDE). 31 August – 6 September 2016, ICES HQ, Copenhagen, Denmark. ICES CM 2016/ACOM:16. 500 p.
Marine Conservation Institute. 2020. MPAtlas [Online]. Seattle, WA. Available at: www.mpatlas.org Noël, S.-L. 2020. Semi-automation procedure for catch reconstruction forward carry, p. 15-20. In: B. Derrick,
M. Khalfallah, V. Relano, D. Zeller and D. Pauly (eds). Updating to 2018 the 1950-2010 Marine Catch Reconstructions of the Sea Around Us: Part I – Africa, Antarctica, Europe and the North Atlantic. Fisheries Centre Research Report 28(5).
Pantzar, M. 2020. Balancing rural development and robust nature conservation–lessons learnt from Kosterhavet Marine National Park, Sweden, p. 299-328. In: J. Humphreys and R.W.E. Clark (eds). Marine Protected Areas. Elsevier.
Persson, L. 2015. Reconstructing total Swedish catches on the west coast of Sweden: 1950-2010. Fisheries Centre Working Paper #2015-24, 10 p.
Persson, L. 2016. Sweden (West Coast), p. 405. In: D. Pauly and D. Zeller (eds). Global Atlas of Marine Fisheries: A critical appraisal of catches and ecosystem impacts. Island Press, Washington D.C.
SEPA. 2009. Management Plan for Kosterhavet National Park. Swedish Environmental Protection Agency (SEPA), Stockholm, Sweden.