Embed Size (px)
Citation preview
JointResearchCentre
1JointResearchCentre
The European Commission’sscience and knowledge service
Joint Research Centre
Fisheries, Aquaculture & Algae Biomass Assessment
BIOMASS Workshop @EUBCE 2017
Jordi Guillen, Gianluca Fiore & Rita AraujoFisheries & Aquaculture Sector
Water and Marine Resources Unit
2
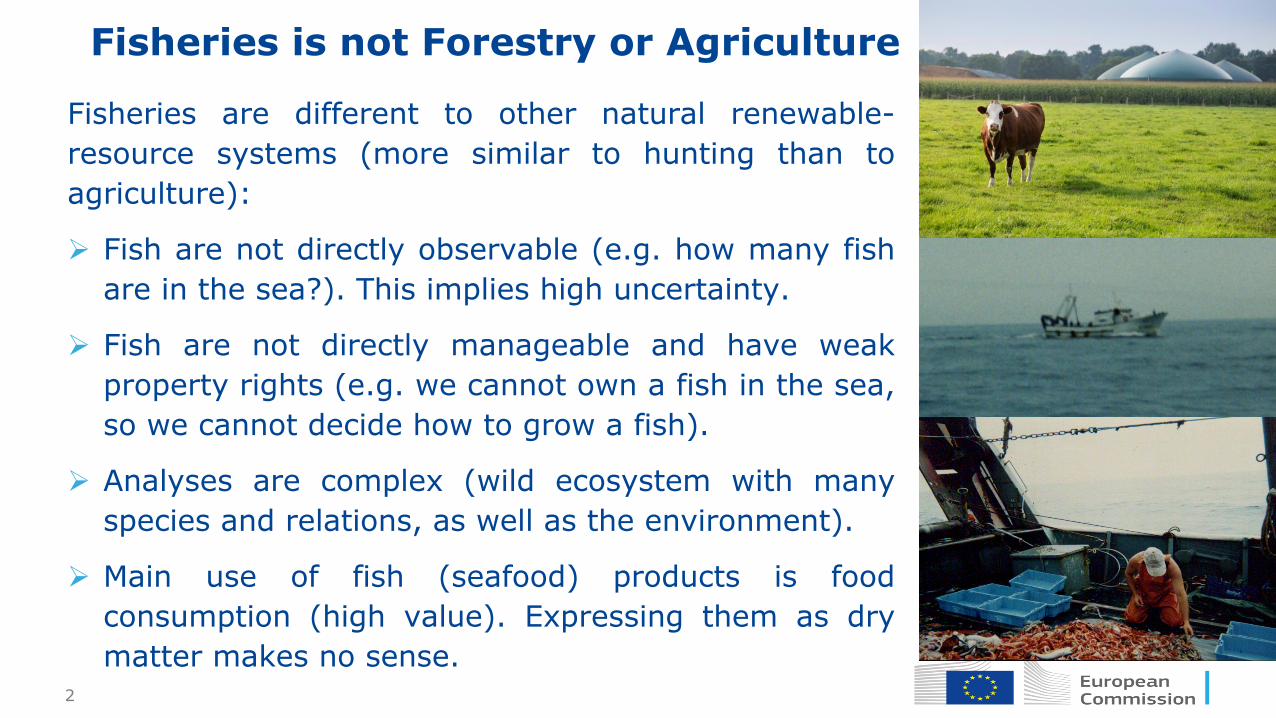
Fisheries is not Forestry or Agriculture
Fisheries are different to other natural renewable-resource systems (more similar to hunting than toagriculture):
Ø Fish are not directly observable (e.g. how many fishare in the sea?). This implies high uncertainty.
Ø Fish are not directly manageable and have weakproperty rights (e.g. we cannot own a fish in the sea,so we cannot decide how to grow a fish).
Ø Analyses are complex (wild ecosystem with manyspecies and relations, as well as the environment).
Ø Main use of fish (seafood) products is foodconsumption (high value). Expressing them as drymatter makes no sense.
Fisheries and aquaculture: where we areFisheries
Ø Data collected and analysis ran using in-house modelling.
Ø Methods developed and tested, and gaps identified (referencepoints for stock without assessment, linking stocks to fishing fleetcomponents).
Aquaculture
Ø Production analysis based on official statistics; economicparameters based on STECF report.
Distribution (supply chain)
Ø Developed and input/output model to explore distribution,processing and usage of fishery products along the supply chain tosee the interactions between sectors and countries.
4
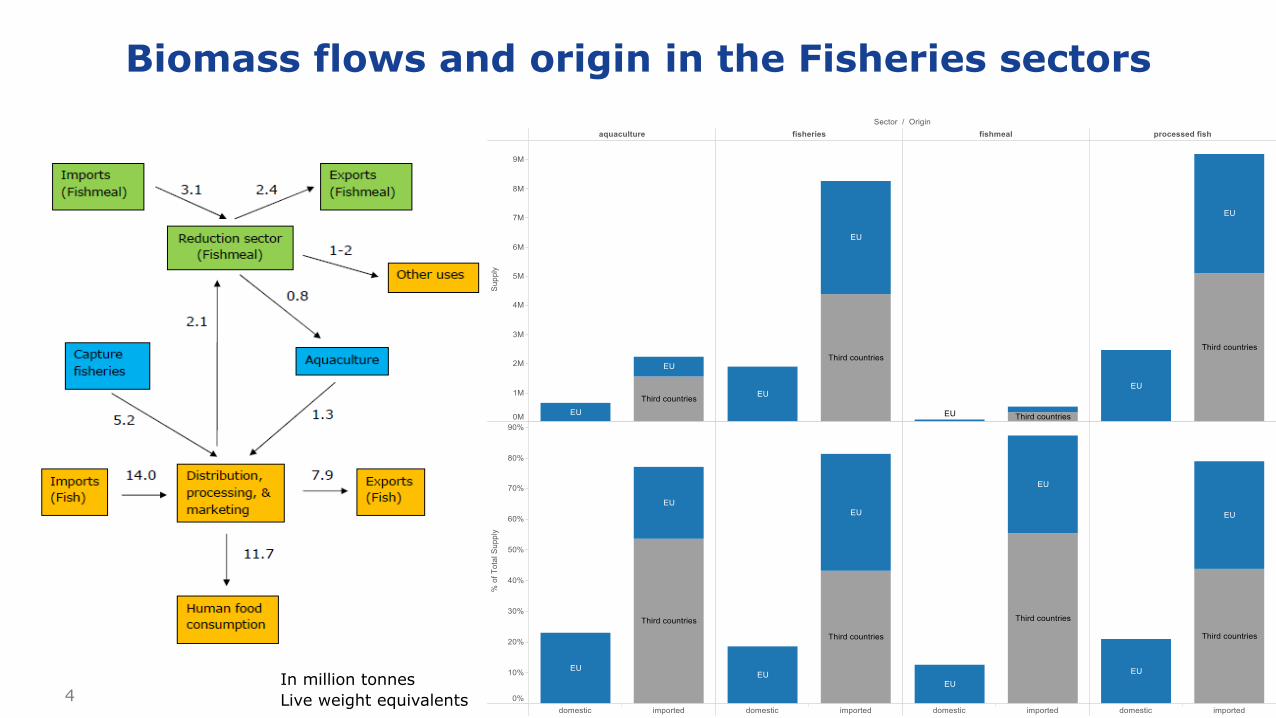
Biomass flows and origin in the Fisheries sectors
In million tonnesLive weight equivalents
5
F & A Main Highlights: Production
Ø EU Fisheries production has been stable/decreasing.
Ø Significant increases in production biomass from wild-capturefisheries in the short term are not expected since most stocks arefully or overexploited.
Ø Aquaculture is the fastest-growing animal food producing sector inthe world, but EU aquaculture production is not increasing.
Ø European Commission (2013) identified four strategic priorities forthe EU aquaculture sector. EU countries estimated that EUaquaculture production could increase 25% by 2020.
Ø Proportion of seafood products traded internationally is high andincreasing. Seafood consumption in EU countries: 21% originatesnationally, 35% in other EU countries and 44% from Third countries.
6
F & A Main Highlights: Distribution
Ø Over the past 50 years, global consumption of seafood percapita has more than doubled. Seafood consumption per capita indeveloping regions has increased even faster.
Ø According to UN, today’s world population of more than 7 billionwill rise to about 9 billion by 2030 and to 10 billion by 2050.
Ø Seafood protein represents an essential nutritional component insome densely populated countries, especially where total proteinintake levels are low.
Ø Demand from emerging economies is increasing and may affectglobal trade.
Ø Aquaculture is a net producer of food and biomass. Butproduction increases from aquaculture may have limits.
F & A Planning for 2017 and onwards
Ø Assessment of current biomass supply and potential:Fisheries stock assessment are essential to any biomass estimatebut often impeded by relevant data gaps. We collaborate withinternational partners by developing, validating and applying newdata poor assessment approaches.
Ø Better understand the origin of supply to the EU and if thesource is in good exploitation status, we will further disaggregatethe non-EU area.
Ø Supply chains: Disaggregation of the intra EU trade at MemberState level and further refinements if needed.
Ø Economic analysis of EU fisheries and aquaculture sectors.
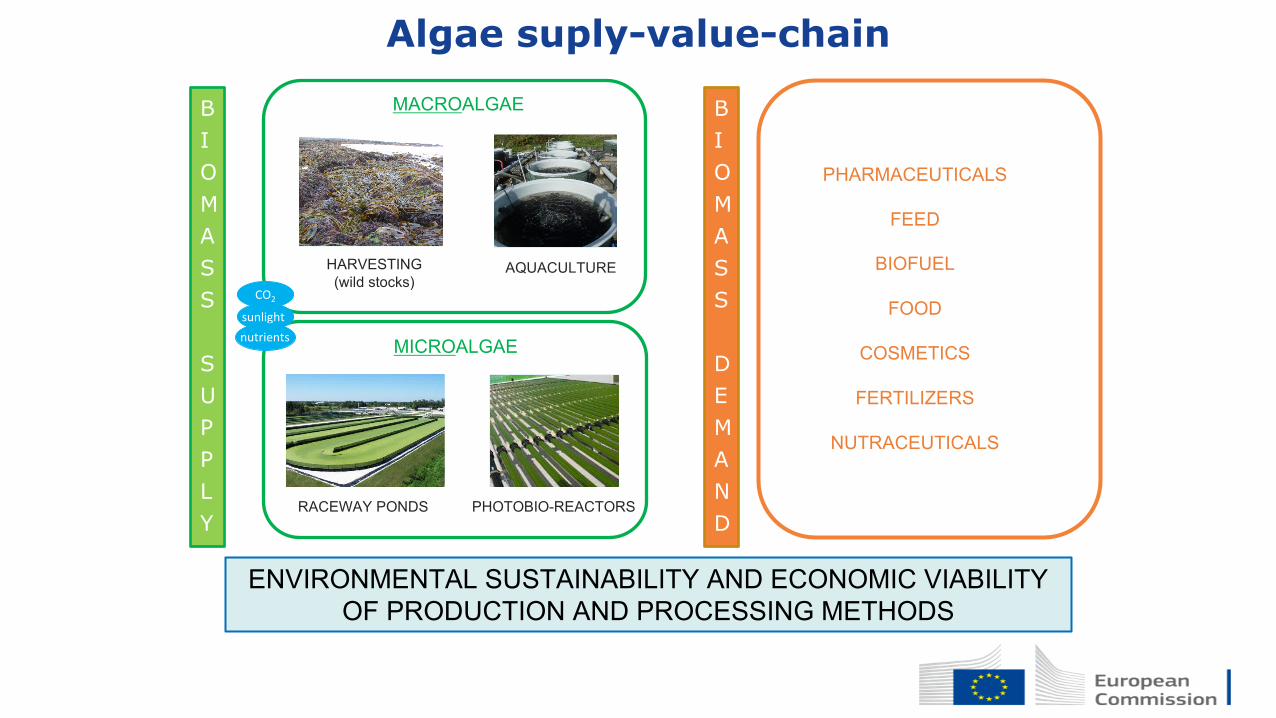
ENVIRONMENTAL SUSTAINABILITY AND ECONOMIC VIABILITY OF PRODUCTION AND PROCESSING METHODS
HARVESTING(wild stocks)
MACROALGAE
AQUACULTURE
RACEWAY PONDS
MICROALGAE
PHOTOBIO-REACTORS
CO2
sunlightnutrients
BIOMASS
SUPPLY
BIOMASSDEMAND
PHARMACEUTICALS
FEED
BIOFUEL
FOOD
COSMETICS
FERTILIZERS
NUTRACEUTICALS
BIOMASS
DEMAND
Algae suply-value-chain
PRODUCTION and SUPPLY CHAIN
Algae biomass: where we are
Ø Available data collected and main knowledge gaps identified
Ø Development of alternative approaches to fill knowledge gaps
Ø Deficient data obtained from official statistics regarding data reporting for
country, year and species resolution
Ø Production and trade volume organized by country and aggregated at the EU and global level
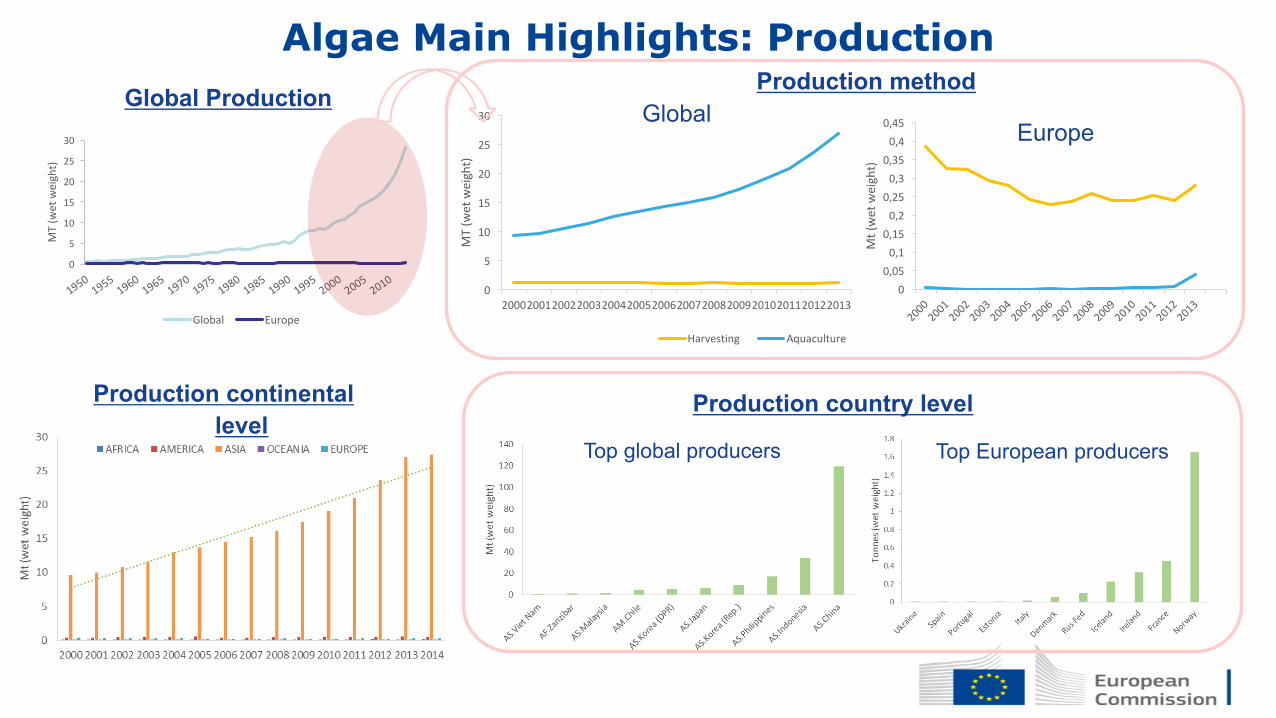
Algae Main Highlights: Production
Europe
0
5
10
15
20
25
30
MT(w
etweight)
Global Europe
00,050,10,150,20,250,30,350,40,45
Mt(wetweight)
Production method
0
5
10
15
20
25
30
20002001200220032004200520062007200820092010201120122013
MT(w
etweight)
Harvesting Aquaculture
Global
Production continental level
Top global producers Top European producers
Production country level
Global Production
0
1
2
3
4
5
6
7
1984 1987 1990 1993 1996 1999 2002 2005 2008 2011
US$b
ilion
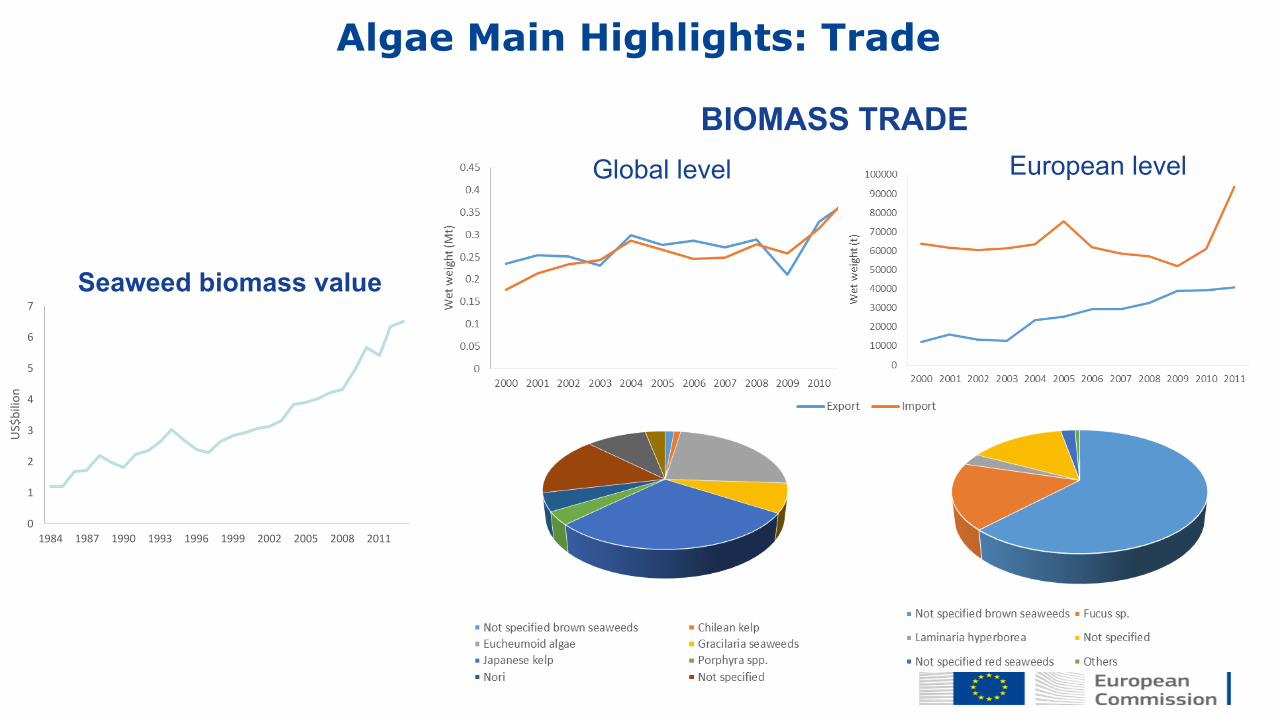
Seaweed biomass value
Algae Main Highlights: Trade
BIOMASS TRADEGlobal level European level
Thank you very much!
JRCScienceHub:ec.europa.eu/jrc
Twitter:@EU_ScienceHub
Facebook:EUScienceHub– JointResearchCentre
LinkedIn:JointResearchCentre(JRC)- EuropeanCommission'sScienceService
YouTube:JRCAudiovisuals
Vimeo:Science@EC
Fisheries & Aquaculture: Jordi Guillen ([email protected])
Fisheries & Aquaculture: Gianluca Fiore ([email protected])
Algae: Rita Araujo ([email protected])