Embed Size (px)
Citation preview
C H A P T E R 1 4
FISH POPULATION ESTIMATES:STREAMS
There are many methods to assess fishpopulations in streams, including
electrofishing, pool seining, counting fish passingthrough barriers and fences placed across streams,and counting redds and spawning fishimmediately after spawning has occurred.Electrofishing is a common method of assessingjuvenile salmonid and smallmouth basspopulations in New Brunswick, while poolseining, barrier/fence counts and redd/spawnercounts are methods generally employed to assessadult salmonid stocks.
ELECTROFISHING
Electrofishing is a method which utilizes electriccurrent to stun fish so they may be handled forenumeration and measurement. The totalpopulation is projected from the number of fishcollected and the capture efficiency. Permanentelectrofishing sites are established on streams tocompare year to year fish densities. One time“spot checks” are also undertaken to assessspecies presence and relative abundance.
Permanent electrofishing sites are especiallyuseful in providing time-series data for juvenilesalmonid abundance. Site location and descriptionare particularly important to ensure the samehabitat type and area is re-sampled in subsequentyears. In general, new permanent electrofishingstations should represent a single habitat type, i.e.riffle, run, pool or rapid unless the stream is verysmall (< 3 m wide).
Fish populations in streams are estimated withelectrofishing using one of three indirect methods:
< Zippin’s Total Removal Estimate - This isa multiple sweep method with 3 or moresweeps. It is based on the principle that adecrease in catch per effort (c/e) as thepopulation is depleted bears a directrelationship to the extent of the population.Population size is derived by plotting aregression line of c/e on the cumulative catch.The linear regression technique to calculatepopulation size first determines probability ofcapture (P):
-(K3Tx -3T3x)= -------------------- K3x2 - (3x)2
and then the population estimate (N):
3T + P3x= ------------ KP
where: K = number of sweeps completedT = number of fish caught per sweepx = cumulative number of fish
removed in previous sweep(s)
< Catch per Unit Effort (CPUE) : One SweepMethod - This method can only be used toobtain a population estimate where severalZippin or Petersen total abundance estimateshave been previously calculated. If arelationship between the first sweep catch andthe Zippin or Petersen total population
Fish Population Estimates: Streams 14-2
estimate can be established, i.e. the firstsweep catch per unit effort relates to totalabundance, the CPUE method can be used asa rapid assessment technique. The CPUEmethod usually employs a 180 to 300 secondeffort on the first and only sweep whereasZippin or Petersen methods often requireseveral hours to a few days to complete.Population estimates are calculated from theone sweep count and the predeterminedrelationship. The CPUE data form is thesame as the Zippin form.
< Petersen Mark and Recapture Estimate - Asample of fish is collected, marked andreleased. At a later time, usually within a fewdays, a second recapture sample is obtained.The Petersen population estimator is:
MC N = ------
R
where:
N = population sizeM = number of marked fish releasedC = recapture sample size (marked and unmarked fish)R = number of marked fish recaptured
or if the number of marked recaptures (R) issmall, Chapman’s (1951) modified Petersenformula may be used:
(M+1)(C+1) N = -----------------
(R+1)
Once juvenile salmonid densities for a site havebeen estimated, the Percent Habitat Saturation(PHS) index may be calculated for each species’age class (Grant and Kramer 1990). This indexdetermines the amount of use of the site byjuveniles and can be used to predict theprobability that the fish are exhibiting density-dependent behaviour.
Percent Habitat Saturation indices are calculatedfor each age class separately, then combined todetermine the total PHS for the site.
PHS = 100 x D x T x 1.19
where:
D = Density/m2
T = Territory Size (log10 T = 2.61 log10
Average Fork Length(cm) - 2.83)1.19 = Correction Factor
FISH TRAP COUNTS
Various fish trapping facilities are operated byFisheries and Oceans Canada, the New
Brunswick Department of Natural Resources andEnergy, the University of New Brunswick, J.D.Irving Limited, and in the past, Bowater Pulp andPaper Canada Inc. Their purpose is to assessbrook trout and Atlantic salmon populations. Thefacilities include trap nets which sample a portionof the total population, and counting fences, fishlifts and barrier traps which count all fish.Counting fences simply count fish as they migrateup or down stream. Containment barriers, on theother hand, trap upstream migrating fish andretain them in a large holding pool until spawningseason when the fish are released.
All trapping facilities are checked daily for fishcounts; water levels and temperatures are alsorecorded. In addition, tagged fish are identified;fin clipped fish may or may not be identified. Insome instances, observations may be made onindividual fish, such as length and sex.
The various trapping facilities have uniquecharacteristics and as such, collect different typesof information. For instance,
< the Catamaran Brook fence operated by theUniversity of New Brunswick and Fisheriesand Oceans Canada assesses the upstream anddownstream movements of salmonids andother species,
Fish Population Estimates: Streams 14-3
< Fisheries and Oceans’ estuarial sites monitorfish species larger than 15 cm movingupstream, including two age classes ofAtlantic salmon (grilse and multi-sea-wintersalmon), and
< Natural Resources and Energy sites recordupstream movement only of adult brook troutand three adult age classes of Atlantic salmon(grilse, small multi-sea-winter and largemulti-sea-winter salmon).
The New Brunswick Department of NaturalResources and Energy has developed a computerapplication for entering barrier count data andgenerating summary reports.
All trapping facility sites have been incorporatedwithin GIS.
POOL SEINING
Pool seining is undertaken on several rivers inthe fall of each year to count adult Atlantic
salmon and/or collect them for broodstock.Within the Miramichi basin, this activity is nowdirected by Miramichi Fisheries Ltd. with variousprivate industries or user groups which undertakesatellite rearing and stocking of hatchery-raisedjuvenile salmonids.
A variety of information of various Atlanticsalmon stocks is gained by seining pools,including ratios of male to female salmon, grilseto multi-seawinter salmon, and wild to hatchery-raised salmon, the latter indicated by clippedadipose fins. Any salmon with tags, obtained atDFO trap nets in the estuary, are noted and thedata is cross-referenced with data obtained duringthe tagging process.
A sample of individual fish may be collected atthis time for broodstock, usually multi-seawintersalmon unless not available (male fish are mostlygrilse). These fish are transported to the SoutheskHatchery and spawned. The progeny are raiseduntil the following spring when they are stockedout to stock-specific satellite rearing tank sites
around the province. Please refer to Chapter 21Management Activities: Fish Stockings formore details on the satellite rearing program.
REDD/SPAWNER COUNTS
Counts of Atlantic salmon redds and spawningfish are undertaken just after spawning in the
fall of the year on many New Brunswick streams.Actual dates will vary for individual streams, butspawning is usually mid to late October until earlyNovember. By surveying the same stretch of astream each year, called an “index” stretch, annualcomparisons may be made to observe temporaland spatial trends in salmon distribution.
Redds and spawning salmon are countedsimultaneously as the surveyor travels down astretch of stream on foot or by canoe. Redds areobvious depressions or pits in the streambed withclean gravel and small rubble on top and are themore reliable count since they don’t move.Spawning fish may be missed or may have left thestream between spawning and the survey. Countsof spawning fish may be referenced to a particularsite or within a more general stretch of a stream.
DATA SOURCES
The electrofishing results data set includes datafrom Fisheries and Oceans Canada, the New
Brunswick Department of Natural Resources andEnergy, J.D. Irving, Limited, Bowater Pulp &Paper Canada Inc. and various conservationorganizations. Pool seining data was obtainedfrom Bowater Pulp and Paper Canada Inc.Redd/spawner counts are available from theDepartment of Natural Resources and Energy,Bowater Pulp and Paper Canada Inc., and J. D.Irving, Limited.
The fish migration counts data set includes datafrom Fisheries and Oceans Canada, the NewBrunswick Department of Natural Resources andEnergy, J.D. Irving Limited, and Bowater Pulpand Paper Canada Inc. Fisheries and Oceans data
Fish Population Estimates: Streams 14-4
records all fresh and salt water species, but onlybrook trout and Atlantic salmon data has beenincorporated within the Data Warehouse.
POSITIONAL ACCURACY
The positional accuracy of the streampopulation assessment sites is based on
textual descriptions of locations and known roadaccess points. The positional accuracy of thehydrographic spatial data is ±1.5m to ±2.5m.Please refer to SNB’s Land and WaterStandards Manual for further details.
DATA FILES
Tabular DataThere are ten data tables within fish populationestimates for streams. Four tables are associatedwith electrofishing; one maintains generalinformation on electrofishing sites, the secondtable contains details of an electrofishing session,the third contains data obtained during a session,and the fourth contains population estimatesderived from the data. Three data tables arerelated to fish migration counts; one maintains thegeneral information on the fish counting facilities,the second table contains the daily fish countsentering the facility, and the third contains variousmeasurements on individual fish passing throughthe facility. There are two data tables related topool seining; the first maintains generalinformation on the seining sites, and the secondtable contains numbers of fish caught at each site.Two data tables are associated with redd andspawner surveys; the first contains numbers ofredds and spawners counted over stretches ofstream, and the second table contains numbers offish counted at specific sites within streams sincethey usually occur in groups in pools. Numbers ofredds and spawning fish are usually obtainedduring the same survey.
Ç Electrofishing Sites - Maintains generalinformation on each site, including thelocational data for referencing within GIS.
Ç Electrofishing Sessions - Containsinformation specific to each survey session,including water and air temperatures and sitedimensions.
Ç Electrofishing Sweep Data - Containsnumbers of fish captured per sweep and meanfork lengths by species and age class.
Ç Electrofishing Population Estimates -Contains estimates of population density andpercent habitat saturation.
Ç Fish Trapping Sites - Maintains generalinformation on each site, including the yearsof operation.
Ç Fish Migration Counts - Contains dailycounts of each fish species (brook trout andAtlantic salmon) and age class of fish enteringthe fence or trap. Some fences are able tomonitor fish moving up and down.
Ç Fish Migration Totals - Contains annualsummary of each fish species (brook trout andAtlantic salmon) and age class of fish enteringthe fence or trap.
Ç Individual Fish Observations - Containsdata on individual fish passing through thecounting facility such as species, age, sex, andlength.
Ç Pool Seining Sites - Maintains generalinformation on each site, including thelocational data for referencing within GIS.
Ç Pool Seining - Contains dates of seining andcounts of fish caught.
Ç Redd and Spawner Counts by StreamReach - Contains data from redd and spawnercount surveys, as well as measurements ofindividual stretches along the stream routesand locational data for referencing withinGIS.
Ç Spawner Counts by Site - Contains datafrom spawner count surveys for a specific site
Fish Population Estimates: Streams 14-5
as well as locational data for referencingwithin GIS.
Spatial DataArcView shape files were created forelectrofishing sites, fish counting facility sites,and pool seining sites. Point coverages are usedrather than dynamic segmentation forelectrofishing sites due to the large number ofFisheries and Oceans sites which are provided ascoordinates, and for counting facilities asFisheries and Oceans sites are located within theestuary where there are no stream routes.
Redd and spawner count survey stretches aremapped through Route System files and dynamicsegmentation.
References:
Chapman, D. G. 1951. Some properties of thehypergeometric distr ibution withapplications to zoological censuses. Univ.California Publ. Stat., 1(7): 131-160.
Grant, J. and D. L. Kramer. 1990. Territory sizeas a prediction of the upper limit topopulation density of juvenile salmonids instreams. Can. J. Fish. Aquat. Sci. 47: 1724-1737.
Petersen, C. G. J. 1896. The yearly immigrationof young plaice into the Limfyord from theGerman Sea. Rept. Danish Biol. Sta., 6: 5-48.
Zippin, C. 1958. The removal method ofpopulation estimation. J. Wildl. Manage.22(1): 82-90.
Fish Population Estimates: Streams 14-6
TABULARDATAFILES
Fish Population Estimates: Streams 14-7
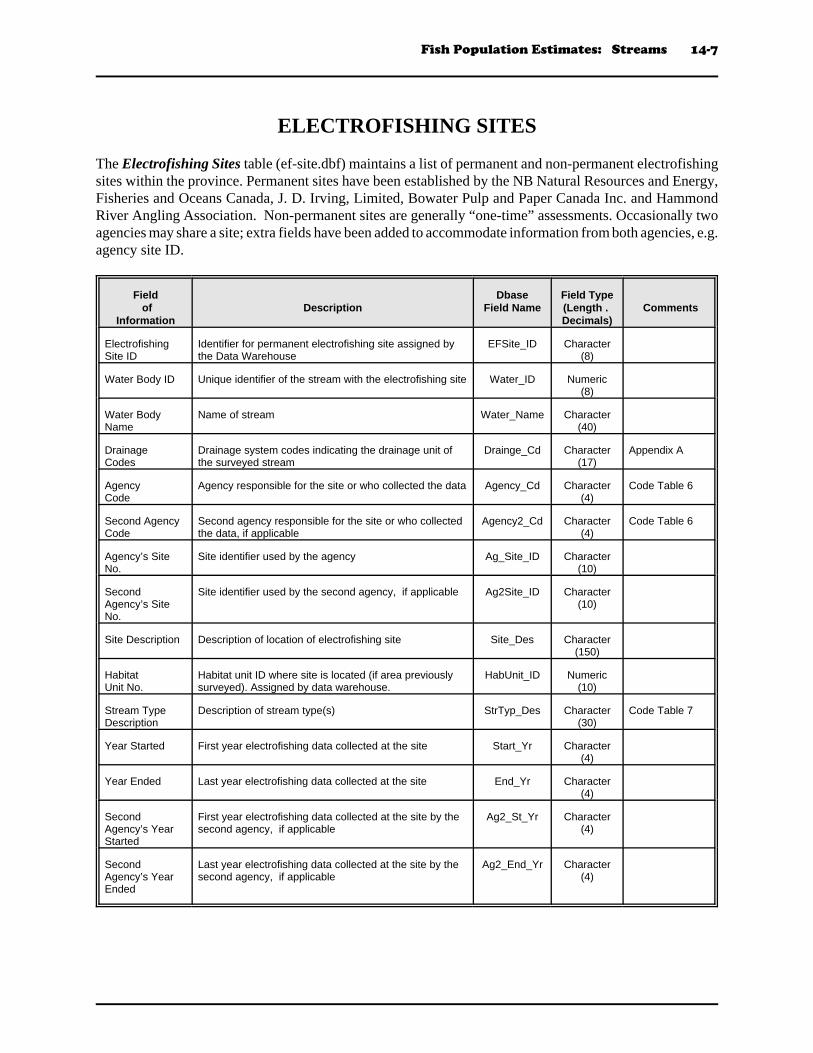
ELECTROFISHING SITES
The Electrofishing Sites table (ef-site.dbf) maintains a list of permanent and non-permanent electrofishingsites within the province. Permanent sites have been established by the NB Natural Resources and Energy,Fisheries and Oceans Canada, J. D. Irving, Limited, Bowater Pulp and Paper Canada Inc. and HammondRiver Angling Association. Non-permanent sites are generally “one-time” assessments. Occasionally twoagencies may share a site; extra fields have been added to accommodate information from both agencies, e.g.agency site ID.
Field of
InformationDescription
DbaseField Name
Field Type(Length . Decimals)
Comments
ElectrofishingSite ID
Identifier for permanent electrofishing site assigned bythe Data Warehouse
EFSite_ID Character(8)
Water Body ID Unique identifier of the stream with the electrofishing site Water_ID Numeric(8)
Water BodyName
Name of stream Water_Name Character(40)
DrainageCodes
Drainage system codes indicating the drainage unit ofthe surveyed stream
Drainge_Cd Character(17)
Appendix A
Agency Code
Agency responsible for the site or who collected the data Agency_Cd Character(4)
Code Table 6
Second Agency Code
Second agency responsible for the site or who collectedthe data, if applicable
Agency2_Cd Character(4)
Code Table 6
Agency’s SiteNo.
Site identifier used by the agency Ag_Site_ID Character(10)
SecondAgency’s SiteNo.
Site identifier used by the second agency, if applicable Ag2Site_ID Character(10)
Site Description Description of location of electrofishing site Site_Des Character(150)
HabitatUnit No.
Habitat unit ID where site is located (if area previouslysurveyed). Assigned by data warehouse.
HabUnit_ID Numeric(10)
Stream TypeDescription
Description of stream type(s) StrTyp_Des Character(30)
Code Table 7
Year Started First year electrofishing data collected at the site Start_Yr Character(4)
Year Ended Last year electrofishing data collected at the site End_Yr Character(4)
SecondAgency’s YearStarted
First year electrofishing data collected at the site by thesecond agency, if applicable
Ag2_St_Yr Character(4)
SecondAgency’s YearEnded
Last year electrofishing data collected at the site by thesecond agency, if applicable
Ag2_End_Yr Character(4)
Fish Population Estimates: Streams 14-8
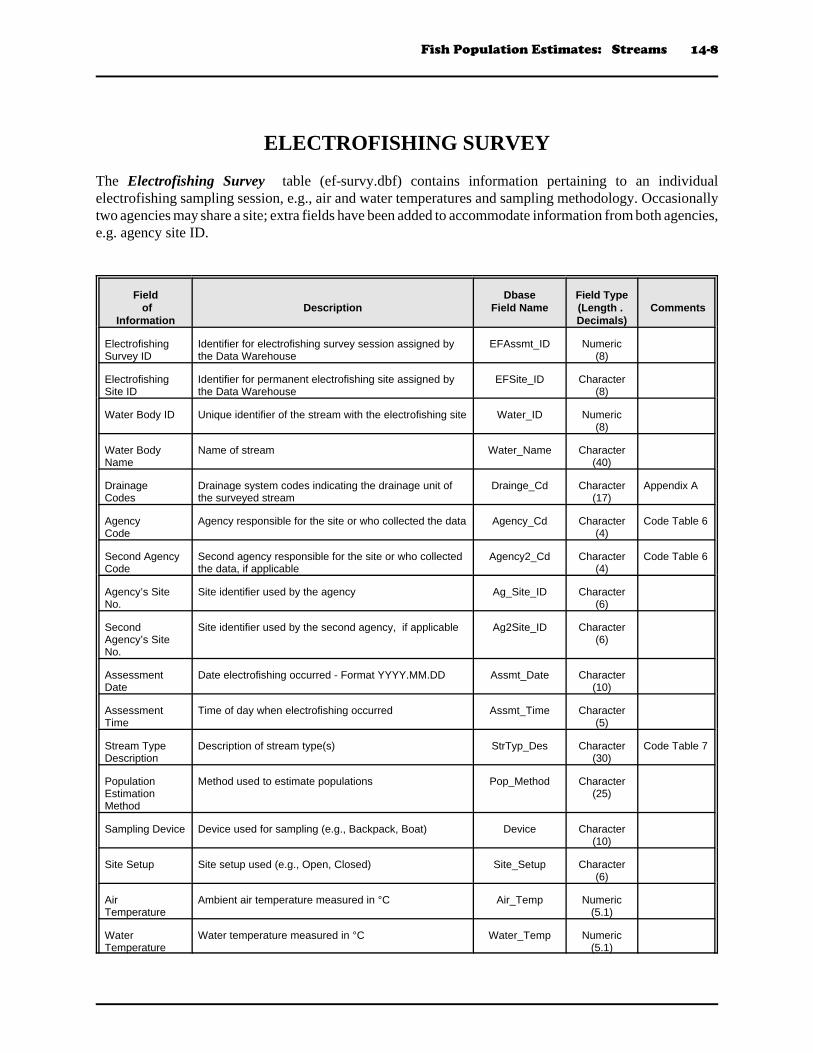
ELECTROFISHING SURVEY
The Electrofishing Survey table (ef-survy.dbf) contains information pertaining to an individualelectrofishing sampling session, e.g., air and water temperatures and sampling methodology. Occasionallytwo agencies may share a site; extra fields have been added to accommodate information from both agencies,e.g. agency site ID.
Field of
InformationDescription
DbaseField Name
Field Type(Length . Decimals)
Comments
ElectrofishingSurvey ID
Identifier for electrofishing survey session assigned bythe Data Warehouse
EFAssmt_ID Numeric(8)
ElectrofishingSite ID
Identifier for permanent electrofishing site assigned bythe Data Warehouse
EFSite_ID Character(8)
Water Body ID Unique identifier of the stream with the electrofishing site Water_ID Numeric(8)
Water BodyName
Name of stream Water_Name Character(40)
DrainageCodes
Drainage system codes indicating the drainage unit ofthe surveyed stream
Drainge_Cd Character(17)
Appendix A
Agency Code
Agency responsible for the site or who collected the data Agency_Cd Character(4)
Code Table 6
Second Agency Code
Second agency responsible for the site or who collectedthe data, if applicable
Agency2_Cd Character(4)
Code Table 6
Agency’s SiteNo.
Site identifier used by the agency Ag_Site_ID Character(6)
SecondAgency’s SiteNo.
Site identifier used by the second agency, if applicable Ag2Site_ID Character(6)
AssessmentDate
Date electrofishing occurred - Format YYYY.MM.DD Assmt_Date Character(10)
AssessmentTime
Time of day when electrofishing occurred Assmt_Time Character(5)
Stream TypeDescription
Description of stream type(s) StrTyp_Des Character(30)
Code Table 7
PopulationEstimationMethod
Method used to estimate populations Pop_Method Character(25)
Sampling Device Device used for sampling (e.g., Backpack, Boat) Device Character(10)
Site Setup Site setup used (e.g., Open, Closed) Site_Setup Character(6)
AirTemperature
Ambient air temperature measured in °C Air_Temp Numeric(5.1)
WaterTemperature
Water temperature measured in °C Water_Temp Numeric(5.1)

Fish Population Estimates: Streams 14-9
Field of
InformationDescription
DbaseField Name
Field Type(Length . Decimals)
Comments
Flow (cms) Flow of water measured in cubic meters per second Water_Flow Numeric(6.4)
AssessmentLength
Length of sample area (m) Assmt_Len Numeric(6.2)
AssessmentArea
Surface area of the stream section being sampled (m2) Assmt_Area Numeric(8.1)
Number ofSweeps
Number of sweeps performed at the site No_Sweeps Numeric(1)
Comments General comments Comments Character(100)

Fish Population Estimates: Streams 14-10
ELECTROFISHING SWEEP DATA
The Electrofishing Sweep Data table (ef-data.dbf) contains data collected during an electrofishing session.Each entry represents one age class of one fish species and records sweep catch numbers and mean forklengths. In some cases, exact dates of electrofishing may not be known; at the very least, year is berecorded. The table accommodates mark and recapture, removal and CPUE methods. Occasionally twoagencies may share a site; extra fields have been added to accommodate information from both agencies, e.g.agency site ID.
Field of
InformationDescription
DbaseField Name
Field Type(Length . Decimals)
Comments
ElectrofishingSweep Data ID
Identifier for electrofishing sweep data (per age classper species) assigned by the Data Warehouse. May ormay not have corresponding record(s) in ElectrofishingPopulations Estimates table.
EfData_ID Numeric(10)
ElectrofishingSurvey ID
Identifier for electrofishing survey session assigned bythe Data Warehouse
EFAssmt_ID Numeric(8)
ElectrofishingSite ID
Identifier for permanent electrofishing site assigned bythe Data Warehouse
EFSite_ID Character(8)
Water Body ID Unique identifier of the stream with the electrofishingsite
Water_ID Numeric(8)
Water BodyName
Name of stream Water_Name Character(40)
DrainageCodes
Drainage system codes indicating the drainage unit ofthe surveyed stream
Drainge_Cd Character(17)
Appendix A
Agency Code
Agency responsible for the site or who collected thedata
Agency_Cd Character(4)
Code Table 6
Second Agency Code
Second agency responsible for the site or who collectedthe data, if applicable
Agency2_Cd Character(4)
Code Table 6
Agency’s SiteNo.
Site identifier used by the agency Ag_Site_ID Character(6)
SecondAgency’s SiteNo.
Site identifier used by the second agency, if applicable Ag2Site_ID Character(6)
AssessmentDate
Date electrofishing occurred - Format YYYY.MM.DD Assmt_Date Character(10)
Stream TypeDescription
Description of stream type(s) StrTyp_Des Character(30)
Code Table 7
PopulationEstimationMethod
Method used to estimate populations Pop_Method Character(25)
AssessmentArea
Area of the stream being sampled (m2) Assmt_Area Numeric(8.1)
Number ofSweeps
Number of sweeps performed at the site No_Sweeps Numeric(1)
Species Code Species code of fish electrofished Species_Cd Character(2)
Code Table17

Fish Population Estimates: Streams 14-11
Field of
InformationDescription
DbaseField Name
Field Type(Length . Decimals)
Comments
Species Name of fish species electrofished Species Character(30)
Age Class Age class of fish electrofished (e.g., 0+, 1+, 2+, Fry,Parr)
Age_Class Character(10)
Average Weight(gm)
Average weight of the captured fish measured in grams Ave_Weight Numeric(8.1)
Mean ForkLength (cm)
Average fork length of captured fish measured incentimeters
Ave_Flen Numeric(6.1)
Mean TotalLength (cm)
Average total length of captured fish measured incentimeters
Ave_Tlen Numeric(6.1)
No. Captured on1st SweepORNo. Captured &Marked on 1st
Sweep
Zippin: No. of fish captured in first sweep of theelectrofishing device
Petersen: No. of fish captured, marked and releasedon the first sweep
No_Sweep1 Numeric(6)
1st sweep time Number of shocking seconds for first sweep Time_Swp1 Numeric(6)
No. Captured on2nd Sweep
Zippin: No. of fish captured in second sweep of theelectrofishing device
Petersen: No.unmarked fish on the second sweep
No_Sweep2 Numeric(6)
2nd sweep time Number of shocking seconds for second sweep Time_Swp2 Numeric(6)
No. Captured on3rd Sweep
Zippin: No. of fish captured in third sweep of theelectrofishing device
Petersen: No. marked fish on the second sweep
No_Sweep3 Numeric(6)
3rd sweep time Number of shocking seconds for third sweep Time_Swp3 Numeric(6)
No. Captured on4th Sweep
Zippin: No. of fish captured in fourth sweep of theelectrofishing device
No_Sweep4 Numeric(6)
4th sweep time Number of shocking seconds for fourth sweep Time_Swp4 Numeric(6)
No. Captured on5th Sweep
Zippin: No. of fish captured in fifth sweep of theelectrofishing device
No_Sweep5 Numeric(6)
5th sweep time Number of shocking seconds for fifth sweep Time_Swp5 Numeric(6)
No. Captured on6th Sweep
Zippin: No. of fish captured in sixth sweep of theelectrofishing device
No_Sweep6 Numeric(6)
6th sweep time Number of shocking seconds for sixth sweep Time_Swp6 Numeric(6)
Total No. FishCaptured AllSweeps
Total number of fish captured in all sweeps Tot_Allswp Numeric(8)
Percent FishClipped
Percentage of fish captured with adipose fin clips(indicating hatchery origin)
Prcnt_Clip Numeric(6.1)
Fish Population Estimates: Streams 14-12
Field of
InformationDescription
DbaseField Name
Field Type(Length . Decimals)
Comments
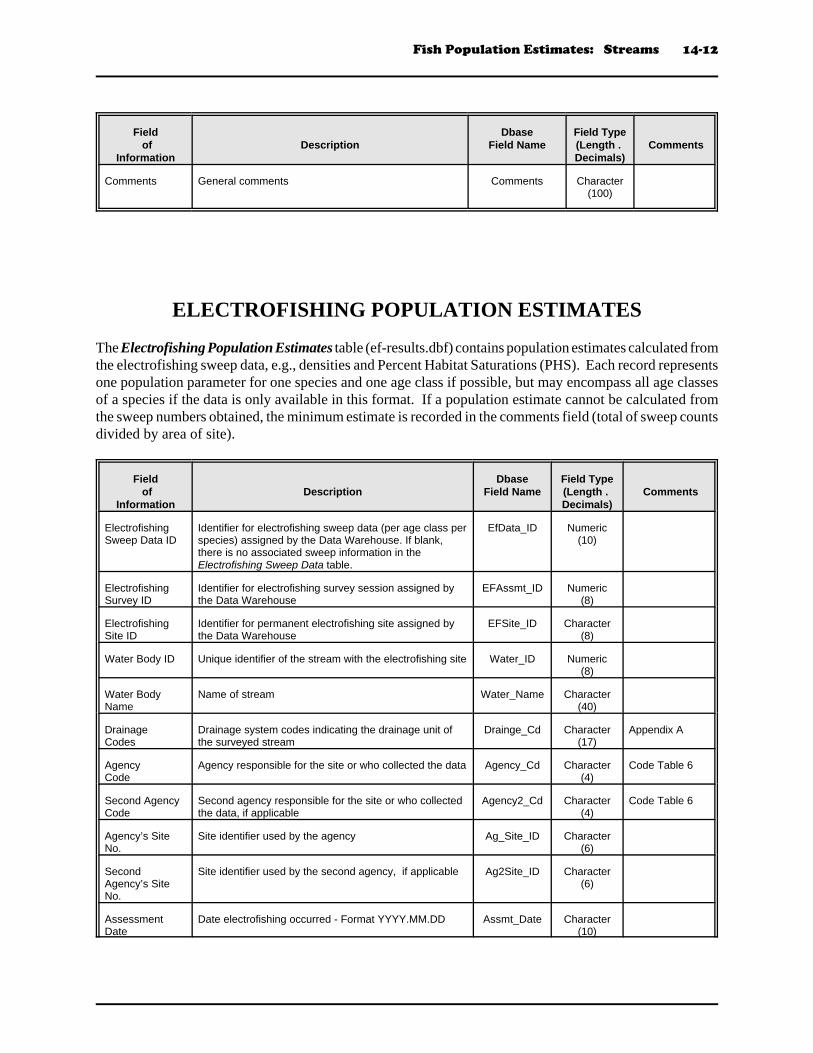
Comments General comments Comments Character(100)
ELECTROFISHING POPULATION ESTIMATES
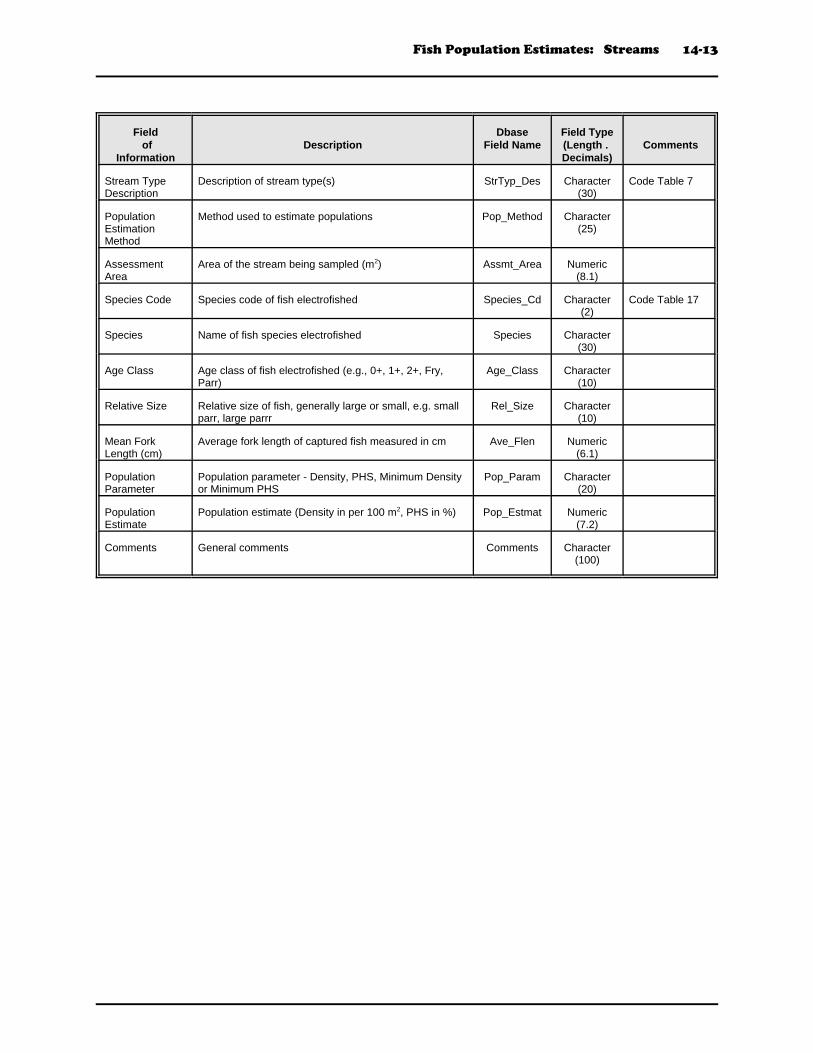
The Electrofishing Population Estimates table (ef-results.dbf) contains population estimates calculated fromthe electrofishing sweep data, e.g., densities and Percent Habitat Saturations (PHS). Each record representsone population parameter for one species and one age class if possible, but may encompass all age classesof a species if the data is only available in this format. If a population estimate cannot be calculated fromthe sweep numbers obtained, the minimum estimate is recorded in the comments field (total of sweep countsdivided by area of site).
Field of
InformationDescription
DbaseField Name
Field Type(Length . Decimals)
Comments
ElectrofishingSweep Data ID
Identifier for electrofishing sweep data (per age class perspecies) assigned by the Data Warehouse. If blank,there is no associated sweep information in theElectrofishing Sweep Data table.
EfData_ID Numeric(10)
ElectrofishingSurvey ID
Identifier for electrofishing survey session assigned bythe Data Warehouse
EFAssmt_ID Numeric(8)
ElectrofishingSite ID
Identifier for permanent electrofishing site assigned bythe Data Warehouse
EFSite_ID Character(8)
Water Body ID Unique identifier of the stream with the electrofishing site Water_ID Numeric(8)
Water BodyName
Name of stream Water_Name Character(40)
DrainageCodes
Drainage system codes indicating the drainage unit ofthe surveyed stream
Drainge_Cd Character(17)
Appendix A
Agency Code
Agency responsible for the site or who collected the data Agency_Cd Character(4)
Code Table 6
Second Agency Code
Second agency responsible for the site or who collectedthe data, if applicable
Agency2_Cd Character(4)
Code Table 6
Agency’s SiteNo.
Site identifier used by the agency Ag_Site_ID Character(6)
SecondAgency’s SiteNo.
Site identifier used by the second agency, if applicable Ag2Site_ID Character(6)
AssessmentDate
Date electrofishing occurred - Format YYYY.MM.DD Assmt_Date Character(10)
Fish Population Estimates: Streams 14-13
Field of
InformationDescription
DbaseField Name
Field Type(Length . Decimals)
Comments
Stream TypeDescription
Description of stream type(s) StrTyp_Des Character(30)
Code Table 7
PopulationEstimationMethod
Method used to estimate populations Pop_Method Character(25)
AssessmentArea
Area of the stream being sampled (m2) Assmt_Area Numeric(8.1)
Species Code Species code of fish electrofished Species_Cd Character(2)
Code Table 17
Species Name of fish species electrofished Species Character(30)
Age Class Age class of fish electrofished (e.g., 0+, 1+, 2+, Fry,Parr)
Age_Class Character(10)
Relative Size Relative size of fish, generally large or small, e.g. smallparr, large parrr
Rel_Size Character(10)
Mean ForkLength (cm)
Average fork length of captured fish measured in cm Ave_Flen Numeric(6.1)
PopulationParameter
Population parameter - Density, PHS, Minimum Densityor Minimum PHS
Pop_Param Character(20)
PopulationEstimate
Population estimate (Density in per 100 m2, PHS in %) Pop_Estmat Numeric(7.2)
Comments General comments Comments Character(100)

Fish Population Estimates: Streams 14-14
FISH COUNTING SITES
The Fish Counting Sites table (frunsite.dbf) maintains a list of counting fences and protection barrierswithin the province. The counting facilities are operated by NB Natural Resources and Energy, Fisheriesand Oceans Canada, J.D. Irving Limited and Bowater Pulp and Paper Canada Inc.
Field of
InformationDescription
DbaseField Name
Field Type(Length .Decimals)
Comments
Facility ID Identifier for the counting fences and barriers assignedby the Data Warehouse
Facil_ID Character(8)
Code Table 16
Water Body ID Unique identifier of the stream where facility is located Water_ID Numeric(8)
Water BodyName
Name of stream Water_Name Character(40)
DrainageCodes
Drainage system codes indicating the drainage unit ofthe stream
Drainge_Cd Character(17)
Appendix A
Agency Code
Code representing the agency responsible for the site Agency_Cd Character(4)
Code Table 6
Agency’s SiteNo.
Site identifier used by the agency Ag_Site_ID Character(8)
Facility Type Type of facility - trap net, counting fence or protectionbarrier
Facil_Type Character(20)
Facility Name Name of fish counting facility Facil_Name Character(20)
Active Years Lists the range of years the counting facility was active Yrs_Active Character(16)

Fish Population Estimates: Streams 14-15
FISH MIGRATION COUNTS
The Fish Migration Counts table (fishrun.dbf) maintains daily counts of fish entering the various countingfacilities. For ease of use, the counts for each species and age class are stored in individual fields. Since eachsite collects data differently, all records will not contain the same information.
Field of
InformationDescription
DbaseFieldName
Field Type(Length .Decimals)
Comments
Counting FacilityID
Internal number to uniquely identify each countingfacility. Assigned by the Data Warehouse
Facil_ID Character(8)
Water BodyID
Unique identifier of the stream with the countingfacility
Water_ID Numeric(8)
Water BodyName
Name of stream Water_Name Character(40)
DrainageCodes
Drainage system codes indicating the drainageunit of the surveyed stream
Drainge_Cd Character(17)
Appendix A
Agency Code
Code representing the agency responsible for thesite
Agency_Cd Character(4)
Code Table 6
Agency’s Site No. Site identifier used by the agency Ag_Site_ID Character(6)
AssessmentDate
Date of count - Format YYYY.MM.DD Assmt_Date Character(10)
Direction ofMovement
Direction the fish are moving - upstream ordownstream
Direction Character(6)
Species Code Species code of fish Species_Cd Character(2)
Code Table 17
Species Name of fish species Species Character(30)
Origin of Fish Indicates whether the fish are wild or hatcherystock
Origin Character(10)
Age Class Age class of fish captured (e.g. Fry, Parr, Grilse,MSW)
Age_Class Character(30)
Relative Size Relative size of fish, generally large or small, e.g.small MSW, large MSW
Rel_Size Character(10)
Fish Status Indicates the status of the fish - whether itreleased, sacrificed or found dead
Status Character(50)
Number of Fish Number of fish counted No_Fish Numeric(10)

Fish Population Estimates: Streams 14-16
FISH MIGRATION SUMMARY
The Fish Migration Counts table (fishrun-sum.dbf) maintains an annual summary of the numbers of Atlanticsalmon entering the various counting facilities.
Field of
InformationDescription
DbaseFieldName
Field Type(Length .Decimals)
Comments
Counting FacilityID
Internal number to uniquely identify each countingfacility. Assigned by the Data Warehouse
Facil_ID Character(8)
Water BodyID
Unique identifier of the stream with the countingfacility
Water_ID Numeric(8)
Water BodyName
Name of stream Water_Name Character(40)
DrainageCodes
Drainage system codes indicating the drainageunit of the surveyed stream
Drainge_Cd Character(17)
Appendix A
Agency Code
Code representing the agency responsible for thesite
Agency_Cd Character(4)
Code Table 6
Agency’s Site No. Site identifier used by the agency Ag_Site_ID Character(4)
AssessmentDate
Date of count - Format YYYY.MM.DD Assmt_Date Character(10)
Assessment Year Year of assessment Assmt_Year Character(4)
Atlantic SalmonSmolt
Total number of Atlantic salmon smolt movingthrough the facility during the year
Smolt Numeric(6)
Atlantic SalmonGrilse
Total number of Atlantic salmon grilse (1SW)moving upstream through the facility during theyear
Grilse Numeric(6)
Atlantic SalmonSmall MSW
Total number of small multi-sea winter (2SW)Atlantic salmon moving upstream through thefacility during the year
Sm_MSW Numeric(6)
Atlantic SalmonLarge MSW
Total number of large multi-sea winter (3SW orolder) Atlantic salmon moving upstream throughthe facility during the year
Lg_MSW Numeric(6)
Atlantic SalmonTotal MSW
SUBTOTAL - Number of small and large multi-seawinter Atlantic salmon moving upstream throughthe facility during the year
Tot_MSW Numeric(6)
Total AtlanticSalmon
TOTAL - Number of adult Atlantic salmon movingupstream (grilse + small MSW + large MSW)through the facility during the year
Tot_AS Numeric(6)
Fish Population Estimates: Streams 14-17
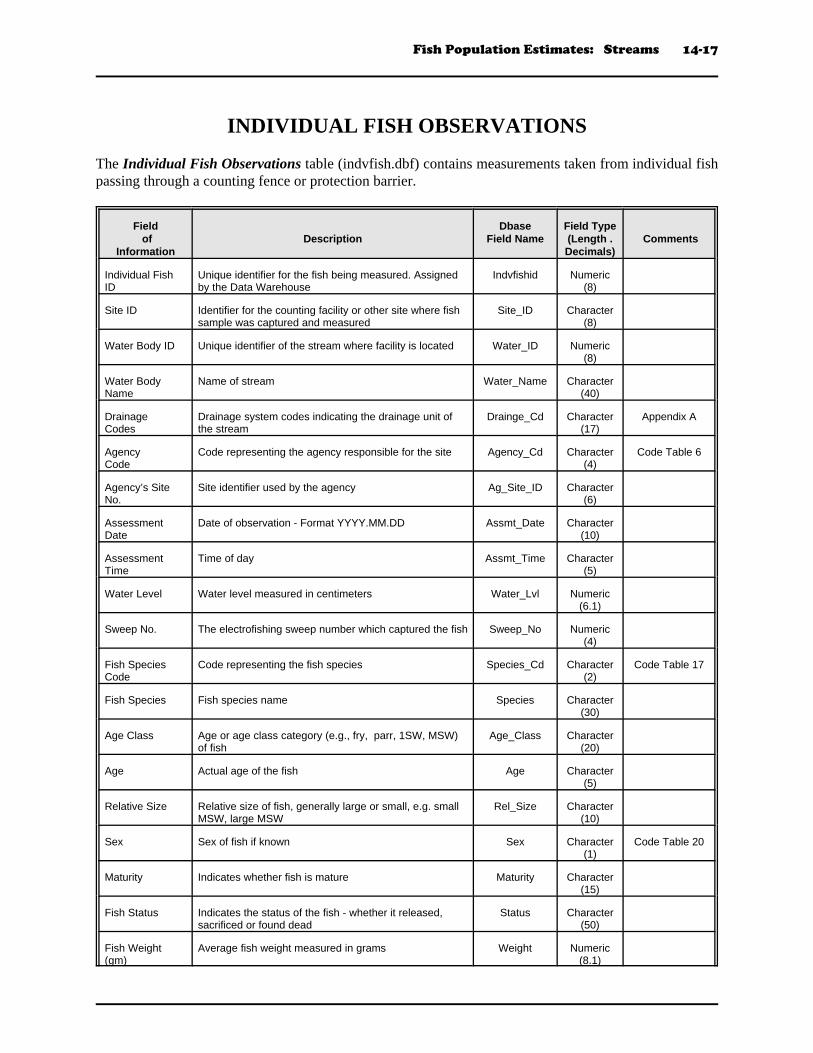
INDIVIDUAL FISH OBSERVATIONS
The Individual Fish Observations table (indvfish.dbf) contains measurements taken from individual fishpassing through a counting fence or protection barrier.
Field of
InformationDescription
DbaseField Name
Field Type(Length .Decimals)
Comments
Individual FishID
Unique identifier for the fish being measured. Assignedby the Data Warehouse
Indvfishid Numeric(8)
Site ID Identifier for the counting facility or other site where fishsample was captured and measured
Site_ID Character(8)
Water Body ID Unique identifier of the stream where facility is located Water_ID Numeric(8)
Water BodyName
Name of stream Water_Name Character(40)
DrainageCodes
Drainage system codes indicating the drainage unit ofthe stream
Drainge_Cd Character(17)
Appendix A
Agency Code
Code representing the agency responsible for the site Agency_Cd Character(4)
Code Table 6
Agency’s SiteNo.
Site identifier used by the agency Ag_Site_ID Character(6)
AssessmentDate
Date of observation - Format YYYY.MM.DD Assmt_Date Character(10)
AssessmentTime
Time of day Assmt_Time Character(5)
Water Level Water level measured in centimeters Water_Lvl Numeric(6.1)
Sweep No. The electrofishing sweep number which captured the fish Sweep_No Numeric(4)
Fish SpeciesCode
Code representing the fish species Species_Cd Character(2)
Code Table 17
Fish Species Fish species name Species Character(30)
Age Class Age or age class category (e.g., fry, parr, 1SW, MSW)of fish
Age_Class Character(20)
Age Actual age of the fish Age Character(5)
Relative Size Relative size of fish, generally large or small, e.g. smallMSW, large MSW
Rel_Size Character(10)
Sex Sex of fish if known Sex Character(1)
Code Table 20
Maturity Indicates whether fish is mature Maturity Character(15)
Fish Status Indicates the status of the fish - whether it released,sacrificed or found dead
Status Character(50)
Fish Weight(gm)
Average fish weight measured in grams Weight Numeric(8.1)

Fish Population Estimates: Streams 14-18
Field of
InformationDescription
DbaseField Name
Field Type(Length .Decimals)
Comments
Fork Length(cm)
Fork length of fish, measured in centimeters Frk_Len Numeric(8.1)
Total Length(cm)
Total length of fish, measured in centimters Tot_Len Numeric(8.1)
Comments General comments Comments Character(250)
Fish Population Estimates: Streams 14-19
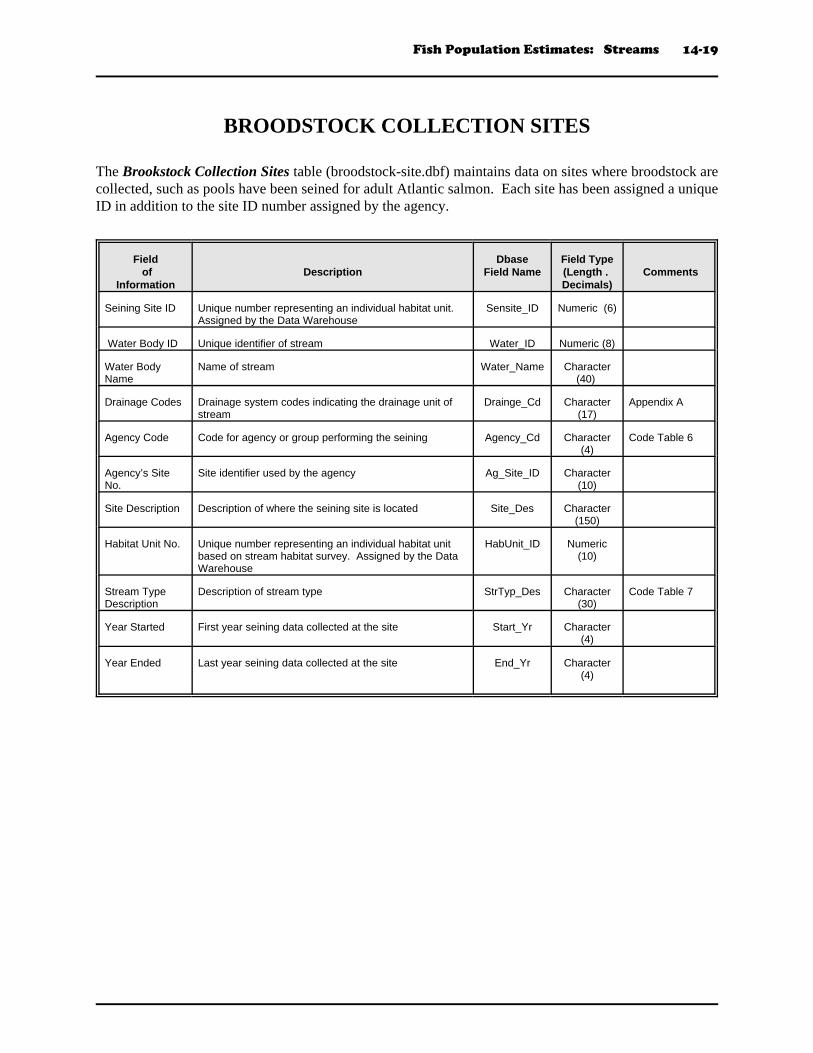
BROODSTOCK COLLECTION SITES
The Brookstock Collection Sites table (broodstock-site.dbf) maintains data on sites where broodstock arecollected, such as pools have been seined for adult Atlantic salmon. Each site has been assigned a uniqueID in addition to the site ID number assigned by the agency.
Field of
InformationDescription
DbaseField Name
Field Type(Length . Decimals)
Comments
Seining Site ID Unique number representing an individual habitat unit.Assigned by the Data Warehouse
Sensite_ID Numeric (6)
Water Body ID Unique identifier of stream Water_ID Numeric (8)
Water BodyName
Name of stream Water_Name Character(40)
Drainage Codes Drainage system codes indicating the drainage unit ofstream
Drainge_Cd Character(17)
Appendix A
Agency Code Code for agency or group performing the seining Agency_Cd Character(4)
Code Table 6
Agency’s SiteNo.
Site identifier used by the agency Ag_Site_ID Character(10)
Site Description Description of where the seining site is located Site_Des Character(150)
Habitat Unit No. Unique number representing an individual habitat unitbased on stream habitat survey. Assigned by the DataWarehouse
HabUnit_ID Numeric(10)
Stream TypeDescription
Description of stream type StrTyp_Des Character(30)
Code Table 7
Year Started First year seining data collected at the site Start_Yr Character(4)
Year Ended Last year seining data collected at the site End_Yr Character(4)
Fish Population Estimates: Streams 14-20
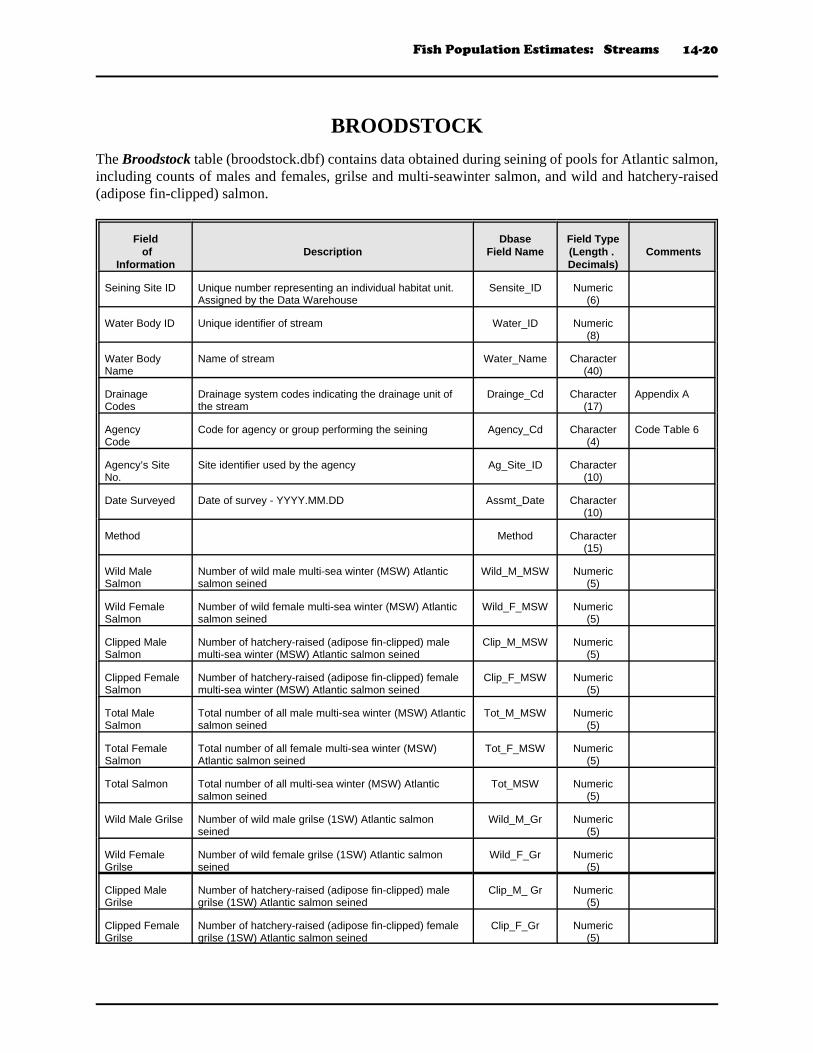
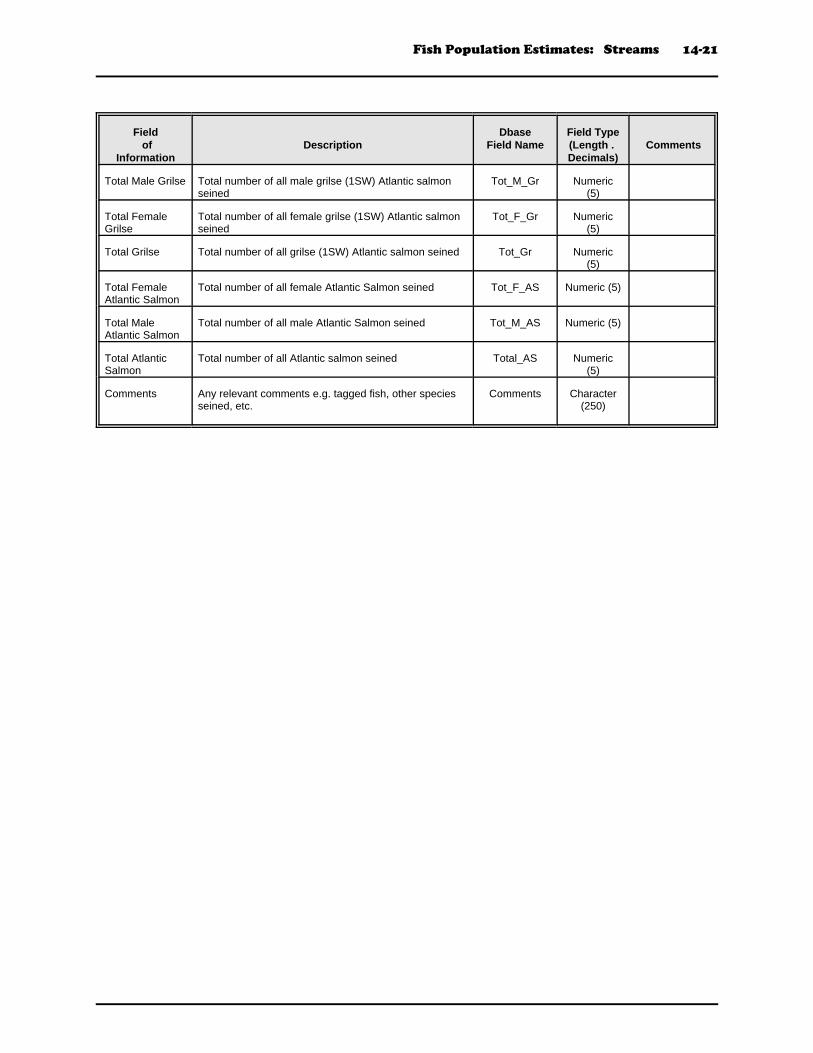
BROODSTOCKThe Broodstock table (broodstock.dbf) contains data obtained during seining of pools for Atlantic salmon,including counts of males and females, grilse and multi-seawinter salmon, and wild and hatchery-raised(adipose fin-clipped) salmon.
Field of
InformationDescription
DbaseField Name
Field Type(Length . Decimals)
Comments
Seining Site ID Unique number representing an individual habitat unit.Assigned by the Data Warehouse
Sensite_ID Numeric(6)
Water Body ID Unique identifier of stream Water_ID Numeric(8)
Water BodyName
Name of stream Water_Name Character(40)
DrainageCodes
Drainage system codes indicating the drainage unit ofthe stream
Drainge_Cd Character(17)
Appendix A
AgencyCode
Code for agency or group performing the seining Agency_Cd Character(4)
Code Table 6
Agency’s SiteNo.
Site identifier used by the agency Ag_Site_ID Character(10)
Date Surveyed Date of survey - YYYY.MM.DD Assmt_Date Character(10)
Method Method Character(15)
Wild MaleSalmon
Number of wild male multi-sea winter (MSW) Atlanticsalmon seined
Wild_M_MSW Numeric(5)
Wild FemaleSalmon
Number of wild female multi-sea winter (MSW) Atlanticsalmon seined
Wild_F_MSW Numeric(5)
Clipped MaleSalmon
Number of hatchery-raised (adipose fin-clipped) malemulti-sea winter (MSW) Atlantic salmon seined
Clip_M_MSW Numeric(5)
Clipped FemaleSalmon
Number of hatchery-raised (adipose fin-clipped) femalemulti-sea winter (MSW) Atlantic salmon seined
Clip_F_MSW Numeric(5)
Total MaleSalmon
Total number of all male multi-sea winter (MSW) Atlanticsalmon seined
Tot_M_MSW Numeric(5)
Total FemaleSalmon
Total number of all female multi-sea winter (MSW)Atlantic salmon seined
Tot_F_MSW Numeric(5)
Total Salmon Total number of all multi-sea winter (MSW) Atlanticsalmon seined
Tot_MSW Numeric(5)
Wild Male Grilse Number of wild male grilse (1SW) Atlantic salmonseined
Wild_M_Gr Numeric(5)
Wild FemaleGrilse
Number of wild female grilse (1SW) Atlantic salmonseined
Wild_F_Gr Numeric(5)
Clipped MaleGrilse
Number of hatchery-raised (adipose fin-clipped) malegrilse (1SW) Atlantic salmon seined
Clip_M_ Gr Numeric(5)
Clipped FemaleGrilse
Number of hatchery-raised (adipose fin-clipped) femalegrilse (1SW) Atlantic salmon seined
Clip_F_Gr Numeric(5)
Fish Population Estimates: Streams 14-21
Field of
InformationDescription
DbaseField Name
Field Type(Length . Decimals)
Comments
Total Male Grilse Total number of all male grilse (1SW) Atlantic salmonseined
Tot_M_Gr Numeric(5)
Total FemaleGrilse
Total number of all female grilse (1SW) Atlantic salmonseined
Tot_F_Gr Numeric(5)
Total Grilse Total number of all grilse (1SW) Atlantic salmon seined Tot_Gr Numeric(5)
Total FemaleAtlantic Salmon
Total number of all female Atlantic Salmon seined Tot_F_AS Numeric (5)
Total MaleAtlantic Salmon
Total number of all male Atlantic Salmon seined Tot_M_AS Numeric (5)
Total AtlanticSalmon
Total number of all Atlantic salmon seined Total_AS Numeric(5)
Comments Any relevant comments e.g. tagged fish, other speciesseined, etc.
Comments Character(250)
Fish Population Estimates: Streams 14-22
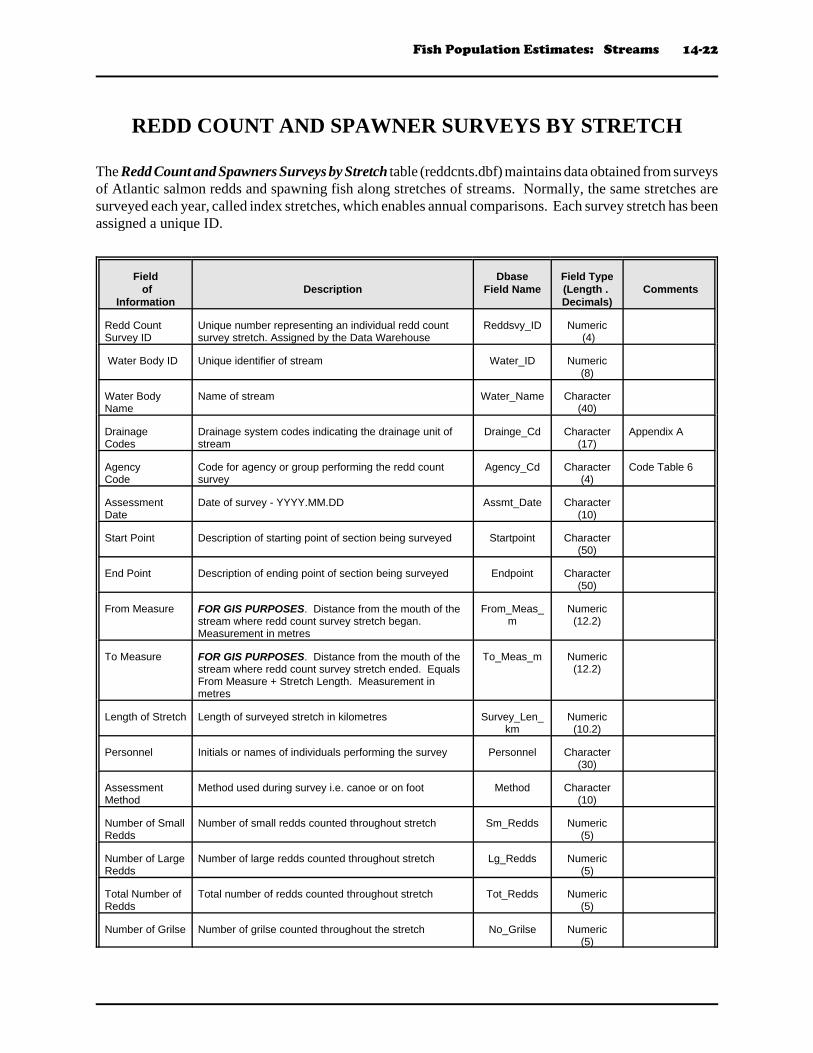
REDD COUNT AND SPAWNER SURVEYS BY STRETCH
The Redd Count and Spawners Surveys by Stretch table (reddcnts.dbf) maintains data obtained from surveysof Atlantic salmon redds and spawning fish along stretches of streams. Normally, the same stretches aresurveyed each year, called index stretches, which enables annual comparisons. Each survey stretch has beenassigned a unique ID.
Field of
InformationDescription
DbaseField Name
Field Type(Length . Decimals)
Comments
Redd CountSurvey ID
Unique number representing an individual redd countsurvey stretch. Assigned by the Data Warehouse
Reddsvy_ID Numeric (4)
Water Body ID Unique identifier of stream Water_ID Numeric(8)
Water BodyName
Name of stream Water_Name Character(40)
DrainageCodes
Drainage system codes indicating the drainage unit ofstream
Drainge_Cd Character(17)
Appendix A
AgencyCode
Code for agency or group performing the redd countsurvey
Agency_Cd Character(4)
Code Table 6
AssessmentDate
Date of survey - YYYY.MM.DD Assmt_Date Character(10)
Start Point Description of starting point of section being surveyed Startpoint Character(50)
End Point Description of ending point of section being surveyed Endpoint Character(50)
From Measure FOR GIS PURPOSES. Distance from the mouth of thestream where redd count survey stretch began. Measurement in metres
From_Meas_m
Numeric(12.2)
To Measure FOR GIS PURPOSES. Distance from the mouth of thestream where redd count survey stretch ended. EqualsFrom Measure + Stretch Length. Measurement inmetres
To_Meas_m Numeric(12.2)
Length of Stretch Length of surveyed stretch in kilometres Survey_Len_km
Numeric(10.2)
Personnel Initials or names of individuals performing the survey Personnel Character(30)
AssessmentMethod
Method used during survey i.e. canoe or on foot Method Character(10)
Number of SmallRedds
Number of small redds counted throughout stretch Sm_Redds Numeric(5)
Number of LargeRedds
Number of large redds counted throughout stretch Lg_Redds Numeric(5)
Total Number ofRedds
Total number of redds counted throughout stretch Tot_Redds Numeric(5)
Number of Grilse Number of grilse counted throughout the stretch No_Grilse Numeric(5)
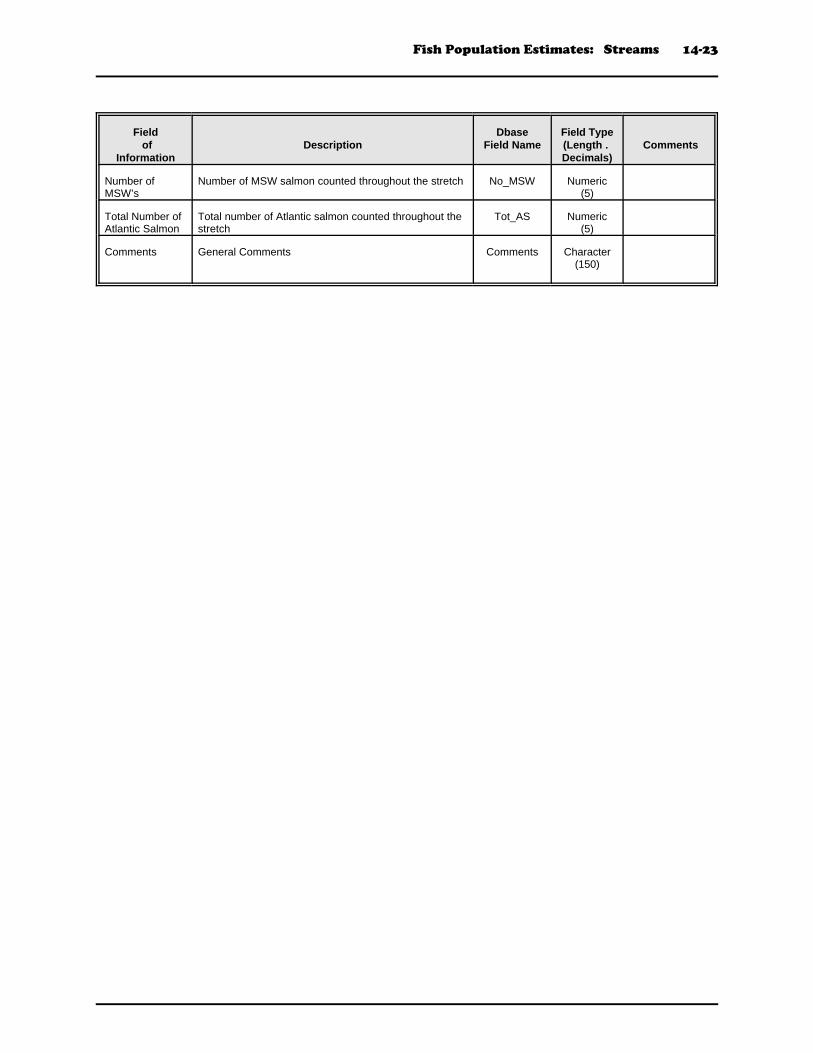
Fish Population Estimates: Streams 14-23
Field of
InformationDescription
DbaseField Name
Field Type(Length . Decimals)
Comments
Number ofMSW’s
Number of MSW salmon counted throughout the stretch No_MSW Numeric(5)
Total Number ofAtlantic Salmon
Total number of Atlantic salmon counted throughout thestretch
Tot_AS Numeric(5)
Comments General Comments Comments Character(150)

Fish Population Estimates: Streams 14-24
SPAWNER COUNT SURVEYS BY POINT LOCATIONS
The Spawner Count Point Surveys table (spawners.dbf) contains data obtained during surveys of spawningAtlantic salmon at specific sites on streams. This data is usually collected the same time redds are countedalong stretches of stream, but in this instance the specific site or pool within the stream containing the fishis captured. Each survey point has been assigned a unique ID.
Field of
InformationDescription
DbaseField Name
Field Type(Length . Decimals)
Comments
Spawner CountSurvey ID
Unique number representing an individual spawner countsurvey site. Assigned by the Data Warehouse
Spnsite_ID Numeric(6)
Water Body ID Unique identifier of stream Water_ID Numeric(8)
Water BodyName
Name of stream Water_Name Character(40)
DrainageCodes
Drainage system codes indicating the drainage unit ofthe stream
Drainge_Cd Character(17)
Appendix A
AgencyCode
Code for agency or group performing the spawnersurvey
Agency_Cd Character(4)
Code Table 6
Site Description Description of location of site where spawners werecounted
Site_Des Character(150)
Point Measure FOR GIS PURPOSES. Distance from the mouth of thestream where spawners were counted. Measurement inmetres
Point_Meas Numeric(12.1)
AssessmentDate
Date of survey - YYYY.MM.DD Assmt_Date Character(10)
Personnel Initials or names of individuals performing the survey Personnel Character(30)
AssessmentMethod
Method used during survey (enter “Canoe” or “Foot”) Method Character(10)
Number of MSWSalmon
Number of multi-seawinter Atlantic salmon counted atsite
No_MSW Numeric(4)
Number of Grilse Number of Atlantic salmon grilse counted at site No_Grilse Numeric(4)
Total Number ofAtlantic Salmon
Total number of Atlantic salmon counted at site Total_AS Numeric(4)
Fish Population Estimates: Streams 14-25
SPATIALDATAFILES

Fish Population Estimates: Streams 14-26
ELECTROFISHING POINTS
The Electrofishing Points spatial file (ef-sites.shp) is a point coverage representing electrofishing samplingsites. A point coverage is used rather than dynamic segmentation due to the large number of Fisheries andOceans sites which are provided as coordinates.
Field of
InformationDescription
DbaseField Name
Field Type(Length . Decimals)
Comments
Internal ID Internal ID generated by GIS to uniquely identify eachpoint
ID Numeric(8)
ElectrofishingSite ID
Unique number representing an electrofishing site.Assigned by the Data Warehouse
EfSite_ID Numeric (4)
AgencyCode
Code for agency who collected the data Agency_Cd Character(4)
Agency’s SiteNo.
Site identifier used by the agency Ag_Site_ID Character(6)
Water Body ID Unique number of the surveyed stream Water_ID Numeric(8)
Water Name Name of surveyed stream Water_Name Character(30)
Drainage Codes Drainage system codes representing the drainage unit ofthe surveyed stream.
Drainge_Cd Character(14)
Appendix A
Fish Population Estimates: Streams 14-27
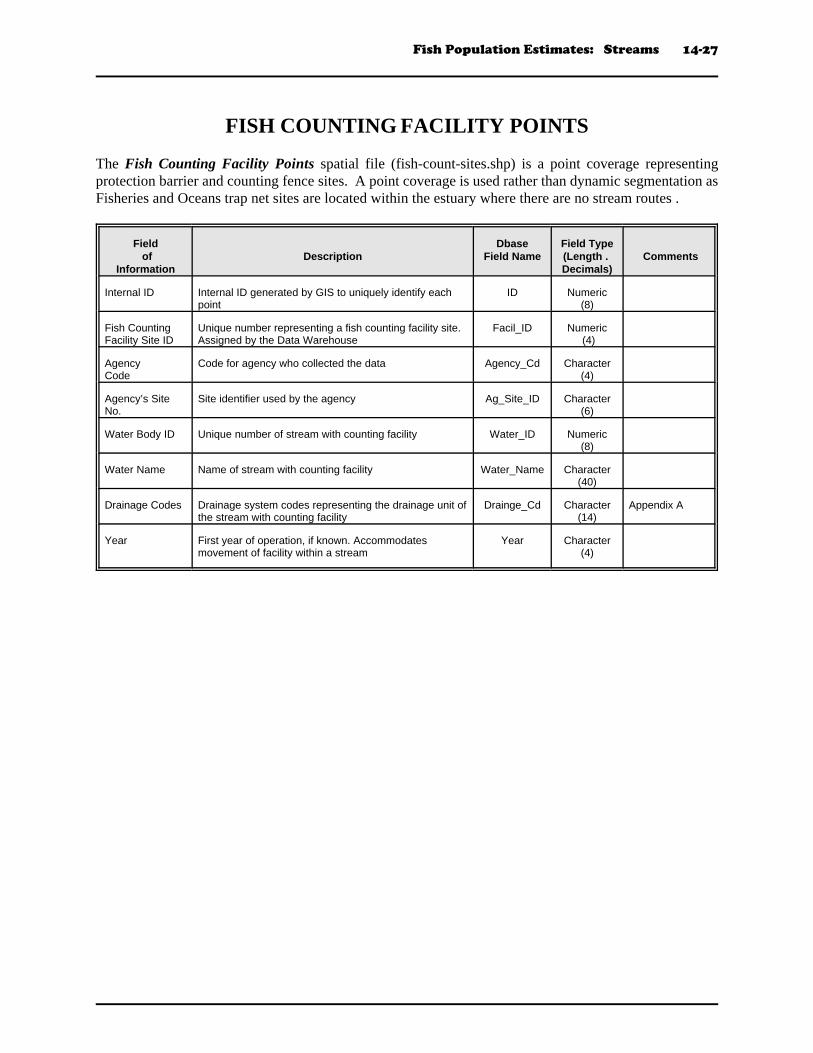
FISH COUNTING FACILITY POINTS
The Fish Counting Facility Points spatial file (fish-count-sites.shp) is a point coverage representingprotection barrier and counting fence sites. A point coverage is used rather than dynamic segmentation asFisheries and Oceans trap net sites are located within the estuary where there are no stream routes .
Field of
InformationDescription
DbaseField Name
Field Type(Length . Decimals)
Comments
Internal ID Internal ID generated by GIS to uniquely identify eachpoint
ID Numeric(8)
Fish CountingFacility Site ID
Unique number representing a fish counting facility site.Assigned by the Data Warehouse
Facil_ID Numeric (4)
AgencyCode
Code for agency who collected the data Agency_Cd Character(4)
Agency’s SiteNo.
Site identifier used by the agency Ag_Site_ID Character(6)
Water Body ID Unique number of stream with counting facility Water_ID Numeric(8)
Water Name Name of stream with counting facility Water_Name Character(40)
Drainage Codes Drainage system codes representing the drainage unit ofthe stream with counting facility
Drainge_Cd Character(14)
Appendix A
Year First year of operation, if known. Accommodatesmovement of facility within a stream
Year Character(4)
Fish Population Estimates: Streams 14-28
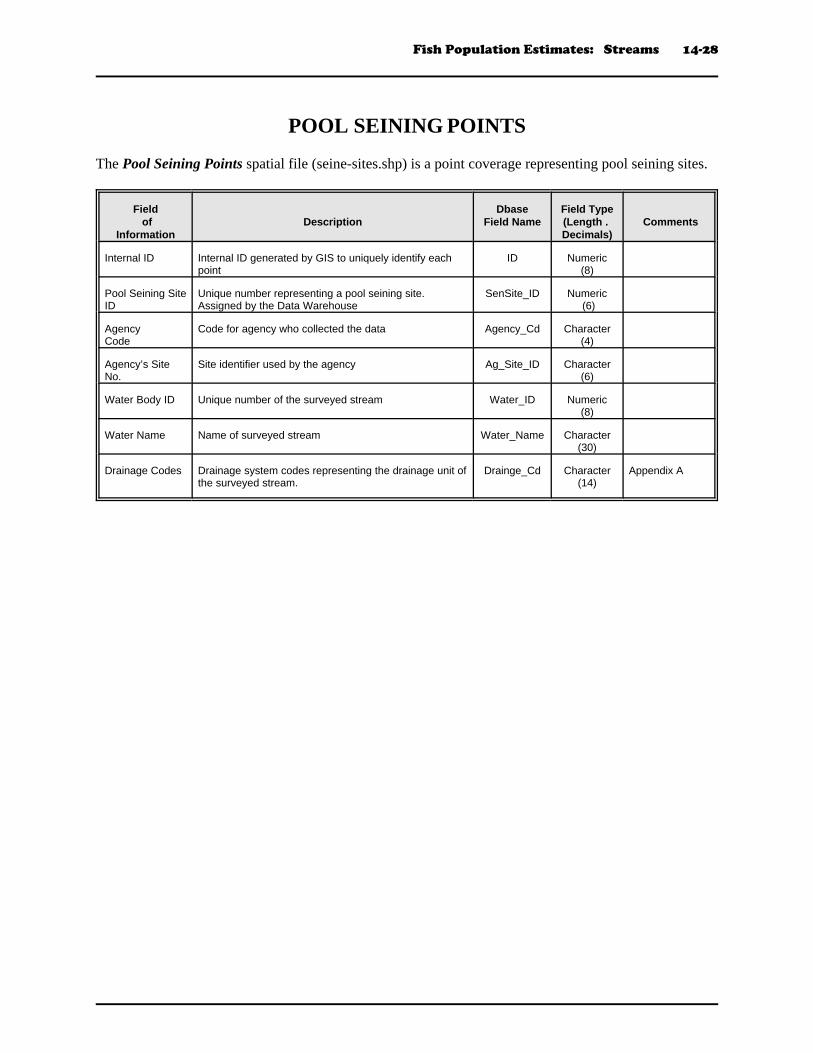
POOL SEINING POINTS
The Pool Seining Points spatial file (seine-sites.shp) is a point coverage representing pool seining sites.
Field of
InformationDescription
DbaseField Name
Field Type(Length . Decimals)
Comments
Internal ID Internal ID generated by GIS to uniquely identify eachpoint
ID Numeric(8)
Pool Seining SiteID
Unique number representing a pool seining site.Assigned by the Data Warehouse
SenSite_ID Numeric (6)
AgencyCode
Code for agency who collected the data Agency_Cd Character(4)
Agency’s SiteNo.
Site identifier used by the agency Ag_Site_ID Character(6)
Water Body ID Unique number of the surveyed stream Water_ID Numeric(8)
Water Name Name of surveyed stream Water_Name Character(30)
Drainage Codes Drainage system codes representing the drainage unit ofthe surveyed stream.
Drainge_Cd Character(14)
Appendix A