Embed Size (px)
Citation preview

FISH COMPOSITION AND FISHERIES AT DOWNSTREAM AND UPSTREAM OF BARAM RIVER, SARAWAK
.'
Juliana Sambal anak Sibat
Bachelor of Science with HODoursQL
(Aquatic Resource Science and Management) 634
2015M2 J94 2015

Pu;u ,.; n)' t I 'l:..kJ"lInal A ~d ' , · IJNIVERSITI MALAYSIA S,o\R..\WAt\
FISH COMPOSITION AND FISHERIES AT DOWNSTREAM AND UPSTREAM OF BARAM RIVER, SARA WAK
Juliana Sambai anak Sibat
This project report is submitted in partial fulfillment of the requirements for the Degree of Bachelor of Science with Honors
(Aquatic Resource Science and Management)
.'
Faculty of Resource Science and Technology UNIVERSITI MALAYSIA SARA W AK
2015

DECLARATION
I hereby declare that no portion of this dissertation has been submitted in support of an
application for another degree of qualification of this or any other university or institution
of higher learning.
JULIANA SAMBAI ANAK SIBA T
Aquatic Resource Science and Management
Department of Aquatic Science
Faculty of Resource Science and Techno]ogy
Universiti Malaysia Sarawak

The project entitled "Fish Composition and Fisheries at Downstream and Upstream of
Baram River, Sarawak" was prepared by Juliana Sambai anak Sibat and submitted to the
Faculty of Resource Science and Technology in partial fulfillment of the requirements for
the Degree of Bachelor of Science (Honours) in Aquatic Resource Science and
Management.
Received for examination by:
.'
( . .... )
Date:

I
ACKNOWLEDGEMENT
I would like to express my deepest gratitude to the almighty God for gracing me with good
health and opportunity to finish this report. I am greatly indebted to my supervisor, Prof
Lee Nyanti for the guidance, support and input to this work from the start. His advices and
comments during field trips and also report writing is very much appreciated.
I would like to dedicate my precious acknowledgement to Mr Jongkar Grinang and staffs
of Faculty Resource Science and Technology, Mr Benedict anak Samling, Mr Richard Toh,
Mr Zulkifli and Ms Lucy Daru who have facilitated us during the field work.
Besides, I would like to extend my cordial appreciation to my parents, Mr Sibat anak Ibeng
Mdm Bernadette Epoi and my siblings who have supported me spiritually and financially
in order for me to complete this report.
To my fellow friends under the same supervisor, Fatin Raidah, Nur Ezzaty, Kirollina, Goh
Hao Chin, Iskandar, Danial, Sumeet, Lee Li Keat and Jerome who always accompany me
staying in the laboratory overnight, thanks for the time we spent together and the memories
that we made. I will treasure it for the rest of my life and special thanks I dedicated to my
classmates, friends and housemates for their moral support. Last but not least, the financial
support by Sarawak Energy Berhad through research grant no GL (F07)/SEB/3A/2013 (20)
is gratefully acknowledged.

II
Table of Contents
Acknowledgement……………………………………………………………………… I
Tables of Contents……………………………………………………………………… II
List of Abbreviations…………………………………………………………………… V
List of Tables………………………………………………………………………….. VI
List of Figures…………………………………………………………………………. VII
Abstracts……………………………………………………………………….............. 1
1.0 Introduction.………………………………………………………………………. 2
2.0 Literature Review.…………………………………………………………………. 4
2.1 Freshwater Fishes in Malaysia………………………………………………... 4
2.2 Freshwater Habitat in Malaysia.………………………………………………. 5
2.3 Fish as Biological Indicator…………………………………………………… 5
2.4 Length-weight Relationship…………………………………………………… 6
2.5 Water Quality Parameters……………………………………………………... 6
2.5.1 pH Value……………………………………………………………....... 7
2.5.2 Dissolved Oxygen (DO)………………………………………………… 7
2.5.3 Total Suspended Solids (TSS)…………………………………………... 7
2.5.4 Temperature…………………………………………………………….. 8
2.5.5 Turbidity………………………………………………………………… 8
2.6 Relationship between Fish Reproductively and Gonadal Somatic Index (GSI). 8
2.7 Feeding Habit………………………………………………………………….. 9
2.8 Fisheries Activity…………….………………………………………………... 9
III
3.0 Materials and Methods………...…………………………………………………… 10
3.1 Study Site……………………………………………………………………… 10
3.2 Fish Species Identification…………………………………………………….. 12
3.3 Fish Measurement……………………………………………………………... 12
3.3.1 Length-weight Relationship…………………………………………...... 12
3.3.2 Hepatosomatic Indices (HSI)…………………………………………… 13
3.4 Fish Preservation………………………………………………………………. 13
3.5 Water Quality Parameters……………………………………………………... 14
3.5.1 In situ……………………………………………………………………. 14
3.5.1.1 pH and Temperature…………………………………………… 14
3.5.1.2 Dissolved Oxygen (DO)………………………………………… 14
3.5.1.3 Turbidity………………………………………………………… 14
3.5.2 Ex-situ…………………………………………………………………... 14
3.5.2.1 Total Suspended Solids (TSS)…………………………………... 14
3.5.2.2 Chlorophyll-a…………………………………………………………. 15
3.5.2.3 BOD5…………………………………………………………………. 17
3.6 Indices…………………………………………………………………………. 17
3.7 Feeding Habit………………………………………………………………….. 18
3.8 Results…………………………………………………………………………. 20
3.8.1 Water Quality…………………………………………………………… 20
3.8.1.1 Turbidity………………………………………………………… 20
3.8.1.2 pH………………………………………………………………. 20

IV
3.8.1.3 BOD5……………………………………………………………. 21
3.8.1.4 Dissolved Oxygen………………………………………………. 22
3.8.1.5 Temperature…………………………………………………….. 23
3.8.1.6 Total Suspended Solids…………………………………………. 23
3.8.1.7 Chlorophyl-a……………………………………………………. 24
3.8.2 Fish Fauna………………………………………………………………. 25
3.8.3 Diversity, Richness and Evenness Index………………………………... 35
3.8.4 Hepatosomatic Index……………………………………………………. 36
3.8.5 Length-weight Relationship…………………………………………….. 38
3.8.6 Stomach Content………………………………………………………... 40
3.8.7 Principle Component Analysis………………………………………….. 41
3.9 Fisheries Production at Upstream of Baram River…………………………….. 42
4.0 Discussion…………………………………………………………………………. 45
Conclusion……………………………………………………………………………… 50
References………………………………………………………………………………. 51
Appendix………………………………………………………………………………... 55
V
List of Abbreviations
TSS Total Suspended Solids
BOD5 Biological Oxygen Demand
COD Chemical Oxygen Demand
GSI Gonadal Somatic Index
HSI Hepatosomatic Index
SL Standard Length
TL Total Length
H’ Shannon-Weiner’s Index
D Margalef’s Species Richness Index
J’ Pielou’s Evenness Index
S Sorensen’s Index
VI
List of Tables
Table 1: Coordinates of the sampling stations at downstream and
upstream Baram River.
10
Table 2: List of fish species, the number and percentages caught from all
sampling stations at downstream of Baram River.
26
Table 3: List of fish species, the number and percentage caught from all
sampling stations at upstream of Baram River.
30
Table 4: List of fish species, the number and percentage caught from all
sampling stations.
34
Table 5: Diversity, richness and evenness indices recorded at all stations. 36
Table 6: List of fish species, number of individuals (N) and average of
Hepatosomatic Index (HSI) and standard deviation (SD) in the
two study areas.
37
Table 7: Frequency of occurrence for different food items. 40
Table 8: Total mass (g) and mass method of different food items found
in the stomachs of three fish species.
41
Table 9: Results of correlation matrix between various parameters and
fish assemblages.
41
Table 10: Results of correlation matrix between various parameters and
fish assemblages.
42
Table 11: Results of pattern matrix between various parameters and fish
assemblages.
42
Table 12: Age, level of education, marital status (no. of children) and
years of experiences fishing at upstream of Baram River.
43
Table 13: Types of fishing gears, numbers of family members who fish
for living, types of boat and engine.
43

VII
List of Figures
Figure 1: Sampling sites for all stations at the downstream and
upstream of Baram River (Source: Google Earth).
10
Figure 2: Means turbidity values for each station at downstream and
upstream of Baram River.
20
Figure 3: Mean pH values for each station at downstream and
upstream of Baram River.
21
Figure 4: Mean BOD5 values for each station at downstream and
upstream of Baram River.
22
Figure 5: Mean dissolved oxygen values for each station at
downstream and upstream of Baram River.
22
Figure 6: Mean temperature values for each station at downstream and
upstream of Baram River.
23
Figure 7: Mean TSS values for each station at downstream and
upstream of Baram River.
24
Figure 8: Mean chlorophyll -a values for each station at downstream
and upstream of Baram River.
24
Figure 9: Percentage of family caught in all seven stations at the
downstream of Baram River.
25
Figure 10: Percentage of family caught in all eight stations at the
upstream of Baram River.
29
Figure 11: Percentage of family caught in all stations of downstream
and upstream of Baram River.
33
Figure 12: LWR for Rasbora lateristriata. 38
Figure 13: LWR for Helostoma temmincki. 39
Figure 14: LWR for Nematabramis steindachneri. 39

1
Fish Composition and Fisheries at Downstream and Upstream of Baram River,
Sarawak
Juliana Sambai anak Sibat
Aquatic Resource Science and Management
Faculty of Resource Science and Technology
University Malaysia Sarawak
ABSTRACT
The study on diversity and distribution of freshwater fishes at downstream and upstream of Baram River was
carried out on 1st - 5
th July 2014 and 19
th - 23
rd January 2015. The fishes were caught using cast net and gill
net of various mesh sizes. In Baram River, fishes from the family Cyprinidae were dominant with 64.53% of
the total number of individuals caught. Diversity and distribution of species was analyzed using diversity
index which are Shannon-Weiner, Margalef’s Index and Pielou’s Index. Based on the results obtained, the
downstream of Baram River recorded a diversity index of 2.88, Pielou’s Evenness Index of 0.46 and species
richness of 6.84. In the upstream area, diversity index was 2.75, evenness index was 0.46 and species
richness was 5.39. The most abundant species at the downstream area was Heleostoma temminckii with 87
individuals, while at upstream area was Rasbora lateristriata with 68 individuals. For water quality
observation, temperature ranged from 24.10- 35.93 °C, dissolved oxygen concentration has a mean of 6.12
mg/I and pH ranged from 6.30 to 7.01.
Keywords: Diversity, distribution
ABSTRAK
Kajian kepelbagaian dan taburan ikan air tawar di hilir dan ulu Sungai Baram telah dilakukan pada 1 - 5hb
Julai 2014 dan 19 - 23hb Januari 2015. Ikan ditangkap menggunakan jala dan pukat. Di Sungai Baram,
spesis dominan adalah dari keluarga Cyprinidae dengan 64.53%. Kepelbagaian dan taburan spesies ini
telah dianalisis menggunakan indeks kepelbagaian oleh Shannon-Weiner, Indeks Margalef dan Indeks
Pielou. Berdasarkan keputusan yang diperolehi, di hilir Sungai Baram mencatatkan indeks kepelbagaian
2.88, Indeks keadaan rata Pielou sebanyak 0.46 dan kekayaan spesies 6.84. Di kawasan hulu, indeks
kepelbagaian adalah 2.75, indeks kemerataan adalah 0.46 dan kekayaan spesis adalah 5.39. Spesies yang
paling banyak di kawasan hilir adalah Heleostoma temminckii dengan 87 individu manakala spesies yang
paling banyak di kawasan hulu adalah Rasbora lateristriata dengan 68 individu. Untuk kualiti air, julat suhu
adalah 24.10 – 35.93 ° C, kepekatan oksigen terlarut air adalah tinggi dengan min 6.12 mg/l dan pH berjulat
antara 6.30 - 7.01.
Kata Kunci: Kepelbagian, taburan
2
1.0 Introduction
The freshwater habitat is Malaysia consists of both natural and man-made water bodies.
For examples, the riverine, lacustrine (which consists of natural lakes, ox-bow lakes,
reservoirs and ex-mining pools) and palustrine (freshwater and peat swamps and rice
fields) habitats, (WWFM, 2002).
Studies on freshwater fish diversity and distribution have been documented at many
localities of Peninsular Malaysia and Borneo (Sabah and Sarawak). In Sarawak, apart from
the study on documenting freshwater fish by Watson and Balon (1984) along the Baram
River and the compilation of a fish checklist by Kottelat & Lim (1995), several other
studies have been conducted and mainly focusing on small areas.
Other studies include the composition and diversity of freshwater fish in Lutong River
carried out by Nyanti et al. (2012) which recorded 33 species, Khairul Adha et al. (2009)
come out with 36 species in Batang Kerang, Parenti and Lim (2005) reported a total of 164
species in Rajang River basin, 15 species documented in Layar and Spak River by Jefferine
et al. (2009) and Gunung Jerai by Shah et al. (2009) with 37 species recorded.
Additionally, several fish fauna studies have also been carried out within the watershed of
Baram River, including Watson and Balon (1984) in Baram River, Nyanti et al. (1999) in
Kelabit Highlands, Nyanti et al. (2006) in Loagan Bunut National Park, as well as Nyanti
and Jongkar (2007) in Dappur River and its tributaries.
However, there is a very little information about the fish fauna distribution that is present
at the upper and lower Baram River. Additionally, there is also very limited information
about fish diversity within these areas. Thus, the objectives of this study were to:

3
1. document the fish fauna that are present at downstream and upstream of Baram
River.
2. determine the fish diversity, abundance and dominant species within these areas.

4
2.0 LITERATURE REVIEW
2.1 Freshwater Fishes in Malaysia
Malaysia is recognized internationally as a hot mega diversity country. Out of the 1000
species of freshwater fish listed in South-East Asians tropics, 420 species can be found in
Malaysia (Hashim et al., 2012).
Freshwater fish species in Malaysia can be categorized into two zoogeographic regions.
The first region is the Peninsular Malaysia, where the fishes are similar to that of the
mainland Asiatic ichthyofauna and is of Sundaic origin. The second region is east Malaysia
(Sabah and Sarawak), which is part of the zoogeographic area of Borneo, together with
Sumatra and Java islands (Mohsin & Ambak, 1991; Zakaria-Ismail, 1994; Yap, 2002).
In general, cyprinids are the most abundance fish fauna in East, and South and Southeast
Asia which is consisted of about more than 1000 species (Hasyimah et al., 2013). For
comparison, studies carried out by Khairul Adha et al. (2009) showed that 79.7% of the
total catch in Jempol and Serting is represented by Cyprinids, the brown water in Batang
Kerang by Khairul Adha et al. (2009) also dominated by the Cyprinidae (63.8%) family
and study by Hassan et al. (2010) showed that Cyprinidae represented the major species in
Nanga Merit, comprising 59.5% of the total number of fish caught.
Zakaria-Ismail (1991) reported that the one of the highest diversity of freshwater fish in the
world is in the Southeast Asia region including Peninsular Malaysia and Borneo Island.
Salam and Gopinath (2006) reported that over 300 freshwater fish species inhabit the
riverine ecosystem in Malaysia. Recent studies by Chong et al. (2010) shows that Malaysia
possesses about 15 families with 470 species of freshwater fishes.
Mohsin and Ambak (1983) documented a total of 382 species of freshwater fish
representing 56 families in Peninsular Malaysia based on various sources.

5
2.2 Freshwater Habitat in Malaysia
Studies conducted by the World Wide Fund for Nature in Malaysia (WWFM, 2002),
categorized freshwater habitat in Malaysia as riverine, lacustrine and palustrine. Major
rivers in East Malaysia is much longer and larger than in Peninsular Malaysia. For
example, the longest river in Peninsular Malaysia is Pahang River with only 434 km long
and 29,137 km2 catchment compared to Rajang River in Sarawak which is recognized as
the longest and largest river in Malaysia with a length of 565 km and a catchment of
51,000 km2 (Anon, 1998). The longest river in Sabah is Kinabatangan River with a length
of 563 km. Many rivers have been extensively modified for drainage purposes and their
carrying capacities are significantly altered (WWFM, 2002).
In Malaysia, lacustrine and palustrine habitats are consisted as non-flowing or stagnant
water bodies (lentic system) and include few natural lakes, 63 man-made dams and
reservoirs (47 single purpose dams and 16 multi-purpose dams), 16,440 hectares of ex-
mining pools and 2.5 million ha of freshwater and peat swamp forests (Salam & Gopinath,
2006). A few examples of lacustrine are natural lakes, ox-bow lakes, reservoirs and ex-
mining pools while palustrine composed of freshwater and peat swamps and rice fields
(Salam & Gopinath, 2006).
2.3 Fish as Biological Indicator
Increasing in human population and rapid development of industrialization has increases
the pollution of most aquatic ecosystems and consequent deterioration in environmental
water quality. Indicator organisms are needed to improve assessment programmes on the
ecological impacts of anthropogenic activities on the aquatic environment. Fish have been
widely documented as useful indicators of environmental water quality because of their
sensitivity to pollution (Naigaga et al., 2011) such as habitat alterations, organic

6
enrichment, chemical toxicity, and thermal fluctuations. Therefore, any changes caused by
natural or human activities will greatly influence the fish community structure that will
affect the whole community (Naigaga et al., 2011).
2.4 Length-weight Relationship
Length-weight relationship (LWR) of fishes plays a very important role in fisheries and
fish biology because this method shows the approximation of the average weight of the fish
by indicating a mathematical relation between them. According to Mir et al. (2012), LWR
can be used for the differentiation of taxonomic units and the relationship changes with the
various developmental events in life. LWR parameter are very useful in various ways such
as to estimate the weight of the fish based on its length, calculate the condition indices,
compare life history and morphology of population that comes from different regions and
to study ontogenetic allometric changes.
2.5 Water Quality Parameters
Water quality study is the process to determine the physical, biological and
chemical characteristics of the water bodies. This study is very essential to detect the
pollutant or waste that will degrade the water quality (Ismail & Usali, 2010). Nowadays,
water resources are at constant risk and become limited. The water quality status of rivers
in Malaysia should be taken more seriously by the civilians, government agencies as well
as the public at large. Classification of water quality index in this study is based on selected
parameter such as pH, dissolved oxygen, BOD5, total suspended solids, chlorophyll-a and
turbidity.

7
2.5.1 pH Value
Acidity or alkalinity of particular water can be determined by measuring the pH
value of the water sample (Arrignon, 1999). Determining the pH is very crucial to indicate
the extent of aggressiveness of particular water and to ensure whether the pH is suitable for
higher animal life (Arrignon, 1999). The pH concentration may change due to several
factors such as pollution, decay of organic matter and fish respiration. Arrignon (1999)
stated that most species are intolerant to pH below 5.0 while pH in between 6.0 and 7.2 is
the optimal pH for reproduction of most species. Randall (1991) indicates that fish are
unable to survive with pH extremes outside the range of 5 - 9. Natural water has pH ranges
between 5 to 10 (Boyd, 1990).
2.5.2 Dissolved Oxygen (DO)
Dissolved Oxygen (DO) is the amount of oxygen dissolved in water. The absence
of oxygen shows severe pollution while a good water quality has adequate presence of
oxygen. DO is very important for the survival of most aquatic organism because DO
control the metabolism of the organism. The amount of oxygen depends on the pressure
and temperature. According to Arrignon (1999), high pressure will lead to high solubility
of oxygen while increase in temperature can reduce the solubility of oxygen.
2.5.3 Total Suspended Solids (TSS)
Suspended solid is very harmful to the aquatic organisms. Some of the suspended
solid thickened the epithelial cells of the gill, and change the natural body movement of the
fish and cause harmful effect on the eggs (Arrignon, 1999). High amount of total
suspended solids that is more than 25mg/l resulted in low productivity of fish (Arrignon,
1999). Excessive suspended sediment can cause alteration in fish habitat and long-term
effect to fish populations.

8
2.5.4 Temperature
The solubility of gases, density, viscosity, rate of biochemical and chemical
reactions all depends on the temperature of the water (Ariggnon, 1999). Ecological
imbalance occurs due to variation in temperature of water resulting in a favorable condition
for the development of some species but can destroy certain aquatic species (Arrignon,
1999). The meristic characters and sexual differentiation is influence by thermal
environment (Munro et al., 1990). Higher temperature increase metabolism which is
associated with faster development rates (Munro et al., 1990).
2.5.5 Turbidity
Sediment concentration caused by anthropogenic activities lead to high turbidity.
Excess sediment beyond the natural background is very dangerous to the aquatic
ecosystem.
2.6 Relationship between Fish Reproductively and Gonadal Somatic Index (GSI)
Individual fish must reach a particular age before undergo gametogenesis. The
number and size of eggs are influenced by the body size (length and weight) of the female
fish (Munro et al., 1990). The growth rate of fish is influenced by food availability, prey-
predators relationship and other environmental factors (Munro et al., 1990). Gonado
somatic index (GSI) expresses the weight of the gonad in relation to the body weight and
expressed in percentage. GSI value is better being observed during spawning period in the
rainy season (Hogg, 1976). GSI of female fish is usually higher that of the male fish. The
knowledge of fecundity and reproductive biology is very essential to determine the
appropriate management practices that should be done to conserve the fish species (Oso et
al., 2013).

9
2.7 Feeding Habit
Scientific knowledge on food and feeding habits of fish is an important condition
for increasing fish production. Studies of the fish diet based on analysis of stomach content
are very useful to indicate the production and ecological role of fish population (Windell &
Bowen, 1978). Food and feeding habits of the fish vary with time of the day, with the
environmental condition and with different food substances present in the water body.
2.8 Fisheries Activity
Fish and fisheries are very important resources. In 2001, it was reported that about
95 million tonnes of fish production was harvested. Aquaculture fisheries contributed about
35 million tonnes. A total of 93 million tonnes were used directly as food, which is
contributing about 15% of our protein supply.
10
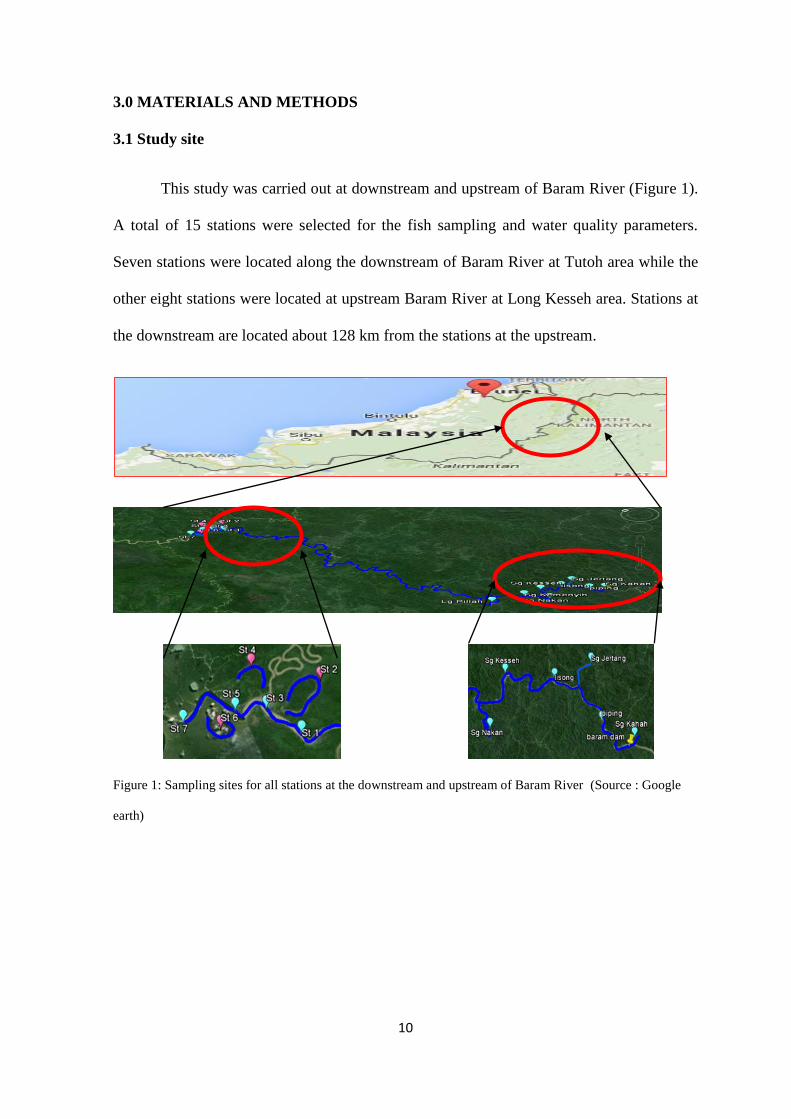
3.0 MATERIALS AND METHODS
3.1 Study site
This study was carried out at downstream and upstream of Baram River (Figure 1).
A total of 15 stations were selected for the fish sampling and water quality parameters.
Seven stations were located along the downstream of Baram River at Tutoh area while the
other eight stations were located at upstream Baram River at Long Kesseh area. Stations at
the downstream are located about 128 km from the stations at the upstream.
Figure 1: Sampling sites for all stations at the downstream and upstream of Baram River (Source : Google
earth)

11
The coordinates for each sampling station was marked using Global Positioning Systems
(GPS) (Garmin, GPSmap 62s) and shown in Table 1.
Table 1: Coordinates of the sampling stations at downstream and upstream Baram River.
Locations Station Name of Sampling Site Coordinates
Downstream D1
D2
D3
D4
D5
D6
D7
Batang Baram
Loagan Baru
Sungai Tutoh
Loagan Tebaboi
Batang Baram
Loagan Pungok
Batang Baram
N 04° 00’ 39.5’’
E 114° 24’ 39.2’’
N 04° 00’ 54.8’’
E 114° 26’ 25.8’’
N 04° 01’ 57.4’’
E 114° 25’ 04.2’’
N 04° 02’ 04.3’’
E 114° 24’ 49.1’’
N 04° 02’ 04.3’’
E 114° 24’ 49.1’’
N 04° 00’ 56.4’’
E 114° 23’ 32.8’’
N 04° 01’ 19.1’’
E 114° 23’ 29.7’’
Upstream
U1
U2
U3
U4
U5
U6
U7
U8
Sungai Nakan
Sungai Kemenyih
Sungai Kesseh
Sungai Lisong
Sungai Jertang
Sungai Piping
Sungai Kelimau
Sungai Kahah
N 04° 01’ 19.1’’
E 114° 23’ 29.7’’
N 04° 01’ 19.1’’
E 114° 23’ 29.7’’
N 03° 27’ 22.2’’
E 114° 30’ 39.5’’
N 03° 26’ 25.9’’
E 114° 31’ 58.2’’
N 03° 26’ 21.5’’
E 114° 32’ 17.2’’
N 03° 24’ 46.1’’
E 114° 33’ 29.6’’
N 03° 23’ 49.0’’
E 114° 33’ 16.
N 03° 23’ 49.0’’
E 114° 33’ 16.2’’

12
3.2 Fish Species Identification
The specimens was collected and enumerated according to species during the field
sampling. The samples were identified at the sampling site and some of the samples were
identified in the Aquatic Vertebrate laboratory. Fish specimens was identified up to species
using keys suggested by Mohsin and Ambak (1983), Roberts (1989), Kotellat et al. (1993),
Inger and Chin (2002), and Tan (2006).
3.3 Fish Measurement
The standard length, total length and weight of each individual fish caught were
recorded. The standard length and total length were measured using digimatic caliper
(Mitutoyo, CD-12’’ CP), plastic ruler and measuring board (Wildeo Model no.118). The
total length is the measurement from the anterior-most of the head to the end of caudal fin
while standard length of the fish was measured from mouth to the caudal peduncle. The
body weight of the fish was weighed by using analytical balance (SHIMADZU, ELB 200)
with 2 decimal places and SHIMADZU, BL-220H (220 g) with 3 decimal places.
3.3.1 Length-weight Relationship
The length-weight relationship can be expressed by the formula (Schneider et al., 2000)
W= aLb
Where, W= weight of fish (g), L= length of fish (cm), a= constant and b= an exponential
expressing relationship between length-weight. ‘b’ indicates the allometry of the fish
where:
b = 3 (normal growth rate)
b > 3 (positive allometry)
b < 3 (negative allometry)

13
LogW= Log a + b Log L
Where b represents the slope of the line and Log a is constant.
The coefficient of condition factor (K) indicates that the higher the value of K, the better
the condition of the fish.
K = 100W/ L3
W = Total weight of fish (g)
L = Total length of fish (cm)
100 = Factor to bring the value of K near unity
3.3.2 Hepatosomatic Indices (HSI)
The Heptosomatic index was calculated using the formula below:
Weight of liver (g)
Body weight (g)
3.4 Fish Preservation
Specimens were fixed in 10% formalin before being brought back to the laboratory.
The fish was washed before being stored in 70% ethanol for long term preservation and
further identifications. For small fishes (up to 15 cm), the samples were placed in bottle
sample with 10 % formalin and ensure that the entire fin were fully expanded to make it
easier to count the number of fin-rays (Arrignon, 1999). For large specimen, the abdomen
of the fish was injected with concentrated formalin. Data such as date of sampling,
location, station number, and type of net was labeled on the sample bottles.
X 100% = HSI