Embed Size (px)
Citation preview

Fish Community Assessment of Junction Creek 2004
By
Emily S. Lemieux and John M. Gunn, Cooperative Freshwater Ecology Unit and
Jennifer Sheardown, Junction Creek Stewardship Committee
October, 2004
- i -
ABSTRACT A fish community assessment was conducted in the headwater area of Junction Creek (north of Kelly Lake) during the summer of 2004. This was a qualitative survey, using electrofishing at sites greater than one metre deep and baited minnow traps at sites less than one metre deep to describe the species occurrence and distribution throughout the 23 km of the main branch of the creek that extends from the Garson Mine to Kelly Lake. The survey of the main branch was also preceded by a rapid assessment of fish species in the more inaccessible areas of the four tributaries (Frood, Nolin, Maley, and Copper Cliff Creek). In overall design, the 2004 study was very similar to a study conducted by the Cooperative Freshwater Ecology Unit in 1993 (Sein 1993). In addition to fish data, fish habitat measurements were taken and stream water samples were collected monthly. A total of 5881 fish from a total of 14 species were captured, including three new species (brassy minnow (Hybognathus hankinsoni), golden shiner (Notemigonus crysoleucas), and yellow perch (Perca flavescens)) never before caught in Junction Creek. Two brook trout (Salvelinus fontinalis) from the public stocking projects were also captured; a very encouraging finding. Creek chub (Semotilus atromoculatus) and brook stickleback (Culaea inconstans) were the most common species in 2004 (53.7% and 15.2% respectively). In addition to the brook trout presence and the species richness increase for the native species, the most significant changes since 1993 were the expansion of the area containing fish to include the reaches from Brady Street to Martindale Road (below Nolin discharge) (2.2 km in length) and up the Frood Branch to the Lasalle crossing (approximately 1.5 km in length). This expansion in the area occupied by fish appears to track the observed water quality improvements in these areas. Although this study clearly shows that Junction Creek is showing signs of recovery, many environmental problems remain and a great deal of effort is needed to achieve further restoration of the stream.

- ii -
ACKNOWLEDGEMENTS This project would not have been possible without advice and assistance of Ed Snucins and Christine Brereton of the Cooperative Freshwater Ecology Unit. Thanks to the Department of Fisheries and Oceans, Sudbury District, for providing all electrofishing equipment for the duration of field activities. Thanks to Kevin Shaughnessy for developing the first version of the fish identification key. This version was subsequently modified and improved by Emily Lemieux with the consultation of Erling Holm of the Royal Ontario Museum. All preliminary data for the tributary areas were collected by Sarah Woods, Kelly Lippert, and Allison Lickley of the Cooperative Freshwater Ecology Unit. Sarah Woods also provided much appreciated input throughout the planning of the project. Thanks to Cam Portt and Monique Dube for advice regarding project planning. The assistance of Carrie Regenstreif of the Junction Creek Stewardship Committee is greatly appreciated. Thanks are extended to Cristina Greco, Elizabeth Bamberger, Bill Keller, Tom Johnston, Glen Watson, Wendy Wisniewski, Carrie Regenstreif, and Cam Portt for review of the draft of this report. All maps were produced by Guy Gionet and altered by Cristina Greco. Funding for this project was provided by INCO Ltd. and by Fisheries and Oceans Canada.

- iii -
TABLE OF CONTENTS ABSTRACT........................................................................................................................I
ACKNOWLEDGEMENTS ............................................................................................ II
TABLE OF CONTENTS ...............................................................................................III
LIST OF FIGURES ........................................................................................................ IV
LIST OF TABLES ........................................................................................................... V
LIST OF APPENDICES ................................................................................................VI
1.0 INTRODUCTION..................................................................................................... 1
2.0 METHODS ................................................................................................................ 2
2.1 PHYSICAL PARAMETERS .......................................................................................... 2
2.2 FISH INVENTORY...................................................................................................... 5
2.2.1 Development of Fish Identification Key......................................................... 5 2.2.2 Reconnaissance Surveys of Tributaries .......................................................... 5
2.2.2.1 Electrofishing Survey of Tributaries....................................................... 6 2.2.3 Fish Assessment of the Mainstem of Junction Creek ..................................... 7
2.3 WATER QUALITY SURVEY ....................................................................................... 7
2.4 DATA MANAGEMENT............................................................................................... 9
3.0 RESULTS .................................................................................................................. 9
3.1 PHYSICAL HABITAT ............................................................................................... 10
3.2 FISH INVENTORY.................................................................................................... 16
3.2.1 Reconnaissance Surveys of Tributaries ........................................................ 16 3.2.1.1 Electrofishing Survey of Tributaries..................................................... 16
3.2.2 Fish Assessment of the Mainstem of Junction Creek ................................... 17 3.2.2.1 Problems with Reach 14 ....................................................................... 20
3.3 CHEMICAL PARAMETERS ....................................................................................... 20
4.0 RECOMMENDATIONS........................................................................................ 24
5.0 REFERENCES........................................................................................................ 25
- iv -
LIST OF FIGURES
Figure 2.1. The upper Junction Creek watershed, showing the surrounding watersheds. ..............2
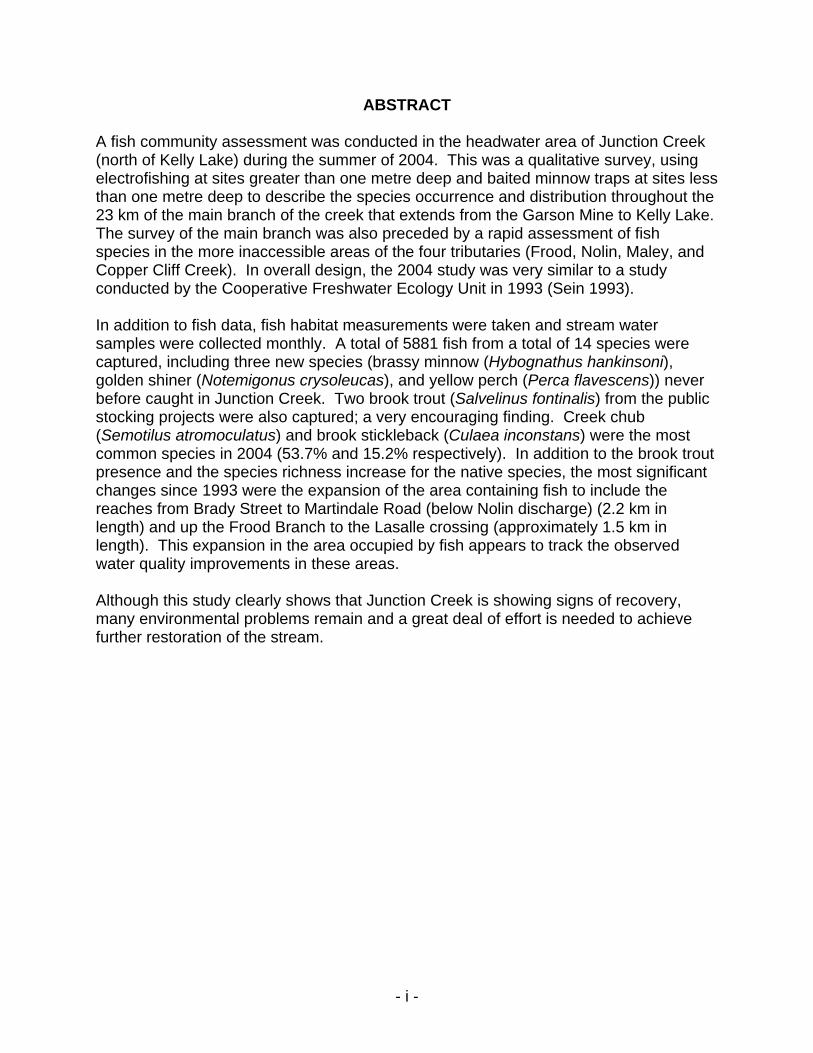
Figure 2.2. Numbered reaches of Junction Creek used for data analysis. ......................................3
Figure 2.3. Locations of the seven water sampling sites on Junction Creek. .................................9
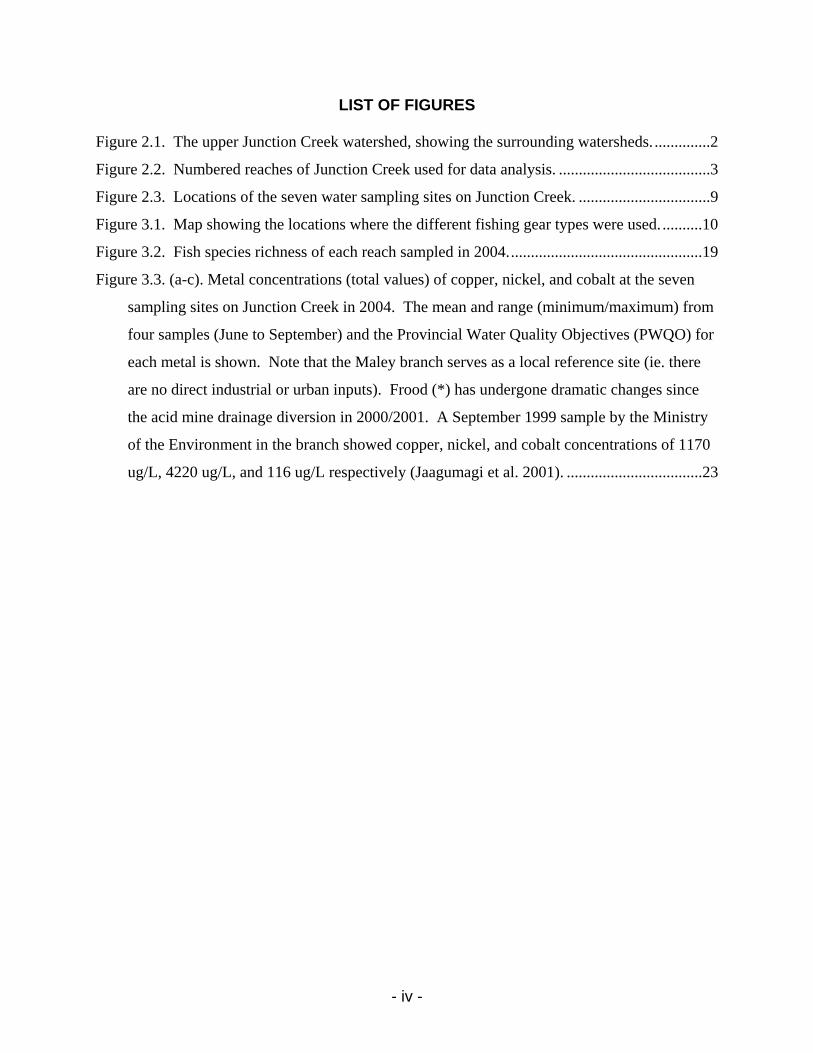
Figure 3.1. Map showing the locations where the different fishing gear types were used. ..........10
Figure 3.2. Fish species richness of each reach sampled in 2004.................................................19
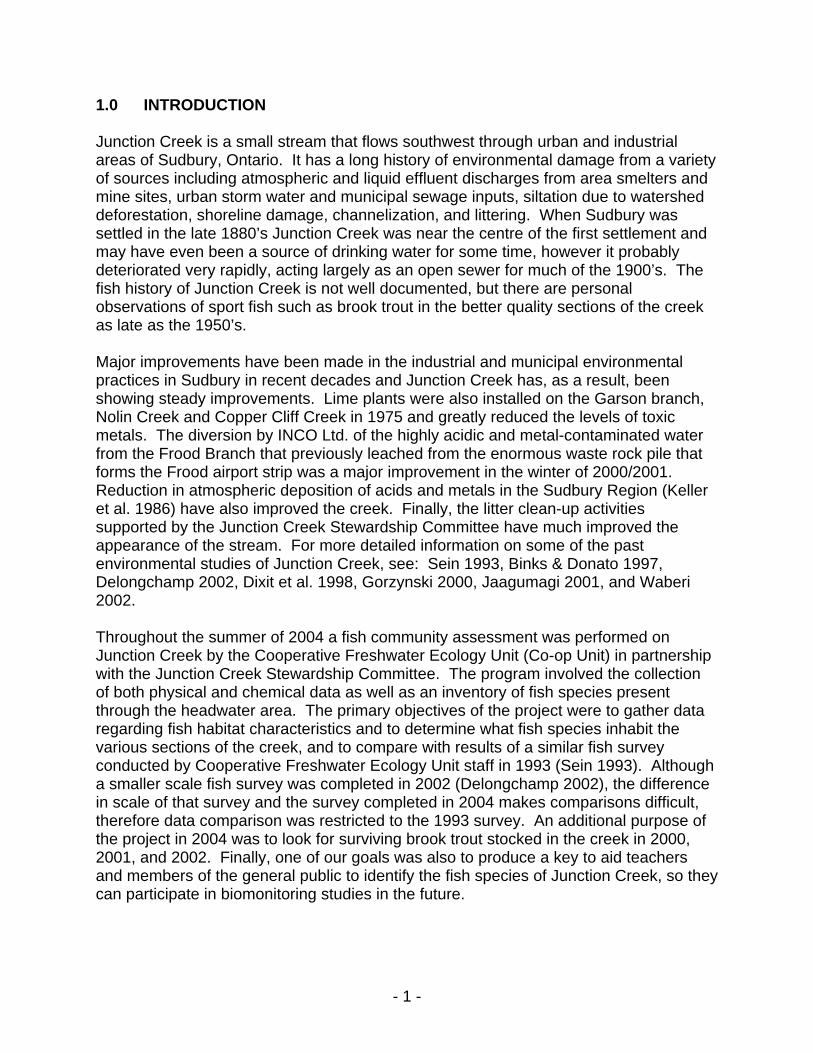
Figure 3.3. (a-c). Metal concentrations (total values) of copper, nickel, and cobalt at the seven
sampling sites on Junction Creek in 2004. The mean and range (minimum/maximum) from
four samples (June to September) and the Provincial Water Quality Objectives (PWQO) for
each metal is shown. Note that the Maley branch serves as a local reference site (ie. there
are no direct industrial or urban inputs). Frood (*) has undergone dramatic changes since
the acid mine drainage diversion in 2000/2001. A September 1999 sample by the Ministry
of the Environment in the branch showed copper, nickel, and cobalt concentrations of 1170
ug/L, 4220 ug/L, and 116 ug/L respectively (Jaagumagi et al. 2001). ..................................23

- v -
LIST OF TABLES
Table 2.1. Description of study reaches listed in order from upstream to downstream (1 to 16)...4
Table 2.2. Description of tributaries to Junction Creek. .................................................................6
Table 2.3. Water sampling site locations. .......................................................................................8
Table 3.1. Description of the physical habitat found in each study reach listed in order from
upstream to downstream (1 to 16). ........................................................................................12
Table 3.2. Fish species captured by minnow trap and gill net during preliminary sampling of the
four Junction Creek tributaries: Maley branch, Frood branch, Nolin Creek, and Copper Cliff
Creek. .....................................................................................................................................16
Table 3.3. Numbers of various fish species captured by electrofishing in the Maley and Frood
tributaries downstream of dams. ............................................................................................17
Table 3.4. Relative abundance of fish species captured in Junction Creek in 2004 (all gear types
and sampling sites combined)................................................................................................18
Table 3.5. Fish species captured in reaches of Junction Creek in 2004 (all gear types
combined)… ..........................................................................................................................18
Table 3.6. Lengths and weights of brook trout captured in Junction Creek in 2004. ...................19
Table 3.7. Water chemistry for Junction Creek and its tributaries 2004. Mean and range
(minimum – maximum) for selected parameters shown for the four monthly samples (June
7, July 5, August 3, September 1, 2004).*.............................................................................21

- vi -
LIST OF APPENDICES
Appendix 1. Junction Creek field guide. .................................................................................28
Appendix 2. Photo documentation of fish habitat in Junction Creek. .....................................47
Appendix 3. Photo documentation of brook trout habitat in Junction Creek. .........................53
Appendix 4. Total catch in numbers for 2004 and 1993 for each gear used. ..........................55
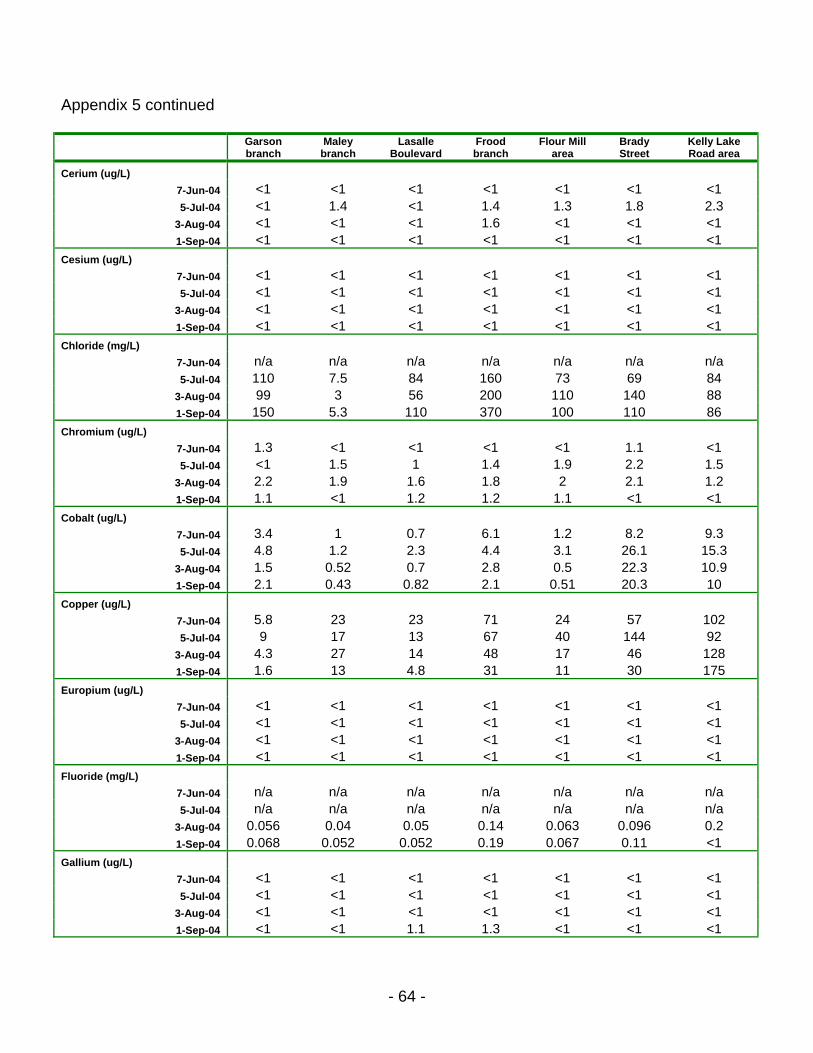
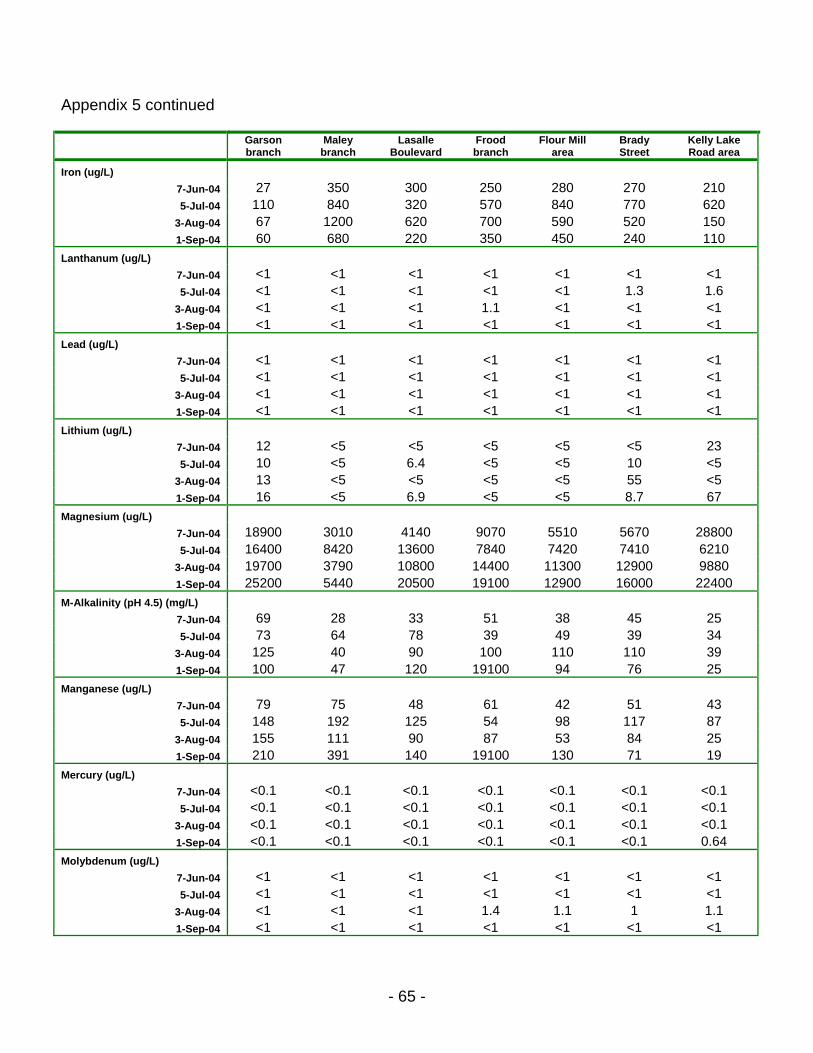
Appendix 5. Water chemistry parameters collected from seven sites on Junction Creek and its
tributaries in 2004. ...........................................................................................................63
- 1 -
1.0 INTRODUCTION
Junction Creek is a small stream that flows southwest through urban and industrial areas of Sudbury, Ontario. It has a long history of environmental damage from a variety of sources including atmospheric and liquid effluent discharges from area smelters and mine sites, urban storm water and municipal sewage inputs, siltation due to watershed deforestation, shoreline damage, channelization, and littering. When Sudbury was settled in the late 1880’s Junction Creek was near the centre of the first settlement and may have even been a source of drinking water for some time, however it probably deteriorated very rapidly, acting largely as an open sewer for much of the 1900’s. The fish history of Junction Creek is not well documented, but there are personal observations of sport fish such as brook trout in the better quality sections of the creek as late as the 1950’s. Major improvements have been made in the industrial and municipal environmental practices in Sudbury in recent decades and Junction Creek has, as a result, been showing steady improvements. Lime plants were also installed on the Garson branch, Nolin Creek and Copper Cliff Creek in 1975 and greatly reduced the levels of toxic metals. The diversion by INCO Ltd. of the highly acidic and metal-contaminated water from the Frood Branch that previously leached from the enormous waste rock pile that forms the Frood airport strip was a major improvement in the winter of 2000/2001. Reduction in atmospheric deposition of acids and metals in the Sudbury Region (Keller et al. 1986) have also improved the creek. Finally, the litter clean-up activities supported by the Junction Creek Stewardship Committee have much improved the appearance of the stream. For more detailed information on some of the past environmental studies of Junction Creek, see: Sein 1993, Binks & Donato 1997, Delongchamp 2002, Dixit et al. 1998, Gorzynski 2000, Jaagumagi 2001, and Waberi 2002. Throughout the summer of 2004 a fish community assessment was performed on Junction Creek by the Cooperative Freshwater Ecology Unit (Co-op Unit) in partnership with the Junction Creek Stewardship Committee. The program involved the collection of both physical and chemical data as well as an inventory of fish species present through the headwater area. The primary objectives of the project were to gather data regarding fish habitat characteristics and to determine what fish species inhabit the various sections of the creek, and to compare with results of a similar fish survey conducted by Cooperative Freshwater Ecology Unit staff in 1993 (Sein 1993). Although a smaller scale fish survey was completed in 2002 (Delongchamp 2002), the difference in scale of that survey and the survey completed in 2004 makes comparisons difficult, therefore data comparison was restricted to the 1993 survey. An additional purpose of the project in 2004 was to look for surviving brook trout stocked in the creek in 2000, 2001, and 2002. Finally, one of our goals was also to produce a key to aid teachers and members of the general public to identify the fish species of Junction Creek, so they can participate in biomonitoring studies in the future.

- 2 -
2.0 METHODS
The 2004 Junction Creek fish community survey began at the headwaters of the Garson Branch and continued downstream to Kelly Lake, a total of 23 km (Figure 2.1). Field sampling activities took place on the mainstem of Junction Creek, beginning at Garson Mine, between June 14, 2004 and August 9, 2004. All electrofishing was completed between June 14 and 30, 2004, and habitat measurements and minnow trapping were completed from July 5 to 16, 2004 and August 3 to 9, 2004. A final check on fish presence in the urban area below Brady Street was conducted on September 1, 2004. Preliminary fish surveys were also conducted on the Maley, Frood, and Nolin branches and on Copper Cliff Creek prior to conducting the main community survey (Figure 2.1). These preliminary surveys in the tributaries focused on areas above the barrier dams (Copper Cliff, Maley, Frood) or above the buried sections of the creek (Nolin).
Figure 2.1. The upper Junction Creek watershed, showing the surrounding
watersheds. 2.1 Physical Parameters Fish habitat characteristics were documented every 100m, with sites numbered starting from the headwaters of the Garson branch and increasing in number to Kelly Lake (23
- 3 -
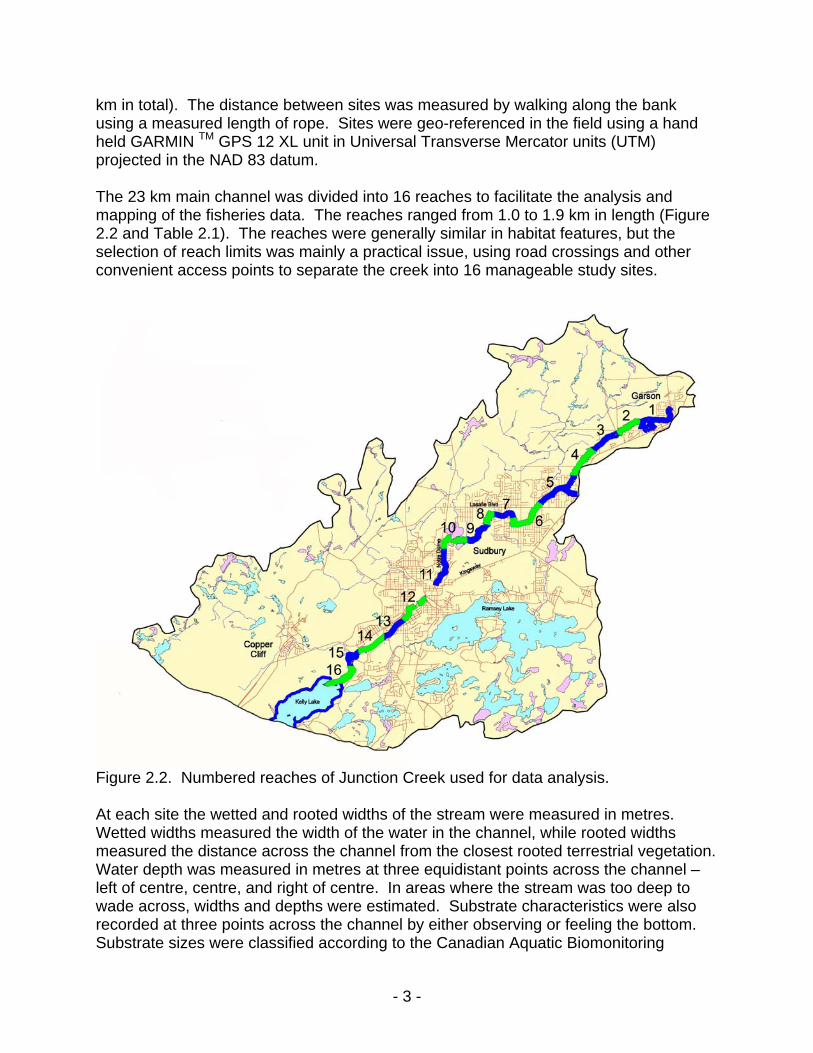
km in total). The distance between sites was measured by walking along the bank using a measured length of rope. Sites were geo-referenced in the field using a hand held GARMIN TM GPS 12 XL unit in Universal Transverse Mercator units (UTM) projected in the NAD 83 datum. The 23 km main channel was divided into 16 reaches to facilitate the analysis and mapping of the fisheries data. The reaches ranged from 1.0 to 1.9 km in length (Figure 2.2 and Table 2.1). The reaches were generally similar in habitat features, but the selection of reach limits was mainly a practical issue, using road crossings and other convenient access points to separate the creek into 16 manageable study sites.
Figure 2.2. Numbered reaches of Junction Creek used for data analysis. At each site the wetted and rooted widths of the stream were measured in metres. Wetted widths measured the width of the water in the channel, while rooted widths measured the distance across the channel from the closest rooted terrestrial vegetation. Water depth was measured in metres at three equidistant points across the channel – left of centre, centre, and right of centre. In areas where the stream was too deep to wade across, widths and depths were estimated. Substrate characteristics were also recorded at three points across the channel by either observing or feeling the bottom. Substrate sizes were classified according to the Canadian Aquatic Biomonitoring
- 4 -
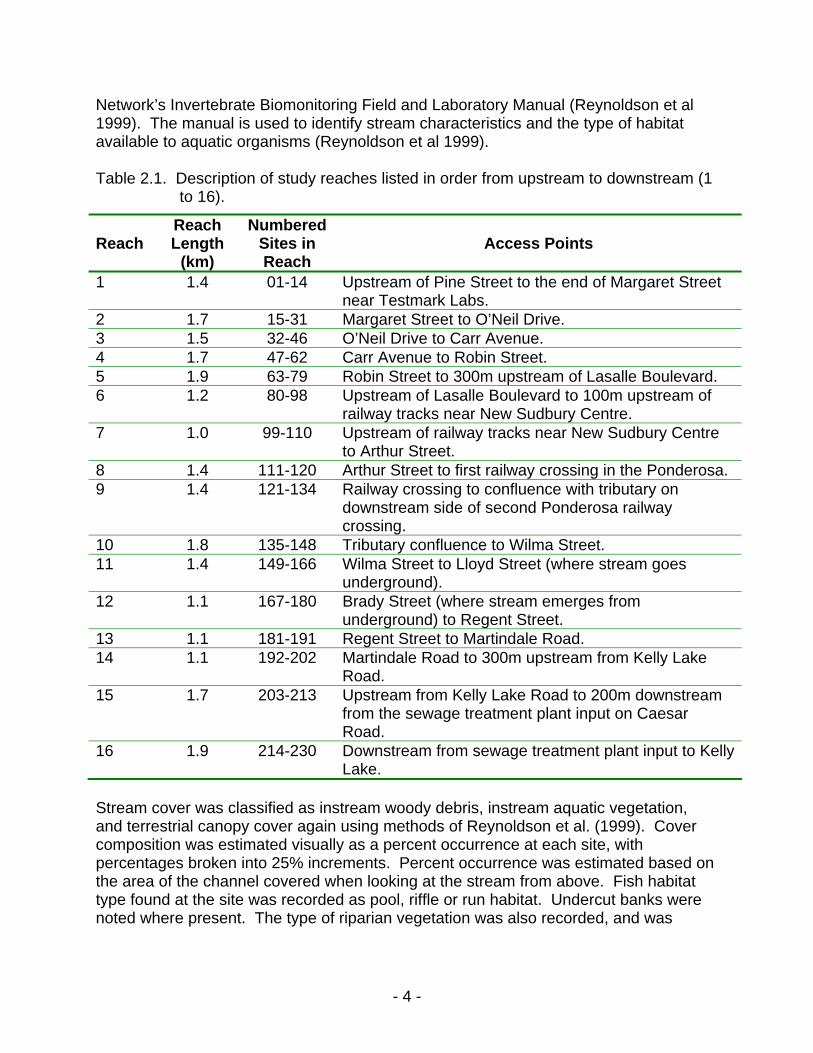
Network’s Invertebrate Biomonitoring Field and Laboratory Manual (Reynoldson et al 1999). The manual is used to identify stream characteristics and the type of habitat available to aquatic organisms (Reynoldson et al 1999). Table 2.1. Description of study reaches listed in order from upstream to downstream (1
to 16).
Reach Reach Length
(km)
NumberedSites in Reach
Access Points
1 1.4 01-14 Upstream of Pine Street to the end of Margaret Street near Testmark Labs.
2 1.7 15-31 Margaret Street to O’Neil Drive. 3 1.5 32-46 O’Neil Drive to Carr Avenue. 4 1.7 47-62 Carr Avenue to Robin Street. 5 1.9 63-79 Robin Street to 300m upstream of Lasalle Boulevard. 6 1.2 80-98 Upstream of Lasalle Boulevard to 100m upstream of
railway tracks near New Sudbury Centre. 7 1.0 99-110 Upstream of railway tracks near New Sudbury Centre
to Arthur Street. 8 1.4 111-120 Arthur Street to first railway crossing in the Ponderosa. 9 1.4 121-134 Railway crossing to confluence with tributary on
downstream side of second Ponderosa railway crossing.
10 1.8 135-148 Tributary confluence to Wilma Street. 11 1.4 149-166 Wilma Street to Lloyd Street (where stream goes
underground). 12 1.1 167-180 Brady Street (where stream emerges from
underground) to Regent Street. 13 1.1 181-191 Regent Street to Martindale Road. 14 1.1 192-202 Martindale Road to 300m upstream from Kelly Lake
Road. 15 1.7 203-213 Upstream from Kelly Lake Road to 200m downstream
from the sewage treatment plant input on Caesar Road.
16 1.9 214-230 Downstream from sewage treatment plant input to Kelly Lake.
Stream cover was classified as instream woody debris, instream aquatic vegetation, and terrestrial canopy cover again using methods of Reynoldson et al. (1999). Cover composition was estimated visually as a percent occurrence at each site, with percentages broken into 25% increments. Percent occurrence was estimated based on the area of the channel covered when looking at the stream from above. Fish habitat type found at the site was recorded as pool, riffle or run habitat. Undercut banks were noted where present. The type of riparian vegetation was also recorded, and was
- 5 -
classified as coniferous, deciduous, shrubs, or grasses (or any combination of these vegetation types). Photos were taken at each site to show and record typical habitat found in that area. Images were captured using an Olympus D380 digital camera. Water temperature (oC) was measured using a YSI Model 63 meter at all sites. Conductivity (micromhos/cm) readings were also taken when necessary for electrofishing purposes. 2.2 Fish Inventory 2.2.1 Development of Fish Identification Key A preliminary key for use in identification of species known from the 1993 survey (Sein 1993) was first developed by Kevin Shaunessey and then modified by Emily Lemieux. It was based on characteristics described by Scott and Crossman (1973) and followed procedures taught at the Royal Ontario Museum fish identification course held in Dorset May 18-20, 2004 and attended by Emily Lemieux. The completed key is attached as Appendix 1. 2.2.2 Reconnaissance Surveys of Tributaries Preliminary surveys were completed on all major tributaries of Junction Creek before field work began on the mainstem (Table 2.2). With the exception of Nolin Creek, surveys were completed upstream of dams on the tributaries to determine what fish species could potentially colonize downstream areas of Junction Creek. Nolin Creek was surveyed above the site where the water goes underground to join Junction Creek in the underground section near Tom Davies’ Square. The Maley branch was surveyed upstream from the Maley Dam from May 11 to 21, 2004 using wire mesh minnow traps baited with dry dog food and nordic-style gill nets. Additional branches (Frood branch, Nolin Creek, and Copper Cliff Creek) were sampled between May 26, 2004 and June 1, 2004 using minnow traps and visual observations.

- 6 -
Table 2.2. Description of tributaries to Junction Creek.
Tributary Description Garson branch The Garson branch begins at the Garson Mine, where a
lime plant is used to treat the water. It also experiences seasonal inputs from a sewage lagoon in the area and may receive added nutrients from the Cedar Green golf course. There are more groundwater sources in this branch than in any other tributary to Junction Creek which explains why the water temperatures are usually cooler.
Maley branch The Maley branch extends well north of Junction Creek and serves as a reference for this study. It is the only tributary to Junction Creek that does not receive direct mine discharges, but experiences similar atmospheric effects and Sudbury type soils. A second golf course, Timberwolf, is also located in this area.
Frood branch The Frood branch has historically received vast amounts of acid mine drainage from the Frood airport waste rock pile. The diversion that occurred in 2000/2001 greatly reduced the acid mine drainage problem. The Frood area is now the main reclamation site for the Junction Creek Steering Committee, with tree planting and land reclamation activities having taken place.
Nolin Creek Nolin Creek is composed of drainage from mines and slag piles along Highway 144. A lime plant is used to treat the water before it enters the mainstem of Junction Creek. Nolin Creek flows through the Little Britain area, then flows underground, meeting Junction Creek below Civic Square.
Copper Cliff Creek Copper Cliff Creek receives tailings drainage as well as liquid effluent from the Copper Cliff smelter and from the sewage treatment plant in Copper Cliff operated by Inco Ltd. Liming occurs before the water flows into a settling pond and then into Junction Creek, just above the point of discharge of the Sudbury sewage treatment plant.
2.2.2.1 Electrofishing Survey of Tributaries In addition to the minnow trapping and visual observations in the headwater areas, the lower sections of the Frood and Maley tributaries were also sampled using an electrofisher. The Frood tributary was electrofished from downstream of Mae Street to McLean Park on June 23, 2004. The Maley branch was electrofished June 21, 2004 from the confluence with Junction Creek at the Twin Forks playground, up to the crossing on Maley Drive.
- 7 -
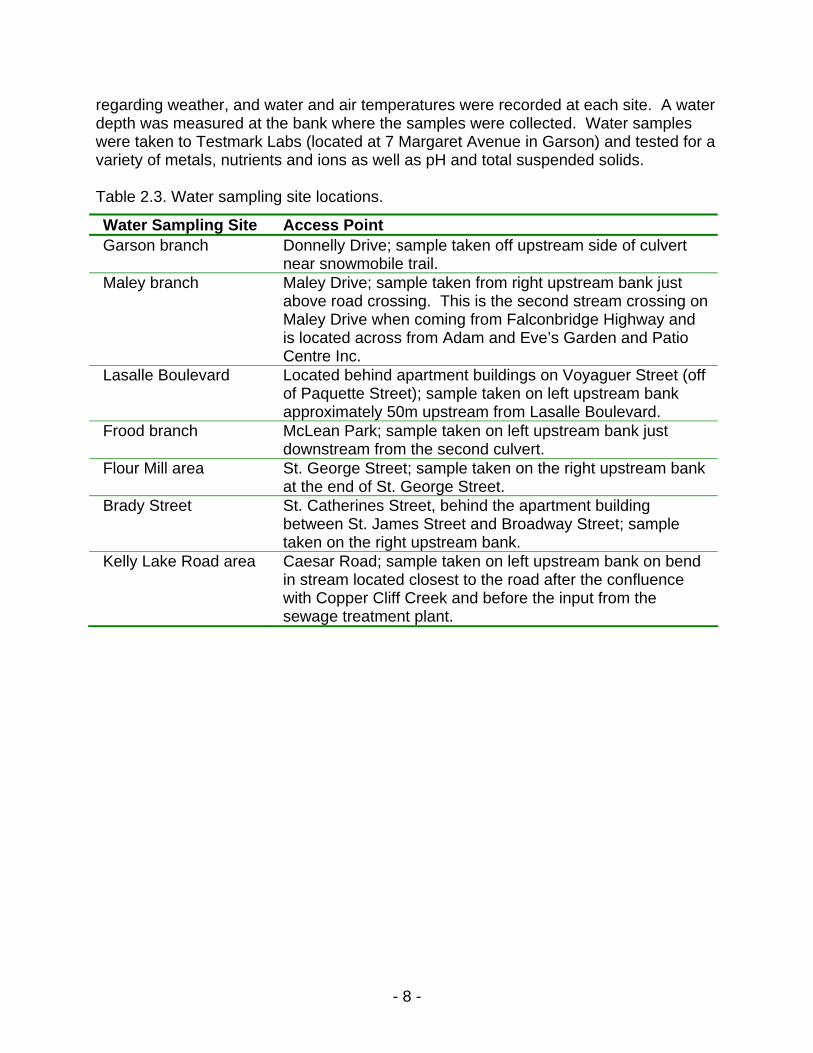
2.2.3 Fish Assessment of the Mainstem of Junction Creek The primary method used for fish collection for the 23 km mainstem was backpack electrofishing using a Smith Root Type XIIB unit with pulsed direct current. Electrofisher settings (voltage, hertz, and milliseconds) were adjusted at each site according to the water conductivity, as well as substrate type and water temperature. Electrofishing was conducted moving upstream with a two-person crew; one person electrofishing, and the second person dip netting the fish. Electricity was applied to the stream in an on/off manner rather than using continuous output, which allowed for more effective fishing. Non-sport fish were collected in a bucket and returned to the stream as soon as possible. This method reduced holding time on the fish as well as the associated stress. When water depths exceeded one metre electrofishing was not possible. Instead wire mesh minnow traps were used to capture fish. Traps were baited with dry dog food and set every 100m with set durations of approximately two hours. Trap sites were selected based on the typical habitat available at each site. Trap locations were recorded using a GPS. Most fish caught in the traps were identified and returned to the stream, however, subsamples of species were collected, preserved in 10% formalin and returned to the lab for identification under the microscope. Selected specimens (voucher specimens) were preserved in 70% ethanol and form a reference collection for the stream. In one large beaver pond area with excessive depth, a nordic-style multi-mesh gill net was set for approximately two hours. A minimum water depth of 1.5m was necessary in order to use the gill net. In large, shallow ponds, minnow traps were set along the banks. Brook trout caught in Junction Creek were sacrificed so that accurate lengths and weights could be measured, sex and maturity determined, and otoliths removed for aging purposes. Otolith and scale samples were sent to Ontario Ministry of Natural Resources labs to be aged; results are expected sometime in the spring of 2005. Brook trout, and the habitat in which they were found, were also documented with photos. 2.3 Water Quality Survey Monthly water samples were taken at seven locations on Junction Creek by the Junction Creek Stewardship Committee (Table 2.3 and Figure 2.3). Sample bottles and a cooler were provided by Testmark Inc., and were picked up the night before sampling was to occur. Grab samples were taken using a pole with a bottle attached to the end, allowing safe collection of water from the stream bank. Before the water samples were collected, the bottle on the sampling pole was rinsed with stream water three times to remove any contaminants. Three different bottles were filled at each site, each rinsed three times prior to filling. All samples were taken on the upstream side of the road crossing to rule out the road as a possible contamination source. Notes were taken
- 8 -
regarding weather, and water and air temperatures were recorded at each site. A water depth was measured at the bank where the samples were collected. Water samples were taken to Testmark Labs (located at 7 Margaret Avenue in Garson) and tested for a variety of metals, nutrients and ions as well as pH and total suspended solids. Table 2.3. Water sampling site locations.
Water Sampling Site Access Point Garson branch Donnelly Drive; sample taken off upstream side of culvert
near snowmobile trail. Maley branch Maley Drive; sample taken from right upstream bank just
above road crossing. This is the second stream crossing on Maley Drive when coming from Falconbridge Highway and is located across from Adam and Eve’s Garden and Patio Centre Inc.
Lasalle Boulevard Located behind apartment buildings on Voyaguer Street (off of Paquette Street); sample taken on left upstream bank approximately 50m upstream from Lasalle Boulevard.
Frood branch McLean Park; sample taken on left upstream bank just downstream from the second culvert.
Flour Mill area St. George Street; sample taken on the right upstream bank at the end of St. George Street.
Brady Street St. Catherines Street, behind the apartment building between St. James Street and Broadway Street; sample taken on the right upstream bank.
Kelly Lake Road area Caesar Road; sample taken on left upstream bank on bend in stream located closest to the road after the confluence with Copper Cliff Creek and before the input from the sewage treatment plant.

- 9 -
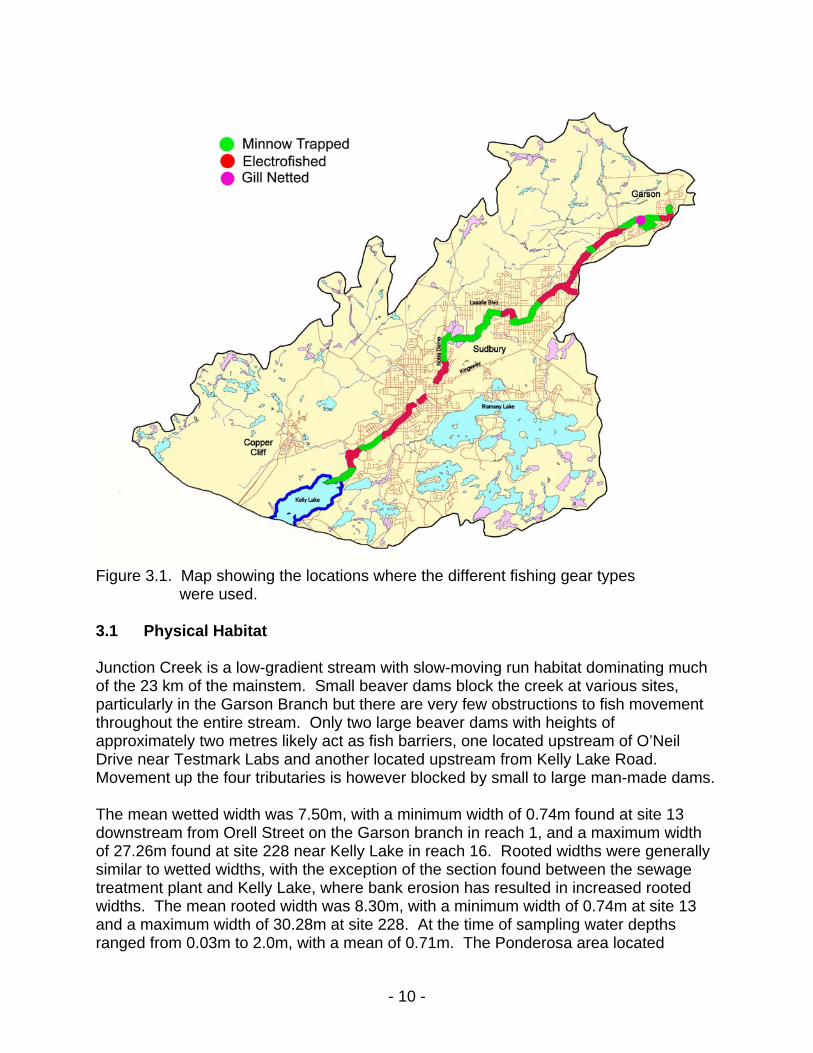
Figure 2.3. Locations of the seven water sampling sites on Junction Creek. 2.4 Data Management All data were recorded on standard field sheets for habitat parameters and minnow trapping data, electrofishing data, and fish sampling data and later entered into a Microsoft Excel spreadsheet. Data are archived at the Cooperative Freshwater Ecology Unit (located at 1222 Ramsey Lake Road). 3.0 RESULTS A total of 230 habitat sites, or 23 km of stream, were assessed. A total of 10.7 km (46.5%) was electrofished (Figure 3.1). One hundred twenty-three minnow traps were set, sampling a total distance of 12.2 km (53.0%). At one location two minnow traps were set in an attempt to sample ponded areas on either side of a road crossing. Gill netting was used only once, sampling only 0.1km (0.4%).
- 10 -
Figure 3.1. Map showing the locations where the different fishing gear types
were used. 3.1 Physical Habitat Junction Creek is a low-gradient stream with slow-moving run habitat dominating much of the 23 km of the mainstem. Small beaver dams block the creek at various sites, particularly in the Garson Branch but there are very few obstructions to fish movement throughout the entire stream. Only two large beaver dams with heights of approximately two metres likely act as fish barriers, one located upstream of O’Neil Drive near Testmark Labs and another located upstream from Kelly Lake Road. Movement up the four tributaries is however blocked by small to large man-made dams. The mean wetted width was 7.50m, with a minimum width of 0.74m found at site 13 downstream from Orell Street on the Garson branch in reach 1, and a maximum width of 27.26m found at site 228 near Kelly Lake in reach 16. Rooted widths were generally similar to wetted widths, with the exception of the section found between the sewage treatment plant and Kelly Lake, where bank erosion has resulted in increased rooted widths. The mean rooted width was 8.30m, with a minimum width of 0.74m at site 13 and a maximum width of 30.28m at site 228. At the time of sampling water depths ranged from 0.03m to 2.0m, with a mean of 0.71m. The Ponderosa area located
- 11 -
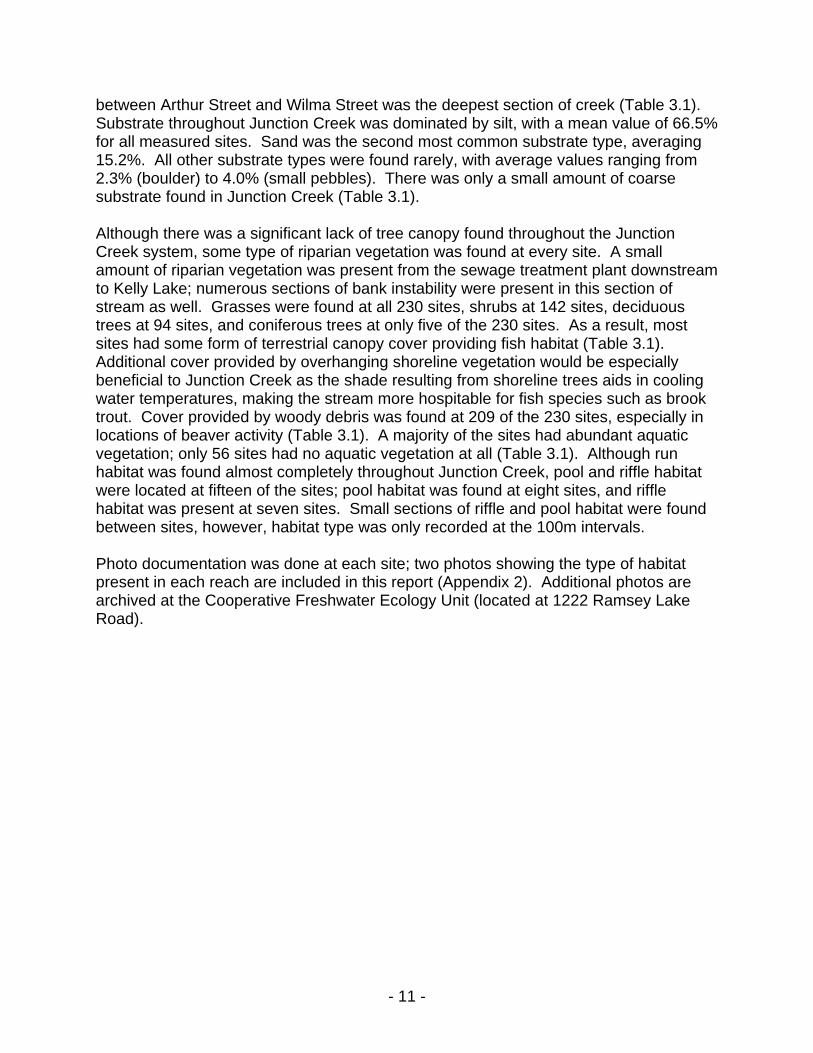
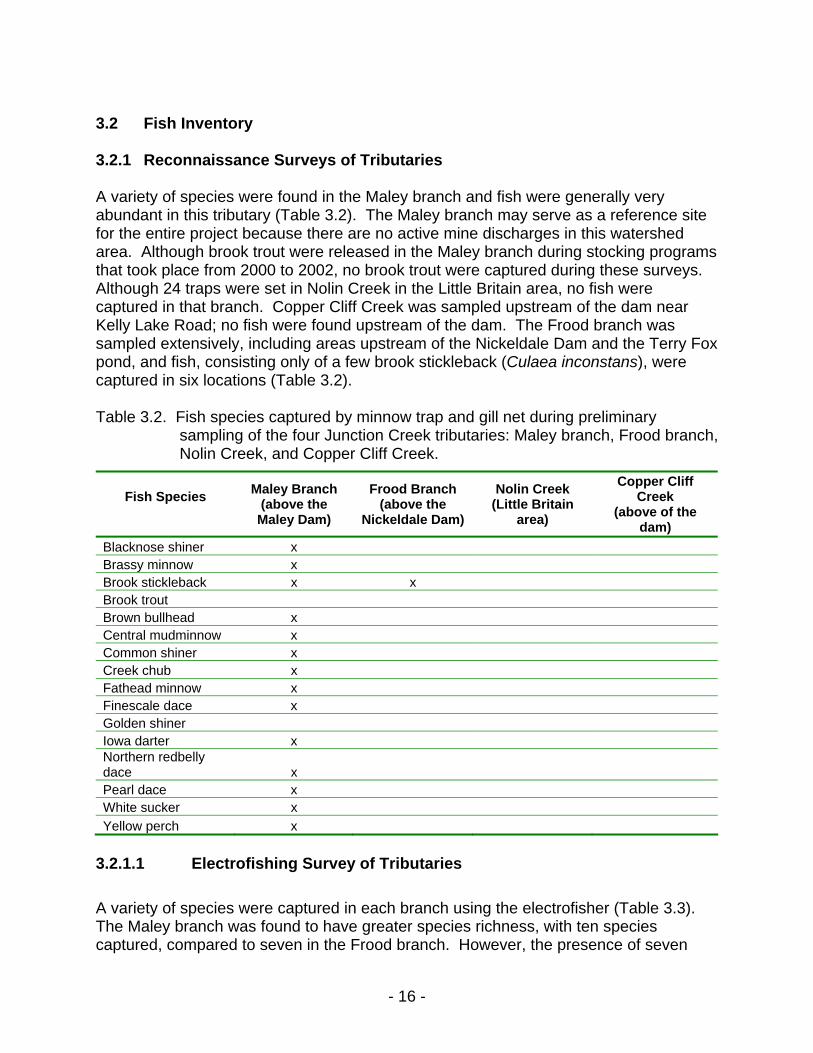
between Arthur Street and Wilma Street was the deepest section of creek (Table 3.1). Substrate throughout Junction Creek was dominated by silt, with a mean value of 66.5% for all measured sites. Sand was the second most common substrate type, averaging 15.2%. All other substrate types were found rarely, with average values ranging from 2.3% (boulder) to 4.0% (small pebbles). There was only a small amount of coarse substrate found in Junction Creek (Table 3.1). Although there was a significant lack of tree canopy found throughout the Junction Creek system, some type of riparian vegetation was found at every site. A small amount of riparian vegetation was present from the sewage treatment plant downstream to Kelly Lake; numerous sections of bank instability were present in this section of stream as well. Grasses were found at all 230 sites, shrubs at 142 sites, deciduous trees at 94 sites, and coniferous trees at only five of the 230 sites. As a result, most sites had some form of terrestrial canopy cover providing fish habitat (Table 3.1). Additional cover provided by overhanging shoreline vegetation would be especially beneficial to Junction Creek as the shade resulting from shoreline trees aids in cooling water temperatures, making the stream more hospitable for fish species such as brook trout. Cover provided by woody debris was found at 209 of the 230 sites, especially in locations of beaver activity (Table 3.1). A majority of the sites had abundant aquatic vegetation; only 56 sites had no aquatic vegetation at all (Table 3.1). Although run habitat was found almost completely throughout Junction Creek, pool and riffle habitat were located at fifteen of the sites; pool habitat was found at eight sites, and riffle habitat was present at seven sites. Small sections of riffle and pool habitat were found between sites, however, habitat type was only recorded at the 100m intervals. Photo documentation was done at each site; two photos showing the type of habitat present in each reach are included in this report (Appendix 2). Additional photos are archived at the Cooperative Freshwater Ecology Unit (located at 1222 Ramsey Lake Road).

- 12 -
Table 3.1. Description of the physical habitat found in each study reach listed in order from upstream to downstream (1 to 16).
Reach Physical Habitat Description
Mean Wetted Width
(m)
Mean Rooted Width
(m)
Mean Water Depth
(m)
Mean Woody Debris
Coverage (%)
Mean Aquatic
Vegetation Coverage
(%)
Mean Terrestrial
Canopy Coverage
(%)
1
Habitat varies from a cattail marsh downstream of Pine St. to a small channel downstream of Central Lane. Substrate is dominated by silt, sand, and gravel.
1.50 1.59 0.29 0-25 0-25 0-25
2
Many beaver ponds are present; where a channel is present, it flows through an old pond area and has many undercut banks. Substrate consists mostly of silt, with occasional boulders present.
2.19 2.25 0.49 25-50 50-75 0-25
3
Riparian vegetation varies from grasses near O’Neil Dr. to forested area near Donnelly Dr. Abundant aquatic vegetation is present, and banks are undercut in some areas. Silt and sand are the dominant substrate types, although all other substrate sizes are found in small amounts.
2.26 2.65 0.30 0-25 25-50 0-25
4
A beaver pond is found at Carr Ave., followed by a flooded, marshy area downstream to Alice St. A defined channel is found downstream to Robin St. Abundant cover is present in the form of undercut banks, woody debris, and aquatic vegetation.
2.67 2.62 0.50 25-50 50-75 0-25

- 13 -
Table 3.1 continued
Reach Physical Habitat Description
Mean Wetted Width
(m)
Mean Rooted Width
(m)
Mean Water Depth
(m)
Mean Woody Debris
Coverage (%)
Mean Aquatic
Vegetation Coverage
(%)
Mean Terrestrial
Canopy Coverage
(%)
5
Habitat varies from a wide and deep channel with grassy banks to a small channel in a forested area near Twin Forks playground. Substrate consists of mostly silt and sand, but also a variety of substrate sizes ranging from small pebbles to gravel.
3.27 3.36 0.57 0-25 0-25 25-50
6
There is little variety in habitat in this reach. The channel is wide and deep, and although some terrestrial canopy cover is present, cover is not abundant. Silt and sand are the dominant substrate types, although there are also some areas with boulder and large cobble.
6.07 6.58 1.06 0-25 0-25 0-25
7
A wide and deep channel is found in this reach, with abundant aquatic vegetation in some areas. Substrate is dominated by silt and sand.
5.85 6.68 0.62 0-25 25-50 0-25
8
A small amount of adequate fish habitat is found in this reach. The channel is wide and deep, with some aquatic vegetation and little canopy cover available. Substrate consists of silt, boulder, and gravel.
5.88 6.07 1.13 0-25 0-25 0
- 14 -
Table 3.1 continued
Reach Physical Habitat Description
Mean Wetted Width
(m)
Mean Rooted Width
(m)
Mean Water Depth
(m)
Mean Woody Debris
Coverage (%)
Mean Aquatic
Vegetation Coverage
(%)
Mean Terrestrial
Canopy Coverage
(%)
9
This reach is much the same as Reach 8, with little available cover providing fish habitat. The channel is wide and deep, with substrate consisting of silt.
6.02 6.10 1.35 0-25 0-25 0
10
A wide and deep channel is present in this reach as well, however some cover is provided by terrestrial canopy and aquatic vegetation. Substrate is dominated by silt.
5.15 5.31 1.19 0-25 0-25 0-25
11
Terrestrial canopy cover is found throughout this reach, and cover is also provided by aquatic vegetation. Silt and sand are the dominant substrate types, although a variety of larger substrate sizes are also found, ranging from large pebble to boulder.
7.17 7.72 0.52 0-25 25-50 25-50
12
Although canopy cover is present throughout this reach, there is little instream cover available in the form of woody debris or aquatic vegetation. Substrate is heavily dominated by sand, although a variety of all substrate types can be found.
7.71 9.30 0.39 0-25 0-25 0-25

- 15 -
Table 3.1 continued
Reach Physical Habitat Description
Mean Wetted Width
(m)
Mean Rooted Width
(m)
Mean Water Depth
(m)
Mean Woody Debris
Coverage (%)
Mean Aquatic
Vegetation Coverage
(%)
Mean Terrestrial
Canopy Coverage
(%)
13
This reach runs through a forested area and has consistent canopy cover. The channel is wide, but generally shallow. Substrate is similar to Reach 12, with an abundance of sand, as well as a variety of other substrate sizes.
7.15 8.62 0.39 0-25 0-25 0-25
14
The channel is wide and deep in this reach, with signs of old beaver activity. Terrestrial canopy and woody debris provide cover. Substrate consists of silt and sand.
7.57 8.75 1.00 0-25 0-25 0-25
15
A large beaver dam is present at the upstream end of this reach. Aquatic vegetation is found in the area directly downstream from the sewage treatment plant. Substrate in this reach is dominated by silt, but also consists of sand and a variety of substrate sizes ranging from gravel to small pebbles.
11.22 13.74 0.49 0-25 0-25 0-25
16
A small amount of adequate fish habitat is present in much of this reach, however there is abundant aquatic vegetation found close to Kelly Lake. The banks are unstable, and a very small amount of riparian vegetation is found.
13.27 16.97 1.06 0-25 50-75 0
- 16 -
3.2 Fish Inventory 3.2.1 Reconnaissance Surveys of Tributaries A variety of species were found in the Maley branch and fish were generally very abundant in this tributary (Table 3.2). The Maley branch may serve as a reference site for the entire project because there are no active mine discharges in this watershed area. Although brook trout were released in the Maley branch during stocking programs that took place from 2000 to 2002, no brook trout were captured during these surveys. Although 24 traps were set in Nolin Creek in the Little Britain area, no fish were captured in that branch. Copper Cliff Creek was sampled upstream of the dam near Kelly Lake Road; no fish were found upstream of the dam. The Frood branch was sampled extensively, including areas upstream of the Nickeldale Dam and the Terry Fox pond, and fish, consisting only of a few brook stickleback (Culaea inconstans), were captured in six locations (Table 3.2). Table 3.2. Fish species captured by minnow trap and gill net during preliminary
sampling of the four Junction Creek tributaries: Maley branch, Frood branch, Nolin Creek, and Copper Cliff Creek.
Fish Species
Maley Branch (above the
Maley Dam)
Frood Branch (above the
Nickeldale Dam)
Nolin Creek (Little Britain
area)
Copper Cliff Creek
(above of the dam)
Blacknose shiner x Brassy minnow x Brook stickleback x x Brook trout Brown bullhead x Central mudminnow x Common shiner x Creek chub x Fathead minnow x Finescale dace x Golden shiner Iowa darter x Northern redbelly dace x Pearl dace x White sucker x Yellow perch x
3.2.1.1 Electrofishing Survey of Tributaries A variety of species were captured in each branch using the electrofisher (Table 3.3). The Maley branch was found to have greater species richness, with ten species captured, compared to seven in the Frood branch. However, the presence of seven
- 17 -
species including relatively sensitive species like fathead minnow (Eaton 1973, Matuszek, et al. 1988, Playle et al. 1993, Welsh et al. 1996) is quite remarkable at this site given the extreme contamination levels present prior to the diversion (Waberi 2002, Jaagumagi et al. 2001). Table 3.3. Numbers of various fish species captured by electrofishing in the Maley and
Frood tributaries downstream of dams.
Fish Species Maley Branch Frood Branch Blacknose shiner 0 0 Brassy minnow 0 0 Brook stickleback 2 10 Brook trout 0 0 Brown bullhead 82 15 Central mudminnow 24 28 Common shiner 27 0 Creek chub 135 236 Fathead minnow 4 13 Finescale dace 0 0 Golden shiner 0 0 Iowa darter 64 118 Northern redbelly dace 6 4 Pearl dace 19 0 White sucker 6 0 Yellow perch 0 0 Total 369 424
3.2.2 Fish Assessment of the Mainstem of Junction Creek A total of 14 species and 5881 individuals were captured (Table 3.4). The most abundant species was creek chub (Semotilus atromaculatus), with a total of 3159 individuals caught comprising 53.7% of the total catch. The least abundant species found were brook trout, brassy minnow, and golden shiner, each with only two individuals captured. The most prevalent species (species found at the most reaches) was the fathead minnow (Pimephales promelas), found in 15 of the 16 reaches of stream, or 93.8% of reaches. The brook trout was the least prevalent species, found in only one reach, or 6.3% of reaches. Although finescale dace (Phoxinus neogaeus) and blacknose shiner (Notropis heterolepis) were reported in the Maley branch during preliminary surveys, voucher samples for identification were not collected and neither species was found in Junction Creek during the community survey. These species are therefore considered unconfirmed at this time. Most reaches contained a wide variety of species (Table 3.5). The richest fish communities were found in reach 4, with 12 species in total, and reach 7, with 9 species (Figure 3.2). Reach 14 had the least number of species, with only one species found. The greatest number of individuals was found in reach 6, with 943 individuals in total. Reach 14 had the least number of individuals, with only one fish caught in the reach.
- 18 -
Table 3.4. Relative abundance of fish species captured in Junction Creek in 2004 (all gear types and sampling sites combined).
Species Taxa Number of Fish Captured
Percent of Total Catch
Brassy minnow Hybognathus hankinsoni 2 0.03Brook stickleback Culaea inconstans 892 15.20Brook trout Salvelinus fontinalis 2 0.03Brown bullhead Ameiurus nebulosus 120 2.10Central mudminnow Umbra limi 288 4.90Common shiner Luxilus cornutus 434 7.40Creek chub Semotilus atromaculatus 3159 53.70Fathead minnow Pimephales promelas 119 2.00Golden shiner Notemigonus crysoleucas 2 0.03Iowa darter Etheostoma exile 299 5.10Northern redbelly dace Phoxinus eos 266 4.50Pearl dace Margariscus margarita 46 0.78White sucker Catostomus commersoni 223 3.80Yellow perch Perca flavescens 29 0.49Total 5881 100
Table 3.5. Fish species captured in reaches of Junction Creek in 2004 (all gear types
combined).
Reach Fish species 1 2 3 4 5 6 7 8 9 10 11 12 13 14 15 16
Brassy minnow 1 0 0 1 0 0 0 0 0 0 0 0 0 0 0 0 Brook stickleback 112 397 201 141 13 2 7 2 0 5 0 6 3 1 0 2 Brook trout 0 0 0 2 0 0 0 0 0 0 0 0 0 0 0 0 Brown bullhead 4 0 2 5 65 23 14 0 0 1 0 5 0 0 1 0 Central mudminnow 4 1 3 44 28 0 54 0 0 0 26 57 54 0 17 0 Common shiner 1 11 163 7 6 174 16 5 27 16 5 0 0 0 0 0 Creek chub 128 39 278 407 253 725 344 220 23 232 373 95 40 0 2 0 Fathead minnow 18 3 14 13 6 1 13 18 5 8 15 1 2 0 1 1 Golden shiner 0 0 0 0 1 0 0 0 0 1 82 0 0 0 0 0 Iowa darter 1 0 2 18 42 0 54 2 0 0 0 46 25 0 27 0 Northern redbelly dace 134 105 4 7 3 3 5 1 0 3 0 0 1 0 0 0 Pearl dace 0 5 12 17 2 7 0 0 1 0 0 2 0 0 0 0 White sucker 10 0 1 33 25 8 17 0 0 4 14 26 19 0 41 25Yellow perch 0 0 0 0 0 0 0 0 0 2 1 0 1 0 0 25Total 413 561 680 695 444 943 524 248 56 272 516 238 145 1 89 53

- 19 -
02468
101214
1 2 3 4 5 6 7 8 9 10 11 12 13 14 15 16
Reach
Num
ber
of S
peci
es
Figure 3.2. Fish species richness of each reach sampled in 2004. Two brook trout were captured downstream from Maley Drive on the Garson branch in reach 4, on June 15, 2004. Both fish were brought back to the Co-op Unit so that otoliths could be taken, and these samples will be used to determine the ages of the fish. Results regarding the ages of these fish are expected in the spring of 2005. Lengths and weights of the two brook trout were also measured (Table 3.6). Photo documentation of the fish as well as the habitat used by the brook trout is provided in Appendix 3. Table 3.6. Lengths and weights of brook trout captured in Junction Creek in 2004.
Fish Number Fork Length Total Length Weight 1 272mm 285mm 270g 2 194mm 200mm 100g
When compared to the data collected in 1993, the 2004 data show both a greater species richness and a greater number of individual fish captured (Sein 1993) (Appendix 4). Brassy minnow, golden shiner, and yellow perch were not captured in the 1993 survey (Sein 1993), although yellow perch were captured in 2002 (Delongchamp 2002). Creek chub was the most abundant species in both surveys, although fathead minnow was the most prevalent species in 2004 whereas creek chub was the most prevalent in 1993 (Sein 1993). Data collected by Sein (1993) show that the Ponderosa area had both the richest and most abundant fish communities, however in 2004 the richest fish communities were found downstream of Maley Drive and in the upstream half of the Ponderosa area, and the most abundant fish community was found from upstream of Lasalle Boulevard to downstream of Barry Downe Road. In 1993 no fish were caught downstream of Brady Street to the Kelly Lake Road area, likely because of the poor water quality of Nolin Creek (Sein 1993). In 2004 fish were caught

- 20 -
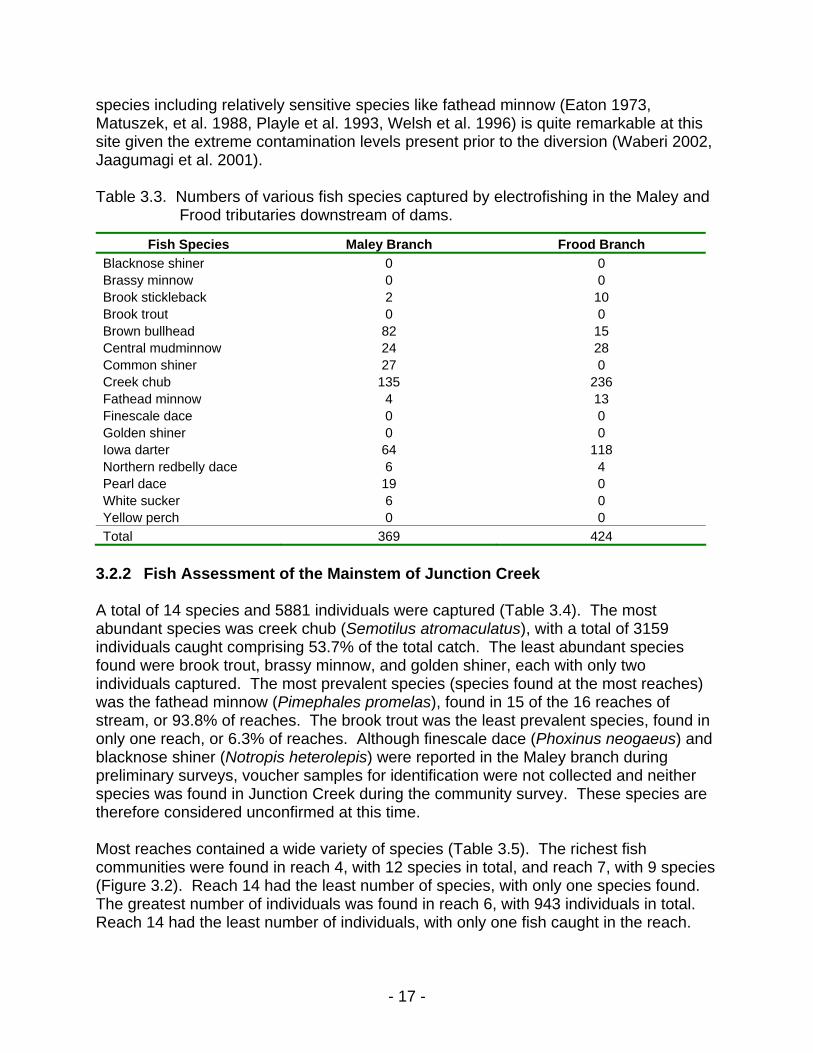
downstream of Brady Street, with the only area lacking fish located downstream of Martindale Road. 3.2.2.1 Problems with Reach 14 Only reach 14, the area located below Martindale Road, stands out as having much lower species richness than any other reach sampled in 2004. Physical habitat in this reach appeared to be reasonably good relative to other adjoining reaches of Junction Creek. It was therefore surprising not to catch fish in this reach. Further samples may be required to explain this absence. To begin this process we returned to this site on September 1, 2004 with nine minnow traps. We also collected two extra water samples, one above Martindale Road and one below Martindale Road downstream approximately 30m from a discharge pipe found at the road crossing. Water chemistry showed little difference between the upstream and downstream samples. Although nickel and zinc levels appeared to be elevated slightly in the downstream sample, this may be within the sampling error at this site. We also caught fish downstream of Martindale Road, although fish were not found in any abundance. Seven creek chub were caught in five traps set downstream of the road crossing. 3.3 Chemical Parameters Water samples were collected at seven locations along Junction Creek during the first week of each month. Although the Junction Creek Stewardship Committee will continue collecting monthly water samples throughout the year, only data from June through September were available for this report (Table 3.7). The water quality data showed many expected trends. First, metals such as copper, nickel and cobalt were elevated at all sites, even the reference sites of the Maley Branch, and were often above Provincial Water Quality Objectives (Figure 3.3). However, the fact that sensitive species such as fathead minnow exist at many of the same sites supports the suggestions of Jaagumagi et al. (2001) that metals are probably complexed with organics and not in particularly toxic forms. Reporting total metal concentrations may therefore be somewhat misleading.

- 21 -
Table 3.7. Water chemistry for Junction Creek and its tributaries 2004. Mean and range (minimum – maximum) for selected parameters shown for the four monthly samples (June 7, July 5, August 3, September 1, 2004).*
Chemical Parameter Garson
branch Maley
branch Lasalle
Boulevard Frood branch
Flour Mill area Brady Street Kelly Lake
Road area Aluminum mean 17.4 206.8 114.8 159.7 246 271.5 204.8 (ug/L) range 4.1 - 44 27 - 663 31 - 241 41 - 421 36 - 761 25 - 823 18 - 632 Arsenic mean 2.1 2.5 2.5 1.9 2.1 1.9 2.2 (ug/L) range 1.8 – 2.5 1.7 - 3.8 1.8 - 3.5 1.5 - 2.2 1.8 - 2.8 1.4 - 2.3 1.6 - 3.6 Cadmium mean n/a** n/a** n/a** 0.37 n/a** 0.31 0.29 (ug/L) range <0.1 - 0.2 <0.1 - 0.15 <0.1 - 0.18 0.2 - 0.48 <0.1 - 0.18 0.13 - 0.6 0.14 - 0.39 Calcium mean 232.8 15.2 91.8 38.5 30.1 62.4 360.8 (mg/L) range 193.0 – 290.0 8.5 – 25.5 17.9 – 147.0 22.8 – 56.6 28.0 – 66.7 37.6 – 112 115.0 – 600 Chloride mean 115.9 5.26 80 227.5 93.6 105.9 86 (mg/L) range 99 - 150 3.0 - 7.5 56 - 110 160 - 370 73 - 110 69 - 140 84 - 88 Cobalt mean 2.9 0.8 1.1 3.8 1.3 19.3 11.4 (ug/L) range 1.5 - 4.8 0.43 - 1.2 0.7 - 2.3 2.1 - 6.1 0.5 - 3.1 8.2 - 26.1 9.3 - 15.3 Copper mean 5.2 20.0 13.7 54.3 23 69.2 124.2 (ug/L) range 1.6 - 9.0 13 - 27 4.8 - 23 31 - 71 11 - 40 30 - 144 92 - 175 Iron mean 66 767.5 365.0 467.5 540 450 272.5 (ug/L) range 27-110 350 - 1200 220 - 620 250 - 700 280 - 840 240 - 770 110 - 620 Magnesium mean 20.0 5.2 12.3 12.6 9.3 10.5 16.8 (mg/L) range 16.4 – 25.2 3.0 – 8.4 4.1 – 20.5 7.8 – 19.1 5.5 – 12.9 5.7 – 16 6.2 – 28.8 M-Alkalinity (pH 4.5) mean 91.8 44.8 80.3 71.7 72.8 67.5 30.8 (mg/L) range 69 - 125 28 - 64 33 - 120 39 - 100 38 - 110 39 - 110 25 - 39 Manganese mean 148.0 192.3 100.8 61.7 80.7 80.8 43.5 (ug/L) range 79 - 210 75 - 391 48 - 140 45 - 87 42 - 130 51 - 117 19 - 87 Nickel mean 239.0 77.3 118.5 224.8 105.3 502.0 380.7 (ug/L) range 157 - 330 55 - 87 82 - 200 168 - 319 72 - 147 253 - 606 283 - 490 pH mean 7.55 7.25 7.49 7.58 7.36 7.50 7.18 range 7.28 - 7.77 7.0 - 7.43 7.09 - 7.84 7.31 - 7.84 7.04 - 7.86 7.02 - 8.06 6.93 - 7.73 Sodium mean 73.8 4.5 47.1 140.2 55.6 66.7 101.4 (mg/L) range 66.8 – 87.6 3.2 - 6.1 34 – 60.8 91.6 - 206 49 - 61.1 48 - 83.9 71.4 - 125 Strontium mean 945.0 37.0 335.3 127.5 145.7 168.5 545 (ug/L) range 790 - 1300 26 - 48 61 - 510 78 - 200 96 - 210 102 - 280 180 - 920 Total Suspended Solids mean n/a** 30.5 n/a** n/a** n/a** n/a** 16.0 (mg/L) range <3 - 32 5 - 77 <3 - 26 <3 - 14 <3 - 42 <3 - 30 9 - 28 Zinc mean 17.6 10.5 12.0 22.5 13.6 19.8 13.9 (ug/L) range 8.1 - 25 5.9 - 13 6.3 - 22 12 - 33 5.2 - 29 11 - 38 8.6 - 24
*Additional parameters measured included: antimony, barium, boron, beryllium, bismuth, cerium, cesium, chromium, europium, gallium, lanthanum, lead, lithium, mercury, molybdenum, niobium, phosphorus, rubidium, scandium, selenium, silver, thallium, thorium, tin, titanium, tungsten, uranium, vanadium, yttrium, zirconium. **Mean values cannot be calculated due to levels that are less than the traceable amount.

- 22 -
1
10
100
1000
Maley branch(Maley Dr.)
Garson branch(Donnelly Dr.)
Lasalle Boulevard(Paquette St.)
Frood branch(McLean Park)
Flour Mill area (St.George St.)
Brady Street Kelly Lake Roadarea (Caesar St.)
Cu
(ug/
L)
PWQO (5ug/L)
*
Figure 3.3.a of c.
10
100
1000
Maley branch(Maley Dr.)
Garson branch(Donnelly Dr.)
Lasalle Boulevard(Paquette St.)
Frood branch(McLean Park)
Flour Mill area (St.George St.)
Brady Street Kelly Lake Roadarea (Caesar St.)
Ni (
ug/L
)
PWQO(25 ug/L)
*
Figure 3.3.b of c.

- 23 -
0.1
1
10
100
Maley branch(Maley Dr.)
Garson branch(Donnelly Dr.)
Lasalle Boulevard(Paquette St.)
Frood branch(McLean Park)
Flour Mill area (St.George St.)
Brady Street Kelly Lake Roadarea (Caesar St.)
Co
(ug/
L)
*PWQO
(0.4 ug/L)
Figure 3.3.c of c.
Figure 3.3. (a-c). Metal concentrations (total values) of copper, nickel, and cobalt
at the seven sampling sites on Junction Creek in 2004. The mean and range (minimum/maximum) from four samples (June to September) and the Provincial Water Quality Objectives (PWQO) for each metal is shown. Note that the Maley branch serves as a local reference site (ie. there are no direct industrial or urban inputs). Frood (*) has undergone dramatic changes since the acid mine drainage diversion in 2000/2001. A September 1999 sample by the Ministry of the Environment in the branch showed copper, nickel, and cobalt concentrations of 1170 ug/L, 4220 ug/L, and 116 ug/L respectively (Jaagumagi et al. 2001).
Acidity was not an obvious problem, with high pH observed in all months and at all sites (Table 3.7). The effects of the lime additions in the tributaries were very evident, with especially high levels of calcium and magnesium in the Garson Branch and below the Copper Cliff creek input (Table 3.7). The most encouraging finding from the water quality surveys was the dramatic decline in metals in the Frood Branch, from the extreme levels (e.g. copper >1mg/L and nickel >4mg/L) reported prior to the acid mine drainage diversion (Waberi 2002). A complete listing of the available chemical data is provided in Appendix 5.

- 24 -
4.0 RECOMMENDATIONS
1. Additional water quality monitoring sites should be established in order to better identify the sources of pollutants. For example, sites are needed on both Nolin Creek and Copper Cliff Creek before the water from these tributaries mixes with the main creek.
These sites will likely be established during the winter of 2004.
2. Long-term monitoring sites should be established and sampled both seasonally
and annually to observe trends in fish communities within Junction Creek. Replicated methods are needed to better quantify relative abundance, species richness, and perhaps biomass. Good reference sites are also needed.
3. An attempt should be made to assess the upstream and downstream movement
of a few of the key species in the creek to see how much mixing of fish populations actually occurs between reaches and tributaries.
4. Additional attempts should be made to reintroduce a variety of fish species above
the Nickeldale Dam on the Frood branch. 5. A routine stocking program for brook trout in the Maley and Garson branches
should be considered to increase the abundance of a sentinel sport fish species and maintain public interest in the creek.
6. Additional study is needed to better explain the causes of the low abundance of
fish in the lower reaches (Brady Street to Kelly Lake Road) to help design or initiate habitat and/or water quality amelioration efforts.

- 25 -
5.0 REFERENCES Binks, M., and M. Donato. 1997. Evidence of ecosystem rehabilitation in Junction Creek
(Sudbury, ON): temporal changes in limno-chemical parameters and benthic community composition at a series of sampling stations. B.Sc. thesis Biology, Laurentian University.
Delongchamp, T. 2002. 2002 fish survey of Nolin, Frood and Regent branches of
Junction Creek. Cooperative Freshwater Ecology Unit, Ontario Ministry of Natural Resources / Laurentian University, Sudbury, Ontario.
Dixit, A.S., Dixit, S.S., Smol, J.P., and W. Keller. 1998. Paleolimnological study of metal
and nutrient changes in Spanish Harbour, north channel of Lake Huron (Ontario). Journal of Lake and Reservoir Management 14 (4): 428-439.
Eaton, J.G. 1973. Chronic toxicity of copper, cadmium and zinc mixtures to the fathead
minnow (Pimephales promelas Rafinesque). Water Research. 7: 1723-1736. Gorzynski, R. 2000. The temperature effects of urban runoff and in-stream
impoundments on an urban brook trout creek; Junction Creek, Sudbury, Ontario, Canada. B.Sc. thesis Environmental Earth Science, Laurentian University.
Jaaguamagi, R., Smith, E., and D. Bedard. 2001. Junction Creek system (Sudbury)
environmental monitoring study, September 1999. Ontario Ministry of the Environment Report, Sudbury District Office.
Keller, W., Pitblado, J.R., and N.I. Conroy. 1986. Water quality improvements in the
Sudbury, Ontario, Canada area related to reduced smelter emissions. Water, Air, and Soil Pollution 31: 765-774.
Matuszek, J.E., J Goodier, and D.L. Wales. 1998. The occurrence of cyprinids and other
small fish species in relation to pH in Ontario lakes. Ontario Fisheries Acidification Report Series No 88-14. Ontario Ministry of Natural Resources.
Playle, R.C., Dixon, D.G., and K. Burnison. 1993. Copper and cadmium binding to fish
gills: estimates of metal-gill stability constants and modelling of metal accumulation. Canadian Journal of Fisheries and Aquatic Sciences. 50: 2678-2687.
Reynoldson, T.B., Logan, C., Pascoe, T., and S.P. Thompson. 1999. Methods manual:
I. Creation of reference-condition databases for benthic invertebrate community structure. NWRI Report No. 99-211.
Scott, W.B., and E.J. Crossman. 1973. Freshwater fishes of Canada. Fish Res. Board
Canada Bull. 194.

- 26 -
Sein, R. 1993. Physical, chemical and biological assessment of Junction Creek 1993. Cooperative Freshwater Ecology Unit, Aquatic Ecosystems Research Section, Ontario Ministry of Natural Resources / Laurentian University, Sudbury, Ontario.
Waberi, H.A. 2002. The effects of AMD (Acid Mine Drainage) diversion on the chemistry
and biology of Frood-Stobie tributaries, Sudbury, Ontario. B.Sc. thesis Environmental Earth Science, Laurentian University.
Welsh, P.G., Parrott, J.L., Dixon, D.G., Hodson, P.V., Spry, D.J., and G. Mierle. 1996.
Estimating acute copper toxicity to larval fathead minnow (Pimephales promelas) in soft water from measurements of dissolved organic carbon, calcium, and pH. Canadian Journal of Fisheries and Aquatic Sciences. 53: 1263-1271.

- 27 -
Appendices

- 28 -
Appendix 1. Junction Creek field guide.

- 47 -
Appendix 2. Photo documentation of fish habitat in Junction Creek.
Reach 1, Site 08, near Central Lane in Garson.
Reach 2, Site 17, near the ball diamonds on O’Neil Drive in Garson.
Reach 3, Site 33, downstream from O’Neil Drive in Garson.
Reach 1, Site 14, near Testmark Labs in Garson.
Reach 2, Site 27, upstream from O’Neil Drive in Garson.
Reach 3, Site 41, upstream from Donnelly Drive in Garson.

- 48 -
Appendix 2 continued
Reach 4, Site 50, near Cedar Green Golf Course in Garson.
Reach 5, Site 63, downstream from Robin Street.
Reach 6, Site 84, downstream from Lasalle Boulevard.
Reach 4, Site 54, downstream from Matson Street.
Reach 5, Site 74, upstream from Lansing Avenue.
Reach 6, Site 93, upstream from Barry Downe Road.

- 49 -
Appendix 2 continued
Reach 7, Site 103, near New Sudbury Centre.
Reach 8, Site 114, in the Ponderosa area.
Reach 9, Site 123, in the Ponderosa area.
Reach 7, Site 110, upstream from Arthur Street.
Reach 8, Site 119, in the Ponderosa area.
Reach 9, Site 130, in the Ponderosa area.

- 50 -
Appendix 2 continued
Reach 10, Site 137, in Ponderosa area.
Reach 11, Site 158, upstream from Leslie Street.
Reach 12, Site 167, at Brady Street, where creek emerges from underground.
Reach 10, Site 141, in Ponderosa area.
Reach 11, Site 163, downstream from Leslie Street.
Reach 12, Site 175, upstream from Riverside Drive.
- 51 -
Appendix 2 continued
Reach 13, Site 183, upstream from McLeod Street.
Reach 14, Site 195, downstream from Martindale Road.
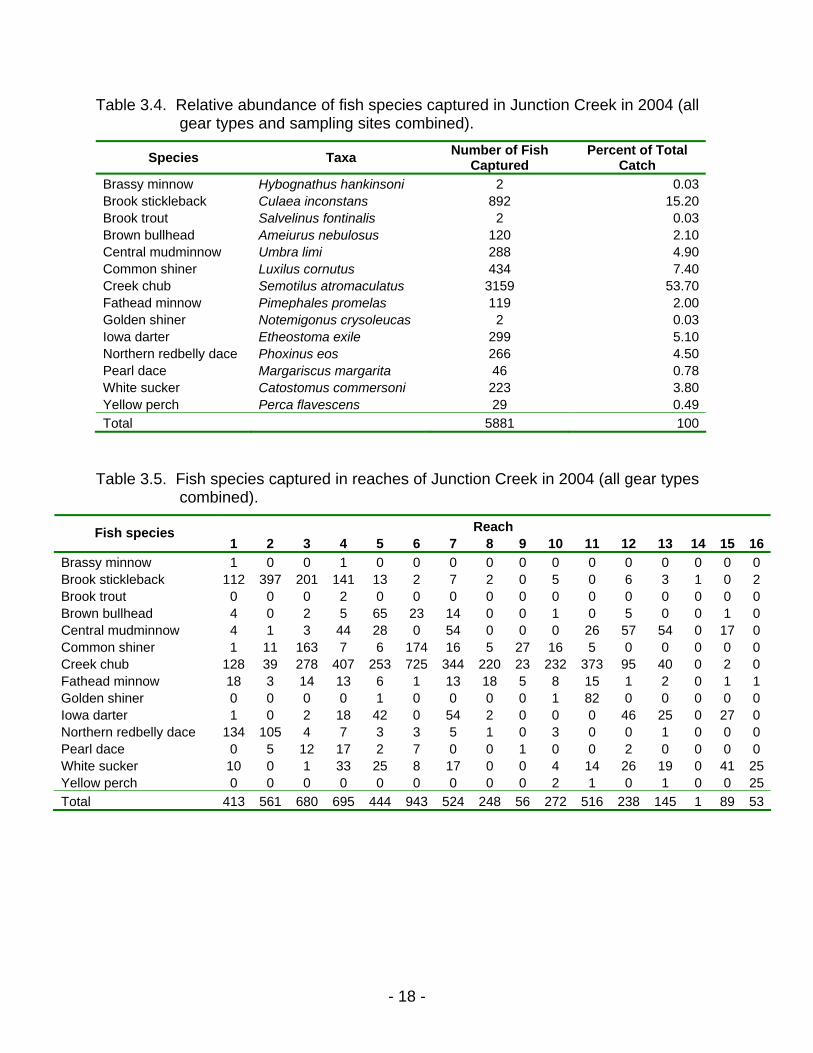
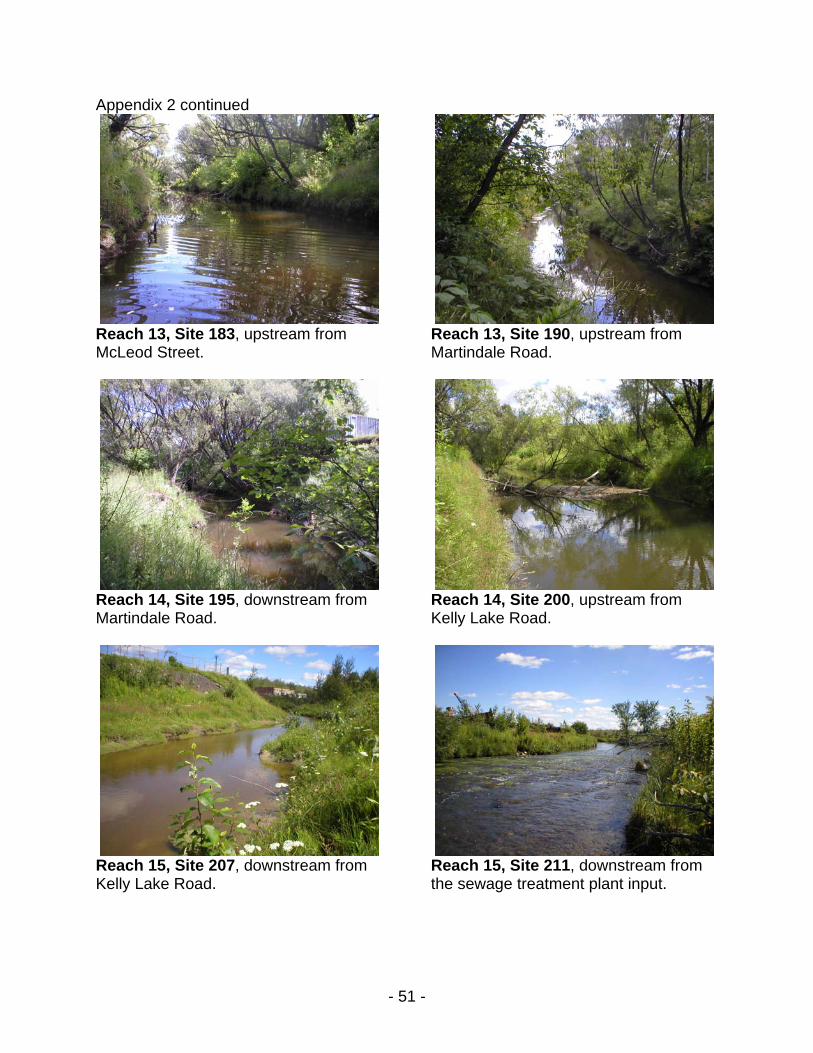
Reach 15, Site 207, downstream from Kelly Lake Road.
Reach 13, Site 190, upstream from Martindale Road.
Reach 14, Site 200, upstream from Kelly Lake Road.
Reach 15, Site 211, downstream from the sewage treatment plant input.
- 52 -
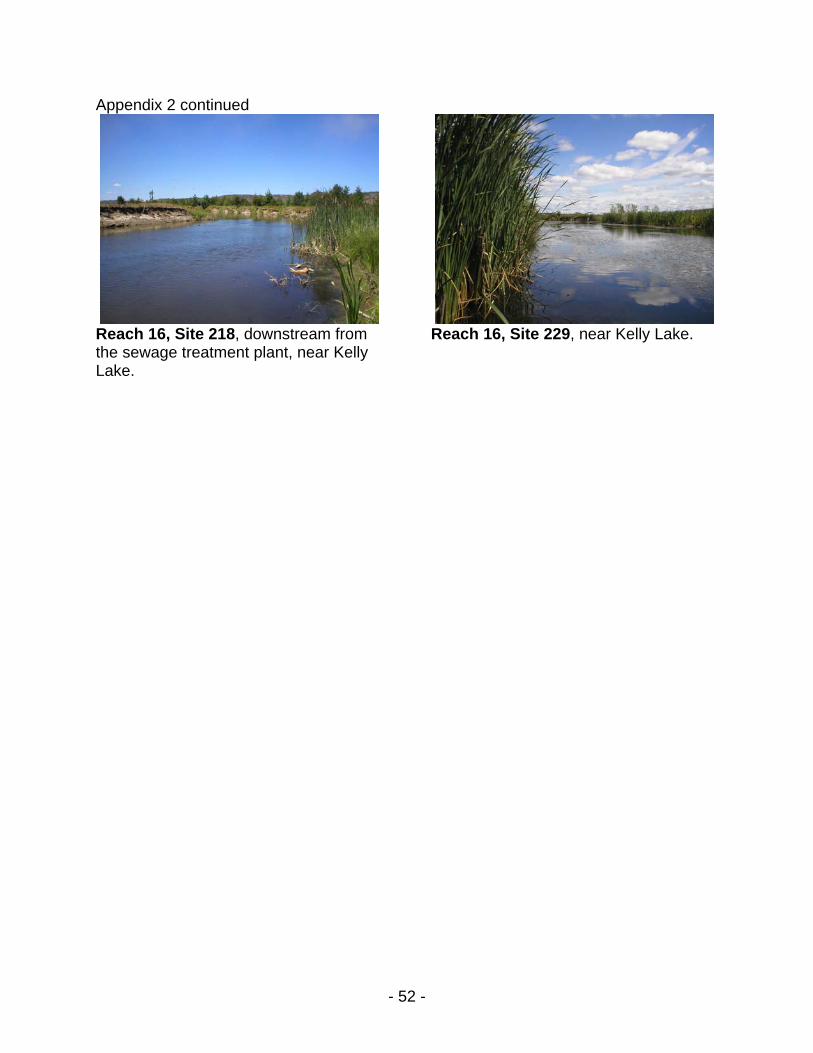
Appendix 2 continued
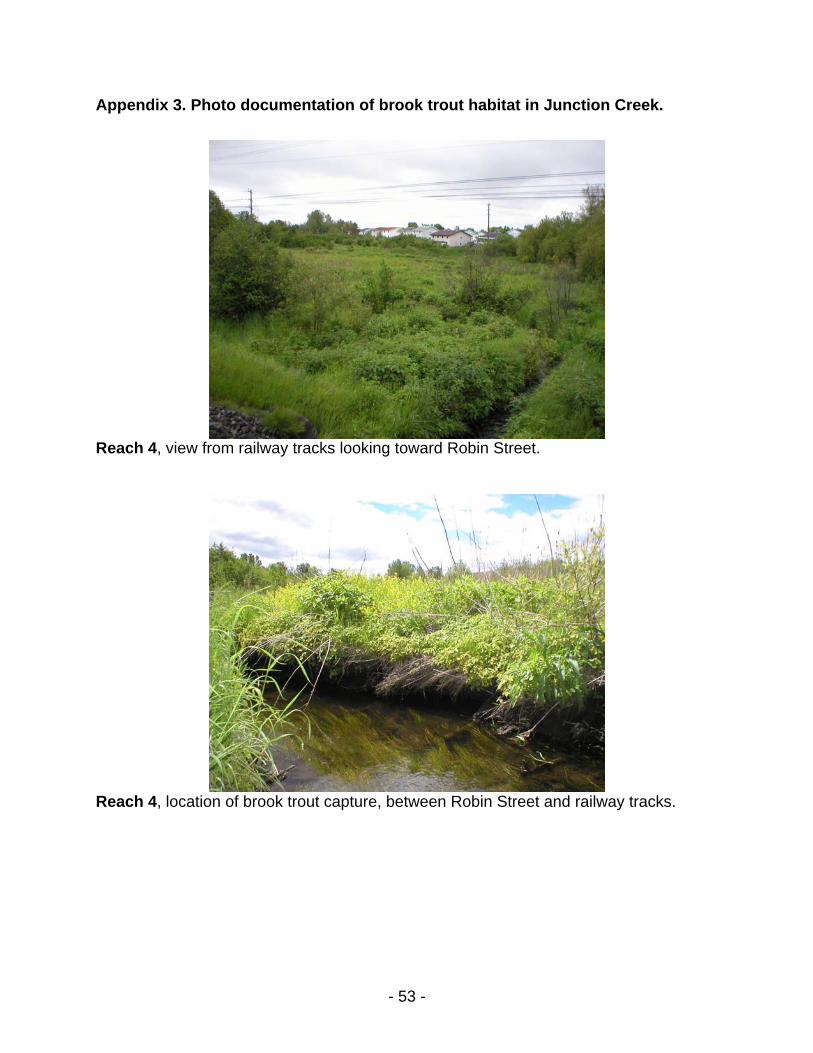
Reach 16, Site 218, downstream from the sewage treatment plant, near Kelly Lake.
Reach 16, Site 229, near Kelly Lake.
- 53 -
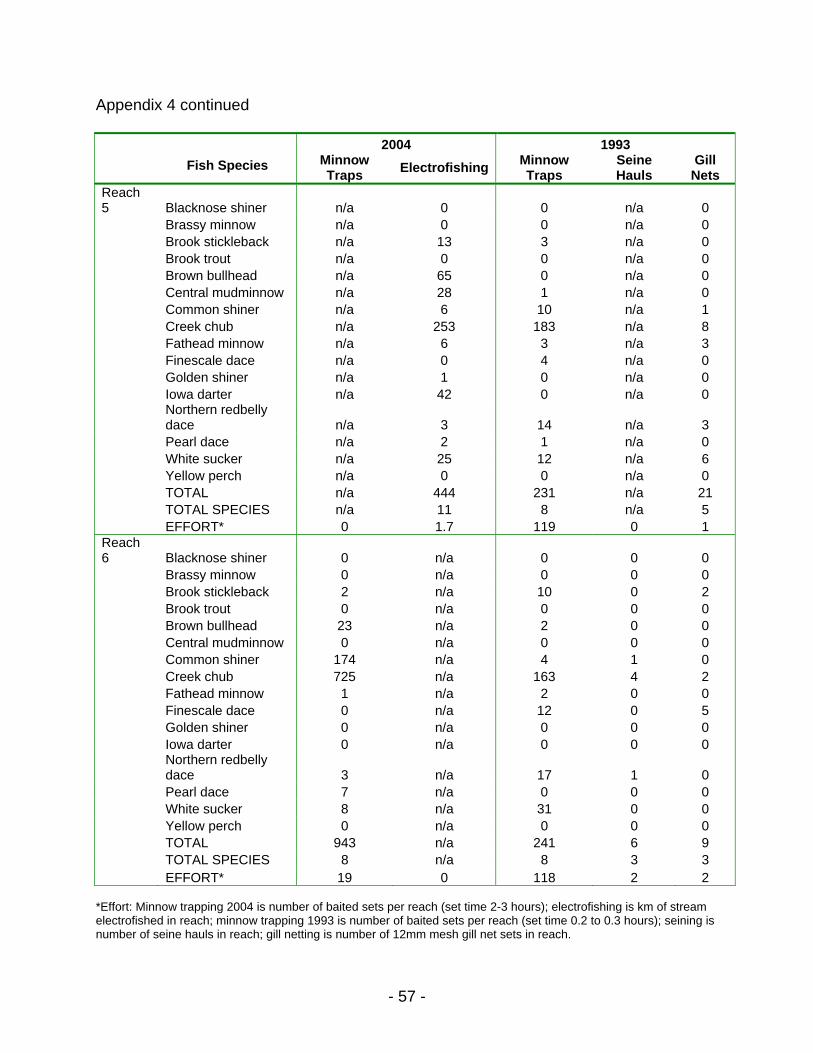
Appendix 3. Photo documentation of brook trout habitat in Junction Creek.
Reach 4, view from railway tracks looking toward Robin Street.
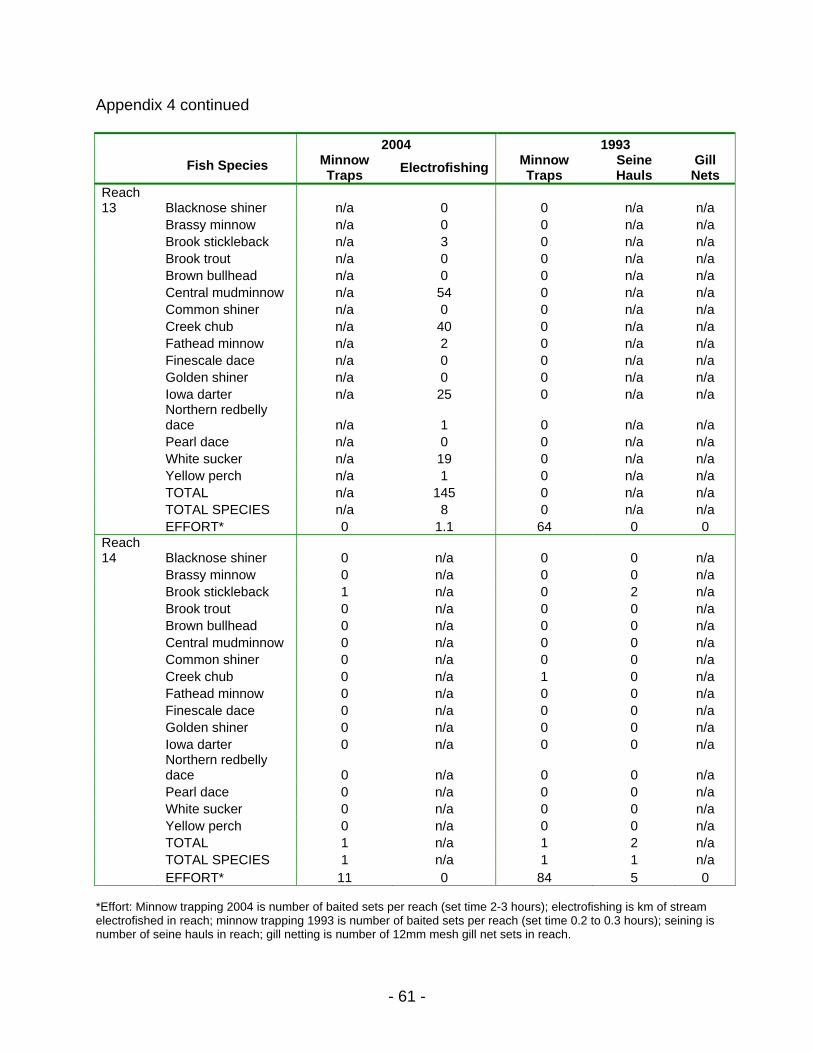
Reach 4, location of brook trout capture, between Robin Street and railway tracks.

- 54 -
Appendix 3 continued
Two brook trout captured in reach 4.
Smaller brook trout captured in reach 4.

- 55 -
Appendix 4. Total catch in numbers for 2004 and 1993 for each gear used. 2004 1993
Fish Species Minnow
Traps Electrofishing Minnow Traps
Seine Hauls
Gill Nets
Reach 1 Blacknose shiner 0 0 Brassy minnow 1 0 Brook stickleback 3 109 Brook trout 0 0 Brown bullhead 0 4 Central mudminnow 0 4 Common shiner 0 1 Creek chub 2 126 Reach 1 not sampled in 1993. Fathead minnow 0 18 Finescale dace 0 0 Golden shiner 0 0 Iowa darter 0 1
Northern redbelly dace 72 62
Pearl dace 0 0 White sucker 0 10 Yellow perch 0 0 TOTAL 78 335 TOTAL SPECIES 4 9 EFFORT* 4 1.0 Reach 2 Blacknose shiner 0 n/a Brassy minnow 0 n/a Brook stickleback 397 n/a Brook trout 0 n/a Brown bullhead 0 n/a Central mudminnow 1 n/a Common shiner 11 n/a Creek chub 39 n/a Reach 2 not sampled in 1993. Fathead minnow 3 n/a Finescale dace 0 n/a Golden shiner 0 n/a Iowa darter 0 n/a
Northern redbelly dace 105 n/a
Pearl dace 5 n/a White sucker 0 n/a Yellow perch 0 n/a TOTAL 561 n/a TOTAL SPECIES 7 n/a EFFORT* 17 0
*Effort: Minnow trapping 2004 is number of baited sets per reach (set time 2-3 hours); electrofishing is km of stream electrofished in reach; minnow trapping 1993 is number of baited sets per reach (set time 0.2 to 0.3 hours); seining is number of seine hauls in reach; gill netting is number of 12mm mesh gill net sets in reach.

- 56 -
Appendix 4 continued 2004 1993
Fish Species Minnow
Traps Electrofishing Minnow Traps
Seine Hauls
Gill Nets
Reach 3 Blacknose shiner n/a 0 0 0 n/a Brassy minnow n/a 0 0 0 n/a Brook stickleback n/a 201 2 0 n/a Brook trout n/a 0 0 0 n/a Brown bullhead n/a 2 0 0 n/a Central mudminnow n/a 3 0 0 n/a Common shiner n/a 163 0 1 n/a Creek chub n/a 278 136 6 n/a Fathead minnow n/a 14 0 0 n/a Finescale dace n/a 0 0 0 n/a Golden shiner n/a 0 0 0 n/a Iowa darter n/a 2 0 0 n/a
Northern redbelly dace n/a 4 0 0 n/a
Pearl dace n/a 12 1 0 n/a White sucker n/a 1 0 2 n/a Yellow perch n/a 0 0 0 n/a TOTAL n/a 680 139 9 n/a TOTAL SPECIES n/a 10 3 3 n/a EFFORT* 0 1.5 16 1 0 Reach 4 Blacknose shiner 0 0 0 n/a n/a Brassy minnow 1 0 0 n/a n/a Brook stickleback 6 135 32 n/a n/a Brook trout 0 2 0 n/a n/a Brown bullhead 0 5 0 n/a n/a Central mudminnow 0 44 0 n/a n/a Common shiner 2 5 6 n/a n/a Creek chub 128 279 77 n/a n/a Fathead minnow 1 12 8 n/a n/a Finescale dace 0 0 24 n/a n/a Golden shiner 0 0 0 n/a n/a Iowa darter 0 18 0 n/a n/a
Northern redbelly dace 7 0 48 n/a n/a
Pearl dace 7 10 0 n/a n/a White sucker 0 33 13 n/a n/a Yellow perch 0 0 0 n/a n/a TOTAL 152 543 208 n/a n/a TOTAL SPECIES 7 10 8 n/a n/a EFFORT* 4 1.2 84 0 0
*Effort: Minnow trapping 2004 is number of baited sets per reach (set time 2-3 hours); electrofishing is km of stream electrofished in reach; minnow trapping 1993 is number of baited sets per reach (set time 0.2 to 0.3 hours); seining is number of seine hauls in reach; gill netting is number of 12mm mesh gill net sets in reach.
- 57 -
Appendix 4 continued 2004 1993
Fish Species Minnow
Traps Electrofishing Minnow Traps
Seine Hauls
Gill Nets
Reach 5 Blacknose shiner n/a 0 0 n/a 0 Brassy minnow n/a 0 0 n/a 0 Brook stickleback n/a 13 3 n/a 0 Brook trout n/a 0 0 n/a 0 Brown bullhead n/a 65 0 n/a 0 Central mudminnow n/a 28 1 n/a 0 Common shiner n/a 6 10 n/a 1 Creek chub n/a 253 183 n/a 8 Fathead minnow n/a 6 3 n/a 3 Finescale dace n/a 0 4 n/a 0 Golden shiner n/a 1 0 n/a 0 Iowa darter n/a 42 0 n/a 0
Northern redbelly dace n/a 3 14 n/a 3
Pearl dace n/a 2 1 n/a 0 White sucker n/a 25 12 n/a 6 Yellow perch n/a 0 0 n/a 0 TOTAL n/a 444 231 n/a 21 TOTAL SPECIES n/a 11 8 n/a 5 EFFORT* 0 1.7 119 0 1 Reach 6 Blacknose shiner 0 n/a 0 0 0 Brassy minnow 0 n/a 0 0 0 Brook stickleback 2 n/a 10 0 2 Brook trout 0 n/a 0 0 0 Brown bullhead 23 n/a 2 0 0 Central mudminnow 0 n/a 0 0 0 Common shiner 174 n/a 4 1 0 Creek chub 725 n/a 163 4 2 Fathead minnow 1 n/a 2 0 0 Finescale dace 0 n/a 12 0 5 Golden shiner 0 n/a 0 0 0 Iowa darter 0 n/a 0 0 0
Northern redbelly dace 3 n/a 17 1 0
Pearl dace 7 n/a 0 0 0 White sucker 8 n/a 31 0 0 Yellow perch 0 n/a 0 0 0 TOTAL 943 n/a 241 6 9 TOTAL SPECIES 8 n/a 8 3 3 EFFORT* 19 0 118 2 2
*Effort: Minnow trapping 2004 is number of baited sets per reach (set time 2-3 hours); electrofishing is km of stream electrofished in reach; minnow trapping 1993 is number of baited sets per reach (set time 0.2 to 0.3 hours); seining is number of seine hauls in reach; gill netting is number of 12mm mesh gill net sets in reach.

- 58 -
Appendix 4 continued 2004 1993
Fish Species Minnow
Traps Electrofishing Minnow Traps
Seine Hauls
Gill Nets
Reach 7 Blacknose shiner 0 0 0 n/a n/a Brassy minnow 0 0 0 n/a n/a Brook stickleback 0 7 9 n/a n/a Brook trout 0 0 0 n/a n/a Brown bullhead 0 14 0 n/a n/a Central mudminnow 0 54 0 n/a n/a Common shiner 14 2 19 n/a n/a Creek chub 203 141 122 n/a n/a Fathead minnow 3 10 8 n/a n/a Finescale dace 0 0 33 n/a n/a Golden shiner 0 0 0 n/a n/a Iowa darter 0 54 0 n/a n/a
Northern redbelly dace 5 0 24 n/a n/a
Pearl dace 0 0 0 n/a n/a White sucker 1 16 9 n/a n/a Yellow perch 0 0 0 n/a n/a TOTAL 226 298 224 n/a n/a TOTAL SPECIES 5 8 7 n/a n/a EFFORT* 3 0.9 70 0 0 Reach 8 Blacknose shiner 0 n/a 0 n/a n/a Brassy minnow 0 n/a 0 n/a n/a Brook stickleback 2 n/a 10 n/a n/a Brook trout 0 n/a 0 n/a n/a Brown bullhead 0 n/a 0 n/a n/a Central mudminnow 0 n/a 4 n/a n/a Common shiner 5 n/a 9 n/a n/a Creek chub 220 n/a 224 n/a n/a Fathead minnow 18 n/a 58 n/a n/a Finescale dace 0 n/a 3 n/a n/a Golden shiner 0 n/a 0 n/a n/a Iowa darter 2 n/a 0 n/a n/a
Northern redbelly dace 1 n/a 55 n/a n/a
Pearl dace 0 n/a 0 n/a n/a White sucker 0 n/a 10 n/a n/a Yellow perch 0 n/a 0 n/a n/a TOTAL 248 n/a 373 n/a n/a TOTAL SPECIES 6 n/a 8 n/a n/a EFFORT* 10 0 59 0 0
*Effort: Minnow trapping 2004 is number of baited sets per reach (set time 2-3 hours); electrofishing is km of stream electrofished in reach; minnow trapping 1993 is number of baited sets per reach (set time 0.2 to 0.3 hours); seining is number of seine hauls in reach; gill netting is number of 12mm mesh gill net sets in reach.

- 59 -
Appendix 4 continued 2004 1993
Fish Species Minnow
Traps Electrofishing Minnow Traps
Seine Hauls
Gill Nets
Reach 9 Blacknose shiner 0 n/a 1 n/a n/a Brassy minnow 0 n/a 0 n/a n/a Brook stickleback 0 n/a 32 n/a n/a Brook trout 0 n/a 0 n/a n/a Brown bullhead 0 n/a 0 n/a n/a Central mudminnow 0 n/a 1 n/a n/a Common shiner 27 n/a 13 n/a n/a Creek chub 23 n/a 262 n/a n/a Fathead minnow 5 n/a 30 n/a n/a Finescale dace 0 n/a 18 n/a n/a Golden shiner 0 n/a 0 n/a n/a Iowa darter 0 n/a 0 n/a n/a
Northern redbelly dace 0 n/a 191 n/a n/a
Pearl dace 1 n/a 0 n/a n/a White sucker 0 n/a 4 n/a n/a Yellow perch 0 n/a 0 n/a n/a TOTAL 56 n/a 552 n/a n/a TOTAL SPECIES 4 n/a 9 n/a n/a EFFORT* 14 0 88 0 0 Reach 10 Blacknose shiner 0 n/a 0 0 0 Brassy minnow 0 n/a 0 0 0 Brook stickleback 5 n/a 77 61 0 Brook trout 0 n/a 0 0 0 Brown bullhead 1 n/a 0 0 0 Central mudminnow 0 n/a 0 1 0 Common shiner 16 n/a 10 0 9 Creek chub 232 n/a 19 1 6 Fathead minnow 8 n/a 52 2 51 Finescale dace 0 n/a 4 0 0 Golden shiner 1 n/a 0 0 0 Iowa darter 0 n/a 0 0 0
Northern redbelly dace 3 n/a 5 0 15
Pearl dace 0 n/a 1 0 0 White sucker 4 n/a 16 0 16 Yellow perch 2 n/a 0 0 0 TOTAL 272 n/a 184 65 97 TOTAL SPECIES 9 n/a 8 4 5 EFFORT* 14 0 98 2 3
*Effort: Minnow trapping 2004 is number of baited sets per reach (set time 2-3 hours); electrofishing is km of stream electrofished in reach; minnow trapping 1993 is number of baited sets per reach (set time 0.2 to 0.3 hours); seining is number of seine hauls in reach; gill netting is number of 12mm mesh gill net sets in reach.

- 60 -
Appendix 4 continued 2004 1993
Fish Species Minnow
Traps Electrofishing Minnow Traps
Seine Hauls
Gill Nets
Reach 11 Blacknose shiner 0 0 0 0 0 Brassy minnow 0 0 0 0 0 Brook stickleback 0 0 5 4 0 Brook trout 0 0 0 0 0 Brown bullhead 0 0 0 0 0 Central mudminnow 0 26 0 0 0 Common shiner 4 1 12 0 0 Creek chub 242 131 111 0 2 Fathead minnow 7 8 3 40 0 Finescale dace 0 0 0 0 0 Golden shiner 0 0 0 0 0 Iowa darter 2 80 1 0 0
Northern redbelly dace 0 0 29 4 7
Pearl dace 0 0 13 0 0 White sucker 3 11 7 4 0 Yellow perch 1 0 0 0 0 TOTAL 259 257 181 52 9 TOTAL SPECIES 6 6 8 5 2 EFFORT* 10 0.8 98 2 5 Reach 12 Blacknose shiner n/a 0 0 n/a 0 Brassy minnow n/a 0 0 n/a 0 Brook stickleback n/a 6 0 n/a 0 Brook trout n/a 0 0 n/a 0 Brown bullhead n/a 5 0 n/a 0 Central mudminnow n/a 57 0 n/a 0 Common shiner n/a 0 0 n/a 0 Creek chub n/a 95 0 n/a 0 Fathead minnow n/a 1 0 n/a 0 Finescale dace n/a 0 0 n/a 0 Golden shiner n/a 0 0 n/a 0 Iowa darter n/a 46 0 n/a 0
Northern redbelly dace n/a 0 0 n/a 0
Pearl dace n/a 2 0 n/a 0 White sucker n/a 26 0 n/a 0 Yellow perch n/a 0 0 n/a 0 TOTAL n/a 238 0 n/a 0 TOTAL SPECIES n/a 8 0 n/a 0 EFFORT* 0 1.4 92 0 2
*Effort: Minnow trapping 2004 is number of baited sets per reach (set time 2-3 hours); electrofishing is km of stream electrofished in reach; minnow trapping 1993 is number of baited sets per reach (set time 0.2 to 0.3 hours); seining is number of seine hauls in reach; gill netting is number of 12mm mesh gill net sets in reach.
- 61 -
Appendix 4 continued 2004 1993
Fish Species Minnow
Traps Electrofishing Minnow Traps
Seine Hauls
Gill Nets
Reach 13 Blacknose shiner n/a 0 0 n/a n/a Brassy minnow n/a 0 0 n/a n/a Brook stickleback n/a 3 0 n/a n/a Brook trout n/a 0 0 n/a n/a Brown bullhead n/a 0 0 n/a n/a Central mudminnow n/a 54 0 n/a n/a Common shiner n/a 0 0 n/a n/a Creek chub n/a 40 0 n/a n/a Fathead minnow n/a 2 0 n/a n/a Finescale dace n/a 0 0 n/a n/a Golden shiner n/a 0 0 n/a n/a Iowa darter n/a 25 0 n/a n/a
Northern redbelly dace n/a 1 0 n/a n/a
Pearl dace n/a 0 0 n/a n/a White sucker n/a 19 0 n/a n/a Yellow perch n/a 1 0 n/a n/a TOTAL n/a 145 0 n/a n/a TOTAL SPECIES n/a 8 0 n/a n/a EFFORT* 0 1.1 64 0 0 Reach 14 Blacknose shiner 0 n/a 0 0 n/a Brassy minnow 0 n/a 0 0 n/a Brook stickleback 1 n/a 0 2 n/a Brook trout 0 n/a 0 0 n/a Brown bullhead 0 n/a 0 0 n/a Central mudminnow 0 n/a 0 0 n/a Common shiner 0 n/a 0 0 n/a Creek chub 0 n/a 1 0 n/a Fathead minnow 0 n/a 0 0 n/a Finescale dace 0 n/a 0 0 n/a Golden shiner 0 n/a 0 0 n/a Iowa darter 0 n/a 0 0 n/a
Northern redbelly dace 0 n/a 0 0 n/a
Pearl dace 0 n/a 0 0 n/a White sucker 0 n/a 0 0 n/a Yellow perch 0 n/a 0 0 n/a TOTAL 1 n/a 1 2 n/a TOTAL SPECIES 1 n/a 1 1 n/a EFFORT* 11 0 84 5 0
*Effort: Minnow trapping 2004 is number of baited sets per reach (set time 2-3 hours); electrofishing is km of stream electrofished in reach; minnow trapping 1993 is number of baited sets per reach (set time 0.2 to 0.3 hours); seining is number of seine hauls in reach; gill netting is number of 12mm mesh gill net sets in reach.

- 62 -
Appendix 4 continued 2004 1993
Fish Species Minnow
Traps Electrofishing Minnow Traps
Seine Hauls
Gill Nets
Reach 15 Blacknose shiner n/a 0 0 0 0 Brassy minnow n/a 0 0 0 0 Brook stickleback n/a 0 0 0 0 Brook trout n/a 0 0 0 0 Brown bullhead n/a 1 0 0 0 Central mudminnow n/a 17 0 0 0 Common shiner n/a 0 0 0 0 Creek chub n/a 2 0 0 0 Fathead minnow n/a 1 0 0 0 Finescale dace n/a 0 0 0 0 Golden shiner n/a 0 0 0 0 Iowa darter n/a 27 0 0 0
Northern redbelly dace n/a 0 0 0 0
Pearl dace n/a 0 0 0 0 White sucker n/a 41 0 0 0 Yellow perch n/a 0 0 0 0 TOTAL n/a 89 0 0 0 TOTAL SPECIES n/a 6 0 0 0 EFFORT* 0 1.1 44 2 1 Reach 16 Blacknose shiner 0 n/a 0 0 0 Brassy minnow 0 n/a 0 0 0 Brook stickleback 2 n/a 5 2 0 Brook trout 0 n/a 0 0 0 Brown bullhead 0 n/a 0 0 0 Central mudminnow 0 n/a 0 0 0 Common shiner 0 n/a 0 0 0 Creek chub 0 n/a 0 0 0 Fathead minnow 1 n/a 3 135 8 Finescale dace 0 n/a 0 0 0 Golden shiner 0 n/a 0 0 0 Iowa darter 0 n/a 0 0 0
Northern redbelly dace 0 n/a 0 0 0
Pearl dace 0 n/a 0 0 0 White sucker 25 n/a 0 0 0 Yellow perch 25 n/a 0 0 0 TOTAL 53 n/a 8 137 8 TOTAL SPECIES 4 n/a 2 2 1 EFFORT* 17 0 116 12 3
*Effort: Minnow trapping 2004 is number of baited sets per reach (set time 2-3 hours); electrofishing is km of stream electrofished in reach; minnow trapping 1993 is number of baited sets per reach (set time 0.2 to 0.3 hours); seining is number of seine hauls in reach; gill netting is number of 12mm mesh gill net sets in reach.

- 63 -
Appendix 5. Water chemistry parameters collected from seven sites on Junction Creek and its tributaries in 2004.
Garson branch
Maley branch
Lasalle Boulevard
Frood branch
Flour Mill area
Brady Street
Kelly Lake Road area
Aluminum (ug/L) 7-Jun-04 14 89 127 107 149 153 150 5-Jul-04 44 663 241 421 761 823 632
3-Aug-04 4.1 48 60 70 38 85 18 1-Sep-04 7.5 27 31 41 36 25 19
Antimony (ug/L) 7-Jun-04 <1 <1 <1 <1 <1 <1 <1 5-Jul-04 <1 <1 <1 <1 <1 <1 <1
3-Aug-04 <1 <1 <1 <1 <1 <1 <1 1-Sep-04 <1 <1 <1 <1 <1 <1 <1
Arsenic (ug/L) 7-Jun-04 2 1.7 1.8 2.2 1.8 1.7 1.6 5-Jul-04 1.8 1.9 2.1 1.5 1.8 1.7 1.9
3-Aug-04 2.5 3.8 3.5 1.9 2.8 2.3 3.6 1-Sep-04 2.1 2.5 2.6 1.9 2.1 1.4 1.6
Barium (ug/L) 7-Jun-04 35 13 16 43 21 24 32 5-Jul-04 44 23 53 39 35 36 35
3-Aug-04 48 14 41 59 38 49 54 1-Sep-04 56 18 63 76 45 46 60
Beryllium (ug/L) 7-Jun-04 <1 <1 <1 <1 <1 <1 <1 5-Jul-04 <1 <1 <1 <1 <1 <1 <1
3-Aug-04 <1 <1 <1 <1 <1 <1 <1 1-Sep-04 <1 <1 <1 <1 <1 <1 <1
Bismuth (ug/L) 7-Jun-04 <1 <1 <1 <1 <1 <1 <1 5-Jul-04 <1 <1 <1 <1 <1 <1 <1
3-Aug-04 <1 <1 <1 <1 <1 <1 <1 1-Sep-04 <1 <1 <1 <1 <1 <1 <1
Boron (ug/L) 7-Jun-04 64 5.7 8.4 22 13 14 36 5-Jul-04 75 8.8 50 27 21 23 31
3-Aug-04 51 8.5 21 29 20 24 72 1-Sep-04 51 5.4 27 36 20 28 85
Cadmium (ug/L) 7-Jun-04 0.2 <0.1 <0.1 0.4 <0.1 0.13 0.14 5-Jul-04 0.2 0.15 0.18 0.38 0.18 0.6 0.32
3-Aug-04 0.14 <0.1 <0.1 0.48 <0.1 0.21 0.32 1-Sep-04 <0.1 0.12 <0.1 0.2 <0.1 0.31 0.39
Calcium (ug/L) 7-Jun-04 193000 8540 17900 27500 28000 37600 203000 5-Jul-04 210000 25500 126000 22800 32200 39400 115000
3-Aug-04 238000 12000 76300 46800 53500 60500 525000 1-Sep-04 290000 14800 147000 56600 66700 112000 600000
- 64 -
Appendix 5 continued
Garson branch
Maley branch
Lasalle Boulevard
Frood branch
Flour Mill area
Brady Street
Kelly Lake Road area
Cerium (ug/L) 7-Jun-04 <1 <1 <1 <1 <1 <1 <1 5-Jul-04 <1 1.4 <1 1.4 1.3 1.8 2.3
3-Aug-04 <1 <1 <1 1.6 <1 <1 <1 1-Sep-04 <1 <1 <1 <1 <1 <1 <1
Cesium (ug/L) 7-Jun-04 <1 <1 <1 <1 <1 <1 <1 5-Jul-04 <1 <1 <1 <1 <1 <1 <1
3-Aug-04 <1 <1 <1 <1 <1 <1 <1 1-Sep-04 <1 <1 <1 <1 <1 <1 <1
Chloride (mg/L) 7-Jun-04 n/a n/a n/a n/a n/a n/a n/a 5-Jul-04 110 7.5 84 160 73 69 84
3-Aug-04 99 3 56 200 110 140 88 1-Sep-04 150 5.3 110 370 100 110 86
Chromium (ug/L) 7-Jun-04 1.3 <1 <1 <1 <1 1.1 <1 5-Jul-04 <1 1.5 1 1.4 1.9 2.2 1.5
3-Aug-04 2.2 1.9 1.6 1.8 2 2.1 1.2 1-Sep-04 1.1 <1 1.2 1.2 1.1 <1 <1
Cobalt (ug/L) 7-Jun-04 3.4 1 0.7 6.1 1.2 8.2 9.3 5-Jul-04 4.8 1.2 2.3 4.4 3.1 26.1 15.3
3-Aug-04 1.5 0.52 0.7 2.8 0.5 22.3 10.9 1-Sep-04 2.1 0.43 0.82 2.1 0.51 20.3 10
Copper (ug/L) 7-Jun-04 5.8 23 23 71 24 57 102 5-Jul-04 9 17 13 67 40 144 92
3-Aug-04 4.3 27 14 48 17 46 128 1-Sep-04 1.6 13 4.8 31 11 30 175
Europium (ug/L) 7-Jun-04 <1 <1 <1 <1 <1 <1 <1 5-Jul-04 <1 <1 <1 <1 <1 <1 <1
3-Aug-04 <1 <1 <1 <1 <1 <1 <1 1-Sep-04 <1 <1 <1 <1 <1 <1 <1
Fluoride (mg/L) 7-Jun-04 n/a n/a n/a n/a n/a n/a n/a 5-Jul-04 n/a n/a n/a n/a n/a n/a n/a
3-Aug-04 0.056 0.04 0.05 0.14 0.063 0.096 0.2 1-Sep-04 0.068 0.052 0.052 0.19 0.067 0.11 <1
Gallium (ug/L) 7-Jun-04 <1 <1 <1 <1 <1 <1 <1 5-Jul-04 <1 <1 <1 <1 <1 <1 <1
3-Aug-04 <1 <1 <1 <1 <1 <1 <1 1-Sep-04 <1 <1 1.1 1.3 <1 <1 <1
- 65 -
Appendix 5 continued
Garson branch
Maley branch
Lasalle Boulevard
Frood branch
Flour Mill area
Brady Street
Kelly Lake Road area
Iron (ug/L) 7-Jun-04 27 350 300 250 280 270 210 5-Jul-04 110 840 320 570 840 770 620
3-Aug-04 67 1200 620 700 590 520 150 1-Sep-04 60 680 220 350 450 240 110
Lanthanum (ug/L) 7-Jun-04 <1 <1 <1 <1 <1 <1 <1 5-Jul-04 <1 <1 <1 <1 <1 1.3 1.6
3-Aug-04 <1 <1 <1 1.1 <1 <1 <1 1-Sep-04 <1 <1 <1 <1 <1 <1 <1
Lead (ug/L) 7-Jun-04 <1 <1 <1 <1 <1 <1 <1 5-Jul-04 <1 <1 <1 <1 <1 <1 <1
3-Aug-04 <1 <1 <1 <1 <1 <1 <1 1-Sep-04 <1 <1 <1 <1 <1 <1 <1
Lithium (ug/L) 7-Jun-04 12 <5 <5 <5 <5 <5 23 5-Jul-04 10 <5 6.4 <5 <5 10 <5
3-Aug-04 13 <5 <5 <5 <5 55 <5 1-Sep-04 16 <5 6.9 <5 <5 8.7 67
Magnesium (ug/L) 7-Jun-04 18900 3010 4140 9070 5510 5670 28800 5-Jul-04 16400 8420 13600 7840 7420 7410 6210
3-Aug-04 19700 3790 10800 14400 11300 12900 9880 1-Sep-04 25200 5440 20500 19100 12900 16000 22400
M-Alkalinity (pH 4.5) (mg/L) 7-Jun-04 69 28 33 51 38 45 25 5-Jul-04 73 64 78 39 49 39 34
3-Aug-04 125 40 90 100 110 110 39 1-Sep-04 100 47 120 19100 94 76 25
Manganese (ug/L) 7-Jun-04 79 75 48 61 42 51 43 5-Jul-04 148 192 125 54 98 117 87
3-Aug-04 155 111 90 87 53 84 25 1-Sep-04 210 391 140 19100 130 71 19
Mercury (ug/L) 7-Jun-04 <0.1 <0.1 <0.1 <0.1 <0.1 <0.1 <0.1 5-Jul-04 <0.1 <0.1 <0.1 <0.1 <0.1 <0.1 <0.1
3-Aug-04 <0.1 <0.1 <0.1 <0.1 <0.1 <0.1 <0.1 1-Sep-04 <0.1 <0.1 <0.1 <0.1 <0.1 <0.1 0.64
Molybdenum (ug/L) 7-Jun-04 <1 <1 <1 <1 <1 <1 <1 5-Jul-04 <1 <1 <1 <1 <1 <1 <1
3-Aug-04 <1 <1 <1 1.4 1.1 1 1.1 1-Sep-04 <1 <1 <1 <1 <1 <1 <1

- 66 -
Appendix 5 continued
Garson branch
Maley branch
Lasalle Boulevard
Frood branch
Flour Mill area
Brady Street
Kelly Lake Road area
Nickel (ug/L) 7-Jun-04 300 87 94 319 126 253 310 5-Jul-04 330 81 200 233 147 606 440
3-Aug-04 169 86 82 179 72 600 490 1-Sep-04 157 55 98 168 76 549 283
Niobium (ug/L) 7-Jun-04 <1 <1 <1 <1 <1 <1 <1 5-Jul-04 <1 <1 <1 <1 <1 <1 <1
3-Aug-04 <1 <1 <1 <1 <1 <1 <1 1-Sep-04 <1 <1 <1 <1 <1 <1 <1
Nitrate (as N) (mg/L) 7-Jun-04 n/a n/a n/a n/a n/a n/a n/a 5-Jul-04 n/a n/a n/a n/a n/a n/a n/a
3-Aug-04 n/a n/a n/a n/a n/a n/a n/a 1-Sep-04 0.54 <0.1 0.22 0.19 <0.1 0.24 <10
Nitrite (as N) (mg/L) 7-Jun-04 n/a n/a n/a n/a n/a n/a n/a 5-Jul-04 n/a n/a n/a n/a n/a n/a n/a
3-Aug-04 <0.05 <0.05 <0.05 <0.05 <0.05 <0.05 <5 1-Sep-04 <0.05 <0.05 <0.05 <0.05 <0.05 <0.05 <0.05
pH 7-Jun-04 7.49 7 7.09 7.34 7.17 7.23 6.93 5-Jul-04 7.28 7.28 7.21 7.31 7.04 7.02 7.11
3-Aug-04 7.77 7.43 7.84 7.84 7.86 8.06 7.73 1-Sep-04 7.67 7.28 7.82 7.82 7.37 7.72 6.96
Phosphorus (ug/L) 7-Jun-04 <50 <50 <50 <50 <50 <50 <50 5-Jul-04 <50 <50 67 <50 <50 <50 <50
3-Aug-04 92 <50 <50 <50 <50 <50 <50 1-Sep-04 84 <50 <50 <50 <50 <50 <50
Potassium (mg/L) 7-Jun-04 n/a n/a n/a n/a n/a n/a n/a 5-Jul-04 n/a n/a n/a n/a n/a n/a n/a
3-Aug-04 12.1 6 3.9 3.2 2.8 3.2 33 1-Sep-04 16.1 0.65 7.37 4.46 3.2 6.39 39
Rubidium (ug/L) 7-Jun-04 18 1.7 2.3 3.4 2.9 3.6 22 5-Jul-04 16 2.4 9.2 4 3.8 4.8 11
3-Aug-04 17 2.2 5.7 5 3.8 3.9 46 1-Sep-04 23 2.3 9.5 6.2 4.3 9.5 61
Scandium (ug/L) 7-Jun-04 <1 <1 <1 <1 <1 <1 <1 5-Jul-04 <1 1.4 1.2 1.2 1.5 1.7 1.4
3-Aug-04 1.2 <1 <1 <1 <1 <1 <1 1-Sep-04 <1 <1 1.1 <1 <1 <1 <1

- 67 -
Appendix 5 continued
Garson branch
Maley branch
Lasalle Boulevard
Frood branch
Flour Mill area
Brady Street
Kelly Lake Road area
Selenium (ug/L) 7-Jun-04 5.4 <1 <1 <1 <1 1.5 7.8 5-Jul-04 1.7 <1 <1 <1 <1 <1 21
3-Aug-04 2.6 <1 1.5 1.7 1.1 1.4 9.7 1-Sep-04 3 <1 1.4 <1 1.1 1.4 16
Silver (ug/L) 7-Jun-04 <1 <1 <1 <1 <1 <1 <1 5-Jul-04 <1 <1 <1 <1 <1 <1 <1
3-Aug-04 <1 <1 <1 <1 <1 <1 <1 1-Sep-04 <0.1 <0.1 <0.1 <0.1 <0.1 <0.1 <0.1
Sodium (mg/L) 7-Jun-04 n/a n/a n/a n/a n/a n/a n/a 5-Jul-04 66.8 6.08 50.9 91.6 49 48 71.4
3-Aug-04 71.5 3.2 34 145 61.1 83.9 125 1-Sep-04 87.6 4 60.8 206 57.2 68.7 111
Strontium (ug/L) 7-Jun-04 800 26 61 93 96 112 340 5-Jul-04 790 48 500 78 98 102 180
3-Aug-04 890 35 270 139 179 180 740 1-Sep-04 1300 39 510 200 210 280 920
Sulphate (mg/L) 7-Jun-04 n/a n/a n/a n/a n/a n/a n/a 5-Jul-04 n/a n/a n/a n/a n/a n/a n/a
3-Aug-04 490 5.3 150 41.9 65 72 1500 1-Sep-04 690 7.9 280 50 83 250 1700
Thallium (ug/L) 7-Jun-04 <0.1 <0.1 <0.1 <0.1 <0.1 <0.1 0.22 5-Jul-04 <0.1 <0.1 <0.1 <0.1 <0.1 <0.1 0.65
3-Aug-04 <0.1 <0.1 <0.1 0.16 <0.1 <0.1 3.9 1-Sep-04 <0.1 <0.1 <0.1 <0.1 <0.1 <0.1 2.7
Thorium (ug/L) 7-Jun-04 <1 <1 <1 <1 <1 <1 <1 5-Jul-04 <1 <1 <1 <1 <1 <1 <1
3-Aug-04 <1 <1 <1 <1 <1 <1 <1 1-Sep-04 <1 <1 <1 <1 <1 <1 <1
Tin (ug/L) 7-Jun-04 <1 <1 <1 <1 <1 <1 <1 5-Jul-04 <1 <1 <1 <1 <1 <1 <1
3-Aug-04 <1 <1 <1 <1 <1 <1 <1 1-Sep-04 <1 <1 <1 <1 <1 <1 <1
Titanium (ug/L) 7-Jun-04 <1 2.4 4.6 2 3.7 3.4 4.1 5-Jul-04 1.6 24 9.1 14 24 27 18
3-Aug-04 1.4 1.9 2.6 1.8 4.6 3.5 1.5 1-Sep-04 1.2 1.8 3.6 1.2 1.8 2 <1

- 68 -
Appendix 5 continued
Garson branch
Maley branch
Lasalle Boulevard
Frood branch
Flour Mill area
Brady Street
Kelly Lake Road area
Total Hardness (mg/L) 7-Jun-04 n/a n/a n/a n/a n/a n/a n/a 5-Jul-04 n/a n/a n/a n/a n/a n/a n/a
3-Aug-04 676 45.2 235 176 180 204 1350 1-Sep-04 837 59.2 451 220 220 347 1590
Total Phosphorus (as P) (mg/L) 7-Jun-04 n/a n/a n/a n/a n/a n/a n/a 5-Jul-04 n/a n/a n/a n/a n/a n/a n/a
3-Aug-04 0.13 0.036 0.067 0.036 0.033 0.059 0.032 1-Sep-04 0.11 0.032 0.074 0.021 0.037 0.035 0.016
Total Suspended Solids (mg/L) 7-Jun-04 32 7 15 14 42 30 17 5-Jul-04 8 33 26 11 18 26 28
3-Aug-04 3 5 <3 12 <3 6 10 1-Sep-04 <3 77 <3 <3 <3 <3 9
Tungsten (ug/L) 7-Jun-04 <1 <1 <1 <1 <1 <1 <1 5-Jul-04 <1 <1 <1 <1 <1 <1 <1
3-Aug-04 <1 <1 <1 <1 <1 <1 <1 1-Sep-04 1.8 <1 1.2 1.7 2.4 1.6 2.5
Uranium (ug/L) 7-Jun-04 <1 <1 <1 <1 <1 <1 <1 5-Jul-04 <1 <1 <1 <1 <1 <1 <1
3-Aug-04 <1 <1 <1 <1 <1 <1 <1 1-Sep-04 <1 <1 <1 <1 <1 <1 <1
Vanadium (ug/L) 7-Jun-04 1.1 <1 <1 2.6 <1 <1 1.1 5-Jul-04 <1 1.3 1.1 <1 1.4 1.3 1.2
3-Aug-04 <1 <1 <1 <1 <1 <1 <1 1-Sep-04 <1 <1 <1 <1 <1 <1 <1
Yttrium (ug/L) 7-Jun-04 <1 <1 <1 <1 <1 <1 <1 5-Jul-04 <1 <1 <1 <1 <1 <1 <1
3-Aug-04 <1 <1 <1 <1 <1 <1 <1 1-Sep-04 <1 <1 <1 <1 <1 <1 <1
Zinc (ug/L) 7-Jun-04 23 13 13 33 14 17 13 5-Jul-04 25 12 22 28 29 38 24
3-Aug-04 14 11 6.8 17 6.2 13 9.9 1-Sep-04 8.1 5.9 6.3 12 5.2 11 8.6
Zirconium (ug/L) 7-Jun-04 <1 <1 <1 <1 <1 <1 <1 5-Jul-04 2.6 4.9 1.7 1 2.7 2.7 2.8
3-Aug-04 <1 <1 <1 <1 <1 <1 2.9 1-Sep-04 <1 <1 <1 3.7 1.7 1.4 5.1