Embed Size (px)
Citation preview

11
FISH COLONISATION OFFISH COLONISATION OFREEF BALLS OVER 8 YEARSREEF BALLS OVER 8 YEARS
North North SulawesiSulawesi, Indonesia, Indonesia
Presented at: 9Presented at: 9thth CARAH, BrazilCARAH, Brazil
88--13 November, 200913 November, 2009
David LennonDavid Lennon11, Jerry Kojansow, Jerry Kojansow22,,
David SompieDavid Sompie22 & & DjonlieDjonlie EmorEmor22
11Reef Ball AustraliaReef Ball Australia22PT PT NewmontNewmont MinahasaMinahasa RayaRaya

22
This presentation covers…This presentation covers…
•• Program location and sponsorProgram location and sponsor
•• Artificial reef objectives, design and constructionArtificial reef objectives, design and construction
•• Survey methodologySurvey methodology
•• ResultsResults
•• ConclusionsConclusions
•• Questions?Questions?
•• Contacts for further informationContacts for further information

33
Program LocationProgram Location
NORTH SULAWESI
PTNMR Mine site and study
area.
44
Program SponsorProgram Sponsor
• PT Newmont Minahasa Raya (PTNMR) – Joint venture company between Newmont Gold Company (USA) and PT Tanjung Serapung (Indonesia).
– Operated an open pit gold mine from 1996 until 2001. Mine closure activities completed in 2004.
– As part of PTNMR’s commitment to the environment and local community, PTNMR funded the construction and monitoring of the largest Reef Ball artifical reef program conducted by a private company, with over 3,000 Reef Balls deployed. An asset that will continue An asset that will continue providing for many years.providing for many years.
55
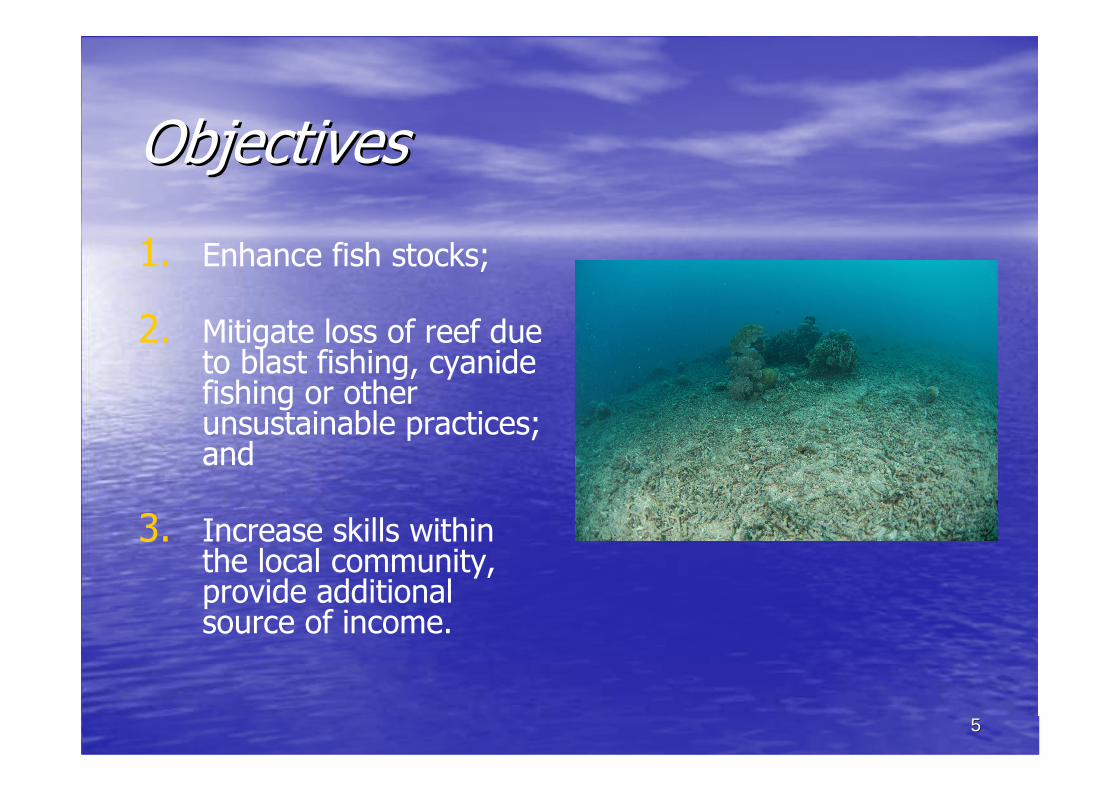
ObjectivesObjectives
1. Enhance fish stocks;
2. Mitigate loss of reef due to blast fishing, cyanide fishing or other unsustainable practices; and
3. Increase skills within the local community, provide additional source of income.

66
Artificial Reef ConstructionArtificial Reef Construction
•• Pallet Ball (~650kg, Pallet Ball (~650kg, 0.9m H) and Bay Ball 0.9m H) and Bay Ball (~280kg, 0.6m H)(~280kg, 0.6m H)
•• Construction of units Construction of units by 25 local villagers, by 25 local villagers, over 4yrs, full time.over 4yrs, full time.
•• Deployment by bargeDeployment by barge
•• Commenced in 1999, Commenced in 1999, finished 2002.finished 2002.

77
Six sites...Six sites...
MALUKU SEA358Depth: 12-14m
59Depth: 20-30m
153Depth: 15-25m
203Depth: 10-30m
227Depth: 10-25m
474Depth: 8-12m
Sandy mud
Steep slope
Hard, sandy rubble
Hard, sandy rubble
Sandy rubble
Hard, strong current

88
ConfiguationConfiguation of the AR’sof the AR’s
Buyat Cape
20m contours
EastWest
Not to scale
Selat Besar
EastWest
Not to scale
Current direction
Tanjung (Cape) Sikod
Not to scale
EastWest
Not to scale
EastWest
Teluk Buyat (Bay)
25 and 20m contours
Tanjung (Cape) Buyat
Selat Besar
Station IIISegara
EastWest
15m contours
Not to scale
Patch reef
Station III Segara

99
Survey MethodologySurvey Methodology
•• Annually, August or September Annually, August or September
•• 2001 to 20082001 to 2008
•• Visual census, 30Visual census, 30--40 40 minsmins
•• One sampling event per siteOne sampling event per site
•• Same observerSame observer
•• Same Reef Balls each time, however # varies Same Reef Balls each time, however # varies
between sitesbetween sites
•• Depths: 5Depths: 5--30m30m

1010
ResultsResults
•• Key findings, for all reefs combined (2008)Key findings, for all reefs combined (2008)
–– 26 Families26 Families
–– 72 Genera72 Genera
–– 150 species150 species
–– 9,006 individuals9,006 individuals
–– Steady increase up to 2006, then slowed, with Steady increase up to 2006, then slowed, with
decrease in mainly the commercial species and decrease in mainly the commercial species and
individuals in 2007 to 2008individuals in 2007 to 2008

1111
Total Species Recorded per SiteTotal Species Recorded per Site

1212
Total Individuals Recorded per SiteTotal Individuals Recorded per Site
1313
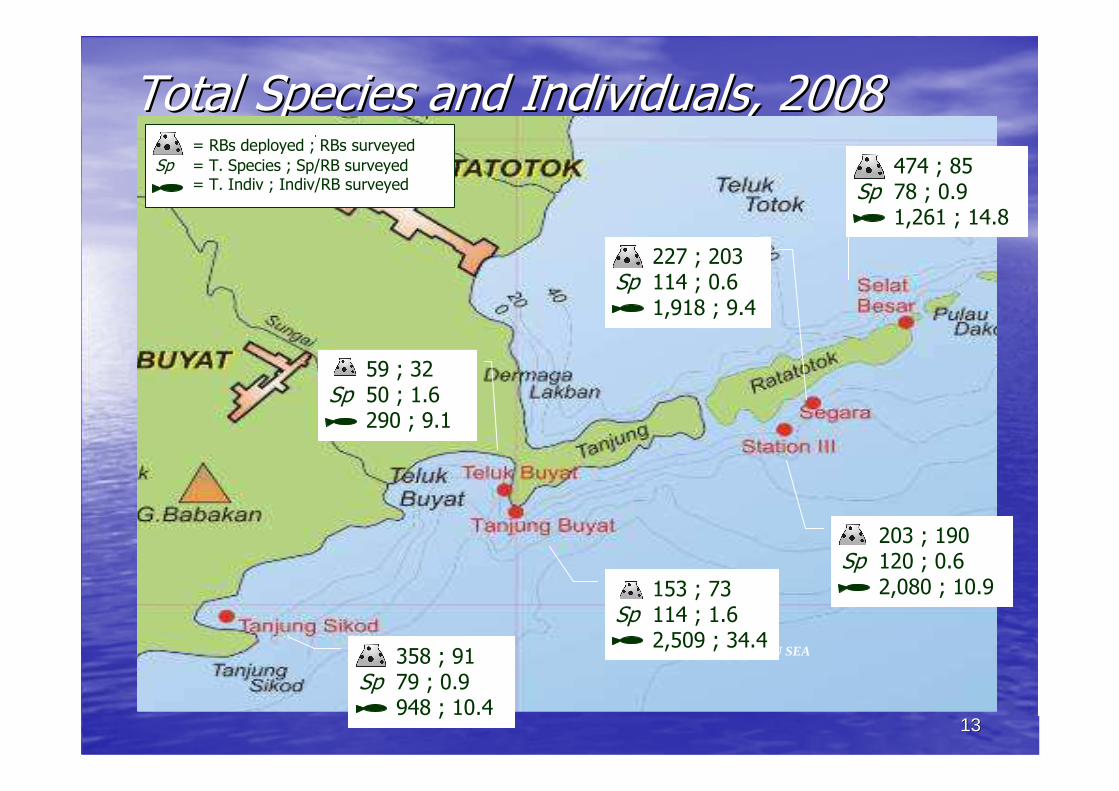
Total Species and Individuals, 2008Total Species and Individuals, 2008
MALUKU SEA
59 ; 32Sp 50 ; 1.6
290 ; 9.1
153 ; 73Sp 114 ; 1.6
2,509 ; 34.4
203 ; 190Sp 120 ; 0.6
2,080 ; 10.9
227 ; 203Sp 114 ; 0.6
1,918 ; 9.4
474 ; 85Sp 78 ; 0.9
1,261 ; 14.8
358 ; 91Sp 79 ; 0.9
948 ; 10.4
= RBs deployed ; RBs surveyed
Sp = T. Species ; Sp/RB surveyed= T. Indiv ; Indiv/RB surveyed

1414

1515
Top 5 species, all sitesTop 5 species, all sites
•• The top 5 most abundant species from all sites The top 5 most abundant species from all sites combined were:combined were:
1.1. Blue streak fusilier (Blue streak fusilier (PterocaesioPterocaesio tiletile))2.2. Yellow tail fusilier (Yellow tail fusilier (CaesioCaesio cuningcuning))3.3. Blue stripe snapper (Blue stripe snapper (LutjanusLutjanus kasmirakasmira))4.4. TwoTwo--tone tang (tone tang (ZebrasomaZebrasoma scopasscopas))5.5. Moorish idol (Moorish idol (ZanclusZanclus cornutuscornutus))
•• Dominant Families: Dominant Families: AcanthuridaeAcanthuridae, , LutjanidaeLutjanidae, , MullidaeMullidae, , SiganidaeSiganidae, and , and ScaridaeScaridae..
•• Roughly an equal split between commercial and coral Roughly an equal split between commercial and coral reef species overall.reef species overall.

1616
ConclusionsConclusions
•• Likely factors influencing the variations between sites include:Likely factors influencing the variations between sites include:
–– Number of Reef Balls; more = Number of Reef Balls; more = ��
–– Proximity to natural reef; <10m = Proximity to natural reef; <10m = ��
–– Spacing of Reef Balls; min gaps = Spacing of Reef Balls; min gaps = ��
–– Bottom type: hard substrate = Bottom type: hard substrate = �� caution…caution…
–– Water quality, nutrients, currentsWater quality, nutrients, currents
–– Depth; 15Depth; 15--25m = 25m = ��
•• During the 8 yrs of study (2001During the 8 yrs of study (2001--2008), colonization peaked at 6 to 7 2008), colonization peaked at 6 to 7 yrs. NB: Reef Balls deployed between 1999yrs. NB: Reef Balls deployed between 1999--2000, therefore peak is 2000, therefore peak is actually year 7 to 8.actually year 7 to 8.
•• Drop in numbers, 2007 to 2008 could be due to cessation of marinDrop in numbers, 2007 to 2008 could be due to cessation of marine e police patrolling the area from 2006 onwards.police patrolling the area from 2006 onwards.

1717
Conclusions cont…Conclusions cont…
•• Objective 2 Objective 2 –– Mitigating impacts.Mitigating impacts.
–– Considered successful based on this study and other Considered successful based on this study and other
studies showing coral growth in impacted areas, and studies showing coral growth in impacted areas, and
increased awareness via local community increased awareness via local community
development programs. development programs.
•• Objective 3 Objective 3 –– employment/income.employment/income.
–– Reduced distance to fishing sites, increased number Reduced distance to fishing sites, increased number
of fishers, employment during construction.of fishers, employment during construction.

1818
Thank YouThank You
•• Questions?Questions?

1919
For further information:For further information:
•• David LennonDavid Lennon
Reef Ball AustraliaReef Ball Australia
E: [email protected]: [email protected]
•• Jerry KojansowJerry Kojansow
PT PT NewmontNewmont MinahasaMinahasa RayaRaya
E: E: [email protected]@newmont.com