Embed Size (px)
Citation preview

4825 Mark Center Drive • Alexandria, Virginia 22311-1850
CRM D0014586.A2/FinalSeptember 2006
Fiscally Informed Military Manpower Requirements
Omer E. Alper • Martha E. Koopman

This document represents the best opinion of CNA at the time of issue. It does not necessarily represent the opinion of the Department of the Navy.
Approved for Public Release; Distribution Unlimited. Specific authority: N00014-05-D-0500. Copies of this document can be obtained from the Defense Technical Information Center at www.dtic.mil or from the CNA Document Control and Distribution Section by calling (703) 824-2123.
Copyright © 2006 The CNA Corporation
Approved for distribution: September 2006
Henry S. Griffis, DirectorWorkforce, Education and Training TeamResource Analysis Division

Contents
Executive summary . . . . . . . . . . . . . . . . . . . . . . . . 1
Introduction: Why cost matters for requirements . . . . . . . . 5
The role of requirements in the current system . . . . . . . . . 7The Manpower Requirements Determination process . . . 7
Fleet requirements . . . . . . . . . . . . . . . . . . . 8New construction . . . . . . . . . . . . . . . . . . . . 10Shore requirements. . . . . . . . . . . . . . . . . . . 11Do fiscal considerations enter this stage
of requirements determination? . . . . . . . . . . . 12From requirements to funded billets: The role
of the PPBES . . . . . . . . . . . . . . . . . . . . . . . . 14The players . . . . . . . . . . . . . . . . . . . . . . . 14The process . . . . . . . . . . . . . . . . . . . . . . . 16PPBES and manpower requirements . . . . . . . . . 17
Single Resource Sponsor for manpower: Advantages and disadvantages. . . . . . . . . . . . . . . . . . . . . . 19
Positive features . . . . . . . . . . . . . . . . . . . . . 20Negative features . . . . . . . . . . . . . . . . . . . . 20Analogy to military-to-civilian billet exchanges . . . . 21
Changes under the Enterprise system. . . . . . . . . . . . 22Why don’t requirements include all fiscal information? . . 23
Poor pricing implies bad incentives . . . . . . . . . . 25Manpower not allocated to activities that value
it most . . . . . . . . . . . . . . . . . . . . . . . . . 26Allocation by negotiation is costly process. . . . . . . 27Budget process may favor overreliance on MPN . . . 27
The potential cost of fiscally uninformed requirements . . 27Organizational distance between Navy field
activities and HQ . . . . . . . . . . . . . . . . . . . 28Evidence from like activities on the scope for
substitution . . . . . . . . . . . . . . . . . . . . . . 29
i

Making demand for military manpower more fiscally informed . . . . . . . . . . . . . . . . . . . . . . . . . 33
End users must have fungible budgets and pay for manpower . . . . . . . . . . . . . . . . . . . . . . . . 34
Incorporating fungibility under current PPBE . . . . 35Topline controls must be firm . . . . . . . . . . . . . 36
Optimal billet programming rates must reflect marginal cost . . . . . . . . . . . . . . . . . . . . . . . . 37
Variable indirect and joint costs . . . . . . . . . . . . 37Demand-based cost allocation for efficient
billet pricing . . . . . . . . . . . . . . . . . . . . . . 39Fixed-price mechanisms . . . . . . . . . . . . . . . . . . . 39Flexible price mechanisms. . . . . . . . . . . . . . . . . . 41
Billet auctions . . . . . . . . . . . . . . . . . . . . . . 41Accommodating executability constraints . . . . . . . 43Billet trading . . . . . . . . . . . . . . . . . . . . . . 44
Addressing concerns with more flexible lower-level budgets . . . . . . . . . . . . . . . . . . . . . . . . . . . 44
Meeting the aggregate endstrength target . . . . . . 44Preserving top-level control over mission priorities . . 45Equipping activities to handle more resource
decisions . . . . . . . . . . . . . . . . . . . . . . . . 46Interim steps toward fiscally informed requirements . . . 46
Billet buying wargame . . . . . . . . . . . . . . . . . 46Shared savings awards for micro-initiatives . . . . . . 47Expanded granular programming . . . . . . . . . . . 47
Evidence on manpower substitution . . . . . . . . . . . . . . . 49Some context: aggregate trends in wages
and manpower . . . . . . . . . . . . . . . . . . . . . . . 49Has civilian substitution exceeded military? . . . . . . . . 50Have activities with more fiscally informed requirements
shown relatively more response in BA? . . . . . . . . . . 53
Appendix A: Other transfer price mechanisms . . . . . . . . . 59Transfer pricing with externalities: Groves-Clarke
mechanisms . . . . . . . . . . . . . . . . . . . . . . . . . 59Generalized Vickery auction. . . . . . . . . . . . . . . . . 61
ii

Appendix B: Examples of budget decentralization in the public sector . . . . . . . . . . . . . . . . . . . . . . . . . . . 63
University of Heidelberg Project IMPULSE . . . . . . . . 63Revised financing and prospective budgeting in
TRICARE . . . . . . . . . . . . . . . . . . . . . . . . . . 65
Appendix C: Summary statistics for regression data. . . . . . . 67
References . . . . . . . . . . . . . . . . . . . . . . . . . . . . . 71
List of figures . . . . . . . . . . . . . . . . . . . . . . . . . . . 73
List of tables . . . . . . . . . . . . . . . . . . . . . . . . . . . . 75
iii

This page intentionally left blank.
iv

Executive summary
There is concern that requirements for the Navy’s military manpower are being developed with insufficient attention to cost. In this sense, today’s requirements may be called “fiscally uninformed.” While today’s requirements may be sufficient to accomplish the mission, it is important that they accomplish the mission at lowest cost.
In this study, we describe the current manpower requirements deter-mination process, identify why requirements are not fiscally informed, and develop ideas for more market-based, cost-informed requirements determination.
The Navy's requirements determination process consists of two stages. In the first stage, requirements without considering con-straints on funds are generated by taking fleet and shore command inputs through industrial engineering models. For fleet activities, this process is centralized and run by N1’s Navy Manpower and Material Analysis Center (NAVMAC). For shore activities, this process is much more decentralized. Once these requirements have been generated, the Planning, Programming, Budgeting, and Execution System (PPBES) takes over, and the decision of what billets to fund is made. This decision is made by an interaction among N1 as the Single Resource Sponsor (SRS) for manpower, the Navy Enterprises, the Budget Submitting Offices (BSOs), and N8.
Recent changes in the PPBES system—namely, N1 becoming SRS for manpower and the creation of Navy Enterprises—have yet to fully play out. The most important feature of the SRS structure is that con-trol of the entire military personnel budget is transferred from the traditional Resource Sponsors (RSs) to N1. On one hand, this change gives the greatest promise of the new system—the ability to innovate and to streamline the process. On the other hand, it is the most trou-blesome aspect because RSs will no longer have the ability to trade off manpower for other appropriations. Although these changes will
1

occur in other areas, we have seen little evidence to suggest that these changes in and of themselves will materially affect the cost incentives facing BSOs and their field activities.
The lack of fiscally informed requirements in the current system stems from the incentives created by certain features of the PPBES process. In particular, the Navy’s BSOs and their field activities have more information about actual operations under their control, but they are not able to make tradeoffs between all of their resources. If they give up military billets, or request extra military billets, they do not typically get the associated savings or pay the costs. The costs or savings go into the general Military Personnel (MilPers) account or go to their RS but are generally not traced back to the BSO.
Thus, an organization at the field level, with the best knowledge regarding how military manpower should be structured by rank and skill, as well as how military manpower should be traded for other types of manpower and capital, may not have the best incentives to use manpower efficiently. For one thing, it may not use its knowledge to innovate and obtain better knowledge about how to reduce man-power costs. At worst, it may be reluctant to reveal its knowledge of possible innovations and savings for fear of losing MilPers funding without gaining the needed Operations and Maintenance (O&M) funding to make necessary expenditures for technology, government civilians, or contractor labor.
We find some evidence that Navy activities have historically reduced civilian manpower more than military manpower. Such behavior is consistent with the different cost incentives that activities face for the two types of manpower. Savings from civilian manpower are retained in an activity’s O&M budget and can be redirected toward a host of alternate resources, whereas the activity would lose any military man-power savings. In addition, evidence suggests that several types of activities that we would expect to make more cost-informed military manpower requirements decisions, such as working-capital-funded activities, have indeed reduced military manpower at a greater rate than their peer activities.
Military manpower requirements would become more fiscally informed if the people making the decisions about requirements and
2

authorizations faced the same resource tradeoffs as the Navy. We pro-pose two general variants of more market-based processes for military manpower requirements. In general, such a process would involve three key departures from the current system:
• Give end users of military manpower more financial fungibility, or the ability to exchange programmed funds in one appropri-ation for another.
• Charge end users for the military manpower they use.
• Make prices reflect the costs to the Navy of military billets. Sev-eral approaches to this are possible. An easily implemented one would be to make prices (or programming rates) more granu-lar by manpower type. Other approaches, such as auctions, result in better prices but may be more difficult to implement.
3

This page intentionally left blank.
4

Introduction: Why cost matters for requirements
An often-repeated statement is that military manpower requirements should not incorporate cost because they are supposed to reflect what it takes to “accomplish the mission” without regard to cost. Although the last phrase of this statement might be taken to mean, “without regard to available funding,” it should not mean “without regard to tradeoffs.”
A fundamental premise of economic analysis is that there are usually alternative ways to produce a given output—in this case, “accomplish-ing the mission.” Many of these alternatives involve substituting man-power in some way. For example, fewer, more skilled Sailors may be able to produce the same output as a greater number of less skilled Sailors. Perhaps a sophisticated piece of electronic equipment can automate work that could also be done manually.
Each of these alternatives entails a different cost, even though they all lead to the same output—accomplishing the mission. It is important to have requirements that show how to achieve the mission in the most cost-effective way, so that we can get the most output from any given overall budget.
In figure 1, each point on the graph represents a different combina-tion of Military Personnel, Navy (MPN) and Operations and Mainte-nance, Navy (O&MN) budgets that an activity might have. Point A notionally reflects requirements that have been developed without regard to tradeoffs, and point B is where true least-cost requirements should be. That is, points A and B are on the same isoquant, a curve along which all points result in the mission being accomplished. Point B lies on a lower isocost, a line along which all points entail the same total cost. Both are technically efficient (no more output can be produced from the given inputs), but only B is allocatively efficient
5

(no other combination of $MPN and $O&MN can produce the output at lower total cost). We refer to point B as requirements that are “fiscally informed.” The difference in total cost between points A and B represents budgetary resources that can be freed for other uses.
Typically, activities’ requirements are not fully funded. This means that an activity requesting requirements represented by point A may find itself in a situation such as point C, where the activity must accept some risk that it will not achieve its mission. In principle, the activity could eliminate this risk at zero net cost by increasing its $O&MN budget with offsets from its $MPN budget, moving along the diagonal line from C to B. In practice, however, features of the current PPBES process do not facilitate such tradeoffs. In the next section, we describe the current manpower requirements process and obstacles in the system that prevent activities from requesting optimal, least-cost requirements (point B).
Figure 1. Requested (A), optimal (least-cost) (B), and funded (C) requirements, notional
$MPN
$OMN
Combos of $MPN, $OMN that achieve mission: Isoquant
Budget cost of fully funding current requirements
Requested $MPN Rqmt
Optimal $MPN Rqmt
Optimal $OMN Rqmt
Budget cost of least-cost requirements
Requested $OMN Rqmt
A
B
C
Funded $MPN Rqmt
Funded $OMN Rqmt
Combos of $MPN, $OMN that impose greater risk of not achieving mission
6

The role of requirements in the current system
Figure 2 shows how a billet, or a manpower requirement, is created. This is a two-part process. The first subsection discusses Manpower Requirements Determination (MRD). We then turn to the Planning, Programming, Budgeting and Execution System (PPBES).
The Manpower Requirements Determination process
The MRD process begins with the identification of an activity's work-load based either on its Required Operational Capabilities (ROC) and Projected Operational Environment (POE) if it is an operational unit or on its Mission, Functions, and Tasks (MFT) statement if it is a shore activity.1 Once the workload is determined, the manpower
Figure 2. The steps in creating a billet
1. Reference [1] gives instructions for each step in this process; [2] is doc-umentation for setting manpower requirements for new construction.
Activity workload: ROC/POE or MFT
Identify requirement
Validate requirement
Allocate funding
Create billet
Manpower Requirements
Determination (MRD)
PPBES
Activity workload: ROC/POE or MFT
Identify requirement
Validate requirement
Allocate funding
Create billet
Activity workload: ROC/POE or MFT
Identify requirement
Validate requirement
Allocate funding
Create billet
Manpower Requirements
Determination (MRD)
PPBES
7

needed to accomplish this workload must be identified—both by quantity, the number of requirements, and by quality, the paygrade and skills required. Workload is translated into manpower require-ments in different ways for fleet and shore units; we will discuss this in more detail later.
A notable aspect of the Navy's requirements determination process is that, when deciding what manpower is needed, there is an instruction that seems to imply that referring to financial considerations is explic-itly forbidden. The first paragraph of [1] states:
The zero-based concept is basic to determining manpower requirements. Under this concept, the Navy determines multi-year manpower requirements without consideration of funds, availability of personnel, or organization. Manpower requirements shall be supported by actual or projected workload based on approved operational require-ments in support of the directed mission.
In other words, requirements are to be derived from mission needs only, without reference to costs or any other complicating factors. That is the most common interpretation. Another possible interpre-tation, however, is that the Navy could take into account relative prices, but need not consider total budget constraints. We can illus-trate this by returning to figure 1. The quote above prohibits deciding on C rather than A because of constraints on funds. It does not, how-ever, limit deciding on B rather than A because both accomplish the mission with certainty.
Requirements are next validated, or reviewed, to ensure that they meet the criteria of the ROC/POE or MFT statements. Once the requirements have passed the validation stage, programming deci-sions regarding whether they will be funded are made. These deci-sions are part of the programming phase of the PPBES, which is discussed later. All of these steps are part of creating a requirement and then a valid, funded billet.
Fleet requirements
The process for identifying and validating manpower requirements is different in fleet activities and shore activities. The N12 division of N1
8

determines fleet activities’ requirements based on ROC/POEs sub-mitted by fleet commands. NAVMAC, also a division of N1, performs the MRD function of generating and validating requirements for fleet activities. Shore activities, however, use the Shore Manpower Require-ments Determination Program, in which a number of organizations generate requirements.
Much more has been written about fleet activities, and the process is more grounded in principles of industrial engineering.2 Without going into the details of N1’s NAVMAC model, it first sets wartime manpower requirements, M+1, based on 100 percent of the force that is needed to meet readiness requirements. This model, which is applied to ships, squadrons, staffs, and other fleet units, sets wartime workload requirements based on well-developed strategy and mission statements. Workloads take into account such factors as how much time Sailors spend in operational manning or watchstanding, admin-istrative and support activities, maintenance, and also training and other activities that are not directly productive.
Once workload estimates are determined, they must be converted to manpower requirements or billets with specific ranks, paygrades, des-ignators, and ratings. The Navy Manpower Requirements System (NMRS) translates workload into billets via an interactive optimiza-tion program. The first step is to apply a standard workweek, but the work must also be allocated by division and type of work. That is, each Sailor may perform some specified fraction of work in his or her own division and rating, then have the remaining hours left for non-watch-standing requirements. In this way, the workload is parceled out in accordance with department, division, and rating boundaries.
The numbers in each paygrade are computed using Staffing Standard tables, which are matrices that relate the percentage in each paygrade to the number of people. Each rating has different Staffing Tables, with some ratings more senior, in general, than others. Distributions are usually centered on a mid-level paygrade so that, if only one person is needed, he or she will be an E-5 (see [3] for details).
2. See [3] for a discussion of the NAVMAC model as used in determining requirements for Ship Manning Documents (SMDs).
9

The process for reviewing and revising fleet requirements is very cen-tralized. Warfare Sponsors (WSs) prepare draft revisions and forward them to NAVMAC, which assesses the draft changes and develops a more complete change request. This request is reviewed by the Com-mander, Fleet Forces Command, Type Commanders, and System Commanders; finally, it is forwarded to the Deputy Commander of Naval Operations (Plans, Policy and Operations) (N3/N5). Only after passing all of these hurdles is the revised requirement signed by the WS and sent back to NAVMAC to be entered into the system.
Despite documented shortcomings, [3] concludes that the fleet MRD process:
accomplishes the stated goals of establishing a credible basis for ship manning, assisting in the management of readiness and personnel, and validating workload—independent of warfare sponsors and costs. It does so through extensive data collection, feedback from the fleets, compliance with policies and instructions, reference to equipment manuals, and a rigorous computer model (NMRS) that computes numbers and types of billets based on projected workload.
New construction
The process for creating Preliminary Ship Manning Documents (PSMDs) and SMDs (including equivalents for squadrons and even large shore facilities) includes a manpower group that ensures that tradeoffs are made between manpower and capital equipment on the ship. These Human Systems Integration (HSI) groups usually work to substitute new labor-saving technology for manpower. According to [2], manpower tradeoffs must be considered before the acquisition of new systems:
An affordability determination results from the process of addressing cost during the requirements process and is included in each Capability Development Document using life-cycle costs or, if available, total ownership cost. Transi-tion into System Development and Demonstration also requires full funding (i.e. inclusion of the dollars and man-power needed for all current and future efforts to carry out the acquisition strategy in the budget and out-year program).
10

Shore requirements
The process for identifying and validating shore requirements has two notable differences from the fleet requirements system. One is that it is performed in a more decentralized manner with capability sponsors and Budget Submitting Offices (BSOs) responsible for the determination and validation of their requirements. The effects of this decentralized system, the incentives it implies, and how these incentives can be improved are the subjects of the latter half of this research memorandum.
The second major difference is that the shore process does not have the same rigor and structure as the NAVMAC process and NMRS model. There used to be a more centralized system run by NAVMAC called SHORSTAMPS, but this was discontinued in 1983. Now the Shore Manpower Requirements Determination Program (SMRDP) provides a set of guidelines. The SMRDP relies on claimants to gener-ate Mission, Function, and Task (MFT) statements and use them to derive workload requirements. The process does provide for central-ized management oversight to ensure consistent application of man-power requirements, the proper allocation of military personnel resources, and the sharing of good ideas and tools across claimancies.
As stated in [1], however, the instruction explicitly allows manpower claimants “flexibility to determine how they will execute the SMRDP.” In particular,
Manpower claimants have the latitude to use a broad range of industrial engineering or other justifiable techniques provided they yield accurate manpower requirements and can withstand outside scrutiny.
Also unlike operational requirements, very little is mentioned in the instruction about reviewing and validating shore requirements. A Commercial Activities (CA) review can be part of a shore require-ments study, but it is not mandatory. Also, having an SMRDP and maintaining detailed backup documentation until the next study is required, but there is no mention of who might review and validate the documentation.
11

In POM-08, the Commander, Naval Installations (CNI) was in the unique position of being “double-hatted”—that is, the same office was a BSO and also joined with Naval Facilities (NAVFAC) to be CNI. In this dual role, CNI was in a position to move toward making the shore requirements system more standardized and closer to the NAVMAC system for fleet requirements.
Do fiscal considerations enter this stage of requirements determination?
For the most part, fiscal considerations enter the billet creation pro-cess when funding is allocated in the PPBES. There are, however, some examples of cost considerations coming into play in the early portions of the process.
Top-down and bottom-up cost-savings in fleet requirements
In the fleet requirements process, we found evidence that the number of billets responded to pressure from top-level decision-makers to control manpower costs. We also heard from NAVMAC staff (in a discussion on 8 September 2005) that part of their process is to visit field units and integrate cost-saving measures that these units have adopted into their model.
We verified one case of top-down savings using CNA's Billet File, which is an extract from the Total Force Manpower Management System (TFMMS). In this file, one can see that in mid-2004 all requirements were lowered to equal the current Billets Authorized (BA). Furthermore, in some ship classes that previously had varia-tions in BA across different ships in the class, BA and requirements were lowered to equal the lowest prior BA. The people we interviewed at NAVMAC reported that this was the result of a directive from N12, and a Naval Audit report confirmed this.
Another initiative that started as a top-down cost-saving move was an optimal manning exercise that recently reduced requirements on USS Milius (DDG-69) from 272 to 247. The admiral involved origi-nally wanted to get down to 232 at the CNO’s urging to save $50 bil-lion, but the stakeholders would agree to only a partial list of policies that would have to be changed, thus reducing the required workload
12

on board. The remainder entailed too much risk for at least one of the five stakeholders. The stakeholders were Surface Forces Com-mand, Fleet Forces Command, NAVSEA, PERS-4, and N76. N12 and NAVMAC facilitated dialogue via a web-based forum called HSI-Clip. The end result is a waiver from some standard policies for this class of ships that allows manning to be reduced by 25 billets.
The NAVMAC representatives also mentioned that the fleet often picks up new technologies, many of which NAVMAC finds out about during site visits. These innovations are then included in the work-load models. More innovations are documented for aircraft, as these are centrally documented. One example that was mentioned was that of bar coding of material that was being loaded onto aircraft.
Military-to-civilian substitution: Potential to influence shore requirements
BSOs sometimes propose military-to-civilian conversions expecting money to hire civilians. They have perhaps done an analysis that shows that civilians are much more cost effective than military—so much so that, if the system works and the BSO gets MilPers savings to spend on O&M, the military-to-civilian trade should provide fiscal incentive to use military effectively.
We heard again and again, however, that the problem is that the MilPers that activities gave up was never adequately compensated for in the O&M account. Thus, the incentive for their people to innovate and look for savings is reduced or eliminated because the return on their effort is lacking.3
There is an incentive to have too many military personnel. This is because military billets are paid for out of the MilPers budget, which capability sponsors or BSOs do not have to pay. Thus, military person-nel appear to be essentially free to the BSOs. Government civilians and contractors are paid for with O&M funds, which the BSOs do
3. “Military-to-Civilian Conversion: Creating a Defense-Wide Strategy,” conference sponsored by the Office of the Under Secretary of Defense for Personnel and Readiness, 19 September 2005.
13

have to subtract from their own budgets. It is highly likely, therefore, that activities will have too many military personnel.
From requirements to funded billets: The role of the PPBES
The Planning, Programming, Budgeting and Execution System is a DoD resource management system that assists CNO and SecNav in allocating Navy resources to fund specific programs in support of national strategy. A DoD directive [4] states that:
The ultimate objective of the DoD PPBES is to provide the best mix of forces, equipment, and support attainable with fiscal constraints.
From this it is immediately clear that the PPBES is where fiscal infor-mation will enter the requirements determination process.
In this subsection, we will describe the players involved and how this process works in more detail. We will focus more on how the process operates currently and leave our discussion of the incentives it pro-duces and how those might be improved to a later part of the paper.
Many changes are taking place in the PPBES cycle, some visible in var-ious ways in PR-07 and POM-08, and some planned for PR-09. These changes include (1) changing N1 to the Single Resource Sponsor (SRS) for manpower and (2) adopting and defining the Enterprise system. It is difficult to describe the “current” system of the PPBES because so many changes are happening at once, and the final state of many of these changes is unknown. Will enacting the SRS and Enterprise system introduce more fiscal information into require-ments determination? It may seem so on paper, but no one knows how the changes will play out. We will, however, discuss here and later in the paper how the changes might affect the process and outcomes.
The players
Resource Sponsors (RSs)
RSs control the funding or Total Obligated Authorization (TOA) for manpower. An RS can be thought of as a banker who controls the money to pay for the endstrength applied against requirements.
14

Under the traditional RS structure, different communities (i.e., sur-face warfare, air warfare) had their own RSs, resulting in the N85/N86/N87/N88 organizations. Each RS had control of its own funding for manpower, acquisitions, and operations. Since each of the tradi-tional RSs received a share of TOA from different appropriations, they could make tradeoffs across appropriations. Since the SRS reor-ganization, N1 is the only RS for the entire MilPers TOA and there are other SRSs, such as N4.
Navy Enterprises
Enterprises, such as the Naval Aviation Enterprise (NAE), in the new system are envisioned to have several levels. At the highest level, the 3- and 4-star level, would be the Navy Enterprise Board, which would act as the senior Navy strategic decision forum and would provide guidance in making programming decisions. It would set vision and establish policy while removing top-level barriers.
At the next level down would be the Fleet Enterprise Leadership Board, consisting mostly of 3-star Admirals. This board would have two dimensions. Across the top would be the five Enterprises: one each for aviation, surface, and submarine, then network warfare and expeditionary warfare. The second dimension, along the side, would have enabling organizations that provide the services the Enterprises need to complete their missions. Some examples of these enabling organizations are Manpower Personnel, Education and Training (MPT&E), installations, and health care.
Budget Submitting Offices (BSOs)4
BSOs can be thought of as the customers of the PPBES. They are the principal officials responsible for manpower within their constituen-cies or as the requirements advocates. They are responsible for requesting the personnel to support naval missions and activities within their area.
4. BSOs were formerly called manpower claimants.
15

N8
N8 guides the process. It provides balance in the PPBES by serving as referee among BSOs and sponsors. In particular, N80 is the Program-ming Division, the organization that is in charge of coordinating and managing the Navy programming process. N80 is considered to be the PPBES manager for the Navy. N81 is the Assessment Division, and N82 (Financial Management and Budget (FMB)) is involved in the budgeting phase.
The process
PPBES is the heart of the DoD resource allocation process and pro-vides the mechanisms for planning for the future and reexamining prior decisions in light of the present environment. It is an iterative process with the following four phases:5
• Planning involves identifying threats to national security, assess-ing our current capabilities to meet those threats, and recom-mending the forces required to defeat them. It attempts to answer the question: “How much defense is enough?”
• In the programming phase, the object is to transform the plan-ning guidance into a 6-year resource proposal. In addition to the planning guidance, the other crucial factor is how much money is available. The challenge of this phase is to apply a fiscal constraint to the guidance from the planning phase and generate an acceptable proposal for how the Navy wants to assign the available dollars to programs. This phase answers the questions: “How much defense can we afford?” “What combination of resources will we use to attain that level?” The answers to these questions are contained in the Navy's Pro-gram Objective Memoranda (POM).
5. This discussion borrows heavily from the PPBE tutorial at http://cno-n6.hq.navy.mil/N6E/PPBS/default.htm
16

The counterpart in the manpower world is that RSs must allo-cate their limited budgets and decide how many and which manpower requirements to buy. They may buy only require-ments that have come out of the MRD, but requirements do not become funded billets until an RS also decides to allocate resources against them.
• The budgeting phase takes the 6-year resource proposal and makes the first 2 years into an executable proposal. Issues that are examined include cost changes, the ability of programs receiving funds to spend them in the year they are provided, and the impacts of slips in schedules. This phase answers the question, “Can we execute the plan efficiently?”
• The execution phase involves actions taken after the Congress has appropriated the money and the budget is in place and being spent.
PPBES is a complex system characterized by “creative tension” among organizations assigned different roles. The intention is to use the ten-sion and competition among the various RSs and BSOs to produce the best possible program of resource use and budget. Balance in the competition is achieved through three organizations that serve as ref-erees in the contest: N80, N81, and N82/FMB. The complexity of the process is most pronounced in an appropriation such as MilPers, which has hundreds of RS and capability sponsor decisions that have to be integrated and evaluated to determine whether the sum really does make a coherent, intelligent, and executable whole (see [5]).
PPBES and manpower requirements
BSOs are responsible for providing specific services. The BSOs have more information about actual operations under their control, but they are not able to make tradeoffs between all of their resources. In particular, if they give up military billets, or request extra military bil-lets, they do not typically get the associated savings or pay the costs. The costs or savings go into the general MilPers account or go to their RSs but are generally not traced back to the BSO. Thus, the organiza-tion with the best knowledge regarding how military manpower should be structured by rank and skill within its organization, as well
17

as how military manpower should be traded for other types of man-power and capital, may not have the best incentives to use manpower efficiently.
In the system before the SRS reform, there were many Resource Sponsors for military manpower. For example, each traditional RS served as the RS for military manpower within its jurisdiction. These RSs and other RSs funded active and reserve military personnel requirements with dollars from their MilPers account.6 These mili-tary personnel served in both operational and shore activities. The RSs also controlled Operations and Maintenance, Navy (O&MN), RDT&E, and acquisition budgets and were able to trade off funds between appropriations within certain limits and over certain time horizons. Since civilian personnel, contractors, capital purchases and other spending is made from the O&MN account, the traditional RSs had the ability to make substitutions of military manpower for other types of manpower, goods and services, acquisition, and research and development. However, the RSs are typically rather far removed from direct knowledge of the workings of the organization, especially with shore activities.
Once the BSOs have determined manpower requirements and RSs have decided which to fund, the next step in setting the program or the budget is to determine executability. The “referees” in the pro-cess—N12, N80, and FMB—do this. There are two components to executability. One is the budgeting problem, that the demands of the various organizations must be costed out and reconciled with the total amount that is available to spend. The second is a staffing prob-lem, a matter of determining whether recruiting, reenlistment, train-ing, and distribution goals can be met. In this sense, N1 can be seen as a large staffing organization. Right now this organization operates in a centralized manner as opposed to a “free market” system based on supply and demand. For example, it does not tell the RS how much various billets cost and let them decide what to buy. Instead, it
6. The MilPers account includes both the Military Personnel, Navy (MPN) budget for active duty military and the Reserve Personnel, Navy (RPN) budget for the Reserves.
18

lets the RSs propose what they want to buy, and then determines if the aggregate is executable and offers alternatives.
Single Resource Sponsor for manpower: Advantages and disadvantages
The traditional PPBES system is undergoing significant changes as N1 and other RSs consolidate into SRSs in their areas of responsibility at the same time that the Navy-wide Enterprise System is evolving. These changes overlap and have such far-reaching effects that it is dif-ficult to discuss them separately. Also, both initiatives are still very much in the planning stages, so it is difficult to predict what their mature forms will be. Nevertheless, since one charter of this project was specifically to assess the effect of the SRS on the requirements determination process, we will start there and interject elements of the Enterprise System where appropriate.
N1 is taking on the responsibility as the Single Resource Sponsor for manpower first for military manpower and then for civilian. As the SRS, N1 will coordinate the manpower actions of resource sponsors for other appropriations, claimants, and BSOs. The results of an eval-uative wargame conducted in 2005, however, indicated that care must be taken to make sure that N1 remains a useful facilitator and not an advocate for manpower and training that will grow into its own cum-bersome bureaucracy.
In the past, N1 has had many roles in the manpower PPBES process. It is the Appropriation Sponsor for MilPers, N12 operates as the Single Manpower Sponsor, and N1 was one of the largest RSs for man-power and even a BSO. There were, however, multiple RSs for man-power. With the move to N1 as Single Resource Sponsor for manpower, however, N1 will be both the appropriation sponsor for MilPers and the only RS. There will, however, still be creative tension and referees in the system. The BSOs will continue to play their tradi-tional role, as will the N8 offices. Also, there will still be negotiations among N1, the new Enterprises, and other organizations as the pro-cess plays out.
19

Positive features
Having N1 as SRS involves several possible benefits:
• All Enterprises and BSOs will feed their manpower demands to the same organization. This may have two advantages. First, it may provide more visibility and accountability into the pro-cesses that the BSOs are using. Second, it may make it easier to introduce innovations, such as the market mechanisms and billet trading arrangements that are discussed later in this paper.
• N1, as an SRS, can become a large, efficient staffing organiza-tion for a system based on supply and demand. It could concen-trate on establishing efficient recruiting, training, and pipeline distribution mechanisms and on estimating accurate prices for manpower. The Enterprises and BSOs could then set man-power demands based on these prices. Given how complicated manpower “executability” is, both from the budget standpoint and the community planning standpoint, there may be less fric-tion in a system where an SRS has the sole responsibility as a central planning body.
• The SRS process will place all military manpower dollars under N1 control, thus streamlining the MilPers PPBES process. At least one other budget line has a single RS—N4, the RS for O&MN. In this case, it is believed that the single sponsor makes the process move more smoothly and effectively because N4 can analyze, arbitrate, and quickly realign resources when the program appears to be in trouble or requires changes. It is pre-cisely moving the manpower dollars away from the traditional RSs to an SRS, however, that also creates many of the possible problems in the N1 case.
Negative features
The SRS structure also has several difficulties. The first, and most important, is caused simply by moving control over MilPers from the traditional RSs to N1. This change removes the traditional RSs’ fiscal accountability for manpower. In other words, the traditional RSs, who
20

have the need and the knowledge to make the tradeoffs, will no longer benefit financially from making tradeoffs between MilPers, O&MN, and acquisitions. They will still have the ability to trade mili-tary manpower for civilian manpower or capital, but they will no longer retain the savings or pay the costs.
Even if N1 does its best to keep costs as low as possible, it will not have the ability to trade military manpower for other resources. Further-more, N1 is one step further removed from the specific knowledge regarding manpower requirements, technology, and how to run orga-nizations within individual RSs and BSOs. Thus, it will take a high degree of coordination and cooperation among N1, the other RSs, and BSOs for the SRS to be effective.
Another possible objection to N1 as SRS is that the role of one central planning body is simply too large. As was discussed earlier, N1 already has many roles in the MRD and PPBES process. Adding SRS may remove enough of the leverage of the other traditional RSs that the process no longer has the tension between competing agencies to work properly.
Analogy to military-to-civilian billet exchanges
N1 becoming an SRS is similar to the process of military-to-civilian billet exchanges in shore activities (actually sea or shore, but most military billets in sea activities are military essential). The BSOs, in set-ting their budgets, do not have to include money for military man-power: military billets are essentially “free goods” for them. They do, however, have to allocate O&MN dollars for government civilians and pay for any contractors. Suppose a Most Efficient Organization (MEO) study is done that suggests that it would be cost-effective to release some military billets and substitute fewer, less costly civilians. The activity is reluctant to do this because often when it releases mil-itary billets it does not receive the additional O&MN funding to pay the salaries of the civil servants. Thus, demand for military manpower remains artificially high.
In the same way, N1 would be paying for billets, but the Resource Sponsors would be using them. If the RS gives up MilPers, it must be guaranteed something in return or, just as in the example of military/
21

civilian conversions, the demand for military manpower will be too high. This is not an inevitable consequence of the SRS; however, in implementing it, incentives must be put in place that will recreate the traditional RSs' motives to make the correct tradeoffs among military manpower, other types of manpower, and capital.
Changes under the Enterprise system
The Enterprise and SRS systems are closely linked and should be dis-cussed concurrently. Enterprises are envisioned to work together with the providers and enablers to provide Budget Submitting Offices with separate budgets for MPN, OPN, and so on. As in the traditional system, BSOs can make within-appropriation tradeoffs only. The question is whether there are more incentives built into this new system to make these tradeoffs more fiscally informed. Another ques-tion is whether the information going from the BSOs back to the higher-level decision-makers is more fully based on fiscal incentives.
One problem in sorting out these questions is that the Enterprise system is not completely developed at this point. It is not clear to anyone exactly to whom the BSOs report and how the decisions will be made. The Enterprises are virtual organizations that are laid over the current Navy command structure. So, for example, the N1 in Commander, Naval Aviation Forces (CNAF) also works in the Naval Aviation Enterprise (NAE) and has a role as a BSO. Also, the Com-mander, Naval Installations (CNI) organization was a BSO under one hat and joined with NAVFAC and some other organizations to become the Installation enabler/provider under another hat. With such an uncertain command structure, it is difficult to ascertain how incentives will change.
One initiative, however, does seem promising. This is the plan to align ratings with Enterprises. Some ratings, such as the aviation rat-ings, already clearly belong to an Enterprise—in this case, the NAE. Other ratings, such as Yeoman (YN), are split across Enterprises, but there is an initiative to align each such rating with a specific Enter-prise. In this case, every rating would have a voice in the PPBES pro-cess that might introduce built-in incentives to make better decisions regarding the health of that rating.
22

For example, when N1 or N8 is short on funds at the end of the POM cycle, it is currently their practice to send out a “bogey” and tell all the BSOs to reduce their manpower budgets by a given percentage of money or people. This bogey typically is accompanied by an instruc-tion to make the largest cuts in certain paygrades. With advocates for ratings, however, each rating can design its own “best” pyramid with rollups or rolldowns. It can also advocate for the proper number of in-skill billets. This would particularly benefit the shared ratings.
Why don’t requirements include all fiscal information?
In the traditional system, the entire DoN Total Obligated Authoriza-tion (TOA) was divided among the traditional RSs and all the many smaller RSs, each of which controlled its own military manpower budget (see figure 3).
Figure 3. Requirements to funded billets in the traditional system
N76 TOA N78 TOA N75 TOA N1 TOA
MPN
1) DoN TOA divided among RSs
Funded
O&MN Other
2) Resource sponsors divide aggregate TOA across appropriations
4) Part or all of BSO’s requirements are funded in each appropriation.
Unfunded Funded
3) RSs provide BSOs separate budgets for MPN, O&M, etc.
BSOs can make within-appropriation tradeoffs only
Unfunded
Requirements to programs in the traditional system
BSO MPN Requirements BSO O&MN Requirements
23

The Resource Sponsors also controlled their own Operations and Maintenance, Navy (O&MN), Research, Development, Test and Eval-uation (RDT&E), acquisition, and other budgets and were able to trade off funds between appropriations within certain limits and over certain time horizons. Since civilian personnel, contractors, capital purchases, and other spending are made from the O&MN account, the traditional RSs had the ability to make substitutions of military manpower for other types of manpower and capital. The question is whether they had the correct information and incentives to make these substitutions correctly. That is, were there incentives built into the system that would make the information that the BSOs held flow back upward to the RSs?
The new SRS system has three RSs, organized along appropriation lines (see figure 4). N1 is the SRS for manpower and controls the entire MPN TOA. This means that N1 will have ultimate authority over the decision to authorize billets. Unlike in the traditional model, the RSs do not get money from more than one appropriation, so they cannot make tradeoffs across appropriations. Instead, representatives of the fleet (either Enterprises, such as the NAE, or Commander, Fleet Forces Command (CFFC)) negotiate with N1 to get their billets funded. These Enterprises and other fleet customers receive a por-tion of different appropriations from the SRS.
There is little difference between the two processes at the BSO level. As far as BSOs are concerned, they are being handed down separate pots of money for different appropriations. So, for example, a BSO cannot directly trade military manpower (paid for with MPN dollars) for civilian manpower (paid for with O&MN dollars). Also, within each appropriation, a BSO is likely to reach the endgame with some funded and some unfunded requirements in each appropriation, without the optimal built-in incentives to send the importance of dif-ferent outcomes back up to higher levels.
There are several reasons why neither of these systems is likely to result in truly fiscally informed requirements. Most of the limitations with current systems and the improved systems we can move toward are the subject of the rest of this paper. Here we will briefly outline some of the challenges that are presented by both the traditional and SRS systems.
24

Poor pricing implies bad incentives
Capability Sponsors (CSs) and BSOs are responsible for providing specific services. The CSs have more information about actual opera-tions under their control, but they are not able to make tradeoffs among all of their resources. In particular, if they give up military bil-lets, or request extra military billets, they do not typically get the asso-ciated savings or pay the costs. The costs or savings go into the general MilPers account or go to their RSs, but are usually not traced back to the CS. This means that the BSOs effectively perceive a price of zero for military manpower and report their demands accordingly. As a
Figure 4. Requirements to funded billets with Single Resource Sponsors
N76 TOA N78 TOA N75 TOA N1 TOA
MPN
1) DoN TOA divided among SRSs
Funded
O&MN Other
2) Enterprises get separate topline controls from each SRS. There is limited fungibility across appropriations.
4) Part or all of BSO’s requirements are funded in each appropriation.
Unfunded Funded
3) Enterprises provide their BSOs separate budgets for MPN, O&M, etc.
BSOs can make within-appropriation tradeoffs only
Unfunded
Requirements to programs with Single Resource Sponsors
BSO MPN Requirements BSO O&MN Requirements
N1 SRS N4 SRS N6/7 SRS
25

result, theory suggests that the BSOs’ demand for military manpower will be inefficiently high. This is one source of bad fiscal information in the programming and budgeting system.
An organization at the field level, with the best knowledge regarding how military manpower should be structured by rank and skill, as well as how military manpower should be traded for other types of man-power and capital, may not have the best incentives to use manpower efficiently. For one thing, it may not use its knowledge to innovate and obtain better knowledge about how to reduce manpower costs. At worst, it may be reluctant to reveal its knowledge of possible inno-vations and savings for fear of losing MilPers funding without gaining the needed O&MN funding to make necessary expenditures for tech-nology, government civilians, or contractor labor.
Also, because RSs face a single price for any officer and a single price for any enlisted, demand for military manpower will tend to be inef-ficiently skewed toward more senior, presumably more productive ranks and paygrades. This is true across types of ratings and designa-tors also. For example, because ratings with high entry requirements and long training pipelines cost the same as any other rating, there is no incentive not to pick the person who was more expensive for the Navy to recruit and train.
In summary, tradeoffs between military manpower, other types of manpower, and capital (on whatever level of the organization they are made) are not being made correctly because the relative prices are set incorrectly.
Manpower not allocated to activities that value it mostUnder the current system, if aggregate manpower demands are not executable and billets must be cut, these cuts are often made propor-tionally across BSOs; this may be “fair,” but it is inefficient. Under a cost-informed system, BSOs for whom manpower is most valuable would reveal themselves by their willingness to bear the costs.
Sometimes at the end of a POM budget-setting cycle there is a short-age of funds, and N1 and N8 have to cut the MPN account. Often this “bogey” is distributed across the board, with each BSO having to absorb an equal share, either by dollars or by number of people. The advantage of a dollar cut is that it allows the BSO more leeway to cut
26

the type of people it wishes to by paygrade. The more restrictions that N1 and N8 put on the bogey, the less room there is for tradeoffs by the people with the best information. The activities do not have the option of distributing the cut across appropriations as they see fit.
Allocation by negotiation is costly process
Right now, N1 operates in a very centralized manner as opposed to a free-market system based on supply and demand. For example, it does not tell the RSs, Enterprises, and BSOs how much various billets cost and let them decide what to buy (there is a single average program-ming rate for enlisted and officer). Instead, N1 lets the players pro-pose what they want to buy and then determines if the aggregate is executable or not and offers alternatives. There will be some back and forth between this “clearinghouse” (N1), the Resource Sponsors, the Enterprises, and the BSOs. The cost of this process needs to be fac-tored in when evaluating the cost of the current system.
Budget process may favor overreliance on MPN
An inefficiently high demand for military manpower may also partially result from the uncertainty associated with the budget process. Field-level activities ashore that prepare and submit requirements (both for manpower and O&MN budgets) may factor in the likelihood that part of their submitted requirements will not get authorized. At a mini-mum, BSOs want to obtain sufficient overall resources to accomplish their missions. But requirements do not guarantee resources. Each level of the budget chain must approve the commitment of resources. Due to the risk of having some part of their requirements unfunded, each BSO may have an incentive to add a premium to its require-ments. To the extent that MPN requests are more likely to get autho-rized than O&MN requests, there is an incentive (due only to the budget process) to ask for MPN rather than O&MN.
The potential cost of fiscally uninformed requirements
How significant an issue is the lack of fiscally informed requirements? The foregoing discussion suggests that the cost of fiscally uninformed requirements is likely to be larger (1) the farther removed those making resource decisions are from the best operational information
27

at the field level and (2) the greater the opportunities for substitution of manpower. In this subsection, we provide some relevant indicators.
Organizational distance between Navy field activities and HQ
How likely is it that information generated at the field level informs decisions at the headquarters level? One way to get a sense of the bar-riers to information flow within an organization is to examine its orga-nizational chart. The more layers of command (or management) there are, the more difficult it may be for field activities to communi-cate possible resource tradeoffs up the chain. One reason is that a proposed tradeoff must clear more budgetary decision “hurdles” the more layers there are.
The Navy organizational hierarchy is well documented in the Stan-dard Navy Distribution List (SNDL). The Navy chain of command is organized into echelons, with the top (echelon 1) composed of head-quarters activities that report directly to the Secretary of the Navy (e.g., CNO, ASNs, JAG, CNR, various warfare PEOs). The second echelon contains operational and shore headquarters units that report to an echelon-1 activity, for instance, Commander, Fleet Forces Command.
Table 1 indicates that a significant share of Unit Identification Codes (UICs) (over 45 percent) and enlisted billets (almost 70 percent) are below the fourth echelon. This means that they are two or more orga-nizational levels below where decisions on resource tradeoffs are cur-rently made. Because there are so many field activities (level four and below) relative to those making resource decisions (levels one and two), it would seem a daunting task to continuously transmit, receive, assess, and prioritize all operational tradeoffs up the chain of command.7
7. This observation is not meant to suggest any problem with the current organizational structure. Rather, we present it as an indication of the volume of information that must be communicated to obtain fiscally informed outcomes in the current requirements process. One benefit of the market-based approaches to be discussed later is a reduction of the amount of information that needs to be transferred within the organization.
28

Evidence from like activities on the scope for substitution
If there are very limited options for substituting manpower, the fact of fiscally uninformed requirements may not entail a sizable cost. However, earlier literature provides ample evidence for input substi-tution possibilities in the military context. Reference [6] examined statistical evidence relating different mixes of military manpower to the number of flights produced by a squadron. The study estimated that there are enough substitution possibilities just within military manpower to generate a 7-percent reduction in cost.
We have also examined the variation in the military-civilian mix at the UIC level across activities of selected types. Historically, as shown in figures 5 and 6, it appears that the general operation of naval air sta-tions and naval bases has been possible with varying mixes of civilian and enlisted military (and presumably other types of manpower and resources, too, though we lack data on these). The points in the two figures represent the mixes of enlisted military and civilians for each UIC-year combination in the sample. The solid lines in each graph represent all combinations of enlisted and civilian that total a con-stant number (800 for naval stations, 750 for naval air stations). Using the solid line as a reference, we see that, among naval stations with approximately 800 total enlisted and civilian personnel, in a given year there is an even spread along the line from about 25 percent civilian to 75 percent civilian.
Because of their centralized requirements models, we observe much less variation in the levels of enlisted billets across like fleet activities, such as all ships of a given type. Recent research, however (e.g., [7]
Table 1. Number of Navy UICs and enlisted personnel by echelon, 2005
UICs Enlisted BAEchelon Number Percentage Number Percentage
1 17 0.9% 158 0.1%2 70 3.7% 1,493 0.8%3 331 17.7% 13,704 7.3%4 600 32% 41,896 22.3%Under 4 855 45.7% 130,607 69.5%
29

Figure 5. Observed combinations of civilians and enlisted billets for general duty activities at naval stations, 1990–2005
Figure 6. Observed combinations of civilians and enlisted billets for general duty activities at naval air stations, 1990–2005
020
040
060
080
0To
tal e
nlis
ted
bille
ts a
utho
rized
0 200 400 600Civilian full-time personnel
050
010
0015
00To
tal e
nlis
ted
bille
ts a
utho
rized
0 200 400 600 800Civilian full-time personnel
30

and [8]), into alternative ship manning by the Military Sealift Com-mand (MSC) highlights potential opportunities for substitution in operational activities as well. The authors of [8] estimate that partially civilianizing the USS Mount Whitney (LCC-20) command ship with civilian mariners from MSC saves about $45 million per year.
Finally, the history of A-76 competitions for shore-based activities pro-vides further evidence of the existence of substitution possibilities. In fact, this history also gives us an estimate of the maximum savings available from moving to least-cost requirements. Free and open market competition provides an activity arguably the most powerful incentive to discover and reveal the mix of resources required to achieve its mission (or performance work statement) at lowest cost. A-76 evidence from past competitions suggests that these “true” least-cost requirements are about 30 to 40 percent cheaper than the origi-nal (or baseline) authorizations [9].
The historical savings rates from A-76 competitions may well repre-sent a reasonable upper bound on the likely savings to be realized from efforts to increase activities’ ability to make input tradeoffs. We would expect actual savings to be significantly less than this bound, however, because there is a large difference in the strength of the incentives created between simply providing activities greater budget-ary flexibility and asking them to compete for their survival.
In the following section, we discuss ways to make requirements deci-sions at the operational level more fiscally informed.
31

This page intentionally left blank.
32
Making demand for military manpower more fiscally informed
The current PPBES is designed to deliver a timely and credible bud-get, ultimately for congressional review, itemized by appropriation. BSOs are given separate topline controls8 for each appropriation, but, for the reasons discussed earlier, they have little incentive to look for any tradeoffs across appropriations.9 As a result, they have come to take an appropriation-by-appropriation approach to programming and budgeting, ignoring many potential cross-appropriation tradeoffs.
It is somewhat ironic that MPN costs are commonly considered highly visible by decision-makers at the top level, even though they are prob-ably the least visible appropriations at the lower levels. This is pre-cisely because top-level decision-makers know almost exactly how much more they will have available to spend in other appropriations when they cut a billet. By contrast, lower-level decision-makers cannot see with any kind of certainty an increase elsewhere in their own pro-grams or budgets as a result of taking the same actions.10
Shore military manpower requirements would become more fiscally informed if those making requirements and authorizations decisions faced the same resource tradeoffs as the Navy. This means that BSOs
8. The term topline control refers to the total cost constraint handed down from a resource sponsor to a BSO within a given appropriation, typically in the programming phase.
9. Such tradeoffs would take the form of reducing a BSO’s topline control in one appropriation and increasing it in another, so that the total remained unchanged.
10. MILCON is another appropriation that can similarly be considered “visible” at the top but not at the bottom.
33

would have to pay for manpower, as well as be able to capture any sav-ings from reduced requirements.
If BSOs' objectives are aligned with the interests of the overall Navy, then all that may be needed is to provide those setting requirements with accurate cost information, and instruct them to determine the least-cost set of requirements that will achieve the mission. As an alter-native, the Navy could ask them to reveal the potential tradeoffs in production.
To the extent that BSOs have an incentive to protect their own piece of the budget, however, their interests may not be fully aligned with the overall Navy. As a result, simply asking them to reveal tradeoffs or providing them cost information may not change their decisions on requirements. In such a situation, we need a process that allows BSOs to make economically meaningful tradeoffs, which means letting the true costs and savings of their decisions show up in their own budgets. Such a process would provide an ongoing incentive to keep looking for and reporting ways of meeting their missions at lower cost.
End users must have fungible budgets and pay for manpower
A more market-based demand process for military manpower requirements could take many forms (we will discuss some variants), but in general it would involve three key departures from the current system:
1. Provide end users of military manpower more financial fungibility.11
2. Charge end users for the military manpower they use.
3. Make prices (or programming rates) more granular by man-power type and year in the Future Years Defense Plan (FYDP).
11. By fungibility we mean giving an activity the option to shift programmed funds from one appropriation to another. In principle, fungibility could apply to budgeted or appropriated funds as well, though doing so would require legislative reform.
34

Another important element is to decentralize decision-making to a reasonable extent, so that those most informed about operational tradeoffs make the requirements decisions. The appropriate level for requirements decisions may depend on the type and size of activity in question. The current system for shore requirements is more decen-tralized than the current system for fleet requirements.
Appendix B highlights some public-sector examples of organizations that have switched from a centralized resource allocation process to a decentralized, market-based one embodying the elements just listed.
Incorporating fungibility under current PPBE
Financial fungibility is important because it allows lower levels to realize the Navy’s opportunity cost of military manpower. Top-level decision-makers regularly think of the opportunity cost of manpower as the number of additional steaming hours, spares, or ships they can buy if they reduce manpower by a certain amount. Lower-level decision-makers are not used to making such calculations because they lack the fungibility necessary for implementing any of these tradeoffs. Because fungibility at the budgeting and execution stages of the PPBES process would require legislative approval, a reasonable first step would be to allow fungibility at the programming phase.
Even at the programming phase, however, some realignment of roles will be necessary. In particular, activities may continue to get separate topline controls for each appropriation, passed down (usually) from different Resource Sponsors via the Enterprises. If the activities in aggregate were to program a higher total O&MN and lower MPN, a different division of resources across RSs may be required. RSs would have to be amenable to such shifts as the cost of obtaining greater effi-ciency at the field level.
Another possibility with a fungible system is to charge activities a cer-tain percentage of their top line for exchanging appropriations.12 A
12. Example: With a 10% fungibility tax, instead of receiving $1 in O&MN for $1 of MPN given up, an activity would receive $0.90 in O&MN.
35

tax might be appropriate if there will be significant administrative costs of tracking and overseeing these transactions. It would also limit transactions to those that were most valuable to the activity, and encourage activities to “get it right” the first time.
Another potential benefit of fungibility taxes is that the tax “revenue” could be reallocated to ensure that savings are shared all the way up the budget chain, thereby fostering stakeholder involvement from top to bottom. This may be necessary to ensure that all players have something to gain. Suppose a BSO finds a way to save $1 million by spending $2 million less MPN (funded by N1) and $1 million more O&MN (funded by N4, let’s say). N4 may have more of an incentive to increase the BSO’s piece of O&MN if N4’s overall O&MN budget increases by doing so. Rules can be established that reallocate part of N1’s savings to N4 such that each gains something.13 Using the num-bers above, if N1’s topline were cut by $1.5 million and N4’s increased by $1.5 million, each would receive 50 percent of the savings.
Topline controls must be firm
For BSOs to make real tradeoffs among inputs, they must have a firm topline cost constraint that includes all of the resources they use, just as Resource Sponsors have. Without such a constraint, any pricing system can be undermined. The effective “price” perceived by the BSOs will be less than the price charged; in the extreme, it could be zero.
For example, a BSO might be willing to give up some military billets for a lower-cost civilian option. The Resource Sponsor promises to let the BSO “keep” the savings, but in the next programming cycle the RS imposes an “efficiency review,” cutting the BSO’s top line by the
13. A pricing mechanism for manpower that includes a tax can be viewed as one form of a shared savings agreement, which is a deal negotiated between a Resource Sponsor and BSO(s). The agreement specifies how the total budget savings resulting from improved BSO efficiency are to be shared between the BSO and RS. Charging BSOs a price equal to the cost of manpower is equivalent to letting the BSO keep all the savings that result from using less manpower. A price in excess of cost (as with a tax) would shift some of the savings away from the BSO.
36

amount of the savings. It would be difficult to know whether the same topline cut would have occurred regardless of the savings achieved.
As another example, activities may want to “buy” more senior and more expensive manpower. If they can justify and receive a higher top line because “their (internal) cost of manpower has increased,” they effectively face a zero price for that manpower.
One way to assure BSOs that their budgets are firm may be to set up a transparent process through which Resource Sponsors can build reputations for not cutting publicly announced individual BSO top lines. Any cuts that are passed down would be done in a broad-based, fair-share fashion. A transparent process would also help top-level decision-makers justify any targeted cuts and increases made neces-sary by changing threats or demands for new capabilities.
Optimal billet programming rates must reflect marginal cost
The success of any pricing mechanism will depend on how accurately the prices reflect the true marginal costs to the Navy for each type of manpower. This means that accurate supply and cost information are important to ensure that the aggregate demand is executable and cost-effective. Various supply-side constraints on military manpower mean that proper granular costing of manpower will be a challenging and dynamic (though not impossible) exercise. We will discuss these constraints next.
Variable indirect and joint costs
The Navy must have a reasonable estimate of the full marginal cost of its manpower supply decisions. Various supply constraints and links in the military manpower system mean that some of these decisions involve costs associated not with single billets but with groups of bil-lets. For instance, recruiting and training costs are associated with a Sailor as he progresses through a group of billets over a career (some-times loosely referred to as “the life cycle of a billet”). To ensure full cost recovery from a price-based demand process, the manpower supply system has to decide how to allocate costs that are associated with groups of billets. The efficient way to allocate such costs (to be
37

discussed later) for pricing purposes is based on the relative demands for the various billets in the group.
Variable indirect costs
There are costs over and above direct compensation (some of which are paid for outside of MPN) that are associated with additional bil-lets or groups of billets. To the extent that they vary with billet addi-tions, these should be included in marginal cost calculations. These costs are often diffuse or occur with lags, so estimates may have to be used. Examples of such variable indirect costs include recruiting, training, and installation overhead.
Joint costs: Rotation and community management
Some number of shore billets will have to be retained to meet sea-shore rotation goals for every sea billet that is required. This means that a certain number of shore billets must be produced jointly with each sea billet. Efficiency requires that the total value for each sea billet and its requisite shore billets in sum exceed the total cost of all those billets. If the demand for shore billets is very low, they may still be worth retaining if the value on sea billets is sufficient to cover the cost of all the billets.
Also, given the closed-loop nature of the military manpower system, “producing” an E-5 requires retaining at least one of each of the lower ranks. In this sense, an E-5 billet is a joint product with at least one each of E-1 through E-4 billets. The cost of this joint product needs to be covered for efficiency, and the marginal cost for an E-5 will depend on the numbers available in E-4 and below.
The net effect of all of these joint costs is only to add some complexity (and flexibility) to the determination of the proper cost to use when evaluating the efficiency of a given allocation. The highest bid for the marginal shore-based E-3 may be insufficient to cover even regular pay for that billet, yet it still may be efficient to retain that billet if it is required for rotation or career progression purposes.
38
Demand-based cost allocation for efficient billet pricing
Once a mechanism is in place to solicit activities’ demand, manpower and budget analysts can use the demand information to develop more refined billet prices that allocate the variable indirect and joint costs of billets (training, recruiting, rotation, closed-loop) in a way that recovers costs and reduces surpluses and shortages among vari-ous manpower types.
For example, consider training and recruiting costs for a particular rating. In principle, these costs (because they are associated with the life cycle of a billet) can be allocated almost arbitrarily over the life cycle of a given billet in that rating. Suppose initially that the pro-gramming rates for E-3s and E-4s are allocated equal shares of the training and recruiting costs, but E-3s in that rating turn out to have excess supply and E-4s have excess demand. Then it would be effi-cient to revise the programming rates to allocate a larger share of the training and recruiting costs to E-4s and less to E-3s. The updated demands should reduce the shortage and surplus billets.
Fixed-price mechanisms
While not the economic ideal for the allocation of military man-power, fixed-price mechanisms may be a reasonable first step toward fiscally informed requirements. The key element will be for BSOs/activities to have fungible MPN budgets and decide how much mili-tary manpower to program (given that they must pay the program-ming rates that reflect the estimated marginal costs of billets, as developed by manpower and budget analysts).
The main advantage of such a system is that it would encourage cost-saving tradeoffs at the activity level and reveal a more accurate picture of the demand for military manpower. It would provide better infor-mation to manpower policy-makers as well. For example, reenlist-ment bonuses and voluntary separations could be more carefully targeted to manpower types that are most highly valued (over and above their cost) and least valued (relative to their cost). Alternative force-shaping policies could be more carefully compared for cost-effectiveness. Information on manpower demand would also make
39

the calculation of return on various training investments easier and make budgets for them more defensible.
A secondary advantage of having BSOs/activities pay for require-ments is that manpower requirements would become almost self-validating.14 The mere act of paying for a unit of manpower and for-going other resources effectively validates the necessity and cost-effec-tiveness of that manpower (over other resource types) in pursuit of mission objectives. Such information can give senior leadership more confidence in answering questions about whether certain levels of endstrength are validated.
Another advantage of such a system is its relative simplicity to imple-ment. N1 need only develop a menu of costs for the various categories of manpower and conduct the programming process much the same way as in the past. BSOs and activities will have an expanded set of resource choices since they could apply savings in MPN to other appropriations. Thus, there may be some more resource analysis and cost-effectiveness analysis required at the activity level.
The main disadvantage of a fixed-price system is that supply may not equal demand for a given manpower type at the quoted program-ming rate.15 In situations of excess demand, there will have to be some business rules to decide which activities receive the limited number of billets, even though all are willing to pay the cost. Likewise, in the case of excess supply, some process will be necessary for allocat-ing the excess billets across activities (even though none of the recip-ients are not willing to pay for them). This process of manually clearing the market will involve much of the same iterative negotia-tion and coordination that happens under the current process.
14. There would still need to be a process for validating whether the total budget of an activity was reasonable for the output delivered.
15. We were told that during POM-06, Resource Sponsors were given “intel-ligent budget-cut targets” to meet and could cut TOA in any appropria-tion. The largest cuts they submitted came from their MPN shares of TOA, which in aggregate turned out not to be executable.
40
Flexible price mechanisms
If the supply of every type of manpower could be increased very easily at a constant marginal cost, a fixed-price mechanism that charged end users this marginal cost would yield an efficient outcome. Supply of each manpower type could be increased or reduced, as needed, to meet demand.
However, due to some of the constraints discussed earlier, most types of military manpower are in relatively fixed supply, at least in the near term. For example, the total quantity of E-6s available in a particular community 3 years from now can be adjusted up or down to a certain extent by force-shaping tools, but it is more or less constrained by the current inventory in that community. When supply of a manpower resource is relatively constrained (or inelastic), its marginal cost is set by the highest price that some activity is willing to pay for it. Flexible-price mechanisms are one way to reveal this information.
Billet auctions
The most well-known and commonly used flexible price mechanism is an auction. One specific auction format that may be well suited to the military manpower market is a multiple-unit Vickery auction.16 In this auction, there are n units of the same good to be allocated (think of n billets of a given paygrade and rating for the fifth year of the FYDP). Each activity would submit a sealed bid, which would be a list declaring how much they are willing to pay for each additional billet, beginning with the first and continuing until additional billets have zero value. The n highest bids receive the available billets and the price paid per unit is the n+1th highest bid. In this allocation mecha-nism, it is in each bidder's interest to bid true values because the price any given bidder will have to pay is unaffected by the value that bidder reports.
Example: Assume that there are five billets to allocate among three activities. Activities are asked to submit their values for each possible
16. An internet-based version of this auction format was used to conduct the widely publicized initial public offering of Google stock in 2004.
41

billet quantity. They are told that the available billets will be allocated in such a way as to maximize total reported value, and that each activ-ity receiving a billet will pay a unit price that will be the sixth highest (i.e., highest non-winning) bid.
Suppose the true values are as shown in table 2. Then N1 could act as an auctioneer, and the efficient outcome in this example would be to assign 1, 1, and 3 billets to activities A, B, and C, respectively. The price paid per unit received would be 4, which is the value of the high-est non-winning bid (what activities A and C would pay for an addi-tional billet).
One alternative to having activities buy billets is to allocate billets to begin with and then allow activities to sell them back (i.e., a reverse auction). This may be easier to graft onto the current system since it is set up to allocate billets already. Activities could report how many billets (of a given type) they're willing to free up (if any) and at what price. The Navy would buy back the number of billets it desired and remove these billets from the lowest bidding activities. The payment to these winning bidders can be determined by the lowest non-winning bid (to give an incentive to bid true values). The Navy would also set a reserve price above which they would not pay for billets. Activities that wanted more billets would likewise bid for them, giving up O&M or other appropriations.
Table 2. Activities’ values for various quantities of billets
Billets allocated
Activity A marginal value
Activity Bmarginal value
Activity Cmarginal value
1 5 16 82 4 1 73 4 1 54 3 1 45 3 1 2
42

Accommodating executability constraints
An attractive feature of such flexible-price mechanisms as billet auc-tions is that N1 can incorporate executability constraints more effi-ciently than under fixed-price mechanisms. N1 would have to determine the range of inventory paths (over the POM years, say) that are consistent with policy constraints (e.g., minimum end-strength, sea-shore rotation) and, within this set, develop the costs of meeting various inventory targets. Much of the backbone for con-ducting this analysis already exists within N1 (specifically, the range of executable inventory paths), though certainly more tools may have to be developed.
Another advantage of auction mechanisms is that they are quite cus-tomizable. For example, if end users’ values for one type of man-power depend on the quantity of other types of manpower they will have, separate auctions for each type of manpower may not be appro-priate. In such a situation, the auction could be structured as a com-binatorial auction. In a combinatorial auction, end users submit bids for different packages (or combinations) of manpower (for example, $500,000 for a package of three E-6s and three E-3s). Combinatorial auctions have been applied for the sale of truckload transportation, bus routes, and radio spectrum. Appendix A contains a discussion of one type of combinatorial auction, the generalized Vickery auction, and how it might work.
Auctions also can be modified to allow bidders to make bids condi-tional on what other bidders receive. For example, a training activity’s value for manpower may depend on its anticipated workload, which in turn will depend on how much manpower operational units are going to require. Or it may depend on how much manpower is assigned to another training unit that handles part of the workload. For these types of more general cases involving positive or negative externalities between players, there is a class of more versatile, though somewhat more information-intensive mechanisms that can be applied to achieve efficient allocations and provide incentives for truthful reporting. These “Groves-Clarke” mechanisms are also described in appendix A.
43

Billet trading
A more limited way to allow for relative equilibrium prices for differ-ent types of military manpower is to let BSOs trade requirements. In this way, different types of military manpower can reallocate toward more valuable uses. The relative prices will become the rate at which different types of manpower trade for each other. Billet trading allows tradeoffs across military manpower types but not between MPN and O&MN. The volume of trade may be limited, but, because it does not involve any funds crossing appropriations, it would not require legislative approval to be applied during budgeting and execution.
Addressing concerns with more flexible lower-level budgets
Earlier, we discussed how preventing BSOs from making the full range of tradeoffs among resources can give rise to inefficiency, and how market-based mechanisms can lead to more efficient outcomes. Next we address some of the common concerns expressed about market-based mechanisms.
Meeting the aggregate endstrength target
One rationale for the fencing, or separation, of MPN from the rest of the budget is that Congress has an interest in maintaining a minimum number of active duty personnel.17 What happens if, in a market-based system, the total demand for military personnel (at a price that covers their costs) falls short of the endstrength that Congress wants?
In principle, the endstrength constraint can be accommodated directly in a market-based mechanism. Suppose activities had fungi-ble budgets and bid for their share of a given total quantity of man-power, as set by Congress. It may be that to allocate the targeted quantity of manpower requires prices too low to cover the Navy’s costs. But the cost for manpower must be paid somehow. Ultimately, the shortfall will come from the rest of the Navy’s budget. As long as these budget cuts are spread in fair-share fashion, however, activities will still have an incentive to make fiscally informed tradeoffs.
17. Military personnel are vital to ongoing national defense. Absent con-scription, they are the only citizens who can be ordered to war.
44

Furthermore, the savings (net of reduced value to the Navy) from reducing the endstrength target will become visible.
Preserving top-level control over mission priorities
One concern for activities reallocating budgets from MPN to O&MN is that higher levels would have little ability to know whether those funds were spent to further larger Navy goals. There is some validity to this concern if activities can pursue objectives that are at odds with the larger Navy’s objectives. However, lack of perfect output measures should not necessarily call for limiting choices over inputs.
First, it is important to bear in mind that activities’ total funding con-straints are still in the hands of higher-level decision-makers. Activi-ties still have an incentive to please leadership by demonstrating results (for reasonable cost) in order to continue receiving funding. If anything, this concern highlights the important role for metrics, communicating clear objectives to activities and holding activities accountable for measures of their output.
The Enterprise system has been designed in part to align the objec-tives of lower echelon activities with those of leadership. Closer col-laboration and communication of these objectives, combined with better metrics on expected outputs, will address some of these issues.
In the past, when the top level felt that lower levels responsible for multiple missions were not achieving an appropriate balance, they removed responsibility for one of the missions. Typically, this occurred at the RS level. For example, the expansion of N4 as a single logistics RS in the mid-1990s was reportedly motivated by the fact that the warfare RSs were spending too much of their budgets on procure-ment and too little toward maintaining fleet readiness. See [10] for a detailed account. A similar rationale was behind the creation of an expeditionary warfare RS out of the surface RS in 1990.
By collecting all logistic-related activities under N4 and fencing N4’s funding from the other warfare sponsors, the top level gained some control over the exact amount to be spent toward each separate goal. This type of management tool would still be available to the higher levels in a system with fungibility.
45
However, even this sort of fencing may have a cost if it reduces the incentives to look for efficient tradeoffs between the separated mis-sions. Consider the case of N4. Because the warfare sponsors were no longer responsible for the readiness mission, they had a reduced incentive to consider the operation and maintenance cost of new platforms since this would be paid for out of N4’s budget.
Equipping activities to handle more resource decisions
Another common concern that has been expressed with more mana-gerial flexibility at the operational level is that either (1) it will increase the burden on activity commanders, possibly distracting them from the mission or (2) while activity commanders have good leadership and military skills, they may not have the resource analysis or business training to make the best decisions.
It is true that adding decision-making responsibility at the field level will require resources to support it. For instance, many larger activi-ties may want to take on additional budget analysts. However, we would expect activities to have the incentive to invest in the efficient level of analytical and administrative support, so that the expected savings from improved decision-making will be more than enough to offset any additional support costs.
In addition, we note that commanders regularly make decisions requiring resource analysis when they decide how to allocate their O&M budgets, for instance.
Interim steps toward fiscally informed requirements
The larger reforms to the PPBES discussed earlier may take some time and investment to implement. In the interim, there are more modest steps that would move the system in the direction of more fis-cally informed requirements.
Billet buying wargame
An initial step toward a system that generates fiscally informed requirements would be to conduct one or more wargames with activ-ity commanders in a market-based process. The games could be
46

conducted with commanders at various organizational levels to iden-tify differences in information and objectives, and to help determine the appropriate level to which decisions should be delegated.
Commanders would be given full fungibility over all their resources and could allocate as they saw fit toward achieving the mission at min-imum risk. The wargames could help identify what tools, processes, or data are currently missing or need to be developed at the decision-making level to implement such systems.
Shared savings awards for micro-initiatives
Often a single activity may lack the incentive to look for small improvements in efficiency because, even if it captures the full savings that result, these savings aren’t quite enough to justify the investment or risk in experimentation that it must bear. However, if there are dozens of similar activities throughout the Navy that would also ben-efit from this innovation, the total benefits may well outweigh the ini-tial cost, and discovery of it should be encouraged.
One way of doing so would be to offer an efficiency prize that gave activities discovering and documenting such savings initiatives some percentage of the Navy-wide savings. This would also encourage activ-ities to report their cost-saving initiatives to NAVMAC and other requirements modelers.
Expanded granular programming
Current programming rates face Resource Sponsors with one average cost for an officer and one for an enlisted. These rates are inadequate because (1) they do not vary by type of manpower and (2) they exclude some costs associated with manpower that show up in appro-priations other than MPN. This price system tends to encourage RSs to authorize the most valuable ratings and ranks because RSs perceive the biggest value from these billets. DoD composite rates do vary by rank but not by rating. Granular programming should help differen-tiate costs by rating and encourage better tradeoffs across military manpower types.
47

This page intentionally left blank.
48
Evidence on manpower substitution
The foregoing discussion suggested that, when MPN cannot be traded for much else, military manpower is continuously perceived by those setting requirements as relatively inexpensive. As a conse-quence, we should not observe activities’ reported demands to respond very much as naval manpower costs change. In this section, we investigate whether this hypothesis is borne out in the data. Note that, due to data limitations, the evidence presented here is not con-clusive, only suggestive.18
Some context: aggregate trends in wages and manpower
How has the cost of manpower (relative to other resources) changed over time? Figure 7 shows the OSD deflators for military personnel and civilian personnel relative to other DoD purchases over time. There has been a steady increase in the relative prices of both types of labor, comparable to the relative price growth observed in the pri-vate sector. Other things equal, we would expect to observe a substi-tution away from civilian and military personnel and toward other inputs.
In fact, in figure 7 we do observe that DoD civilians and military per-sonnel have been declining as a share of total DoD purchases, as have the labor hours per unit output in the private sector. In aggregate, therefore, the change in demand for manpower appears to have behaved as expected.
18. Unless otherwise noted, the data sources used in our analysis are as specified here. The source for the civilian personnel data is the STATUS file, provided by AAUSN Office of Civilian Human Resources HR Sys-tems Division, Data Management Branch. The military billet data we use were extracted from TFMMS, and the military manning data come from the Navy’s Enlisted Master Record.
49

In the next subsection, we try to distinguish “bottom-up” substitution from “top-down” substitution. Bottom-up substitution is a shift in per-sonnel mix within an activity, whereas top-down substitution is the change in total mix attributable to added and dropped activities. Top-level decisions to add and drop activities are primarily driven most likely by changes in workload, though costs and manpower tradeoffs may inform the decisions as well. Given the discussion of activities’ incentives in the previous section, we do not expect to observe much bottom-up substitution of military manpower.
Has civilian substitution exceeded military?
How has the Navy responded to generally higher prices for military and civilian personnel? The Navy’s civilian and military personnel have been declining over the last two decades. The Navy was also downsizing during much of this period, and the decline is largely
Figure 7. Real manpower prices and quantity shares: DoD vs. private sector, 1986-2003a
a. Source for private non-farm business data: Bureau of Labor Statistics. Source for DoD data: FY06 Green Book.
0.00
0.20
0.40
0.60
0.80
1.00
1.20
1.40
1.60
1986
1987
1988
1989
1990
1991
1992
1993
1994
1995
1996
1997
1998
1999
2000
2001
2002
2003
Priv Non-Farm Bus: labor cost/non-labor cost DoD: CivPay deflator/Non-pay deflator
DoD: MilPay deflator/Non-pay deflator DoD: Military billets/DoD real purchases
DoD: Civilians/DoD real purchases Priv Non-Farm Bus: Labor hrs/output
Real manpower prices: private sector and DoD
Manpower relative quantity:private sector and DoD
Inde
x (1
986
= 1
.0)
50

attributable to a reduced mission (i.e., the Navy is using less of every resource, not merely substituting away from labor).
To measure the amount of bottom-up manpower substitution, we must hold mission constant over time. One way to approximate a con-stant mission is to limit the sample to those activities (or UICs) that have been in continuous existence19 between 1986 and 2005.
Figure 8 shows a marked difference between the behavior of civilian and military billets for these activities. While civilians have declined, military personnel have remained fairly constant over time (espe-cially those in operational UICs), even while growing as expensive as civilians. Indeed, the change in civilians in this group of UICs accounts for 30 percent of the total change in civilians over the period, whereas the change in billets in this group accounts for less than 2 percent of the total change in billets. We do observe some downturn in billets authorized at the end of the series. This decline may be partially attributable to UICs that are downsizing in prepara-tion for eliminations that have not yet been observed.
A different way to measure bottom-up substitution is as the part of total change not accounted for by top-level managerial decisions to add or drop activities.20 The top level has an incentive to seek savings from all types of resources, and it pursues these savings in large part by its decisions to drop and add UICs. Activities’ incentives to look for labor savings are stronger for civilians than for military personnel. As a result, we might expect the fraction of total changes in personnel accounted for by added or dropped UICs to be larger for military than for civilians.
19. We would observe a decline in the billets and civilians in activities sched-uled for deactivation as they ramp down workload. This decline would be more properly attributable to the declining workload than to the higher price for labor. Similarly, newly established activities would show increasing personnel most likely because they are ramping up. There are 2,382 UICs that were continuously active throughout the period.
20. These decisions are most likely mainly driven by significant workload changes, but they may reflect some substitution (by adding less man-power-intensive UICs and dropping more manpower-intensive UICs).
51

Table 3 shows the net change in personnel of different types in dropped and added UICs, during various length windows of time (before/after the date of their drop/add). For example, the n = 4 column means that we measure the size of dropped UICs 4 years before they were dropped. Similarly, we measure the size of added UICs 4 years after they were added. The number, -153,903, gives us the net change in enlisted billets (billets in added UICs - billets in dropped UICs), which represents 76 percent of the total change in enlisted billets over the period.21
We observe that indeed a smaller portion of the total civilian change is attributable to added/dropped UICs at all windows except for the
Figure 8. Manpower trends in continuously active UICs, from 1986 through 2005
21. We can think of the results shown in figure 8 as the case of n = 20. That is, all manpower changes in UICs that were ever dropped or added are attributed to top-level decisions. With smaller n, we can attribute any manpower changes occurring beyond n years from the year of add/drop to substitution at the activity level.
0
20000
40000
60000
80000
100000
120000
140000
160000
1986
1987
1988
1989
1990
1991
1992
1993
1994
1995
1996
1997
1998
1999
2000
2001
2002
2003
2004
2005
Fiscal year
BA in OPS UICsBA in SHORE UICsCivilians
52

current year.22 The result using size in the year of add or drop may be attributable to the fact that military manpower changes require longer lead times than civilian changes.
Have activities with more fiscally informed requirements shown relatively more response in BA?
We also investigate whether activities with potentially greater fungibil-ity across resource types have reduced manpower more in response to generally increasing relative prices. Our candidates for more fis-cally informed activities include working capital funded activities and defense agencies (which typically must reimburse the Navy for all mil-itary personnel), MSC activities (funded by a separate working capital
22. We must be careful in drawing the conclusion from this evidence that there was greater substitution of civilians than of military within activi-ties. For example, an alternative explanation may be that activities for which workload was no longer needed (dropped activities) had greater enlisted military relative to civilians. However, the data indicate that this is unlikely. The net military/civilian ratio in dropped/added activities does not exceed 1.91 for any value of n < 5. The average military/civilian ratio over the 1990–2004 period is 2.10.
Table 3. Portion of total enlisted and civilian personnel changes attributable to added or dropped UICs
Total change
Net personnel changes from added/dropped UICs,with sizes measured as size in year of add + n, year of drop - n yearsa
a. If (year of add + n) occurs after 2004, we use size in 2004. Similarly, if (year of drop - n) is earlier than the first year of data, we use size in the first year of data.
n = 0 n = 1 n = 2 n = 3 n = 4Enlisted 1986–2004
- 202,830 -9,660 -76,338 -117,620 -137,479 -153,903
5% 38% 58% 68% 76%
Civilians 1990–2004
-127,238 -21,333 -41,164 -61,597 -73,243 -86,808
17% 32% 48% 58% 68%
53

fund), and headquarters activities (which are presumably closer orga-nizationally to the resource decisions). In each case, we limit our observations to UICs that were continuously active during the entire period as an attempt to control for mission “quantity.”23 Appendix C contains tables of summary statistics for the data we used in the regressions.
We estimate the following equations separately:
Δln(BAit) = β0+ β1FUNC_AVGit+ β2SIZEit + β3 1WCF + β41MSC
+ β51DA + β61HQ + β7t + eit, (1)
Δln(CIVit) = β0+ β1FUNC_AVGit + β2SIZEit + β3 1WCF + β41MSC
+ β51DA + β61HQ + β7t + eit, (2)
Δln(BAit + CIVit) = β0+ β1FUNC_AVGit + β2SIZEit + β3 1WCF
+ β41MSC + β51DA + β61HQ + β7t + eit, (3)
where
The regression equations will indicate whether our candidate activi-ties (holding activity size, type, and year constant) have had
23. Certainly the mission or workload for a continuously active UIC can change over time (for example, if it expands as a result of consolida-tions or regionalization). In such cases, by limiting the sample to con-tinuously active UICs, we may be overrepresenting those that have increased workload over time. It is unfortunate that we have no data to control precisely for workload.
BAit = enlisted billets authorized for activity i in year t
CIVit = full-time civilian personnel at activity i in year t
FUNC_AVGit = change in logarithm of the type of personnel of interest (enlisted billets or civilians) in year t among activities per-forming the same type of function as activity i
SIZEit = sum of civilians and preceding twelve-month average mil-itary manning at activity i in year t.
54

significantly different growth rates in billets and/or civilians than other Navy activities of the same type.
We hope to limit the effect of workload changes on personnel demand by including only activities that have been in continuous existence through the time period. We lack the data to determine the precise underlying causes of any difference in manpower rates of change. For instance, we know that the relative price of manpower has been increasing, and, other things equal, we would expect all activities to have reduced both military and civilian personnel. How-ever, we also know that for many types of labor, civilians cost less than military personnel, so we may expect to observe greater substitution of civilian for military in activities with more fungible budgets. Note that a statistically significant difference in the rate of input change for a given type of activity may be due to factors other than resource fun-gibility, which have not been controlled for due to data unavailability.
Table 4 presents the results from estimating this equation. The coef-ficient estimate on the “activity type average” variable can be inter-preted roughly as the share of an activity’s billet change that is explained by the average billet change among similar activities.24 The coefficient estimates on the WCF, DA, MSC, and echelon 1 or 2 indi-cator variables can be interpreted as the average percentage-point dif-ference in growth rates between these types of activities and other similar activities.
The results in columns (5) and (6) indicate that Working Capital Fund (WCF) activities have reduced their civilian and enlisted per-sonnel in total at a rate systematically greater than other activities (about 3 to 4 percentage points per year). Activities at echelon 1 and 2 have also had systematically greater declines in personnel. This may be evidence of greater incentive and/or potential for the use of con-tractors at these types of activities.
24. The “activity type average” variable used in the regressions reported here implicitly weights (by size) the personnel change for each UIC belonging to a given group. An alternative set of regressions using the yearly unweighted average changes within an activity type(equivalent to a standard fixed-effects model) yielded qualitatively similar results.
55

Columns (1) and (2) indicate that WCF, DA, and echelon 1 and 2 activities have reduced enlisted billets at a systematically greater rate than the rest of the Navy (by 1 to 3 percentage points per year). Col-umns (3) and (4) indicate that WCF activities have reduced civilians at a greater rate than the rest of the Navy. The 25 continuous MSC activities in our sample were also working capital funded after 1992, so the positive MSC coefficient in column (4) may be reflecting the average growth in their requirements before becoming WCF activi-ties. Still, the net effect for MSC (summing up the coefficients on WCF and MSC) would be negative.
Table 4. Ordinary least squares estimates of personnel changes in activities with and without fungibilitya
Explanatory variable
Dependent variable(1)
delta log (BA)
(2) delta log
(BA)b
(3) delta log
(Civ)c
(4) delta log (Civ)b,c
(5) delta log (Civ+Enl)
(6) delta log
(Civ+Enl)b
Activity type average 0.1674(9.43)**
0.1735(14.28)**
0.1634(5.54)**
0.1562(7.00)**
0.0922(6.31)**
0.1113(9.40)**
Size -0.00001(1.71)
-0.000006(1.30)
0.00001(2.89)**
0.00001(3.47)**
0.000007(2.10)*
0.000008(2.83)**
WCF indicator -0.0077(0.63)
-0.0382(3.88)**
-0.0463(2.84)**
-0.0611(4.38)**
-0.0463(2.83)**
-0.0369(2.99)**
MSC indicator -0.0063(0.40)
-0.0082(0.95)
0.0262(1.13)
0.0538(2.85)**
0.0236(1.45)
0.0085(0.87)
Defense agency (DA) indicator
-0.0126(2.97)**
-0.0064(1.53)
-0.0014(0.41)
0.0026(0.88)
-0.0043(0.94)
-0.0024(0.54)
Echelon 1or 2 indicator
-0.0163(2.61)**
-0.0118(1.99)*
0.0011(0.13)
0.0033(0.47)
-0.0146(2.12)*
-0.0125(2.05)*
Years since 1986 -0.0019(8.00)**
-0.0003(1.49)
-0.0033(4.85)**
-0.0023(3.99)**
-0.002(7.96)**
-0.0005(2.60)**
Constant 0.0252(8.54)**
0.0035(1.56)
0.0343(3.90)**
0.0202(2.73)**
0.0237(7.36)**
0.0056(2.37)*
No. of observations 43,323 75,356 9,825 12,828 41,018 70,501R-squared 0.065 0.066 0.049 0.049 0.020 0.027
a. Absolute value of robust t-statistics in parentheses. The dependent variables delta log (x) are calculated as ln(xt) - ln(xt-1). One asterisk (*) indicates significance at 5 percent; two asterisks (**) indicate significance at 1 percent.
b. Includes UICs not dropped/added in 5-year window. c. Excludes UICs not reporting any civilian personnel. Earlier regressions including these UICs (and assigning them
zero civilians) obtained qualitatively similar results.
56

In summary, we do find some evidence corroborating our hypothesis that more fiscally informed activities have a stronger incentive than uninformed activities to reduce military manpower in the face of higher costs. Among our candidate types of fiscally informed activi-ties, WCF, DA, and echelon 1 and 2 activities have cut enlisted billets at a rate greater than the rest of the Navy, as costs for these billets have increased. Only WCF activities have demonstrated greater-than-average reductions in civilians, too.
57

This page intentionally left blank.
58

Appendix A
Appendix A: Other transfer price mechanisms
Transfer pricing with externalities: Groves-Clarke mechanisms
Whenever activities’ values for combinations of manpower are inde-pendent of the manpower other activities receive, there are no exter-nalities. However, it may be the case that there is such a dependence, especially for support activities. For example, the number of mainte-nance personnel a maintenance activity demands may depend on the level of manning in units that use the equipment to be maintained.
A Groves-Clarke mechanism can be structured to allow these depen-dencies to be taken into account when determining demand. In a Groves-Clarke mechanism, each activity would report how much it valued a given allocation of manpower (across all activities), and the available manpower would be allocated in the way that maximized total value. This would give end users a way to make their demand for manpower conditional on the level of demand in other activities.
There would then be side payments between activities. Each activity would pay an amount that decreased with the total value reported by all other activities. The more manpower value others receive in the given allocation, the less this activity has to pay. The incentive for each activity is to truthfully reveal what the manpower is worth in any given allocation, taking into account any external costs or benefits its man-power allocation may impose on others.
For example, an activity using some piece of equipment will realize that its side payment will go down by any increase in costs imposed on the activity maintaining or repairing the equipment. As a result, it has an incentive to consider the full cost to the Navy of its level of activity (and equipment use). As in the auction mechanism, the price each
59

Appendix A
activity will have to pay is independent of the value reported; it depends only on what the others report.
Table 5 shows that we get the same solution under these mechanisms as under the auction described in the main text for the case in which there are no externalities.
Under a Groves mechanism, the optimal allocation is efficient in that it maximizes the total reported value of the players (activities). Given that the players report values truthfully, this alternative is (1, 1, 3). After the optimal allocation is determined, each player receives a
Table 5. Values and transfers under Groves-Clarke mechanisms
Allocation to (A,B,C)
Activity Atrue value
Activity Btrue value
Activity Ctrue value
Groves transfer to A =
B’s value + C’s value
Clarke transfer to A = Groves transfer - 40
0, 5, 0 0 20 0 20 -201, 4, 0 5 19 0 19 -212, 3, 0 9 18 0 18 -223, 2, 0 13 17 0 17 -234, 1, 0 16 16 0 16 -245, 0, 0 19 0 0 0 -400, 4, 1 0 19 8 27 -131, 3, 1 5 18 8 26 -142, 2, 1 9 17 8 25 -153, 1, 1 13 16 8 24 -164, 0, 1 16 0 8 8 -320, 3, 2 0 18 15 33 -71, 2, 2 5 17 15 32 -82, 1, 2 9 16 15 31 -93, 0, 2 13 0 15 15 -250, 2, 3 0 17 20 37 -81, 1, 3 5 16 20 36 -42, 0, 3 9 0 20 20 -200, 1, 4 0 16 24 40 01, 0, 4 5 0 24 24 -160, 0, 5 0 0 26 26 -14
60

Appendix A
transfer payment. In a Groves mechanism, this transfer is the total value reported by the other activities. Through this transfer payment, the mechanism serves to internalize the opportunity cost of military manpower to each activity. Because each player receives a positive transfer, this mechanism would be impractical insofar as it would require an external subsidy.
In a Clarke mechanism, the transfers to each player from the Groves mechanism are adjusted downward by a constant that is equal to the maximum payoff the other players could receive if the given player were eliminated. The new transfers guarantee that in equilibrium each player still wants to participate (its net gains exceed zero) and, unlike in Groves mechanisms (and under mild additional conditions likely to hold in this setting), that there will be no subsidy required to the system.
Groves-Clarke mechanisms have had limited application in practice. In one notable example, a variant was used by the Public Broadcast-ing Service to decentralize the selection of national programming.
Generalized Vickery auction
A special case of the Clarke mechanism for the allocation of a set of items to a set of players is the generalized Vickery auction. The basic intuition is that each player submits its bids for various combinations of the items to be allocated. The items are then allocated in a way that maximizes the total reported values. Each player has to pay an amount that equals the difference between what the others could have obtained in the absence of the given player and what they actu-ally obtain.
In the foregoing example, activity A would pay 4 for one billet because activities B and C together could have obtained (in the absence of activity A) at most a total value of 40. In the actual alloca-tion, activities B and C together receive a total value of 36, so activity A pays for the difference. We can view this payment as activity A fully compensating the cost to other activities for any billets it is allocated. Likewise, activity B would pay 4 and activity C would pay 11. Note that the average price paid per unit need not be equal across activities.
61

Appendix A
This page intentionally left blank.
62

Appendix B
Appendix B: Examples of budget decentralization in the public sector
Many large public- and private-sector organizations have moved away from budgeting specific resources directly to the activity and toward a system of budgeting fungible resources that activities may choose to spend more flexibly. In this section, we describe two recent efforts in this direction.
University of Heidelberg Project IMPULSE
Public universities in Germany used to have centrally allocated and funded faculty and staff positions. Because these positions imposed no cost to academic departments and institutes, no department wanted to give up a faculty position voluntarily. In addition, obtaining financing for replacement hires could take up to a year, which meant that many posts remained unfilled. Since 2000, following an agree-ment with the Ministry of Finance, universities have been receiving more liberalized budgets.
Specifically, each university (and each institute falling under it) is now given two budgets: Personnel and Other. In the past, Personnel budgets were centrally managed and could be used only to fund aca-demic, administrative, and technician positions. Under the new sys-tem, Personnel budgets are decentralized, and institutes can keep 60 percent of the Personnel budget savings (to spend as they choose or transfer to the next period) if they divest a post or leave a post vacant. The initial levels of institutes’ budgets were determined based on one-time negotiations at the start of the program between the Rector-ate and professors. Each institute is free to change its personnel struc-ture as long as it does not exceed its Personnel budget. Also, if an institute wants to exceed its Personnel budget, it is free to spend from its Other budget or trade Personnel for Other budgets with another institute. Because the Ministry of Finance has insisted on having the
63

Appendix B
traditional accounting and reporting structure, it was necessary to maintain a distinction between Personnel budget and Other budget.
The budgetary changes have required a complex structure of inte-grated accounting software, as well as increased time and effort both at the institutes and at the central level. Despite these initial hurdles, institutes have responded to their new incentives. For instance, the various categories and classifications of posts were centrally estab-lished under the old system, and almost no changes to the structure of an institute’s personnel were possible. This limited the set of people that could be hired for the position (i.e., those with the par-ticular set of qualifications). Typically, however, this set of qualifica-tions wasn’t the right one from the institute’s perspective. As part of the new system, individual institutes can determine their own job types to attract people with the right set of skills to do the job. One example of this is that many are converting former academic or sci-entific posts to professional management or administrative posts.
In addition, when a post-holder resigns or retires, departments have been less inclined to refill the position immediately. Internal statistics have shown an increase in both the number of unoccupied (but bud-geted) posts, as well as the average time to refill vacated posts. Because institutes can now use 60 percent of their personnel budget for general expenditures, they find doing so more valuable than re-hiring right away.
Some other benefits of the new system include top-level knowledge of the best and well-performing units within the university, as well as closer networking among formerly isolated researchers. One area for potential improvement is financial, accounting, and budgeting per-sonnel development.
Similar budget flexibility initiatives have recently been introduced by the California Department of Education and the University of North Carolina.
64

Appendix B
Revised financing and prospective budgeting in TRICARE
Military treatment facilities (MTFs) used to receive funding only for the direct care they provided. Any referrals to the private-sector net-work of contracted physicians were paid for by a central TRICARE budget. In an effort to align MTF providers’ referral decisions with the costs of those decisions, MTFs were given budget accountability for both direct care and the cost of their network referrals.
As a result, MTF providers became more conscious of their referrals and undertook initiatives to use their in-house capacity more produc-tively. For example, general surgeons at one clinic took on some rou-tine gastroenterology procedures so that gastroenterologists could focus on a narrower set of more difficult procedures.
One legislative limitation on revised financing is that at the Service level it is prohibited to move funds out of the direct care (in-house) account to pay bills for private-sector care, though not vice versa. As a result, prospective payment budgeting has been proposed that would project the private-sector bills of each MTF based on expected case load and allow them to keep any amounts below the budgeted level.
MTFs that exceed their projected bills will receive closer manage-ment scrutiny to determine what remedial actions might be taken to improve efficiency.
65

Appendix B
This page intentionally left blank.
66

Appendix C
Appendix C: Summary statistics for regression data
Tables 6 through 11 provide summary statistics for the regressions presented in the text.
Table 6. Summary statistics for data in regression (1)
Variable Obs. Mean Std. Dev. Min. Max.delta ln(BA) 43,323 0.003 0.275 -5.735 6.946activity avg 43,323 -0.007 0.410 -7.004 10.780totpers 43,323 125.170 383.217 0.000 11,871.750flag_wcf 43,323 0.023 0.151 0.000 1.000flag_msc 43,323 0.011 0.104 0.000 1.000flag_da 43,323 0.030 0.170 0.000 1.000flag_ech12 43,323 0.025 0.156 0.000 1.000t 43,323 9.941 5.464 1.000 19.000
Table 7. Summary statistics for data in regression (2)
Variable Obs. Mean Std. Dev. Min. Max.delta ln(BA) 75,356 -0.001 0.314 -7.277 6.983activity avg 75,356 -0.001 0.461 -7.004 10.780totpers 75,356 104.772 356.692 0.000 11871.750flag_wcf 75,356 0.026 0.159 0.000 1.000flag_msc 75,356 0.017 0.128 0.000 1.000flag_da 75,356 0.028 0.166 0.000 1.000flag_ech12 75,356 0.018 0.135 0.000 1.000t 75,356 9.149 5.674 1.000 19.000
67

Appendix C
Table 8. Summary statistics for data in regression (3)
Variable Obs. Mean Std. Dev. Min. Max.delta ln(CIV) 9,825 -0.008 0.279 -4.512 4.413activity avg 9,825 -0.027 0.364 -6.521 5.791totpers 9,825 267.337 613.634 1.000 11347.750flag_wcf 9,825 0.045 0.208 0.000 1.000flag_msc 9,825 0.015 0.121 0.000 1.000flag_da 9,825 0.000 0.010 0.000 1.000flag_ech12 9,825 0.069 0.253 0.000 1.000t 9,825 12.051 4.317 5.000 19.000
Table 9. Summary statistics for data in regression (4)
Variable Obs. Mean Std. Dev. Min. Max.delta ln(CIV) 12,828 -0.009 0.279 -4.848 4.413activity avg 12,828 -0.024 0.382 -6.521 5.811totpers 12,828 249.740 627.922 0.000 11685.080flag_wcf 12,828 0.054 0.225 0.000 1.000flag_msc 12,828 0.018 0.131 0.000 1.000flag_da 12,828 0.000 0.009 0.000 1.000flag_ech12 12,828 0.067 0.249 0.000 1.000t 12,828 11.877 4.418 5.000 19.000
Table 10. Summary statistics for data in regression (5)
Variable Obs. Mean Std. Dev. Min. Max.delta ln(BA+CIV) 41,018 0.000 0.254 -5.150 4.426activity avg 41,018 -0.022 0.389 -10.176 7.279totpers 41,018 124.076 376.238 0.000 11,347.750flag_wcf 41,018 0.024 0.154 0.000 1.000flag_msc 41,018 0.011 0.104 0.000 1.000flag_da 41,018 0.030 0.171 0.000 1.000flag_ech12 41,018 0.025 0.156 0.000 1.000t 41,018 10.275 5.425 1.000 19.000
68

Appendix C
Table 11. Summary statistics for data in regression (6)
Variable Obs. Mean Std. Dev. Min. Max.delta ln(BA+CIV) 70,501 0.002 0.288 -5.378 5.695activity avg 70,501 -0.021 0.424 -10.176 7.279totpers 70,501 103.286 344.810 0.000 11685.080flag_wcf 70,501 0.027 0.161 0.000 1.000flag_msc 70,501 0.017 0.128 0.000 1.000flag_da 70,501 0.029 0.167 0.000 1.000flag_ech12 70,501 0.019 0.136 0.000 1.000t 70,501 9.503 5.698 1.000 19.000
69

Appendix C
This page intentionally left blank.
70
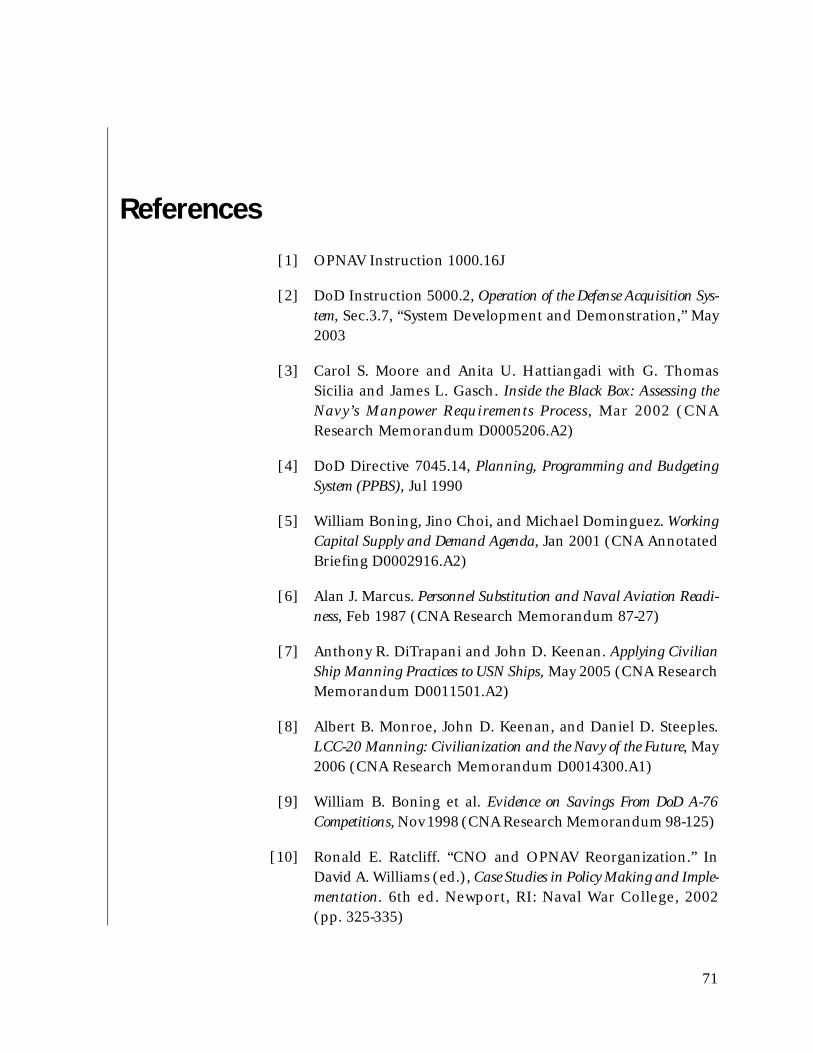
References
[1] OPNAV Instruction 1000.16J
[2] DoD Instruction 5000.2, Operation of the Defense Acquisition Sys-tem, Sec.3.7, “System Development and Demonstration,” May 2003
[3] Carol S. Moore and Anita U. Hattiangadi with G. Thomas Sicilia and James L. Gasch. Inside the Black Box: Assessing the Navy’s Manpower Requirements Process, Mar 2002 (CNA Research Memorandum D0005206.A2)
[4] DoD Directive 7045.14, Planning, Programming and Budgeting System (PPBS), Jul 1990
[5] William Boning, Jino Choi, and Michael Dominguez. Working Capital Supply and Demand Agenda, Jan 2001 (CNA Annotated Briefing D0002916.A2)
[6] Alan J. Marcus. Personnel Substitution and Naval Aviation Readi-ness, Feb 1987 (CNA Research Memorandum 87-27)
[7] Anthony R. DiTrapani and John D. Keenan. Applying Civilian Ship Manning Practices to USN Ships, May 2005 (CNA Research Memorandum D0011501.A2)
[8] Albert B. Monroe, John D. Keenan, and Daniel D. Steeples. LCC-20 Manning: Civilianization and the Navy of the Future, May 2006 (CNA Research Memorandum D0014300.A1)
[9] William B. Boning et al. Evidence on Savings From DoD A-76 Competitions, Nov 1998 (CNA Research Memorandum 98-125)
[10] Ronald E. Ratcliff. “CNO and OPNAV Reorganization.” In David A. Williams (ed.), Case Studies in Policy Making and Imple-mentation. 6th ed. Newport, RI: Naval War College, 2002 (pp. 325-335)
71

This page intentionally left blank.
72

List of figures
Figure 1. Requested (A), optimal (least-cost) (B), and funded (C) requirements, notional . . . . . . . . . 6
Figure 2. The steps in creating a billet . . . . . . . . . . . . . 7
Figure 3. Requirements to funded billets in the traditional system . . . . . . . . . . . . . . . . . . . 23
Figure 4. Requirements to funded billets with Single Resource Sponsors . . . . . . . . . . . . . . . . . . 25
Figure 5. Observed combinations of civilians and enlisted billets for general duty activities at naval stations, 1990–2005 . . . . . . . . . . . . . . . . . . . . . . . 30
Figure 6. Observed combinations of civilians and enlisted billets for general duty activities at naval air stations, 1990–2005 . . . . . . . . . . . . . . . . . . 30
Figure 7. Real manpower prices and quantity shares: DoD vs. private sector, 1986-2003. . . . . . . . . . . . . . 50
Figure 8. Manpower trends in continuously active UICs, from 1986 through 2005 . . . . . . . . . . . . . . . 52
i

This page intentionally left blank.
ii
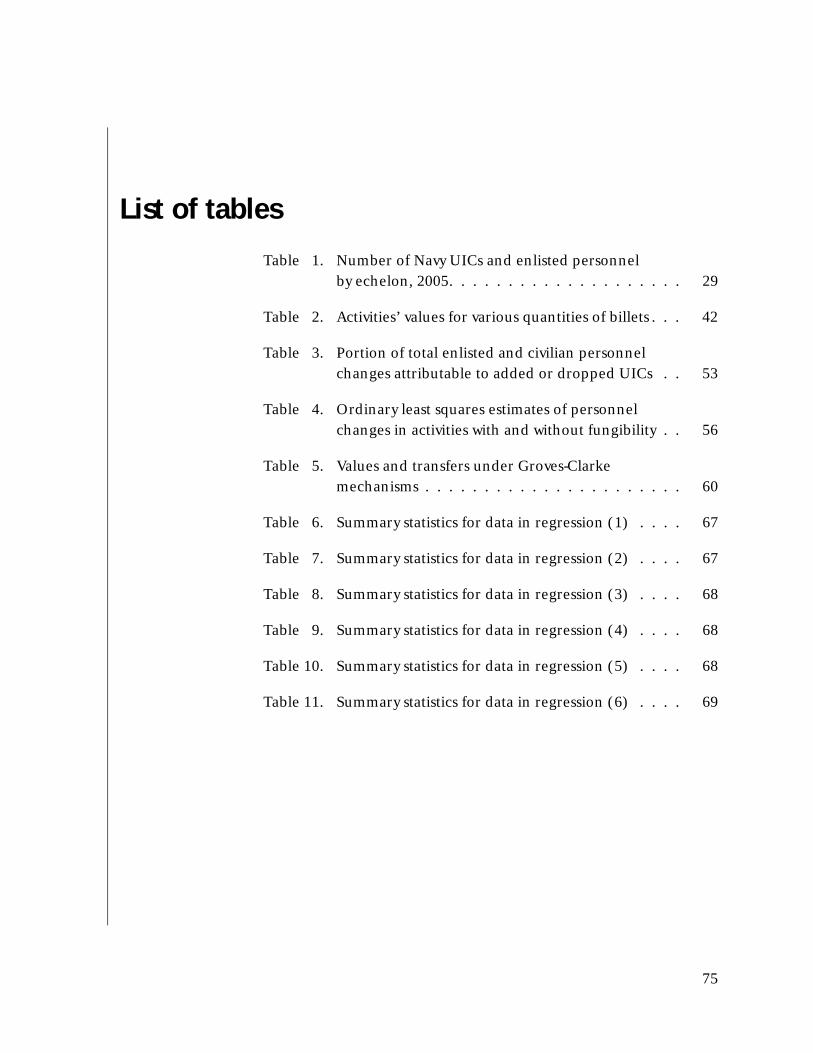
List of tables
Table 1. Number of Navy UICs and enlisted personnel by echelon, 2005. . . . . . . . . . . . . . . . . . . . 29
Table 2. Activities’ values for various quantities of billets . . . 42
Table 3. Portion of total enlisted and civilian personnel changes attributable to added or dropped UICs . . 53
Table 4. Ordinary least squares estimates of personnel changes in activities with and without fungibility . . 56
Table 5. Values and transfers under Groves-Clarke mechanisms . . . . . . . . . . . . . . . . . . . . . . 60
Table 6. Summary statistics for data in regression (1) . . . . 67
Table 7. Summary statistics for data in regression (2) . . . . 67
Table 8. Summary statistics for data in regression (3) . . . . 68
Table 9. Summary statistics for data in regression (4) . . . . 68
Table 10. Summary statistics for data in regression (5) . . . . 68
Table 11. Summary statistics for data in regression (6) . . . . 69
75

This page intentionally left blank.
76


CR
M D
0014
586.
A2/
Fin
al