Embed Size (px)
Citation preview

GOVERNMENT OF JAMAICA
FISCAL POLICY PAPER FY 2016/17
14
GOVERNMENT OF JAMAICA
FISCAL POLICY PAPER FY 2016/17
14th April 2016
GOVERNMENT OF JAMAICA
FISCAL POLICY PAPER

TABLE OF CONTENTS
PART 1 FISCAL RESPONSIBILITY STATEMENT PART 2 MACROECONOMIC FRAMEWORK Overview of Macroeconomic Developments FY 2015/16
• Real Sector Developments
• Labour Market Developments
• Monetary Developments
• External Sector Developments
• The Commodities Market
• The International Environment
Macroeconomic Outlook FY 2016/17 – FY 2019/20
• Growth Agenda
• Medium Term Growth Projections
• Projected Real Sector Performance FY 2016/17 to FY 2019/20 PART 3 FISCAL MANAGEMENT STRATEGY
Central Government Operations FY 2015/16
• Background
• FY 2015/16 Performance
Public Debt Stock FY 2015/16 Public Bodies Operations FY 2015/16
Medium Term Fiscal Programme
• Revenue Strategy
• Expenditure Strategy
• FY 2016/17 Budget – Central Government
• Public Debt Trajectory
• FY 2016/17 Budget – Public Bodies
Appendix I Expenditure Profile Appendix II Public Financial Management Reform Programme Appendix III Financial Sector Developments Appendix IV Strategic Human Resource Management Appendix V Tax Administration Programme Appendix VI Public Sector Investment Programme FY 2016/17 – 2019/20 Appendix VII Fiscal Risk Statement

1
PART 1
FISCAL RESPONSIBILITY STATEMENT Introduction The enhanced fiscal rules, which were adopted by the Government of Jamaica (GOJ), through
amendments to the Financial Administration and Audit (FAA) and Public Bodies Management and
Accountability (PBMA) Acts in March 2014, require that within six months of the passage of the
Appropriation Act for the financial year to which the relevant Estimates of Revenue and
Expenditure relate, the Minister shall cause to be tabled in both Houses of Parliament, a Fiscal
Policy Paper (FPP). The Minister duly complied with this requirement by laying an FPP Interim
Report in Parliament on September 29, 2015.
The FAA Act also establishes a budget calendar, which requires that the annual Estimates of
Revenue and Expenditure, and the accompanying FPP, be tabled simultaneously in February of each
year to allow for passage of the budget prior to the start of the fiscal year to which those estimates
relate. FY 2015/16 marked the inaugural simultaneous tabling of the Estimates of Revenue and
Expenditure before the start of the fiscal year.
The FY 2016/17 Estimates of Revenue and Expenditure, as well as the FPP, were due to be tabled in
February 2016 to allow for the approval of the budget by both Houses of Parliament by
March 31, 2016. However, the dissolution of Parliament on February 5, 2016 for the holding of
General Elections on February 25, 2016 resulted in a delay in the tabling of the budget and
associated FPP beyond the required timelines in the FAA Act. The advice from the Attorney
General’s Chambers is that the principle of intervening impossibility would be applicable in this
situation. The dissolution of Parliament ended the life of Parliament and accordingly the budget
could not be tabled in the Houses of Parliament. This situation could therefore be classified as a
supervening event. The GOJ thus made a reasonable modification to the timelines for tabling of the
budget to April 14, 2016 with approval expected by May 27, 2016.
The intervening event of the dissolution of Parliament and attendant adjustment in the budget time-
table has resulted in a postponement of the EFF 11th (December 2015) review from the scheduled
February 2016 date. The 11th and 12th (March 2016) reviews will be combined and undertaken in
May 2016. All quantitative targets and structural benchmarks for the December 2015 review quarter
were met.
Commitment to Fiscal Responsibility
On March 3, 2016, a new administration comprised of the Jamaica Labour Party took the reins of
government following a clear mandate given by voters in the February 25, 2016 General Elections.
The new Minister of Finance has reaffirmed the Administration’s unequivocal commitment to

2
fiscal responsibility and prudence and to act decisively in managing fiscal risks. The Minister
recognizes the importance of the GOJ taking deliberate actions to continue the process of
implementing the economic reform programme (ERP) with particular emphasis placed on
bolstering the growth momentum. A critical plank of the immediate overall strategy is to continue
to adhere to the requirements under the Extended Fund Facility arrangement with the International
Monetary Fund (IMF), which is now in its final year of execution. This adherence is vital for the
GOJ to continue to access critical multilateral and bilateral funding support. It is also important for
Jamaica’s on-going engagement with the international capital market.
Responsibility in fiscal management entails strict adherence to targets and involves continuous
monitoring of fiscal events and timely reporting of fiscal decisions and outcomes. This
responsibility requires well-planned and transparent actions to minimize risks and correct
deviations, which may affect the sustainability of public finances over time. Within this context,
the policy decisions that the GOJ takes now will not only be reflective of the immediate impact but
will have due regard to the financial implications or burden for future generations.
The GOJ remains unyieldingly committed to the tenet of fiscal prudence. Economic expansion and
growth in real incomes are dependent on stable economic conditions and sustainable public debt.
The economy has been hobbled by high debt in the past. However, with the public debt trajectory
on a steady downward path the prospects for meaningful public investments to drive economic
growth are higher. The GOJ will be taking decisive actions to build on previous efforts and initiate
new activities to bolster real economic growth and create meaningful jobs.
The GOJ is fully cognizant that the path of fiscal prudence is not without its challenges.
Nonetheless, the alternative path of persistent fiscal deficits and the continued assumption of the
liabilities of public bodies is not a better choice as it results in higher public debt and future tax
burdens. These alternatives have proved to be undesirable and have limited Jamaica´s economic
and social development. Accordingly, the GOJ’s priority objectives for FY 2016/17 and
through the medium term are to grow the economy and create meaningful jobs and in so
doing to facilitate a faster and sustainable reduction of the public debt. As a testament to the
GOJ’s commitment to achieving these objectives, a new Ministry of Economic Growth and Job
Creation has been established. These strategic objectives will be underpinned by efficient
expenditure management; robust and progressive tax reform that eases the burden on the more
vulnerable in the society; comprehensive pension reform; public sector transformation; and
reduction in corruption and waste.
These strategic objectives are in synergy with the GOJ’s thrust to generate sufficient national
savings and create more fiscal space to support economic growth, reduce poverty and improve
social well-being. The enhanced socio-economic infrastructure will help to provide the enabling
environment for improving the quality of life to first world levels, thereby making Jamaica, the
place of choice to live, work, raise families and do business.

3
Economic Reforms
The GOJ recognizes that fiscal consolidation that seeks to reduce the debt burden is necessary.
However, it is not sufficient to overcome the economic challenges that the country faces. The
FPP FY 2015/16 Interim Report that was tabled in September 2015 highlighted the performance
of the government since the beginning of the fiscal year. It also provided a menu of economic
reforms, in particular, fiscal reforms to bolster fiscal and debt sustainability and transform the
Jamaican economy. The GOJ will continue to implement these alongside other structural
reforms, which will continue to contribute toward: creating a more efficient and transparent
fiscal administration; improving Jamaica’s competitiveness; and providing the impetus for
piloting the economy onto a path of sustainable growth and development. These reforms, for
which details are presented in the accompanying Fiscal Management Strategy and Appendices,
include:
• Growth Enhancing Reform;
• Tax Reform (policy and administration);
• Pension Reform
• Public Financial Management Reform;
• Public Sector Reform;
Economic Review and Outlook
FY 2015/16 marks the third year of the four-year EFF arrangement that the GOJ agreed with the
IMF. Performance indicators that have been met include maintaining a large primary surplus in
the range of 7.5% of GDP to 7.25% of GDP, reduction in the fiscal deficit and public debt,
declining current account deficit, low inflation and strong Net International Reserves (NIR).
During the latter two years the targets were met within the context of significantly lower oil
prices.
In recognition of the need to bolster real economic growth, the Board of the IMF in
December 2015, agreed to lower the primary surplus target from 7.5% of GDP to 7.25% for
FY 2015/16 and further to 7.0% for FY 2016/17. This relaxation is to provide additional fiscal
space for growth-enhancing capital spending.
While the growth outcomes have been disappointing, the recent trends are positive. The
Jamaican economy has been seeing improvements in real GDP growth, having registered
positive quarterly year-over-year growth since the last quarter of FY 2014/15. The improvement
in the economy has been reflected in the labour market conditions with employment rising more
rapidly than the labour force, leading to a decline in the unemployment rate. Down-side risks
remain, such as the price of oil rising, and other exogenous factors related to world economic
outlook and climatic conditions which necessitate continuous vigilance and fiscal discipline.

4
Nevertheless, the GOJ remains steadfast in building a solid foundation for sustainable growth
and development. An updated Growth Agenda that provides the framework to systematically
attack binding structural constraints and achieve sustainable economic growth with social equity
consistent with the goals of Vision 2030 Jamaica has been developed and will be tabled in
Parliament in May 2016.
Part 2 and Part 3 on the Macroeconomic Framework and Fiscal Management Strategy,
respectively, provide an assessment on the performance and outlook of the economy.
• Real GDP growth under the EFF has averaged 0.6% (FY 2013/14 & FY 2014/15). Real GDP growth is estimated at 0.9% for FY 2015/16 and is expected to pick up from FY 2016/17 onward, averaging 2.0% - 3.0% per annum;
• Debt/GDP is estimated to end March 2016 at 126.8% of GDP, a 3.7 percentage point reduction over the previous year, due largely to the Petrocaribe liability management transaction executed during the year. Debt/GDP stood at 135.6% at end-March 2013;
• The Central Government’s targeted Primary Surplus as a percent of GDP (7.5%) was achieved for FY 2013/14 and FY 2014/15. Preliminary estimates for FY 2015/16 indicate that both the nominal primary surplus target and the primary surplus as a percent of GDP target were achieved at $120,795.9mn and 7.4% respectively. The FY 2016/17 and medium term primary surplus target is 7.0% of GDP;
• Central Government operations generated a Fiscal Surplus of 0.1% of GDP in FY 2013/14 (the first surplus since FY 1995/96). Near zero fiscal balances (-0.5% and -0.3% of GDP) were recorded for FY 2014/15 and FY 2015/16, respectively and incremental surpluses are projected over the latter years of the medium term. Of note, the Debt Service/Tax Revenue ratio has fallen from 67.3% in FY 2012/13 to a projected 48.5% in FY 2016/17 primarily due to the NDX. Accordingly, an increased proportion of GOJ’s fiscal resources is available to support priority social programmes;
• Following a surplus of 0.4 % of GDP in FY 2014/15, the overall Public Sector generated a larger surplus of 1.4% of GDP in FY 2015/16. The overall Public Sector is expected to generate surpluses over the later years of the medium term;
• Jamaica recorded a Current Account surplus (US$39.4mn) for the March quarter of 2015, the first since 2004. The Current Account deficit of the Balance of Payments (BOP) declined from 8.1% of GDP in FY 2013/14 to an estimated 2.4% of GDP for FY 2015/16 and it is expected to remain close to 3.0% over the medium term. The decline in global oil prices and other commodities had a significant positive on Jamaica’s current account.
• The Jamaica dollar has depreciated against the US dollar, since the start of the ERP, by an average of 12.0% per annum. With the narrowing of the inflation differential between Jamaica and its trading partners, the rate of depreciation of the Jamaica dollar has slowed;

5
• Inflation in calendar year 2015 was 3.7%, (6.4% in 2014) the lowest rate in almost 50 years. For the fiscal year to February 2016, inflation was 3.1% and is expected to end FY 2015/16 at 3.5%. Prudent and complementary monetary and fiscal policies, alongside favourable oil prices, have served to maintain inflation at low single digits, which are expected to continue over the medium term;
• The NIR increased from US$884.3mn at end-March 2013 to US$2,449.6mn at end-March 2016;
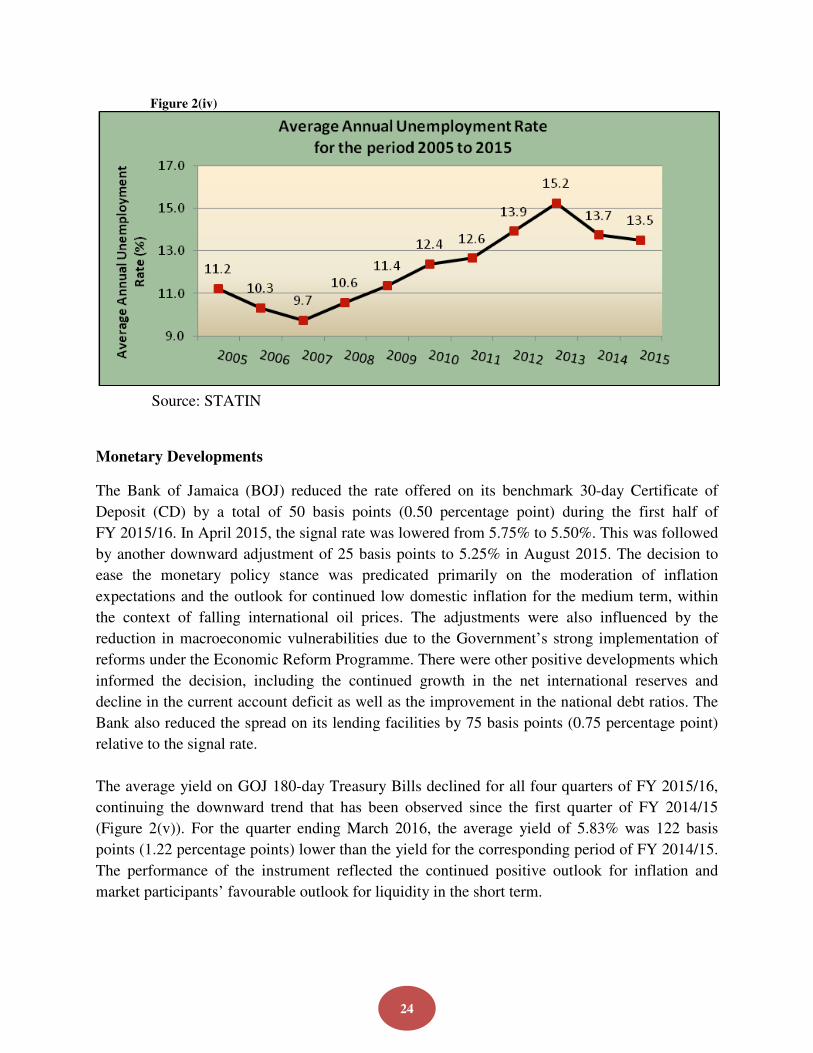
• The average unemployment rate fell from 15.2% in 2013 to 13.7% in 2014 and further to 13.5% in 2015. The unemployment rate in October 2015 was 13.5%, compared to 14.2%, a year earlier. When viewed over a five-year period, unemployment has remained at an unfavourably high level. Strong growth initiatives are expected to positively impact unemployment.
• Both Standard and Poor’s and Moody’s rating agencies upgraded Jamaica’s credit rating in June 2015. These were followed by a ratings upgrade by Fitch in February 2016;
• Jamaica moved up 27 places from 85 to 58 out of 189 countries in the World Bank’s “Doing Business 2015” report.
Fiscal Developments
Supplementary Estimates and Adjustment to Primary Balance Target
The Interim Fiscal Policy Paper (FPP) tabled on September 29, 2015, noted that despite key
fiscal variables outperforming targets up to August 2015, there were emerging challenges on
both the revenue and expenditure fronts that had to be confronted to ensure the continuous
meeting of agreed targets. In particular, the Interim FPP stated that there was a passive gap on
the Central Government primary balance of $12,743.4mn (0.8% of GDP) resulting largely from
higher than budgeted payments for Wages and Salaries and expected shortfalls in Revenues and
Grants. A menu of proposed measures to close the gap were presented, including adjustments to
expenditure on Recurrent Programmes of $6,809.6mn (0.4% of GDP) below the amount
originally budgeted, which the FPP noted would be included in the First Supplementary
Estimates later in the year if deemed necessary. The First Supplementary Estimates tabled on
January 26, 2016 only required reduction in Recurrent Programmes of $2,854.2mn or (0.2% of
GDP) as Revenue and Grants had been performing better than expected and Wages and Salaries
were lower than presented in the Interim FPP.

6
The First Supplementary Estimates also reflected the lowering of the Primary Surplus target
under the EFF from 7.5% of GDP (equivalent to $125,007.5mn1) to 7.25% of GDP
($120,727.6mn) for FY 2015/16. This relaxation targeted the provision of additional fiscal space
for growth-enhancing capital spending, in the amount of $4,213.7mn.
Petrocaribe Liability Management Transaction
In an effort to satisfy a priority objective of the ERP/EFF to reduce the debt to sustainable levels,
the Governments of Jamaica and Venezuela reached an agreement in July 2015 regarding
buyback of Jamaica’s stock of the Petrocaribe Energy Cooperation Agreement debt as at the end
of December 2014. In keeping with the Agreement, the Central Government bought back the
December 2014 outstanding debt, less any payments made between April and July 2015, for
US$1,500.0mn, utilizing funds raised under a US$2,000.0mn issue on the ICM comprising (i) a
13-year bond with equal repayments in 2026, 2027and 2028 at 6.75% and (ii) a 30 year bullet
bond at 7.875 percent. The buyback essentially replaced, at a reduced face value, debt with a flat
repayment schedule throughout its remaining life, with international bonds with back-loaded
repayments.
Notwithstanding the liability management transaction, the Petrocaribe Energy Cooperation
Agreement remains in place as does the strong Venezuela/Jamaica relationship that has existed
over the years.
FY 2015/16 Performance
Provisional data indicate that Central Government operations for FY 2015/16 generated a
Primary Surplus equivalent to 7.4% of GDP or $120,795.9mn, in line with the target established
under the EFF. The EFF does not have a specific target on the Central Government fiscal
balance, which registered a deficit of $4,883.7mn, compared to the originally programmed
deficit of $4,886.7mn.
The accompanying Part 3 Fiscal Management Strategy provides a detailed assessment of the
fiscal outturn for FY 2015/16, relative to the original budget. The Primary Surplus outturn of
$120,795.9mn was 4.7% less than the originally budgeted surplus of $126,727.6mn. This
deviation from budget is due to relaxation of the EFF Primary Surplus and the outturn is in fact
in line with the supplementary budget.
Revenue and Grants totaled $455,835.8mn, falling short of budget by $2,265.6mn (0.5%) largely
as a result of shortfalls in Bauxite Levy and Grants outweighing strong performance by Non-Tax
Revenue. Notwithstanding the lower than budgeted real economic growth and inflation, Tax
1 The nominal figure of the Primary Surplus target under the EFF was originally $126,727.6mn but this was reduced to $125,007.6mn at the August 2015 review due to an estimated lower nominal GDP for FY 2015/16.

7
Revenue was on target with budget, as robust compliance activities by the TAJ and JCA reaped
positive yields throughout the fiscal year. Expenditure totaled $460,719.4mn, which was in line
with budget as lower Recurrent Expenditure, in particular Interest Payments, was offset by
higher spending on Capital Programmes.
The GOJ has, in large part, completed negotiations for new wage agreements for the 2015/2017
contract period, with the major unions representing public sector workers. In order to maintain
the social consensus underpinning the ERP, foster industrial harmony with workers and ensure
the continued efficient operation of the public service, the GOJ adjusted its initial wage/benefit
offer to public servants from 3% and 2% in years one and two respectively, to 4% and 3% on
basic pay. In addition, some allowances were increased above the rates on basic pay. These
adjustments contributed to Wages and Salaries of $168,787.4mn exceeding budget by 2.2%. The
GOJ will finalize agreements with the remaining groups as soon as is practicable and amounts
relating to FY 2015/16 have been programmed in the FY 2016/17 Budget.
The Overall Balance for the group of 65 Self Financing Public Bodies (SFPBs) is currently
estimated at a surplus of $27,534.1mn for FY 2015/16, compared to the budgeted surplus of
$7,875.3mn. Contributing to this outturn was an Operating Balance of $82,744.3mn which was
13.0% above budget with improvement in the collection of receivables being a significant
contributor. The estimated capital expenditure/investment of the group at $48,442.0mn
reflecting an 80% achievement of the budgeted amount, also contributed to the higher than
budgeted Overall Balance. The largest shortfalls on capital expenditure were reported by the
NHT and CAP. Estimated net transfers to Government of $30,413million improved by 55% on
the budgeted amounts as SCT, corporate taxes and dividends increased.
FY 2016/17 Budget and the Medium Term
Against the backdrop of the GOJ’s strategic objectives, the quantitative targets agreed under the
EFF, the macroeconomic assumptions outlined in the Macroeconomic Framework and the revenue
and expenditure measures being implemented through the FY 2016/17 budget, the MOFPS
developed the medium term fiscal and debt profile (Table 1A).
The macroeconomic forecast for FY 2016/17 includes, inter alia:
• Real GDP growth of 1.8% (up from 0.9% in 2015/16);
• Inflation rate (annual point to point) of 5.5% (3.5% estimated for 2015/16);
• Oil price (WTI) avg. of US$36.90 per barrel (avg. for 2015/16 US$44.50); and
• Core imports increasing by 1.8% relative to estimates for FY 2015/16.
The FY 2016/17 expenditure requirements are forecast at $502,373.8mn (up 0.9 percentage point
of GDP over the previous year to 29.1%) comprising: Recurrent Programmes of $139,772.4mn;
Compensation of $181,141.9mn (including Wages & Salaries of $170,193.5mn); Capital
8
Programmes at $43,000.8mn; and Interest Costs of $138,458.7mn. The most significant increase
is reflected in Capital Programmes, which is projected to increase from 2.0% of GDP to 2.5% of
GDP arising from the relaxation of the Primary Surplus target. The Central Government budget
includes contingency provisions for:
(i) Interest payments on guaranteed loans of $7,647.6mn, consisting of $1,703.4mn for domestic and $5,944.2mn for external interest;
(ii) Amortization (principal) payments on guaranteed loans of $5,015.2mn, with $4,277.8mn allocated for external and $737.5mn for domestic payments;
(iii) Liability management of the internal debt - amortization (principal) payments of $5,000.0mn and interest payments of $250.0mn;
(iv) Liability management of the external debt - amortization (principal) payments of $6,278.0mn and interest payments of $627.8mn; and
(v) Recent agreements already signed and the offers made to the other groups yet to sign, back-pay for prior period; and
(vi) Natural disasters of $550.0mn.
Revenue and Grants are forecast to increase from 27.9% of GDP in FY 2015/16 to 28.1%,
equivalent to $484,763.1mn in FY 2016/17. This forecast includes flows of $8,577.1mn
expected from the ongoing administrative and compliance actions being executed by the Tax
Administration Jamaica (TAJ) and Jamaica Customs Agency (JCA). These actions had
considerable success in FY 2015/16 as manifested in the GOJ meeting its tax revenue target.
Further details on the performance of tax revenue are provided in the FMS while Appendix 5
outlines some key administrative initiatives of the TAJ and JCA. The forecasts for Revenue and
Grants and the Expenditure requirements for FY 2016/17 generate a Primary Surplus of
$120,848.0mn, equivalent to the primary surplus target of $120,848.0mn or 7.0% of GDP.
The Public Bodies Regulations provide for the distribution of profit or surplus from public
bodies to the Consolidated Fund. For FY 2015/16, an amount of $2,955.2mn was transferred to
the Consolidated Fund in addition to $11,400.0mn from the National Housing Trust (NHT).
Programmed transfers from public bodies to the Consolidated Fund for FY 2016/17 amount to
$14,489.7mn, inclusive of the $11,400.0mn from the NHT. These distribution flows will
augment the expected flows from improvement in compliance efforts and contribute toward
meeting the fiscal targets.
The Minister of Finance and the Public Service will outline changes to the structure of Jamaica’s
Personal Income Tax as well as the adjustments, that will be made to ensure the primary surplus
and debt targets are adhered to, when he speaks at the opening of the budget debate on
May 12, 2016.

9
Table 1A: Medium Term Fiscal & Debt Indicators
Act. Act. Est. Proj. Proj. Proj. Proj.
(J$mn) 2013/14 2014/15 2015/16 2016/17 2017/18 2018/19 2019/20
Revenue & Grants 396,979.4 411,715.9 455,835.8 484,763.1 517,184.7 550,624.0 594,728.2
of which Tax
Revenue 343,836.1 370,877.5 411,854.0 445,488.9 487,515.3 519,023.6 561,456.6
Expenditure 395,241.8 418,986.8 460,719.4 502,373.8 515,022.3 527,880.2 555,591.5
of which Wages &
Salaries 156,361.7 158,758.6 168,787.4 170,193.5 179,415.3 188,227.5 197,761.2
of which Interest 109,919.5 124,512.7 125,679.5 138,458.7 128,612.4 119,238.3 114,196.8
Cent Govt Fiscal Balance 1,737.6 -7,270.9 -4,883.6 -17,610.7 2,162.4 22,743.8 39,136.7
Cent Govt Primary Balance 111,657.1 117,241.8 120,795.9 120,848.0 130,774.8 141,982.1 153,333.5
Domestic Debt 1,024,515.2 1,054,911.1 815,948.5 839,910.6 815,965.8 813,655.2 769,924.2
External Debt 921,489.8 986,782.6 1,252,811.0 1,347,468.2 1,428,098.3 1,480,108.8 1,566,117.9
Total Debt 1,946,005.0 2,041,693.7 2,068,759.5 2,187,378.9 2,244,064.1 2,293,764.0 2,336,042.0
(% GDP)
Revenue & Grants 27.1% 26.3% 27.9% 28.1% 27.6% 27.2% 27.2%
of which Tax
Revenue 23.5% 23.7% 25.2% 25.8% 26.1% 25.6% 25.7%
Expenditure 27.0% 26.8% 28.2% 29.1% 27.5% 26.0% 25.4%
of which Wages &
Salaries 10.7% 10.2% 10.3% 9.9% 9.6% 9.3% 9.0%
of which Interest 7.5% 8.0% 7.7% 8.0% 6.9% 5.9% 5.2%
Cent Govt Fiscal Balance 0.1% -0.5% -0.3% -1.0% 0.1% 1.1% 1.8%
Cent Govt Primary Balance 7.6% 7.5% 7.4% 7.0% 7.0% 7.0% 7.0%
Domestic Debt 70.0% 67.5% 50.0% 48.7% 43.6% 40.1% 35.2%
External Debt 63.0% 63.1% 76.8% 78.1% 76.3% 73.0% 71.7%
Total Debt 133.0% 130.6% 126.8% 126.7% 120.0% 113.2% 106.9%
Source: MOFPS
The policy measures to be implemented in FY 2016/17 and over the medium term are expected
to enable the GOJ to achieve its key fiscal targets. These measures, which are critical to meeting
the stated fiscal objectives, are founded on the principles of sound fiscal management. They are
expected to deliver lasting benefits and to be effective in reducing the fiscal deficit and
generating incremental surplus over the medium term, reducing the debt burden on the citizens,
and supporting adequate levels of national savings. The expected reduction in debt and debt
servicing costs should provide more fiscal space to support proper maintenance of the GOJ’s
physical assets and facilitate moderation of cyclical fluctuations in economic activity, as
appropriate. Nevertheless, should there be any unforeseen fallout in programmed revenue and/or
increased expenditure requirements, the GOJ stands ready to make the necessary adjustments
and take the requisite measures to correct any fiscal imbalance that may emerge.
10
Fiscal Reporting
This Fiscal Responsibility Statement sets out projections for the Central Government’s Fiscal
Balance, Primary Balance, Domestic and External debt, as well as guaranteed debt for
FY 2016/17 - FY 2019/20. The fiscal accounts are compiled on a cash accounting basis. These
fiscal accounts are consistent with the IMF Government Finance Statistics (GFS) guidelines.
As required under the enhanced fiscal rules (Fiscal Responsibility Framework
Regulations 2012), this FPP also includes a Fiscal Risk Statement, which evaluates contingent
liabilities and other risks that may affect the fiscal accounts but due to the uncertainty as to their
actual occurrence, are not budgeted. The various contingent liabilities presented may also
contribute to an increase in the debt stock and accordingly must be properly managed.
The policy-priorities and objectives enunciated in this Fiscal Responsibility Statement are
consistent with those in other GOJ documents and in the EFF. It is important however to note
some variances with respect to presentations, as follows:
(i) The total debt shown in Table 1A and the remainder of this FPP refers to Central Government debt, Bank of Jamaica debt and Government guaranteed external debt. The stock of debt utilized for the EFF includes Central Government debt, Bank of Jamaica debt, Government guaranteed external debt, Government guaranteed domestic debt and net debt of the PetroCaribe Development Fund (PCDF).
(ii) The Revenue and Grant figures for FY 2015/16 in this FPP represent actual collections by revenue departments/agencies to March 2016. However, the revenue data contained in the Revenue Estimates represent transfers from the revenue Departments/Agencies to the Consolidated Fund. Transfers to the Consolidated Fund may differ from actual revenue collections because of a lag between receipt of revenue and the physical transfer of such revenue to the Consolidated Fund. The fiscal and primary balances shown in Table 1A and the remainder of the FPP are compiled on the basis of actual revenue collections. Additionally, the estimated expenditure outturn for FY 2015/16 shown in Table 1A and upon which fiscal and primary balances are computed is based on actual cash expenditure to March 2016.
Going forward, there are some significant fiscal reporting changes to be implemented, most
notably:
(i) Beginning with FY 2016/17 Budget, the Central Government has adopted a Revised Chart of Accounts (COA). Thus both the Estimates of Expenditure and Revenue Estimates for FY 2016/17 have been prepared and presented in the COA format. The Revised COA establishes a set of standard accounting codes for revenue, expenditure, assets and liabilities to be used throughout the public sector in order to enhance the capability of government to produce financial reports. The revenue estimates presented in this FPP utilize the usual format, consistent with that agreed under the IMF’s General Data
11
Dissemination Standards (GDDS). However during FY 2016/17 there will be further consultations among stakeholders regarding possible adjustments in the Metadata for the GDDS and fiscal reports for future FPPs.
(ii) The Revised COA also requires some adjustments of the components currently captured as Wages and Salaries. These adjustments are to be consistent with the IMF’s Government Finance Statistics guidelines and will change the value captured as Wages and Salaries, as well as the associated Wages/GDP ratio. Among the changes will be the removal of the GOJ’s employer’s contribution toward the NHT and NIS from Wages and Salaries. While these contributions, including the government’s portion of the cost toward health insurance, are considered part of Compensation, the GFS does not include them in Wages and Salaries. In light of these changes, during the first quarter of FY 2016/17, the MOFPS will be in consultation with key stakeholders, including the IMF staff, regarding other classification issues in respect of Wages and Salaries, which will have important bearing on the targeted Wage/GDP ratio of 9.0%. The MOFPS has already commenced the legislative process to adjust the timeline for the 9.0% of GDP Wage ceiling. However the outcome of the stakeholder consultations will help to guide the determination of a new timeline, which will be reported in the Interim Fiscal Policy Paper to be tabled in September 2016.
(iii) In conformity with the requirements of the March 2014 fiscal rules, the MOFPS will commence monitoring and reporting on the Specified Public Sector (SPS2) in FY 2017/18. Reporting on Central Government operations and on public bodies will continue, however, these will be augmented by the compilation of Fiscal Balance and Public Debt for the SPS starting in FY 2017/18, as required by the FAA Act 2014.
Fiscal Responsibility with Flexibility
Maintaining a prudent fiscal policy with respect to revenue and expenditure is critical for the
achievement of the medium term targets established under the ERP. It is therefore crucial that any
revenue or expenditure measure which has the potential to impair the achievement of the targets is
not adopted without the implementation of countervailing or offsetting measures. It should also be
noted that decisions which impact the revenue or expenditure, may do so over the ensuing fiscal
years.
Both the size and direction of the fiscal deficit and public debt depend on the macroeconomic
assumptions considered, such as: inflation, exchange and interest rates; external and domestic
demand; and the price of oil and other key commodities. Based on the macroeconomic
assumptions over the medium term (inclusive of growth) and the maintenance of a primary
balance of no less than 7.0% of GDP in FY 2016/17 and over the medium term, the trajectory of
2 The SPS is defined in the FAA Act as “the public sector not including any public body certified by the Auditor-General, in the prescribed manner, as primarily carrying out functions that are of a commercial nature that satisfy such criteria as may be prescribed”

12
the public debt is on a firm, downward path. These macroeconomic forecasts are and will always
be susceptible to developments in world markets, particularly oil and other commodities markets.
To the extent that changes in world markets cause a material deviation in the macroeconomic
variables, these will affect fiscal outcomes and influence the development of an appropriate fiscal
response.
The enhanced fiscal rules are focused on fiscal consolidation to achieve debt sustainability.
However, it is desirable that they allow for flexibility for unforeseen situations in order to provide
the necessary adjustments to economic cycles. The preservation of fiscal equilibrium is not
incompatible with cyclical fluctuations in economic activity and disruptions related to public
disaster, national emergency, a severe economic contraction or a financial sector crisis that have a
severe impact on fiscal operations.
The enhanced fiscal rules provide for a Notional Account into which cumulative deviations from
targeted fiscal balances, whether positive or negative, will be recorded. This particular element of
the enhanced fiscal governance framework becomes effective in FY 2017/18. The rules will also
allow for an automatic correction should deviations get to a pre-defined threshold. The legislation
also includes provisions for suspension of the rules under specific circumstances, with
authentication from the Auditor General and the approval of Parliament.
The propositions presented here are consistent with the novel conceptual framework of the FRF,
with respect to the control of public debt and the requirement for public sector solvency. The
international experience has demonstrated that countries facing similar problems have gained
credibility and achieved fiscal objectives by adopting a well-designed FRF, underpinned by
transparency and fiscal rules, and espousing the following fundamental principles to which the
GOJ sincerely commits:
• prevention of high and recurring fiscal deficits, by striking the balance between the citizen's aspirations towards public expenditure and the resources available for financing them;
• targeting of public debt at prudent levels, compatible with revenue and public assets, while providing a safety margin to absorb the effects of contingent liabilities and other fiscal risks;
• adoption of a reasonable tax burden and a stable tax policy;
• preservation of public assets, including their proper maintenance, at a level compatible with the role assigned to the State; and
• transparency in the production and dissemination of information regarding the budget preparation, presentation, execution and accounting.

13
Conclusion
The GOJ will continue to implement the requisite reforms to facilitate sustainable economic
growth with job creation. The upgrade of Jamaica’s credit ratings by the three major
international rating agencies during FY 2015/16, the raising of US$2,000.0mn on the
international capital market in July 2015 at record low coupons, increasing Business and
Consumer Confidence indices, and the improvement in Jamaica’s ranking in the World Bank
Doing Business Index are positive indicators of confidence in the Jamaican economy.
The administration is fully cognizant of the country’s tight fiscal situation and will remain
fiscally responsible by adhering to agreed targets. At the same time, the GOJ will aggressively
focus on the objective of growing the economy and creating meaningful jobs which will enable a
more rapid and sustainable reduction in the public debt. The GOJ has a responsibility to provide
a safe and stable environment that will allow the people to use their talents to create wealth. It
is within this context that the GOJ will be intensifying efforts toward robust tax reform,
divestment of some public assets, containing the cost in government operations and accelerating
the economic growth momentum. The GOJ is confident that these efforts will ensure a more
stable macroeconomic environment, a sustainable debt trajectory, and an improved business
climate that will attract new investments and result in durable job creation and increased
prosperity thereby allowing the citizens to realize the vision of making Jamaica, the place of
choice to live, work, raise families and do business.
The enhanced fiscal rules which were approved by Parliament will help to lock in the gains from
the ongoing fiscal consolidation efforts well beyond the end of the country’s economic
programme with the IMF. These rules, alongside the other wide-ranging reform initiatives being
undertaken, are critical not just for meeting current and near-term targets but more importantly
for moving the country toward lasting prosperity.
In this Fiscal Responsibility Statement, I hereby declare that, in pursuing the policy objectives of
the Government, I will adhere to the principles of prudent fiscal management and seek to manage
fiscal risks accordingly. In so doing, I hereby attest to the reliability, accuracy and completeness
of the information contained in this Fiscal Policy Paper and its compliance with fiscal
responsibility principles.
_______________________________________
Audley Shaw, MP
Minister of Finance and Public Service
April 14, 2016

14
Part 2
MACROECONOMIC FRAMEWORK
Overview of Macroeconomic Developments FY 2015/16
After a significant contraction in the third quarter of calendar year 2014, real GDP rebounded
steadily in the final quarter of 2014 and through most of 2015 (Figure 2(i).
The economic recovery is largely a reflection of developments in the goods industries as the
services sector has exhibited relatively stable growth. Most of the movement in the goods sector
is being driven by ‘Manufacturing’ as well as the ‘Agriculture, Forestry and Fishing’ industry.
The latter has been recovering from the impact of the drought conditions experienced throughout
most of FY 2014/15. The diminishing effects of the drought is evidenced by the convergence of
the growth path for goods production overall and the growth path for goods production excluding
‘Agriculture, Forestry and Fishing’, particularly for the first three quarters of the 2015 calendar
year (Figure 2(ii)). Additionally, production levels for a number of other commodities have been
picking up in recent quarters. Most notable is the improvement in the production of crude
bauxite, reflecting increased capacity utilization as well as the impact of the resumption of
bauxite mining operations at the Alpart bauxite/alumina plant. There has also been an up-tick in
cement production, as the construction industry continues to experience modest growth.
Figure 2(i)
Source: STATIN

15
Figure 2(ii)
Source: STATIN
Within the services sector, except ‘Government Services’, all industry groups performed
positively throughout FY 2015/16. Significantly, tourism has maintained its positive
performance, with a fairly steady growth in visitor arrivals since the recovery began in 2010,
following three years of contraction caused by the Global Recession of 2008/2009. The United
States continues to dominate as the country of origin, although Canada and Europe have led the
increase in recent years.
The improvement in the economy has been reflected in the labour market conditions which
continued to strengthen during the first half of FY 2015/16, confirmed by the movements of the
main labour force indicators. Employment has been rising more rapidly than the labour force,
leading to an increase in the employment rate and a concomitant decline in the unemployment
rate. Both males and females have shared in the improved conditions in the labour market, with
unemployment levels falling for both groups. Throughout the period, the labour force
participation rate, which measures the proportion of the total working-age population (14 years
and over) that is either employed or looking for work, has remained relatively stable.
Inflation has remained low, registering an outturn of 3.7% for calendar year 2015, the lowest rate
in about 50 years. Most of the inflationary pressure emanated from the upward movements in the
price of agricultural food items, stemming from reduced supplies due to sustained drought
conditions. This was however offset by a general fall in the cost for energy related goods as a
result of persistently low international oil prices. Importantly, the inflation differential between
Jamaica and the United States has reduced significantly. The reduction is even more pronounced
in the case of the all-items CPI excluding the more volatile food and energy sub-indexes. Indeed,
for this sub-aggregate, the Jamaica-US gap has closed almost entirely. This should contribute to
the continued easing in exchange rate pressures.

16
The developments in the external sector have been mainly positive. The current account of the
balance of payments continued to improve, evidenced by the narrowing of the deficit recorded
over the first three quarters of FY 2015/16, relative to the corresponding period of the last fiscal
year. Both the goods and the services accounts contributed to this improvement. Export
expansion remains elusive however. The improvement in the goods account followed from a
sharper decline in imports than exports. Also, the Bank of Jamaica (BOJ) maintained its strong
holdings of foreign reserves, with Net International Reserves (NIR) rising to US$2.4bn at end-
March 2016, boosted by the Government’s successful return to the international bond market in
July 2015.
The central bank eased its monetary policy stance during the first half of FY 2015/16, lowering
the signal rate twice in the period, within the context of a relatively low inflation environment.
Credit to the private sector has improved, while there has been growing business and consumer
confidence resulting from a reduction in the macroeconomic vulnerabilities that previously
characterised the economy.
On the fiscal side, the GOJ has maintained disciplined fiscal governance while it continues to
make progress in implementing necessary reforms that will enable an environment supportive of
economic growth. Despite a shortfall in revenues and grants relative to target, lower than
projected total expenditure contributed to a better than budgeted fiscal position up to end-
February 2016.
These developments augur well for stronger economic performance, despite the inevitable
challenges. Growth of 0.9% is anticipated for this fiscal year, and a pick-up in economic growth
to over 2.0% is expected over the medium term.
A summary of the macroeconomic performance of Jamaica for FY 2013/14 to FY 2015/16 is
provided in Table 2A below.

17
Table 2A: Summary of Economic Performance
Unit FY 2013/14 FY 2014/15 FY 2015/16 (Proj.)
Real GDP Growth Rates % 1.0 0.2 0.9
Inflation (Annual Pt to Pt) % 8.3 4.0 3.5
Broad Money (M2*3) Growth % 6.1 5.7 20.0
Unemployment Rate (Oct.) % 14.9 14.2 13.5
Exchange Rate (average selling rate) J$=US$1 103.87 113.07 118.74
Treasury Bill (average 6-month) % 7.9 7.8 6.3
Current Account/GDP % -8.1 -7.0 -2.4
Net International Reserves (NIR); (e-o-p) US$mn 1,303.6 2,293.7 2,449.6
Gross Reserves coverage (Goods & Services Imports) Weeks 14.7 21.6 23.4
Fiscal Accounts
Central Gov't Fiscal Balance/GDP % 0.1 -0.5 -0.3
Central Gov't Primary Balance/GDP % 7.6 7.5 7.4
Public Bodies Overall Balance/GDP % 0.4 0.4 1.7
Debt Stock/GDP % 133.0 130.6 126.8
Source: MOFPS/BOJ/PIOJ
The subsequent sections provide a more detailed assessment of Jamaica’s economic performance
during FY 2015/16 with a focus on developments in the real sector, labour market, monetary
sector and external sector. In addition, the prospects for the economy over the medium term are
examined, along with developments in the commodities market and the international economic
environment.
3 This refers to broad money supply that includes the Jamaica dollar value of foreign currency deposits. The rate of growth provided for FY 2015/16 represents the twelve-month growth up to February 2016.

18
Real Sector Developments
Economic Performance for the first three quarters of FY 2015/16
Real GDP increased by 0.9% for the first three quarters of FY 2015/16, relative to the
corresponding period of FY 2014/15. This reflects improvements in both the Goods Producing
and Services industries. The Goods Producing Industry recorded 2.0% growth, driven by positive
performances in all the component industries. There was a modest 0.2% expansion in the
Agriculture, Forestry & Fishing industry. The performance of the industry was subdued by
drought conditions which prevailed during the review period. According to the Meteorological
Service of Jamaica, for the first half of FY 2015/16, the island recorded average rainfall levels of
50.0% below the thirty-year average rainfall. The Mining & Quarrying industry recorded growth
of 0.6% mainly as a result of increased alumina and crude bauxite production. Manufacturing
output grew by 4.8%, attributable to higher output from both the Food, Beverages & Tobacco
and Other Manufacturing sub-industries. Within the Other Manufacturing sub-industry, the
performance was impacted positively by the return to normal production of the Petrojam
Refinery following its closure between August and October of 2014. The Construction industry
recorded growth of 0.7%, driven primarily by an improvement in the ‘Other Construction’
category, which benefited from increased output associated with road construction and
rehabilitation works as well as infrastructure work in the telecommunications industry. Higher
output in the Building Construction component was influenced by hotel construction and
renovation as well as the build-out of office space to facilitate the expansion of the Business
Process Outsourcing (BPO) industry.
The Services industry recorded a 0.6% expansion for the first three quarters of FY 2015/16.
Contributing to this performance was growth of 1.2% in Hotels & Restaurants which benefited
from an increase in stopover arrivals relative to the corresponding period of FY 2014/15,
primarily reflecting a larger number of visitors from the USA and Europe. This improvement in
visitor arrivals, along with an increase in the volume of bauxite related cargo, also helped to
propel growth of 1.1% in Transport, Storage & Communication. The Services industry was also
positively impacted by a 2.8% rise in Electricity & Water Supply which resulted mainly from an
increase in electricity generation, spurred by a higher consumption demand.
Projected Performance for FY 2015/164
The Jamaican economy is projected to grow by 0.9% (see Table 2B) in FY 2015/16, with real
value added expected to increase by 1.6% for the Goods Producing Industry and 0.7% for the
Services Industry. The performance of the Goods Producing Industry is expected to be driven by
improvements in all the component industries, except for Mining and Quarrying. In particular, a
0.7% increase in the Agriculture, Forestry & Fishing industry is projected mainly due to
increased capacity utilisation at Agro Parks, resulting in more acres under production relative to
4 This estimate is based on three official quarterly out-turns published by STATIN and one quarterly estimate produced by the PIOJ.

19
the previous fiscal year. These parks are geared towards enhancing the domestic supply chain,
thereby facilitating import substitution. The Manufacturing industry is expected to expand by
3.5%, reflecting a recovery from the impact of the 10 weeks closure of the Petrojam Refinery
during the preceding fiscal year as well as increased food processing. Continued activities in the
construction of highways and new hotels, build-out of office space to facilitate the expansion of
the BPO industry as well as construction activities relating to three renewable energy plants are
expected to boost performance in the Construction industry, resulting in growth of 0.7%. On the
contrary, Mining & Quarrying is expected to decline by 0.1%.
The Services Industry is projected to grow by 0.7% and it is anticipated that the main drivers will
be Hotels & Restaurants and Electricity & Water Supply which are expected to grow by 1.6%
and 2.9%, respectively. The underlying growth fillip for Hotels & Restaurants is expected to be
increased visitor arrivals consequent on continued marketing, particularly in new markets, that
will be accommodated by increased room stock. Growth in Electricity & Water Supply output is
expected to be driven by increased electricity generation fuelled by increased business activities
and lower electricity rates stemming from the pass-through of the low international oil prices to
consumers.

20
Table 2B: Change in Value Added by Industry at Constant (2007) Prices (%)
FY 2014/15 FY 2015/16
Actual Projection
GOODS PRODUCING INDUSTRY -1.5 1.6
Agriculture, Forestry & Fishing -5.1 0.7
Mining & Quarrying -0.9 -0.1
Manufacture -1.3 3.5
of which: Food, Beverages & Tobacco 1.1 2.5
Other Manufacturing -4.4 4.9
Construction 1.7 0.7
SERVICES INDUSTRY 0.6 0.7
Electricity & Water Supply -2.0 2.9
Transport, Storage & Communication 0.9 1.2
Wholesale & Retail Trade; Repair and Installation of Machinery 0.3 0.5
Finance & Insurance Services 0.5 0.5
Real Estate, Renting & Business Activities 0.4 0.5
Producers of Government Services -0.1 -0.2
Hotels and Restaurants 4.0 1.6
Other Services 1.6 0.6
Less Financial Intermediation Services Indirectly Measured (FISIM) -0.8 0.2
TOTAL GDP AT BASIC PRICES 0.2 0.9
Source: STATIN & PIOJ
Labour Market Developments
The increasing trend in the average level of employment since 2012 continued in 2015, marking
the fourth consecutive year of improvement. This performance is reflective of the recovery in the
economy generally, and supported by ongoing economic reforms specifically targeting the
enhancement of the business environment and competitiveness.

21
TABLE 2C: SELECTED LABOUR FORCE INDICATORS
BOTH SEXES
2014 2015
October
Annual
July October
Annual
Average Average
TOTAL POPULATION 2,722,000 2,719,975 2,725,900 2,727,200 2,725,225
Population 14 years and over 2,082,800 2,081,300 2,085,900 2,086,900 2,085,350
Labour Force 1,310,200 1,307,500 1,320,500 1,325,200 1,316,575
Employed Labour Force 1,124,000 1,127,825 1,147,500 1,146,600 1,138,700
Unemployed Labour Force 186,200 179,650 173,000 178,600 177,875
Outside The Labour Force 772,600 773,800 765,400 761,700 768,775
Employment Rate 85.8 86.3 86.9 86.5 86.5
Unemployment Rate 14.2 13.7 13.1 13.5 13.5
Job Seeking Rate 9.3 9.0 8.8 8.9 9.1
Percentage of Population under 14 years 23.5 23.5 23.5 23.5 23.5
Percentage of Population 14 years & over 76.5 76.5 76.5 76.5 76.5
Percentage of Population 14+ Outside LF 37.1 37.2 36.7 36.5 36.9
Labour Force as a % age of Total Population 48.1 48.1 48.4 48.6 48.3
Labour Force as a % age of Population 14+ 62.9 62.8 63.3 63.5 63.1
Source: STATIN Labour Force Survey October 2015
According to the October 2015 Labour Force Survey, the unemployment rate fell by
0.7 percentage point to 13.5% compared to 14.2% in October 2014 (Table 2C). This is the lowest
rate of unemployment recorded in October since 2011 (Figure 2(iii)). Relative to October 2014,
the unemployment rate for both males and females moved downwards with the rate declining by
0.6 percentage point to 9.3% for males and by 0.9 percentage point to 18.5% for females. The
unemployment rate for youth aged between fourteen and twenty-four years was 32.7% as at
October 2015. This represented a decrease of 3.3 percentage points in comparison to the 36.0%
reported in October 2014. Within this age group, male unemployment decreased by
2.7 percentage points, moving from 27.3% to 24.6%; while for females it was lower by
4.0 percentage points, having moved from 47.9% to 43.9%. The total labour force grew by 1.1%
relative to October 2014, representing an additional 15,000 persons. However, employment rose
by an even larger number, hence the reduction in the unemployment rate.

Figure 2(iii)
Source: STATIN
Total employment rose by 22,600 persons or 2.0%, reflecting an increase of 10,100 employed
males (1.6% rise) and 12,500 employed females (2.6% r
improvement in employment are
Workers and Shop & Market Sales Workers’ which recorded increases of 11,500 persons (4.6%)
and 8,700 persons (3.9%) respec
offset by reductions in other groups, most notably ‘Skilled Agricultural and Fishery Workers’
which experienced a decline of 8,800 persons (4.3%). Industry wise, the groups that recorded the
largest increase in the number of employed persons are ‘Hotels and Restaurants Services’
‘Real Estate, Renting & Business Activities’ with the former adding 13,700 employees (a 16.8%
increase) and the latter 10,000 employees (a 15.5% increase) (Table 2D). On
employment declined by 7,000 persons (3.4%) for the industry group ‘Agriculture, Hunting,
Forestry & Fishing’ and by 6,100 persons (10.7%) for the industry group ‘Private Households
with Employed Persons’.
22
Total employment rose by 22,600 persons or 2.0%, reflecting an increase of 10,100 employed
males (1.6% rise) and 12,500 employed females (2.6% rise). The occupation groups that led the
improvement in employment are ‘Professionals, Senior Officials and Technicians’ and ‘Service
Workers and Shop & Market Sales Workers’ which recorded increases of 11,500 persons (4.6%)
and 8,700 persons (3.9%) respectively. The level of employment for the period was however
offset by reductions in other groups, most notably ‘Skilled Agricultural and Fishery Workers’
which experienced a decline of 8,800 persons (4.3%). Industry wise, the groups that recorded the
t increase in the number of employed persons are ‘Hotels and Restaurants Services’
‘Real Estate, Renting & Business Activities’ with the former adding 13,700 employees (a 16.8%
increase) and the latter 10,000 employees (a 15.5% increase) (Table 2D). On
employment declined by 7,000 persons (3.4%) for the industry group ‘Agriculture, Hunting,
and by 6,100 persons (10.7%) for the industry group ‘Private Households
Total employment rose by 22,600 persons or 2.0%, reflecting an increase of 10,100 employed
ise). The occupation groups that led the
‘Professionals, Senior Officials and Technicians’ and ‘Service
Workers and Shop & Market Sales Workers’ which recorded increases of 11,500 persons (4.6%)
tively. The level of employment for the period was however
offset by reductions in other groups, most notably ‘Skilled Agricultural and Fishery Workers’
which experienced a decline of 8,800 persons (4.3%). Industry wise, the groups that recorded the
t increase in the number of employed persons are ‘Hotels and Restaurants Services’ and
‘Real Estate, Renting & Business Activities’ with the former adding 13,700 employees (a 16.8%
increase) and the latter 10,000 employees (a 15.5% increase) (Table 2D). On the other hand,
employment declined by 7,000 persons (3.4%) for the industry group ‘Agriculture, Hunting,
and by 6,100 persons (10.7%) for the industry group ‘Private Households

23
TABLE 2D: EMPLOYED LABOUR FORCE BY INDUSTRY
INDUSTRY GROUP
2014 2015 Absolute Change
October
Annual
October
Annual Oct-15 -
Avg-15 -
Average Average Oct-14 Avg-14
BOTH SEXES
Agriculture, Hunting, Forestry & Fishing 207,500 207,775 200,500 202,075 -7,000 -5,700
Mining & Quarrying 6,600 6,150 6,400 5,800 -200 -350
Manufacturing 72,300 72,900 70,700 72,975 -1,600 75
Electricity, Gas and Water Supply 7,800 8,500 8,500 8,700 700 200
Construction 82,700 80,925 84,100 82,575 1,400 1,650
Wholesale & Retail, Repair of Motor Vehicle & Equipment 223,700 226,350 226,800 227,325 3,100 975
Hotels & Restaurants Services 81,400 80,500 95,100 88,200 13,700 7,700
Transport, Storage and Communication 76,000 75,250 72,100 74,725 -3,900 -525
Financial Intermediation 23,800 26,025 23,800 26,400 0 375
Real Estate, Renting & Business Activities 64,500 67,350 74,500 74,175 10,000 6,825
Public Administration & Defence; Compulsory Social Security 55,000 56,850 60,100 56,475 5,100 -375
Education 74,500 70,300 70,800 70,450 -3,700 150
Health & Social Work 31,000 31,900 33,900 32,625 2,900 725
Other Community, Social and Personal Service Activities 57,900 58,700 65,800 60,200 7,900 1,500
Private Households with Employed Persons 56,900 55,550 50,800 53,050 -6,100 -2,500
Industry Not Specified (Incl. Extra-Territorial Bodies) 2,400 2,800 2,700 2,950 300 150
TOTAL EMPLOYED LABOUR FORCE 1,124,000 1,127,825 1,146,600 1,138,700 22,600 10,875
Source: STATIN Labour Force Survey October 2015
A comparison of the annual averages reveals a 0.2 percentage point reduction in the
unemployment rate for 2015, falling from 13.7% in 2014 to 13.5%. The consecutive decline in
the rate between 2013 and 2015 marks the first since the 2005 to 2007 period (Figure 2(iv)).
Following last year’s decline in the annual average unemployment rate for males and females,
both rates again fell marginally in 2015, by 0.2 percentage point to 9.9% and 17.9% respectively.
On the employment side, the annual average level increased by 10,875 persons to 1,138,700
persons.
24
Figure 2(iv)
Source: STATIN
Monetary Developments
The Bank of Jamaica (BOJ) reduced the rate offered on its benchmark 30-day Certificate of
Deposit (CD) by a total of 50 basis points (0.50 percentage point) during the first half of
FY 2015/16. In April 2015, the signal rate was lowered from 5.75% to 5.50%. This was followed
by another downward adjustment of 25 basis points to 5.25% in August 2015. The decision to
ease the monetary policy stance was predicated primarily on the moderation of inflation
expectations and the outlook for continued low domestic inflation for the medium term, within
the context of falling international oil prices. The adjustments were also influenced by the
reduction in macroeconomic vulnerabilities due to the Government’s strong implementation of
reforms under the Economic Reform Programme. There were other positive developments which
informed the decision, including the continued growth in the net international reserves and
decline in the current account deficit as well as the improvement in the national debt ratios. The
Bank also reduced the spread on its lending facilities by 75 basis points (0.75 percentage point)
relative to the signal rate.
The average yield on GOJ 180-day Treasury Bills declined for all four quarters of FY 2015/16,
continuing the downward trend that has been observed since the first quarter of FY 2014/15
(Figure 2(v)). For the quarter ending March 2016, the average yield of 5.83% was 122 basis
points (1.22 percentage points) lower than the yield for the corresponding period of FY 2014/15.
The performance of the instrument reflected the continued positive outlook for inflation and
market participants’ favourable outlook for liquidity in the short term.

25
Figure 2(v)
Source: BOJ
The impact of the policy action of the Bank on liquidity within the financial system contributed
to an improvement to the relatively tight conditions that previously prevailed. Through its open
market operations, the BOJ injected a total of J$59.1bn into the system during the first three
quarters of FY 2015/16. This injection was however offset by Government operations that
absorbed J$52.6bn from the system, resulting in a net injection of J$6.5bn over the period.
Positive real growth in private sector credit returned during the first half of FY 2015/16 (Figure
2(vi)) with expansion in both business and household credit. The growth in credit reflected
demand-driven acceleration in loans and advances to households and businesses. The sectors that
led the growth in business lending were Professional & Other Services, Mining and
Manufacturing. The credit expansion is consistent with the relative improvement in the economy
as well as with the increase in business and consumer confidence. According to data from the
survey of business and consumer confidence, the average annual index of business confidence
climbed to an eight year high in 2015, while the average annual index for consumer confidence
reached its highest level since 2012.

26
Figure 2(vi)
Source: BOJ5
In contrast to the growth in private sector credit since the beginning of 2015, there was a sharp
contraction in public sector credit (Figure 2 (vii) as the government’s demand for domestic
financing declined significantly, due mainly to the ongoing fiscal consolidation as well as a
successful re-entry to the international capital market. This is a welcomed reversal to the
scenario of the recent past where government borrowing crowded out private sector investments,
and highlights one of the achievements of the economic reform programme.
The equities market exhibited buoyancy during 2015, with the Jamaica Stock Exchange (JSE)
surging by 90%. In so doing, the JSE emerged the top-performing index in 2015 according to the
global financial research company Bloomberg which tracks over 90 markets globally. The
performance of the equities market reflected improved investor confidence, in the context of
positive macroeconomic developments including relatively low inflation, continued reduction in
the policy rate of the Bank of Jamaica as well as Jamaica’s progress in implementing a
comprehensive program of economic reforms.
5 The figure utilizes credit stock information obtained from BOJ which was deflated using the CPI.

27
Figure 2(vii)
Source: BOJ
At the end of December 2015, Net Domestic Assets (NDA) had contracted by $36.7bn relative to
the corresponding period of 2014. Over the similar period, the stock of Net International
Reserves (NIR) increased by $50.0bn (US$436.2mn). As a result, the monetary base grew by
$13.3bn or 12.2%. The increase in the NIR mainly reflected the purchase of the US dollar debt
proceeds raised by the GOJ on the international capital markets in July 2015 as well as market
purchases by BOJ which more than offset market sales and payment of GOJ debt during the
period. The contraction in NDA mainly reflected the build-up of Government deposits at the
central bank.
Inflation
The All Jamaica ‘All Divisions’ Consumer Price Index increased from 224.1 at the end of
December 2014 to 232.3 at the end of December 2015, representing cumulative increase of 3.7%
in the index during calendar year 2015 (Table 2E). This is 2.7 percentage points lower than the
6.4% increase recorded during 2014, marking a notable slow down in the pace of price increases.
The division ‘Food and Non-Alcoholic Beverages’ which is the highest weighted division,
registered the largest increase during the calendar year, rising by 8.7%. This was influenced
mainly by the movement in price for ‘Fruits’ and ‘Vegetables and Starchy Foods’ which went up
by 8.0% and 27.0%, respectively, led by the increase in prices for vegetables on the local market,
and reflected primarily the impact of the adverse drought conditions that prevailed throughout
2015 on supplies of most domestic agricultural commodities. With the exception of ‘Housing,
Water, Electricity, Gas and Other Fuels’ and ‘Transport’, all other divisions also experienced
price increases. The division ‘Housing, Water, Electricity, Gas and Other Fuels’, which declined
by 8.3%, was significantly impacted by a 16.5% reduction in the index for the group ‘Electricity,
Gas and Other Fuels’. There was a 4.0% decline in the index for the ‘Transport’ division. These
declines reflected the impact of continued low international oil prices.

28
The All Jamaica ‘All Divisions’ Consumer Price Index increased by 3.1% from the beginning of
FY 2015/16 to the end of February 2016. With the exception of ‘Housing, Water, Electricity,
Gas and Other Fuels’ and ‘Transport’, all the divisions recorded increases. The division which
registered the highest increase was ‘Food and Non-Alcoholic Beverages’, rising 7.9% over the
period.
Inflation for FY2015/16 is expected to turn out well below the lower end of the BOJ’s target
range of 5.5% to 7.5%. For the remainder of the fiscal year, the overall risk to the inflation
forecast is tilted to the downside. The main downside risks include the possibility of more
favourable weather conditions which could drive down the prices of agricultural food items,
lower than anticipated international commodity prices which includes a continuation of the fall
in international oil prices and weaker than expected demand conditions. The major upside risks
include the possible impact of maturing government bonds in the last quarter of the fiscal year,
higher than expected exchange rate depreciation, worsening of adverse weather conditions, a
reversal of falling oil prices and more robust domestic demand than anticipated.
Table 2E
D e c 2 0 14
Inde x
M a r 2 0 15
Inde x
D e c 2 0 15
Inde x
J a n 2 0 16
Inde x
F e b 2 0 16
Inde x
M o nthly %
c ha ng e fo r
F e b 2 0 16
C a le nda r
Ye a r 2 0 15
(% c ha ng e )
C Y 2 0 16 to
F e b 2 0 16
(% c ha ng e )
F Y 15 / 16 t o
F e b 2 0 16
( % c ha ng e )
ALL DIVISIONS - ALL
ITEMS 224.1 222.7 232.3 231.3 229.6 -0.7 3.7 -1.2 3.1
1 Food and Non-Alcoholic
Beverages 270.1 267.6 293.6 291.6 288.9 -0.9 8.7 -1.6 7.9
2 Alcoholic Beverages and
Tobacco 272.0 274.4 286.6 287.4 287.8 0.1 5.4 0.4 4.9
3 Clothing and Footwear 221.3 224.8 231.0 231.4 231.6 0.1 4.4 0.2 3.0
4 Housing, Water, Electricity,
Gas and Other Fuels 224.6 215.2 205.9 203.0 200.5 -1.2 -8.3 -2.6 -6.8
5 Furnishings, Household
Equipment and Routine
Household Maintenance
216.8 218.8 223.4 223.9 224.3 0.2 3.1 0.4 2.5
6 Health 139.9 140.9 142.7 142.8 142.9 0.1 2.0 0.1 1.5
7 Transport 208.7 207.0 200.3 199.5 196.4 -1.5 -4.0 -1.9 -5.1
8 Communication 66.9 66.9 66.9 66.9 66.9 0.0 0.0 0.0 0.0
9 Recreation and Culture 177.5 178.4 182.2 182.9 183.0 0.1 2.6 0.5 2.6
10 Education 173.1 173.1 182.6 182.6 182.6 0.0 5.5 0.0 5.5
11 Restaurants and
Accommodation Services 180.0 185.2 188.4 190.1 190.1 0.0 4.4 0.9 2.7
12 Miscellaneous Goods and
Services 209.0 213.5 222.0 222.6 223.0 0.2 6.2 0.4 4.4
All Jamaica ‘All Divisions’ and Division Indices and Movements
(Base period December 2006 = 100)
Source: STATIN

29
Exchange Rate
There was a continued slowdown in the pace of depreciation of the Jamaican currency relative to
its US counterpart during 2015. At end-December 2015 the weighted average selling rate of the
US dollar with respect to the Jamaica dollar was US$1.00 = J$120.42, representing a
depreciation of 5.0% when compared to the selling rate of at end-December 2014. The rate of
depreciation for calendar years 2014 and 2013 were 7.8% and 14.4% respectively. It is
anticipated that this declining trend will be maintained over the medium term, as the domestic
currency is no longer assessed to be over-valued. The narrowing of the inflation differential
between Jamaica and the United States is expected to also be a significant contributing factor to
the stabilization process.
At end-March 2016, the weighted average selling rate of the US dollar was US$1.00 = J$122.04,
reflecting a depreciation of 6.1% for FY 2015/16.
External Sector Developments
Data for the external sector indicates a continuing trend towards an improved current account
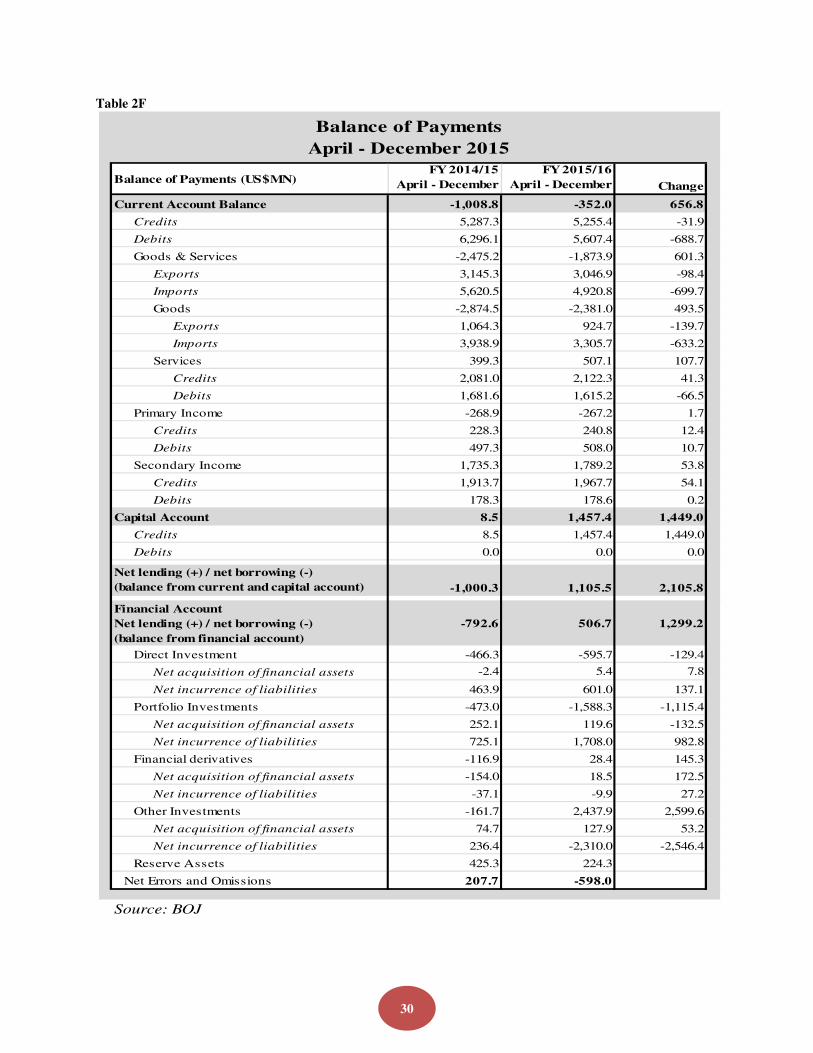
balance for the first three quarters of FY 2015/16 (Figure 2(viii)). The Current Account balance
recorded a deficit of US$352.0mn for the April to December 2015 period, representing 3.4% of
GDP and reflecting an improvement of US$656.8mn relative to the corresponding period in
2014 (Table 2E). Both the goods and the services accounts contributed to the improved current
account balance, with the goods component yielding the greater positive impact. The improved
outturn for the period also emanated from the US$53.8mn improvement in the Secondary
Income sub-account as well as a marginal improvement in the Primary Income account. The
improvement in the Goods account balance was mainly as a result of a larger decline in imports
than exports. The fall in imports primarily reflected declines in the import bill for Mineral Fuel,
Food, and Chemicals. Exports decreased largely due to reductions in Crude Materials and
Mineral Fuel sold abroad. The Services sub-account benefited from improvement in net Travel
and net Transport Services flows and increased private transfers.
The Capital Account balance recorded a surplus of US$1,457.4mn over the first three quarters of
FY 2015/16, primarily reflecting the impact of repurchasing the PetroCaribe debt at a discount.
This outturn together with the balance on the Current Account resulted in a net lending balance
of US$1,105.5mn, compared to a net borrowing balance of US$1,000.3mn for the corresponding
period of FY 2014/15. Reserve Assets increased by US$224.3mn between April and
December 2015 as flows from official and private sources were more than sufficient to finance
the Current and Capital accounts.
30
Table 2F
Balance of Payments (US$MN) FY 2014/15
April - December
FY 2015/16
April - December Change
Current Account Balance -1,008.8 -352.0 656.8
Credits 5,287.3 5,255.4 -31.9
Debits 6,296.1 5,607.4 -688.7
Goods & Services -2,475.2 -1,873.9 601.3
Exports 3,145.3 3,046.9 -98.4
Imports 5,620.5 4,920.8 -699.7
Goods -2,874.5 -2,381.0 493.5
Exports 1,064.3 924.7 -139.7
Imports 3,938.9 3,305.7 -633.2
Services 399.3 507.1 107.7
Credits 2,081.0 2,122.3 41.3
Debits 1,681.6 1,615.2 -66.5
Primary Income -268.9 -267.2 1.7
Credits 228.3 240.8 12.4
Debits 497.3 508.0 10.7
Secondary Income 1,735.3 1,789.2 53.8
Credits 1,913.7 1,967.7 54.1
Debits 178.3 178.6 0.2
Capital Account 8.5 1,457.4 1,449.0
Credits 8.5 1,457.4 1,449.0
Debits 0.0 0.0 0.0
Net lending (+) / net borrowing (-)
(balance from current and capital account) -1,000.3 1,105.5 2,105.8
Financial Account
Net lending (+) / net borrowing (-)
(balance from financial account)
-792.6 506.7 1,299.2
Direct Investment -466.3 -595.7 -129.4
Net acquisition of financial assets -2.4 5.4 7.8
Net incurrence of liabilities 463.9 601.0 137.1
Portfolio Investments -473.0 -1,588.3 -1,115.4
Net acquisition of financial assets 252.1 119.6 -132.5
Net incurrence of liabilities 725.1 1,708.0 982.8
Financial derivatives -116.9 28.4 145.3
Net acquisition of financial assets -154.0 18.5 172.5
Net incurrence of liabilities -37.1 -9.9 27.2
Other Investments -161.7 2,437.9 2,599.6
Net acquisition of financial assets 74.7 127.9 53.2
Net incurrence of liabilities 236.4 -2,310.0 -2,546.4
Reserve Assets 425.3 224.3
Net Errors and Omissions 207.7 -598.0
Source: BOJ
Balance of Payments
April - December 2015

31
Figure 2(viii)
Source: BOJ
The Commodities Market
There was a general fall in international commodity prices over the three quarters of FY 2015/16,
ending December 2015. This largely reflects the impact of relatively weak global demand
coupled with buoyant supplies. The IMF’s International Commodity Price Index declined 35.3%
over the period, following the 7.5% fall over the corresponding period of the previous fiscal year.
Contributing to this reduction, were declines of 18.4% in the index for Non-Fuel items and
44.4% in the Fuel (Energy) Price. The sharp reduction in the index for fuel (energy) related
commodities resulted mainly from the downward movement in international oil prices due to an
excess supply, driven by continued growth in shale oil production in the USA and intensified
crude oil production in Iraq. The decline in the index for Non-Fuel items primarily reflected an
expansion in supplies due to the impact of favourable weather conditions in countries that are
major producers of these commodities.
The downward trend in commodities prices is expected to continue through 2016, with the IMF
projecting a 25.8% fall in the International Commodity Price Index for this calendar year. The
decline is expected to be led by a 36.9% drop in the Fuel (Energy) Price Index, resulting from
sustained oil production growth among Organization of the Petroleum Exporting Countries
(OPEC) members and subdued aggregate demand growth. The projected 12.0% reduction in the
Non-Fuel Commodities Index is also expected to have a significant impact on the International
Commodity Price Index. Slowing demand, particularly in China, is expected to drive down metal
prices in 2016.

32
Table 2G: International Commodity Prices
The International Environment
Global economic growth remained subdued in 2015, again falling short of expectations. The
World Economic Outlook (WEO) Update published by the International Monetary Fund reported
in its January 2016 issue that world output grew by 3.1%, compared to the initial growth forecast
of 3.5% at the beginning of January 2015. The pace of growth in 2015 slowed relative to the
3.4% outturn in 2014, despite the continuation of modest recovery in advanced economies. The
disappointing performance has been attributed mainly to the continued deceleration of economic
activity in emerging and developing economies amid declining commodity prices, suppressed
global trade, and weakening capital flows. The contribution to global growth of several of the
Box 2A: International Commodity Prices
Jamaica remains a price taker for a variety of internationally traded primary commodities (Table 2G) such
as alumina, coffee, cocoa and sugar which are important foreign exchange earners for Jamaica. At the
same time, Jamaica spends considerable amounts of foreign exchange on commodities such as oil, soybean,
corn/maize and wheat.
The prices of soybean meal and maize/corn are of critical importance to Jamaica as these are some of the
main inputs in animal feed, especially poultry feed. Poultry (chicken meat) is heavily weighted in the
Consumer Price Index (CPI) basket and movements in the prices of inputs for poultry feed impact inflation
in Jamaica. Crude oil prices are also critical as they affect every aspect of the production process in
Jamaica, mainly via electricity costs and gas at the pumps. When the dimension of adverse J$ foreign
exchange rate movements is added, it brings into sharp focus the need to sustain relative stability in the
foreign exchange market.
Apr-Dec Apr-Dec
FY 2014/15 FY 2015/16
All Commodity Price Index -7.5 -35.3
Non-Fuel Price Index -3.8 -18.4
Fuel (Energy) Price Index -9.4 -44.4
Select Commodities
Cocoa Cents per Kg. 23.2 3.5
Coffee, Arabica Cents per Kg. 55.2 -26.8
Soybean meal $/mt -4.8 -24.5
Maize/Corn $/mt -23.2 -10.1
Wheat, US, HRW $/mt -8.3 -25.5
Sugar, EU, domestic Cents per Kg. 4.9 -6.8
Sugar, World Cents per Kg. -1.3 -24.9
Crude Oil US$ per Barrel -7.9 -46.6
Aluminum US$/Tonne 7.0 -15.7
Commodity Unit
Average Percentage Change
Source: IMF Primary Commodity Prices

33
largest emerging economies declined substantially in 2015. Output growth in China decelerated
to 6.9% compared to 7.3% last year, reflecting a rebalancing of economic activity away from
investment and manufacturing toward consumption and services. Both Brazil and Russia
recorded economic contraction, having been undergoing severe adjustments in the face of
external and domestic challenges.
Growth in the advanced economies remained resilient in 2015, with Spain and the United States
leading the expansion in output. In the United States, economic activity has been driven by
relatively strong domestic demand which is supported by robust consumption and dynamic
investment outside the oil sector as well as strengthening housing and labour markets. These
improvements contributed to the decision by the US Federal Reserve to raise short-term interest
rates for the first time since the Great Recession.
International oil prices continue to decline, reflecting expectations of sustained increases in
production by members of the Organization of the Petroleum Exporting Countries (OPEC),
despite the persistent condition of excess global oil supply over world demand for the
commodity. The anticipated extent of the positive impact of lower oil prices on global demand
has however not materialized due to several mitigating factors. Firstly, the financial strains being
experienced in many oil exporting countries restrict their ability to adequately manage the shock,
resulting in a significant reduction in their domestic demand. Additionally, the plunge in oil
prices has had a considerable negative impact on investment in oil and gas extraction which
diminishes global aggregate demand. Another factor is the lower than expected increase in
consumption among oil importing countries. Finally, limited pass-through of price declines to
consumers may have also been a factor in several emerging market and developing economies.
Notwithstanding the foregoing, the outlook is positive for global growth in the medium term
with expansion in world output of 3.4% projected for 2016 and 3.6% for 2017. Underlying these
projections are expectations of continued recovery among advanced economies as well as
improvements in the GDP growth rate in some of the countries that are currently experiencing
economic distress. The risks to the global outlook are skewed to the downside and relate mainly
to ongoing adjustments in the global economy which include the generalized slowdown in
emerging market economies, rebalancing of economic activity in China, lower commodity
prices, and the gradual exit from extraordinarily accommodative monetary conditions in the
United States. The successful management of these key challenges is imperative, in order to
bolster global growth.
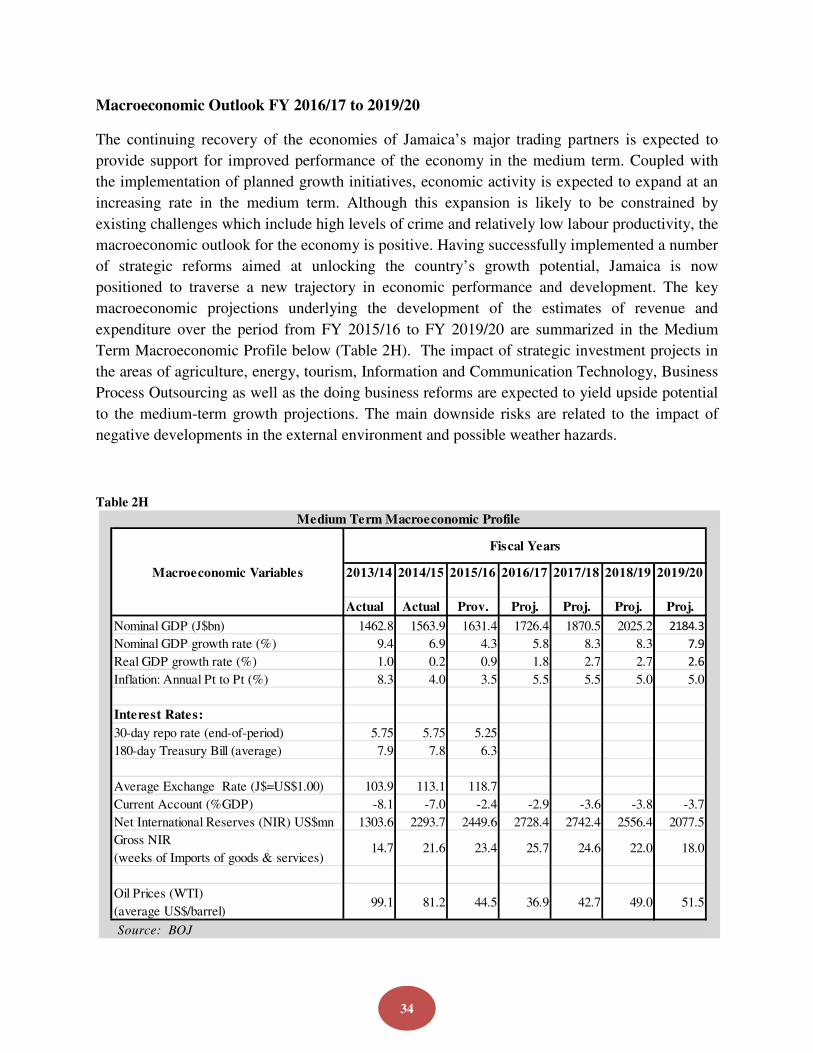
34
Macroeconomic Outlook FY 2016/17 to 2019/20
The continuing recovery of the economies of Jamaica’s major trading partners is expected to
provide support for improved performance of the economy in the medium term. Coupled with
the implementation of planned growth initiatives, economic activity is expected to expand at an
increasing rate in the medium term. Although this expansion is likely to be constrained by
existing challenges which include high levels of crime and relatively low labour productivity, the
macroeconomic outlook for the economy is positive. Having successfully implemented a number
of strategic reforms aimed at unlocking the country’s growth potential, Jamaica is now
positioned to traverse a new trajectory in economic performance and development. The key
macroeconomic projections underlying the development of the estimates of revenue and
expenditure over the period from FY 2015/16 to FY 2019/20 are summarized in the Medium
Term Macroeconomic Profile below (Table 2H). The impact of strategic investment projects in
the areas of agriculture, energy, tourism, Information and Communication Technology, Business
Process Outsourcing as well as the doing business reforms are expected to yield upside potential
to the medium-term growth projections. The main downside risks are related to the impact of
negative developments in the external environment and possible weather hazards.
Table 2H
2013/14 2014/15 2015/16 2016/17 2017/18 2018/19 2019/20
Actual Actual Prov. Proj. Proj. Proj. Proj.
1462.8 1563.9 1631.4 1726.4 1870.5 2025.2 2184.3
9.4 6.9 4.3 5.8 8.3 8.3 7.9
1.0 0.2 0.9 1.8 2.7 2.7 2.6
8.3 4.0 3.5 5.5 5.5 5.0 5.0
5.75 5.75 5.25
7.9 7.8 6.3
103.9 113.1 118.7
-8.1 -7.0 -2.4 -2.9 -3.6 -3.8 -3.7
Net International Reserves (NIR) US$mn 1303.6 2293.7 2449.6 2728.4 2742.4 2556.4 2077.5
18.0
Average Exchange Rate (J$=US$1.00)
Current Account (%GDP)
30-day repo rate (end-of-period)
180-day Treasury Bill (average)
Source: BOJ
Fiscal Years
14.7 21.6 23.4 25.7 24.6 22.0
81.2 44.5 36.9
Inflation: Annual Pt to Pt (%)
Interest Rates:
Medium Term Macroeconomic Profile
Gross NIR
(weeks of Imports of goods & services)
99.1 42.7 49.0Oil Prices (WTI)
(average US$/barrel)51.5
Nominal GDP (J$bn)
Nominal GDP growth rate (%)
Real GDP growth rate (%)
Macroeconomic Variables

35
Real GDP is projected to grow by an average of 2.0% - 3.0% over the next four fiscal years. This
growth is expected to be driven by the performance of both the goods and services industries,
contingent on: the impact of the growth-inducing strategies being implemented, increased global
economic activities, strengthened investor confidence and improved linkages within the domestic
economy.
Inflation is expected to stabilize within the 5.0% to 5.5% range over the medium term. This
expectation is underpinned by assumptions of continuing low international oil and grain prices.
The current account balance as a percentage of GDP is projected to remain relatively low,
averaging -3.5% over the next four years. This is predicated on Jamaica’s improved external
competitiveness, as well as anticipated low global crude oil prices.
Guided by the fiscal responsibility framework, improvements in fiscal management along with
stronger economic performance are expected to keep the total public debt as a percentage of
GDP on its downward trajectory, towards the targeted 96.0% by the end of FY 2019/20.
Growth Agenda
Background
In response to the persistent underperformance of the Jamaican economy, the Government of
Jamaica (GOJ) developed a comprehensive strategy to address the underlying factors and
generate higher levels of economic growth in the medium term. The government’s growth
agenda addresses the binding constraints that the economy faces, and provides a framework to
mobilize potentially productive assets in order to achieve sustainable economic growth with
social equity, consistent with the goals of Vision 2030 Jamaica.
The Guiding Principles of the Growth Agenda are as follows:
• Unleash entrepreneurial dynamism by unlocking latent wealth tied up in idle assets.
• Infrastructure investments as catalyst for job creation through strengthening resiliency of
built environment.
• Build an innovative & competitive modern economy of large and small firms by
strengthening business networks and minimizing supply-side constraints.
• Modernize and improve the efficiency of government.
• Social inclusion through community renewal, expanded self-agency and equity.
• Proactive partnership between government and private sector.

36
The main components of the medium-term growth agenda are summarized in the table below:
Table 2I: Main Components of the Government of Jamaica’s Growth Strategy
Component Role
1. Fiscal Consolidation Provides Macroeconomic Stability
2. Business Environment
Competitiveness Reforms
Addresses Constraints in the Business Environment and facilitates MSME capacity building and enhanced access to financing
3. Strategic Investment Projects Provides Catalytic Capital Investments and Employment; Improves Business Environment
4. Human Capital Development, Social
Protection, Security and Resilience
Builds Labour Productivity; Provides Social Protection; Addresses Crime and Violence Constraints; Reduces the impact of disasters and of climate change
Source: PIOJ
Update on the Growth Agenda
Progress has been made in implementing the programme of stabilization and structural reforms
including:
� Strengthening the framework for fiscal responsibility
� Development of a fiscal management reform action plan
� Debt restructuring and reduction
� Reform of tax incentives legislation
� Implementation of a Central Treasury Management System
� Establishment of a central collateral registry
� Introduction of a multi-purpose registration instrument to streamline the business registration process
� Preparation of new insolvency legislation
� Passage of new Banking Services Act and enabling regulations
� Revision of Electricity Act to facilitate competition and development of electricity sector
� Adoption of legislation supporting flexible work arrangements
� Passage of Special Economic Zone (SEZ) legislation

37
Medium Term Growth Projections6
The projected value added change in the production of goods and services for the four-year
period starting FY 2016/17 is provided in Table 2J7 below.
Table 2J: Projected Change in Value Added by Industry at Constant (2007) Prices (%)
6 The growth rates presented are PIOJ’s baseline growth projections. 7 The headline real GDP growth projections shown in table 2H are higher, generally, than the base-line projections in table 2J, reflecting greater optimism for global growth in the medium term.
FY 2016/17 FY 2017/18 FY 2018/19 FY 2019/20
GOODS PRODUCING INDUSTRY 2.4 3.9 6.6 3.9
Agriculture, Forestry & Fishing 5.0 4.0 4.0 6.0
Mining & Quarrying -0.5 19.1 40.0 2.5
Manufacture 1.7 1.9 2.2 3.9
of which: Food, Beverages & Tobacco 2.0 1.5 2.0 5.0
Other Manufacturing 1.4 2.4 2.5 2.5
Construction 1.5 1.4 1.6 2.5
SERVICES INDUSTRY 0.9 1.2 1.5 2.0
Electricity & Water Supply 2.0 3.0 2.5 3.5
Transport, Storage & Communication 1.8 2.0 2.5 2.5
Wholesale & Retail Trade; Repair and
Installation of Machinery 0.6 0.8 1.0 1.5
Finance & Insurance Services 0.9 1.2 1.7 2.5
Real Estate, Renting & Business Activities 0.6 1.0 1.7 1.8
Producers of Government Services -0.4 -0.4 -0.2 -0.1
Hotels and Restaurants 2.2 3.3 2.9 4.5
Other Services 1.5 2.0 2.0 2.5
Less Financial Intermediation Services
Indirectly Measured (FISIM) 0.3 0.5 0.5 0.5
TOTAL GDP AT BASIC PRICES 1.3 1.9 2.8 2.5
PIOJ's Estimates
Source: PIOJ

38
FY 2016/17 Projected Performance
The economy is projected to grow by 1.3% for FY 2016/17. This projection reflects continued
strengthening of most industries. Increased global output, strengthening of competitiveness in
some industries, improvements in the business environment and the roll out of several major
strategic investment projects are expected to result in an increase in economic activities and a
consequent rise in domestic production mainly in the following industries:
� Agriculture, Forestry & Fishing industry, which is expected to grow by 5.0%. This is
predicated on an increase in linkages between Agriculture and other industries, particularly
the Hotels & Restaurants and Manufacturing industries, and will be facilitated by increased
capacity utilization and output from Agro Parks as well as other GOJ initiatives to increase
output and stabilize the production chain;
� Construction, which is projected to grow by 1.5%. The main drivers will be several strategic
development projects which are slated to be implemented within the short to medium term.
These include projects in the areas of tourism, road infrastructure, logistics, energy,
information and communication technology, and business process outsourcing;
� Hotels & Restaurants, which is projected to grow by 2.3%. This will be facilitated by an
increase in the room stock and frequency of flights into Jamaica;
� Electricity & Water Supply, which is expected to grow by 2.0%. This projection is based on
the anticipated increase in electricity consumption, facilitated by relatively lower energy
prices and higher levels of production.
FY 2017/18 Projected Performance
Economic growth of 1.9% is projected for FY 2017/18. This projection is predicated on
increased global output which will positively impact growth in Jamaica’s main service and goods
exporting industries, as well as increased capacity utilization in some industries. The main
drivers of growth are expected to be:
� Mining & Quarrying, which is projected to grow by 19.1%. This is based on the anticipated
commencement of alumina refining at the Alpart Plant in the final quarter of the fiscal year
as well as an expected increase in aluminium prices in 2017;
� Agriculture Forestry & Fishing, which is projected to grow by 4.0%. The industry will be
driven mainly by expected increase in utilization of Agro-parks and increase linkages with
the Hotels & Restaurants (Tourism) and Manufacturing industries.
� Hotels & Restaurants, which is projected to grow by 3.3%. This projection is based on the
anticipated increase in stop-over arrivals as a result of higher global output and will be
facilitated by further increases in room stock and frequency of flights into Jamaica.
39
FY 2018/19 Projected Performance
Real growth in output is projected to be 2.8% for FY 2018/19. This projection reflects growth in
most industries, as influenced by increased demand locally and externally. Additionally, some
industries will benefit from increased capacity utilization. The main drivers of growth are
expected to be:
� Mining & Quarrying, with growth forecast of 40.0%. This is predicated on alumina refining
operations at Alpart taking place for the entire fiscal year, facilitated by increased global
demand for aluminium;
� Agriculture Forestry & Fishing, which is projected to grow by 4.0%. Similar to FY 2016/15
and FY 2016/17, growth in the industry is expected to be spurred by increased utilization of
Agro-parks and higher demand from Hotels & Restaurants (Tourism) and Manufacturing
industries;
� Hotels & Restaurants, with projected growth of 2.9%. This growth will be driven mainly by
increased activities in the tourism sector.
FY 2019/20 Projected Performance
The economy is projected to expand by 2.5% in real terms for FY 2019/20, driven by growth in
all industries except for Government Services. The most significant contributors to this growth
are expected to be Agriculture, Forestry and Fishing, Hotels and Restaurants and Manufacturing
which are projected to grow by 6.0%, 4.5% and 3.9%, respectively.
40
PART 3
FISCAL MANAGEMENT STRATEGY
Central Government Operations FY 2015/16
BACKGROUND
In conformity with the requirements of enhanced fiscal rules, the FY 2015/16 budget was tabled
in February 2015. In light of this, the budget for FY 2015/16 was predicated on estimated
figures for FY 2014/15, which was comprised of actual data up to December 2014 and estimates
for the remainder of the fiscal year.
Total Expenditure for FY 2015/16 was projected at $462,988.1mn (27.4% of GDP), comprising
Recurrent Expenditure of $432,579.0mn (25.6% of GDP) and Capital Expenditure of
$30,409.0mn (1.8% of GDP). Non-Debt (Primary) Expenditure was budgeted at $331,373.7mn
(19.6% of GDP), an increase of 11.8% over the estimated spending in FY 2014/15 and indicative
of the GOJ attempts at simultaneously implementing the necessary structural reforms whilst
supporting social protection programmes.
Of the total budgeted for Recurrent Expenditure, Wages and Salaries accounted for 9.8% of
GDP, Recurrent Programmes 8.0% and Interest Payment 7.8% of GDP.
The allocation toward the Recurrent Programmes amounted to $135,735.3mn; a nominal
increase of 21.3% over FY 2014/15 estimated outturn and included:
• Provision for the voter re-verification exercise (approx. $1,000.0mn) and $1,200.0mn for
Local Government Elections that were due in June 2015;
• Increases for pension ($1,700.0mn) and government’s contribution to employee’s health
insurance ($1,100.0mn);
• Mitigation provision of $3,400.0mn for weather-related risk and adverse movement in
petroleum prices;
• An increase of $13,000.0mn of additional budgetary support for the Ministry of Health,
to strengthen the ministry’s ability to address the challenges in delivering proper health
care and to stem the build-up in expenditure arrears;
• Increase provision for social spending in order to ensure that overall spending is not
eroded by inflation.

41
Wages and Salaries were budgeted at $165.229.4mn, a 4.1% increase over FY 2014/15 estimated
cost. This provision included: increase in wages, one-off payments and back-pay to Correctional
Officers, Firemen and Health Sector workers; performance increments; and anticipated wage
increase for the 2015/2017 contract period.
Interest Payments were budgeted at $131,614.4mn (7.8% of GDP down from 8.2% of GDP
estimated in FY 2014/15); of which 60.0% was expected to be paid out to domestic creditors
($75,234.3mn) and the remaining 40.0% to external sources ($56,380.1mn). External Interest
cost was expected to rise by 8.3% due to existing and maturing global bonds whilst on the
domestic side maturing Benchmark Investment Notes were the main reason for the projected
cost.
The provision for Capital Programmes amounted to $30,409.0mn (1.8% of GDP, up from 1.6%
in FY 2014/15). Notable inclusions in this Capital provision were: $5,700.0mn for the PATH
programme; $3,100.0mn for the purchase of buses for the JUTC; $2,400.0mn towards the Sugar
Transformation Programme; $1,600.0mn for security vehicles for the Ministry of National
Security and $1,400.0mn for the Fiscal Administration Modernization Programme (FAMP).
Revenue & Grants for FY 2015/16 were projected to increase by 9.6% over the estimates for
FY 2014/15 to $458,101.1mn. This projection represented 27.1% of GDP, compared to 26.5%
in FY 2014/15. Tax Revenue of $411,882.3mn was estimated to increase by 9.0% or
$34,005.1mn over estimated collections in FY 2014/15, a third of which ($10,348.0mn) was
expected from the implementation of new revenue measures (Table 3A).
Excluding the new revenue measures, Tax Revenue was projected to grow by 6.3% over the
estimated receipts for FY 2014/15, marking a deceleration from the 7.9% growth in
FY 2014/15. This deceleration in the growth in Tax Revenue during FY 2015/16 was predicated
on, inter alia: an expected contraction in the GOJ’s wage bill which would reduce PAYE and
Education Tax; the January 2016 increase in the Personal Income Tax threshold; increased
payment of tax refunds; and, lower oil prices.
The new tax measures were introduced to synchronize with the efforts of the TAJ and JCA to
boost compliance. Both the TAJ and JCA had outlined strategic initiatives for FY 2015/16
intended to target compliance and increase revenue (Appendix V). As such, an additional
$12,323.4mn (0.7% of GDP) was expected from these initiatives. TAJ for instance, intended to
build on the previous year’s initiatives by focusing on registration compliance, filing compliance,
payment compliance and correct reporting compliance. Those activities were expected to
improve compliance rates, create equity in the tax system while increasing overall efficiency and
effectiveness of the TAJ operations. JCA also developed strategies to encourage voluntary
compliance through simplified & standardized systems and streamlining core business processes
through the effective use of technology.

42
Table 3A: Summary of the Recommended Revenue Measure for FY 2015/16
Proposed FY 20115/16 Revenue Measures Annualized
(J$mn)
Amendment to the Taxation regime for Life Insurance Companies Effective
for year of assessment 2015
0
Increase in the Special Consumption Tax (SCT) on Cigarettes ($10.50 to $12)
Effective 13th
March 2015
488
Increase in the Specific SCT rates on Petrol (i.e. E10 87, E10 90, Diesel and Ultra
Low Sulphur Diesel) by J$7 per litre. Effective 18th
March 2015
6,412
Replacement of the 1.0 per cent Petroleum Cess to a specific SCT of $2 per litre
Effective March 2015
1,824
Increase in the General Personal Income Tax (PIT) Threshold to $592,800
Effective 1st January 2016
(644)
Re-introduction of GCT on electricity for residential customers (with an
increased threshold of 300 kWh) at the standard rate. Effective 1st April 2015
807
Rationalization of the Environmental Levy- Introduction of the 0.5% of domestic
sales (excluding the services sector) Effective 1st April 2015
962
Rationalization of Outdated Fees - Trade & Business License
Effective 1st April 2015
500
Rationalization of Outdated Fees – Excise Unit Effective 1st April 2015 Compliance
Measure
Reduction of Import Duties (CET) on Horses for Breeding - From 40% Duty to
5% Duty Effective 1st April 2015
(0.1)
Full implementation of the elimination of zero-rating under the GCT for
government purchases (with exception of public schools and Jamaica Defense
Force)
Continuation from FY 2014/2015 (Initiated in Phase I)
Compliance
Measure
Withholding Tax on Specified Services (at a rate of 3%)
Effective 1st May 2015
Compliance
Measure
TOTAL 10,348

43
Non-tax Revenue for FY 2015/16 was budgeted at $30,961.3mn (1.8% of GDP), a reduction of
9.5% from the estimated outturn in FY 2014/15. The projected decline was due to two factors:
1. With JCA transitioning to full executive agency status by April 1, 2015, the agency was
expected to retain $5,160.0 of the Customs Administration Fee (CAF) to cover its
operating expenses, which would have lowered the overall net flow into the Consolidated
Fund; and
2. Distribution/dividends from self-financing public bodies were programmed to be reduced
from $2,366.0mn to $1,247.0mn.
Bauxite Levy collections to be transferred to the Consolidated Funds were programmed at
$4,779.7mn (0.3% of GDP) while Capital Revenue was projected at $938.8mn, a decline of
20.4% from estimated receipts in FY 2014/15.
With respect to Grants, the budgeted collections for FY 2015/16 of $9,539.0mn represented a
109.9% increase over FY 2014/15 estimated receipts, due largely to expected higher inflows
from the European Union (EU) for budget support.
Subsequent to the budget being tabled in February 2015, the actual figures for FY 2014/15
showed some variances from the estimated figures that were presented in the February 2015 FPP
with both Revenue and Grants and Expenditure being lower. Consequently, the variance
between the estimated and actual figures for FY 2014/15 altered the growth rates for the
FY 2015/16 budget.
Based on the actual spending in FY 2014/15, the provision for the FY 2015/16 expenditure
budget represented a 10.5% increase (Table 3B).
Table 3B: FY 2015/16 Expenditure Budget vs. FY 2014/15 Outturn
2014/15 2015/16 % Change
Expenditure 418,986.8 462,988.1 10.5%
Recurrent Expenditure 395,967.8 432,579.0 9.2%
Programmes 112,696.6 135,735.3 20.4%
Wages & Salaries 158,758.6 165,229.4 4.1%
Interest 124,512.7 131,614.3 5.7%
Capital Expenditure 23,019.0 30,409.0 32.1%
Source: MoFPS
The reduced figures for Revenue and Grants in FY 2014/15 resulted in generally larger increases
being projected for FY 2015/16 (Table 3C). Thus Revenue and Grants were projected to grow
by 11.3% over FY 2014/15, with Tax Revenue budgeted to increase by 11.1%, rather than 9.0%
as reported in the February 2015 FPP. The result of this was that greater effort was required of
the tax collection authorities to achieve the collection targets for FY 2015/16 and adhere to the
primary surplus requirement of the economic programme.

44
Table 3C: FY 2015/16 Revenue Forecast vs. FY 2014/15 Outturn
2014/15 2015/16 % Change
Revenue and Grants 411,715.9 458,101.4 11.3%
Tax Revenue 370,877.5 411,882.6 11.1%
Non-Tax Revenue 34,311.5 30,961.3 -9.8%
Bauxite Levy 0.0 4,779.7 100%
Capital Revenue 1,509.2 938.8 -37.8%
Grants 5,017.8 9,539.0 90.1%
Source: MoFPS
CENTRAL GOVERNMENT: FY 2015/16 PERFORMANCE
Provisional data indicate that Central Government operations generated a Primary Surplus
equivalent to 7.40% of GDP, which was above the 7.25% of GDP target established under the
EFF. The nominal value of the Primary Surplus was $120,795.9mn, an increase of $68.3mn over
the EFF target of $120,727.6mn.
The Fiscal Deficit for FY 2015/16 amounted to $4,883.7mn, or 0.3% of GDP, which was in-line
with the approved budget (Table 3D).

45
Table 3D: Central Government Summary Account FY2015/16 (in millions of Jamaica dollars)
Prov. Budget FY 14/15
Item
Apr - Mar Apr - Mar Diff Diff % Apr - Mar Diff Diff %
Revenue & Grants 455,835.8 458,101.4 -2,265.6 -0.5% 411,715.9 44,119.9 10.7%
Tax Revenue 411,854.0 411,882.6 -28.6 0.0% 370,877.4 40,976.6 11.0%
Non-Tax Revenue 35,748.6 30,961.3 4,787.3 15.5% 34,311.5 1,437.1 4.2%
Bauxite Levy 2,116.9 4,779.7 -2,662.8 -55.7% 0.0 2,116.9 -
Capital Revenue 652.7 938.8 -286.1 -30.5% 1,509.2 -856.5 -56.8%
Grants 5,463.6 9,539.0 -4,075.4 -42.7% 5,017.8 445.8 8.9%
Expenditure 460,719.5 462,988.1 -2,268.6 -0.5% 418,986.8 41,732.7 10.0%
Recurrent Expenditure 427,972.2 432,579.1 -4,606.9 -1.1% 395,967.8 32,004.4 8.1%
Programmes 133,505.2 135,735.3 -2,230.1 -1.6% 112,696.6 20,808.6 18.5%
Wages & Salaries 168,787.4 165,229.4 3,558.0 2.2% 158,758.6 10,028.8 6.3%
Interest 125,679.6 131,614.4 -5,934.8 -4.5% 124,512.6 1,167.0 0.9%
Domestic 71,391.3 75,234.3 -3,843.0 -5.1% 76,052.1 -4,660.8 -6.1%
External 54,288.3 56,380.1 -2,091.8 -3.7% 48,460.5 5,827.8 12.0%
Capital Expenditure 32,747.3 30,409.0 2,338.3 7.7% 23,019.0 9,728.3 42.3%
Capital Programmes 32,747.3 30,409.0 2,338.3 7.7% 23,019.0 9,728.3 42.3%
Fiscal Balance (Surplus + / Deficit -) -4,883.7 -4,886.7 3.0 -0.1% -7,270.9 2,387.2 -32.8%
Loan Receipts 298,600.5 128,930.6 169,669.9 131.6% 168,705.9 129,894.6 77.0%
Domestic 29,004.3 56,338.3 -27,334.0 -48.5% 39,247.9 -10,243.6 -26.1%
External 269,596.2 72,592.3 197,003.9 271.4% 129,458.0 140,138.2 108.2%
Project Loans 12,326.3 10,917.9 1,408.4 12.9% 12,968.4 -642.1 -5.0%
Other 257,269.9 61,674.4 195,595.5 317.1% 116,489.6 140,780.3 120.9%
Divestment Proceeds/Other 6,071.2 0.0 6,071.2 - 0.0 6,071.2 -
Amortization 342,726.0 178,579.6 164,146.4 91.9% 87,794.4 254,931.6 290.4%
Domestic 77,718.9 83,443.3 -5,724.4 -6.9% 29,752.50 47,966.4 161.2%
External 265,007.1 95,136.3 169,870.8 178.6% 58,041.90 206,965.2 356.6%
Overall Balance (Surplus + / Deficit -) -42,938.0 -54,535.7 11,597.7 -21.3% 73,640.6 -116,578.6 -158.3
Primary Balance (Surplus + / Deficit -) 120,795.9 126,727.7 -5,931.8 -4.7% 117,241.7 3,554.2 3.0%
Source: MOFPS
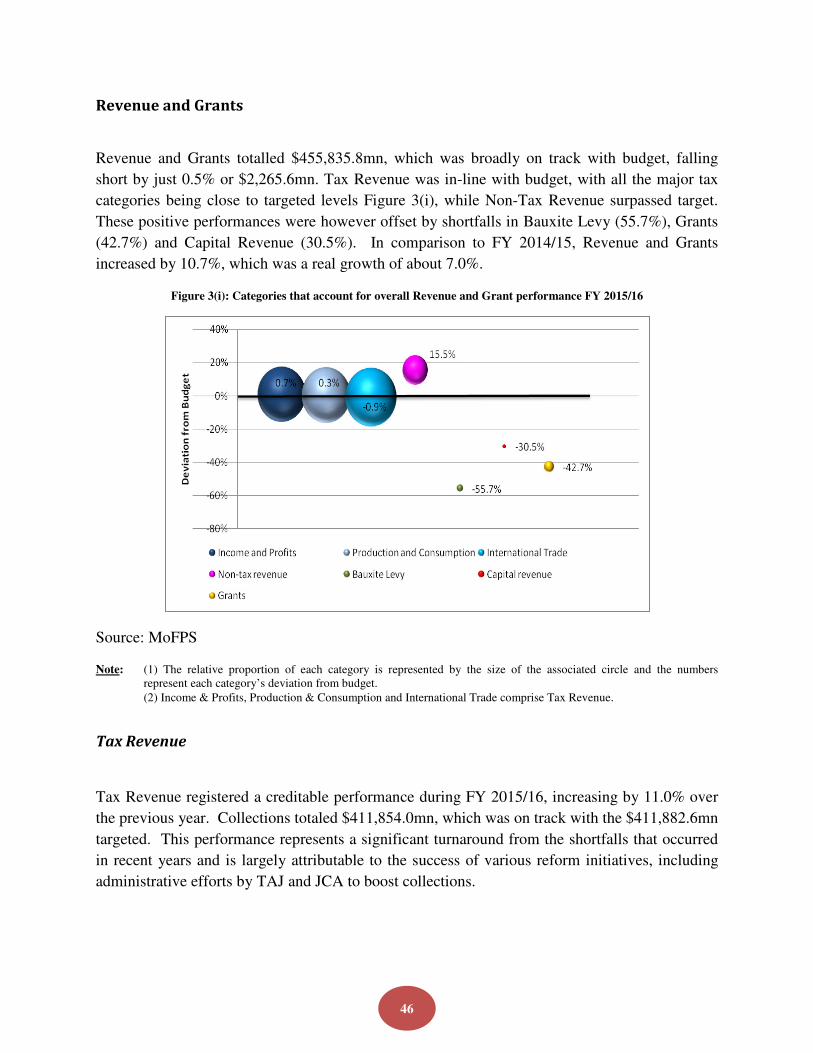
46
Revenue and Grants
Revenue and Grants totalled $455,835.8mn, which was broadly on track with budget, falling
short by just 0.5% or $2,265.6mn. Tax Revenue was in-line with budget, with all the major tax
categories being close to targeted levels Figure 3(i), while Non-Tax Revenue surpassed target.
These positive performances were however offset by shortfalls in Bauxite Levy (55.7%), Grants
(42.7%) and Capital Revenue (30.5%). In comparison to FY 2014/15, Revenue and Grants
increased by 10.7%, which was a real growth of about 7.0%.
Figure 3(i): Categories that account for overall Revenue and Grant performance FY 2015/16
Source: MoFPS
Note: (1) The relative proportion of each category is represented by the size of the associated circle and the numbers represent each category’s deviation from budget.
(2) Income & Profits, Production & Consumption and International Trade comprise Tax Revenue.
Tax Revenue
Tax Revenue registered a creditable performance during FY 2015/16, increasing by 11.0% over
the previous year. Collections totaled $411,854.0mn, which was on track with the $411,882.6mn
targeted. This performance represents a significant turnaround from the shortfalls that occurred
in recent years and is largely attributable to the success of various reform initiatives, including
administrative efforts by TAJ and JCA to boost collections.

47
Figure 3(ii): Performance of Tax Revenue from FY 2009/10 to FY 20015/16
Tax Revenue has been showing a progressive decline in deviation from target, as depicted in
Figure 3(ii), culminating with collections in FY 2015/16 almost exactly on target ($28.6mn
shortfall). The reduction in deviation of Tax Revenue from target brings a greater level of
predictability to fiscal operations and bodes well for improved cash management and budget
execution.
It must be noted that this performance of Tax Revenue in FY 2015/16 occurred within a context
of lower than programmed inflation, larger than budgeted declines in imports and less than
anticipated economic growth, which is illustrative of the effort undertaken by the tax authorities
to collect amounts due.
Income & Profit and Production & Consumption Taxes were both relatively in line with the
targeted amount by $893.1mn (0.7%) and $372.2mn (0.3%) respectively while International
Trade Taxes were slightly lower than budget ($1,293.9mn or 0.9%). All three categories of Tax
Revenue registered increases over FY 2014/15 collections (Table 3E).
Income and Profits
Income & Profit Taxes registered an inflow of $130,759.7mn, which was $893.1mn (0.7%) over
the targeted amount and 8.2% over FY 2014/15 collections. Tax on Interest was the main item
contributing to the above-budget inflows, with collections surpassing budget by $2,112.0mn (or
23.9%). The performance of Tax on Interest was largely due to lower than anticipated refunds.
Notwithstanding the payment of refunds being less than programmed, the GOJ was still able to
reduce the stock of tax refund arrears during FY 2015/16.

48
Receipts from Other Companies (Corporate Taxes) totaled $42,282.2mn, which was in line with
budget and a 17.8% increase over the outturn for FY 2014/15. This outturn stemmed from
improved compliance activities implemented by the TAJ, including the effect of the Fiscal
Incentive Regime introduced in January 2014 and the ‘Know your taxpayer’ campaign
(Appendix V). These measures have influenced tax items such as Corporate Tax, which
underperformed in recent years, to rebound and register improved collections. A steady rise in
the Asset Tax has also contributed to the increased collections in Corporate Taxes as shown in
(Figure 3(iii)).
Figure 3(iii): Performance of Major Tax Types
Source: MoFPS
PAYE receipts of $71,966.2mn were 0.9% above budget. Collections increased $4,148.0mn, or
6.1% over last year. PAYE benefitted from a 6.3% increase in the Central Government’s wage
payments in FY 2015/16. In addition, PAYE has been positively impacted by the continued
improvement and recovery of the business environment, as reflected in the increase in
employment (the employment rate increased from 85.8% in October 2014 to 86.5% at
October 2015).

49
Table 3E: Detail of Revenue FY2015/16 (in millions of Jamaica dollars)
Prov. Budget FY 14/15 Item
Apr - Mar Apr - Mar Diff Diff % Apr - Mar Diff
Diff %
Revenue & Grants 455,835.8 458,101.4 -2,265.6 -0.5% 411,715.9 44,119.9 10.7%
Tax Revenue 411,854.0 411,882.6 -28.6 0.0% 370,877.4 40,976.6 11.0%
Income and profits 130,759.7 129,866.6 893.1 0.7% 120,854.0 9,905.7 8.2%
Bauxite/alumina 0.0 0.0 0.0 0.0% 0.0 0.0 -
Other companies 42,282.2 42,656.6 -374.4 -0.9% 35,902.8 6,379.4 17.8%
PAYE 71,966.2 71,333.2 633.0 0.9% 67,818.1 4,148.1 6.1%
Tax on dividend 1,014.5 1,802.3 -787.8 -43.7% 1,537.4 -522.9 -34.0%
Other individuals 4,549.1 5,238.8 -689.7 -13.2% 4,245.6 303.5 7.1%
Tax on interest 10,947.7 8,835.7 2,112.0 23.9% 11,350.1 -402.4 -3.5%
Production and consumption 133,792.2 133,420.0 372.2 0.3% 120,421.1 13,371.1 11.1%
MBT 560.9 832.6 -271.7 -32.6% 663.9 -103.0 -15.5%
SCT 14,028.2 13,253.6 774.6 5.8% 10,071.9 3,956.3 39.3%
Environmental Levy 235.2 590.0 -354.8 -60.1% 0.0 235.2 _
Motor vehicle licenses 2,946.6 2,724.0 222.6 8.2% 2,663.3 283.3 10.6%
Other licenses 445.2 366.7 78.5 21.4% 388.2 57.0 14.7% Betting, gaming and lottery 2,732.8 3,163.7 -430.9 -13.6% 2,656.3 76.5 2.9%
Accommodation Tax 2,059.1 2,241.2 -182.1 -8.1% 1,999.1 60.0 3.0%
Education Tax 21,244.6 21,100.4 144.2 0.7% 19,623.6 1,621.0 8.3%
Telephone Call Tax 5,808.2 7,429.9 -1,621.7 -21.8% 6,687.8 -879.6 -13.2%
Contractors levy 992.2 1,044.2 -52.0 -5.0% 1,014.1 -21.9 -2.2%
GCT (Local) 72,745.0 70,551.4 2,193.6 3.1% 63,994.6 8,750.4 13.7%
Stamp Duty (Local) 9,994.2 10,122.3 -128.1 -1.3% 10,658.3 -664.1 -6.2%
International Trade 147,302.1 148,596.0 -1,293.9 -0.9% 129,602.3 17,699.8 13.7%
Custom Duty 29,520.9 30,790.6 -1,269.7 -4.1% 26,557.6 2,963.3 11.2%
Stamp Duty 1,971.3 2,191.3 -220.0 -10.0% 1,884.8 86.5 4.6%
Travel Tax 10,150.9 10,496.4 -345.5 -3.3% 9,692.1 458.8 4.7%
GCT (Imports) 65,806.4 66,102.3 -295.9 -0.4% 58,470.9 7,335.5 12.5%
SCT (imports) 37,257.0 36,493.4 763.6 2.1% 30,632.5 6,624.5 21.6%
Environmental Levy 2,595.6 2,522.0 73.6 2.9% 2,364.4 231.2 9.8%
Non-Tax Revenue 35,748.6 30,961.3 4,787.3 15.5% 34,311.5 1,437.1 4.2%
Bauxite Levy 2,116.9 4,779.7 -2,662.8 -55.7% 0.0 2,116.9 -
Capital Revenue 652.7 938.8 -286.1 -30.5% 1,509.2 -856.5 -56.8%
Grants 5,463.6 9,539.0 -4,075.4 -42.7% 5,017.8 445.8 8.9%
Source: MoFPS

50
Tax on Dividend and Other Individuals (self-employed) registered shortfalls of $787.8mn
(43.7%) and $689.7mn (13.2%), respectively. Receipts from Other Individuals were impacted
by lower than expected growth in nominal income. These receipts were however 7.1% more
than in FY 2014/15.
Production and Consumption
Production and Consumption tax receipts were in line with target, recording a slight increase of
$372.2mn (0.3%), as most items were on track with the budgeted amount. Total receipts
increased by 11.1% ($13,371.1mn) above what was collected last year.
Both GCT and SCT contributed significantly to the increased collections, in nominal terms.
Receipts from GCT surpassed budget and last year’s collections by $2,193.6mn (3.1%), and
$8,750.4mn (13.7%), respectively. The buoyant GCT flows stemmed largely from: lower
payment of refunds in FY 2015/16; improved compliance, with significant increase in collection
of arrears; and the full year effect of the payment of GCT by GOJ MDAs. With respect to SCT,
collections were $774.6 (5.8%) above budget and $3,956.3mn (39.3%) more than in FY 2014/15.
Contributing most significantly to this increase last year was the $7.00per litre increase in the
specific SCT rate on petrol which took effect in March 2015, as well as higher inflows from
alcohol.
The main tax types that underperformed relative to budget were: Environmental Levy, with a
significant shortfall of 60.1% ($354.8mn), Minimum Business Tax (MBT) which fell short of the
budgeted amount by 32.6% ($271.7mn), Telephone Call Tax which registered a shortfall of
$1,621.7mn (21.8%); and Betting, Gaming & Lottery which was 13.6% ($430.9mn) lower than
targeted.
Environmental levy was previously charged only on imported products (with some exceptions).
At the beginning of FY 2015/16, the levy base introduced in 2008 was broadened by introducing
a 0.5% levy on the domestic side. However, the implementation date was changed from April 1
to June 1, 2015, with payments commencing in October 2015, resulting in a shortfall in the levy.
The full year effect will impact FY 2016/17.
In addition to falling short of budget, the MBT declined by $103.0mn or 15.5% below
collections in FY 2014/15. The underperformance is partly due to non-compliance on the part of
some businesses as there are significant outstanding payments. Accordingly, the TAJ will be
stepping up compliance activity in respect of this tax type in order to increase compliance and
revenue inflows
The Telephone Call Tax has been a good tax handle for the GOJ. However collections have
trended downward in recent months, resulting in a shortfall against the budget and a decline
below collections in the previous year. The reduction in collections is related to the increased
use of Voice over Internet Protocol (VoIP) and the attendant reduction in telephone calls.
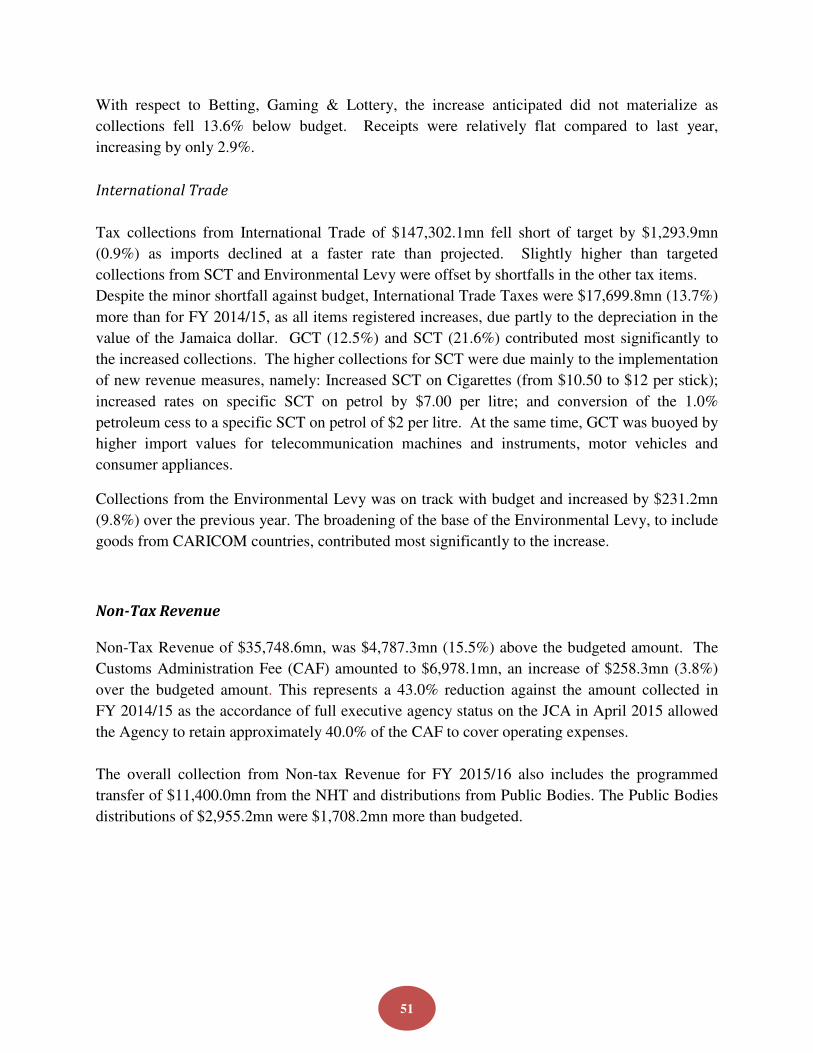
51
With respect to Betting, Gaming & Lottery, the increase anticipated did not materialize as
collections fell 13.6% below budget. Receipts were relatively flat compared to last year,
increasing by only 2.9%.
International Trade
Tax collections from International Trade of $147,302.1mn fell short of target by $1,293.9mn
(0.9%) as imports declined at a faster rate than projected. Slightly higher than targeted
collections from SCT and Environmental Levy were offset by shortfalls in the other tax items.
Despite the minor shortfall against budget, International Trade Taxes were $17,699.8mn (13.7%)
more than for FY 2014/15, as all items registered increases, due partly to the depreciation in the
value of the Jamaica dollar. GCT (12.5%) and SCT (21.6%) contributed most significantly to
the increased collections. The higher collections for SCT were due mainly to the implementation
of new revenue measures, namely: Increased SCT on Cigarettes (from $10.50 to $12 per stick);
increased rates on specific SCT on petrol by $7.00 per litre; and conversion of the 1.0%
petroleum cess to a specific SCT on petrol of $2 per litre. At the same time, GCT was buoyed by
higher import values for telecommunication machines and instruments, motor vehicles and
consumer appliances.
Collections from the Environmental Levy was on track with budget and increased by $231.2mn
(9.8%) over the previous year. The broadening of the base of the Environmental Levy, to include
goods from CARICOM countries, contributed most significantly to the increase.
Non-Tax Revenue Non-Tax Revenue of $35,748.6mn, was $4,787.3mn (15.5%) above the budgeted amount. The
Customs Administration Fee (CAF) amounted to $6,978.1mn, an increase of $258.3mn (3.8%)
over the budgeted amount. This represents a 43.0% reduction against the amount collected in
FY 2014/15 as the accordance of full executive agency status on the JCA in April 2015 allowed
the Agency to retain approximately 40.0% of the CAF to cover operating expenses.
The overall collection from Non-tax Revenue for FY 2015/16 also includes the programmed
transfer of $11,400.0mn from the NHT and distributions from Public Bodies. The Public Bodies
distributions of $2,955.2mn were $1,708.2mn more than budgeted.

52
Bauxite Levy
Receipts from the Bauxite levy amounted to $2,116.9mn, which was $2,662.8mn (55.7%) lower
than expected. This shortfall has stemmed largely from a dispute between Noranda Bauxite
Limited and the GOJ on the applicable bauxite levy rate and the lower than anticipated
aluminum prices.
Specifically, with the expiration of the Interim Fiscal Regime, it was expected that FY 2015/16
would have seen large inflows into the Capital Development Fund from the Bauxite Levy.
However, due to the disagreement on the applicable bauxite levy rate, an interim agreement was
put into action until resolution of the dispute. During this period, the GOJ received a lower price
of US$5 for each tonne of ore exported. In December 2015, there was a favourable ruling for the
GOJ and accordingly the GOJ expects to receive increased flows in subsequent fiscal years.
Capital Revenue Capital Revenue collections of $652.7mn was 30.5% ($286.1mn) below budget and 56.8%
($856.5mn) below last year’s collection. Lower than budgeted collection from loan repayments
and royalties contributed significantly to the shortfall. The royalties from the mining sector were
budgeted at $736.6mn, however only $571.8mn was realized, a shortfall of 22.4%. The budgeted
amount was predicated on the expected growth in the Mining and Quarrying industry, which was
projected at 4.5% for FY 2015/16. However a 0.1% contraction8 is estimated for the industry
and this has negatively impacted inflows to the GOJ.
Grants
Grant receipts amounted to $5,463.6mn, which were $4,075.4mn (42.7%) below the targeted
amount. The shortfall was due partly to a delay in disbursement of a portion of the EU
programmed budgetary support for FY 2015/16. That portion of the payments is now expected in
FY 2016/17. The slower than anticipated execution of some capital projects also affected the
inflows.
Expenditure
During FY 2015/16, the Central Government was able to hold Expenditure to $460,719.5mn,
which was broadly in-line with the programmed amount. This containment of expenditure was
realized due to a reduction of $4,606.9mn or 1.1% in Recurrent Expenditure while allowing
increase in Capital Spending. Increased Capital spending was facilitated by the relaxation of the
Primary Surplus target from 7.5% to 7.25% of GDP for FY 2015/16. The Recurrent Expenditure
8 See “Table 2B: Change in Value Added by Industry at Constant (2007) Prices (%)”

53
amounted to $427,972.2mn and Capital Expenditure was $32,747.3mn. Capital and Recurrent
Expenditure were higher than the previous fiscal year’s spending by 42.3% and 8.1%,
respectively.
Non-debt (primary) expenditure totalled $335,039.9mn, which was $3,666.2mn (1.1%) higher
than budgeted. This higher spending was due largely to the increase in the capital outlay from the
reduction in the EFF Primary Balance target, as well as increased expenditure on Wages and
Salaries arising from the agreements with unions representing public sector workers.
Recurrent Expenditure
Recurrent Expenditure of $427,972.2mn was 1.1% lower than budgeted, as higher spending in
some areas was offset by lower spending in other areas. Specifically, there was an increase in
expenditure on Wages & Salaries while spending on Recurrent Programmes and Interest
Payments were below budget. In comparison to FY 2014/15, Recurrent Expenditure increased
by $32,004.4mn or 8.1% (details provided in the Background Section above).
Recurrent Programmes
Spending on Recurrent Programmes of $133,505.2mn was $2,230.1mn (1.6%) below the
budgeted amount. Due to higher than programmed adjustments in to Wages and Salaries, as well
as an unprogrammed adjustment to travelling cost (motor vehicle upkeep, mileage and
commuting allowance), the GOJ had to contain other areas in the budget to remain on track with
the targeted Primary Surplus. Within that context, spending on Recurrent Programmes was
reduced.
Compared to FY 2014/15, the expenditure on Programmes rose by 18.5% ($20,808.6mn) mainly
due to: significantly higher payments going to the Ministry of Health to address some critical
needs for the health sector; higher payments for pensions; payment of arrears; and payments
towards a hedge to protect against the impact of potential higher oil prices.

54
Wages and Salaries
Wages and Salaries totalled $168,787.4mn, which was 2.2% higher than budgeted. Of this
amount, $5,272.3mn (3.1%) was utilized for back-pay. The expenditure on Wages and Salaries
was 6.3% ($10,028.8mn) more than in FY 2014/15. This increase was due largely to new levels
of pay for public sector workers for the 2015/17 contract period, performance increments and
back-pay for agreements and settlements from prior periods.
After much negotiation with the various unions representing public sector workers, base wages
for approximately 97% of all public sector workers were increased by roughly 4.0% in
FY 2015/16, along with some allowances that were adjusted above the rates on basic pay.
Payments for some groups began in October 2015. These negotiated increases were higher than
the programmed amount (3.0%) and contributed to the expansion of the wage bill from 10.2% of
GDP in FY 2014/15 to 10.3% in FY 2015/16.
Interest Payments
Interest Payments amounted to $125,679.6mn, $5,934.8mn (4.5%) lower than budgeted. Both the
domestic and external debt contributed to this performance. Domestic payments were below by
5.1% ($3,843.0mn) and external costs were 3.7% ($2,091.8mn) lower than budgeted.
The lower than budgeted costs were mainly due to lower than expected inflation (for inflation
linked bonds), slower than anticipated depreciation of the Jamaica dollar, lower than
programmed domestic interest rates and less than anticipated contingency payments, which have
all positively impacted the overall Interest Payments. For FY2015/16, the Interest
Payments/GDP ratio fell by 0.3 percentage point to 7.7%.
Since FY 2009/10, Interest Payments as a proportion of Tax Revenue, Expenditure (excluding
Amortization) and GDP have all been on a downward trajectory (Figure 3(iv)). Initially, these
favourable reductions in the interest ratio was mainly due to the debt exchanges in FY 2009/10
and FY 2012/13, but through continued fiscal prudence, both the fiscal and debt profiles continue
to improve. Specifically, Interest/Tax, Interest/Expenditure and Interest/GDP ratios have seen
significant reductions over the last six years. Also evident is the narrowing of the gap between
the Interest/Tax and Interest/Expenditure ratios (Figure 3(iv)) which is indicative of the efforts to
minimize the disparity between Revenue and Expenditure (i.e. to reduce the fiscal deficit).

55
Figure 3(iv): Interest Ratios
Source: MoFPS
Capital Expenditure
Capital Expenditure totalled $32,747.3mn, a significant increase of $2,338.3mn (7.7%) over the
budgeted amount. This increase in capital expenditure was facilitated through the lowering of the
EFF primary surplus target from 7.5% of GDP to 7.25% of GDP in recognition of the magnitude
of the impact of the Petrocaribe Liability Management Transaction on reducing the debt/GDP
ratio. The fiscal space provided through this action by the IMF was specifically to accommodate
additional growth enhancing capital spending during the year.
In comparison to FY 2014/15, Capital Expenditure was 42.3% ($9,728.3mn) higher. This
increased capital outlay bodes well for the government’s thrust towards providing the enabling
environment to support higher levels of economic growth.
Financing
With a Fiscal Deficit of $4,883.7mn and Amortization Payments of $342,726.0mn, the financing
requirement for FY 2015/16 was $347,609.7mn. The GOJ financed this by borrowing
$298,600.5mn, with the remaining $49,009.2mn financed by utilizing cash balances available at
the start of the fiscal year.
The Loan Receipts were $169,669.9mn (131.6%) higher than budgeted. This was mainly due to
loans from external sources, which totalled $269,596.2mn and was 271.4% ($197,003.9mn) over
the budgeted amount. Accounting for much of the excess over budget is the GOJ’s liability

56
management exercise executed through the buy-back of loans valued at $3,200mn from the
Government of Venezuela, acting through PDVSA Petroleos, S.A. Funds utilized for the
transaction, were raised in the International Capital Market (ICM) through the issue of two new
Eurobonds totaling US$2,000.0mn, as follows:
I. 1st Bond: Matures in 2028 with an interest coupon of 6.750% for a total value of U$1.35
billion. The principal is to be repaid in 2026, 2027, and 2028.
II. 2nd Bond: Matures 2045 with an interest of 7.875% for a total value of U$650mn. Full
repayment is scheduled at maturity.
The GOJ utilized US$1,500.0mn of the funds raised to execute the liability management
transaction with PDVSA, with the additional US$500.0mn for financing budgetary obligations.
Domestic Loan receipts were 48.5% ($29,004.3mn) lower than programmed as the additional
amount raised from external sources reduced the demand for domestic financing.
Amortization Payments totalled $342,726.0mn, an increase over the budget of $164,146.4mn
(91.9%). Domestic Amortization of $77,718.9mn was lower than budgeted by $5,724.4mn
(6.9%), while External payments were higher than expected by $169,870.8mn (178.6%), due to
the liability management transaction with PDVSA.
Public Debt Stock
At end-March 2016, the total outstanding stock of public debt was $2,068,700.0mn compared to
$2,041,693.8mn at end-March 2015 (Table 3F). This represented an increase of $27,006.2mn or
1.3% when compared to end-March 2015.
This slight increase was mainly due to depreciation in the value of the Jamaica dollar. For
FY 2015/16, the Jamaica dollar depreciated by 6.1% relative to the US dollar, moving from
$115.04=US$1.00 to $122.04=US$1.00, and has contributed approximately $75,881.74mn
(3.7%) to the debt stock. For the corresponding period in FY2014/15, the rate of depreciation
was 5.1% and foreign exchange movements added approximately $59,137.9mn (2.9%) to the
debt stock.

57
Table 3F: Total Debt Stock
FY 2014/15 FY 2015/16
(J$mn)
Domestic 1,054,911.1 815,948.5
External 986,782.6 1,252,811.0
Total 2,041,693.7 2,068,759.5
(% GDP)
Domestic 67.5 50.0
External 63.1 76.8
Total 130.6 126.8 Source: MoFPS
The external debt stock stood at $1,252,811.0mn, an increase of $266,028.40mn over the outturn
of $986,782.6mn at end-March 2015 and represented 60.6% of the total debt. The domestic debt
stock decreased by $238,962.6mn to $815.948.5mn and represented 39.4% of total debt at end-
March 2016. During the FY 2015/16, the Government did not issue any new guarantees on
behalf of public bodies nor assume any guaranteed loans. The stock of Government guaranteed
debt at end-March 2016 as a percentage of GDP fell by 1.1 percentage points, from 11.5% to
10.4%, due to net repayments.
At the end of FY 2015/16, domestic debt accounted for 39.4% of the total debt, down from
51.3% at March 2014. Domestic and External bonds are estimated to account for 39.3% and
33.6% of total debt, respectively (Table 3G).

58
Table 3G: Stock of Debt for FY 2015/16 by Creditor Category
FY2014/15 FY2015/16 % of Total debt
J$ Billion J$ Billion FY2015/16
Total debt 2,041,693.8 2,068,700.0 100.0%
Total domestic debt 1,054,911.2 815,948.6 39.4%
Marketable securities 870,000.1 813,219.4 39.3%
Bonds
866,000.1 809,219.4 39.1%
Treasury Bills 4,000.0 4,000.0 0.2%
Loans 184,911.1 2,729.2 0.1%
Total External Debt 986,782.6 1,252,812.2 60.6%
Marketable securities 472,543.6 694,147.4 33.6%
Bonds
472,543.6 694,147.4 33.6%
Loans
514,239.0 558,664.8 27.0%
Bilateral
93,191.0 91,654.8 4.4%
Multilateral 382,230.9 430,903.8 20.8%
IMF 67,093.4 80,773.6 3.9%
IDB 163,320.4 191,762.3 9.3%
IBRD 94,785.5 99,797.5 4.8%
Other 57,031.7 58,570.4 2.8%
Private creditors 38,817.2 36,106.2 1.7%
Source: MoFPS
The debt/GDP ratio has maintained a firm downward trajectory as shown in Figure 3(v).
Debt/GDP ratio has declined from 130.5% at the end of FY 2014/15 to 126.8% in FY 2015/16,
which supports the efforts being made to lower the ratio to 96.0% by March 2020. The buyback
of Petrocaribe Energy Cooperation Agreement debt played a vital role in the reduction of the
ratio during FY 2015/16.
59
Figure 3(v): Debt to GDP from FY 2011/12 to FY 2019/20
Source: MoFPS
• Public Bodies Operations - FY 2015/16
Public Bodies9 continue to undertake a critical role in stimulating economic activity and
promoting development in a wide spectrum of activities including developmental, regulatory,
social and commercial. Based on the size of some Public Bodies and their involvement in port
and housing development, water supply, transportation and energy, their contribution to
development at both the macro- and micro-economic levels has over the years been significant.
Presently, there are approximately 190 active Public Bodies, of which 42% (or 80) are
characterized as self-financing.
The programmed Overall Balance10 of the sixty-five (65) Self-financing Public Bodies (SFPBs)
approved by Parliament for FY 2015/16 was a surplus of $7,875.0mn. Total revenues of the
group of SFPBs were budgeted at $409,162.0mn from which a current balance of $58,214.0mn
was expected.
SFPBs Performance
The estimated Overall Balance of the group for FY 2015/16 is a surplus of $27,534.1mn,
reflecting a significant improvement of $19,658.0mn on the budget. Contributing to this outturn
9 Defined in the Public Bodies Management and Accountability Act as Statutory Bodies, Authorities or Government Companies, but do not include Executive Agencies. 10 The Overall Balance reflects the financing of a PB; increase or decrease in use of credit or improvement in cash deposits.

60
was an Operating Balance of $82,744.0mn which was 13.0% more than budgeted and was
primarily due to a significant improvement in the collection of receivables. The estimated capital
expenditure/investment of the group at $48,442.0mn which represents 80.0% of the budgeted
amount, also contributed to the higher than budgeted Overall Balance. The largest shortfalls on
capital expenditure were reported by the NHT and CAP. Estimated net Transfers to Government
of $30,413.0mn improved by 55% on the budgeted amounts as SCT, corporate taxes and
dividends increased.
Of note, three of the sixty-five entities, Petrojam, National Housing Trust (NHT) and National
Health Fund (NHF), accounted for $19,215.0mn or 97% of the estimated variance of the group.
Petrojam’s outturn resulted mainly from improved margins, decreased value of inventories and
improved collection of receivables. Improved revenue flows coupled with a 10% below budgeted
spending on capital expenditure accounted for NHT’s positive results. The NHF had budgeted to
take over six hospital pharmacies, however this did not materialize resulting in cost savings,
which alongside the under-utilised capital budget, accounted for its favourable results.
The SFPBs generated an Overall Balance surplus of $18,871.0mn for FY 2011/12 but their
performance fell to a deficit of $7,542.0mn for 2012/13. In FY 2013/14 and FY 2014/15, the
SFPBs returned improved performances with a deficit of $3,626.0mn (budgeted deficit
$1,365.0mn) and a surplus of $14,645.0mn (budgeted $298.0mn) respectively. The estimated
performance for FY 2015/16 is therefore a continuation of this trend. The estimated performance
of the SFPBs is shown in the Table 3H below.

61
Table 3H
Public Bodies Summary of Estimated Outturn for Financial Year 2015/16
(Selected & Other)
J$m
SPBs OPBs
Estimated Estimated TOTAL PBs
2015/16 2015/16 2015/16
Statement 'A' Flow of Funds
1 Current Revenue 308,998.46 66,220.67 375,219.12
2 Current Expenses (271,650.82) (43,032.43) (314,683.26)
3 Current Balance 37,347.63 23,188.23 60,535.87
4 Adjustments 21,883.86 324.56 22,208.43
Change in Accounts 0.00 0.00 0.00
Receivable/Payable (303.53) (1,564.02) (1,867.55)
Items not requiring outlay of cash: 0.00 0.00 0.00
Depreciation 13,398.84 1,122.16 14,520.99
Other Non-Cash Items 8,798.65 790.05 9,588.70
Prior Year Adjustment (10.09) (23.63) (33.72)
5 Operating Balance 59,231.50 23,512.79 82,744.29
6 Capital Account (17,556.45) (7,241.15) (24,797.61)
Revenue 17,617.41 170.00 17,787.41
Expenditure (40,433.56) (7,084.70) (47,518.27)
Investment (579.51) (344.99) (924.50)
Change in Inventory 5,839.21 18.54 5,857.75
7 Transfers from Government 8,403.16 6,211.01 14,614.17
Loans 0.00 0.00 0.00
Equity 0.00 0.00 0.00
On-Lending 0.00 0.00 0.00
Other 8,403.16 6,211.01 14,614.17
8 Transfers to Government (38,153.85) (6,872.93) (45,026.78)
Dividend (704.43) (2,250.80) (2,955.23)
Loan Repayments 0.00 0.00 0.00
Corporate Taxes (2,182.89) (283.32) (2,466.21)
Other (35,266.53) (4,338.81) (39,605.34)
9 OVERALL BALANCE (5+6+7+8) 11,924.36 15,609.72 27,534.08
10 FINANCING (11+15) (11,924.36) (15,609.72) (27,534.08)
* 10a Total 816.00 (1,294.16) (478.16)
Capital Revenue 816.00 278.16 1,094.16
Loans 0.00 (2,637.32) (2,637.32)
Equity 0.00 1,065.00 1,065.00
On-Lending 0.00 0.00 0.00
Loan Repayments 0.00 0.00 0.00
11 Total Foreign (12+13+14) (6,848.35) (201,215.81) (208,064.16)
12 Government Guaranteed Loans (3,571.75) (1,326.51) (4,898.26)
Disbursement 2,863.66 700.57 3,564.23
Amortization (6,435.41) (2,027.08) (8,462.49)
13 Direct Loans (3,234.29) (199,889.30) (203,123.59)
Long Term: 2,176.52 (199,934.16) (197,757.65)
Disbursement 2,210.70 149,520.07 151,730.77
Amortisation (34.19) (349,454.23) (349,488.42)
Short Term: (5,410.80) 0.00 (5,410.80)
Change in Trade Credits (5,410.80) 44.86 (5,365.94)
14 Change in Deposits Abroad (42.31) 0.00 (42.31)
15 Total Domestic (16+17+18) (5,892.01) 186,900.25 181,008.23
16 Banking System 1,380.21 17,101.58 18,481.79
Loans (Change) 606.75 (36.50) 570.25
Overdraft (Change) 134.24 (12.22) 122.02
Deposits (Change) 639.22 17,150.30 17,789.52
17 Non-Banks (Change) (2,424.54) 1,286.81 (1,137.72)
18 Other (Change) (4,847.69) 168,511.86 163,664.17

62
MEDIUM TERM FISCAL PROGRAMME
The medium term fiscal programme has been formulated to be consistent with the following
objectives: macro-economic stability; reduction of public debt; and facilitating sustainable
economic growth with job creation. The GOJ is committed to reducing the Debt/GDP ratio to
96.0% by the end of FY 2019/20 as agreed under the EFF. In addition, the GOJ has embraced the
requirement to further reduce the Debt/GDP ratio to the ceiling of 60% by end
FY 2025/26 as legislated by the fiscal rules. Consistent with these debt reduction commitments,
the Central Government Primary Surplus is programmed at 7.0% of GDP for FY 2016/17 and the
medium term. The Overall Balance of the public bodies is programmed to be in balance over the
medium term.
The assumptions outlined in the Macroeconomic Framework (Table 2H) and the expenditure and
revenue strategies outlined below, underpin the development of the robust medium term fiscal
profile, depicted in Tables 3I and 3J. The fiscal profile shows a Central Government Primary
Surplus equivalent to 7.0% of GDP from FY 2016/17 through the medium term. Central
Government operations are expected to generate a Fiscal Surplus of 0.1% of GDP in FY 2017/18,
with larger surpluses in the following years.
Revenue Strategy
The main thrust of the GOJ’s revenue strategy is to continue the building of an efficient and
equitable tax system that supports a stable macro-economy and facilitates a competitive business
environment to support economic growth and development. This will ensure that Government’s
policies and programmes are adequately funded. Within this context, the GOJ will continue to
implement some key policy, administrative and legislative reform actions to augment those
various measures that have already been implemented.
Tax Policy Reform Package
With respect to tax policy initiatives, the Minister of Finance and the Public Service will outline
changes to the structure of Jamaica’s Personal Income Tax (PIT) as well as the adjustments that
will be made to ensure the primary surplus and debt targets are adhered to, when he opens the
budget debate on May 12, 2016.
Tax Administration Reform
Implementation of the various tax administration activities will be spearheaded by both TAJ and
JCA. These activities are summarised below with details provided in Appendix V.

63
Tax Administration Jamaica (TAJ)
Against the background of significant gains in FY 2015/16, TAJ’s strategic focus will seek to
build on these successes thereby meeting the expectations of both taxpayers and stakeholders.
TAJ’s modernization programme will continue to be a driving force behind its strategies over the
medium term.
The TAJ will continue to carry out risk management approaches to tax administration as follows:
(i) compliance risks will be assessed in accordance with the National Compliance Plan;
and
(ii) TAJ will continue to undertake intelligence gathering and conduct research activities
to
increase its knowledge of compliance levels/risks.
TAJ’s compliance programmes are aimed at mitigating identified risks. Mitigation strategies
will be focused on the causes of non-compliance using a mix of responses, including:
(i) education; (ii) assistance; (iii) improved laws and procedures; (iv) audit; and (v) other forms
of enforcement. The TAJ will undertake a post implementation evaluation of the effectiveness
of its mitigation activities where the results will inform future planning.
Jamaica Customs Agency (JCA)
In support of the GOJ’s broad revenue strategy, and, building on its achievements in
FY 2015/16, the JCA’s strategies to be pursued over the medium term include, inter alia:
• assessing and collecting revenue due to the GOJ;
• ensuring the efficient and effective use of resources;
• increasing the methods of detection of imported and exported illegal and prohibited
goods;
• improving voluntary compliance through ongoing public education and by initiating
discussions with stakeholder groups/traders;
• improving legal and regulatory frameworks;
• facilitating the efficient processing of legitimate goods and persons; and
• automating and strengthening information management, information and communication
technology, and financial management systems.
Revenue Profile
Underpinned by the aforementioned strategies and the macroeconomic assumptions outlined in
Part II Macroeconomic Framework, Revenue and Grants are forecast to increase slightly from
the provisional outturn of 27.9% of GDP in FY 2015/16 to 28.1% in FY 2016/17, before

64
declining to 27.2% of GDP in FY 2019/20 (Tables 3I and 3J). Tax and Non-tax Revenue are the
categories expected to contribute to the decline over the medium term.
Tax Revenue is projected to fall marginally from 25.8% of GDP in FY 2016/17 to 25.7% of
GDP in FY 2019/20. The main factors expected to contribute to this marginal reduction are as
follows:
• Reduced PAYE and Education Tax (as a percent of GDP) from the contraction of the
Central Government wage bill (by 0.9 % of GDP); and
• A few tax types, including a significant portion of the SCT, that are fixed rates (not
advalorem) and accordingly will not increase in line with nominal GDP growth, with the
result that these taxes will decline as a proportion of GDP;
The effect of these factors is expected to be offset, however, by the continuing thrust to
implement administrative improvements to the systems and human competences at the TAJ and
JCA. These efforts reaped notable rewards in FY 2015/16 with Tax Revenue achieving the
target.
Non-tax Revenue is projected to decline over the medium term, from 1.8% of GDP for
FY 2016/17 to 1.1% of GDP by FY 2019/20. In FY 2016/17, the last tranche of the
$11,400.0mn transfer from the NHT to the Consolidated Fund will occur, thus contributing to the
sharp reduction in expected Non-tax Revenue in FY 2017/18. Both Bauxite Levy and Grants are
projected to average about 0.2% of GDP over the medium term.
Expenditure Strategy
Expenditure management will continue to be a critical component of the Fiscal Management
Strategy for bolstering fiscal outcomes over the medium to long term. This expenditure
management stance is reflected by a projected fall in Central Government primary expenditure
from 21.1% in FY 2016/17 to 20.1% by FY 2019/20 (Table 3I).
Total expenditure by Central Government is programmed to decline by 3.7 percentage points of
GDP to 25.4% in FY 2019/20 from the budgeted 29.1% in FY 2016/17, with the lion’s share of
the reduction attributable to lower interest payments.
Being cognizant of the impact on the poor, as it implements the necessary fiscal consolidation
strategies alongside supporting structural reforms, the GOJ remains committed to prioritizing
expenditure through enhanced targeting of social spending and will maintain a floor on specified
social protection programmes.
65
This floor has been set at the FY 2012/13 spending level, in real terms. These programmes
include: conditional cash transfers for children and the elderly; basic school subsidy; basic
education including early childhood, primary and secondary education; the school feeding
programme; poor relief programmes; and assistance to persons with disabilities, among others.
FY 2016/17 BUDGET – CENTRAL GOVERNMENT
The GOJ Budget for FY 2016/17 coincides with the fourth and final year of the EFF arrangement
between the GOJ and the IMF. The FY 2016/17 fiscal programme is crafted to be consistent with
the objectives of the ERP. The focus will be on strategies geared toward achieving the primary
surplus of 7.0% of GDP (or $120,848.0mn), which represents the operational instrument utilized
to attain the objective of public debt of 96% of GDP by the end of FY 2019/20. The fiscal
deficit is budgeted at $17,980.3mn or 1.0% of GDP.
The GOJ has successfully met the key quantitative performance criteria and structural
benchmarks under the programme so far and remains cognizant of the fact that there are still
challenges in the global economy, including volatility or uncertainty in the movement of some
commodity prices such as oil and alumina, and subdued global economic growth, which impose
certain risks on the GOJ’s fiscal operations. It is against this backdrop that the FY 2016/17
Budget has been developed.

66
TABLE 3I: CENTRAL GOVERNMENT SUMMARY ACCOUNTS (% GDP)
Source: MoFPS
2013/14 2014/15 2015/16 2016/17 2017/18 2018/19 2019/20
Revenue & Grants 27.1% 26.3% 27.9% 28.1% 27.6% 27.2% 27.2%
Tax Revenue 23.5% 23.7% 25.2% 25.8% 26.1% 25.6% 25.7%
Non-Tax Revenue 2.8% 2.2% 2.2% 1.8% 1.1% 1.1% 1.1%
Bauxite Levy 0.1% 0.0% 0.1% 0.2% 0.2% 0.2% 0.2%
Capital Revenue 0.0% 0.1% 0.0% 0.0% 0.0% 0.0% 0.0%
Grants 0.7% 0.3% 0.3% 0.3% 0.2% 0.2% 0.2%
Expenditure 27.0% 26.8% 28.2% 29.1% 27.5% 26.1% 25.4%
Recurrent Expenditure 24.5% 25.3% 26.2% 26.6% 25.0% 23.4% 22.4%
Programmes 6.3% 7.2% 8.2% 8.1% 7.9% 7.6% 7.6%
Compensation 10.5% 10.2% 9.9% 9.6%
Wages and Salaries 10.7% 10.2% 10.3% 9.9% 9.6% 9.3% 9.0%
Employers' Contribution 0.6% 0.6% 0.6% 0.6%
Interest 7.5% 8.0% 7.7% 8.0% 6.9% 5.9% 5.2%
Domestic 4.7% 4.9% 4.4% 3.8% 3.3% 2.8% 2.4%
External 2.8% 3.1% 3.3% 4.3% 3.6% 3.1% 2.9%
Capital Expenditure 2.5% 1.5% 2.0% 2.5% 2.5% 2.7% 3.0%
Fiscal Balance (Surp+/Def-) 0.1% -0.5% -0.3% -1.0% 0.1% 1.1% 1.8%
Loan Receipts 6.4% 10.8% 18.3% 5.2% 11.4% 5.9% 6.0%
Domestic 2.7% 2.5% 1.8% 2.4% 3.7% 2.5% 1.3%
External 3.7% 8.3% 16.5% 2.7% 7.7% 3.3% 4.8%
Divestment/Other 0.0% 0.0% 0.4% 0.8% 0.8% 0.8% 0.8%
Amortization 7.3% 5.6% 21.0% 4.5% 12.3% 7.8% 8.6%
Domestic 5.2% 1.9% 4.8% 1.6% 5.3% 3.7% 4.6%
External 2.1% 3.7% 16.2% 2.9% 7.0% 4.0% 3.9%
Overall Balance (Surp+/Def-) -0.8% 4.7% -2.6% 0.5% 0.0% 0.0% 0.0%
Primary Balance(Surp+/Def-) 7.6% 7.5% 7.4% 7.0% 7.0% 7.0% 7.0%
GDP 1,462,800.0 1,563,900.0 1,631,400.0 1,726,400.0 1,870,528.5 2,025,239.6 2,184,332.1

67
Source: MoFPS
TABLE 3J: CENTRAL GOVERNMENT SUMMARY ACCOUNTS (J$mn)
2013/14 2014/15 2015/16 2016/17 2017/18 2018/19 2019/20
Revenue & Grants 396,979.3 411,716.0 455,835.8 484,763.0 517,184.7 550,624.0 594,728.3
Tax Revenue 343,836.1 370,877.5 411,854.0 445,488.9 487,515.3 519,023.6 561,456.6
Non-Tax Revenue 41,047.1 34,311.5 35,748.6 30,537.2 21,323.9 22,698.9 23,934.1
Bauxite Levy 1,009.5 0.0 2,116.9 2,818.2 3,032.4 3,276.6 3,567.7
Capital Revenue 658.1 1,509.2 652.7 669.8 687.9 706.5 724.9
Grants 10,428.5 5,017.8 5,463.6 5,248.9 4,625.2 4,918.4 5,045.0
Expenditure 395,241.7 418,986.8 460,719.5 502,373.8 515,022.2 527,880.2 555,591.5
Recurrent Expenditure 358,252.9 395,967.8 427,972.2 459,373.0 467,632.4 473,643.3 490,701.2
Programmes 91,971.7 112,696.6 133,505.2 139,772.4 148,279.4 154,484.8 166,653.2
Compensation 181,141.9 190,740.7 199,920.2 209,851.2
Wages and Salaries 156,361.7 158,758.6 168,787.4 170,193.5 179,415.3 188,227.5 197,761.2
Employers' Contribution 10,948.4 11,325.4 11,692.7 12,090.0
Interest 109,919.5 124,512.6 125,679.6 138,458.7 128,612.3 119,238.3 114,196.8
Domestic 68,728.9 76,052.1 71,391.3 64,779.7 61,091.5 55,907.3 51,708.3
External 41,190.6 48,460.5 54,288.3 73,679.0 67,520.8 63,331.0 62,488.5
Capital Expenditure 36,988.8 23,019.0 32,747.3 43,000.8 47,389.8 54,236.9 64,890.3
Fiscal Balance (Surp+/Def-) 1,737.6 -7,270.8 -4,883.7 -17,610.8 2,162.5 22,743.8 39,136.8
Loan Receipts 93,527.5 168,705.9 298,600.5 89,384.4 213,315.8 118,827.5 131,606.4
Domestic 40,119.9 39,247.9 29,004.3 41,921.7 68,962.1 51,134.4 27,316.5
External 53,407.6 129,458.0 269,596.2 47,462.7 144,353.7 67,693.1 104,289.9
Divestment/Other 6,071.2 14,539.2 15,253.6 16,090.8 16,960.4
Amortization 106,640.2 87,794.4 342,726.0 77,560.1 230,731.7 157,662.1 187,703.6
Domestic 76,604.4 29,752.5 77,718.9 26,811.6 99,501.0 75,670.1 101,500.1
External 30,035.8 58,041.9 265,007.1 50,748.5 131,230.7 81,992.0 86,203.5
Overall Balance (Surp+/Def-) -11,375.1 73,640.7 -42,938.0 8,752.7 0.2 0.0 0.0
Primary Balance(Surp+/Def-) 111,657.1 117,241.8 120,795.9 120,847.9 130,774.8 141,982.1 153,333.6
68
The FY 2016/17 Budget will be tabled on April 14, 2016 and the GOJ has settled with
bargaining units representing 97% of public sector workers, with the payment of new salary and
allowances having commenced for most groups during FY 2015/16. However, there are a few
groups that are yet to settle and the GOJ will finalize agreements with the remaining groups as
soon as is practicable. Estimated amounts relating to FY 2015/16 for these groups have been
programmed in the FY 2016/17 Budget.
The fiscal profile shows a Wage/GDP ratio of 9.9%% of GDP for FY 2016/17, which falls
gradually to 9.0% of GDP by March 2020. The GOJ is in the process of developing a wage
policy that will guide the negotiation process going forward. The GOJ will also seek to
implement critical aspects of the public sector transformation initiative as part of the strategy to
reduce the cost of operating government, including the wage bill.
With another challenging fiscal year ahead, the MDAs will be required to be more prudent and
efficient in their operations. To support these efforts, the GOJ in determining the Capital budget
as presented in the PSIP (Appendix VI), was much more strategic in allocating budgetary
resources to facilitate effective implementation of investment projects
Expenditure
Non-Debt Expenditure
The Non-Debt Expenditure for FY 2016/17 is projected at $363,915.1mn, comprising Recurrent
Expenditure of $320,914.3mn and Capital of $43,000.8mn. Of the Recurrent provision,
Compensation is projected at $181,141.9mn, with the Wages and Salaries component at
$170,193.5mn and the remainder for the GOJ’s contribution toward statutory deductions and
health insurance for employees. The provision for Recurrent Programmes is $139,772.4mn.
Protected Social Spending
Social programmes for protected groups will continue to receive priority with respect to the
allocation of resources in order to ensure that overall spending in these areas is not eroded by
inflation. Included are programmes for youth employment, drugs and medical supplies for the
public health system, poor relief, children homes and places of safety, school feeding and the
PATH programme targeting the elderly, pregnant and lactating women and children attending
school. For FY 2016/17, the provision to support social spending is approximately $28,500.0mn.

69
Compensation (Wages & Salaries and Employer’s Contribution)
The Central Government’s Compensation Bill for FY 2016/17 of $181,141.9mn accounts for
approximately 50% of the total FY 2016/17 Non- Debt budget and just about 56% of total Non-
Debt Recurrent Expenditure.
The $181,141.9mn allocated for Compensation, includes a provision of $4,800.0mn, representing
GOJ’s (employer’s) contribution to Public Sector Health Schemes (20% is contributed by
employees). This expenditure was previously classified as payment for insurance services under
Recurrent Programmes and not as Compensation of Employees. With the GOJ moving towards
compliance with international public financial management standards by adopting a Revised
Chart of Accounts, this expenditure, which is deemed a benefit which the government pays for
its employees in lieu of remuneration, is now classified under Compensation of Employees as
Employer’s Contribution.
The Compensation provision also includes amounts for back-pay primarily to Correctional
Officers, Fire-fighters and Health Sector workers as well as salary increases due to public sector
groups which did not conclude their negotiations in FY 2015/16. In addition, provision is also
made for the payment of arrears to cover outstanding wage agreements settled prior to
FY 2015/16, to Medical Consultants, Veterinarian Consultants, School Bursars and Education
Officers.
Recurrent Programmes
Compared with the FY 2015/16 provisional outturn, the allocation for Recurrent Programmes
represents an increase of 4.7%, which is marginally below the expected inflation rate for
FY 2016/17. This real decline reflects the GOJ’s resolve to contain expenditure, as part of the
fiscal consolidation efforts to reduce the debt burden and facilitate faster economic growth.
Included in this provision are amounts to meet pension payments and travel expenses for public
sector employees, of $28,148.0mn and $14,068.0mn, respectively.
The provision for pensions includes an increase of $1,500.0mn to meet the annual increase
granted to existing pensioners and accommodate payments to new pensioners.
Approximately $2,000.0mn has been provided to meet the second year of the new rates for travel
and related allowances and arrears of $800mn covering the period August 2015 to October 2015.
Implementation of the new rates began in November 2015 and the retroactive amount is
programmed for payment in April 2016. Also included in Recurrent Programmes is an amount
allocated under MOFP’s Contingency to cover an estimated $2,500.0mn that has been provided
to meet the payment of General Consumption Taxes on goods and services purchased by MDAs
as well as $550mn set aside for weather-related risk mitigation.

70
The creation of this contingency for weather related risks is a statutory requirement under the
Financial Administration and Audit (Amendment) Act 2014, Third Schedule, Section 4. The
amount will be transferred to the Contingencies Fund held by the Accountant General as required
under the law.
Non-Debt Capital Expenditure
Capital Expenditure is budgeted at $43,000.8mn, an increase of $10,253.5mn, or 31.3% over the
amount spent during FY 2015/16. This level of spending represents 2.5% of GDP, up from 2.0%
of GDP the previous year, and was facilitated by the creation of room for spending on growth-
inducing capital projects through the reduction in the Primary Balance target.
Capital A
A total of $13,294.0mn has been allocated to projects being implemented under the Capital A
Heads of Estimates and $29,931.0mn to projects which are funded with support from
multilateral/bilateral agencies. The largest share of the capital budget, $11,229.0mn, has been
allocated to the new Ministry of Economic Growth and Job Creation with the Major
Infrastructure Development Project (MIDP) receiving just under $7,000mn.
Debt Servicing Total provision for Debt Service is $216,018.7mn, or 37.2% of the budget, compared to 41.9% in FY 2014/15 (Debt Service spiked in FY 2015/16 to 58.3% of budget due to the Petrocaribe liability management exercise). Interest payments are budgeted to increase by 8.0% over the outturn for FY 2015/16 to $138,458.7mn (8.0% of GDP). Domestic Interest costs are budgeted to fall 9.3% to $64,779.71mn, while External Interest costs are budgeted to rise by 35.7% to $73,678.9. The significant rise in budgeted External Interest costs is due largely to the US$ 2,000mn global bonds raised on the ICM in July 2015. The lower Domestic Interest payments are due mainly to the reduction in the domestic debt stock arising from the extinguishing of debt owed by the Central Government to the PCDF, which was facilitated by the PetroCaribe liability management exercise and the maturity of a NDX instrument in February 2016. Accordingly, Domestic Interest costs are budgeted to fall from 4.4% of GDP in FY 2015/16 to 3.8% of GDP in FY 2016/17. Despite the increase in External Interest costs in FY 2016/17, by 1.0 percentage point of GDP, compared to the outturn for FY 2015/16, this ratio is projected to gradually decline to 2.9% of GDP by FY 2019/20.

71
Revenue and Grants
Revenue and Grants for FY 2016/17 are forecast at $484,763.1mn, or 28.1% of GDP, compared
to the provisional outturn of 27.9% of GDP for FY 2015/16. The forecast for FY 2016/17
represents a 6.3% increase over FY 2015/16, which is slightly below the average annual increase
of 7.0% over the last 5 years.
Tax Revenue is budgeted at $445,488.9mn (25.8% of GDP) and is expected to account for
91.9% of total Revenue and Grants, compared to 90.4% for FY 2015/16. This forecast for Tax
Revenue represents an increase of 8.2% ($33,634.9mn) over collections in FY 2015/16 (Table
3K). Tax receipts in FY 2015/16 increased by 11.0% over the previous year. The budgeted
increase in Tax Revenue is predicated on, inter alia, a projected 5.8% growth in nominal income
in FY 2016/17, movements in other economic variables, as well as enhanced compliance
activities by TAJ and JCA.
Table 3K: FY 2016/17 Revenue Forecast
2015/16 2016/17 % Change
Revenue & Grants 455,835.8 484,763.1 6.3
Tax Revenue 411,854.0 445,488.9 8.2
Non-tax Revenue 35,748.6 30,537.2 -14.6
Bauxite Levy 2,116.9 2,818.2 33.1
Capital Revenue:
652.7
669.8
2.6
Grants 5,463.6 5,248.9 -3.9
Source: MoFP
A number of factors will contribute to the lower tax revenue growth in FY 2016/17, compared to
the growth in the previous fiscal year, most notably:
72
1. increase in the personal income tax threshold effective January 1, 2016 which will reflect the full year impact in FY 2016/17;
2. lower interest cost which is expected to reduce the baseline interest income to the GOJ; 3. lower average price of oil, with an attendant expected reduction in the advalorem portion
of the SCT; 4. the structure of some of the tax types, including a significant portion of the SCT, are
fixed rates (not advalorem) and accordingly will not grow in line with nominal GDP, with the result that these taxes will show a declining ratio in proportion to GDP.
Non-tax Revenue for FY 2016/17 is projected at $30,537.2mn, a reduction of 14.6% from the
provisional outturn for FY 2015/16. This forecast amounts to 1.8% of GDP, down from the
estimated 2.1% of GDP in FY 2015/16. The projected decline is primarily due to two factors, as
follows:
• having become a full-fledged executive agency on April 1, 2015, the JCA will retain a larger portion of the CAF to cover its operating expenses, resulting in a reduction in net flows to the Consolidated Fund; and
• a reduction in expected distribution/dividends from Self-Financing Public Bodies and Executive Agencies.
The projected Non-tax Revenue for FY 2016/17 includes:
• The programmed transfer of $11,400.0mn from the NHT to the Consolidated Fund;
• $5,607.1mn from the CAF;
• Expected receipts for telecommunications licences of $866.9mn ; and
• Dividend distribution from public bodies of $3,089.7mn.
Bauxite Levy transfers from the Capital Development Fund to the Consolidated Fund for
FY 2016/17 are programmed at $2,818.2mn. The expiration of the Interim Fiscal Regime on
December 31, 2014 has allowed for the full levy payment. The forecast of $2,818.2mn also
accounts for US$6.0mn to clear the GOJ’s (Clarendon Alumina Productions) obligations to
WINDALCO and represents the balance of Bauxite Levy flows after covering the obligations to
WINDALCO, as well as budgetary support for the Jamaica Bauxite Institute (JBI).
Capital Revenue is budgeted at $669.8mn, which is just about in line with receipts in
FY 2015/16, while Grants are forecast at $5,248.9.0mn, a marginal decline of 3.9% below
receipts in FY 2015/16. Budget support flows from the European Union (EU) are budgeted to
amount to Euro7mn and represents a 62.0 % decrease relative to receipts in FY 2015/16.

73
Financing
The borrowing requirement of the Central Government for FY 2016/17 amounts to $89,384.4mn, which will cover the Fiscal Deficit of $17,610.7mn, Amortization Payments of $77,560.1mn and provide some pre-funding for obligations in the next fiscal year. Of the budgeted Loan Receipts, $41,921.7mn is programmed to be raised domestically and $47,462.7mn is to be raised externally, inclusive of policy based/development policy loans from international financial institutions and project/investment loans of $17,579.4mn. This borrowing requirement represents a 70.1% reduction in total Loan Receipts when compared to FY 2015/16. The reduction in borrowing (y.o.y) reflects significantly lower Amortization costs.
PUBLIC DEBT TRAJECTORY
The public debt stock as a percent of GDP is projected to continue its trend decline over the
medium term from the estimated 126.7% of GDP at the end of FY 2015/16. The continued
reduction in the public debt stock as a percent of GDP over the medium term is a necessary
condition, towards creating the increased fiscal space needed to facilitate public investment in
human and physical capital to solidify long term growth and development of the economy.
The fiscal consolidation effort has resulted in consistent declines in the Central Government
deficit, falling from 11.1% of GDP in FY 2009/10 to a surplus of 0.1% of GDP at the end of
FY 2013/14 and a relatively small deficit of 0.3% of GDP for FY 2015/16. For FY 2016/17, the
deficit is budgeted at 1.0% of GDP, consequent on higher Capital Expenditure and External
Interest costs. However, prudent expenditure management over the medium term will realign
expenditure more closely to the revenue resources, thus generating a small Fiscal Surplus in
FY 2017/18 and incremental surpluses thereafter.
Additionally, the management of contingent liabilities and the ceilings on guarantees set in the
Public Debt Management Act 2012 will be critical to reducing the public debt burden over the
medium term. The stock of publicly-guaranteed debt is projected to decline from 11.5% of GDP
at the end of March 2015 to 10.4% of GDP by the end of FY 2016/17.
FY 2016/17 BUDGET – SELF -FINANCING PUBLIC BODIES
The Overall Balance of the group of Self-financing Public Bodies is projected at a surplus of
$3,309.6mn for FY 2016/17. The Current Balance surplus of $61,051.2mn is almost flat with the
estimated outturn for FY 2015/16, as the marginal increase of $10,958.7mn or 2.9% in revenue
just covers the growth in current expenditure.

74
Net flows from Public Bodies to GOJ are projected at $35,311.0mn, resulting from $50,476.9mn
Transfers to GOJ and Transfers from GOJ of $15,165.9mn (including $400mn of equity
financing to EXIM Bank). The flows from Public Bodies to GOJ include SCT from Petrojam,
corporate taxes, grants to support special programmes as well as financial distributions
(dividends). Public Bodies benefitting from GOJ transfers include NROCC and RMF - loan
repayments, Students Loan Bureau (SLB) – support from Education Tax and JUTC for which the
amount represents the cost of buses, spare parts and fare subsidy.
Total capital expenditure/investment is forecast at $58,867.2mn, a 21.5% increase over the
estimated $48,442.8mn for FY 2015/16. Three public bodies, namely the NHT ($23,606.0mn),
NWC ($8,726.0mn) and PAJ ($10,030.0mn) account for 72% of the planned expenditure.
The group’s Overall Balance is forecast to decline by $24,224.5mn compared with
FY 2015/16. Two Public Bodies account for 80% of this amount, namely: PAJ - $10,613.0mn
and Petrojam - $8,889.0mn. PAJ’s decline is attributed mainly to increased capital expenditure,
while Petrojam’s position is influenced to a large extent by the expected change in inventories.
The Table below outlines the financial forecast of the group of Public Bodies for FY 2016/17.
The group is expected to return positive Overall Balances for the medium-term.
The Public Bodies have played a pivotal role in the development of the physical and social
infrastructure of the country by the capital and investment programmes they undertake.
highlighted below are summaries of the projected outlay of the NHT, PAJ and NWC.
National Housing Trust (NHT) The forecast is for housing expenditure of $22,761.0mn activities by March 31, 2017. The
planned level of expenditure will result in the disbursement of loans of $15,621.0mn under
different programmes, including Build-on Own Land, open market, construction, joint mortgage
finance and house lot loans.
PAJ
Given that the Kingston Container Terminal will begin operations under a PPP arrangement in
2016, PAJ will focus on developing and leveraging its core competencies and infrastructure
assets in its key business segments. This will result in substantial capital investments in Cargo,

75
Cruise, Business Process Outsourcing, Logistics, and Harbours & Port Services. The capital
expenditure programme is predicated on a forecast of moderate growth in key markets, within
the context of an expected recovery in the global economy over the planning cycle.
The reinforcement of the KCT Quay wall, construction of two new BPO facilities in Montego
Bay and Portmore, and planned developments at Reynold’s Pier and Montego Bay Cruise and
Cargo are expected to account for 78% of the budgeted capital expenditure of $10,030.0mn. Of
note, capital revenue of $9,412.9mn is anticipated from the divestment of KCT’s assets.
NWC
Measures that will be pursued to improve the Commission’s overall operational efficiency
include the development and implementation of a detailed meter replacement programme,
increased monthly meter reading, as well as a reduction in bill delivery cost. The NWC will
undertake capital projects valued at $8,726.0mn for the financial year. This includes $3,184.6mn
for the KMA Water Supply Improvement project, as well as $951.9mn for K-Factor water and
sewerage projects. An additional $702.1mn is earmarked for the Caribbean Regional Fund for
Wastewater Management project.

76
Public Bodies Summary of Financial Forecasts
(Selected)J$m
Actual Original Estimated Projected
2014/15 2015/16 2015/16 2016/17
Statement 'A' Flow of Funds
1 Current Revenue 423,781.15 409,162.05 375,219.12 386,177.85
2 Current Expenses (367,436.12) (350,947.75) (314,683.26) (325,126.63)
3 Current Balance 56,345.02 58,214.30 60,535.87 61,051.22
4 Adjustments 7,274.26 15,014.99 22,208.43 16,474.83
Change in Accounts 0.00 0.00 0.00 0.00
Receivable/Payable (17,808.18) (8,561.25) (1,867.55) (4,960.23)
Items not requiring outlay of cash: 0.00 0.00 0.00 0.00
Depreciation 14,725.62 16,059.59 14,520.99 17,266.50
Other Non-Cash Items 10,356.82 7,516.65 9,588.70 4,168.57
Prior Year Adjustment 0.00 0.00 (33.72) 0.00
5 Operating Balance 63,619.29 73,229.29 82,744.29 77,526.06
6 Capital Account (23,822.51) (45,804.58) (24,797.61) (38,505.44)
Revenue 14,809.21 15,951.88 17,787.41 17,701.90
Expenditure (45,243.79) (58,610.98) (47,518.27) (57,170.54)
Investment (827.59) (1,981.20) (924.50) (1,696.61)
Change in Inventory 7,439.66 (1,164.28) 5,857.75 2,659.81
7 Transfers from Government 19,300.50 20,565.27 14,614.17 14,765.90
Loans 0.00 0.00 0.00 3.00
Equity 0.00 0.00 0.00 0.00
On-Lending 0.00 0.00 0.00 0.00
Other 19,300.50 20,565.27 14,614.17 14,762.90
8 Transfers to Government (44,452.29) (40,114.64) (45,026.78) (50,476.94)
Dividend (1,574.13) (1,247.32) (2,955.23) (3,089.68)
Loan Repayments 0.00 0.00 0.00 0.00
Corporate Taxes (1,265.88) (1,636.53) (2,466.21) (1,617.51)
Other (41,612.28) (37,230.78) (39,605.34) (45,769.76)
9 OVERALL BALANCE (5+6+7+8) 14,644.98 7,875.34 27,534.08 3,309.57
10 FINANCING (11+15) (14,644.99) (7,875.34) (27,534.08) (3,309.57)
10a Total 19,417.42 4,761.89 (208,064.16) (18,163.84)
Capital Revenue (2,649.22) 4,459.66 (4,898.26) (9,012.34)
Loans 3,178.16 (297.77) 3,564.23 3,722.12
Equity (5,827.38) 600.00 (8,462.49) (12,734.46)
On-Lending 22,653.60 0.00 (203,123.59) (9,110.71)
Loan Repayments 20,732.44 0.00 (197,757.65) (11,146.68)
11 Total Foreign (12+13+14) (10,681.46) 65,966.05 (349,488.42) (16,742.68)
12 Government Guaranteed Loans 1,921.17 (4,108.42) (5,410.80) 2,035.97
Disbursement 1,694.78 5,753.34 (5,365.94) 2,035.97
Amortization (360.58) (9,861.76) (42.31) (40.79)
13 Direct Loans (35,868.30) 70,116.77 181,008.23 2,540.08
Long Term: 11,542.54 58,317.35 18,481.79 12,935.11
Disbursement 636.65 73,174.55 570.25 8,381.34
Amortisation 87.34 (14,857.20) 122.02 16.01
Short Term: 10,818.55 11,799.42 17,789.52 4,537.76
Change in Trade Credits(1,166.55) 11,799.42 (1,137.72) (4,141.01)
14 Change in Deposits Abroad (46,244.28) (42.30) 163,664.17 (6,254.02)
15 Total Domestic (16+17+18) 2,807.17 (78,603.28) (5,892.01) 1,963.72
16 Banking System 1,923.53 (7,039.41) 1,380.21 8,476.95
Loans (Change) 684.91 (116.92) 606.75 8,426.98
Overdraft (Change) 78.04 16.14 134.24 5.81
Deposits (Change) 1,160.58 (6,938.63) 639.22 44.16
17 Non-Banks (Change) 230.90 (1,929.74) (2,424.54) (4,799.05)
18 Other (Change) 652.74 (69,634.13) (4,847.69) (1,714.18)

77
Appendix I
Medium Term Expenditure Profile 2014/2015 – 2019/2020 Table 1A - Non Debt Recurrent Expenditure
Provisional
Expenditure
2014-2015
Revised
Estimates 2015-
2016
Estimates of
Expemditure
2016-2017
Projected
2017-2018
Projected
2018-2019
Projected
2019-2020
His Excellency the Governor-General and Staff 183,358 190,656 181,887 191,891 201,485 211,560
Houses of Parliament 780,088 820,722 827,023 872,509 916,135 961,941
Office of the Public Defender 86,964 86,831 91,767 96,814 101,655 106,738
Office of the Contractor-General 240,422 246,654 278,184 293,484 308,158 323,566
Auditor General 467,020 529,748 545,112 575,093 603,848 634,040
Office of the Services Commissions 185,007 185,328 195,744 206,510 216,835 227,677
Office of the Children's Advocate 120,538 134,885 140,043 147,745 155,133 162,889
Independent Commission of Investigations 338,407 349,267 350,455 369,730 388,217 407,627
Office of the Prime Minister 3,015,355 3,972,590 3,982,819 4,201,874 4,411,968 4,632,566
Office of the Cabinet 503,837 524,203 425,723 449,138 471,595 495,174
Ministry of Tourism 1,586,358 1,821,639 1,731,265 1,826,485 1,917,809 2,013,699
Ministry of Economic Growth and Job Creation - 2,924,482 8,355,972 8,815,550 9,256,328 9,719,144
Ministry of Finance and the Public Service 47,796,605 50,903,718 66,908,679 70,588,656 72,353,372 75,971,041
(formerly Ministry of Finance and Planning) - - -
Ministry of National Security 50,008,592 54,380,651 55,675,358 58,737,503 62,674,378 65,808,097
Ministry of Justice 5,140,785 6,138,923 5,963,978 6,291,997 6,606,597 7,536,926
Ministry of Foreign Affairs and Foreign Trade 3,019,596 4,035,672 3,939,584 4,156,261 4,364,074 4,582,278
Ministry of Labour and Social Security 2,462,503 2,604,952 2,543,257 2,683,136 2,817,293 2,958,158
Ministry of Education, Youth and Information
(formerly Ministry of Education)83,738,654 87,489,618 90,500,104 95,477,610 100,251,490 106,264,065
Ministry of Health 41,664,333 53,028,076 52,900,678 56,435,004 58,456,449 62,379,271
Ministry of Youth and Culture 2,024,055 1,987,229 - - -
Ministry of Culture, Gender, Entertainment and Sport - 281,722 2,361,637 2,491,527 2,616,103 3,746,909
Ministry of Industry, Commerce, Agriculture and
Fisheries- 320,168 5,345,695 5,639,708 5,921,694 6,959,778
Ministry of Agriculture and Fisheries 3,981,051 4,377,685 - - -
Ministry of Industry, Investment and Commerce 1,917,989 1,899,129 - - -
Ministry of Science, Energy and Technology (formerly
Ministry of Science, Technology, Energy and Mining)4,872,089 7,342,146 4,706,214 4,965,056 5,213,309 5,473,974
Ministry of Transport, Works and Housing 6,639,912 4,133,628 - - -
Ministry of Water, Land, Environment and Climate
Change1,164,419 1,240,423 - - -
Ministry of Transport and Mining - 181,163 2,340,671 2,469,408 2,592,878 2,722,522
Ministry of Local Government and Community
Development9,907,369 10,853,016 10,492,874 11,069,982 11,623,481 12,204,655
Forestry Department 492,281 - - - - -
National Land Agency 413,885 - - - - -
National Environment and Planning Agency 699,160 - - - - -
National Works Agency 541,556 - - - - -
- -
TOTAL RECURRENT 273,992,188 302,984,924 320,784,723 339,052,672 354,440,283 376,504,297

78
Medium Term Expenditure Profile 2014/2015 – 2019/2020
Table 1B - Medium Term Capital Profile
Heads
Provisional
Expenditure
2014-2015
Revised
Estimates 2015-
2016
Estimates of
Expemditure
2016-2017
Projected
2017-2018
Projected
2018-2019
Projected
2019-2020
Office of the Prime Minister2,060,608 2,294,767 2,105,735 2,673,137 3,410,157 3,407,500
Office of the Cabinet193,163 293,557 733,272 724,373 802,674 755,000
Ministry of Tourism and Entertainment24,392 17,758 17,000 - - -
Ministry of Economic Growth and Job Creation- 2,543,669 11,230,188 21,522,908 30,914,258 40,059,020
Ministry of Finance and the Public Service (formerly
Ministry of Finance and Planning)1,464,481 4,006,381 7,080,412 5,305,471 2,137,000 2,242,742
Ministry of National Security2,447,432 2,404,924 3,565,200 3,478,248 2,602,770 2,788,316
Ministry of Justice590,010 644,313 899,412 1,257,197 1,328,427 1,310,879
Ministry of Foreign Affairs10,000 226,463 -
Ministry of Labour and Social Security5,516,433 5,705,636 6,225,744 6,853,551 7,032,426 7,339,004
Ministry of Education, Youth and Information
(formerly Ministry of Education)1,943,814 2,313,483 2,633,542 2,528,330 1,560,350 1,990,000
Ministry of Health906,243 1,168,653 1,547,992 2,092,852 2,101,113 1,452,654
Ministry of Youth and Culture173,678 91,949 - - -
Ministry of Culture, Gender, Entertainment and Sport- - 188,516 - - -
Ministry of Agriculture and Fisheries1,795,752 - - - - -
Ministry of Industry, Commerce, Agriculture and
Fisheries- 3,858,059 3,594,788 485,294 2,150,000 2,175,000
Ministry of Industry Investment and Commerce3,800 529,191 - - - -
Ministry of Science, Energy and Technology (formerly
Ministry of Science, Technology, Energy and Mining)- 1,123,320 988,467 436,724 147,500 1,250,185
Ministry of Transport, Works and Housing10,096,349 6,702,728 - - - -
Ministry of Water Land Environment and Climate
Change 200,703 145,049 - - - -
Ministry of Transport and Mining- 581 1,310,451 - - -
Ministry of Local Government and Community
Development154,153 473,807 880,081 31,715 50,225 120,000
TOTAL CAPITAL 40,975,451 34,544,288 43,000,800 47,389,800 54,236,900 64,890,300

79
Medium Term Expenditure Profile 2014/2015 – 2019/2020 Table 1C- Economic Classification Non- Debt Recurrent Expenditure 2014/2015 - 2019/2020
Provisional
Expenditure
2014-2015
Revised
Estimates 2015-
2016
Estimates of
Expemditure
2016-2017
Projected
2017-2018
Projected
2018-2019
Projected
2019-2020
Compensation of Employees 158,758,600 168,787,400 181,141,900 190,740,700 199,920,200 209,851,200
Programmes: 112,696,600 134,197,524 139,772,400 148,279,400 154,484,800 166,653,200
Travel Expenses and Subsistence 11,489,361 13,640,750 14,068,006 14,841,746 15,583,834 16,363,025
Rental of Property and Machinery 3,211,795 3,862,027 3,626,975 3,826,459 4,017,782 4,218,671
Utilities and Communication Services 8,622,732 9,028,372 8,711,672 9,190,814 9,650,355 10,132,872
Use of Goods and Services 24,680,937 38,835,309 28,335,309 29,893,751 30,188,439 33,527,860
Grants, Contributions & Subsidies 31,252,271 31,485,897 43,892,820 46,306,925 48,622,271 51,053,385
Retirement Benefits 26,048,504 28,037,920 29,437,289 31,056,340 32,609,157 34,239,615
Awards and Social Assistance 6,956,504 7,026,194 8,985,658 9,479,869 10,553,863 11,081,556
Capital Goods 434,496 2,073,232 1,413,853 1,491,615 1,566,196 3,444,505
Other 207,823 1,300,818 2,191,881 1,692,905 2,591,710
TOTAL RECURRENT 271,455,200 302,984,924 320,914,300 339,020,100 354,405,000 376,504,400

80
TOTAL RECURRENT AND CAPITAL $’000
Actual Estimates 2014-2015
Approved Estimates 2015-2016
Revised Estimates 2015-2016
Estimates 2016-2017
1 General Public Services 1 Executive and Legislative Services 2,121,126.0 2,209,340.0 2,258,488.0 2,438,357.0 2 Economic and Fiscal Policies Management 15,418,412.0 18,087,537.0 20,749,455.0 25,005,982.0 3 Personnel Management 4,454,276.0 5,620,701.0 4,968,483.0 6,165,377.0 4 Foreign Affairs 3,186,249.0 4,063,426.0 4,354,957.0 4,694,185.0 5 Economic Planning and Statistical Services 1,604,510.0 2,098,022.0 2,560,497.0 2,925,682.0 6 Public Works 918,518.0 810,928.0 810,994.0 1,628,653.0 7 Public Debt Management Services, Internal Debt 108,910,762.0 158,677,686.0 148,763,865.0 91,591,297.0 8 Public Debt Management Services, External Debt 125,571,688.0 151,516,318.0 322,049,827.0 124,427,483.0
99 Other General Public Services 34,231,438.0 38,641,580.0 39,203,034.0 40,544,028.0
Total General Public Services 296,416,979.0 381,725,538.0 545,719,600.0 299,421,044.0
2 Defence Affairs and Services 1 Military Defence 13,589,534.0 14,041,209.0 14,774,545.0 14,644,305.0
Total Defence Affairs and Services 13,589,534.0 14,041,209.0 14,774,545.0 14,644,305.0
3 Public Order and Safety 1 Police Services 35,615,160.0 35,537,635.0 39,065,755.0 40,105,002.0 3 Law Courts 6,021,673.0 7,082,986.0 7,086,927.0 7,238,638.0 4 Correctional Services 5,498,861.0 5,379,224.0 6,626,675.0 7,540,399.0
Total Public Order and Safety 47,135,694.0 47,999,845.0 52,779,357.0 54,884,039.0
4 Economic Affairs 1 Industry and Commerce 2,253,128.0 2,362,815.0 2,691,658.0 4,579,454.0 2 Labour Relations and Employment Services 1,237,730.0 1,256,711.0 1,310,775.0 1,318,703.0 3 Agriculture, Forestry and Fishing 9,701,037.0 10,542,277.0 12,244,452.0 11,670,328.0 4 Fuel and Energy 1,039,488.0 1,318,119.0 2,001,055.0 1,330,901.0 5 Mining, Manufacturing and Construction 178,904.0 183,171.0 187,031.0 177,894.0 6 Road Construction and Repairs 8,781,400.0 6,084,309.0 7,275,266.0 10,467,789.0 7 Road Transport 7,293,374.0 4,198,348.0 4,750,292.0 2,517,100.0 8 Rail Transport 185,835.0 178,835.0 178,835.0 178,835.0 9 Shipping, Ports and Lighthouses 926,966.0 1,060,421.0 1,088,804.0 1,287,838.0
11 Postal Services 2,044,947.0 2,190,363.0 2,425,921.0 2,342,408.0 12 Telecommunication Services 1,656,275.0 1,031,938.0 1,051,101.0 802,515.0 13 Tourism 4,098,947.0 4,415,846.0 4,608,167.0 5,326,740.0 14 Physical Planning and Development 547,096.0 559,114.0 581,881.0 508,791.0 15 Scientific and Technological Services 675,880.0 797,704.0 829,955.0 994,014.0 99 Other Economic Affairs 11,926.0 31,924.0 24,924.0 37,335.0
Total Economic Affairs 40,632,933.0 36,211,895.0 41,250,117.0 43,540,645.0
5 Environmental Protection and Conservation
1 Solid Waste Management 1,025,266.0 845,180.0 1,210,092.0 1,279,114.0 3 Pollution Abatement 24,384.0 19,589.0 20,136.0 16,700.0 4 Protection of Biodiversity and Landscape 1,075,175.0 1,226,525.0 1,187,426.0 1,557,160.0
99 Other Environmental Protection and Conservation - - - 34,500.0
Total Environmental Protection and Conservation
2,124,825.0 2,091,294.0 2,417,654.0 2,887,474.0
6 Housing and Community Amenities 1 Housing Development 2,027,610.0 1,483,915.0 1,649,979.0 540,468.0 2 Community Development 6,984,122.0 6,511,544.0 7,184,351.0 7,344,552.0 3 Water Supply Services 785,085.0 836,111.0 908,188.0 978,565.0
Total Housing and Community Amenities 9,796,817.0 8,831,570.0 9,742,518.0 8,863,585.0
7 Health Affairs and Services 1 Health Administration 6,288,034.0 7,389,642.0 8,022,894.0 7,511,725.0 3 Outpatient Services 49,153.0 89,176.0 92,903.0 93,190.0 4 Hospital Services 4,113,319.0 4,434,888.0 4,861,062.0 5,324,647.0 5 Public Health Services 34,567,441.0 40,980,254.0 43,856,027.0 43,831,425.0
Total Health Affairs and Services 45,017,947.0 52,893,960.0 56,832,886.0 56,760,987.0

81
TOTAL RECURRENT AND CAPITAL $’000
Actual Estimates 2014-2015
Approved Estimates 2015-2016
Revised Estimates 2015-2016
Estimates 2016-2017
8 Recreation, Culture and Religion 1 Recreational and Sporting Services 645,206.0 617,991.0 729,513.0 768,538.0 2 Art and Cultural Services 1,165,839.0 1,282,338.0 1,308,224.0 1,407,531.0 3 Broadcasting and Publishing Services 899,560.0 1,070,801.0 1,039,240.0 980,216.0 4 Religious and Other Community Services 215,000.0 427,500.0 3,623,332.0 500,000.0 5 Youth Development Services 933,018.0 868,518.0 916,636.0 843,355.0
Total Recreation, Culture and Religion 3,858,623.0 4,267,148.0 7,616,945.0 4,499,640.0
9 Education Affairs and Services 1 Education Administration 2,852,179.0 2,485,578.0 2,800,971.0 2,548,811.0 2 Pre-Primary Education 2,712,461.0 2,886,929.0 2,982,083.0 2,981,740.0 3 Primary Education 24,893,195.0 23,992,184.0 25,767,553.0 28,319,078.0 4 Secondary Education 30,952,477.0 29,834,797.0 32,613,021.0 32,039,632.0 5 Tertiary Education 16,564,331.0 17,620,685.0 18,764,289.0 19,123,921.0 6 Education Not Definable by Level 1,392,125.0 1,329,849.0 1,378,549.0 1,513,110.0 7 Subsidiary Services to Education 7,036,935.0 7,041,742.0 7,233,031.0 7,110,457.0
Total Education Affairs and Services 86,403,703.0 85,191,764.0 91,539,497.0 93,636,749.0
10 Social Security and Welfare Services 1 Sickness and Disabled 221,240.0 207,989.0 265,243.0 229,877.0 2 Senior Citizens 397,162.0 397,983.0 435,198.0 440,127.0 3 Survivors Assistance 214,423.0 250,423.0 300,923.0 250,423.0 4 Family and Children 74,778.0 89,126.0 93,957.0 97,071.0
99 Other Social Security and Welfare Services 9,737,895.0 10,152,371.0 10,208,249.0 11,112,043.0
Total Social Security and Welfare Services 10,645,498.0 11,097,892.0 11,303,570.0 12,129,541.0
99 Unallocated Total Unallocated 3,100,000.0 21,335,169.0 - 16,202,424.0
Gross Total 558,722,553.0 665,687,284.0 833,976,689.0 607,470,433.0 Less Appropriations-in-Aid 19,406,806.0 24,119,572.0 25,555,358.0 27,536,576.0 Net Total 539,315,747.0 641,567,712.0 808,421,331.0 579,933,857.0

82
Appendix II
Public Financial Management (PFM) Reform Programme
Introduction
The GOJ remained resolute and committed to the implementation of comprehensive reforms to its public financial management (PFM) system throughout FY 2015/16. The overall objective of the reform programme is to ensure that the PFM system is fulfilling the key goals of:
� Aggregate fiscal discipline;
� Strategic allocation of resources;
� Effective and efficient delivery of services.
There are substantive monitoring and oversight mechanisms in place, namely: (i) the PFM Oversight Committee, which provides strategic direction and (ii) the PFM Secretariat and Monitoring Team which provide administrative support, coordinate donor and technical support as well as monitor and report on the PFM Reform Action Plan (RAP).
Summary of Progress in Key PFM Areas
Significant progress was made in FY 2015/16 to strengthen core PFM functions - accounting and cash/treasury management, budget management, revenue administration and procurement. Some key activities completed were:
I. Continued expansion of the Treasury Single Account (TSA) with the activation and increased utilization of the Central Payroll Payment System (CPPS), thereby allowing for increased central release of salary payments through the treasury management module (TMM).
II. The Reconciliation Module was completed and activated, thus allowing for automatic reconciliation between the Accountant General Department (AGD) and BOJ (TMM/TSA) on one hand and the AGD and MDAs (TMM/FinMan) on the other hand. These reconciliations are particularly important given their positive impact on data integrity and fiscal transparency.
III. Implementation of the Reports Module, which allowed for the expansion of the suite of management and statutory reports which are automatically generated by the CTMS. This is a significant development given the need for timely and accurate information to satisfy statutory requirements as well as to inform the management of the budget within the context of the GOJ medium term economic programme.
IV. Continued strengthening of the budget planning, preparation and execution capacity:

83
(i) A new budget management system was procured and configured and is expected to be utilized during FY 2016/17.
(ii) The Public Investment Management System (PIMS), which was introduced as a key component of the 2014 Fiscal Rules, is now operational:
a. As at end-January 2016, there were three (3) sittings of the Public Investment Management Committee (PIMC), which reviewed projects valued at over $3,000.0mn and also granted approval for the implementation of projects to be funded by loans and grants of approximately US$75.0mn;
b. The PIMS Secretariat has been staffed with the contracting of an Executive Director and the employment of 4 Project Analysts and an Administrative Officer. The Secretariat is housed at the Planning Institute of Jamaica;
c. The Operational Guidelines for the PIMS has been drafted and is to be finalized within the first quarter of the FY 2016/17;
d. The PIMS database is populated with all projects to be undertaken by the Government that are directly funded by central government.
(iii) Medium Term Results Based Budgeting (MTRBB) - The pilot phase of the
MTRBB implementation was completed in the December 2015 quarter. The
consulting firm that was contracted to undertake the assignment has completed its
deliverables and the contract is now fully executed. The main outcomes of this
phase are:
(a) introduction of a ‘forward estimates tool’ and the development of a three (3) year forward estimate for all Ministries, Departments and Agencies that are on the Central Government’s budget;
(b) production of a new Budget Manual to support the implementation of
MTRBB;
(c) three (3) pilot Ministries (formerly called Education, Agriculture & Fisheries,
and Transport, Works and Housing) have rationalized their programmes to be
in alignment with the Strategic Business Processes of the respective MDA and
a template developed for the rationalization of all programmes across all
MDAs;
(d) the build out of Key Performance Indicators (KPIs) for one (1) Programme in
each of the pilot Ministries and development of a template for the build out of
the KPIs for all programmes.
V. Significant progress in Revenue Administration and Taxpayer Service delivery through:
(i) Implementation of new Revenue Administration systems at Jamaica Customs Agency and Tax Administration Jamaica. This has facilitated the automation of a

84
number of business processes and allowed for improved access to services by taxpayers.
(ii) Improvement in organizational development and business processes – TAJ transitioned into a semi-autonomous revenue agency (SARA) with a newly approved structure and subsequent recruitment of staff, which is still ongoing.
VI The procurement process was notably advanced in FY 2015/16 with:
(i) The e-Tendering system that was acquired in May 2014 going live in July 2015. It was piloted for six (6) months up to December 2015. The expectation is that all MDAS will be using the system by end 2017.
(ii) Passage of the Procurement Law in October 2015.
(iii) Training sessions conducted to enhance the capacity for preparing procurement plans. The Ministry of Finance also conducted training in the use of the e-tendering system.
Near Term Implementation Outlook Going forward, the Ministry of Finance and the Public Service will continue to place emphasis on:
� Strengthening of the Cash Management function and the transitioning of the Accountant General’s Department into a modern Treasury;
� Continue the roll-out of the Medium Term Results Based Budgeting;
� Full roll-out and utilization of the Central Payroll Processing System (CPPS);
� Building staff capacity and change management;
� Greater integration of respective financial information systems and business continuity management; and
� On-going efforts to upgrade relevant ICT infrastructure and system interoperability to support an Electronic Single Window (ESW) to facilitate improved international trade.

85
APPENDIX III
Developments in the Financial Sector Introduction During FY 2015/16, the Ministry of Finance and Planning (MOFP) continued to work closely with its stakeholders, including the supervisory authorities, to facilitate reform of the financial sector in keeping with the Government’s commitment to strengthen the regulatory and supervisory framework of the financial sector and build more resilient financial institutions. Significant progress was made in advancing key pieces of legislation including the passage of three major ones. The Financial Investigations Division (FID) continued to actively pursue its mandate of, inter alia, addressing financial crimes, including money laundering, while the Financial Institutions Services (FIS) continued its winding down operations in respect of the Financial Sector Adjustment Company (FINSAC). Highlights of some of the financial sector reforms, as well as some of the major achievements of the FID and the FIS are provided below. Banking Services Act (BSA) The Banking Services Act (BSA), 2014, which consolidated different pieces of legislation that governed deposit taking institutions regulated by the Bank of Jamaica (BOJ), was brought into effect on September 30, 2015 following Parliamentary approval of a suite of Regulations and Rules. Effecting the Banking Services Act required the amendment and re-issue of Regulations and Rules that existed under the Banking and Financial Institutions Acts. The Regulations address, inter alia: opening hours; establishment of branches; licence fees; capital adequacy; amalgamation and transfers; and, licence application rules. Under the BSA, additional Regulations and Rules, including the regime for financial holding companies and consolidated supervision; agency banking; and code of conduct on customer relations for deposit taking institutions, will be developed. Effectiveness of the BSA was a structural benchmark in the Memorandum of Economic and Financial Policies (MEFP) under the Extended Fund Facility (EFF) with the International Monetary Fund (IMF). Bank of Jamaica (Amendment) Act A Bill to amend the Bank of Jamaica (BOJ) Act was tabled in Parliament in July 2015. The Bill was subsequently passed in both Houses of Parliament in October 2015 and became effective on October 30, 2015. The amended Act confers institutional responsibility for the stability of Jamaica’s financial system on the BOJ. Effectiveness of the BOJ (Amendment) Act was a structural benchmark for November 1, 2015. Insurance (Amendment) Act A Bill to amend the Insurance Act was passed in January 2016 and is awaiting royal assent by the Governor General. The amendment to the Insurance Act seeks to harmonize certain provisions with other financial sector legislation and strengthen the legislative framework of the insurance industry.

86
Private Sector Pension Reform Drafting instructions were issued in December 2015 to the Chief Parliamentary Counsel (CPC) to draft legislation to amend the Pensions (Superannuation Funds and Retirement Schemes) Act. The next step in the legislative process is circulation of the first draft of the Bill to key stakeholders for comments. This second phase of private sector pension reform seeks to address issues such as vesting, portability and indexation. Proposed Micro Credit Act The first draft of the Micro Credit Bill was received from the CPC during the first quarter of FY 2015/16. The Bill was circulated to key stakeholders for comments, which were compiled and reviewed during the third fiscal quarter. The next steps include issuing further drafting instructions to the CPC for revision of the draft Bill and subsequent submission of the Bill to the Legislation Committee of Cabinet for consideration. The proposed new Act is intended to provide for the registration and regulation of small privately-owned money lending institutions in an effort to address inherent deficiencies in the industry. The proposed Act also seeks to promote greater transparency, provide for protection of consumers and reduce the risk of the industry being utilized as a vehicle for facilitating money laundering. Financial Institutions Services Limited During FY 2015/16, the FIS continued with the winding up of residual FINSAC activities including the sale of remaining FINSAC properties. The following are some of its key achievements:- � The FIS sold some of the remaining properties under FINSAC’s control, including twenty-one (21) of thirty-one (31) Enchanted Gardens units which netted $18.6mn and Epsom Holdings’ property which netted $47.0mn.
� Five (5) payments totalling US$2.5mn were received in respect of a St. Lucian property owned by International Hotels (St. Lucia) Limited in line with an agreement reached in 2013. The next payment is due in April 2016.
� The audited financial statements for the year ended March 2015 for FIS and FINSAC were completed and submitted to the MOFP in July 2015 and the Annual General Meeting was held on November 6, 2015. � FIS on behalf of FINSAC continued efforts to resolve the following outstanding pension-related matters with Guardian Life Limited (GLL) and the Actuaries (Eckler):-
o Jamaica Mutual Life Staff Superannuation Fund o Eagle Merchant Bank Pension Scheme o Scheme for the Jamaica Mutual Properties Limited

87
� The majority of the judgments awarded in the litigation matters being pursued in the courts by or against FINSAC and its affiliated entities were in favour of FINSAC. They are at various stages of the litigation process and include the following: o In September 2015, FINSAC was successful in selling one (1) of twelve (12) remaining Crawford-owned/related properties addressed under the Privy Council judgment handed down against Donovan Crawford in 2005 in the Century litigation. o In October 2015, FINSAC received its share of the net proceeds from the sale of the Grenada Crescent building (US$0.9mn), which is being held on deposit pending the final decision relating to the appeal by Dr Paul Chen Young of the judgment that was handed down in May 2006 against Dr Chen Young in the Eagle litigation. o Judgment was granted in favour of the Workers Bank in the claim against the Bank for storage fees based on a storage agreement. Financial Investigations Division During FY 2015/16, the FID continued to actively pursue its mandate to reduce the incidence of financial crime in Jamaica, sharing information with its law enforcement counterparts at home and abroad, as well as conducting its own investigatory activities. The following are some of its key achievements: � The FID entered into four (4) information sharing Memoranda of Understanding (MOUs) with regional and international counterparts - The Bahamas, Canada, United Kingdom and Australia. � The FID recorded significant successes in core areas of cash seizure and civil recoveries. In the area of civil recoveries, the FID recorded the largest civil recovery in the Division’s history with the recovery of cash in the amount of US$1.4mn plus other recoverable property. A ruling in this case was handed down by the Supreme Court in February 2012 and was subsequently upheld by the Court of Appeal in December 2015. � The FID was successful in its application to the Resident Magistrate court for forfeiture to the Crown of sums seized in April 2014 including US$0.5mn and J$1.3mn. This represents the largest cash seizure in the Division’s history. � The FID received the following number of Suspicious and Threshold Transaction Reports:
Report Type 2015-2016
Suspicious Transaction 156,251
Threshold Transaction 176,876
Total 333,127

88
� As at January 19, 2016, the FID recorded the following number of successes in forfeited properties and motor vehicles:
Total Restrained Properties (Lands, Houses, Apartments, Buildings etc.)
84
Total Forfeited Properties (Lands, Houses, Apartments, Buildings etc.)
25
Total Restrained Motor Vehicles (Motor cars, Trucks, Vans, Motorcycles etc.)
91
Total Forfeited Motor Vehicles (Motor cars, Trucks, Vans, Motorcycles etc.)
2
� The FID was instrumental in providing support for the Caribbean Financial Action Task Forces (CFATF) Mutual Evaluation of Jamaica, which was conducted in June 2015. This Evaluation assessed Jamaica’s compliance with international standards in the area of money laundering and the financing of terrorism.
Areas of Focus for Fiscal Year 2016/17 For FY 2016/17, efforts will concentrate on the following: � The second phase of private sector pension reform to address issues such as vesting, portability and indexation; � Facilitating the enactment of legislation to provide for the registration and regulation of small privately-owned money lending institutions; � Facilitating under the BSA, a suite of Regulations and Rules including: the regime for financial holding companies and consolidated supervision; and agency banking; � The continued divestment of remaining assets under FIS’s control; � Finalizing and resolving outstanding pensions and litigation matters for FINSAC; � Completing the audit for both FINSAC and FIS for the fiscal year ending March 2016; � Completing roll out of the GOAML (this is an IT-based information, collection, management and analysis software package) reporting software to reporting entities; � Completing establishment of the Cyber-forensics laboratory at the FID, including training and the preparation of appropriate policies and procedures to govern its operations; � Refocusing the FID to concentrate on investigating more serious and complex financial crimes as specified in the National Security Policy and Vision 2030; � Changing the status of the FID to that of Department to allow for greater financial autonomy and to give effect to the provisions of the Financial Investigations Division Act; � Building the capacity of the FID to gather intelligence on, and investigate, Terrorism Financing;

89
� Expanding the range of sources from which the FID may gather intelligence, to include regulatory agencies, law enforcement agencies, private sector and foreign partners, through the expansion of the FID’s network of Memoranda of Understanding; � Expanding the capacity of the FID to carry out strategic analysis, which focuses on the identification of themes, trends and typologies in the national environment that can inform national policymaking; � Working with the Ministry of Foreign Affairs and Foreign Trade to improve the Terrorism Prevention Act (TPA) to meet international requirements, as well as assist in the process of bringing Designated Non-Financial Institutions under the TPA.

90
APPENDIX IV
Strategic Human Resource Management
PUBLIC SECTOR REFORM Establishment of the SHRMD The Strategic Human Resource Management Division (SHRMD) continues to execute its functions as the human resource policy hub for the public sector, in parallel with the development and staffing of its new structure. Recruitment of the top level staff was completed during the fourth quarter of FY 2015/16. Human Capital Management Enterprise System (HCMES)
On December 30, 2015, a contract was signed with the successful bidder for the acquisition and installation of a Human Capital Management Enterprise System. The project commenced on January 18, 2016, and the first phase of payroll design has been completed. The project team is in the process of designing the first phase of the Human Resource Management processes. The entire design phase was concluded in February 2016. Compensation Review An analysis of the Central Government’s wage bill has commenced within the context of the compensation review report submitted in February 2014. The results of the analysis will inform the Government’s medium term wage policy. It is expected that the wage policy will be submitted to Cabinet by end-December 2016. Public Sector Pension Reform Activities were advanced during FY 2015/16 to facilitate expected implementation of the reformed Public Sector pension system in FY 2016/17. Significant among these activities were:
� The tabling of a Bill entitled The Pensions (Public Service) Act in the House of Representatives in November 2015. This Omnibus legislation seeks to establish a contributory pension scheme for the public service, to be known as The Public Service
Pension Scheme, from which the payment of pensions, gratuities and other allowances in respect of the service of pensionable officers will be made;
� Completion of the System Requirements Specifications (SRS) and Design for the new pension software, Public Employees Pension Administration System (PEPAS) and delivery of Phase 1 by the consultants, PricewaterhouseCoopers. It is expected that all phases of the software will be delivered by March 31, 2016. The next steps will involve training of all users, user acceptance testing and final deployment of the application;
� Continuation of sensitization sessions on the new reformed system with critical stakeholders.

91
ESTABLISHMENT CONTROL Post Operations Committee The Post Operations Committee (POC) continues to monitor the Public Service Establishment and adjudicate on the filling of vacant posts in the context of the country’s Medium Term Economic Programme. This activity is integral to the containment of the size of the Public Sector and the achievement of the Government’s wage bill target. Establishment General (G) Order The Establishments for Executive Agencies and Educational Institutions were published during FY 2015/16. The draft Civil Service Establishment (General) Order, 2015 was laid in the Houses of Parliament for Affirmative Resolution. SCHOLARSHIPS AND ASSISTANCE AWARDED UNDER GOJ AND DONOR PROGRAMMES
Scholarships
In excess of 300 public sector workers were provided with financial assistance towards tuition fees for tertiary studies, in keeping with the negotiated Heads of Agreement. During the period April to December 2015, scholarship offers were received from China, Cuba, Japan, Russia, Serbia, the Organization of American States (OAS), Mexico, New Zealand and the UK Commonwealth Scholarship. Advertisements were posted in the media and on the MOFP’s website while circulars were issued to special interest groups. Where applicable, candidates were interviewed, nominated and awarded accordingly. Through this process 36 long and short term scholarships were accessed. Skills Training Current and emerging training needs were assessed to inform the Skills Training Programme. The HEART Trust/NTA has been contacted to deliver training in Food Preparation, Air Conditioning and Refrigeration, General Construction, Interior Decorating, Drapery Making, Floral Arrangements and Motor Vehicle Servicing and Repairs.
EMPLOYEE BENEFITS
Funeral Grants and loans for acquisition of computers, motor vehicles, miscellaneous items and tertiary education were processed and approved in accordance with the relevant guidelines. During the April to December 2015 period, total disbursement of Loans and Grants to Public Sector workers was $235.0mn, a 27% increase over the corresponding period last year. This is attributed to the increase in Motor Vehicle loan limits to $2.5mn and $1.5mn for new and used cars, respectively, and, a 200% increase in Funeral Grants under the 2015/16 Heads of Agreement signed between the GOJ and unions representing public sector workers.
92
INDUSTRIAL RELATIONS
Wage Negotiations
The end of the period of no wage increase was welcomed by Public Sector employees and their unions and staff associations. As at January 31, 2016, a total of 33 claims were received from bargaining units representing employees in Central Government, and 20 from Statutory/Public Bodies. Of this number, settlement has been reached in respect of approximately 96% of the Central Government employees for the 2015-2017 contract period with a general increase in salaries and allowances of 4% in year one and 3% in year two. Increases have been granted for Meal, Supper, Taxi, Tailoring and Travelling Allowances, among other group-specific allowances. Activities are underway to ensure the implementation of the items agreed. Central Government settlements outstanding relate to groups within the Health Sector and the University of Technology.
As at January 31, 2016, two (2) agreements have been signed with unions/bargaining units for the Statutory/Public Bodies. Negotiations between unions/bargaining units and management in the Statutory/Public Bodies continue with a view to early settlement. Industrial Harmony During negotiations there were some periods of unrest as some groups sought to press home their requests for improvements in salaries and allowances. These groups included Teachers, Nurses, Correctional Officers, Police Officers and some members represented by the Jamaica Confederation of Trade Unions. Despite these disruptions, industrial harmony was maintained with 97% of the Public Sector groups, against a projected 95% target. This was achieved through continuous dialogue with the unions, the provision of timely and sound advice to Ministries, Departments and Agencies (MDAs) in the implementation of agreed benefits, as well as directed efforts to resolve grievances presented for intervention.

93
Appendix V
TAX ADMINISTRATION PROGRAMME
Tax Administration Jamaica
Tax Administration Jamaica (TAJ) remains a critical arm of the Government of Jamaica’s (GOJ)
economic reform programme, contributing to the ease of doing business by providing a secure
environment to conduct tax transactions. The TAJ collects approximately 65% of the GOJ’s
total tax revenue per annum. Throughout FY 2015/16, TAJ continued to implement tax reform
initiatives to modernize the department and boost revenue collections.
Aided by the administrative activities described below TAJ was able to meet its major targets at
end-December 2015, namely, revenue collections and improved compliance.
The outlook for the core performance of the department remains positive for the full spectrum of
the tax compliance components. This positive outlook stems from the continuous meeting of
quarterly targets during FY 2015/16. For FY 2015/16, net collections stood at $264,551.8mn,
which was $1,265.3mn (0.5%) above the amount targeted.
FY 2015/16 Achievements
Legislation
TAJ’s legislative programme remains on track with the completion of various activities to
support the administration of taxes. These changes span various legislative matters and are
expected to increase the tax base, reduce leakages, address business facilitation and simplify the
current administrative processes. The following were achieved during the April to December
2015 period:
• Governor General’s assent to The Income Tax (Amendment) (No. 2) (Transfer Pricing)
Act, 2015;
• Passage of the (Income Tax) (Transfer Pricing Documentation) Regulations, 2015
• Passage of the Income Tax (Transfer Pricing Agreements) Rules, 2015;
• Amendments to the Income Tax Act (Special Economic Zones Act, 2015 – Schedule I);
• Conclusion of negotiations with Italy for a Tax Information Exchange Agreement; and
• Conclusion of discussions with the OECD Secretariat for approval for Jamaica to sign the
Multilateral Convention on Tax Matters.

94
Registration Compliance During FY 2015/16 several treatment strategies were adopted to improve registration
compliance. Third party information matching and data mining capabilities were enhanced
through the introduction of a large-scale automated crosschecking and verification process.
Analysis of the third party information is aimed at addressing compliance issues across tax
segmentations.
Data warehousing capacities were bolstered with the development of a Discovery Module in the
Revenue Administration Information System (RAiS). The module will be used to help identify,
categorize, prioritize and manage the process of getting individuals, businesses and organizations
to comply with the tax laws. As at end December 2015, approximately 10,000 non-registrants
and 1,000 Income Tax stop-filers were identified for compliance action. At end-December 2015,
1,483 taxpayers were identified for compliance action, of which 827 cases have been closed and
revenue recovered in the sum of $214.0mn.
The registration programme also received the combined support of taxpayer education, taxpayer
assistance and compliance enforcement initiatives. These were primarily to address registration
challenges through field checks, record keeping reviews, information visits, improved
communication products (both paper and web), enhanced outreach programmes, partnering with
external organizations, and, when needed, enforcement and prosecution action. For the period
April to December 2015 there were notable performances in the following areas:
• Advisory visits increased by 96% to 1,643, from 838 over the corresponding period of
2014;
• As at end-December 2015, total taxpayers registered to eFile stood at 28,440 compared
with 6,564 for the corresponding period of the prior year;
• eOne-on-One sessions stood at 5,299; and
• 188 seminars and forums were conducted to inform taxpayers of issues impacting their rights and obligations.
Filing and payment compliance Taxpayers are classified into various segments with a view to better understand their behaviour.
This approach provides for the application of different treatment strategies to improve
compliance rates. Whereas the large taxpayer segment continues to perform above and within
target, additional focus is being given to improving the filing patterns of the micro and small
taxpayers. Table V (1) shows the on-time compliance rates across all tax segmentations.
Additional compliance actions will be undertaken to improve performance according to the
target groups.

95
Table V (2) illustrates the payment compliance for each tax type by segment. Of note,
performance among the micro taxpayers increased significantly in Quarter 3 when compared to
the previous quarters.
Table V (1): On-time filing compliance
Segment
Tax
Type Qtr 1 Qtr 2 Qtr 3
Large
GCT 92% 92% 91%
PAYE 75% 74% 72%
SCT 90% 90% 90%
GART 79% 79% 78%
STCT 100% 100% 100%
Upper
Medium
GCT 86% 89% 90%
PAYE 66% 66% 67%
SCT 100% 100% 100%
GART 70% 72% 68%
Lower
Medium
GCT 86% 86% 85%
PAYE 61% 60% 61%
SCT 42% 92% 100%
GART 84% 73% 70%
Small
GCT 73% 75% 75%
PAYE 53% 53% 54%
SCT 59% 63% 71%
GART 65% 67% 68%
Micro
GCT 48% 48% 48%
PAYE 19% 18% 19%
SCT 27% 40% 38%
GART 47% 50% 54%
Table V (2): On-time payment compliance
Segment
Tax
Type Qtr 1 Qtr 2 Qtr 3
Large
GCT 99% 98% 97%
PAYE 96% 96% 96%
SCT 100% 100% 100%
GART 100% 99% 100%
STCT 100% 100% 100%
Upper
Medium
GCT 98% 97% 98%
PAYE 92% 92% 94%
SCT 67% 100% 100%
GART 100% 99% 100%
Lower
Medium
GCT 97% 96% 96%
PAYE 93% 91% 94%
SCT 53% 10% 100%
GART 100% 96% 100%
Small
GCT 92% 93% 94%
PAYE 84% 86% 89%
SCT 56% 67% 100%
GART 35% 90% 96%
Micro
GCT 79% 85% 88%
PAYE 68% 69% 84%
SCT 33% 0% 33%
GART 60% 79% 97%
TAJ’s filing compliance risk-based approach comprises a mix of education and assistance,
supported by appropriate enforcement and prosecution action. Efforts during FY 2015/16 to
improve filing compliance included:
• pursuing opportunities to increase the number of taxpayers using the e-filing facility;
• updating legislative filing requirements;
• identifying taxpayers who are inactive but still trading and applying the appropriate
actions;
• cleansing the filing database of taxpayers who are no longer required to file returns;
• pursuing opportunities to increase the number of taxpayers using the e-payment facility;
• extending mandatory e-payment to at-risk taxpayers and tax types;
• extending automated withholding-at-source arrangements to third parties;
• working with the banks to incorporate the e-payment of taxes by taxpayers through the
bank’s existing bill payment systems;

96
• utilizing recently strengthened legislation which provide for stronger penalties as well as
the collection of taxes via liens and garnishee action;
• strengthening investigative efforts resulting in an increase in the number of cases going to
the courts for prosecution; and
• working with court bailiffs to enforce warrants.
Returns eFiled for the April to December 2015 period amounted to 67,582, up from 32,802 for
the corresponding period in 2014. The majority of these returns were for PAYE.
Correct Reporting Compliance through Risk-Based Auditing
Correct reporting compliance has been focussing on:
• making better use of TAJ’s enhanced information matching and data mining capability to
help identify high risk cases for audit and to provide ongoing analysis, checking and
verification services throughout the course of the audit; and
• continuing to improve audit effectiveness through training, improving procedures and
using the strengthened legislation provisions to access information and impose penalties.
With the support of RAiS, significant inroads have been made into improving correct reporting
compliance. Through data matching activity, as at end-December 2015, 1,337 audit cases were
identified for execution in respect of three (3) major tax types, Income tax, GCT and Guest
Accommodation Room Tax (GART) as follows:
• Income tax audits were developed for medical professionals, wholesalers, retailers
and taxpayers filing GCT on total supplies and nil income;
• GCT audits were developed for taxpayers with net credit balances, who only
report exempt supplies and input tax credit;
• GART audits were developed for the micro and small segments of the Tourism
and Hospitality sector;
• Joint audit efforts were established with the National Housing Trust for a Payroll
Audits project. A joint audit effort was also established with Jamaica Customs
Agency with the signing of a memorandum of understanding.
Overall, for the period April to December 2015, 78% of targeted audits were completed. As at
December 31, 2015 potential revenue from the efforts of the audit programme amounted to
$3,100.0mn.
Information Technology RAiS Phase 2
TAJ successfully upgraded the tax system with the roll-out of additional tax types on the
Revenue Administration Information System (RAiS) on December 7, 2015. This is expected to

97
improve service delivery and efficiency with the provision of greater convenience and security.
As a result, online services have been expanded for taxpayers with the provision of improved
web services related to Income, Education, Minimum Business, Asset and Payroll Taxes, as well
as NIS, NHT and HEART contributions. Online applications for Taxpayer Registration Numbers
(TRN) and Tax Compliance Certificates (TCC) are also available.
RAiS Phase 3 will incorporate Withholding Tax on Specified Services, Environmental Protection
Levy, Stamp Duty and Transfer Tax, Betting, Gaming and Lottery Tax and Trade and Business
Licences. Phase 3 will run from May 2016 to October 2016.
Enterprise Content Management (ECM)
Phase 1 of the ECM system which was implemented in February 2016 comprises:
(1) the electronic imaging and data capture of paper tax returns;
(2) the electronic imaging of other paper documents (e.g., taxpayer letters, certified
copies of certificates, auditor working papers, taxpayer rulings etc.); and
(3) linking these processes to RAiS case-actioning and reporting components.
Communication and other Outreach Activities For the fiscal year to December 31, 2015, communication and other outreach activities focused primarily on the rollout of Phase 2 of the RAiS and issues surrounding the introduction of Transfer Pricing. Activities relating to the transition of TAJ to a Semi-Autonomous Revenue Agency (SARA), as well as educating stakeholders on recent tax reform and policy changes were also undertaken. Communication and outreach activities included the dissemination of information on the implementation of a Withholding Tax on Specified Services and the increase in the income tax threshold as of January 1, 2016. The TAJ is also expanding its capabilities and interface with other parties as it continues to pursue its mandate.
Strategies and Activities for FY 2016/17 and the Medium Term
Against the backdrop of the gains in FY 2015/16, TAJ’s strategic focus will seek to build on the
successes of meeting the needs and expectations of the taxpaying public and other stakeholders.
TAJ will focus on building on its culture of integrity and making the necessary cultural changes
to align with the transformed client experience. TAJ’s modernization programme will continue
to be a driving force behind its strategies over the medium term. The modernization of TAJ’s
human resources, processes and systems has provided a platform and capacity to enable the
department to broaden its reach and improve compliance in order to efficiently and effectively
respond to changes in the current operating environment.
As a result of the continuing modernization programme, TAJ’s major strategies are as follows:

98
1. Utilization of a competency framework for all the critical positions in TAJ in order to
ensure the best fit for all positions - the primary delivery from the activities to be pursued
will be the development of a highly trained, competent and fully engaged workforce
supported by initiatives to encourage staff retention in the organization;
2. Prudent management of organizational resources (financial and inventory) - through
prudent management, TAJ is expected to, over time, reduce its overall cost to collect
revenue;
3. Provision of an appropriate and safe business environment (physical, employee, data) for
stakeholders;
4. Continued implementation of re-engineered business processes - this strategy will focus
on providing the appropriate technological solutions, operating environment and culture
to support the transformation and modernization of TAJ.
For FY 2016/17, TAJ will continue to employ risk management approaches to tax
administration. Compliance risks will be addressed in a structured manner in accordance with
the National Compliance Plan. The TAJ will continue to undertake intelligence gathering and
conduct research activities to build and strengthen its knowledge of compliance levels and risks
across the different tax types and taxpayer segments. These initiatives will include the
following:
• Undertaking research into hidden economic activity, especially the trading of goods and
services in cash, and, falsifying of accounting records;
• Conducting research on internationally topical compliance issues, such as potential
revenue losses from transfer pricing and other forms of profit shifting by large taxpayers
with cross border operations, and aggressive tax planning of high-wealth and
high-income individuals;
• Undertaking tax compliance gap analysis at a macro level;
• Using random audits based on a statistically valid sample that is representative of the
target taxpayer population to test compliance levels (the random audit programme is part
of TAJ’s wider audit program).
• Analyzing third party information gathered from various sources.
The TAJ will continue to develop compliance programmes to mitigate identified risks.
Mitigation strategies will focus on the causes of non-compliance using a mix of instruments,
including educating and assisting the public, strengthening legislation and procedures, auditing
and other forms of enforcement.

99
In summary, the TAJ will continue carrying out the following activities:
i. Provide an integrated online
experience as well as build on
contemporary services;
ii. Improve online services to small
businesses;
iii. Reduce the administrative cost of
complying;
iv. Work with software developers and
tax professionals to drive innovation
in tax services;
v. Work with taxpayers to resolve
issues early so that returns lodged are
correct;
vi. Work with the public to develop
targeted compliance strategies that
leverage taxpayers’ natural business
systems;
vii. Make earlier, direct and open contact
with taxpayers to avoid disputes
wherever possible or resolve disputes
as early as possible;
viii. Reduce aged cases through earlier
engagement;
ix. Manage disputes fairly and
independently in the simplest and
most cost-effective manner;
x. Influence policy and law design for
more predictable outcomes, using
insights from our administration and
interactions with the community;
xi. Support the GOJ’s taxation priorities
including addressing base erosion
and profit shifting;
xii. Influence government policy
development and implementation,
through advocating the use of
services, technologies and processes
to minimize the administrative
impact on business;
xiii. Use data in a smarter way to improve
decisions, services and compliance;
xiv. Share intelligence and data with tax
agencies worldwide to support
voluntary compliance, encouraging
disclosures and identifying and
investigating tax evasion;
xv. Improve and extend TAJ’s data
matching capabilities;
xvi. Develop better-targeted services
based on a deeper understanding of
taxpayers’ needs and behaviours;
xvii. Establish a holistic view of taxpayer
risk to improve service and
enforcement approaches.
The TAJ will also undertake post implementation evaluation of the effectiveness of each major
mitigation activity, whereby actual outcomes will be compared with desired outcomes and the results
fed into future planning processes.

100
Jamaica Customs Agency
1. Introduction
The Jamaica Customs Agency (JCA) collects approximately 35% of the national tax revenue annually
and works with other agencies to manage the flow of people and goods across Jamaica’s border,
while managing related risks. The JCA has three core functions:
1. Protecting Jamaica’s Border;
2. Promoting and Facilitating Secure and Efficient Trade and Travel; and
3. Collecting the Government of Jamaica's revenue.
JCA was established as an Executive Agency with effect from April 2, 2013, and has since concentrated on the delivery of priority objectives, improving performance and the longer-term transformation of the Agency. Specifically, the JCA is mandated to provide more efficient and effective service to travelers and importers, resulting in improved voluntary compliance from importers. The Agency is also expected to develop an enhanced capacity to detect and prevent revenue fraud and to demonstrate a greater ability to stop illicit imports.
Operating Environment
The JCA continues to operate and facilitate trade in a dynamic environment that needs to be monitored continually to identify and respond to opportunities and risks. To efficiently and effectively perform its main functions, the Agency aims to maintain a workforce that is committed to excellent delivery of high quality customer services. To achieve the JCA’s mission and vision as well as facilitate the social and economic objectives of the Jamaica Government, the Agency collects and protects the revenue and guards against smuggling through:
• executing its normal operations;
• intelligence-led risk management utilizing its global connections;
• stakeholder engagement in developing and executing the JCA's strategy;
• engaging regularly with industry groups and other organisations; and
• preparing a longer-term strategic intelligence picture and outlook to inform its strategic planning.
The JCA functions are mandated by the Customs Act 1941 and Customs Regulations 1955, which are
expected to be revised in FY 2016/17. The revision of the principal instruments of the Customs Act
and Regulations will assist the JCA to keep pace with rapidly changing technology, business practices
and border management requirements and minimize risk to the Agency's ability to carry out current
and future activities efficiently and effectively. In addition to the laws of the Jamaica Customs Act,
the JCA enforces over 125 other provisions of law for at least 20 agencies. JCA functions are
delivered through services that seek to prevent harm from a range of risks, including risks to
Jamaica's security and health as well as risks to the GOJ revenue. JCA frontline presence, routine

101
patrols and inspections, as well as monitoring of risks, help to create a low-risk border. The JCA
promotes and facilitates secure and efficient trade and travel through formal customs partnerships,
input to Jamaica’s free trade agreements (FTAs), and support for traders to benefit from those
agreements.
The JCA faces many significant challenges, including:
• Hiring, training and retaining qualified employees in a highly competitive marketplace;
• Reducing the amount of illegal drugs entering and leaving Jamaica;
• Protecting the economic interest of Jamaica by facilitating the legitimate flow of commerce and travellers, fostering trade compliance with import and export laws and stopping predatory and unfair trade practices that threaten Jamaica’s economic stability and market competitiveness;
• Combating crime by disrupting the flow of illegal guns and money derived from illegal international activity, preventing illicit trade in cultural and intellectual property, and preventing the exportation and importation of stolen property;
• Promoting public health and safety by reducing importation of potentially harmful, hazardous, or otherwise illegal commodities, and by preventing illegal importation of ammunitions and weapons.
These challenges pose risks to the sustainability of the organisation and its ability to deliver on its mandate. The challenging environment within which the JCA operates also impacts on the organisation’s ability to adapt to changing conditions. The process of adopting appropriate strategies and action plans to deal with new threats is underway and will continue into the foreseeable future.
JCA Achievements FY 2015/16
The following major initiatives were undertaken and achievements recorded by the JCA during the
period April 2015 to December 2015:
1. Consistently satisfied all requirements under the Extended Fund Facility (EFF); 2. Surpassed all quarterly tax revenue targets; 3. Eighty eight (88%) of staff has been transitioned into the Executive Agency; 4. The Agency’s flagship project, ASYCUDA World is in high gear. The Export Module is
fully implemented and the Import Module is being piloted at Sufferance Wharves in Kingston; 5. Gazetting of an Electronic Single Administrative Document ; 6. The Customs Amendment Bill 2015 was tabled in Parliament; 7. An Anti-Corruption Committee was established and in keeping with the Revised Arusha
Declaration an Integrity Manual was drafted; 8. Expansion of staff transportation service and logistic support to Montego Bay and other
outposts; 9. Acquisition of equipment to facilitate secondary examination of goods; 10. Negotiation and finalization of MOU's with Kingston Container Terminal (KCT), Norman
Manley International Airport (NMIA), Sangster International Airport (MBJ), TAJ and the Financial Investigation Division (FID); and

102
11. Commenced construction of a jetty at Sufferance Wharves, Port Royal to facilitate efficient processing of pleasure crafts and cabin cruisers.
Strategic Objectives for FY 2016/17 and the Medium Term
The JCA’s medium term strategic objectives and strategies for FY 2016/17 to FY 2018/19 are
outlined below.
1. To assess and collect revenue due
The strategies to be employed include:
• Examining goods and ensuring that the correct amount of duty is collected before the goods are released from JCA’s control;
• Developing and managing a coordinated, risk-based approach to completing post clearance audits;
• Conducting joint post-clearance audits with TAJ;
• Identifying and initiating collection actions for revenue past due; and
• Maintaining a valuation database to verify the values declared to JCA.
2. To ensure efficient and effective use of resources
The strategies to be employed include:
• Assessing budget execution and implementing cost saving strategies; and
• Applying risk-based assessment and management methodologies to inform the JCA’s expenditure requirement.
3. To increase the methods of detection of imported and exported illegal and prohibited goods
The key strategies to be employed include:
• Increasing enforcement activities that lead to detection of illegal and prohibited imports and exports;
• Creating a tangible platform for effective exchange of information and intelligence among national and international counterparts and developing partnerships with local and international stakeholder agencies to conduct coordinated risk management;
• Enhancing the existing risk management functions by adopting relevant World Customs Organization (WCO) standards and guidelines to utilize the advance information from ASYCUDA World for effective risk management;
• Improving border security, and, counter drug trafficking, through use of modern facilities and innovative tactics and strategies;

103
• Enhancing and developing a mechanism to monitor the movement of cargo, passengers, crew and conveyances for effective profiling and targeting, by establishing and strengthening customs control at the border through integrating resilient controls in processes, procedures and physical infrastructure.
4. To improve voluntary compliance
The main strategies to achieve this objective include:
• Undertaking ongoing public education through the various media, such as workshops, meetings, public forum, expos, print and electronic media;
• Broadcasting information through client awareness surveys;
• Developing and implementing a robust National Compliance Plan; and
• Encouraging voluntary compliance by initiating discussions with stakeholder groups/traders.
5. To improve legal and regulatory frameworks
The strategies to be employed include:
• Reviewing and recommending amendments to the Customs Act and Regulations in order to align legislation with best practices; and
• Updating, simplifying and standardizing systems, procedures and legislation.
6. To facilitate the efficient processing of legitimate goods and persons
The key strategies include:
• Ensuring passengers and cargo are processed within the Citizen's charter and legal framework;
• Continuing to communicate customer charter standards both internally and externally in order to promote compliance;
• Developing and acquiring systems that will improve the detection and prevent the movement of prohibited and restricted goods;
• Conducting workshops in an effort to deliver high-quality customer service; and
• Focusing on reducing the time it takes to clear goods and passengers.
7. To automate and strengthen information management, information and communication
technology (ICT) and financial management systems
The strategies to be employed include:

104
• Developing and monitoring project schedules and enhancing ICT systems security;
• Implementing ASYCUDA throughout the JCA; and
• Improving JCA accounting and financial systems through the implementation of cash and accrual basis ACCPAC Accounting System.
8. To develop and maintain a team of motivated, professional and competent staff
To meet this objective the JCA will seek to:
• Evaluate the performance management system and develop and implement strategies to address poor performance areas;
• Formulate and implement human resource best practices, policies and initiatives aimed at enhancing employee welfare and satisfaction;
• Develop and conduct training sessions;
• Fill vacant positions, especially for critical jobs;
• Develop and implement Staff Satisfaction Surveys; and
• Identify and implement training development intervention for each staff level.
9. To adhere to occupational health, safety and environmental national, regional and international standards
In order to satisfy this strategic objective, the JCA will develop and enforce an occupational
health and safety programme within the organization.
10. To enhance planning and research activities within the Agency
The strategies to be employed include:
• Developing and utilizing the Corporate/Operational Plans as tools to guide the management decision making process;
• Coordinating review sessions to assess divisional operational plans and key performance indicators (KPIs); and
• Revising existing standard operating procedures (SOPs) and manuals where necessary.
11. To improve and maintain the system of internal controls within the Finance and Administration Sections The strategies to be employed by the JCA include:
• Documenting and implementing agency-wide SOPs;
• Monitoring and evaluating the systems of internal control to ensure compliance; and

105
• Ensuring that the Agency’s Financial Statements are produced in accordance with the relevant accounting standards and GOJ guidelines.
12. To assess and enhance the impact of the internal audit on the JCA operations
With respect to this strategic objective, the JCA will seek to establish a robust risk assessment
and annual planning process to focus on existing and emerging high risk areas.
13. To establish and maintain quality assurance mechanisms
The strategy to be employed will require the establishment of Quality Management Systems
in keeping with national, regional and international standards.
14. To improve service delivery to the public
The strategies to be employed include:
• Implementing Sysaid (Customer Service System) to manage customer service complaints and issues;
• Conducting workshops and surveys to enhance customer service delivery;
• Conducting Customs Media Forums; and
• Facilitating Customs Stakeholder Exchange.
106
Appendix VI
PUBLIC SECTOR INVESTMENT PROGRAMME FY 2016/17 –FY 2020/21
Reform of Public Investment in Jamaica
As part of the continued support to the Public Financial Management (PFM) Reform Programme the
Ministry of Finance and the Public Service (MOFPS) has successfully implemented key activities
aimed at enhancing the efficiency of the process. One of the key elements of the reform is the
establishment of the Public Investment Management System (PIMS).
In fiscal year 2014/15 the MOFPS in collaboration with the Planning Institute of Jamaica completed
the amendments to the Financial Administration and Audit (FAA) Act to strengthen the legislative
framework for the PFM reform, specifically the Public Investment Management System (PIMS). The
legislation was Gazetted in April 2014.
Through support from the Strategic Public Sector Transformation Project (supported by a World
Bank Loan of US$35.0mn) in fiscal year 2015/16, the MOFPS continued the implementation of the
reform and has achieved major milestones in the development of the PIMS. These milestones
include:
Establishment of the PIMS Secretariat (PIMSEC) - It is the central point of entry for all projects
to be considered for inclusion in the PSIP. The PIMSEC is the key technical body for public
investment planning and implementation and provides technical advice to the Cabinet through the
PIMs Committee on investments that are to be included in the PSIP. The PIMS Secretariat directly
supports the work of the PIMS Committee which makes the final decisions on the composition of the
PSIP.
Hosting of PIMS Committee Meeting - The Committee is chaired by the
Honourable Minister of Finance and the Public Service and supports the review of all public
investments. Under the amended FAA Act, all Pubic Investments must be reviewed by the PIMS
Committee. To date the committee has reviewed more than 20 business cases valuing over
J$6,000mn for projects at different stages of development.
Development of PIMS Guidelines - the PIMS Secretariat (PIMSEC) in collaboration with the
MOFPS has completed the penultimate draft of the guidelines. The document will serve as a
reference document to Ministries, Departments, Agencies and Public Bodies as it outlines the new
rules and procedures as well as details the roles and responsibilities of the stakeholders in the PIMS
process. PIMSEC embarked on a sensitisation programme in 205/16 which also involves

107
consultations with key participants in the PIMS. The sessions will continue to FY 2016/17 following
which, Cabinet approval will be sought.
Establishment of Pre-Investment Evaluation Fund (PIEF) - It is recognised in the development of
the PIMS that the Government will require significant investments in assessment and evaluation of
projects and other types of business cases (for example, Public Private Partnerships) in order to fully
optimise the Public Sector Investment Programme (PSIP). It is with this understanding that the
MOFPS in collaboration with the Secretariat and the World Bank has initiated actions to establish a
PIEF. This fund will support key pre-investment actions such as feasibility assessments; process
reviews; cost benefit analysis; socio-economic and environmental assessment; and other technical
studies aimed at improving the quality of the final project design and ultimately the effectiveness and
efficiency of the PSIP. A total of J$30.0mn has been provided for the Fund in FY 2016/17.
Development of a Public Investment Management Information System (PIMIS) - The first stage
of the development commenced in FY 2015/16 with the development of a project database. This
database currently captures detailed information on all project financed through the central
government and profiles of the majority of projects financed by public bodies. The database is also
used by the MOFPS as a tool to provide reports on the status of key development projects in the
Central Government portfolio.
The second phase of the development is the procurement of a state of the art Management
Information System that will track investments at all stages of the project cycle. Procurement of the
system is scheduled to commence in FY 2016/17.
The FY 2016/17 – FY 2020/21 presented in the attached table incorporates investment projects
funded through GOJ resources, revenues generated by the public bodies as well as through loans and
grants from multilateral/bilateral institutions.
Presented below are some of the major development projects and programmes listed by sector, which
will be implemented by Central Government MDAs through to FY 2020/2021, with assistance from
multilateral/bilateral institutions.,
SOCIAL SECTOR
Support for the Social Safety Net
The Programme of Advancement Through Health and Education (PATH) offers assistance in the
form of grants to two (2) categories of beneficiaries: (i) children/students ages 0 – 19 years; and
(ii) adult poor including the disabled, elderly, pregnant and lactating mothers and the destitute.

108
Another safety net component of the programme is the Steps-to-Work (StW) initiative, which targets
working age members of PATH eligible households for referral to relevant support services to enable
them to seek and retain employment.
The PATH cash grants are funded primarily from the Government of Jamaica resources with support
from loan resources of the International Bank for Reconstruction and Development (IBRD) and the
Inter-American Development Bank (IDB) across the life of the programme which commenced island
wide in 2002.
The 2016/17 provision of $5,000mn is to support continued payment to 320,000 beneficiaries, assign
and deliver a package of labour activation services to support the graduation strategy, enhance the
skills training aspects of the steps to work programme and implement the process for the use of the
pensions earnings contribution database.
Jamaica Social Investment Fund (JSIF)
JSIF manages the implementation of projects aimed at addressing the socio-economic needs and
social services at the community level across Jamaica. The entity was allocated a budget of $1,957mn
in FY 2015/16 and eighty-five (85) sub-projects were completed. Implemented were: infrastructural
sub-projects in urban and rural communities, such as sanitation and water; construction/rehabilitation
of basic and primary schools; rehabilitation of agricultural feeder roads; construction/rehabilitation of
agro-processing facilities to meet good agricultural practices requirements; and provision of
vocational skills training, market awareness, entrepreneurial skills, employment profiling, personal
development and job preparation skills.
In FY 2016/17, the sum of $2,065.7mn has been provided to continue implementation of the
aforementioned programmes. The JSIF plans to execute eight major projects and a total of 169 sub-
projects. The major projects include the Rural Economic Development Initiative, Poverty Reduction
Project III & IV, Basic Needs Trust Fund Seven and Eight (BNTF7 & BNTF8), Integrated
Community Development Project (ICDP), Disaster Vulnerability Reduction Project (DVRP) and the
School Sanitation Programme. These projects are being implemented over a period of two to five
years.
Public Sector Transformation
Public Sector transformation is lead by the Office of the Cabinet and the MOFPS. The transformation
activities are coordinated through the Public Sector Transformation and Modernization Programme
(PSTMP) of the Cabinet Office and the Strategic Public Sector Transformation Project being
implemented by the MOFPS. The projected total external financing to implement these programmes
up to March 2020 is US$67.6mn. The initiatives under these programmes are far reaching and include

109
inter alia – the development and delivery of integrated public services which meet the needs of
customers; strengthening the link between planning, budgeting and performance management through
the introduction of a framework for Medium Term Results Based Budgeting; improving the
efficiency and effectiveness of Human Resource Management across government; developing
capacity for continuous improvement in the quality of service delivery across the public sector;
institutionalization of the Public Investment Management System and fostering industrial and trade
facilitation through the Government’s Agencies.
For FY 2016/2017 a budgetary allocation totalling J$1,387mn is provided to the two aforementioned
projects to implement a slate of activities aimed at progressing towards the objective of transforming
the public sector. The major activities financed include inter alia: Modernization of the Government
Electrical Inspectorate (GEI), Implementation of a Human Capital Management Enterprise System
with Payroll (HCMES/Payroll), establishment of a One Stop Shop for business registration,
establishment of a Montego Bay One Stop Shop for import/export inspection service, development of
a GOJ Records and Information Management Programme, the design and implementation of the
Public Investment Management Information System, design and implementation of a
Pre-investment Studies and Evaluation Fund, and Change management within various Ministries,
Departments and Agencies.
EDUCATION (Additional school places, training and reform)
In FY 2015/16, the Ministry of Education’s approved budget of $2,071mn was increased to $2,311mn
in the 2015/16 First Supplementary Estimates to facilitate the implementation of capital projects. The
main projects and activities executed included: (i) Education Systems Transformation – completed
installation of the NEI inspection software, purchased equipment and licence to support the
implementation of a new Human Resource System; commenced development of the Primary Exit
Profile and Grade 2 & 9 diagnostic tests;, commenced the development and piloting of the National
Standard Curriculum, and completed extension of classroom blocks in two (2) schools; (ii) The
University of Technology Enhancement Project - completed the construction of the School of Hotel
and Tourism Management; continued construction of Shared Facilities to provide additional
classrooms and Laboratories upgrade; (iii) USAID/MOE Education for Partnership for Improved
Reading Outcome - continued intervention in schools that needed assistance in improving reading
levels and (iv) Education Transformation Programme - the provision of additional classroom blocks
in 11 secondary schools to alleviate the shift system.
The Education Ministry’s budget for FY 2016/2017 is J$2,633mn to implement capital projects. All
levels of the education spectrum will benefit from the resources provided. The Early Childhood
cohort/stakeholders will benefit from the Early Childhood Development Project which is supporting
the objective of providing quality education for all children ages 3-5. This will be done through the
development of health education materials, training of health care workers, ECI Practitioners and

110
other stakeholders and the development of a 0-3 year nutrition service delivery model; the
modification of existing spaces for 28 schools to accommodate an infant department is also scheduled
for implementation through the Renovation/Refurbishing of Infant Schools Project. The primary
sector will benefit from new bathroom facilities at 28 primary schools and the USAID/MOE
Education for Partnership for Improved Reading Outcome Project will continue its mandate to
improve literacy levels in primary schools by providing the required literacy material for grades 1 to
3. The Secondary level will benefit from the construction of additional classrooms to address the
existing shift system as well as major revisions to the curriculum through projects such as the
Education Transformation Programme I, the Education System Transformation Programme and
the Promoting Quality Education and Advancing the reality of Child Friendly Environment
Project.
SECURITY and JUSTICE
Citizens Security and Justice Programme (CSJP)
The third phase of the five year programme is being funded by a combination of Loan/Grant/GoJ
funds, in the amount of US$53.3mn.
The programme is expected to expand its reach to include more than the 50 communities served
under CSJP II, with a view to ensuring that inter-agency collaboration can be attained and services
can be institutionalized after the first three years.
In FY 2016/17, the sum of J$1,201.0mn is allocated for the continuation of social intervention
programmes with an increased focus on improving governance and promoting behaviour change,
especially as it relates to conflict resolution, social inclusion and safety, and an increased use of
gender-responsive justice services through the operationalization of the legal aid council, victim
support services and the dispute resolution foundation.
Construction and Improvement of Correctional Facilities
The primary objective of this project is to improve the living and working conditions of the inmates
and staff at the Tamarind Farm and South Camp Road correctional facilities. The allocation of
$191.0mn in 2016/2017 is to continue the construction of a 304 bed prison facility at Tamarind Farm
and the retrofitting of the South Camp Road correctional facility will allow for the transfer of inmates
and staff from Fort Augusta Correctional Centre. Additionally, the allocation will also facilitate the
de-commissioning of the Fort Augusta Correctional Centre.

111
IMPROVED REVENUE COLLECTION
Fiscal Administration Modernization Programme (FAMP)
The main objective of the Programme is to support the GOJ in achieving a sustainable fiscal position.
This will be achieved by strengthening the institutional capacity of MOFPS and its agencies which
should result in improved customs and inland tax collections, and more effective management of debt
and government payment operations.
The programme is being supported by a US$65.0mn loan from the IDB over a 5-year period.
Major Achievements since the commencement of the project in 2012 include (i) the continued
implementation of the new Automated Operations Management System (ASYCUDA) at the
Jamaica Customs Agency (JCA) which has eliminated the use of paper in the clearance process and
reduced processing time which has resulted in cost saving, greater efficiency, transparency and
accountability. (ii) the Integrated Tax Administration System (ITAS) at Tax Administration
Jamaica (TAJ) has resulted in increased tax compliance, improvement in arrears collection and
identification of tax dodgers; (iii) enhancement and upgrading of MDAs Accounting System
(FINMAN)- in 37 ministries and departments and agencies (MDAs) on the centralized payments
system, upgrade to FINMAN MDA software, introduction of FINMAN Treasury Management
Module (TMM), Training in Risk Assessment and Business Continuity and approximately 60 bank
accounts closed and folded into the Treasury Single Account (TSA).
The 2016/17 budget of $2,588mn, will enable the continued implementation of reforms, improve and
strengthen the systems and processes of Tax Administration Jamaica (TAJ), the Customs Agency of
Jamaica, the Debt Management Branch (DMB) of the MOFPS and the Government’s Central
Treasury Management System (CTMS). Other major activities to be supported include – the
implementation of the new Budget Preparation and Management System, a new Payroll System for
CTMS, a new Document Management System and the Rehabilitation of the TAJ East Street building,
ENHANCING COMPETITIVENESS AND GROWTH
Jamaica: Foundations for Competitiveness and Growth
The implementation of this project is expected to enhance competition in the business environment,
facilitate large scale private investment and support Small and Medium Enterprises (SMEs)
capabilities and provide financing needed to increase productivity and prospect for job growth.
This US$50.0mn project is being financed by a loan from the World Bank and will be implemented
over a 6-year period. During the 2015/2016 fiscal year the services of consultants/suppliers were

112
procured to provide goods or services for the project. These included the engagement of three (3)
firms to provide hardware and software to support the roll-out of the Application Management and
Data Analysis (AMANDA) system in the Parish Councils and other referral agencies. The Special
Economic Zone Act was drafted, tabled and subsequently passed in both Houses of Parliament. The
prefeasibility study to assess the viability of establishing a ship registry was completed and the
recommendations from the report will inform the next steps. An Attorney was engaged and placed at
the Attorney General’s Chambers to review key commercial transaction documents. A total of
$712.0mn has been disbursed to the Development Bank of Jamaica for on lending to Small and
Medium Enterprises (SMEs) via approved financial institutions. Loans totaling $223.0mn has been
approved for disbursement and $49.3mn already disbursed to SMEs.
In the 2016/17 fiscal year, the firm contracted to develop the Business Plan for Creative Industries is
scheduled to complete the consultancy in the first quarter. The firm selected to develop the Logistic
Hub Initiative Master Plan is expected to commence the consultancy in the first quarter. The
procurement of a firm to carry out a feasibility study of the Caymanas Special Economic Zone
Request was in progress and the preferred bidder is expected to be engaged in the first quarter of FY
2016/17. Other consultancies scheduled to commence in early 2016/17 include an in-market broker
for the Business Process Outsourcing sector, a consultant to prepare an action plan for the
development of Downtown Kingston and a firm to manage the grants programme for SMEs. The
DBJ will continue to disburse loan funds to SMEs via approved financial institutions (AFI).
Economic Partnership II (EPA II) Capacity Building Project
The 2016/17 provision to the project is $180.0mn. This European Union (EU) funded project will
continue to provide technical assistance to Micro, Small, and Medium-size Enterprises (MSMEs) to
attain HACCP/ISO certification which will enhance their competitiveness and allow these entities to
be able to access export markets. The upgrading of several laboratories which started under EPA I
will continue under phase II until ISO 17025 accreditation and JANAAC certification are attained.
HEALTH
In FY 2016/17 the Ministry of Health will continue the implementation of the National HIV/AIDS
Prevention and Control Programmes and a programme aimed at reducing child mortality and
improving maternal health. The Ministry will also seek to develop policies, protocols and modules for
the screening of non-communicable diseases at health facilities as well as strengthening its capacity
to respond to the spread of the chikungunya virus and the threat of the Ebola virus. The Ministry will
continue the planned investment to rehabilitate a number of primary health care facilities across the
island. An allocation of $1,548mn (Grant-$1,369mn, GOJ-$178.0mn) will be provided to fund seven
projects aimed at meeting the objectives stated above.

113
ENERGY EFFICIENCY and SECURITY
Energy Efficiency and Conservation Programme (IDB) (Targeting the Public Sector)
The major achievements for 2015/16 included: (i) completion of a contract to replace inefficient
window and mini-split A/C units in several state institutions; (ii) commencing the implementation of
a contract valued at US$2.8mn to upgrade the air-conditioning systems at four state institutions
including the Blood Bank and the MOFPS.
The final air conditioning retrofit contract will be tendered early in the 2016/17 fiscal year and
institutions such as the May Pen Hospital and Revenue Departments will benefit.
Energy Security and Efficiency Enhancement Project (IBRD) (Targeting the Private Sector)
In FY 2015/16 the second phase of the pre/feasibility studies of potential hydropower sites
commenced. Six sites are being assessed in this Phase. One firm was engaged to supply a new test
chamber and the requisite software to the Bureau of Standard Jamaica (BSJ). An existing test
chamber at the BSJ was contracted to be rehabilitated. A local architect was hired to produce designs
for modifying a building to house the new test chamber. With regards to the Line of Credit, $227.0mn
was disbursed to the DBJ for on lending to SMEs for energy efficiency upgrades or renewable energy
initiatives.
The budgetary allocation for the FY 2016/17 is $359.7mn. This will be used to fund activities which
include the procurement and installation of a new test chamber, and rehabilitation of the existing test
chamber at the Bureau of Standards Jamaica, completion of phase 2 of the hydropower feasibility
study and the disbursement of the remaining funds allocated to the line of credit sub-component.
AGRICULTURE
Sugar Transformation Project
The 2015/16 approved budget of $2,400mn allocated to this project s was subsequently
increased to $2,601mn in the 2015/2016 First Supplementary Estimates. The additional
allocation was to ensure continued development of a sustainable private sector led sugar
cane industry and the continued strengthening of the sugar dependent communities to ensure
social stability and environmental sustainability.
The major achievements during the 2015/16 fiscal year included: (i) the completion of 225
houses (barracks relocation programme) in the St Thomas sugar dependent areas (SDA);
(ii) training of over 600 persons from the SDAs in a wide range of skills; (iii) rehabilitation
of 80 kms of cane roads in the cane growing areas; (iv-) the provision of support to 40 new

114
or existing business operators to start or expand their business (v) injection of $50.0mn into
the training fund and the implementation of 80 social projects in the SDAs.
The sum of $2,388mn has been allocated in the 2016/17 Estimates of Expenditure to:
(i) continue implementation of a minimum of 80 social projects in the SDAs;
(ii) rehabilitate a minimum of 80 kms of cane roads in the SDAs; (iii) provide support to a minimum
of 80 new or existing business operators to start or expand their enterprises;
(iv) install drip irrigation systems in a minimum of 80 hectares (200 acres) of sugar cane; (iv) replant
a minimum of 1400 hectares (3500 acres) of sugar cane;
Agricultural Competitiveness Programme (ACP)
The objective of the Agricultural Competitiveness Programme (ACP) is to increase the
competitiveness in the agricultural sector through activities that facilitate small and medium farmers’
access to markets.
The project was allocated $691.8mn in the 2015/16 fiscal year, and the main achievements were: (i)
completion of pipeline, switchgears and pump installation at Spring Plains;
(ii) construction of the packing house in New Forest; (iii) establishment of demonstration plots in
Yallahs, Spring plains/Ebony Park and new Forest/Duff house; (iv) continued exploration of overseas
marketing linkages/opportunities; (v) collaborating with an overseas university to introduce new
varieties of sweet potatoes into Jamaica and clean up good local varieties.
The allocation for the 2016/17 fiscal year is $465.8mn. The major activities to be implemented
include the following: (i) establishment of an Agro Park at Hounslow, St Elizabeth (ii) extension of
the existing irrigation system at Hounslow to an adjacent farming community (iii) completion of
electrical and other finishing works at the packing house at New forest; (iv) procurement of
laboratory equipment and supplies for the Veterinary Services Division (VSD), Food Safety, Plant
Health and MOH laboratories to attain JANAAC accreditation and ISO certification.
INFRASTRUCTURE
For FY 2016/2017 $8,827.0.0mn or $76.5% of the $11,230.0mn allocated to the Ministry of
Economic Growth and Job Creation has been earmarked for works related projects aimed at
developing and improving the country’s infrastructure. Work will continue on two major road
projects and commence one, as well as the construction of the Foreign Affairs Head Office. Details
are as follows:
(a) Major Infrastructure Development Programme (MIDP) – is designed to upgrade 430km of key arterial roads, reconstruction of 27 critical bridges, and implement nine phases of the Jamaica Emergency Employment Programme (JEEP) - effect repairs to community roads, retaining walls

115
and drainage structures. This project is programmed to be implemented over 54 months at a cost of US$352.9mn (US$300.0mn - CHINA EXIM Bank; US$52.9mn GOJ).
Works commenced on this project during FY 2014/15, and the progress to the end of FY 2015/16
include the completion of four of the nine programmed phases of JEEP; completion of 4 of the
27 programmed bridges and rehabilitation of 55 km of the 430km of road.
For FY 2016/2017 a total of $6,977.0mn is allocated to the project to: (i) commence rehabilitation
of eleven prioritized main roads - complete ten prioritized main roads and achieve approximately
10% completion on another; (ii) commence and complete the construction of six bridges; and (iii)
commence and complete phases 7 and 8 of the JEEP component (rehabilitation of community
roads, drainage structures, construction of retaining walls and river training) in 63 constituencies.
(b) Rural Road Rehabilitation Project II (OPEC) - The major objective of this project is to facilitate socio-economic development and integration of four parishes in Jamaica through the rehabilitation of sections of roads in the parishes of Trelawny, Manchester, Clarendon and St. Catherine.
Approximately 22.6km of road works is being undertaken in two packages.
Package 1 Sour Sop Turn – Chapleton – 10.4km and Package 2 – Chapleton – Trout Hall –
12.2km. Completion of approximately 37% of the former was achieved up to the end of
FY 2015/2016 while, the award of a contract to undertake the Package 2 road reconstruction
works – Chapleton – Trout Hall – 12.2km is scheduled for the third quarter of FY 2016/2017.
An allocation of $830.0mn is provided in FY 2016/17 to facilitate the continuation and
completion of the Sour Sop Turn – Chapleton (Package 1) road works contract, and the award of
a contract for the Package 2 works.
(c) Road Rehabilitation Project II (Kuwait) - the major objective of this project is to facilitate economic development/growth through improvements to 4 main roads to support agricultural, industrial and tourism activities in the parishes of St. Mary, St. Ann and Westmoreland.
The 2016/17 allocation to the project is $101.9mnn to facilitate the commencement of:
• road rehabilitation works on the Broadgate to Agualta Vale road section - the first of the 4 targeted road sections - and achieve 10% completion;
• acquisition of land necessary for undertaking the works; and
• the relocation of utilities associated with the works. d) Construction of the Ministry of Foreign Affairs Head Office
116
The primary objective of this project is to provide a customized office facility for the Ministry
of Foreign Affairs and Foreign Trade, which will adequately support its needs in terms of
accommodation of staff, meetings and waiting areas for diplomats and other visitors.
The 2016/17 allocation amounts to $666.1mn to undertake site preparatory works and
commence sub-structure works necessary for the construction of the building.
ENVIRONMENT PROTECTION/ DISASTER MITIGATION AND WATER
Strengthening the Operational and Financial Sustainability of National Protected Areas
This six year project seeks to establish a Protected Area Trust Fund, develop a Protected Area policy
and draft instructions for legislation for Protected Areas is scheduled to end in July 2016.
Achievements under this investment grant include the registering of the Jamaica National Protected
Area Trust Fund, endowment to the Caribbean Biodiversity Fund in the amount of US$1.8mn, and
approval of a master plan by Cabinet.
The 2016/17 allocation of $66.1mn will facilitate the closing out of contracts for consultants,
complete business plans, identify revenue generation mechanisms for funding Protected Areas and
drafting of legislation for Protected Areas.
Jamaica Disaster Vulnerability Reduction Project
The six year project seeks to enhance Jamaica’s resilience to disaster and climate risk by improving
disaster preparedness and response and providing support for transportation, water, flood protection
and sanitation. The project will address key issues relating to these areas in 11 parishes.
The project agreement was signed in 2016 and the 2016/17 allocation of $40.0mn will facilitate data
collection on seismic activity and coastal micro-zonation for Alligator Pond and Savanna-la-Mar.
Rehabilitation of Irrigation Infrastructure
The objective of this project is to reduce water losses and operational costs in the Mid-Clarendon Irrigation System. The 2016/17 allocation to the project is $292.32mn. During the fiscal year, the project will commence the replacement of several hundred lengths of defective pipelines and repair damaged sections of irrigation canals in the Mid-Clarendon Irrigation Area.

117
PUBLIC BODIES
Public Bodies Contribution to Public Sector Investment - FY 2016-17
Public Bodies, defined as statutory bodies, authorities or government companies, continue to play a
critical role in stimulating economic activity and promoting development. Their functions cover a
wide spectrum of activities including developmental, regulatory, social and commercial. Given the
size of some Public Bodies and the diverse nature of activities they undertake across various sectors
of the economy, their contribution to development at both the macro- and micro-economic levels has
over the years been significant.
The Public Bodies contribution to Public Sector Investment is highlighted below:
HIGHLIGHTS
National Housing Trust (NHT)
During the FY 2016/17, the Trust has projected to construct and finance approximately 3,049 housing
starts and 1,799 housing completions. This is in keeping with the Trust’s drive to develop some
9,000 housing solutions by FY 2018/19, which will comprise of houses and residential lots in 42
developments in 11 parishes.
Airports Authority of Jamaica (AAJ)
The implementation of Phase 1B of the 20-year Capital Development Programme (CDP) at the
Norman Manley International Airport will continue to be the primary expenditure for AAJ. Works in
this regard will be undertaken at a cost of $729.4mn, approximately 69% of the total capital
expenditure of $1,052.7mn.
Jamaica Civil Aviation Authority (JCAA)
JCAA’s capital programme includes a major modernization programme in the delivery of Air
Navigation Services in accordance with the International Civil Aviation Organisation (ICAO) Global
Air Navigation Plan (GANP) to meet increased capacity demands of the future. International
standards and recommended practices, as well as technological advancements have resulted in air
navigation and communication equipment being used by JCAA becoming obsolete. Total capital
expenditure of $1,654mn forecasted includes the upgrade of equipment and air navigation services, as
well as engineering maintenance services originally slated for 2015/16.
Port Authority of Jamaica (PAJ)
PAJ plans to focus on developing its core infrastructure assets in its key business segments. This will
result in substantial capital investments in Cargo and Cruise ($1,714.7mn) Business Process
Outsourcing (BPO) ($2,857.3mn), as well as Harbours and Port Services ($3,245.0mn). In addition,

118
PAJ will continue its pursuit for the establishment of a Port Community System ($352.4mn) with the
collaboration of other stakeholders in the industry.
National Water Commission (NWC)
Total capital expenditure of $8,726.3mn will include capital projects which will result in increased
operational efficiency, national coverage & access, quality of service & reliability improvements, as
well as increased compliance. The projects relating to expansion/upgrading of facilities will impact
positively on revenues and cash collections.
Urban Development Corporation (UDC)
A total of $1,194.0mn is budgeted to facilitate UDC’s investments and infrastructural works, as well
as the acquisition of fixed assets.
Jamaica Deposit Insurance Corporation (JDIC)
The JDIC is developing a Payout Management Information System (PMIS) to automate the
computation and disbursement of deposit insurance payments to the depositors of a failed JDIC
Policyholders (financial institutions). The expenditure of $95.0mn will be the commencement of the
phased development of the PMIS.
Jamaica Bauxite Mining (JBM)
The JBM will Partner with the Port Authority of Jamaica to undertake repairs to the Ocho Rios port.
Design works in relation to this project commenced in 2015/16 and are expected to continue into
2016/17. The full project is expected to span a period of approximately 4 years.
National Health Fund (NHF)
NHF has plans for three projects which cost $2,148.3mn for 2016/17. This includes purchase and
deployment of Linear Accelerator cancers machines at a cost of $1,700.0mn, as well as purchase of a
corporate office ($385.0mn) and warehouse renovations ($63.3 mn).
Student Loans Bureau (SLB)
The SLB plans to begin the renovations of its property located at Harbour Street to accommodate its
corporate office and the Bureau expects to spend $94.0mn in 2016/17. In addition, the Bureau also
plans to improve its business processes by automating loan origination, administration, processing,
and servicing activities with the implementation of a new Loans Management System. It is expected
that $54.0mn will be spent on acquiring the system in 2016/17.
Universal Service Fund (USF)
USF plans to expend $240.0mn to acquire a traffic validation system. This system seeks to keep
track of the incoming (terminating) calls to Jamaica and to quantify the amounts due to the

119
government. The combination of hardware and software will be located at the Carrier’s premises and
at the USF.
Factory Corporation of Jamaica (FCJ)
FCJ will undertake the following projects in the short to medium term:
• Development of Information, Communication Technology/Business Processing Outsourcing (ICT/BPO) Park in Naggo Head in St. Catherine. The first phase, which comprises the construction of 120,000 square feet of building space, is scheduled to commence in 2016/17.
• Retrofitting of the Montego Bay Free Zone – this will be undertaken to facilitate the optimal use of the 147,000 square feet of factory space in the ICT/BPO sector.
• Redevelopment and repositioning of Garmex Free Zone to form part of the Logistics Hub, with 15,000 square feet scheduled to undertaken in 2016/17.
• Upgrade and redevelopment of Small Industries Complex (SIC).

120
PSIP CENTRAL GOVERNMENT
FY 2015/2016 – 2019/2020
Total Total Total Total Total Total
Recommended
2016/2017
Projection
2017/2018
Projection
2018/2019
Projection
2019/2020
Projection
2020/2021PROJECTS Funding
Agency
Revised
2015/2016
OFFICE OF THE PRIME MINISTER
Sabina Park Lighting Project GOI/TEF 35,226 0 0 0 0 0
Development of a National Identification System
(Korea Poverty Reduction Fund) KPRF 24,916 14,984 36,630 345,250 550,000 320,000
Projects Managed by JSIF:
Jamaica Disaster Vulnerability Reduction Project IBRD 0 40,000 900,000 1,500,000 1,557,500 1,377,500
Inner City Basic Services IBRD 35,544 0 0 0 0 0
Rural Economic Development Initiative IBRD 351,415 592,795 108,382 0 0 0
Poverty Reduction Project III EU 810,788 93,012 0 0 0 0
Poverty Reduction Project IV EU 100,000 400,000 750,000 564,907 0 0
Community Investment Project CDB 1,955 0 0 0 0 0
Basic Needs Trust Fund (BNTF6) CDB 7,022 0 0 0 0 0
Basic Needs Trust Fund (BNTF7) CDB 320,000 459,860 178,125 0 0 0
Basic Needs Trust Fund (BNTF8) 200,000 0 0 0 0
School Sanitation Programme PDF 90,000 202,500 78,260 156,522 0 0
Jamaica Integrated Community Development Project IBRD 250,156 305,084 700,000 1,000,000 1,300,000 1,000,000
JSIF Project/ Administration Cost GOJ 350,245 0 0 0 0 0
Sub-Total Capital B 2,377,267 2,308,235 2,751,397 3,566,679 3,407,500 2,697,500
Less AIA 90,000 202,500 78,260 156,522 0 0
TOTAL OFFICE OF THE PRIME MINISTER2,287,267 2,105,735 2,673,137 3,410,157 3,407,500 2,697,500
2,293,251
OFFICE OF THE CABINET
Public Sector Transformation and Modernization
Programme (PSTMP)293,557 733,272 724,373 802,674 755,000 250,000
IDB 18,488 0 0 0 0 0
IDB 113,707 242,813 264,206 300,000 270,000 100,000
CHINA 50,000 190,793 199,805 209,282 220,000 100,000
EU 55,000 230,666 200,362 228,392 200,000 50,000
GOJ 56,362 69,000 60,000 65,000 65,000 0
TOTAL OFFICE OF THE CABINET 293,557 733,272 724,373 802,674 755,000 250,000
MINISTRY OF TOURISM
FEMCIDI Craft Enhancement Project OAS 12,800 0 0 0 0 0
Enhancing the Resilience of the Agri Sector and
Coastal Areas Ad/ Fund 8,791 17,000 0 0 0 0
SUB-TOTAL MINISTRY OF TOURISM &
ENTERTAINMENT21,591 17,000 0 0 0 0
Less AIA 3,833 0 0 0 0 0
TOTAL MINISTRY OF TOURISM 17,758 17,000 0 0 0 0

121
PSIP CENTRAL GOVERNMENT
FY 2015/2016 – 2019/2020
Total Total Total Total Total Total
Recommended
2016/2017
Projection
2017/2018
Projection
2018/2019
Projection
2019/2020
Projection
2020/2021PROJECTS Funding
Agency
Revised
2015/2016
MINISTRY OF ECONOMIC GROWTH & JOB
CREATION
General 1,092,527 1,444,116 1,686,632 1,697,000 1,928,000 1,378,200
Understanding Social Effects of Financial Crisis IDB 10,000 10,000 0 0 0 0
Institutional Strengthening of the NAO (formerly
Institutional Strengthening of the PIOJ III) EU 44,555 0 0 0 0 0
Development of National Policy and Plan Action on
International Migration and Development GOJ/ IOM 21,500 26,350 29,000 0 0 0
PPCR II - Improving Climate Data & Information
Management CIF/IBRD 9,001 200,000 259,000 150,000 332,000 368,200
Strategic Statistical Development Project IBRD 7,540 0 0 0 0 0
Economic Partnership (EPA) Capacity Building Project EU 27,960 18,660 0 0 0 0
Economic Partnership II (EPA II) Capacity Building
Project EU 66,509 180,000 180,000 112,000 0 0
Enhancing the Resilience of the Agri Sector and
Coastal Areas AdFund 21,000 19,600 7,500 0 0 0
Jamaica Foundation for Competitiveness and Growth IBRD 874,462 850,000 1,100,000 1,335,000 1,596,000 1,010,000
PIOJ
DBJ
Technical Cooperation Facility (TCF) IV EU 10,000 10,158 0 0 0 0
Technical Cooperation Facility (TCF) V EU 129,348 111,132 100,000 0 0
Works 6,161,904 8,827,277 17,994,949 27,932,075 35,535,284 30,469,709
Southern Coastal Highway Improvement Project 0 40,000 6,178,832 13,819,200 16,964,250 20,102,000
Construction of Ministry of Foreign Affairs Head Office GOJ/PRC 226,463 666,096 940,000 720,000 650,000 0
Islandwide Flood Damage Mitigation & Vector Control 233,764 201,000 0 0 0 0
Palisadoes Shoreline Protection & Rehabilitation
Works Project
GOJ/
CEXIM 11,618 8,000 3,500 3,500 3,500 0
Road Rehabilitation Project II GOJ/
OPEC 357,100 830,000 629,297 826,425 596,684 0
Road Rehabilitation Project (Kuwait) Kuwait 101,974 952,708 1,048,773 0 0
Jamaica Economical Housing Project EX-IM
(China) 1,282,000 0 0 0 0 0
Tropical Storm Nicole Rehabilitation/KMA Drainage
Project) GOJ/CDB 1,000 0 0 0 0 0
Road Improvement Programme GOJ/IDB 4,593 0 0 0 0 0
Transportation Infrastructure Rehabilitation Programme GOJ/IDB 448,878 2,588 0 0 0 0
Major Infrastructure Development Programme GOJ/CHINA
EXIM 3,596,488 6,977,619 9,290,612 11,514,177 17,320,850 10,367,709
Institutional and regulatory Framework for Jamaica's
ICT/BPO Industry CDB 8,600 14,701 699 0 0 0
Loan to PAJ - BPO Expansion 112,240 1,915,832 2,355,468 0 0 0
TOTAL MINISTRY OF FINANCE & THE PUBLIC
SERVICE
3,489,519 7,080,412 5,305,471 2,137,000 2,242,742 1,525,000

122
PSIP CENTRAL GOVERNMENT
FY 2015/2016 – 2019/2020
Total Total Total Total Total Total
Recommended
2016/2017
Projection
2017/2018
Projection
2018/2019
Projection
2019/2020
Projection
2020/2021PROJECTS Funding
Agency
Revised
2015/2016
MINISTRY OF NATIONAL SECURITY
Rehabilitation of Port Royal Jetty GOJ 211,600 0 230,000 270,000 0 0
Construction of JDFLathbury Barracks GOJ 50,000 200,000 598,730 650,963 300,000 0
Purchase and Overhaul of Aircraft GOJ 257,600 100,000 0 0 0 0
Purchase and Overhaul of Ships GOJ 0 350,000 540,000 0 0 0
Acquisition of Vehicles GOJ 897,440 490,000 64,190 53,882 25,760 1,000,000
Upgrade of Telecommunications and Vehicle Tracking
System GOJ 205,872 855,000 337,400 88,400 889,438 1,500,000
Construction and Improvement of Police Stations GOJ 70,000 90,000 120,000 1,000,000
Upgrade of Automated Palm and Fingerprint
Identification System (APHIS) GOJ 30,000 0 0 0 0 0
Constrution and Improvement of Police Buildings GOJ 190,000
Construction and Improvement of Correctional
Facilities GOJ 110,000 253,000 40,000 0 0 0
Justice, Security Accountability and Transparency
Project (JSAT) EU 22,776 177,000 314,653 331,619 349,519 200,000
Rehabilitation & Reintegration of Local Offenders &
Deported Persons Programme FCD/ DFID 7,000 3,000 20,000 0 0 0
Jamaica National Crime Victimization Survey 2015 DFID 0 27,200 0 0 0 0
Jamaica Constabulary Reform Programme DFID 50,000 0 0 0 0 0
Citizens Security and Justice Programme III
GOJ/DFATD
/
IDB
819,236 1,020,000 1,263,275 1,117,906 1,103,599 1,100,000
IDB 160,000 289,636 442,277 325,602 129,660 0
DFATD 332,686 349,837 378,992 357,637 177,307 0
DFID 276,550 327,777 386,355 375,955 196,632 0
GOJ 50,000 52,750 55,651 58,712 600,000 1,100,000
Sub-total National Security 2,661,524 3,665,200 3,478,248 2,602,770 2,788,316 4,800,000
Less AIA 256,600 100,000
TOTAL NATIONAL SECURITY 2,404,924 3,565,200 3,478,248 2,602,770 2,788,316 4,800,000
MINISTRY OF JUSTICE
Construction and Improvement of Courthouses -
Justice Square GOJ 55,235 65,000 250,000 300,000 350,000 2,526,000
Motor Vehicle for Judges 137,029 0 0 0 0
Refurbishing of Hagley Park Road Complex GOJ 30,000 90,679 300,000 400,000 401,000 130,000
Citizens Security and Justice Programme III
GOJ/DFATD
/
IDB
145,000 181,000 238,534 250,547 244,150 186,991
IDB 45,000 63,350 95,300 109,667 103,912 88,722
DFATD 70,000 76,020 83,234 100,880 76,740 51,599
Justice, Security Accountability and Transparency
Project (JSAT): EU 70,065 145,589 258,663 252,880 180,729 0
MOJ 50,065 91,083 220,483 231,055 155,729 0
INDECOM 20,000 54,506 38,180 21,825 25,000 0
Justice Undertakings for Social Transformation CIDA 203,000 125,088 130,000 125,000 135,000 200,000
JCF Accountability Programme (Support to INDECOM) DFID 126,536
Citizens Security and Social Cohesion in Jamaica UNDP 9,477 0 0 0 0 0
Community Empowerment and Transformation
(COMET) Project Phase II USAID 5,000 5,000 0 0 0 0
TOTAL MINISTRY OF JUSTICE 644,313 899,412 1,257,197 1,328,427 1,310,879 3,042,991

123
PSIP CENTRAL GOVERNMENT
FY 2015/2016 – 2019/2020
Total Total Total Total Total Total
Recommended
2016/2017
Projection
2017/2018
Projection
2018/2019
Projection
2019/2020
Projection
2020/2021PROJECTS Funding
Agency
Revised
2015/2016
MINISTRY OF LABOUR & SOCIAL SECURITY
Integrated Social Protection and Labour Programme GOJ/IDB 743,396 243,000 0 0 0 0
Social Protection Project II G0J/IBRD 3,744,970 4,309,847 5,026,634 0 0 0
Support to Improve the Lives of Persons with
Disabilities IDB 23,505 0 0 0 0 0
Developing an Energy Services Company Industry in
Jamaica GOJ/EU 23,145 2,148 0 0 0 0
Social and Economic Inclusion of Persons with
Disabilities JICA/IBRD 72,000 70,877 110,823 0 0 0
Advance Decent Work for Domestic Employees 350 0 0 0 0 0
Integrated Support to Jamaica Social Protection
Strategy IDB 1,098,270 1,599,872 1,716,094 7,032,426 7,339,004 8,000,000
SUB-TOTAL MINISTRY OF LABOUR & SOCIAL
SECURITY5,705,636 6,225,744 6,853,551 7,032,426 7,339,004 8,000,000
Less A/A
TOTAL MINISTRY OF LABOUR & SOCIAL SECURITY 5,705,636 6,225,744 6,853,551 7,032,426 7,339,004 8,000,000
6,223,596
Improvements to the Water Distribution System for the
National StadiumGOJ 0 28,500 0 0 0 0
Upgrading of the National Arena Facility GOJ 60,000 0 0 0 0
Construction of Irrigation Infrastructure for Trelawny
Stadium GOJ 25,000 31,000 0 0 0 0
Revitilization of the Institute of Jamaica JICA 35,000 96,000 0 0 0 0
Addressing the Gap of Gender-based Violence
between the State and Vulnerable women and girls1,500 3,016 0 0 0 0
Sub-Total Capital B 61,500 218,516 0 0 0 0
Less AIA 8,000 30,000
TOTAL MINISTRY OF CULTURE, GENDER,
ENTERTAINMENT & SPORT
53,500 188,516 0 0 0 0
MINISTRY OF EDUCATION, YOUTH &
INFORMATIONEstablishment of Diagnostic Centres (Special
Education)GOJ 13,000 40,600 0 0 0 0
Sanitary Block Project (Renovation/Refurbishing of
Primary Schools) GOJ 47,000 76,000 70,000 75,000 380,000 1,400,000
Early Childhood Partition Project 20,000 0 0 0 0
Technology Management Support Services to the
MOE by E-Learning Jamaica Ltd.
0 0 0 0 0
CASE Facilities Upgrade 50,000 0 0 0 0
Renovation/Refurbishing of Infant Schools GOJ 39,600 50,000 50,000 55,000 60,000 1,500,000
National Education Trust Solar School Project 100,000 500,000 451,000 200,000 800,000
Renovation & Modification of Caenwood Office 175,000 0 0 0 0
Electrical Upgrading Project GOJ 78,400 125,000 0 0 0 0
Education System Transformation Programme IBRD/IDB/
GOJ 678,889 517,160 525,330 0 0 0
IBRD 88,500 0 0 0 0 0
IDB 195,389 0 0 0 0 0
Sub-total 678,889 0 0 0 0 0

124
PSIP CENTRAL GOVERNMENT
FY 2015/2016 – 2019/2020
Total Total Total Total Total Total
Recommended
2016/2017
Projection
2017/2018
Projection
2018/2019
Projection
2019/2020
Projection
2020/2021PROJECTS Funding
Agency
Revised
2015/2016
Early Childhood Development Project IBRD 26,650 36,500 23,000 19,350 0 0
University of Technology Enhancement Project CDB 561,850 626,928 620,000 0 0 0
Primary Education Support Project IDB 107,697 8,707 0 0 0 0
School Feeding Modernization Programme GOJ/IDB 1,685 0 0 0 0 0
Strengthening the School Feeding Programme in
Jamaica0 12,960 0 0 0 0
USAID/MOE Education Partnership for Improved
Reading Outcomes GOJ/USAID 178,589 53,002 0 0 0 0
Promoting Quality Education and Advancing the reality
of a Child Friendly Environment UNICEF 20,000 29,637 0 0 0 0
Technology to Empower Individuals & Communities for
Development
GOJ /B& M
Gates
Found.
146,053 112,048 0 0 0 0
Youth Development Programme 70,249 0 0 0 0 0
Construction of Early Childhood Institutions GOJ/
China 63,710 0 340,000 540,000 400,000 400,000
TOTAL MINISTRY OF EDUCATION, YOUTH &
INFORMATION2,380,932 2,633,542 2,528,330 1,560,350 1,990,000 5,300,000
MINISTRY OF HEALTH
Upgrading of Water Supply System -Bellevue Hospital 24,000 0 0 0 0
Health Services Improvement GOJ/ NHF 1,725,500 1,317,310 1,300,000 1,500,000 1,500,000 1,000,000
Infrastructural/Equipment Improvements 1,280,000 0 0 0 0 0
Purchase of Medical Equipment NHF 100,000 0 130,000 150,000 150,000 500,000
Disease Prevention and Control GOJ 162,500 0 160,000 170,000 170,000 500,000
Inner City Focus GOJ 10,000 4,262 0 0 0 0
UHWI Projects UHWI 173,000 0 0 0 0 0
Transformational Fund Mechanism - Jamaica HIV Global
Fund 368,555 0 0 0 0 0
HIV Prevalence in most-at-risk population reduced USAID 307,977 361,582 274,000 274,000 224,000 300,000
Programme for Reduction of Maternal and Child
Mortality (PROMAC) EU 340,000 501,254 790,092 850,260 508,654 500,000
Establishing Nuclear Medicine Capacity IAEA 5,210
Building Capacity in Drinking Water Quality
Management IAEA 2,300
Institutional Strengthening to Improve National
Surveillance, Prevention and Control of Infectious IDB 20,000 6,855 0 0 0 0
Strengthening of Health Systems in Jamaica IDB 5,000 26,040 0 0 0 0
Support to the National HIV/AIDS Response in
Jamaica (formerly New Funding Mechanism)
Global
Fund 117,121 623,999 731,250 656,853 400,000 800,000
Sub-Total MINISTRY OF HEALTH 2,884,153 2,865,302 3,392,852 3,601,113 2,952,654 3,600,000
Less AIA 1,715,500 1,317,310 1,300,000 1,500,000 1,500,000 1,000,000
TOTAL MINISTRY OF HEALTH 1,168,653 1,547,992 2,092,852 2,101,113 1,452,654 2,600,000

125
PSIP CENTRAL GOVERNMENT
FY 2015/2016 – 2019/2020
Total Total Total Total Total Total
Recommended
2016/2017
Projection
2017/2018
Projection
2018/2019
Projection
2019/2020
Projection
2020/2021PROJECTS Funding
Agency
Revised
2015/2016
MINISTRY OF INDUSTRY, COMMERCE,
AGRICULTURE & FISHERIES
Major Rural Farm Roads Rehabilitation/Devt
Programme459,747 250,000 0 0 0 0
Production Incentives to farmers 325,013 189,000 0 0 0 0
Sugar Transformation Programme GOJ 2,601,446 2,388,269 178,000 2,000,000 2,000,000 3,000,000
Diversification of the Caribbean Livestock Sector
through the Production of Small Ruminants GOJ/CFC 56,621 34,769 0 0 0 0
Agricultural Competitiveness Programme GOJ/IDB 691,177 465,789 50,000 0 0 0
Bannna Accompaning Measures (BAMS) GOJ/EU 172,329 143,595 150,108 0 0 0
Enhancing the Resilience of the Agricultural Sector and
Coastal Areas Ad Fund 126,844 110,427 55,000 0 0 0
Promoting Community Based Climate Resilience in the
Fisheries Sector IBRD 11,000 12,939 52,186 150,000 175,000 550,000
TOTAL MINISTRY OF INDUSTRY, COMMERCE, 4,444,177 3,594,788 485,294 2,150,000 2,175,000 3,550,000
MINISTRY OF SCIENCE, ENERGY & TECHNOLOGY
National Energy Solutions Ltd (formerly REP) 0
E-Learning Project GOJ /USF 950,000 700,000 700,000 700,000 0 0
Energy Security Efficiency Enhancement Project: GOJ/ IBRD 362,040 359,704 70,000 0 0 0
MSTEM 282,040 300,704 70,000 0 0 0
0 0 0 0 0
Energy Efficiency & Conservation Programme 379,832
Establishment of Latin America and the Caribbean
Organisation's (OLADE) OLADE 13,579 7,199 8,000 7,500 0 0
Enhancing the ICT Regulatory Environment IDB 5,017 0 0 0 0 0
Improving Innovation Capacities in the Caribbean GOJ/ ACP
Group 28,914 29,033 0 0 0 0
Youth Employment in Digital and Creative Industuries IBRD 70,000 192,100 200,000 140,000 250,185 200,000
Upgrade to the International Postal System 13,938 38,911 8,724 0 0 0
Sub-Total MINISTRY OF ENERGY, SCIENCE,
TECHNOLOGY & TELECOMMUNICATION1,823,320 1,688,467 1,136,724 847,500 1,250,185 2,200,000
Less A/A 700,000 700,000 700,000 700,000 0 0
TOTAL MINISTRY OF SCIENCE, ENERGY & TECHNOLOGY 1,123,320 988,467 436,724 147,500 1,250,185 2,200,000
MINISTRY OF TRANSPORT & MINING
Portmore Transportation Hub - Feasibility Study 15,586 10,360 0 0 0 0
JUTC - Acquisition of spare parts and special tools GOJ 0 799,425 0 0 0 0
Northern Jamaica Development Project GOJ 0 0 0 0 0 0
Trifold National Transport Repository Project IDB 581 666 0 0 0 0
TOTAL MINISTRY OF TRANSPORT & MINING 2,602,047 1,310,451 0 0 0 0

126
PSIP CENTRAL GOVERNMENT
FY 2015/2016 – 2019/2020
Total Total Total Total Total Total
Recommended
2016/2017
Projection
2017/2018
Projection
2018/2019
Projection
2019/2020
Projection
2020/2021PROJECTS Funding
Agency
Revised
2015/2016
MINISTRY LOCAL GOVERNMENT & COMMUNITY
DEVELOPMENT
Islandwide Flood Damage Mitigation & Vector
Control
NSWMA 77,000 0 0 0 0 0
Parish Councils 182,000 0 0 0 0 0
Acquisition of Garbage Trucks - NSWMA 250,000 0 0 0 0
Fixed Asset Acquisition - Jamaica Fire Brigade 319,867 0 0 0 0
Fixed Asset Acquisition - Ministerial vehicles 14,000 0 0 0 0
Drop-in-Centres - homeless people 24,000 0 0 0 0
Community Based Landslide Risk Reduction GOJ/IBRD 171,541 0 0 0 0 0
Riverton Landfill Access Road Concrete Pavement MEXICAN 30,000 182,500 0 0 0 0
Portmore-Hagen Climate Change Park Germany 0 34,500 31,500 0 0 0
Emerging and Sustainable Citiies Initiative EU 13,266 50,214 215 50,225 120,000 150,000
End of Life Tyre Facility GOJ
5,000
TOTAL MINISTRY OF LOCAL GOVERNMENT & 473,807 880,081 31,715 50,225 120,000 150,000
TOTAL CENTRAL GOVERNMENT 37,396,648 45,350,610 49,468,060 56,593,422 66,390,300 71,788,400
LESS AIA 2,773,933 2,349,810 2,078,260 2,356,522 1,500,000 1,000,000
Loan to PAJ
GRAND TOTAL CENTRAL GOVERNMENT 34,622,715 43,000,800 47,389,800 54,236,900 64,890,300 70,788,400

127
PSIP CENTRAL GOVERNMENT
FY 2015/2016 – 2019/2020
Total Total Total Total Total Total
PUBLIC BODIES
PROJECTS
Funding
Agency
Airport Authority of Jamaica
Terminal Departures Concourse AAJ 7,035 - - 43,400 6,200 -
Terminal Building - Customs Hall AAJ 9,380 247,920 19,520 19,840 - -
Apron Remediation - Repair of cracks AAJ 5,862 - - 7,564 7,564 -
Apron Remediation - Re-seal joints AAJ 8,793 - - - - -
Apron Light Mast - Removal of existing one & replace with
Aluminum AAJ
6,917 - - - -
-
Cargo Logistics Centre Expansion AAJ 87,816 - - - - -
Chilled-water A/C system upgrade & expansion AAJ 77,381 - - - - -
Airport Industrial/Mechanical Support Systems - Incinerator
Rehabilitation AAJ
11,724 - - 59,520 59,520
-
Electrical System Upgrade - Section 1(complete) AAJ 83,478 382,200 - 133,176 133,176 -
Upgrade of Standby Power Generators AAJ 23,449 - - - - -
Second Independent Electrical Power Source -Energy
Management - Study AAJ
11,724 - - - -
-
Airport Information Technology Systems AAJ 83,947 3,240 - - 6,200 -
Environmental Management Programme AAJ 17,587 - - 3,720 -
Fixed Assets Replacement AAJ 196,501 96,000 - - -
WATER SUPPLY, SEWAGE & STORM WATER DRAINAGE AAJ 22,159 - 22,940 4,340 -
REFURBISHMENT OF PROPERTY AAJ 15,476 - - - -
Taxiway Alpha Repairs AAJ 8,442 - - - -
Surface Drainage & Edges- Other Taxiways AAJ 9,966 - - - -
Runway Extension & RESA AAJ 234 - 2,542,000 2,542,000 -
MAJOR MAINTENANCE AAJ 19,463 - 37,200 37,200 -
EAST AIRFIELD DEVELOPMENT- PHASE 1 & HANGERAGE AAJ 23,449 - - - -
AAJ - - - - -
AAJ SubTotal 730,783 729,360 1,440,820 2,865,640 2,799,920 -
Jamaica Civil Aivation Authority (JCAA) - - -
AIM Automation JCAA - 115,031 177,723 - -
ICAO Project Management JCAA 45,577 - - - - -
Radar/Air Nav. And Communication Automation System etc JCAA 724,346 660,050 130,263 - - -
ADS-B Stations JCAA - 17,734 18,266 18,814 19,378 -
SIA ILS Montego Bay JCAA 101,850 - - - - -
Low level wind shear automatic system SIA/NMIA JCAA - 68,002 61,935 - - -
Replacing all Mux-Routers Catalyst Switches JCAA 9,586 4,793 - - - -
NMIA & SIA DVOR Replacement JCAA - - 88,861 137,291 - -
Sustainable Energy-Wind Turbine Mt. Denham; Solar Panels -Ayr
Hill and other sites JCAA - 599 1,234 2,797 2,881 -
Utilization of Dark Fiber to create an alternative Communication
underground path JCAA - 2,636 2,060 - - -
A-G Radio CPDLC Compatible JCAA - - 61,709 - -
Standby Generators at all Radar sites JCAA - 53,921 - - - -
Upgrade A/C - NMIA & Norwood JCAA - 35,947 - - - -
Replacement of High Energy A/C with Inverter type A/C JCAA 42,680 - -
COSPAS SORSAT Search and Rescue system JCAA - 13,749 14,162 - - -
JDF RCC IP Based Voice Communication JCAA - - 3,085 3,178 - -
JDF RCC Air to Ground Radio (VHF) JCAA - - 3,085 3,178 - -
JDF RCC Radar Suite JCAA - - - 20,339 20,950 -
JDF RCC AMHS Terminal JCAA - - 1,234 1,271 - -
Renovation of Space for Training Simulators JCAA - 30,000 - - - -
Demolish & reconstruct building at 2 Winchester Road JCAA - 300,000 330,000 -
IT Network upgrade (Server, Switches & Firewall) JCAA - 47,028 - 65,885 Telephone System (VOIP) JCAA - 25,000 - - - -
Enterprise Prlanning Resource System JCAA - 16,500 - - - -
JCAA - Subtotal JCAA 924,039 1,455,010 893,619 186,868 43,208 65,885
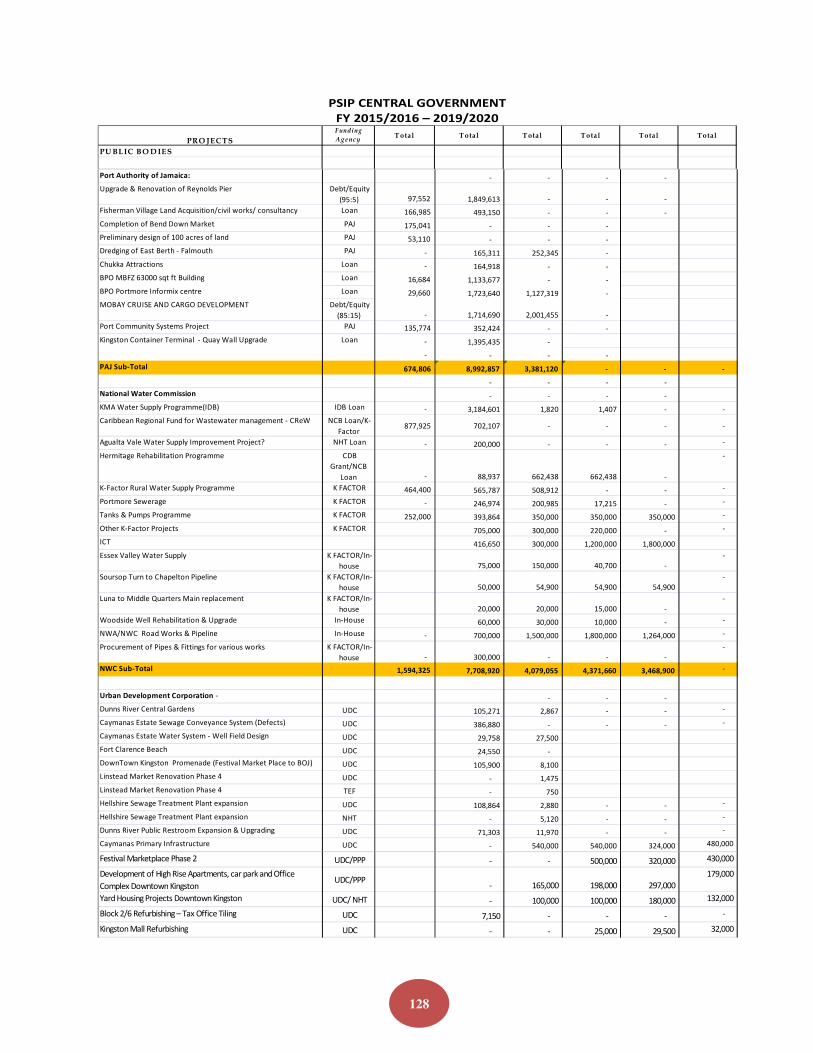
128
PSIP CENTRAL GOVERNMENT
FY 2015/2016 – 2019/2020
Total Total Total Total Total Total
PUBLIC BODIES
PRO JECTS
Funding
Agency
Port Authority of Jamaica: - - - -
Upgrade & Renovation of Reynolds Pier Debt/Equity
(95:5) 97,552 1,849,613 - - -
Fisherman Village Land Acquisition/civil works/ consultancy Loan 166,985 493,150 - - -
Completion of Bend Down Market PAJ 175,041 - - -
Preliminary design of 100 acres of land PAJ 53,110 - - -
Dredging of East Berth - Falmouth PAJ - 165,311 252,345 -
Chukka Attractions Loan - 164,918 - -
BPO MBFZ 63000 sqt ft Building Loan 16,684 1,133,677 - -
BPO Portmore Informix centre Loan 29,660 1,723,640 1,127,319 -
MOBAY CRUISE AND CARGO DEVELOPMENT Debt/Equity
(85:15) - 1,714,690 2,001,455 -
Port Community Systems Project PAJ 135,774 352,424 - -
Kingston Container Terminal - Quay Wall Upgrade Loan - 1,395,435 -
- - - -
PAJ Sub-Total 674,806 8,992,857 3,381,120 - - -
- - - -
National Water Commission - - - -
KMA Water Supply Programme(IDB) IDB Loan - 3,184,601 1,820 1,407 - -
Caribbean Regional Fund for Wastewater management - CReW NCB Loan/K-
Factor 877,925 702,107 - - - -
Agualta Vale Water Supply Improvement Project? NHT Loan - 200,000 - - - -
Hermitage Rehabilitation Programme CDB
Grant/NCB
Loan - 88,937 662,438 662,438 -
-
K-Factor Rural Water Supply Programme K FACTOR 464,400 565,787 508,912 - - -
Portmore Sewerage K FACTOR - 246,974 200,985 17,215 - -
Tanks & Pumps Programme K FACTOR 252,000 393,864 350,000 350,000 350,000 -
Other K-Factor Projects K FACTOR 705,000 300,000 220,000 - -
ICT 416,650 300,000 1,200,000 1,800,000
Essex Valley Water Supply K FACTOR/In-
house 75,000 150,000 40,700 -
-
Soursop Turn to Chapelton Pipeline K FACTOR/In-
house 50,000 54,900 54,900 54,900
-
Luna to Middle Quarters Main replacement K FACTOR/In-
house 20,000 20,000 15,000 -
-
Woodside Well Rehabilitation & Upgrade In-House 60,000 30,000 10,000 - -
NWA/NWC Road Works & Pipeline In-House - 700,000 1,500,000 1,800,000 1,264,000 -
Procurement of Pipes & Fittings for various works K FACTOR/In-
house - 300,000 - - -
-
NWC Sub-Total 1,594,325 7,708,920 4,079,055 4,371,660 3,468,900 -
Urban Development Corporation - - - -
Dunns River Central Gardens UDC 105,271 2,867 - - -
Caymanas Estate Sewage Conveyance System (Defects) UDC 386,880 - - - -
Caymanas Estate Water System - Well Field Design UDC 29,758 27,500
Fort Clarence Beach UDC 24,550 -
DownTown Kingston Promenade (Festival Market Place to BOJ) UDC 105,900 8,100
Linstead Market Renovation Phase 4 UDC - 1,475
Linstead Market Renovation Phase 4 TEF - 750
Hellshire Sewage Treatment Plant expansion UDC 108,864 2,880 - - -
Hellshire Sewage Treatment Plant expansion NHT - 5,120 - - -
Dunns River Public Restroom Expansion & Upgrading UDC 71,303 11,970 - - -
Caymanas Primary Infrastructure UDC - 540,000 540,000 324,000 480,000 Festival Marketplace Phase 2 UDC/PPP - - 500,000 320,000 430,000
Development of High Rise Apartments, car park and Office
Complex Downtown Kingston UDC/PPP
- 165,000 198,000 297,000
179,000
Yard Housing Projects Downtown Kingston UDC/ NHT - 100,000 100,000 180,000 132,000
Block 2/6 Refurbishing – Tax Office Tiling UDC 7,150 - - - -
Kingston Mall Refurbishing UDC - - 25,000 29,500 32,000

129
PSIP CENTRAL GOVERNMENT
FY 2015/2016 – 2019/2020
Total Total Total Total Total Total
PUBLIC BODIES
PROJECTS
Funding
Agency
Dunns River Central Gardens product line expansion UDC - - 10,000 13,000 15,000
Pearly Beach Product line expansion UDC - 40,000 - - -
St. Thomas, Clarendon, Westmoreland for future development
and parking/transportation management UDC
- 30,000 31,000 34,500
38,000
Development of towns in St. Thomas, Westmoreland, Manchester
and Clarendon UDC
- - 35,000 48,000
51,500
Fort Clarence Beach Park Upgrade UDC
- 25,000 25,000 -
-
MoBay Waterfront Protection Infrastructure UDC/TEF
72,510 75,000 75,000 -
-
Dunns River Beach Replenishment UDC 65,920 75,000 75,000 - -
Winnifred Beach Infrastructure UDC - 50,000 50,000 - -
Dunn River Repaving of Exit Driveway & Courtyard UDC 44,000 - - - -
Ocho Rios Commercial Centre Repaving of Eastern Car Park &
Complex Repainting UDC
31,950 750 - -
-
UDC Sub-Total - 1,054,056 1,161,412 1,664,000 1,246,000 1,357,500
-
NATIONAL HOUSING TRUST
Small Contractors Programme
Cherry Gardens, St. Catherine NHT 230,000 - - - - -
Nashville, St. Mary NHT 253,300 225,000 - - - -
Longville 3A Clarendon NHT - 95,000 - - - -
Granville, Trelawny NHT - 30,000 120,000 - - -
Masemure, Westmoreland NHT - 30,000 135,000 - - -
Longville 2A Clarendon NHT - - 60,000 - - -
Darliston, Westmoreland NHT - - 209,000 - - -
The Villages of Colbeck, Clarendon NHT - - 467,500 735,000 - -
Monymusk Country Estate, Clarendon NHT - - 135,000 - - -
Friendship Phase 1, St. Elizabeth NHT - - - 210,000 - -
Sheckles 1, Clarendon NHT - - 75,000 - - -
Sheckles 2, Clarendon NHT - - - - 475,000 200,000
NHT Joint Venture
The Villages of Colebeck Castle - Ph 1 & 2, Clarendon NHT 167,450 799,090 160,000 20,000 - -
Monymusk Country Estate NHT 8,400 350,000 30,000 41,000 5,000 -
The Villages of Colebeck Castle - Ph 3, Clarendon NHT - 10,000 664,000 181,600 40,000 -
Friendship - Phase 1, St. James NHT 400,000 1,000,000 2,200,000 200,000 50,000 -
The Villages of Colebeck Castle - Ph 4, Clarendon NHT - - - 5,000 371,000 123,000
Projects to be determined NHT - - - 400,000 - -
NHT Projects - General
Balaclava, St. Elizabeth NHT 28,810 - - - - -
Barrett Hall Phase 1 NHT 3,160 17,800 1,000,000 1,200,000 - -
Barrett Hall Phase 2 NHT - - 10,000 30,000 - -
Darliston NHT 5,690 30,300 58,000 2,000 - -
Dry Valley - Phase 1 NHT 2,070 25,000 170,000 680,000 680,000 340,000
Eltham Farms, St. Catherine NHT 177,500 180,000 12,000 - 2,000 -
Friendship - Phase 1, St. Elizabeth NHT - 60,650 480,000 30,000 1,500 -
Friendship - Phase 2, St. Elizabeth NHT - - 10,000 70,000 200,000 19,000
Granville, Trelawny NHT 76,000 80,000 7,500 2,000 - -
Hellshire 2, St. Catherine NHT 3,080 151,800 105,000 10,000 - -
Hellshire 3, St. Catherine NHT 700 106,500
Industry Cove, Hanover NHT 8,550 64,400
Longville 3A Clarendon NHT 18,050 1,200
Longville 2A Clarendon NHT 42,060 327,100 Longville 4A Clarendon NHT 47,410 28,000
Longville 4B Clarendon NHT - -
Mary Field, St. Catherine NHT 46,970 52,000
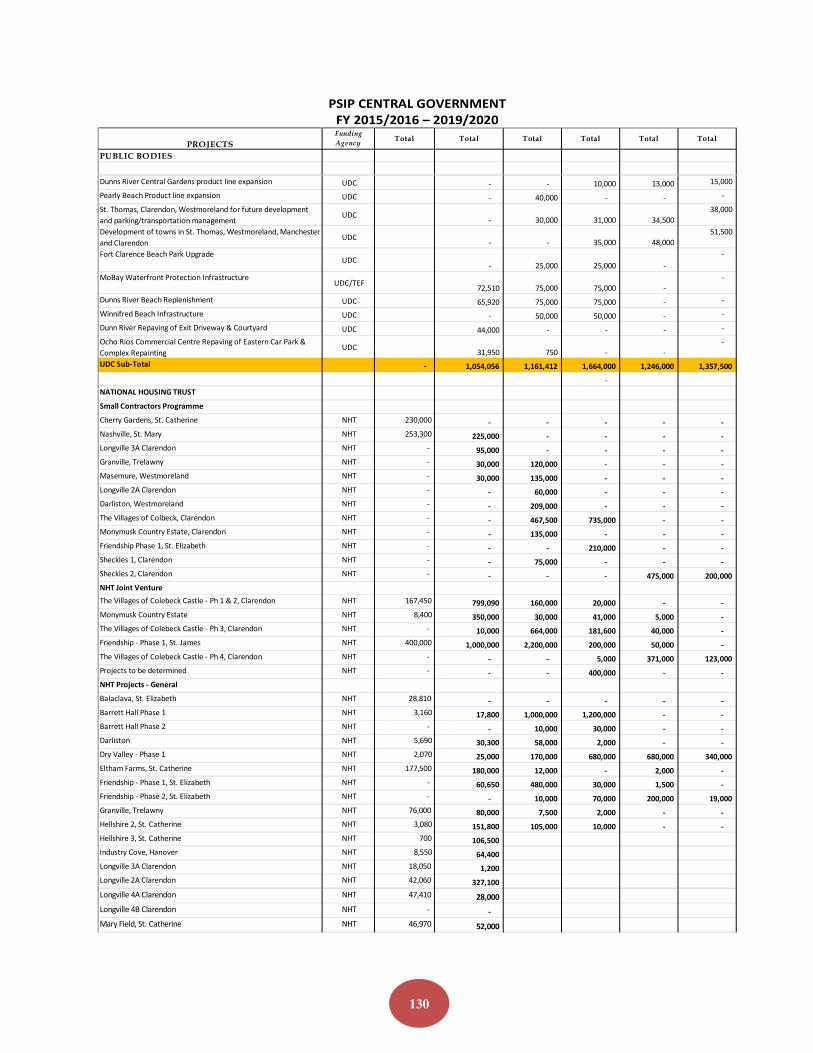
130
PSIP CENTRAL GOVERNMENT
FY 2015/2016 – 2019/2020
Total Total Total Total Total Total
PUBLIC BODIES
PROJECTS
Funding
Agency
Dunns River Central Gardens product line expansion UDC - - 10,000 13,000 15,000
Pearly Beach Product line expansion UDC - 40,000 - - -
St. Thomas, Clarendon, Westmoreland for future development
and parking/transportation management UDC
- 30,000 31,000 34,500
38,000
Development of towns in St. Thomas, Westmoreland, Manchester
and Clarendon UDC
- - 35,000 48,000
51,500
Fort Clarence Beach Park Upgrade UDC
- 25,000 25,000 -
-
MoBay Waterfront Protection Infrastructure UDC/TEF
72,510 75,000 75,000 -
-
Dunns River Beach Replenishment UDC 65,920 75,000 75,000 - -
Winnifred Beach Infrastructure UDC - 50,000 50,000 - -
Dunn River Repaving of Exit Driveway & Courtyard UDC 44,000 - - - -
Ocho Rios Commercial Centre Repaving of Eastern Car Park &
Complex Repainting UDC
31,950 750 - -
-
UDC Sub-Total - 1,054,056 1,161,412 1,664,000 1,246,000 1,357,500
-
NATIONAL HOUSING TRUST
Small Contractors Programme
Cherry Gardens, St. Catherine NHT 230,000 - - - - -
Nashville, St. Mary NHT 253,300 225,000 - - - -
Longville 3A Clarendon NHT - 95,000 - - - -
Granville, Trelawny NHT - 30,000 120,000 - - -
Masemure, Westmoreland NHT - 30,000 135,000 - - -
Longville 2A Clarendon NHT - - 60,000 - - -
Darliston, Westmoreland NHT - - 209,000 - - -
The Villages of Colbeck, Clarendon NHT - - 467,500 735,000 - -
Monymusk Country Estate, Clarendon NHT - - 135,000 - - -
Friendship Phase 1, St. Elizabeth NHT - - - 210,000 - -
Sheckles 1, Clarendon NHT - - 75,000 - - -
Sheckles 2, Clarendon NHT - - - - 475,000 200,000
NHT Joint Venture
The Villages of Colebeck Castle - Ph 1 & 2, Clarendon NHT 167,450 799,090 160,000 20,000 - -
Monymusk Country Estate NHT 8,400 350,000 30,000 41,000 5,000 -
The Villages of Colebeck Castle - Ph 3, Clarendon NHT - 10,000 664,000 181,600 40,000 -
Friendship - Phase 1, St. James NHT 400,000 1,000,000 2,200,000 200,000 50,000 -
The Villages of Colebeck Castle - Ph 4, Clarendon NHT - - - 5,000 371,000 123,000
Projects to be determined NHT - - - 400,000 - -
NHT Projects - General
Balaclava, St. Elizabeth NHT 28,810 - - - - -
Barrett Hall Phase 1 NHT 3,160 17,800 1,000,000 1,200,000 - -
Barrett Hall Phase 2 NHT - - 10,000 30,000 - -
Darliston NHT 5,690 30,300 58,000 2,000 - -
Dry Valley - Phase 1 NHT 2,070 25,000 170,000 680,000 680,000 340,000
Eltham Farms, St. Catherine NHT 177,500 180,000 12,000 - 2,000 -
Friendship - Phase 1, St. Elizabeth NHT - 60,650 480,000 30,000 1,500 -
Friendship - Phase 2, St. Elizabeth NHT - - 10,000 70,000 200,000 19,000
Granville, Trelawny NHT 76,000 80,000 7,500 2,000 - -
Hellshire 2, St. Catherine NHT 3,080 151,800 105,000 10,000 - -
Hellshire 3, St. Catherine NHT 700 106,500
Industry Cove, Hanover NHT 8,550 64,400
Longville 3A Clarendon NHT 18,050 1,200
Longville 2A Clarendon NHT 42,060 327,100 Longville 4A Clarendon NHT 47,410 28,000
Longville 4B Clarendon NHT - -
Mary Field, St. Catherine NHT 46,970 52,000

131
PSIP CENTRAL GOVERNMENT
FY 2015/2016 – 2019/2020
Total Total Total Total Total Total
PUBLIC BODIES
PROJECTS
Funding
Agency
Perth 1A, Manchester NHT 7,170 7,700
Perth 2 - Villages 1-5, Manchester NHT 57,170 20,000
Sevens Village1, Clarendon NHT 88,170 100,000
Sheckles 1, Clarendon NHT 2,000 52,000
Sheckles 2, Clarendon NHT 10,970 8,500
Twickenham Park Phase 4, St. Catherine NHT 8,050 10,400
Windsor - Duncans, Trewlawny NHT 2,070 44,200
Ruthven Road Phase 1 NHT 44,260 327,700
Ruthven Road Phase 2 NHT 18,000 -
Vineyard Town - Central Avenue NHT 10,930 37,100
Vineyard Town - Third Avenue NHT - 30,100
Projects to be determined NHT - -
INNER CITY HOUSING / COMMUNITY RENEWAL PROG. -
Majesty Gardens NHT 171,000 112,000
White Wing NHT 270,000 119,000
Maxfield Park (Frog City) NHT 192,000 138,000
Arnold Road NHT 156,000 69,000
Rasta City NHT 144,000 15,000
St. Andrew Town NHT 4,000 -
Mona Commons NHT 12,000 -
SUGAR HOUSING PROGRAMME -
Perins Compound - Phase 1, Clarendon NHT 16,330 61,400
Perins Compound - Phase 2, Clarendon NHT - -
Jacksonville, Clarendon NHT 6,600 114,100
Yeast Plant, Westmoreland NHT 10,300 57,500
Fontabelle, Westmoreland NHT 15,470 90,900
Shewsbury, Westmoreland NHT 10,500 80,500
Barham NHT 7,100 60,280
Masemure, Westmoreland NHT 14,430 137,300
FIRST STEP HOUSING PROGRAMME -
Bourkesfield, St. Catherine NHT 49,000 27,750
Orange Park, St. Catherine NHT 56,000 33,600
Caymanas, St. Catherine NHT 20,000 -
Reddington, St. Mary NHT 65,000 74,000
Jacksonville, Clarendon NHT - -
Shrewsbury, Westmoreland NHT - -
Barham, Westmoreland NHT - -
Masemure, Westmoreland NHT - -
Yeast Plant, Westmoreland NHT - -
The Villages of Colebeck, Clarendon NHT - -
Monymusk Country Estate, Clarendon NHT - -
Granville, Trelawny NHT - -
Friendship Phase 1, St. Elizabeth NHT - -
Sevens, Village 1, Clarendon NHT - -
Sheckles 2, Clarendon NHT - -
1st Step (FFTP) Programme (BOL - 40%) NHT 58,630 111,000
- - - - -
NHT TOTAL 3,046,350 5,602,870 14,156,190 15,685,010 12,995,700 5,622,000

132
PSIP CENTRAL GOVERNMENT
FY 2015/2016 – 2019/2020
Total Total Total Total Total Total
PUBLIC BODIES
PROJECTS
Funding
Agency
Jamaica Bauxite Mining (JBM) - Port repairs (Ocho Rios) JBM - 120,000 120,000 120,000 120,000 -
Petroleum Corporation of Jamaica (PCJ) - Laughlands 2
MegaWatt HydroPower Plant PCJ 1,100 16,690 734,550
Jamaica Deposit Insurance Corporation
PAYOUT MANAGEMENT INFORMATION SYSTEM (PMIS) JDIC 19,370 95,030 23,900 - -
-
National Health Fund (NHF)
LINEAR ACCELERATOR (LINAC) Project
NHF/CHASE
/TEF - 1,700,000 - - - -
Corporate Office Space NHF/LOAN 150,000 385,000 200,000 200,000 - -
NHF Warehouse Renovation NHF 63,300 - - - -
National Health Fund (NHF) 150,000 2,148,300 200,000 200,000 - -
- -
Universal Service Fund (USF) - Traffic Validation USF 240,000
- -
Students Loan Bureau (SLB) - -
New Loans Management Sytem SLB 53,610 - - -
Renovation of Building at 82-86 Harbour Street, Kingston SLB 94,000 - -
Students Loan Bureau (SLB) 147,610 - - - -
Factory Corporation of Jamaica (FCJ) - - -
CEZ Project Loan/FCJ - - - -
New Building - Naggo Head ICT Park Loan/FCJ 29,000 50,000 650,000 1,170,000 1,700,000
Garmex FCJ 156,000 660,000 495,000 530,000
Mobay Freezone FCJ 180,000 108,000 158,000 240,000
FCJ Total 29,000 386,000 1,418,000 1,823,000 2,470,000 -
TOTAL PUBLIC BODIES 7,169,773 28,696,703 27,608,666 26,916,178 23,143,728 7,045,385
Grand Total PSIP 41,792,488 71,697,503 74,998,466 81,153,078 88,034,028 77,833,785

133
Appendix VII
Fiscal Risk Statement
The Fiscal Responsibility Framework (FRF) Regulations 2012 requires that the FPP provide a broad
assessment of the risks to the fiscal operations, including those associated with the price of oil and
other key natural resources, external and domestic demand, domestic inflation, external and domestic
interest rates, natural disasters, contingent liabilities, and guarantees with respect to fiscal policy
measures.
The September 2015 Fiscal Policy Paper Interim Report highlighted a number of fiscal risks and
indicated that these risks will be expanded upon in the February 2016 FPP. This Fiscal Risk
Statement therefore outlines the GOJ’s exposure to fiscal risks originating from various sources such
as the macroeconomic assumptions used in preparing the FY 2016/17 budget and medium term
projections, public debt dynamics, the operations of state owned enterprises as well as public-private
partnerships (PPP) and contingent liabilities.
For the purpose of this statement, fiscal risks refer to the probability of deviations of fiscal outturns or
other fiscal forecasts from expectations or budget. This Fiscal Risk Statement notes the major risks
the MOFPS/GOJ is monitoring and provides a general outline on how fiscal risks may originate from
numerous sources and how their impact can be transmitted to the fiscal framework. The Statement
also describes each category of risks, quantifying them where practicable and outlining the risk
management strategies which are already in place or which are being explored to cushion the fiscal
programme from any realization of these risks.
Fiscal Risk Sources and Disclosure
Fiscal risks may emanate from a wide range of sources and Box VII (A) highlights some of these
sources currently being monitored and managed by the MOFPS.
The GOJ’s estimates of revenue and expenditure and medium term projections prepared for the FY
2016/17 Budget are underpinned by a range of economic and other assumptions and therefore reflect
the best information available at the time of preparation. If the economic outturns vary from those
utilized in preparing the budget, then their impact will flow through to actual government revenue
and expenditure. The probability of deviations in these parameters that inform the budget therefore
represents a risk to the fiscal estimates programmed and the risk gets progressively larger for the
latter years of the medium term programme.

134
Box VII(A): Sources of Fiscal Risks
• Judicial Awards
• Wage settlements
• Un-Budgeted Obligatory Expenditures
• Transfer/Subsidies
o Assumption of Public Bodies debt
o Financial Assistance to Public Bodies
• Tax Expenditure (Discretionary)
• Guarantees:
o Interest
o Amortization
• Arrears/Pending Obligations:
o Wages & Salaries
o Other Expenditure Arrears
o Tax Refund Arrears
• Public Private Partnership
• Adverse macroeconomic developments
o Commodity Price movements eg. oil, bauxite
o Exchange rate, inflation, interest, real GDP
• Natural Disasters
• Government Policy Changes
• Monetary Policy
Source: MOFPS
Macroeconomic Risks
Economic Growth
The GOJ’s tax revenue is largely linked to nominal GDP growth (which encompasses real GDP
growth and inflation). Therefore, any variation in outturn of real GDP or inflation from forecast
would lead to deviation in tax revenue from budget. An assessment of the one-year growth
projections for the period FY 2012/13 to FY 2015/16 reported in successive FPP publications reveal
that actual annual growth has consistently been below projection, with FY 2013/14 being an
exception with actual real growth being greater than projection (see table II (a)). This
underperformance in growth occurred against the backdrop of a weak global environment, prolonged
drought conditions in the domestic economy, high oil prices, and robust fiscal consolidation.

135
Table II (a): Nominal and Real GDP Growth Projection vs. Actual
Nominal GDP Growth (%) Real GDP Growth (%)
Period Projection Actual
Percentage
Point
Change Projection Actual
Percentage
Point Change
FY 2012/13 7.3 6.2 -1.1 1.0 -0.8 -1.8
FY 2013/14 10.4 9.4 -1.0 0.8 1.0 0.2
FY 2014/15 9.6 6.9 -2.7 1.4 0.2 -1.2
FY 2015/16 7.3 4.3 -3.0 1.6 0.9 -0.7
Source: STATIN/PIOJ
These unexpected changes in growth outturn imply substantial fiscal risk for Jamaica. Most of the
GOJ’s tax revenue items have a one-to-one relationship with changes in GDP. That is, if forecasted
nominal GDP growth varies by 1 percentage point, it is expected that most tax revenue items will also
change by 1 percentage point in the same direction of the change in nominal GDP. For FY 2016/17,
nominal GDP growth is forecasted at 5.2%. Thus if nominal GDP were to grow at 4.2%, tax revenue
would be expected to fall by $2,291.6mn, assuming all else remains constant.
It is also important to note that growth in the Jamaican economy is linked to the economic activities
of its major trading partners, notably the US economy. The IMF’s January 2016 publication of the
World Economic Outlook Update reported that economic activity in the US is expected to gradually
improve during 2016. If this expectation holds, then this could result in positive spill-overs for the
Jamaican economy. Similarly, lower than expected growth in the US will be expected to have a
negative effect on Jamaica’s economy, and hence on revenue collections, the budget balance and debt
levels.
As a first step in sound fiscal management and in the GOJ’s risk mitigation strategy, prudent
projections for real GDP growth and inflation are utilized for the fiscal projections. For example, the
range of potential projects noted in the Growth Agenda is not factored into the real GDP forecasts
presented in the Macroeconomic Framework. The GOJ’s mitigating strategy encompasses three
elements: (i) a fairly conservative approach to the forecast of real growth and inflation; (ii) the
aforementioned one-for-one relationship between GDP growth and revenue used in forecasting and
impact analysis, represents a prudent valuation of the linkage between the real and fiscal sectors; and
(iii) prudent management of GOJ’s cash resources, which involves proactive action to constrain
expenditure if revenue performs below expectations.
136
Commodity Prices
Oil Prices
Crude oil prices, which have been on the decline since the second half of 2014, largely reflect
expectations of sustained increases in production by the Organization of Petroleum Exporting
Countries (OPEC) members despite global supplies outstripping demand. Oil prices are expected to
remain low over the medium term with futures market suggesting only modest increases in prices in
2016 and 2017. For oil-importing countries like Jamaica, this sharp decrease in oil prices have
contributed to a lower inflation rate, a narrowing of the current account deficit and an improvement in
the fiscal balance. Households and businesses benefit from reduced oil prices through reduced
energy and transportation costs, thereby increasing the disposable income of household and boosting
business profitability. This benefit on household and businesses is expected to have an impact on
government revenue.
Changes in oil prices will directly impact both government revenue and expenditure. As it relates to
revenue, this direct impact is reflected mainly in SCT collections on petroleum and petroleum
products. The structure of the SCT on petroleum and petroleum products helps to buffer the impact
of a reduction in oil prices on revenue collections as a portion is fixed and the remainder advalorem.
The fixed portion of the SCT contributed an estimated 74.9% of the total SCT collections for
FY 2015/16. On the expenditure side, lower oil prices will contribute to reduced transportation and
energy cost for the government, thereby reducing overall “housekeeping” expenses.
It should be noted that the GOJ is cognizant of the generally high levels of uncertainty in oil supply
forecast and the risk that prices could rebound faster than expected over the medium term.
Volatilities could arise from geopolitical tensions and changes in the supply conditions by OPEC and
non-OPEC members.
In June 2015, the GOJ entered into a set of hedging contracts to provide coverage of 8 million barrels
of crude oil imports to Jamaica over a period of 18 months, from June 2015 to December 2016. The
weighted average premium cost for the contracts was US$3.48/barrel at a weighted average strike
price of US$66.53/barrel. With the current medium term forecast for oil prices to remain low (below
the average strike of US$66.53/barrel), it is not expected that the GOJ will enter into a new set of
hedging contracts after the expiration of the current contracts by December 2016. The GOJ will
however monitor and assess developments in world oil prices and the market, and if deemed
appropriate, will consider a future hedge arrangement.

137
Bauxite/Alumina Prices
Aluminium prices continue to fall on the world market largely due to ongoing oversupply from
China. This had a negative impact on the price of bauxite, the ore used to produce alumina and
ultimately aluminium, resulting in reduced revenue collections from the bauxite levy. The falling
prices have also adversely impacted investment decisions leading to curtailment/cutback in
production. For FY 2015/16, the central government collection from bauxite levy was $2,116.9mn or
55.7% below the budgeted amount. As a result of this lower than expected performance of the
bauxite levy, the GOJ has made appropriate budgetary adjustments through cuts to primary
expenditure and tapping other revenue sources to ensure that the primary surplus target is maintained.
Interest Rates
Interest rate risks refer to the risk that arises from having higher than expected debt service as a result
of increases in interest rates. The Public Debt Management Act, 2012 (PDMA) requires that the
government prepare annually the Medium Term Debt Management Strategy (MTDS) outlining the
optimal strategy, given the macroeconomic environment, to facilitate the reduction of the public debt
to a sustainable level. This objective is to be achieved at minimum cost and prudent levels of risk.
The MTDS for FY 2016/17 – FY 2018/19 aims to: (i) mitigate foreign exchange risks; (ii) manage
interest rate risk; (iii) extend maturity profile; (iv) develop a monitoring framework for guaranteed
and non-guaranteed debt; and (v) promote the development of the domestic capital market.
The GOJ’s debt portfolio is exposed to interest rate risks. Table II (b) below shows the interest rate
composition of the GOJ’s debt stock as at end-March 2016:
Table II (b): Interest Rate Composition of Debt Stock
end-March 2016
Total Debt (%)
Fixed Rate 65.4
Floating Rate 34.6
Domestic Debt
Fixed Rate 58.7
Floating Rate 41.3
External Debt
Fixed Rate 69.8
Floating Rate 30.2
Source: MOFPS
With a larger share of the portfolio contracted on a fixed rate basis, for both domestic and external
debt, this allows for greater predictability and certainty of the interest cost for the budget. The GOJ’s
benchmark for the fixed/variable rate portfolio mix is 70:30.

138
The GOJ’s strategy to manage the interest rate risk, as outlined in the MTDS
FY 2016/17 – FY 2018/19 is to maintain the fixed/floating rate composition on the domestic portfolio
during FY 2016/17 in order to optimize on the interest rate structure of the portfolio and based on
investor demand for fixed rate debt.
On the external side, international interest rates are currently very low but are expected to rise in the
near future. With this uncertainty surrounding global interest rates, the MTDS FY 2016/17 –
FY 2018/19 outlines that the GOJ’s strategy will be to only issue fixed rate debt in the external
market.
With respect to broader fiscal impact, there is a negative correlation between interest rates and the
fiscal balance. With the medium term projections showing lower interest rates, interest cost will
reduce and hence result in an improvement in the fiscal balance.
Exchange Rates
Exchange rate risk refers to the risk that the fiscal and debt profile will deteriorate as a result of a
depreciation of the Jamaica dollar against other relevant currencies. The share of foreign currency
debt in the total debt portfolio is a good measure of the foreign currency risk. Currently, the US
dollar still remains the major currency in Jamaica’s debt portfolio, followed by the Jamaica dollar and
the Euro currency accounting for the third largest share. As at end-March 2016, 64.0% of the GOJ’s
total debt portfolio was denominated in foreign currency compared to the 60.9% recorded at end-
March 2015. This therefore represents a 3.1 percentage point increase in the GOJ’s exposure to
foreign exchange risk.
For the fiscal year to end-March 2016 the Jamaica dollar depreciated by 6.1% vis-à-vis the US dollar,
moving from J$115.04=US$1.00 to J$122.04=US$1.00, and contributing an additional $75.9bn to the
debt stock. This highlights Jamaica’s high exposure to exchange rate risk. It is, however, important
to note that Jamaica’s domestic capital market is not sufficiently deep and liquid enough to
accommodate the GOJ’s demand for financing without causing adverse movements in domestic
interest rates and crowding out of the domestic private sector. In addition, domestic investors have
expressed their interest to diversify their portfolios by holding foreign currency assets.
During FY 2015/16, the GOJ was able to significantly reduce the foreign exchange risk in its
domestic debt portfolio, moving from a share of 24.3% of domestic debt denominated in foreign
currency as at end-March 2015 to a share of 8.6% of domestic debt denominated in foreign currency
as at end-March 2016. This 15.7 percentage point reduction was achieved through the government
being able to extinguish 74.2% of its debt owed to the PetroCaribe Development Fund (PCDF) in the
Petrocaribe Liability Management Transaction during the second quarter of the fiscal year.
The MTDS FY 2016/17 – FY 2018/19, outlines that the GOJ’s strategy for FY 2016/17 is to maintain
the proportion of foreign currency denominated debt in the domestic portfolio. The foreign currency
debt portion of the debt portfolio is expected to increase marginally, but will remain within the

139
targeted range of 61.0% to 65.0%. It is important to note that a natural hedge against foreign
currency risk lies in the fact that Jamaica’s major export revenues are earned in US dollars and its
international reserves are held in US dollars.
On the fiscal side, changes in the exchange rate translate directly into changes in the government tax
collections. As it relates to international trade taxes, for a given level of imports and non-direct export
taxes, a depreciation in the Jamaica dollar vis-à-vis the US dollar would increase the base of trade
taxes in Jamaica dollar terms. For taxes on goods and services (indirect taxes), a depreciation in the
Jamaica dollar vis-à-vis the US dollar would result in increased collections in taxes by JCA. The
GOJ’s Grant receipts are also positively impacted from exchange rate depreciation as a result of
higher domestic currency values.
Overall, depreciation in the value of the Jamaica dollar has a negative impact on the fiscal balance
through its huge effect on debt service. However, higher tax revenue collections will partly offset
this higher debt service cost. A previous exercise done by the MOFP to assess the fiscal impact of a
sharp exchange rate depreciation indicated that the primary surplus improved due to higher revenue
outweighing non-debt (primary) expenditure, while the fiscal deficit worsened due to higher interest
cost. While revenue/GDP improved, this was countered by an increase in expenditure/GDP, thus
worsening the deficit and the debt. Further work is to be undertaken to continually assess this impact
of exchange rate depreciation.
Contingent Liabilities
Contingent liabilities have the potential to cause severe strain on the fiscal resources as they expose
the government to unexpected and substantial obligations over a short period of time.
Natural Disasters
Jamaica’s location in a multi-hazard zone makes it quite susceptible to natural disasters, mainly
hurricanes, excess rainfall, flooding, earthquakes and drought. One mechanism that Jamaica has used
to manage losses from catastrophic events is through its insurance policy with the Caribbean
Catastrophe Risk Insurance Facility Segregated Portfolio Company (CCRIF SPC) (formally the
Caribbean Catastrophe Risk Insurance Facility). The CCRIF SPC is an insurance facility that will
provide rapid pay-outs to help member countries finance their initial disaster response and maintain
basic government functions after a catastrophic event. CCRIF SPC will make pay-outs within 14 days
after a hazard event triggers a country’s policy. A country’s policy is triggered when a pre-
established trigger event loss is attained.
Prior to CCRIF SPC 2015/16 policy year, which started June 1, 2015, the CCRIF SPC facility that
Jamaica had been using only provided coverage for hurricanes/tropical cyclones (TC) and
earthquakes (EQ) - TC/EQ of a predefined magnitude. For the 2015/16 policy year, Jamaica, after

140
careful risk assessment, expanded the coverage to include excess rainfall at an additional cost of
US$1.7mn. This excess rainfall coverage enhances the existing options as it provides protection
against damage resulting from extreme rainfall events causing floods and landslides. Overall, for the
2015/16 policy year, Jamaica purchased coverage for the impacts of tropical cyclones, earthquakes
and excess rainfall peril at a cost of US$3.7mn. The provision for FY 2016/17 is US$4.0mn.
Estimates of the cost of damage caused by recent natural disasters are set out in
Table II (c).
Table II (c): Selected Natural Disasters and Estimated Economic Impact
Event Year Intensity Cost (J$bn) Impact
(%GDP)
Hurricane Michelle 2001 Category 4 2.52 0.8
May/June Flood Rains 2002 - 2.47 0.2
Hurricane Charley 2004 Category 4 0.44 0.0
Hurricane Ivan 2004 Category 3 36.9 8.0
Hurricanes Dennis & Emily 2005 Category 4 5.98 1.2
Hurricane Wilma 2005 Category 5 3.6 0.7
Hurricane Dean 2007 Category 4 23.8 3.4
Tropical Storm Gustav 2008 - 15.5 2.0
Tropical Storm Nicole 2010 - 20.6 1.9
Hurricane Sandy 2012 Category 2 9.9 0.8
Source: PIOJ
The enhanced fiscal rules also require that the government allocate funds in the budget for weather
related events and for such amounts to be transferred to the Contingencies Fund. The budget
allocation for FY 2016/17 is $550.0mn for weather related events, $450.0mn above the $100.0mn
allocated in FY 2015/16.
Disaster Risk Financing Technical Assistance (DRFTA)
The FY 2015/16 FPP Interim Report noted that the GOJ is receiving technical assistance (TA) from
the World Bank (WB) to better identify and manage fiscal risks associated with natural disasters.
Through direct collaboration with the MOFPS, the WB Disaster Risk Financing Technical Assistance
(DRFTA) Project aims to support Jamaica: (i) in assessing the fiscal shocks derived from natural
disasters; (ii) in strengthening institutional and technical capacity of MOFPS in financial protection
against natural disasters; and (iii) in assessing current available disaster risk financing tools and
identifying affordable, effective financial protection options based on understanding of the fiscal
exposure to natural disasters (direct contingent liabilities from natural disasters).
141
During 2015, the WB DRFTA team (herein after WB) has focused on data collection and analysis to
understand the historical impact of natural disasters in Jamaica. Through collaboration with the
MOFPS, the Office of Disaster Preparedness and Emergency Management (ODPEM) and other
agencies, the WB has finalized/achieved: (i) the assessment, in terms of budgetary impact, of the
historical post disaster physical and economical losses and post disaster expenditure; (ii) the review
of external post-disaster aid inflows, and (iii) the review of the budgetary processes of emergency and
disaster response. Additionally, the WB has started the development of a Country Disaster Risk
Profile11 for Jamaica which will support the quantification of the GOJ’s contingent liabilities
associated with natural disasters.
Initial diagnostics on Public Financial Management (PFM) findings were presented, discussed and
validated with the MOFP in October, 2015. Continued analysis has presented several gaps and
challenges in public financial management response to natural disasters, which will help focus the
efforts on developing a cost-effective sovereign financial protection strategy against natural disasters
for Jamaica. Key initial findings related to fiscal risk are:
a) Quantifying sovereign explicit and implicit contingent liabilities associated with natural
disasters is necessary to better manage fiscal risk. Based on in-country data collection at
ODPEM and MOFPS, the WB project has taken the first steps in quantifying contingent
liabilities by analyzing historical physical and financial losses from natural disasters, as well
as the amounts allocated and spent by the GOJ for relief and reconstruction. Using data from
DesInventar12, ODPEM’s Damage Assessment and Situation Reports and the Planning
Institute of Jamaica’s (PIOJ) ECLAC Report, this exercise considered 26 natural disasters13
between the period 1993 and 2013. Total economic loss for those events was estimated at
US$2,220mn, showing economic losses of approximately US$110.0mn per annum. However,
this figure does not clarify what percentage of US $110mn is a contingent liability of the GOJ.
Despite regulations defining the limits of government responsibility, political and social
pressures often lead the government to accept additional liabilities after a major disaster—for
example, low-income housing. These implicit contingent liabilities are often the most
difficult to assess and can have implications for debt management and fiscal sustainability.
b) The existing Contingencies Fund and National Disaster Fund (NDF) could be improved to be
the backbone of the financial protection strategy against natural disasters. The Contingencies
Fund was established by the Financial Administration and Audit Act in 1959 and allows the
MOFPS to make disbursements for any unforeseen expenditure, such as expenditure arising 11 Probabilistic disaster risk profiles will provide risk assessments and estimates of potential damage to property caused by earthquakes and hurricanes. 12 DesInventar is a conceptual and methodological tool for the generation of National Disaster Inventories and the construction of databases of damage, loss and in general the effects of disasters. 13 Natural disasters were included in the analysis if data on physical losses, economic losses, or relief and reconstruction spending could be verified by at least two sources for that particular event.

142
from a natural disaster. However, based on analysis of historical uses of the fund, the
Contingencies Fund has been capitalized at a level well below average natural disaster losses
per annum, and the fund has historically been disbursed for unforeseen administrative
expenditure. As of March 2014, the Contingencies Fund was capitalized at US$0.8mn. The
NDF, created by executive decision in 1995 and managed by the National Disaster Committee
sub-committee, Finance & Administration (F&A), can also provide rapid liquidity after a
natural disaster. The F&A subcommittee is responsible for the growth of the Fund as well as
approval of disbursements. Requests for disbursements from the Fund are routed through
ODPEM by way of a formal letter to the Chairman of the F&A committee. There is
agreement within the government that the NDF is not adequately capitalized for
comprehensive relief and recovery from major natural disasters, and it is primarily used for
operational and administrative costs of immediate disaster response. As of March 2014, the
NDF was capitalized at US$2.6mn.
An improved budget management system will help the Fiscal Policy Management Unit
(FPMU) to monitor natural disaster-related fiscal risks to the budget. The Budget Preparation
and Management System (BPMS), slated to take effect after July 1, 2016, could include using
the Programme 005 designation in the Chart of Accounts to track disaster-related expenditure
from source of funds to activity and object of expenditure. Continued efforts to examine the
Chart of Accounts approach and other budget management efforts has potential for shifting
actual practice closer to best practice and an optimal financial protection strategy against
disasters. Improved tracking of post-disaster expenditures is an important step in
understanding the impact of disaster on a year-to-year basis. Comparing the GOJ’s quantified
contingent liabilities associated with natural disasters to actual government expenditure will
highlight short term and medium term gaps in financing disaster response. Ultimately,
identifying these gaps will assist in optimizing cost-efficient rules for pre-event allocations
and post-disaster re-allocations and disbursements.
State Owned Enterprises
Public Entities have often been a significant source of contingent liabilities for the GOJ, as they may
sometimes require unplanned cash infusion to operate, or will require some form of debt relief. As
such, the government has developed a comprehensive framework to: properly account for guaranteed
funds and their associated risks; analyze, monitor and control them; and, set targets or caps for each
fiscal year as a share of GDP. The PDMA mandates that public bodies submit reports to the Minister
of Finance, providing details of all their debts and liabilities. The PDMA also outlines the targeted
debt guarantees as a percent of GDP to be no more than 8.0%, 5.0% and 3.0% at end-FY 2016/17,
end-FY 2021/22 and end-FY 2026/27, respectively.

143
For FY 2015/16, the government did not issue any new guarantees nor assume any guaranteed loans
on behalf of public entities. As at end-March 2016 the stock of government guaranteed debt as a
percent of GDP was 10.4%, 1.1 percentage points below the 11.5% reported for end-March 2015.
Table II (d) presents the payments made in FY 2015/16 and provisions for the
FY 2016/17 budget for guaranteed debt payments on behalf of public entities.
Table II (d): Central Government FY 2015/16 Debt Payments on behalf of Public Bodies and FY 2016/17 Budgetary Provisions for Debt Payments on behalf of Public Bodies
FY 2015/16 FY 2016/17
Actual Budget
J$mn
Interest 6,524.5 7,647.6
Domestic 1,554.6 1,703.4
External 4,969.9 5,944.2
Principal 19,092.5 5,015.2
Domestic 680.9 737.5
External 18,411.6 4,277.7
Source: MOFPS
There is strong supervision and monitoring of the public entities by the MOFPS, with the MOFPS
taking the necessary steps to adequately control, account for and reduce the stock of guaranteed debts.
In addition to these explicit contingent liabilities, the GOJ is often required to inject significant
financial support to capitalize or recapitalize a public entity. If a public entity runs a deficit each year
as a matter of economic or social policy objectives, and the deficit is covered by regular transfers
from government to match this deficit, the payment is regarded as a subsidy14. The case of JUTC
furnishes a clear example. In exchange for a reduced fare for students and the elderly, the
Government commits itself to replace JUTC’s rolling stock and infrastructure as necessary to
maintain its operations and provide funding support for operations in the form of a subvention. With a
growing fleet, this leads not only to a large upfront cost in terms of new buses, but to growing
purchases of rolling stock and infrastructure costs as well as to larger operational losses and therefore
larger amounts of funding support. Table II (e) provides a list of public entities currently receiving
financial support from the government.
14 Government Finance Statistics Manual 2014, pg. 133.

144
Table II (e): Central Government Budgetary Support to Public Entities Public Entity
FY
2015/16
(J$mn)
FY
2016/17
(J$mn)
Purpose
Jamaica Urban Transit Company Ltd. 5,348.3 2,244.6 Subsidy
National Road Operating & Constructing Company Ltd. 4,846.5 - Debt Servicing
National Export -Import Bank of Jamaica Ltd. 1,065.0 400.0 Capital Transfer
Students' Loan Bureau 2,915.0 3,077.0 Subsidy
Road Maintenance Fund 5,236.0 - Debt Servicing
Caymanas Track Limited - 153.0 Redundancy Cost
Montego Bay Metro Ltd. 44.7 30.0 Subsidy
Source: MOFPS
Public Private Partnership (PPP)
Investment in public infrastructure is vital to sustainable growth and development of the Jamaican
economy. Jamaica’s PPP programme represents a critical path to the development and maintenance of
its infrastructure. A PPP refers to “an arrangement governed by a long-term procurement contract
between one or more public entities and one or more non-public entities, involving the designing,
financing, building and operating of an infrastructure project or the provision of a service, through the
appropriate sharing of resources, risks and rewards.” The GOJ’s PPP programme started in
November 2012 and provides a framework to engage the private sector in investing in the country’s
public infrastructure projects and services.
However, PPP projects have gained importance due to their potential to impose significant fiscal risks
on the government if not appropriately designed and financed. It is therefore very important that the
risks associated with PPPs be recognized and monitored. The enhanced fiscal rules that were adopted
through amendments to the FAA and PBMA Acts in March 2014, have put in place institutional
changes to strengthen financial and risk analysis of projects, risk sharing arrangements and project
assessments. The PBMA Act provides for a ceiling of 3% of GDP for user-pays projects. The
Kingston Container Terminal (KCT) remains the only PPP Contract that has been executed under the
Contingency Ceiling as at end-March 2016.
Close monitoring of PPP projects is facilitated through the establishment of a PPP Unit within the
Development Bank of Jamaica (DBJ) with responsibility for the transaction management of the
programme, and the establishment of a PPP Unit within the MOFPS responsible for assessing value
for money on the projects and ensuring their alignment with the government’s fiscal programme. In
keeping with the fiscal rules, all PPPs are continually assessed by the MOFPS’s PPP Unit and are
included in the PSIP and subject to the standards set out in the Public Investment Management
System (PIMS).

145
The following PPP transactions are currently in progress:
• Kingston Container Terminal (KCT) - During 2015/16, PAJ executed a thirty-year
Concession Agreement with Kingston Freeport Terminal Limited to finance, expand, operate,
maintain and transfer the KCT. It is anticipated that financing for the project will be finalized
by the end of April 2016. The PAJ is also undertaking preparatory works for the transfer of
KCT’s operations to the Concessionaire.
• Norman Manley International Airport (NMIA) – The initial drive to identify a long-term
concessionaire to operate, finance, develop and maintain the NMIA did not materialize.
However, a holistic evaluation is being undertaken with the aim of identifying a
concessionaire. Most of the pre-qualified bidders continue to show interest. The Government
upon review will decide on the way forward.
• Jamaica Railway Corporation (JRC) - GOJ has entered into a Memorandum of
Understanding with Herzog International Inc. to undertake detailed due diligence to facilitate
the preparation of a proposal to the GOJ. Herzog has undertaken the necessary due diligence
and at December 31, 2015, the company submitted a revised business plan to rehabilitate
approximately 207km of the 334.9km rail track. The work will be undertaken on a phased
basis.
The following project is being assessed for possible PPP Development:
• The Schools Solar Energy and Energy Efficiency Pilot Project, led by the National Education
Trust (NET) in collaboration with the DBJ, have received approval from the Public
Investment Management Committee of Cabinet to advance to the transaction phase. Interested
investors will be sought, through a competitive tender process, to finance and maintain solar
energy systems in 30 schools. The NET has received financial support from the Inter-
American Development Bank’s Multilateral Investment Fund (MIF), the GOJ’s Project
Preparation Facility (PPF) and the DBJ’s Grant Facility to conduct the business case and
preliminary energy audits.
Wage Settlements
A key risk to the wage bill relates to negotiations and disputes where the outcome is uncertain. With
the ending of the 2012/15 Heads of Agreement (HOA) with unions representing public sector
workers on March 31, 2015, a new round of negotiations started in FY 2015/16 for a new HOA for
the 2015/17 contract period. At the time the FY 2015/16 budget was presented, this new round of
wage negotiations had not yet started. As such, the government included a contingency provision for
wage adjustments in the FY 2015/16 budget. However as at end-March 2016, with approximately
97% of all wage negotiations completed, the estimated cost associated with settlements under the new
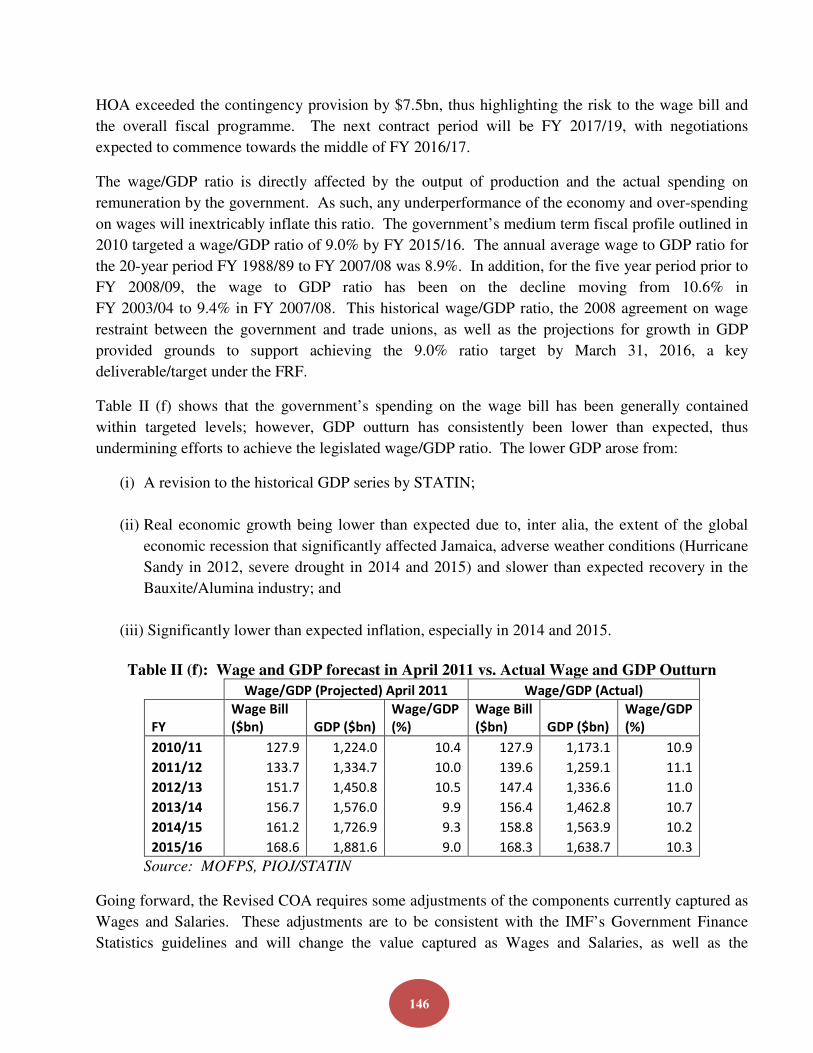
146
HOA exceeded the contingency provision by $7.5bn, thus highlighting the risk to the wage bill and
the overall fiscal programme. The next contract period will be FY 2017/19, with negotiations
expected to commence towards the middle of FY 2016/17.
The wage/GDP ratio is directly affected by the output of production and the actual spending on
remuneration by the government. As such, any underperformance of the economy and over-spending
on wages will inextricably inflate this ratio. The government’s medium term fiscal profile outlined in
2010 targeted a wage/GDP ratio of 9.0% by FY 2015/16. The annual average wage to GDP ratio for
the 20-year period FY 1988/89 to FY 2007/08 was 8.9%. In addition, for the five year period prior to
FY 2008/09, the wage to GDP ratio has been on the decline moving from 10.6% in
FY 2003/04 to 9.4% in FY 2007/08. This historical wage/GDP ratio, the 2008 agreement on wage
restraint between the government and trade unions, as well as the projections for growth in GDP
provided grounds to support achieving the 9.0% ratio target by March 31, 2016, a key
deliverable/target under the FRF.
Table II (f) shows that the government’s spending on the wage bill has been generally contained
within targeted levels; however, GDP outturn has consistently been lower than expected, thus
undermining efforts to achieve the legislated wage/GDP ratio. The lower GDP arose from:
(i) A revision to the historical GDP series by STATIN;
(ii) Real economic growth being lower than expected due to, inter alia, the extent of the global
economic recession that significantly affected Jamaica, adverse weather conditions (Hurricane
Sandy in 2012, severe drought in 2014 and 2015) and slower than expected recovery in the
Bauxite/Alumina industry; and
(iii) Significantly lower than expected inflation, especially in 2014 and 2015.
Table II (f): Wage and GDP forecast in April 2011 vs. Actual Wage and GDP Outturn
Wage/GDP (Projected) April 2011 Wage/GDP (Actual)
FY
Wage Bill
($bn) GDP ($bn)
Wage/GDP
(%)
Wage Bill
($bn) GDP ($bn)
Wage/GDP
(%)
2010/11 127.9 1,224.0 10.4 127.9 1,173.1 10.9
2011/12 133.7 1,334.7 10.0 139.6 1,259.1 11.1
2012/13 151.7 1,450.8 10.5 147.4 1,336.6 11.0
2013/14 156.7 1,576.0 9.9 156.4 1,462.8 10.7
2014/15 161.2 1,726.9 9.3 158.8 1,563.9 10.2
2015/16 168.6 1,881.6 9.0 168.3 1,638.7 10.3
Source: MOFPS, PIOJ/STATIN
Going forward, the Revised COA requires some adjustments of the components currently captured as
Wages and Salaries. These adjustments are to be consistent with the IMF’s Government Finance
Statistics guidelines and will change the value captured as Wages and Salaries, as well as the

147
associated Wages/GDP ratio. In light of these changes, during the first quarter of FY 2016/17, the
MOFPS will be in consultation with key stakeholders, including the IMF staff, regarding other
classification issues in respect of Wages and Salaries, which will have important bearing on the
targeted Wage/GDP ratio of 9.0%. The MOFPS has already commenced the legislative process to
adjust the timeline for the 9.0% of GDP Wage ceiling. However the outcome of the stakeholder
consultations will help to guide the determination of a new timeline, which will be reported in the
Interim Fiscal Policy Paper to be tabled in September 2016.
Arrears
Tax Refund Arrears – this refers to obligations on tax refunds in accordance with tax legislation that
remain unpaid 90 days after the due date (EFF). These arrears are being closely monitored by the
GOJ to ensure that there is no accumulation. In addition, monitoring of the tax refund arrears forms a
part of the quantitative targets under the EFF programme. Of note, the GOJ has been satisfying these
performance criteria under successive IMF reviews. The stock of tax refund arrears was recorded at
$15.8bn as at end-February 2016, representing a $5.9bn reduction from the $21.7bn recorded at
end-March 2015.
Domestic Arrears – this is defined as payments to residents determined by contractual obligations
that remain unpaid 90 days after the due date (EFF). The due date refers to the date in which
domestic debt payments are due according to the relevant contractual agreement, taking into account
any contractual grace periods. Included in this category are arrears on domestic central government
direct debt, including to suppliers and all recurrent and capital expenditure commitments. This
category of arrears also forms a part of the quantitative targets under the EFF programme, with all
requirements being met under successive IMF reviews. The stock of domestic arrears was recorded
at $20.8bn as at end-January 2016, representing a $723.5mn reduction from the $21.5bn recorded at
end-March 2015.
Monetary Policy
The Bank of Jamaica Act outlines that, profits or losses of the Central Bank are transferrable to the
Central Government. The medium term fiscal profile presented in this FPP does not assume any
transfer of profits from the BOJ nor does it include provisions for BOJ losses. Therefore, any
unanticipated losses may have to be picked up by the Central Government, which inherently poses a
risk to the fiscal accounts. However, with improving economic conditions it is anticipated that the
fiscal risks associated with the prudent conduct of monetary policy will be minimal.
Changes in Government policy
On March 3, 2016, a new administration comprised of Jamaica Labour Party (JLP) members, became
the government of Jamaica following victory in the General Elections held on February 25, 2016.
Changes in government policies are expected with any change in administration. The new
administration has however reaffirmed its commitment to fiscal responsibility and prudence as it

148
relates to revenue and expenditure management of the country’s fiscal resources. This is essential for
the achievement of fiscal and debt targets.
Changes in government’s policy may also become necessary, in response to changes in economic and
other conditions, however, where these policy changes lead to an adverse material impact on either
revenue or expenditure, then the GOJ will take the necessary “compensating measures” to ensure that
the fiscal programme maintains its integrity.
Judicial Awards
This relates to current and potential legal or judicial claims against the GOJ with potentially costly
implications should the plaintiffs win their case. Therefore, any court judgement against the GOJ
poses a risk to achieving the fiscal targets due to its potential to cause significant increases in
unplanned expenditure. There have been a number of such unfavourable awards in recent years
which had to be covered by the budget thereby crowding out other needed expenditure or
necessitating additional revenue measures.
On the positive side however, the GOJ got a favourable ruling in December 2015 against a bauxite
company, which is expected to result in increased bauxite levy flows to the Capital Development
Fund.
Going forward, the MOFPS plans to work closely with the Ministry of Justice (MOJ) to keep track of
current and pending cases against the GOJ so that proper expenditure planning can be executed
should there be a ruling against the government.

149
Ministry of Finance and the Public Service
30 National Heroes Circle, Kingston 4, Jamaica W.I. Tel (876) 922-8600, website: www.mof.gov.jm Printed by the Ministry of Finance and the Public Service