Embed Size (px)
Citation preview

46
American Economic Journal: Economic Policy 2012, 4(2): 46–68 http://dx.doi.org/10.1257/pol.4.2.46
Fiscal Policy Multipliers on Subnational Government Spending†
By Jeffrey Clemens and Stephen Miran*
Balanced budget requirements lead to substantial pro-cyclicality in state government spending, with the stringency of a state’s rules driving the pace at which it must adjust to shocks. We show that fis-cal institutions can generate natural experiments in deficit-financed spending that are informative regarding fiscal stabilization policy. Alternative sources of variation in subnational fiscal policy often implicitly involve “windfall” financing, which precludes any effect of future debt or taxation on current consumption and investment. Consistent with a role for these “Ricardian” effects, our estimates are smaller than those in related studies, implying an on-impact mul-tiplier below 1. (JEL C51, E32, E62, H72)
State governments, whose spending accounts for around 10 percent of GDP, play a substantial role in the fiscal policy landscape. Since almost all US states have
formal balanced budget requirements, a large share of their spending fluctuates pro-cyclically. When states enter recessions, their tax bases contract and their safety-net expenditures expand. Compliance with balanced budget requirements can thus entail significant reductions in capital expenditures and in spending on publicly pro-vided goods and services.1
It is difficult to rationalize pro-cyclical spending on infrastructure and service provision as serving any welfare-enhancing purpose. Utility from public services, for example, would likely be higher if these services flowed smoothly. Similarly, if capital expenditures must be conducted with any cyclical orientation at all, they would ideally be reserved for downturns as a source of “shovel ready” projects.
1 In this context, safety-net programs primarily include Unemployment Insurance (UI), cash welfare assistance, and Medicaid. Spending out of insurance trusts, which includes state UI programs, is not subject to state balanced budget requirements. Other insurance trust spending is dominated by pension plans for public employees. Non safety-net spending primarily involves spending on education, transportation, health, law enforcement (including corrections), and relatively minor categories including spending on utilities and public parks.
* Clemens: Stanford Institute for Economic Policy Research, John A. and Cynthia Fry Gunn Building, 366 Galvez Street, Stanford, CA 94305 (e-mail: [email protected]); Miran: Lily Pond Capital Management, LLC, 450 Park Avenue, Suite 1901, New York, NY 10022 (e-mail: [email protected]). We are grateful to Robert Barro, Raj Chetty, Martin Feldstein, Benjamin Friedman, Alexander Gelber, Stefano Giglio, Edward Glaeser, Joshua Gottlieb, Gregory Mankiw, David Mericle, Joshua Mitchell, James Poterba, Kim Reuben, par-ticipants at the Harvard labor/public economics and macroeconomics lunches, participants and discussants at the NBER’s TAPES conference in Varena, Italy, and at the 2010 NTA meetings in Chicago, two anonymous referees, and especially to David Cutler and Lawrence Katz. Clemens acknowledges receipt of financial support from the Department of Homeland Security’s Scholarship and Fellowship Program, the Rumsfeld Foundation’s Graduate Student Fellowship, the Institute for Humane Studies, and the Taubman Center for State and Local Government at Harvard University’s Kennedy School of Government. All errors are of course ours alone.
† To comment on this article in the online discussion forum, or to view additional materials, visit the article page at http://dx.doi.org/10.1257/pol.4.2.46.
ContentsFiscal Policy Multipliers on Subnational Government Spending† 46
I. Budget Rules and State Spending Over the Business Cycle 48II. Differentiating between Sources of Variation in Fiscal Policy 50III. A Measure of Fiscal Shocks and its Relation to the Business Cycle 52IV. State Responses to Deficit Shocks During Two Recessions 54V. Estimating the Government Spending Multiplier 59A. Identification 60B. Baseline Results 61C. Interpreting the Results 63D. Robustness of the Baseline Results 63VI. Conclusion 66References 66

VoL. 4 No. 2 47CLEmENs ANd miRAN: suBNAtioNAL fisCAL PoLiCy
Increases in business-cycle volatility that are induced by pro-cyclical state spending thus do not come with obvious offsetting benefits.
The contribution of state governments to the business cycle depends on two parameters. The first parameter is a measure of how pro-cyclically they spend. Using state-level data on income and the relevant categories of government spend-ing, we estimate this parameter in Section I. For each $1 that income deviates from trend, we find that state spending on infrastructure and service provision deviates from trend by 8 cents.
The second relevant parameter is the fiscal policy multiplier associated with state spending on infrastructure and public services. Estimating this multiplier requires isolating variation that is not, itself, driven by the business cycle. State government spending’s pro-cyclical tendency, as driven in part by balanced budget requirements, makes isolating such variation difficult.
The empirical macroeconomic literature on fiscal policy attempts to isolate exog-enous shocks to government spending using a combination of Structural Vector Autoregressions (SVARs) and narrative histories.2 The primary source of varia-tion in this literature can make both inference and extrapolation difficult (see, e.g., the discussion in Auerbach and Gale 2009). An examination of the time series for aggregate government spending reveals that the shocks isolated by both SVAR and narrative methods will stem largely from defense spending, with the unexpected component coming primarily from the World War II and Korean War build-ups (Ramey 2011).3 Such spending makes inference difficult for two reasons. First, wars can be associated with other important shifts in economic policy.4 Second, the onset and resolution of wars may have significant impacts on expectations for future tax and income streams, both of which are determinants of current consumption, invest-ment, and labor supply decisions.
Difficulties with extrapolation from the macroeconomic studies also relate to their reliance on defense spending. There are important differences between defense spend-ing and the kinds of spending typically considered for stimulus purposes. Unlike defense spending, spending on infrastructure, health, and education affects the econ-omy’s production possibilities and may enter into individuals’ utility functions. Also unlike defense spending, spending on programs like Medicaid and Unemployment Insurance involves changes in incentives that may influence labor supply.
A recent (and very much “in progress”) literature estimates the effects of fiscal policy using plausibly exogenous variation in subnational government spending.5
We show in Section II that this variation tends to depart in an important way from the ideal natural experiment for evaluating stabilization policy. Specifically, the spend-ing is often (either explicitly or implicitly) “windfall” financed rather than deficit financed. This is common to sources of variation that involve federal funding. With
2 An early paper in this relatively recent literature is Blanchard and Perotti (2002). More recent examples include Ramey (2011), Auerbach and Gorodnichenko (2012), and Mountford and Uhlig (2009).
3 An analysis by Barro and Redlick (2011) takes the step of directly assuming the exogeneity of changes in the defense spending series itself.
4 During World War II, for example, the US economy underwent the imposition of rationing and price controls.5 See, e.g., Chodorow-Reich et al. (forthcoming), Cohen, Coval, and Malloy (2011), Serrato and Wingender
(2010), Shoag (2010), and Nakamura and Steinsson (2011).

48 AmERiCAN ECoNomiC JouRNAL: ECoNomiC PoLiCy mAy 2012
federal funding, the future tax burden is borne by both the “treatment” states that receive the spending and the “control” states that do not. Any tendency for deficits to crowd out private consumption and investment, commonly called “Ricardian” effects (Barro 1974), will thus be netted out within standard estimation frameworks. Consequently, in a standard new-Keynesian framework, windfall-financed spending will tend to produce larger multiplier estimates than deficit-financed spending (see, e.g., the discussion by Cogan et al. 2010).
We argue that differences in states’ fiscal institutions, which affect their short-run savings behavior, can yield ideal variation for studying fiscal policy. Spending varia-tion generated by fiscal institutions (broadly taken to include balanced budget require-ments, tax and expenditure limitations, and rainy day funds) affects states’ long run budget constraints. Unlike windfall-financed spending, a spending increase induced by fiscal institutions is deficit financed. Furthermore, the variation occurs in precisely the categories of spending associated with stimulus-oriented policy decisions.
In Sections III–V we describe and implement a strategy for estimating a govern-ment spending multiplier using variation induced by states’ fiscal institutions. In doing so, we extend a result from Poterba (1994) on the effect of states’ balanced budget requirements on their responses to fiscal shocks. The relevant result lever-ages the fact that states have varying degrees of stringency built into the rules which govern deficit financing of general fund expenditures. During times of fiscal stress, we see that states with strict rules enact relatively large rescissions to their budgets in order to quickly narrow emerging deficits.
We use the spending cuts made by strict-rule states (in excess of those made by weak-rule states) to identify the effects of these outlay changes on state economic outcomes. Our estimates imply an on-impact multiplier of around 0.4, with incon-clusive evidence regarding fiscal policy’s effects over subsequent periods. While the estimates of the on-impact multiplier are moderately sensitive across specifications, they are uniformly (and often statistically significantly) smaller than estimates in recent studies that utilize windfall-financed spending variation. Consistent with neo-classical considerations, the results suggest an important role for Ricardian crowd-ing out of private consumption and investment activities.
I. Budget Rules and State Spending Over the Business Cycle
Balanced budget requirements dictate a tight relationship between state govern-ments’ revenues and expenditures.6 Absent significant saving in stabilization funds during expansions, states must choose between increasing tax rates and reducing expenditures during recessions. We save our discussion of differences in the strin-gency of states’ budget rules for Section IV. At present, we note that even the weak-est rules require states to enter each fiscal year expecting revenues to equal general fund expenditures.7 In this section, we focus on the fact that, as a consequence of
6 To avoid unneeded confusion, we note here that we use the terms “spending,” “outlays,” and “expenditures” interchangeably.
7 As we show later, differences in states’ budget rules dictate differences in how they respond to unexpected shocks.

VoL. 4 No. 2 49CLEmENs ANd miRAN: suBNAtioNAL fisCAL PoLiCy
these requirements (coupled with generally limited saving in stabilization funds), states exhibit significant pro-cyclicality in their spending on capital infrastructure and service provision (non-safety-net expenditures).
We illustrate the pro-cyclicality of non-safety-net expenditures in Figures 1 and 2, which we constructed using flexibly detrended data on personal income and the relevant categories of government spending.8 The variables, as with all others in this study, are analyzed in real per capita terms. Figure 1 plots the means of these detrended series (taken across states) over time from 1960 to 2006. Figure 2 displays each state-by-year observation for the two series in scatter plot form. The timing of cyclical adjustments in state spending (as illustrated in Figure 1) is consistent with what one would expect due to balanced budget requirements; spending tracks the business cycle with a lag of about one year. The best-fit line in Figure 2 implies that when personal income is $1 below trend, spending outside of safety-net programs tends to be 7.7 cents below trend (with a standard error of 1.7 cents).9
8 Specifically, we regressed both non-safety-net spending and personal income on state-specific quartic trends. Non-safety-net spending is defined as the sum of “capital” and “current” expenditures minus expenditures on “pub-lic welfare,” which is dominated by Medicaid and cash welfare assistance. Altering the number of terms in the polynomial does not significantly change the results, although a relatively flexible polynomial seems clearly prefer-able to a simple linear trend given the variety of changes a state’s economic trajectory can make over the course of five decades. We obtain similar results when running each state’s income and spending data through the Hodrick-Prescott filter rather than detrending with polynomials.
9 Essentially the same result is obtained when the detrended state income data are replaced by state income data that has been run through the Hodrick-Prescott (HP) filter (point estimate of 7.4 cents with a standard error of 1.8 cents). We use HP-filtered income data in the analysis reported in Section V. A smaller estimate (3.2 cents with a standard error of 0.8 cents) is obtained when the state spending data is run through the HP-filter as well. HP-filtering is questionable for the long series on state spending, however, as state spending has grown in spurts over the last five decades and is poorly described by what Jaeger (1994) describes as the “smooth and slowly changing trends” required for the HP-filter to be appropriate.
Det
rend
ed n
on s
afet
y-ne
t out
lays
per
cap
ita
Det
rend
ed p
erso
nal i
ncom
e pe
r ca
pita150
75
0
−75
−150
1,000
500
0
−500
−1,000
1960 1970 1980 1990 2000 2010Year
–
–
–
–
–
–
–
–
–
–
– – – – –
Non safety-net spendingPersonal income
Figure 1. Detrended Non Safety-net Outlays and Personal Income Means across States: 1960–2006
Notes: Figure 1 plots the unweighted means (across states) of detrended personal income and state government spending outside of insurance trusts and safety-net programs on a per capita basis. Detrending was conducted using state-specific quartic polynomials. Personal income data come from the Bureau of Economic Analysis (BEA) and state government spending data come from the Census of Governments (COG).

50 AmERiCAN ECoNomiC JouRNAL: ECoNomiC PoLiCy mAy 2012
The full effect of pro-cyclical state spending on the business cycle depends on the fiscal policy multiplier associated with these expenditures. More specifically, it depends on the multiplier associated with smoothing the timing of these expendi-tures. The implications for aggregate volatility could be substantial. If the relevant multiplier is slightly larger than two (as recently estimated by Shoag 2010), state governments would be responsible for nearly one-fifth of all business-cycle volatil-ity. On the other hand, if shifts in government expenditures displace contempora-neous private activity (as found, e.g., by Cohen, Coval, and Malloy 2011), state governments may cause a relatively small portion of volatility.
II. Differentiating between Sources of Variation in Fiscal Policy
In this section, we lay out a framework for distinguishing between sources of variation for estimating multipliers on subnational government spending. A benefit of standard applied micro-econometric approaches (in particular relative to VAR and SVAR methods) is that they allow us to be very explicit about the source of the variation used for econometric identification.10 We describe how alternative sources of variation can be mapped into distinct natural experiments in fiscal policy. We focus, in particular, on differences in the implied financing of the relevant govern-ment spending.11
10 The explicit use of narrative shocks or some other clearly defined source of variation within a VAR or SVAR framework, as in Auerbach and Gorodnichenko (2012), Favero and Giavazzi (2012), and Ramey (2011) can also be an attractive source of relatively transparent identification.
11 Natural experiments in fiscal policy can differ along several dimensions that are relevant for thinking about their associated multipliers. These include their impact on the economy’s production possibilities, the extent to which they substitute for (or complement) private consumption, their timing, and their impact on incentives (e.g., for labor supply) in addition to how they are financed.
1,000
500
0
−500
−1,000
−4,000 −2,000 0 2,000 4,000
Non safety-net spendingFitted values
Figure 2. Detrended Non Safety-net Outlays and Personal Income
Notes: Figure 2 plots state-year observations of detrended personal income and state government spending out-side of insurance trusts and safety-net programs on a per capita basis. The best-fit line has a slope of 0.077 (stan-dard error of 0.017) and the regression yields an R2 of 0.16. Detrending was conducted using state-specific quartic polynomials. Personal income data come from the BEA and state government spending data come from the COG.
VoL. 4 No. 2 51CLEmENs ANd miRAN: suBNAtioNAL fisCAL PoLiCy
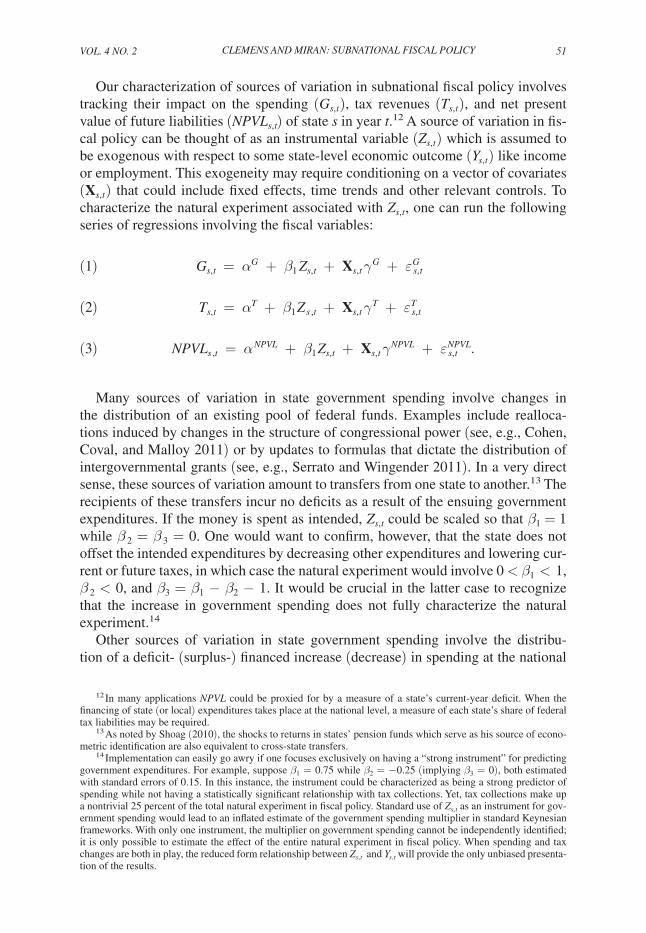
Our characterization of sources of variation in subnational fiscal policy involves tracking their impact on the spending (Gs, t ), tax revenues (ts, t ), and net present value of future liabilities (NPVLs, t) of state s in year t.12 A source of variation in fis-cal policy can be thought of as an instrumental variable (Zs, t ) which is assumed to be exogenous with respect to some state-level economic outcome ( y s, t ) like income or employment. This exogeneity may require conditioning on a vector of covariates (Xs, t ) that could include fixed effects, time trends and other relevant controls. To characterize the natural experiment associated with Zs, t , one can run the following series of regressions involving the fiscal variables:
(1) G s, t = α G + β 1 Z s, t + X s, t γ G + ε s, t G
(2) t s, t = α t + β 1 Z s ,t + X s, t γ t + ε s, t t
(3) NPV L s ,t = α NPVL + β 1 Z s, t + X s, t γ NPVL + ε s, t NPVL .
Many sources of variation in state government spending involve changes in the distribution of an existing pool of federal funds. Examples include realloca-tions induced by changes in the structure of congressional power (see, e.g., Cohen, Coval, and Malloy 2011) or by updates to formulas that dictate the distribution of intergovernmental grants (see, e.g., Serrato and Wingender 2011). In a very direct sense, these sources of variation amount to transfers from one state to another.13 The recipients of these transfers incur no deficits as a result of the ensuing government expenditures. If the money is spent as intended, Zs, t could be scaled so that β1 = 1 while β 2 = β 3 = 0. One would want to confirm, however, that the state does not offset the intended expenditures by decreasing other expenditures and lowering cur-rent or future taxes, in which case the natural experiment would involve 0 < β1 < 1, β 2 < 0, and β3 = β1 − β2 − 1. It would be crucial in the latter case to recognize that the increase in government spending does not fully characterize the natural experiment.14
Other sources of variation in state government spending involve the distribu-tion of a deficit- (surplus-) financed increase (decrease) in spending at the national
12 In many applications NPVL could be proxied for by a measure of a state’s current-year deficit. When the financing of state (or local) expenditures takes place at the national level, a measure of each state’s share of federal tax liabilities may be required.
13 As noted by Shoag (2010), the shocks to returns in states’ pension funds which serve as his source of econo-metric identification are also equivalent to cross-state transfers.
14 Implementation can easily go awry if one focuses exclusively on having a “strong instrument” for predicting government expenditures. For example, suppose β1 = 0.75 while β2 = −0.25 (implying β3 = 0), both estimated with standard errors of 0.15. In this instance, the instrument could be characterized as being a strong predictor of spending while not having a statistically significant relationship with tax collections. Yet, tax collections make up a nontrivial 25 percent of the total natural experiment in fiscal policy. Standard use of Zs, t as an instrument for gov-ernment spending would lead to an inflated estimate of the government spending multiplier in standard Keynesian frameworks. With only one instrument, the multiplier on government spending cannot be independently identified; it is only possible to estimate the effect of the entire natural experiment in fiscal policy. When spending and tax changes are both in play, the reduced form relationship between Zs, t and y s, t will provide the only unbiased presenta-tion of the results.

52 AmERiCAN ECoNomiC JouRNAL: ECoNomiC PoLiCy mAy 2012
level. One recent example involves formula-induced variation in the funds dis-bursed through the American Recovery and Reinvestment Act (Chodorow-Reich et al. forthcoming). Another involves the differential impact of changes in defense spending on states with different exposure to defense-related industries (Nakamura and Steinsson 2011). If the residents of each state or locality pay an equal share of the federal tax burden, then these natural experiments become equivalent to changes in the distribution of an existing pool of funds. To see why, suppose that a policy change results in an extra dollar of spending in half of the states and no change in the others; all states facing an increase in their future tax liability with a present value of 50 cents. In comparing the impact of this policy change across regions, the future tax liabilities will difference out. This leaves the equivalent of a windfall-financed increase in spending in the states that received the federal funds. Econometrically, an instrument that perfectly predicts the $1 spending differential would be uncor-related with a perfect measure of future tax liabilities. As before, Zs, t could be scaled so that β1 = 1 while β2 = β3 = 0.15
Changes in government spending that are driven by states’ fiscal institutions will differ from the spending changes just described. Such changes will not involve external sources of finance, so that any increase in spending (net of taxes) necessar-ily involves an increase in future liabilities. These institutions will not, as a general proposition, generate exogenous variation in the level of government spending. They do, however, generate exogenous variation in how states respond to shocks. Budget rules, for example (as detailed below), dictate the pace at which states adjust in response to unexpected deficits. Similarly, savings devices like rainy day funds may generate differences in how states respond to the arrival of intergovernmental trans-fers.16 In cases where fiscal institutions affect spending behavior without affecting revenue-raising behavior, Zs, t can be scaled so that β1 = β3 = 1 while β2 = 0. This is precisely the natural experiment at the heart of stabilization policy. Distinguishing between this setting and settings where β3 = 0 is crucial for testing the importance of traditional Keynesian mechanisms relative to the neoclassical considerations associated with Ricardian Equivalence (Barro 1974).17 Any crowd out of private consumption or investment that results from deficit financing is implicitly netted out when the financing burden is spread equally across the treatment and control groups.
III. A Measure of Fiscal Shocks and Its Relation to the Business Cycle
We now implement the approach described above, using variation in how states respond to fiscal shocks. In this section we describe the construction of a measure
15 Note here that if states differ in the extent to which they are expected to bear the burden of future tax liabilities there may be a separate instrument that could be used to identify the effects of deficit financing. The availability of such a variable would make it possible, in principal, to recover estimates of the effects of fiscal policy associated with any degree of deficit finance.
16 Suppose, for example, that a federal stimulus policy involved $10 billion transfers to each state and that states with rainy day funds save a greater share of these transfers than others. The difference in spending between the two sets of states would effectively be deficit financed; it would be associated with an equivalently-sized change in their future liabilities.
17 Considerations associated with rational expectations are incorporated into both real business cycle and new-Keynesian models as discussed by Cogan et al. (2010).

VoL. 4 No. 2 53CLEmENs ANd miRAN: suBNAtioNAL fisCAL PoLiCy
of fiscal shocks and provide evidence on how these shocks relate to business cycles. In Section IV, we present evidence of the effect of states’ balanced budget require-ments on the speed with which they respond to these shocks.
Following Poterba (1994), we quantify fiscal shocks using the difference between budget forecasts and realizations, which are expressed without mid-year adjustments as described below:
Expenditure shockt = outlaysCL, t − Et−1(outlayst)
Revenue shockt = RevenuesCL, t − Et−1(Revenuest).
The terms involving expectations are outlay and revenue forecasts, where the fore-cast is made at the end of the previous fiscal year. outlaysCL, t and RevenuesCL, t are the constant-law levels of outlays and revenues; they are what would prevail in the absence of mid-year adjustments to the budget. The difference between these terms provides a true measure of expenditure and revenue shocks.18 We cannot directly observe constant-law outlays and revenues. However, we can recover them by sub-tracting mid-year changes (denoted as ∆outlayst and ∆Revenuest) from the final outlay and revenue realizations for the fiscal year (outlayst and Revenuest). We compute the total shock by combining the revenue and expenditure shocks to form:
deficit shockt = Expenditure shockt – Revenue shockt .
Beginning in 1988, the National Association of State Budget Officers (NASBO) reports all of the information required to construct these shocks in its semiannual fiscal survey of the states series.
Three features of the deficit shock series are worth discussing immediately. First, its dependence on forecasts raises issues associated with forecast manipulation. Forecast manipulation may be a significant concern when fiscal stress is particu-larly severe (as during the recent financial crisis).19 We checked for the relevance of forecast manipulation by replacing the forecasts reported by NASBO with simple econometric forecasts based on state income, revenues, and expenditures from the previous fiscal year. We found that this change in the forecast series had little impact on the empirical investigation.
Second, the deficit shocks’ relationship with forecasts makes them much less per-sistent than the economic shocks with which they are associated. State forecasters appear to be taken by surprise during the year in which an economic shock occurs. In forecasts for future years, however, the shock is generally taken into account.
Third, the NASBO reports include mid-year spending cuts, but not mid-year spending increases. This reflects some combination of institutional realities and measurement error. The rules for changing appropriations in response to adverse
18 The use of constant-law measures is crucial because mid-year adjustments to outlays and revenues will tend to undo the appearance of fiscal shocks. Were mid-year adjustments to be complete, for example, realized deficits would equal zero any time that a state planned to balance its budget at the beginning of the fiscal year.
19 Rose and Smith (2012) discuss a literature on the extent to which revenue forecast manipulation may be a more general phenomenon.

54 AmERiCAN ECoNomiC JouRNAL: ECoNomiC PoLiCy mAy 2012
shocks differ from those for changing appropriations in response to favorable shocks. Increases in appropriations require legislation. In the face of unexpected deficits, however, many state governors are constitutionally empowered to impose budget cuts unilaterally. Hence while the variable is indeed right-censored, measure-ment error is only present if legislatures appropriate additional spending outside of the usual appropriations cycle. In the context of the NASBO data for 1988–1992, Rueben (1993) investigates the effects of making standard econometric corrections for censored data. She finds that these corrections have little impact on estimates of state responses to fiscal shocks.
Figure 3 graphs national means (across the states) of deficit shocks and detrended personal income per capita from 1988 to 2004. The figure shows that deficit shocks tend to be large when the economy is entering a recession. When detrended personal income turns sharply downward, large, positive deficit shocks occur. Deficit shocks tended to be small and negative during the expansionary years of the mid- and late-1990s. As reported in Table 1, the adverse shocks experienced at the beginnings of recessions and the favorable shocks experienced during expansions result in a mean shock that is fairly close to 0. Because deficit shocks occur close to the peak of a state’s business-cycle, they tend to be negatively correlated with changes in personal income and positively correlated with the level of personal income.
IV. State Responses to Deficit Shocks During Two Recessions
In this section, we analyze states’ short-term responses to deficit shocks, focus-ing on the effect of budget rules with different degrees of stringency. We collect information on balanced budget requirements from a 1987 report by the Advisory Commission on Intergovernmental Relations (ACIR) and from various reports by the National Association of State Budget Officers (NASBO). Rules can be differentiated
Det
rend
ed in
com
e
De�
cit s
hock
s
150
100
50
0
−50
1,000
500
0
−500
−1,000
1987 1989 1991 1993 1995 1997 1999 2001 2003 2005Year
–
–
–
–
–
– – – – – – – – – –
IncomeDeficit shocks
–
–
–
–
–
Figure 3. Detrended Income and Deficit Shocks
Notes: Figure 3 plots the unweighted means (across states) of deficit shocks per capita and detrended personal income per capita. The deficit shocks were constructed using data from semiannual reports by the National Association of State Budget Officers (NASBO). Personal income data come from the BEA.

VoL. 4 No. 2 55CLEmENs ANd miRAN: suBNAtioNAL fisCAL PoLiCy
in large part on the basis of whether they affect the enactment or execution of a state’s budget. An example of a rule that applies to the budget’s enactment is a rule requir-ing the legislature to pass a balanced budget. Such a rule does not force states to respond quickly to deficits that emerge over the course of the fiscal year. It requires only that the budget be balanced (in expectation) in the following fiscal year, i.e., that E(Gt+1) < E(tt+1). Stricter rules apply more directly to the execution of the bud-get. The strictest rule (also known as the “No-Carry” rule) prohibits carrying deficits through the next budget cycle. This rule requires that if a deficit is incurred at time t, the budget for the following year must be such that deficitt + E(Gt+1) < E(tt+1).20
20 Past research has explored some of the consequences of these rules. Notable studies include work by Poterba (1997) and Bohn and Inman (1996), who examine the impact of different requirements on a broad range of bud-getary outcomes. Highlights also include Poterba and Rueben (2001), and Lowry and Alt (2001), whose work addresses the nexus between balanced budget requirements, state fiscal behavior, and interest rates on general-obligation debt. These studies confirm empirically that requirements which apply to the budget’s execution have greater impact than those that apply only to the budget’s enactment. Strict budget rules are associated with lower spending levels, modestly greater accumulation of surpluses in budget stabilization funds, and faster adjustment in response to fiscal shocks.
Table 1—Summary Statistics: Strict versus Weak Budget Rules States (1988–2004)
Mean SD Mean SD
Variable Strong Weak
(1) (2) (3) (4)
fiscal variables ($ per capita) State general fund expenditures 1,612 498 1,926 650 State general fund revenues 1,620 503 1,925 657 Total taxes as share of gen. rev. 0.51 0.05 0.55 0.06 Pers. inc. taxes as share of gen. rev. 0.19 0.07 0.24 0.05 Defshock −5 89 13 98 ∆Revenue (for next fiscal year) 9 51 8 70 ∆Outlays −14 31 −13 30
Economic variables Personal income ($ per capita)** 26,699 4,414 32,342 5,139 Employment shocks (Bartik 1991) 0.022 0.015 0.023 0.013
demographic variables State population (1000s) 3,265 2,070 12,100 8,974 Drop out fraction 0.18 0.04 0.17 0.03 High school grad fraction 0.27 0.03 0.27 0.04 Some college fraction 0.18 0.04 0.17 0.03 College plus fraction 0.15 0.03 0.17 0.04 Medicaid fraction 0.10 0.04 0.11 0.03 Senior fraction 0.12 0.02 0.12 0.02 Child fraction 0.28 0.03 0.27 0.02
Observations 317 131
Notes: ** and * indicate statistically significant differences between the means for weak- and strong-budget rule states at the 0.01 and 0.05 levels respectively. The combined sample includes data on the 27 annually budget-ing states listed in Table 2 for the period 1988–2004. Several observations are unavailable due to incomplete data reporting, leaving a final sample of 448 observations. Columns 1 and 2 report data for the states identified in Table 2 as having “Strong” budget rules while columns 3 and 4 report data for states identified in Table 2 as having “Weak” or “Medium” budget rules. Fiscal variables were generated using data from the Census of Government’s (COG) Annual survey of state and Local Government finances and the National Association of State Budget Officer’s (NASBO) semiannual series fiscal surveys of the states. Income data come from the Bureau of Economic Analysis, employment data come from the Bureau of Labor Statistics, and demographic data come from the March Demographic Supplements to the Current Population Survey.

56 AmERiCAN ECoNomiC JouRNAL: ECoNomiC PoLiCy mAy 2012
The fiscal behavior of interest takes the form of mid-year tax increases and spending reductions that narrow unexpected deficits as they emerge. Since timing is central to this application, we follow Poterba (1994) in restricting our sample to a subset of 27 states with annual budgetary cycles and annual legislative cycles.21
We generate our measure of budget rules using a 1–10 index produced by the ACIR (1987). We designate the eight states with scores less than seven as “weak-rule” states. This is the cutoff associated with the relatively crucial distinction between states with and without a rule that approximates the No-Carry rule. We con-sider a further subdivision of the weak-rule states into states with rules of weak- and medium-stringency.22 Table 2 provides a breakdown of the states in each classifica-tion. Table 1 reports summary statistics (separately for states with weak and strong rules) for the fiscal variables analyzed in the current section as well as for addi-tional economic and demographic characteristics. Apparent differences between the
21 Adding an additional set of states, in which legislative cycles are annual while budgetary cycles are biennial, has little impact on the results. As expected, the further introduction of the states with biennial legislative cycles and biennial budgetary cycles significantly weakens the first stage relationship presented below.
22 In addition to the ACIR and NASBO classifications of budget rules, a classification can also be found in a 1993 report by GAO. Differences between these classification systems are the subject of an exchange between Levinson (1998, 2007), and Krol and Svorny (2007). An alternative classification scheme, based on direct read-ings of statutes and constitutions across states, has also been recently produced by Hou and Smith (2006). The literature points toward the notion that state political culture may ultimately be as important as the actual content of the requirements themselves (NCSL 2010). We focus on the ACIR classification system because of its power for predicting states’ mid-year budget cuts. We also note that a close reading of the GAO report suggests a classifica-tion much closer to that from the ACIR than is apparent on first glance. Specifically, the report’s Table I.3 classifies four of ACIR’s weak-rule states as strong-rule states. In each case, however, the classification is linked to a footnote stating “Although these states require year-end budget balance, carryover and/or borrowing to finance a deficit are allowed if necessary” (emphasis added). The note implies that the requirement does not bind these states in a seri-ous way, making us comfortable with the ACIR’s weak-rule classification.
Table 2—Rules Classification
Weak rules Medium rules Strong rules
Connecticut California AlabamaIllinois Maryland ArizonaLouisiana Michigan ColoradoNew York Pennsylvania Delaware
GeorgiaIdahoIowaKansasMississippiMissouriNew JerseyNew MexicoOklahomaRhode IslandSouth CarolinaSouth DakotaTennesseeUtah
West Virginia
Notes: The table contains a classification of the 27 states with annual budget cycles that are included in our final sample. States were ranked according to a stringency index found in Table 3—of ACIR (1987). States with an index value less than 5 are classified as weak, an index equal to 5 or 6 as medium, and an index exceeding 6 as strong. When we classify states as strong or weak, the states classified as medium are shifted into the weak classification.

VoL. 4 No. 2 57CLEmENs ANd miRAN: suBNAtioNAL fisCAL PoLiCy
groups are that weak-rule states tend to be highly populous and have high incomes. These cross-state differences help to inform our robustness analysis.
We look to states’ mid-year spending cuts and tax increases (∆outlayst and ∆Revenuet), in particular to the extent that they are driven by differences in states’ balanced budget requirements, as sources of variation of the sort described in Section II. This leads us to estimate equations (4) and (5), which are similar to specifications implemented by Poterba (1994):
(4) Δoutlay s s, t = β 1 weakBB R s defshoc k s, t + β 2 defshoc k s, t
+ β 3, s δ s + β 4, t δ t + ε s, t
(5) ΔRevenu e s, t = γ 1 weakBB R s defshoc k s, t + γ 2 defshoc k s, t
+ γ 3, s δ s + γ 4, t δ t + μ s, t .
In terms of the econometric framework laid out in Section II, the interaction between the deficit shock and the indicator for weak budget rules, weakBBRs defshocks, t , is the instrument (Zs, t) while the main effect of the deficit shock is an essential ele-ment of the vector of control variables (Xs, t). The reason for this will become clear in Section V when we discuss the intuition behind the key identifying assumption associated with multiplier estimation. In the empirical implementation, we split the deficit shocks into distinct variables for their positive and negative values. Budget rules only have binding implications in the face of positive (i.e., adverse) deficit shocks, so that the relevant instrument is weakBBRs defshocks, t × 1{defshock > 0}.
Table 3 presents an initial set of results describing the behavior of state govern-ments facing unexpected fiscal shocks from 1988 through 2004. Columns 1 and 2 report results for mid-year budget cuts and mid-year tax increases, respectively, with all 27 states in the sample grouped together. These results show that states do little in response to negative deficit shocks while enacting significant budget cuts and tax increases in response to positive shocks.23 The budget cuts average 29.2 cents per dollar of deficit shock (estimated with a standard error of 5.5 cents) while the tax increases average 6.4 cents (estimated with a standard error of 2.2 cents). The estimated tax increases are for the fiscal year during which the shock occurs. Since mid-year tax increases will tend, in general, to be in effect for fewer than 6 months out of the current fiscal year, the current-year collections can be much smaller than the new collections scheduled for the following fiscal year.
Columns 3 through 6 of Table 3 divide states into classification by strong and weak budget rules (columns 3 and 4) and by strong, medium, and weak budget rules (columns 5 and 6). These columns show that the mid-year budget cuts are concen-trated in states with relatively strict balanced budget requirements. While strong-rule
23 The absence of a mid-year spending response to negative deficit shocks may be driven by the fact that NASBO only reports mid-year spending cuts, and not mid-year spending increases. As discussed in Section III, this may largely reflect institutional realities rather than measurement error. Outside of the normal legislative cycle, it is more difficult for appropriations to be increased than for them to be rescinded.

58 AmERiCAN ECoNomiC JouRNAL: ECoNomiC PoLiCy mAy 2012
states enact an average of 38.3 cents in budget cuts per dollar of deficit shock, weak-rule states enact an average of 14.0 cents in such cuts. The standard error on the 24.3 cent differential is 5 cents, making the difference highly significant statistically. The strong, medium, and weak classification yields quite similar results.24
The budget rules turn out not to predict mid-year tax increases to a degree that could be regarded as either economically or statistically significant. This result is crucial for characterizing the proposed natural experiment in fiscal policy (as dis-cussed in Section II). The result implies that the interaction between budget rules and deficit shocks can be viewed as isolating a shock to spending that is deficit financed, with no change in current tax revenues.
Table 4 divides the sample into groups of years, with 1988–1994 representing an initial period during which states experienced significant fiscal stress, 1995–2000 representing an expansionary period during which states experienced few positive deficit shocks, and 2001–2004 representing a second period of fiscal stress. State behavior during the two periods of stress is broadly similar. The principal difference is that states enacted less in the way of mid-year tax increases from 2001 to 2004 (on the order of 7.7 cents per dollar of deficit shock versus 14.5 cents during the earlier period).
Differences between the expansionary period and the two periods of stress are striking. Deficit shocks are generally un-predictive of state governments’ mid-year actions during the 1995–2000 expansion. None of the estimates for this period are
24 These results are quite consistent with results from Poterba (1994). Other results, which we do not report, are also broadly consistent with Poterba’s findings. This includes the finding that states with relatively large balances in their stabilization funds enact less in the way of mid-year spending reductions per dollar of deficit shock.
Table 3—First Stage Regressions: Effect of Budget Rules on Mid-Year Adjustments
∆Outlays ∆Revenues ∆Outlays ∆Revenues ∆Outlays ∆Revenues
(1) (2) (3) (4) (5) (6)Defshock × 1{Defshock > 0} −0.292 0.0641 −0.383 0.0716 −0.383 0.0717
(0.0552) (0.0223) (0.0462) (0.0305) (0.0462) (0.0306)Defshock × 1{Defshock < 0} 0.00220 0.0273 0.0248 0.0220 0.0246 0.0220
(0.0142) (0.0107) (0.0156) (0.0165) (0.0157) (0.0166)Weak rules × Defshock 0.243 −0.0198 0.188 −0.0130 × 1{Defshock > 0} (0.0506) (0.0316) (0.0400) (0.0334)Weak rules × Defshock −0.0408 0.0127 −0.0317 0.0145 × 1{Defshock < 0} (0.0276) (0.0209) (0.0363) (0.0265)Medium rules × Defshock 0.277 −0.0233 × 1{Defshock > 0} (0.0615) (0.0354)Medium rules × Defshock −0.0528 0.00850 × 1{Defshock < 0} (0.0290) (0.0206)
State and year effects? Yes Yes Yes Yes Yes YesObservations 448 448 448 448 448 448
Notes: Standard errors, calculated allowing for arbitrary correlation at the state level, are in parentheses beneath each point estimate. In all columns, the sample contains the 27 annually budgeting states listed in Table 2. Classification of each state’s balanced budget requirements is described in the note to Table 2. Construction of the deficit shock variables is described in detail in the text. The fiscal outcome variables were constructed using data from the National Association of State Budget Officer’s (NASBO) semiannual series fiscal surveys of the states.

VoL. 4 No. 2 59CLEmENs ANd miRAN: suBNAtioNAL fisCAL PoLiCy
statistically significant and the interaction between budget rules and positive deficit shocks yields an economically large, wrong signed, and highly imprecise coefficient in the regression involving mid-year outlay changes. The imprecision is driven in large part by the fact that there are very few observations involving positive deficit shocks in states with weak budget rules during this period. These were also years when states were more likely to have surpluses left over from prior years, making it possible for them to balance their budgets with smaller mid-year spending reduc-tions and tax increases. The measurement of deficit shocks may also be more error prone during expansionary years due to the absence of reporting on mid-year spend-ing increases. For these reasons, we restrict the sample to the periods of fiscal stress when estimating the effect of state budget cuts on state economies.
The absence of predictive power during expansions need not pose a problem for efforts to estimate the effect of government spending “on impact” during recessions. However, it does raise problems for efforts to estimate multipliers in models with lag structures. The absence of a clean, extended time series is not conducive to efforts to account for complex dynamics.
V. Estimating the Government Spending Multiplier
We now use equation (4) as the first stage in an instrumental variables strategy for estimating the effect of budget cuts on state income. The estimating framework is summarized below:
(6) G s, t = β 1 weakBB R s defshoc k s, t + β 2 defshoc k s, t + β 3, s δ s + β 4, t δ t
y s, t = γ 1 G s, t + γ 2 defshoc k s, t + γ 3, s α s + γ 4, t α t + ε s, t ,
Table 4—First Stage Regressions: Period by Period
∆Outlays ∆Revenues ∆Outlays ∆Revenues ∆Outlays ∆Revenues
(1) (2) (3) (4) (5) (6)1988–1994 1995–2000 2001–2004
Defshock −0.420 0.145 −0.0975 −0.0556 −0.383 0.0769 × 1{Defshock > 0} (0.0633) (0.0517) (0.0951) (0.0427) (0.0734) (0.0495)Defshock 0.0885 −0.0260 −0.0417 0.0390 0.0830 0.0505 × 1{Defshock < 0} (0.0358) (0.0287) (0.0285) (0.0271) (0.0805) (0.0386)Weak rules × Defshock 0.301 −0.0731 −0.986 −0.117 0.404 −0.0249 × 1{Defshock > 0} (0.0744) (0.0611) (0.600) (0.116) (0.0828) (0.0589)Weak rules × Defshock −0.101 0.0384 0.0872 0.0794 −0.158 −0.0425 × 1{Defshock < 0} (0.0448) (0.0335) (0.0641) (0.0567) (0.0906) (0.0404)
State and year effects? Yes Yes Yes Yes Yes YesObservations 182 182 160 160 106 106
Notes: Standard errors, calculated allowing for arbitrary correlation at the state level, are in parentheses beneath each point estimate. In all columns, the sample contains the 27 annually budgeting states listed in Table 2. Classification of each state’s balanced budget requirements is described in the note to Table 2. Sample years are restricted as described in the current table’s column headings. Construction of the deficit shock variables is described in detail in the text. The fiscal outcome variables were constructed using data from the National Association of State Budget Officer’s (NASBO) semiannual series fiscal surveys of the states.

60 AmERiCAN ECoNomiC JouRNAL: ECoNomiC PoLiCy mAy 2012
where G s, t represents the mid-year outlay changes from Section IV and where, again as in Section IV, the specifications are implemented with distinct variables for the positive and negative values of the deficit shocks.
Given the differences between states with weak and strong budget rules (as reported in Table 1), it is crucial to account for differentials in income levels and trends across states. We account for such differences by detrending each state’s income series using the Hodrick-Prescott filter.25 Before presenting the estimates, we devote the next subsection to describing the economic intuition behind the key identifying assumption. We discuss the principal threat to this assumption, and our methods for taking that threat into account, in detail.
A. identification
The key identifying assumption can be written as follows:
E (weakBB R s × defshoc k s, t × ε s, t ) = 0.
In short, the excluded instrument, weakBBRs defshocks, t , must be uncorrelated with the second stage error term. We develop intuition in the following paragraph.
Noting that weakBBRs is binary, we can re-write this condition in two pieces:
(1 − p weakBBR ) × E (weakBB R s × defshoc k s, t × ε s, t | weakBB R s = 0)
p weakBBR × E (weakBB R s × defshoc k s, t × ε s, t | weakBB R s = 1) = 0.
where pweakBBR is the probability that a state has weak budget rules. The first piece of this expression automatically equals 0 since it is the piece for which weakBBRs always equals 0. Hence we are left with
p weakBBR × E (weakBB R s × defshoc k s, t × ε s, t | weakBB R s = 1) = 0
as the exclusion restriction, with weakBBRs always equal to one. Since we include the main effect of the deficit shock in our regressions, it follows from the prop-erties of ordinary least squares that E(defshoc k s, t × ε s, t ) = 0. Consequently, we can write that if E(defshoc k s, t × ε s,t ) = E(defshoc k s, t × ε s, t | weakBB R s = 1), then E(defshoc k s, t × ε s, t | weakBB R s = 1) = 0. In words, the restriction is satisfied if the unconditional expectation of the deficit shock times the second stage error equals that same expectation conditional on a state having weak budget rules. We interpret this as requiring that the deficit shock variables have similar economic content in weak- and strong-rule states.
The primary threat to this condition stems from differences in the revenue bases utilized across states. Revenue bases with different elasticities (with respect to eco-nomic conditions) can lead an economic shock of given size to result in deficit
25 We use the conventional smoothing parameter of 6.25 when working with annual observations and of 1,600 when working with quarterly observations, as recommended by Ravn and Uhlig (2002).

VoL. 4 No. 2 61CLEmENs ANd miRAN: suBNAtioNAL fisCAL PoLiCy
shocks that differ across states. As reported in Table 1, taxation accounts for 55 per-cent of general revenues in weak-rule states and 51 percent in strict-rule states, with personal income tax revenue accounting for the entire difference. This raises concern because personal income taxes tend to be more volatile than other revenue sources. Consequently, an economic shock of a given size may, all else equal, result in a relatively large deficit shock in the weak-rule states. If true, this would upwardly bias our multiplier estimates. Conditional on their deficit shocks, weak-rule states would have better performing economies than strong-rule states for reasons unre-lated to their budget cuts.
We implement two checks to account for bias that may result from this difference in revenue bases. First, we directly allow the relationship between deficit shocks and income to vary with the share of revenues raised through income taxation. We do this by controlling for an interaction between the income-tax share and the main effects of the deficit shock variables. Second, we explore the timing with which our initial estimates of the effect of mid-year outlay changes on income arrive. If the avoidance of mid-year budget cuts is truly improving a state’s economic per-formance, the improvement should arrive during the latter half of the fiscal year. It is only during this latter portion of the year that the fiscal policies of states with different balanced budget requirements diverge.26 The evidence suggests that these concerns are relevant, as estimates that control for the tax interactions mentioned above or that control for the condition of the economy prior to the implementation of budget cuts are smaller than estimates that take neither measure.
B. Baseline Results
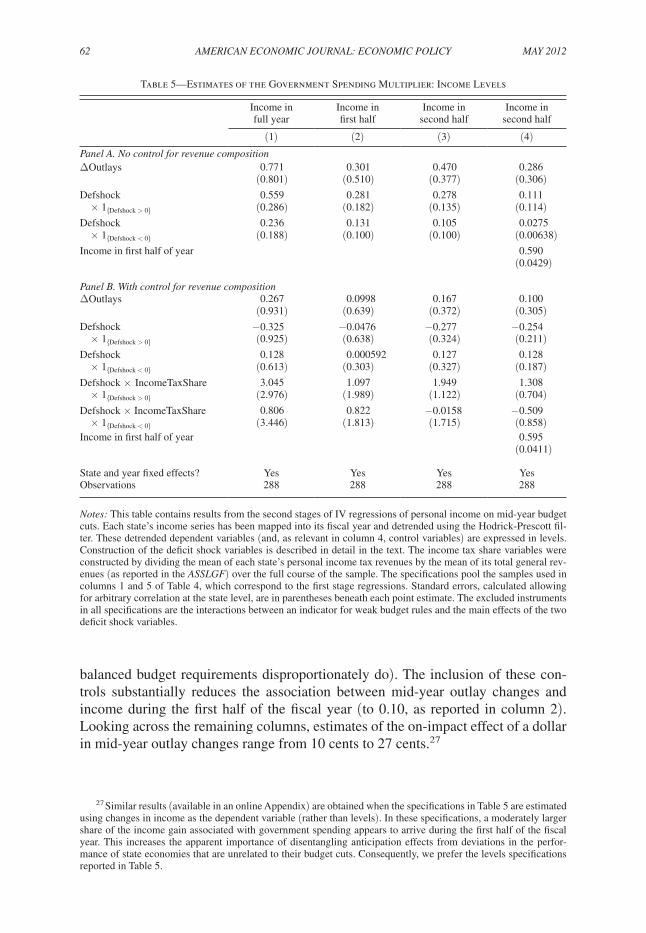
Panel A of Table 5 presents initial estimates of the effect of mid-year outlay changes on the level of detrended income. When looking at income over the full course of the fiscal year (column 1), an additional dollar in outlays is associated with an additional 77 cents in income. Columns 2 and 3 break down the timing with which this additional income arrives, showing that 30 cents arrive during the first half of the fiscal year while 47 cents arrive during the second half. Since mid-year budget cuts do not occur until the latter half of the fiscal year, there is reason for concern that the 30 cents reflect superior economic performance that is unrelated to fiscal policy; as discussed above, this would violate the key assumption for unbiased estimation of the multiplier. We control for this directly in column 4 by estimating the effect of budget cuts on income during the second half of the fiscal year while controlling for income during the first half of the fiscal year; this yields an on-impact multiplier estimate of 0.29.
In panel B (otherwise the same as panel A) we introduce controls that allow deficit shocks to have different relationships with state business cycles when states rely heavily on the relatively volatile individual income tax (as states with weak
26 We keep in mind that the anticipation of government spending can result in effects prior to the time at which the spending occurs (see Mertens and Ravn 2012). In the current setting, however, anticipation effects do not seem particularly plausible. To the extent that deficit shocks are unexpected, such effects would have to occur between early-year recognition of the shock and mid-year implementation of the budget cuts.
62 AmERiCAN ECoNomiC JouRNAL: ECoNomiC PoLiCy mAy 2012
balanced budget requirements disproportionately do). The inclusion of these con-trols substantially reduces the association between mid-year outlay changes and income during the first half of the fiscal year (to 0.10, as reported in column 2). Looking across the remaining columns, estimates of the on-impact effect of a dollar in mid-year outlay changes range from 10 cents to 27 cents.27
27 Similar results (available in an online Appendix) are obtained when the specifications in Table 5 are estimated using changes in income as the dependent variable (rather than levels). In these specifications, a moderately larger share of the income gain associated with government spending appears to arrive during the first half of the fiscal year. This increases the apparent importance of disentangling anticipation effects from deviations in the perfor-mance of state economies that are unrelated to their budget cuts. Consequently, we prefer the levels specifications reported in Table 5.
Table 5—Estimates of the Government Spending Multiplier: Income Levels
Income in full year
Income in first half
Income in second half
Income in second half
(1) (2) (3) (4)Panel A. No control for revenue composition∆Outlays 0.771 0.301 0.470 0.286
(0.801) (0.510) (0.377) (0.306)Defshock 0.559 0.281 0.278 0.111 × 1{Defshock > 0} (0.286) (0.182) (0.135) (0.114)Defshock 0.236 0.131 0.105 0.0275 × 1{Defshock < 0} (0.188) (0.100) (0.100) (0.00638)Income in first half of year 0.590
(0.0429)
Panel B. With control for revenue composition∆Outlays 0.267 0.0998 0.167 0.100
(0.931) (0.639) (0.372) (0.305)Defshock −0.325 −0.0476 −0.277 −0.254 × 1{Defshock > 0} (0.925) (0.638) (0.324) (0.211)Defshock 0.128 0.000592 0.127 0.128 × 1{Defshock < 0} (0.613) (0.303) (0.327) (0.187)Defshock × IncomeTaxShare 3.045 1.097 1.949 1.308 × 1{Defshock > 0} (2.976) (1.989) (1.122) (0.704)Defshock × IncomeTaxShare 0.806 0.822 −0.0158 −0.509 × 1{Defshock < 0} (3.446) (1.813) (1.715) (0.858)Income in first half of year 0.595
(0.0411)
State and year fixed effects? Yes Yes Yes YesObservations 288 288 288 288
Notes: This table contains results from the second stages of IV regressions of personal income on mid-year budget cuts. Each state’s income series has been mapped into its fiscal year and detrended using the Hodrick-Prescott fil-ter. These detrended dependent variables (and, as relevant in column 4, control variables) are expressed in levels. Construction of the deficit shock variables is described in detail in the text. The income tax share variables were constructed by dividing the mean of each state’s personal income tax revenues by the mean of its total general rev-enues (as reported in the AssLGf) over the full course of the sample. The specifications pool the samples used in columns 1 and 5 of Table 4, which correspond to the first stage regressions. Standard errors, calculated allowing for arbitrary correlation at the state level, are in parentheses beneath each point estimate. The excluded instruments in all specifications are the interactions between an indicator for weak budget rules and the main effects of the two deficit shock variables.

VoL. 4 No. 2 63CLEmENs ANd miRAN: suBNAtioNAL fisCAL PoLiCy
C. interpreting the Results
Before discussing the robustness of the results in Table 5 to a variety of specifica-tion changes, we take a moment to highlight key issues related to their interpreta-tion. The standard error on the coefficient of interest tends to be around 0.4 (higher in the full-year specifications in the table’s first column), making the coefficients statistically indistinguishable from 0. In this setting, the null hypothesis of a coef-ficient of 0 implies substantial Ricardian effects. It requires debt-financed govern-ment spending to crowd out the sum of private consumption and investment on a one-for-one basis. The negative lower bounds on our estimates’ confidence intervals imply that our results cannot be taken as evidence against this view.
Our results are much more informative, in particular in the context of the existing literature, in terms of our confidence intervals’ upper bounds. In specifications that focus on the second half of the fiscal year, point estimates consistently fall well below 1. The upper reach of the 95 percent confidence bounds in these specifications aver-ages just above 1. We read this as evidence that the effect of government spending on income, at least on impact, includes nontrivial crowding out of private sector activity.
An important role for Ricardian effects can reconcile our results with other recent papers in the literature. Notably, Shoag (2011), and Serrato and Wingender (2011) estimate state government spending multipliers on the order of 2.1 and 1.9, in each case with a standard error of 0.9. As discussed in Section II, the spending shocks analyzed by these authors are effectively windfall financed, which eliminates the possibility of Ricardian effects.
While the evidence of Ricardian effects is reasonably strong for the period during which mid-year outlay changes occur, we have difficulty delivering clean or precise estimates of government spending’s total effect for two reasons. First, as briefly mentioned above, it is possible for government spending to affect economic activ-ity prior to that spending’s arrival if it is anticipated by the private sector (see, e.g., Mertens and Ravn 2012). We are not well positioned to disentangle such anticipa-tion effects from divergences in state economic conditions for which we need to control.
Second, traditional Keynesian responses to government spending need not unfold instantly and may be realized over the course of several periods. Unfortunately, our empirical framework is ill-suited to estimating such effects (see, e.g., the discussion toward the end of this paper’s Section IV, and Shoag’s 2011 discussion of impedi-ments to estimating the persistence of government spending’s effects). We cannot rule out the possibility of meaningful income gains over the following fiscal year.
D. Robustness of the Baseline Results
Tables 6, 7, and 8 provide a sense for the robustness of the baseline results to a variety of specification changes. The seed specification for the robustness checks is the specification in which the effect of mid-year outlay changes was estimated on the level of income in the second half of the fiscal year, controlling for the level of income in the first half of the fiscal year (from column 4 of panel A in Table 1). The robustness demonstrated in these tables is by no means unique to this particular specification.

64 AmERiCAN ECoNomiC JouRNAL: ECoNomiC PoLiCy mAy 2012
Table 6—Robustness to Inclusion of Controls
Income levels
(1) (2) (3) (4)∆Outlays 0.286 0.285 0.300 0.101
(0.306) (0.305) (0.304) (0.221)Defshock 0.111 0.110 0.132 −0.349 × 1{Defshock > 0} (0.114) (0.114) (0.109) (0.157)Defshock 0.0275 0.0296 0.0228 0.112 × 1{Defshock < 0} (0.0638) (0.639) (0.0591) (0.272)Income in first half of year 0.591 0.587 0.586 0.595
(0.0429) (0.0424) (0.0424) (0.0372)Bartik shock 267.1
(174.1)Federal aid to the state 0.0425
(0.0307)Defshock × IncomePerCapita 1.28 × 1{Defshock > 0} (0.57)Defshock × IncomePerCapita −0.27 × 1{Defshock < 0} (0.82)State and year fixed effects? Yes Yes Yes YesObservations 288 288 288 288
Notes: Column 1 replicates column 4 in panel A of Table 5. The remaining specifications differ only in terms of the inclusion of the additional controls described in the table. The Bartik Shock variable is constructed as described by Bartik (1991) and represents exogenous shocks to state economies due to changes in the industrial composition of the national economy. This variable is much more strongly predictive of detrended income (coefficient of 1,104 with a standard error of 374) when we do not simultaneously control for state income during the first half of the fis-cal year. Federal Aid to the State is taken from the AssGLf. IncomePerCapita is calculated as the average (taken across all years of the sample) level of real income per capita in each state, and has been expressed in hundreds of thousands of dollars.
Table 7—Robustness to Sample Changes
Income
Baseline Recession one Recession twoIncluding
boom years
Including states that legislate
annually
(1) (2) (3) (4) (5)∆Outlays 0.286 0.564 −0.0212 0.189 0.235
(0.306) (0.397) (0.391) (0.287) (0.255)Defshock 0.111 0.208 0.0137 0.0724 0.0848 × 1{Defshock > 0} (0.114) (0.160) (0.137) (0.107) (0.0937)Defshock 0.0275 0.169 −0.234 −0.0367 0.0290 × 1{Defshock < 0} (0.0638) (0.0567) (0.0707) (0.0568) (0.0493)Income in first half of year 0.590 0.549 0.627 0.584 0.610
(0.0429) (0.0555) (0.0735) (0.0398) (0.0340)State and year fixed effects? Yes Yes Yes Yes YesObservations 288 182 106 448 429
Notes: Column 1 replicates column 4 in panel A of Table 5. The remaining specifications differ only in terms of sample selection criteria. In column 2 the sample is restricted to the 1988–1994 period of fiscal stress (as in columns 1 and 2 of Table 4). In column 3 the sample is restricted to the 2001–2004 period of fiscal stress (as in columns 5 and 6 of Table 4). In column 4 the Baseline sample is augmented to include the expansion period from 1995–2000 (which was investigated in isolation in columns 3 and 4 of Table 4). In column 5 the Baseline sample is augmented to include an additional set of states that legislate annually despite budgeting biennially. We find that this set of states (which includes Florida, Hawaii, Indiana, Iowa, Kansas, Maine, Minnesota, Nebraska, New Hampshire, Ohio, Vermont, Virginia, Washington, Wisconsin, and Wyoming) behaves in the same manner as those that both budget and legislate annually in terms of their first stage responses to deficit shocks.

VoL. 4 No. 2 65CLEmENs ANd miRAN: suBNAtioNAL fisCAL PoLiCy
The results presented involve the inclusion of additional control variables, changes in the sample on which estimation is conducted, and changes related to the inclusion of fixed effects and trends. Additional control variables of interest include shocks to state economic conditions (constructed following Bartik 1991, and Blanchard and Katz 1992), federal aid to state governments, and an interaction between a state’s income per capita and the measure of fiscal shocks. The latter control is relevant because income per capita was one of the principle characteristics along which weak rule states differed from strict rule states. Changes to the sample include splitting the sample across the two periods of fiscal stress, expanding the sample to include the 1995–2000 expansion, and expanding the sample to include states that operate with annual legislative cycles despite having biennial budgetary cycles. Changes to the specification of the fixed effects include dropping fixed effects and year effects altogether, expanding the set of fixed effects to allow each state a distinct fixed effect during the earlier (1988–1994) and latter (2001–2004) portions of the sample, and controlling for state-specific trends.
Tables 6, 7, and 8 show that these specification changes have minor impacts on the results. In specifications not reported, we have also found that the results are robust to altering the smoothing parameter associated with the HP-filtering of state income as well as to changing the manner in which the instruments are specified.28 They are similarly robust to changes in the frequency of the income data on which HP-filtering is conducted.
28 We consider two alterations to the specification of the instruments. First, results are essentially unchanged by replacing the weak/strong classification with the weak/medium/strong classification shown in Table 2. Second, we show that the results are unchanged by dropping the interaction between negative deficit shocks and the budget-rules indicator (which has little predictive power in the first-stage regressions) from the specification.
Table 8—Robustness to the Specification of the Fixed Effects
Income
(1) (2) (3) (4)∆Outlays 0.286 0.474 0.262 0.241
(0.306) (0.333) (0.311) (0.273)Defshock × 1{Defshock > 0} 0.111 0.0912 0.107 0.0995
(0.114) (0.128) (0.104) (0.0855)Defshock × 1{Defshock < 0} 0.0275 −0.0496 0.0322 0.0246
(0.0638) (0.0431) (0.0680) (0.656)Income in first half of year 0.590 0.646 0.585 0.576
(0.0429) (0.0408) (0.0432) (0.0410)Year effects Yes No Yes YesState fixed effects Yes No No YesCycle-specific state effects No No Yes NoState-specific trends No No No YesObservations 288 288 288 288
Notes: Column 1 replicates column 4 in panel A of Table 5. The remaining specifications differ only in terms of the manner in which fixed effects and trends are specified. The sets of controls included in each specification are described in the bottom rows of the table. Cycle-specific state effects mean that distinct sets of state fixed effects are included for the two periods of fiscal stress in the sample. For example, there is one variable set equal to one if an observation corresponds to New York for a year between 1988 and 1994; there is a separate variable equal to one if an observation corresponds to New York for a year between 2001 and 2004.

66 AmERiCAN ECoNomiC JouRNAL: ECoNomiC PoLiCy mAy 2012
VI. Conclusion
This paper examines the behavior of state governments over the course of the business cycle. A key feature of this behavior is the pro-cyclicality of expenditures on capital infrastructure and service provision, which scale nearly proportionately with the size of the state’s economy. When state income is one dollar below trend, these non-safety-net expenditures are, on average, 8 cents below trend. Our mul-tiplier estimates suggest that this pro-cyclicality has a less dramatic impact on the volatility of the business cycle than one might expect. If a dollar in spending cuts reduces state income by 50 cents (toward the high end of our estimates), pro-cycli-cal state spending would be the cause of roughly four percent of state-level income volatility. Of course, this estimate is subject to same degree of imprecision as our multiplier estimates.
The recent literature on subnational fiscal policy has generated new sources of variation for estimating government spending multipliers. We briefly summarize key advantages and disadvantages of the applied micro-econometric approaches taken by papers in this literature (the current paper included). Their advantages include the transparency of their sources of econometric identification and the tight cor-respondence between the source of identification and the spending associated with real-world fiscal policy options. Disadvantages include their difficulty in estimating the dynamic effects of fiscal policy (which are best captured by more structural approaches) and their tendency to produce imprecise estimates.
Large standard errors have prevented the literature from pinning down precise estimates of fiscal policy multipliers of interest. Nonetheless, we argue that cross-study comparisons can shed light on what forces are at work. As discussed above, our relatively low multiplier estimates (based on deficit-financed government spend-ing) can be reconciled with the larger estimates in several recent studies (based on windfall-financed government spending) if government debt crowds out current pri-vate consumption and investment. We view these contrasting, but not contradictory, results as evidence of an important role for neoclassical considerations.
Important differences between subnational and national fiscal policy must also be kept in mind in interpreting our results. Gramlich (1987) contributes a very clear discussion of issues that arise in comparing multipliers across levels of government. Importantly, cross-state imports (referred to in this context as “consumption leak-ages”) may reduce subnational multipliers relative to national multipliers. Labor mobility may work in the opposite direction if workers cross borders in response to employment opportunities generated by government spending. Maintaining statistical power, while dividing samples along margins relevant for investigating these consider-ations, will require better sources of variation than those used in this literature to date.
REFERENCES
Advisory Commission on Intergovernmental Relations. 1987. fiscal discipline in the federal sys-tem: National Reform and the Experience of the states. ACIR Report A-107. Washington, DC, July.
Auerbach, Alan J., and William G. Gale. 2009. “Activist Fiscal Policy to Stabilize Economic Activity.” In financial stability and macroeconomic Policy, 327–74. Jackson Hole, WY: Federal Reserve Bank of Kansas City.

VoL. 4 No. 2 67CLEmENs ANd miRAN: suBNAtioNAL fisCAL PoLiCy
Auerbach, Alan. J., and Yuriy Gorodnichenko. 2012. “Measuring the Output Responses to Fiscal Pol-icy.” American Economic Journal: Economic Policy 4 (2): 1–27.
Barro, Robert J. 1974. “Are Government Bonds Net Wealth?” Journal of Political Economy 82 (6) 1095–1117.
Barro, Robert J., and Charles J. Redlick. 2011. “Macroeconomic Effects from Government Purchases and Taxes.” Quarterly Journal of Economics 126 (1): 51–102.
Bartik, Timothy J. 1991. Who Benefits from state and Local Economic development Policies? Kalam-azoo, MI: W. E. Upjohn Institute for Employment Research.
Blanchard, Olivier Jean, and Lawrence F. Katz. 1992. “Regional Evolutions.” Brookings Papers on Economic Activity 23 (1): 1–61.
Blanchard, Olivier, and Roberto Perotti. 2002. “An Empirical Characterization of the Dynamic Effects of Changes in Government Spending and Taxes on Output.” Quarterly Journal of Economics 117 (4): 1329–68.
Bohn, Henning, and Robert P. Inman. 1996. “Balanced-Budget Rules and Public Deficits: Evidence from the U.S. States.” Carnegie-Rochester Conference Series on Public Policy 45: 13–76.
Chodorow-Reich, Gabriel, Laura Feiveson, Zachary Liscow, and William Gui Woolston. Forthcoming. “Does State Fiscal Relief During Recessions Increase Employment? Evidence from the American Recovery and Reinvestment Act.” American Economic Journal: Economic Policy.
Clemens, Jeffrey, and Stephen Miran. 2012. “Fiscal Policy Multipliers on Subnational Government Spending: Dataset.” American Economic Journal: Economic Policy. http://dx.doi.org/10.1257/pol.4.2.46.
Cogan, John F., Tobias Cwik, John B. Taylor, and Volker Wieland. 2010. “New Keynesian versus Old Keynesian Government Spending Multipliers.” Journal of Economic dynamics and Control 34 (3): 281–95.
Cohen, Lauren, Joshua Coval, and Christopher Malloy. 2011. “Do Powerful Politicians Cause Corpo-rate Downsizing?” Journal of Political Economy 119 (6): 1015–60.
Favero, Carlo, and Francesco Giavazzi. 2012. “Measuring Tax Multipliers. The Narrative Method in Fiscal VARs.” American Economic Journal: Economic Policy 4 (2): 69–94.
Gramlich, Edward M. 1987. “Subnational Fiscal Policy.” In Perspectives on Local Public finance and Public Policy, Vol. 3, edited by John M. Quigley, 3–27. Cambridge, MA: Harvard University Press.
Hou, Y. and D. L. Smith. 2006. “A Framework for Understanding State Balanced Budget Requirement Systems: Reexamining Distinctive Features and an Operational Definition.” Public Budgeting & finance 26 (3): 22–45.
Jaeger, Albert. 1994. “Mechanical Detrending by Hodrick-Prescott Filtering: A Note.” Empirical Eco-nomics 19 (3): 493–500.
Krol, Robert, and Shirley Svorny. 2007. “Budget Rules and State Business Cycles.” Public finance Review 35 (4): 530–44.
Levinson, Arik. 1998. “Balanced Budgets and Business Cycles: Evidence from the States.” National tax Journal 51 (4): 715–32.
Levinson, Arik. 2007. “Budget Rules and State Business Cycles: A Comment.” Public finance Review 35 (4): 545–49.
Lowry, Robert C., and James E. Alt. 2001. “A Visible Hand? Bond Markets, Political Parties, Balanced Budget Laws, and State Government Debt.” Economics and Politics 13 (1): 49–72.
Mertens, Karel, and Morten O. Ravn. 2012. “Empirical Evidence on the Aggregate Effects of Antici-pated and Unanticipated U.S. Tax Policy Shocks.” American Economic Journal: Economic Policy 4 (2): 145–81.
Mountford, Andrew, and Harald Uhlig. 2009. “What Are the Effects of Fiscal Policy Shocks?” Journal of Applied Econometrics 24 (6): 960–92.
Nakamura, Emi, and Jon Steinsson. 2011. “Fiscal Stimulus in a Monetary Union: Evidence from U.S. Regions.” www.columbia.edu/~en2198/papers/fiscal.pdf.
National Association of State Budget Officers. Various Years. The Fiscal Survey of States. A Report by the National Governors Association and the National Association of State Budget Officers.
Poterba, James M. 1994. “State Responses to Fiscal Crises: The Effects of Budgetary Institutions and Politics.” Journal of Political Economy 102 (4): 799–821.
Poterba, James M. 1997. “Do Budget Rules Work?” In fiscal Policy: Lessons from Economic Research, edited by Alan J. Auerbach, 53–86. Cambridge, MA: MIT Press.
Poterba, James M., and Kim S. Rueben. 2001. “Fiscal News, State Budget Rules, and Tax-Exempt Bond Yields.” Journal of urban Economics 50 (3): 537–62.
Ramey, Valerie A. 2011. “Identifying Government Spending Shocks: It’s All in the Timing.” Quarterly Journal of Economics 126 (1): 1–50.

68 AmERiCAN ECoNomiC JouRNAL: ECoNomiC PoLiCy mAy 2012
Ravn, Morten O., and Harald Uhlig. 2002. “On Adjusting the Hodrick-Prescott Filter for the Fre-quency of Observations.” Review of Economics and statistics 84 (2): 371–76.
Rose, Shanna, and Daniel L. Smith. 2012. “Budget Slack, Institutions, and Transparency.” Public Administration Review 72 (2): 187–95.
Rueben, Kim S. 1993. “Correcting for Censored Data in the Presence of Heteroskedasticity: An Appli-cation to State Fiscal Adjustment.” Unpublished.
Serrato, Juan Carlos Suárez, and Philippe Wingender. 2011. “Estimating Local Fiscal Multipliers.” Unpublished. http://www.jcsuarez.com/Files/Suarez_Serrato-Wingender-ELFM.pdf.
Shoag, Daniel. 2010. “The Impact of Government Spending Shocks: Evidence on the Multiplier from State Pension Plan Returns.” Unpublished. http://www.people.fas.harvard.edu/~shoag/papers_files/shoag_jmp.pdf.
United States General Accounting Office (GAO). 1993. Balanced Budget Requirements: State Experi-ences and Implications for the Federal Government. Briefing Report to the Chairman, Committee on the Budget, House of Representatives. Washington, DC, March.