Embed Size (px)
Citation preview

Fiscal Policy
Fiscal economic

Government in the Economy
Nothing arouses as much controversy as the role of government in the economy.
Government can affect the macroeconomy in two ways: Fiscal policy is the manipulation of
government spending and taxation. Monetary policy refers to the
behavior of the Federal Reserve regarding the nation’s money supply.
What is Fiscal Policy?
Fiscal policy is the deliberate manipulation of government purchases, transfer payments, taxes, and borrowing in order to influence macroeconomic variables such as employment, the price level, and the level of GDP

Government in the Economy
Discretionary fiscal policy refers to deliberate changes in taxes or spending.
The government can not control certain aspects of the economy related to fiscal policy. For example: The government can control tax rates but
not tax revenue. Tax revenue depends on household income and the size of corporate profits.
Government spending depends on government decisions and the state of the economy.
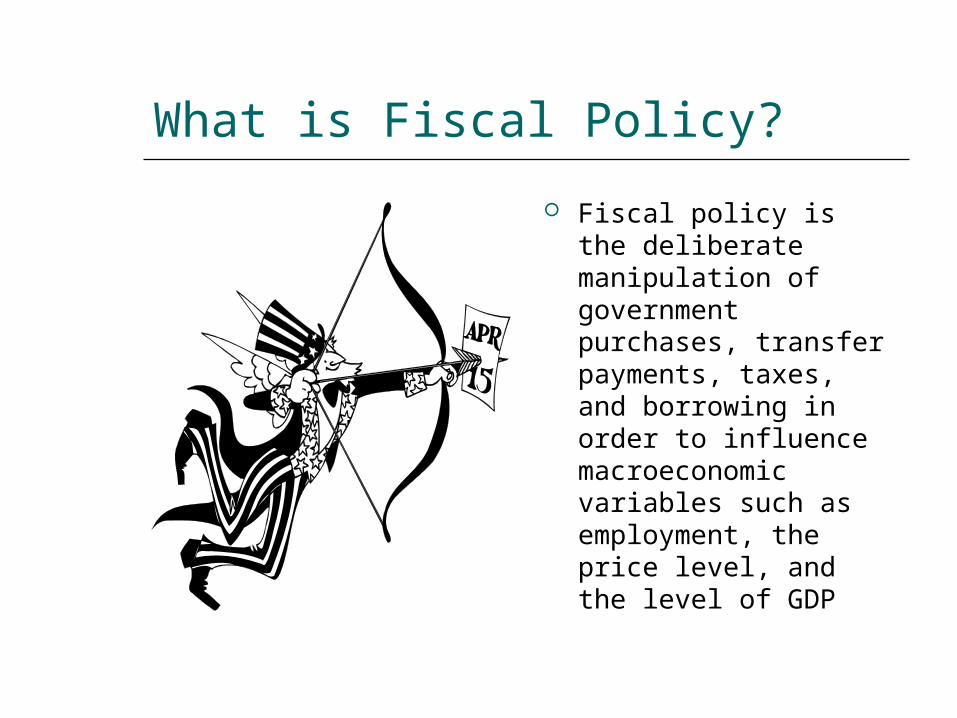
Net Taxes (T), and Disposable Income (Yd)
Net taxes are taxes paid by firms and households to the government minus transfer payments made to households by the government.
Disposable, or after-tax, income (Yd ) equals total income minus taxes.
Y Y Td

Adding Net Taxes (T) and Government Purchases (G) to the Circular Flow of Income

Adding Net Taxes (T) and Government Purchases (G) to the Circular Flow of Income
When government enters the picture, the aggregate income identity gets cut into three pieces:
Y Y Td
Y C Sd
Y T C S Y C S T
• And aggregate expenditure (AE) equals:
A E C I G

The Budget Deficit
A government’s budget deficit is the difference between what it spends (G) and what it collects in taxes (T) in a given period:
B udget def G Ticit
• If G exceeds T, the government must borrow from the public to finance the deficit. It does so by selling Treasury bonds and bills. In this case, a part of household saving (S) goes to the government.
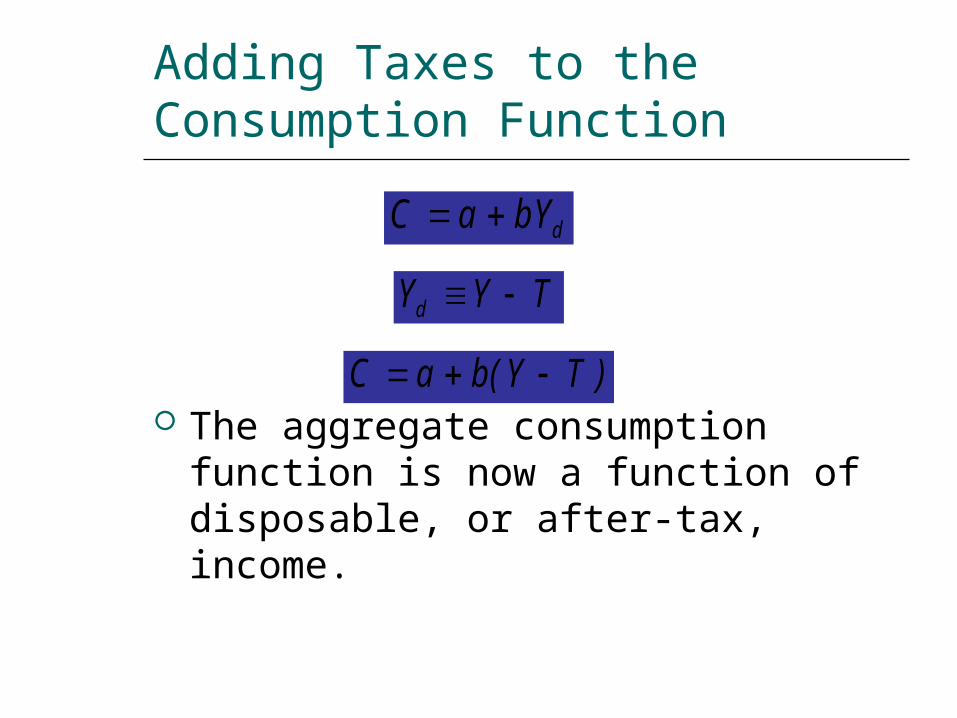
Adding Taxes to theConsumption Function
The aggregate consumption function is now a function of disposable, or after-tax, income.
C a bYd
Y Y Td
C a b Y T ( )

Equilibrium Output: Y = C + I + G
Finding Equilibrium for I = 100, G = 100, and T = 100(All Figures in Billions of Dollars)
(1) (2) (3) (4) (5) (6) (7) (8) (9) (10)
OUTPUT(INCOME)
Y
NETTAXES
T
DISPOSABLEINCOMEYd Y T
CONSUMPTIONSPENDING
(C = 100 + .75 Yd)
SAVINGS
(Yd – C)
PLANNEDINVESTMENT
SPENDINGI
GOVERNMENTPURCHASES
G
PLANNEDAGGREGATE
EXPENDITURE C + I + G
UNPLANNEDINVENTORY
CHANGEY (C + I + G)
ADJUSTMENTTO
DISEQUILIBRIUM
300 100 200 250 50 100 100 450 150 Output500 100 400 400 0 100 100 600 100 Output
700 100 600 550 50 100 100 750 50 Output
900 100 800 700 100 100 100 900 0 Equilibrium
1,100 100 1,000 850 150 100 100 1,050 + 50 Output
1,300 100 1,200 1,000 200 100 100 1,200 + 100 Output
1,500 100 1,400 1,150 250 100 100 1,350 + 150 Output
C Yd 1 0 0 7 5. C Y T 1 0 0 7 5. ( )

Finding EquilibriumOutput/Income Graphically

The Government Spending Multiplier
The government spending multiplier is the ratio of the change in the equilibrium level of output to a change in government spending.
G overnm en t m ultip lierM P S
spend ing 1

The Government Spending Multiplier
Finding Equilibrium After a $50 Billion Government Spending Increase(All Figures in Billions of Dollars; G Has Increased From 100 in Table 25.1 to 150 Here)
(1) (2) (3) (4) (5) (6) (7) (8) (9) (10)
OUTPUT(INCOME)
Y
NETTAXES
T
DISPOSABLEINCOMEYd Y T
CONSUMPTIONSPENDING
(C = 100 + .75 Yd)
SAVINGS
(Yd – C)
PLANNEDINVESTMENT
SPENDINGI
GOVERNMENTPURCHASES
G
PLANNEDAGGREGATE
EXPENDITURE C + I + G
UNPLANNEDINVENTORY
CHANGEY (C + I + G)
ADJUSTMENTTO
DISEQUILIBRIUM
300 100 200 250 50 100 150 500 200 Output
500 100 400 400 0 100 150 650 150 Output
700 100 600 550 50 100 150 800 100 Output
900 100 800 700 100 100 150 950 50 Output
1,100 100 1,000 850 150 100 150 1,100 0 Equilibrium
1,300 100 1,200 1,000 200 100 150 1,250 + 50 Output

The Effect on GDP of an Increase in Government Spending
Real GDP
$
C+I+G+(X-M)
45o C+I+G’+(X-M)
GDP
G Simple government expenditures multiplier =
GDP/G = 1/(1-MPC)
Simple government expenditures multiplier =
GDP/G = 1/(1-MPC)

The Government Spending Multiplier
The Tax Multiplier
A tax cut increases disposable income, and leads to added consumption spending. Income will increase by a multiple of the decrease in taxes.
A tax cut has no direct impact on spending. The multiplier for a change in taxes is smaller than the multiplier for a change in government spending.

The Tax Multiplier
YM P S
( in itia l in c rease in ag g reg a te ex p en d itu re )
1
Y T M P CM P S
TM P C
M P S
( )
1
T ax m ultipM P C
M P Slier

The Effect on GDP of a Decrease in Taxes
Real GDP
$
C+I+G+(X-M)
45o C’+I+G+(X-M)
GDP
Simple tax multiplier =
GDP/T = -MPC/(1-MPC)
Simple tax multiplier =
GDP/T = -MPC/(1-MPC)

The Balanced-Budget Multiplier
The balanced-budget multiplier is the ratio of change in the equilibrium level of output to a change in government spending where the change in government spending is balanced by a change in taxes so as not to create any deficit.

The Balanced Budget Multiplier
A factor that show that identical changes in government purchases and net taxes change real GDP demanded by that same amount
Change in Y Change in G1
1- MPC + Change in T
- MPC
1- MPC
Change in G Change in T
Change in Y Change in G1
1- MPC
MPC
1- MPC = Change in G

The Balanced-Budget Multiplier
Finding Equilibrium After a $200 Billion Balanced Budget Increase in G and T(All Figures in Billions of Dollars; G and T Have Increased From 100 in Table 25.1 to 300 Here)
(1) (2) (3) (4) (5) (6) (7) (8) (9)
OUTPUT(INCOME)
Y
NETTAXES
T
DISPOSABLEINCOMEYd Y T
CONSUMPTIONSPENDING
(C = 100 + .75 Yd)
PLANNEDINVESTMENT
SPENDINGI
GOVERNMENTPURCHASES
G
PLANNEDAGGREGATE
EXPENDITURE C + I + G
UNPLANNEDINVENTORY
CHANGEY (C + I + G)
ADJUSTMENTTO
DISEQUILIBRIUM
500 300 200 250 100 300 650 150 Output
700 300 400 400 100 300 800 100 Output
900 300 600 550 100 300 950 50 Output
1,100 300 800 700 100 300 1,100 0 Equilibrium
1,300 300 1,000 850 100 300 1,250 + 50 Output
1,500 300 1,200 1,000 100 300 1,400 + 100 Output

Fiscal Policy Multipliers
Summary of Fiscal Policy Multipliers
POLICY STIMULUS MULTIPLIERFINAL IMPACT ON
EQUILIBRIUM Y
Government-spendingmultiplier
Increase or decrease in thelevel of governmentpurchases:
Tax multiplier Increase or decrease in thelevel of net taxes:
Balanced-budgetmultiplier
Simultaneous balanced-budgetincrease or decrease in thelevel of government purchasesand net taxes:
1
1
M P S
M P C
M P S
GM P S
1
TM P C
M P S
G

Fiscal Policy in Practice

Introduction
Before the 1930s, fiscal policy was not explicitly used to influence the macroeconomy The classical approach implied that natural market
forces, by way of flexible prices, wages, and interest rates, would move the economy toward its potential GDP
Thus there appeared to be no need for government intervention in the economy
Before the onset of the Great Depression, most economists believed that active fiscal policy would do more harm than good

The Great Depression and World War II
Three developments bolstered the use of fiscal policy The publication of Keynes’ General Theory War-time demand on production helped pull
the U.S. out of the Great Depression The Full Employment Act of 1946, which gave
the federal government responsibility for promoting full employment and price stability

Automatic Stabilizers
Structural features of government spending and taxation that smooth fluctuations in disposable income over the business cycle
Examples include, Our progressive income
system with its increasing marginal income tax rates
Unemployment insurance Welfare spending

The Economy’s Influenceon the Government Budget
Fiscal drag is the negative effect on the economy that occurs when average tax rates increase because taxpayers have moved into higher income brackets during an expansion.

The Golden Age of Keynesian Fiscal Policy to Stagflation
The Early 1960s provided support for Keynesian theories In particular, President Kennedy’s 1964 income
tax cut did much to boost the economy and reduce unemployment
However, the 1970s were marked by significant supply-side shocks (increases in oil prices in addition to crop failures) The economic ills brought about by these supply-
side shocks to the economy could not be remedied by demand-side Keynesian economic theories

Lags in Fiscal Policy
The time required to approve and implement fiscal legislation may hamper its effectiveness and weaken fiscal policy as a tool of economic stabilization
In the case of an oncoming recession, it may take time to Recognize the coming recession Implement the policy Let the policy have its impact

Discretionary Policy and Permanent Income
Permanent income is income that individuals expect to receive on average over the long run
To the extent that consumers base spending decisions on their permanent income, attempts to fine-tune the economy through discretionary fiscal policy will be less effective

Budgets, Deficits,and Public Policy

The Government Budget
A plan for government expenditures and revenues for a specified period, usually a year

The Federal Budget
The federal budget is the budget of the federal government.
The difference between the federal government’s receipts and its expenditures is the federal surplus (+) or deficit (-).

The Federal Budget
Federal Government Receipts and Expenditures, 2000 (Billions of Dollars)
AMOUNTPERCENTAGE
OF TOTAL
ReceiptsPersonal taxes 1,010.1 49.6
Corporate taxes 193.2 9.5Indirect business taxes 111.0 5.5Contributions for social insurance 720.6 35.4
Total 2,034.9 100.0
Current ExpendituresConsumption 514.1 26.9Transfer payments 831.9 43.6Grants-in-aid to state and local governments 274.2 14.4Net interest payments 236.9 12.4Net subsidies of government enterprises 52.5 2.7
Total 1,909.6 100.0
Current Surplus (+) or deficit () (Receipts Current Expenditures) + 125.3Source: U.S. Department of Commerce, Bureau of Economic Analysis.
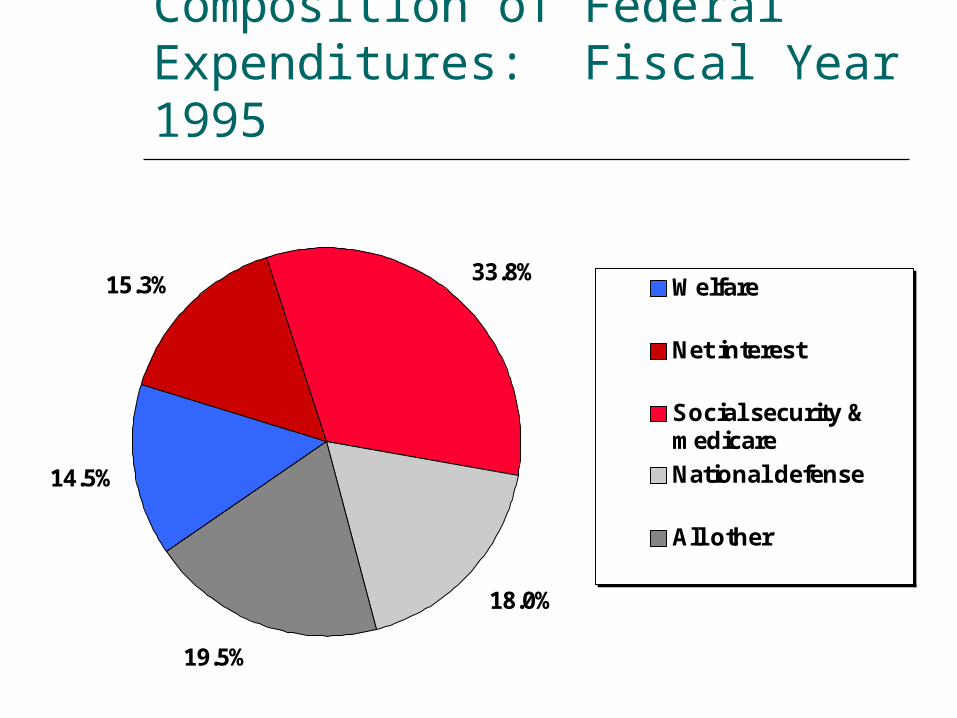
Composition of Federal Expenditures: Fiscal Year 1995
14.5%
15.3% 33.8%
18.0%
19.5%
Welfare
Net interest
Social security &medicare
National defense
All other

The Presidential Role in the Budget Process
Early in this century, the president had very little involvement in the development of the federal budget
By the mid-1970s the president had been given the resources to translate policy into a budget proposal to be presented to Congress Office of Management and Budget (1921) Employment Act of 1946 (Council of Economic
Advisers)

The Presidential Role in the Budget Process (continued)
The development of the president’s budget begins a year before it is submitted to Congress
The presidents proposed budget (The Budget of the United States Government) is supported by the Economic Report of the President
The budget is submitted in January for the upcoming fiscal year October 1-September 30

The Congressional Role in the Budget Process
House and Senate budget committees review the president’s budget proposal
An overall budget outline is approved by Congress (budget resolution) and given to the various congressional committees and subcommittees which authorize federal spending

Budget Deficits and Surpluses
When budgeted expenditures exceed projected tax revenues, the budget is projected to be in deficit
When projected tax revenues exceed budgeted expenditures, the budget is projected to be in surplus


The Federal Government Surplus (+) or Deficit (-) as a Percentage of GDP, 1970 I2003 II

Problems with the Budget Process
Continuing resolutions A continuing resolution is a budget agreement that
allows agencies, in the absence of an approved budget, to spend at the rate of the previous year’s budget
Continuing resolutions are implemented due to delays in the budget process or problems with content of the budget
Overlapping committee authority Length of the budget process Uncontrollable budget items Overly detailed budget

Entitlement Programs
Guaranteed benefits for those who qualify under government transfer programs such as Social Security and Aid to Families with Dependent Children
These programs represent a major “fixed” element of the budget, unless laws are passed to change eligibility requirements

Suggestions for Budget Reform
Biennial budget The elimination of line
item details before Congress Congress would
consider only the overall budget for a given agency, rather that detailed line items

Rationale for Budget Deficits
Large capital projects (highways, etc.) The benefits from these project will benefit more
than current taxpayers, so deficit financing is appropriate
Major Wars Keynesian economics points to the use of deficits
to stimulate the economy during periods of economic slowdown
Automatic stabilizers tend to increase deficits, since during times of recession, taxes are reduced while unemployment insurance and welfare payments are increased

Budget Philosophies
Annually balanced budget—Budget philosophy prior to the Great Depression; aimed at equating revenues with expenditures, except during times of war
Cyclically balanced budget—Budget philosophy calling for budget deficits during recessions to be financed by budget surpluses during expansions
Functional Finance—A budget philosophy aiming fiscal policy at achieving potential GDP rather than balancing budgets either annually or over the business cycle

Crowding Out and Crowding In
Crowding out--When the government undertakes expansionary fiscal policy, interest rates increase due to competition for borrowed funds and increased transactions demand for money As a result, private investment is “crowded out” due
to increases in public investment Crowding in—If expansionary fiscal policy
raises the general level of prosperity in the economy, private investors may expect greater investment-related profits, causing private investment to increase

Deficits and Interest Rates
Financing Deficits Taxes Bonds (borrowing) Printing Money
Ricardian Equivalence

The Federal Deficit Versus the National Debt
The federal deficit is a flow variable measuring the amount by which expenditures exceed revenues in a particular year
The national debt is a stock variable measuring the accumulation of past deficits
In the U.S., it took 200 years for the national debt to reach $1 trillion After the debt reached this level, it took only 15
years for the debt to reach the $5 trillion level

The Debt and Problems
http://www.brillig.com/debt_clock/ Arguments about the Debt
We have to pay it back We owe it to ourselves (much less so
than years ago).

Reducing the Deficit
Line-item veto (signed into law in April 1996 struck by the Supreme Court in 1998)
A provision to allow the president to reject particular portions of the budget rather than simply accept or reject the entire budget
Balanced budget amendment
Proposed amendment to the U.S. Constitution requiring a balanced federal budget
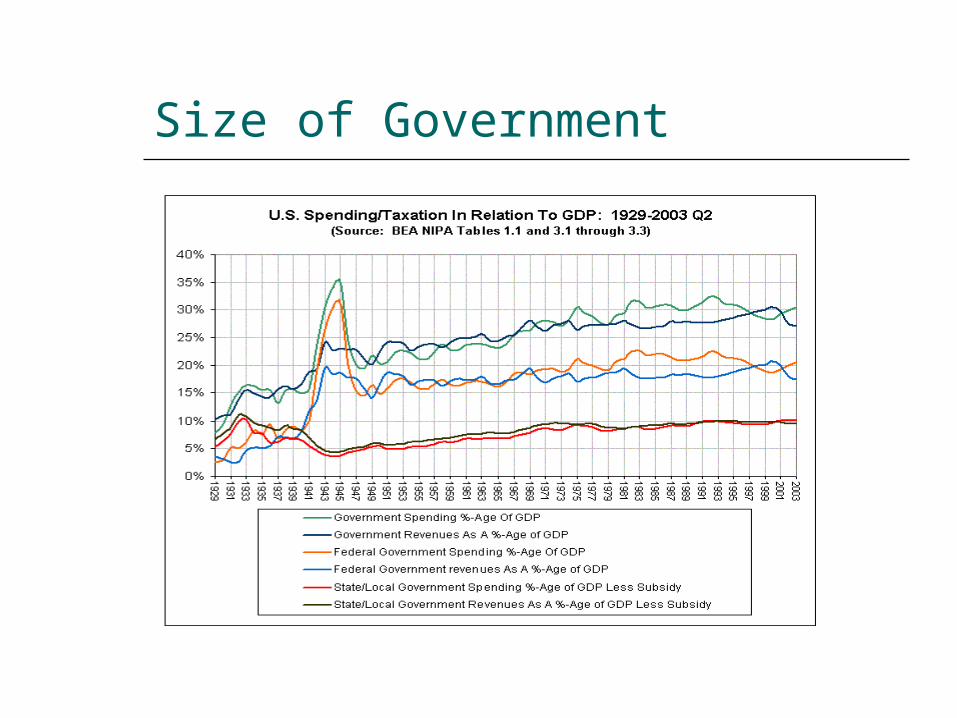
Size of Government

The Debt
The federal debt is the total amount owed by the federal government. The debt is the sum of all accumulated deficits minus surpluses over time.
Some of the federal debt is held by the U.S. government itself and some by private individuals. The privately held federal debt is the private (non-government-owned) portion of the federal debt.

The Federal Government Debt as a Percentage of GDP, 1970 I2003 II
The percentage began to fall in the mid 1990s.

The Economy’s Influenceon the Government Budget
The full-employment budget is what the federal budget would be if the economy were producing at a full-employment level of output.

The Economy’s Influenceon the Government Budget
The cyclical deficit is the deficit that occurs because of a downturn in the business cycle.
The structural deficit is the deficit that remains at full employment.

Review Terms and Concepts
automatic stabilizersautomatic stabilizers
balanced-budget balanced-budget multipliermultiplier
budget deficitbudget deficit
cyclical deficitcyclical deficit
discretionary fiscal policydiscretionary fiscal policy
disposable, or after-tax, disposable, or after-tax, incomeincome
federal budgetfederal budget
federal debtfederal debt
federal surplus (+) or federal surplus (+) or deficit (-)deficit (-)
fiscal dragfiscal drag
fiscal policyfiscal policy
full-employment budgetfull-employment budget
government spending government spending multipliermultiplier
monetary policymonetary policy
net taxesnet taxes
privately held federal debtprivately held federal debt
structural deficitstructural deficit
tax multipliertax multiplier

The Economy’s Influenceon the Government Budget
Automatic stabilizers are revenue and expenditure items in the federal budget that automatically change with the state of the economy in such a way as to stabilize GDP.
The Budget Deficits of the 1980s and 1990s
The tax cuts of the early 1980s together with large increases government spending caused the annual government deficit and the national debt to grow significantly
Although both fiscal policy measures stimulated the economy, the resulting tax revenues were not sufficient to manage the large government deficits

Fiscal Policy and the Natural Rate of Unemployment
If there is a natural rate of unemployment, fiscal policy that increases aggregate demand will appear to succeed in the short run because output and employment will both expand
But stimulating aggregate demand will, in the long run, result only in a higher price level, while the level of output will fall back to the economy’s potential

Feedback Effects of Fiscal Policy on Aggregate Supply
Both automatic stabilizers and discretionary fiscal policy may affect individual incentives to work spend, save, and invest, though these effects are usually unintended

Appendix: The Government Expenditures and Tax Multipliers
Yb
a bNT I G X M
Yb
b NT G
G Yb
bNT
G T Yb
bNT NT
1
11
1
01
1
1
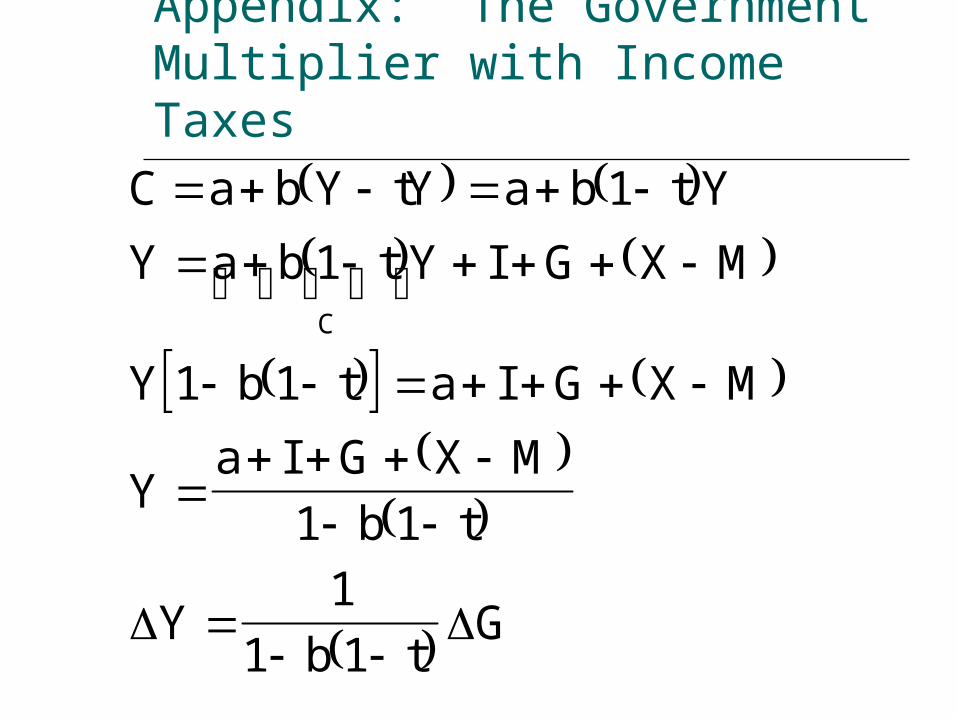
Appendix: The Government Multiplier with Income Taxes
C a b Y tY a b t Y
Y a b t Y I G X M
Y b t a I G X M
Ya I G X M
b t
Yb t
G
C
1
1
1 1
1 1
1
1 1

Appendix: The Multiplier with Income Taxes and Variable Imports
Y a b t Y I G X m t Y
Y b m t b m a I G X
Ya I G X
b m t b m
Yb m t b m
G
C M
1 1
1
1
1
1

Appendix A:Deriving the Fiscal Policy Multipliers
The government spending and tax multipliers algebraically:
Y C I G C a b Y T ( )
Y a b Y T I G ( )
Y a bY bT I G Y bY a bT I G Y b a bT I G( )1
1( )
1Y a bT I G
b

Appendix A:Deriving the Fiscal Policy Multipliers
The balanced-budget multiplier is found by combining the effects of government spending and taxes:
G T
1( )Y G MPS G
MPS
• The balanced-budget multiplier equals one. An increase in G and T by one dollar each causes a one-dollar increase in Y.
Gincrease in spending:
( )C T MPC - decrease in spending:
( )G T MPC = net increase in spending

Appendix B: The Case In WhichTax Revenues Depend on Income
Y C I G
dY Y T
200 1 3T Y
T T tY 0

Appendix B: The Case In WhichTax Revenues Depend on Income
dC a bY
dY Y T 200 1 3T Y
( 200 1 3 )dY Y Y
200 1 3 )dY Y Y
100 .75( 200 1 3 )C Y Y
900Y Y C I G 100I 100G

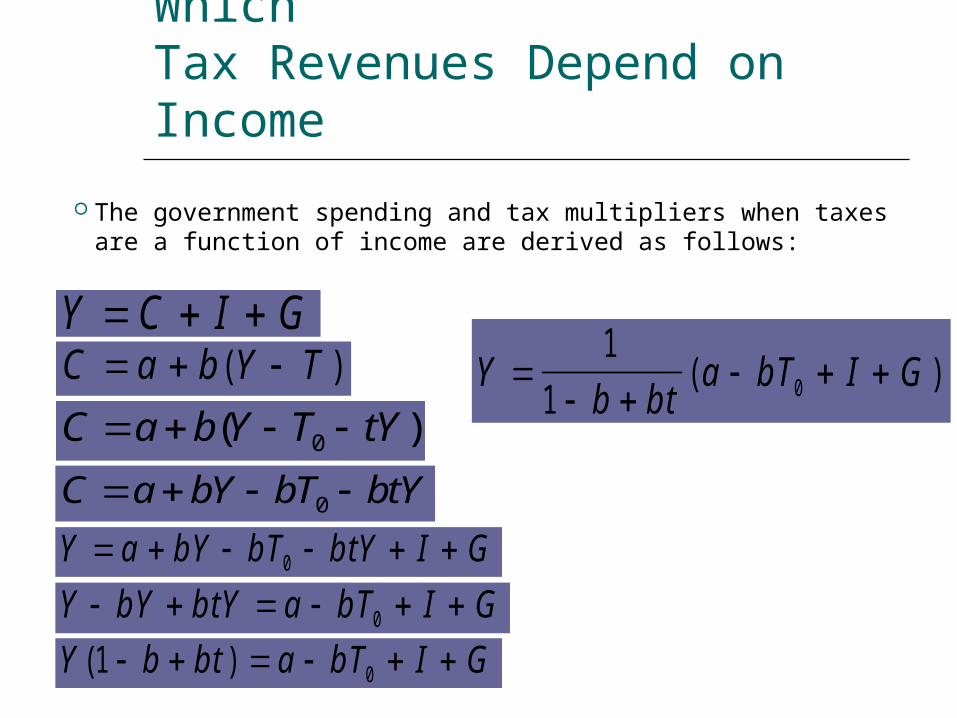
Yb bt
a bT I G
1
1 0( )
Appendix B: The Case In WhichTax Revenues Depend on Income
The Government Spending and Tax Multipliers Algebraically:
( )C a b Y T
0C a bY bT btY 0( )C a b Y T tY
0Y a bY bT btY I G Y C I G
Yb bt
a bT I G
1
1 0( )
Appendix B: The Case In WhichTax Revenues Depend on Income
The government spending and tax multipliers when taxes are a function of income are derived as follows:
Y C I G C a b Y T ( )
0C a bY bT btY 0( )C a b Y T tY
Y a bY bT btY I G 0
Y bY btY a bT I G 0
Y b b t a bT I G( )1 0

A Contractionary Gap Can be Closed by Expansionary Fiscal Policy
Real GDP
PriceLevel SRAS
AD
Potentialoutput
contractionarygap
AD*

An Expansionary Gap Can be Closed by Contractionary Fiscal Policy
Real GDP
PriceLevel SRAS
AD
Potentialoutput
expansionarygap
AD*

The Leakages/Injections Approach
Taxes (T) are a leakage from the flow of income. Saving (S) is also a leakage.
In equilibrium, aggregate output (income) (Y) equals planned aggregate expenditure (AE), and leakages (S + T) must equal planned injections (I + G). Algebraically,
S T I G
A E C I G Y C S T
C S T C I G


![Government Debt Maturity Structure, Fiscal Policy, and Default · Government Debt Maturity Structure, Fiscal Policy, and Default∗ SergiiKiiashko† November22,2017 [Linktolatestdraft]](https://img.pdfslide.us/doc/110x75/6050d317a7955115112203b2/government-debt-maturity-structure-fiscal-policy-and-default-government-debt-maturity.jpg)