Embed Size (px)
Citation preview
Fiscal Policy, Deficits, and Debt
McGraw-Hill/Irwin Copyright © 2012 by The McGraw-Hill Companies, Inc. All rights reserved.
Fiscal policy is the use of the
taxing and spending powers of government
to regulate aggregate expenditure,
and thereby to stabilize the economy
The economy needs
to be stabilized.
The economy can
be stabilized.
The economy should
be stabilized.
This is the Keynesian view
This legislation
established
a responsibility
for the federal
government
to promote
“maximum
employment,
production, and
purchasing power.”
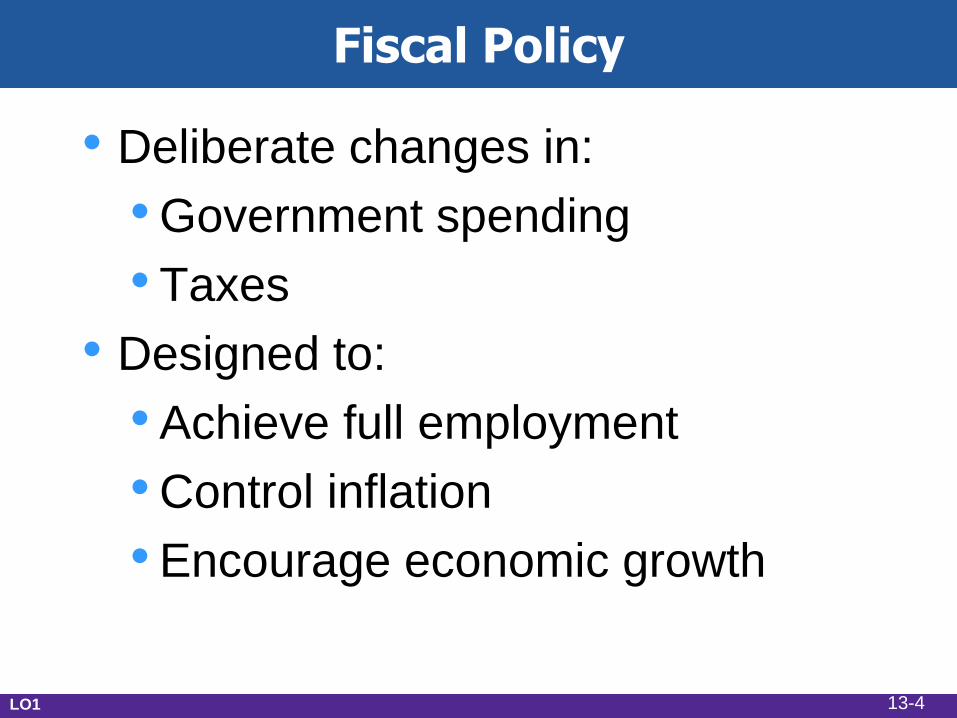
Fiscal Policy
• Deliberate changes in:
• Government spending
• Taxes
• Designed to:
• Achieve full employment
• Control inflation
• Encourage economic growth
LO1 13-4
Expansionary Fiscal Policy
• Use during a recession
• Increase government spending
• Decrease taxes
• Combination of both
• Create a deficit
LO1 13-5
Policy Options: G or T?
• To expand the size of government
• If recession, then increase
government spending
• If inflation, then increase taxes
• To reduce the size of government
• If recession, then decrease taxes
• If inflation, then decrease
government spending
LO1 13-6
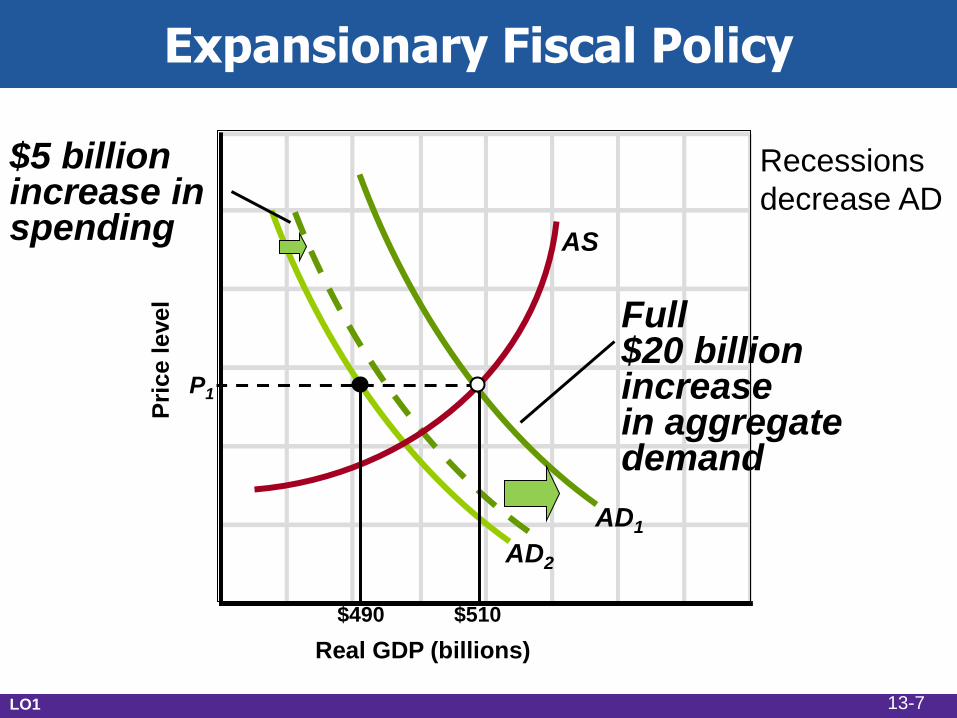
Expansionary Fiscal Policy
Real GDP (billions)
Pri
ce level
AD2
AD1
$5 billion increase in spending
Full $20 billion increase in aggregate demand
AS
$490 $510
P1
LO1
Recessions
decrease AD
13-7
Contractionary Fiscal Policy
• Use during demand-pull inflation
• Decrease government spending
• Increase taxes
• Combination of both
• Create a surplus
LO1 13-8
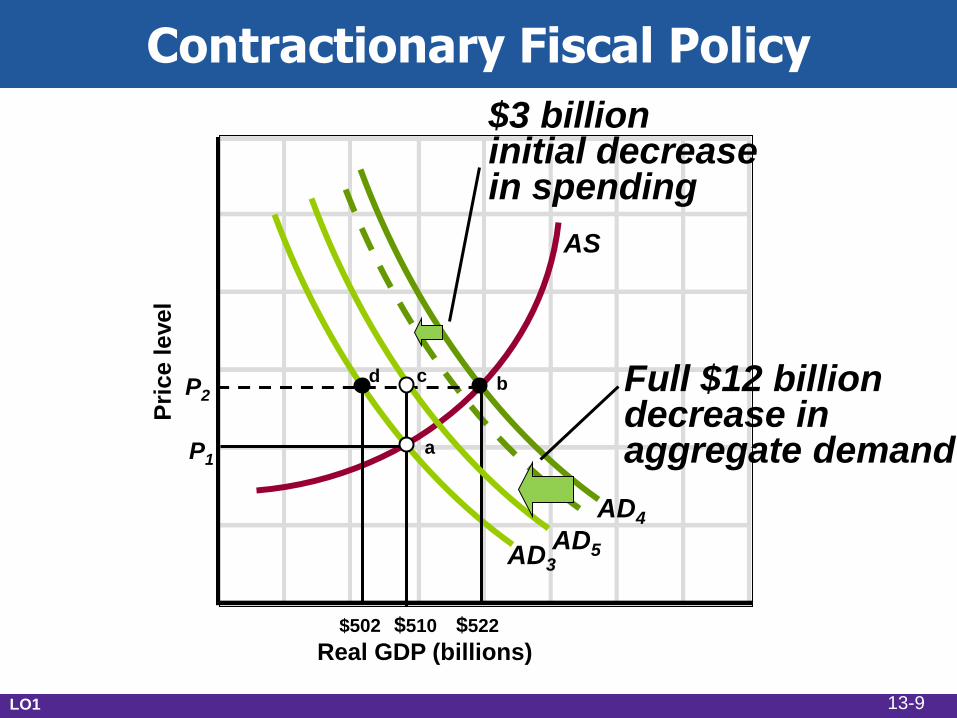
Contractionary Fiscal Policy
Real GDP (billions)
Pri
ce level
AD3
AD4
$3 billion initial decrease in spending
Full $12 billion decrease in aggregate demand
AS
$502 $522
P2
AD5
$510
d b
a P1
c
LO1 13-9
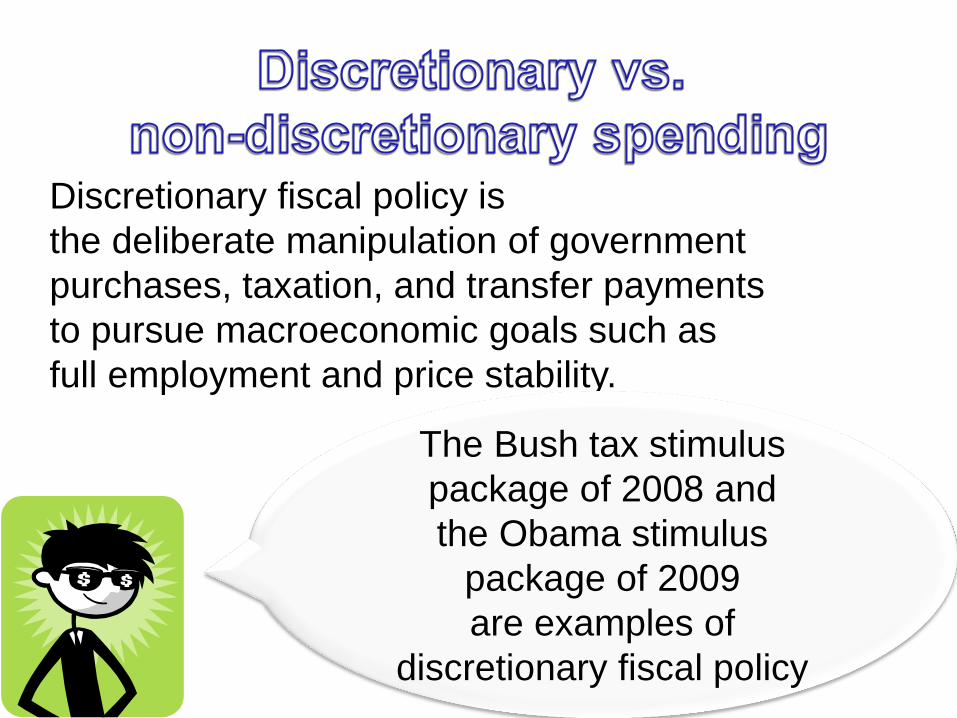
Discretionary fiscal policy is
the deliberate manipulation of government
purchases, taxation, and transfer payments
to pursue macroeconomic goals such as
full employment and price stability.
The Bush tax stimulus
package of 2008 and
the Obama stimulus
package of 2009
are examples of
discretionary fiscal policy
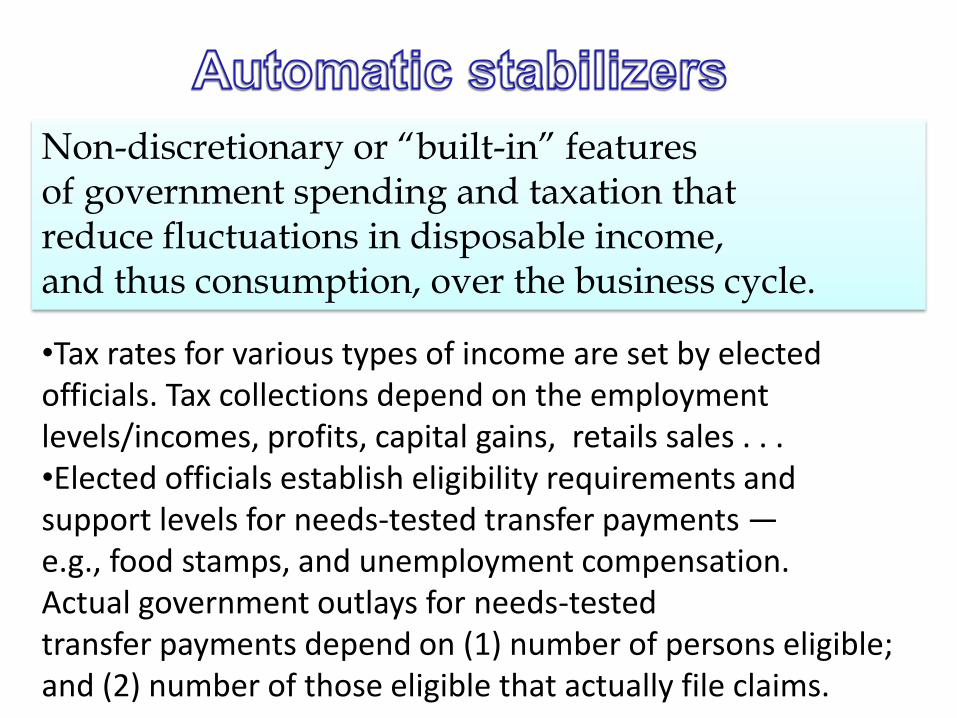
Non-discretionary or “built-in” features of government spending and taxation that reduce fluctuations in disposable income, and thus consumption, over the business cycle.
•Tax rates for various types of income are set by elected officials. Tax collections depend on the employment levels/incomes, profits, capital gains, retails sales . . . •Elected officials establish eligibility requirements and support levels for needs-tested transfer payments — e.g., food stamps, and unemployment compensation. Actual government outlays for needs-tested transfer payments depend on (1) number of persons eligible; and (2) number of those eligible that actually file claims.
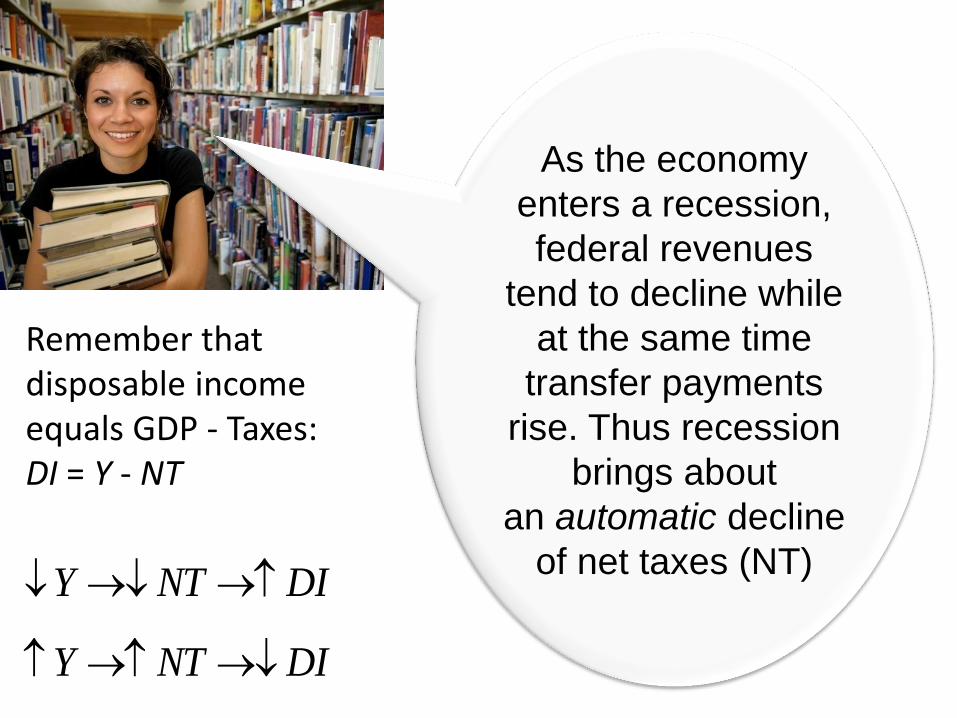
As the economy
enters a recession,
federal revenues
tend to decline while
at the same time
transfer payments
rise. Thus recession
brings about
an automatic decline
of net taxes (NT) DINTY
Remember that disposable income equals GDP - Taxes: DI = Y - NT
DINTY
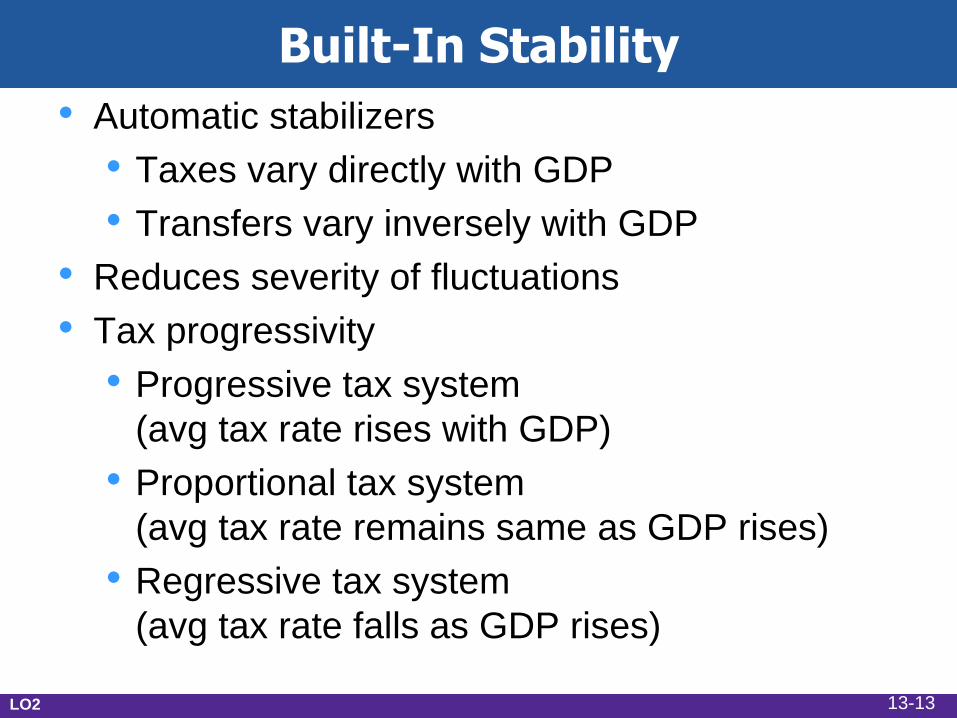
Built-In Stability
• Automatic stabilizers
• Taxes vary directly with GDP
• Transfers vary inversely with GDP
• Reduces severity of fluctuations
• Tax progressivity
• Progressive tax system
(avg tax rate rises with GDP)
• Proportional tax system
(avg tax rate remains same as GDP rises)
• Regressive tax system
(avg tax rate falls as GDP rises)
LO2 13-13
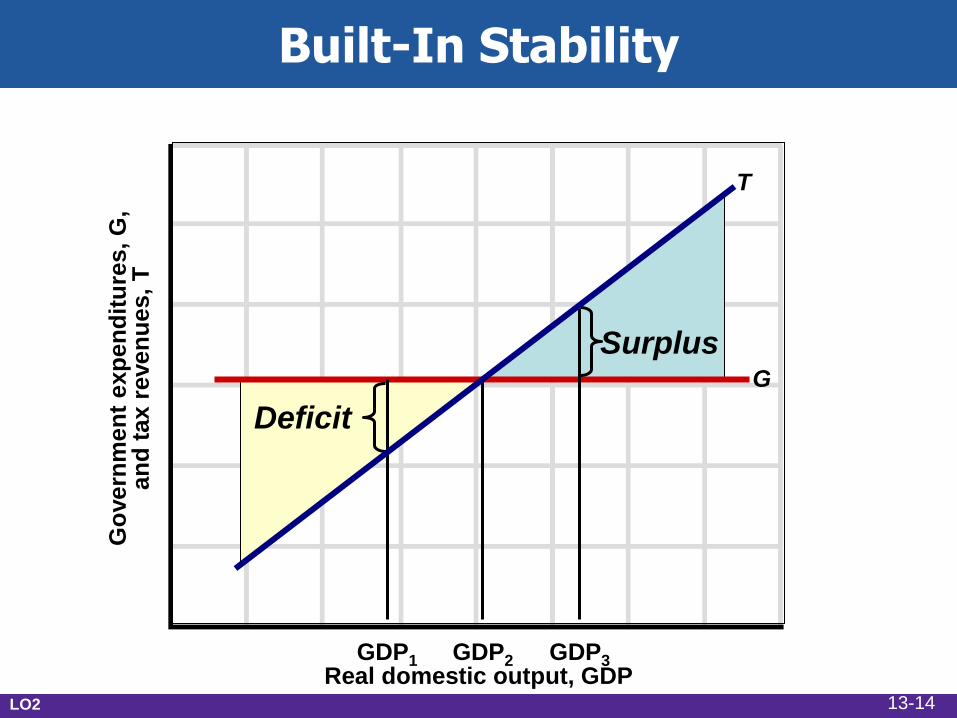
Built-In Stability
G
T
Deficit
Surplus
GDP1 GDP2 GDP3 Real domestic output, GDP
Go
vern
men
t exp
en
dit
ure
s, G
, an
d t
ax r
even
ues,
T
LO2 13-14
Evaluating Fiscal Policy
• Is the fiscal policy…
• Expansionary?
• Neutral?
• Contractionary?
• Use the cyclically adjusted budget
to evaluate
LO3 13-15
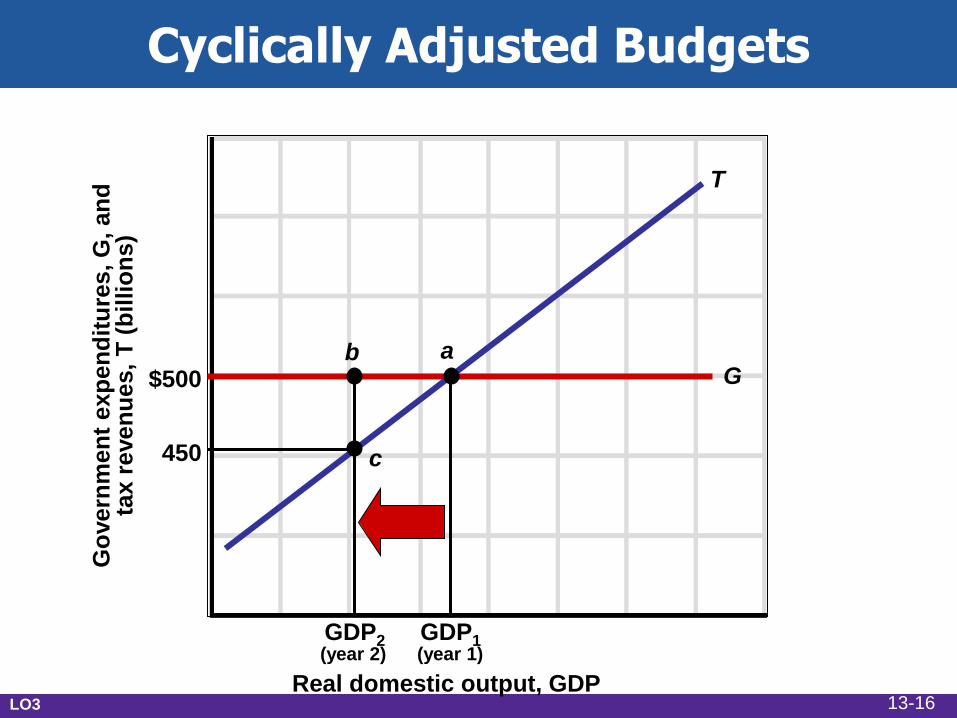
Cyclically Adjusted Budgets
G
T
GDP2 GDP1
Real domestic output, GDP
Go
vern
men
t exp
en
dit
ure
s, G
, an
d
tax r
even
ues,
T (
bil
lio
ns)
(year 2) (year 1)
$500
450
a b
c
LO3 13-16
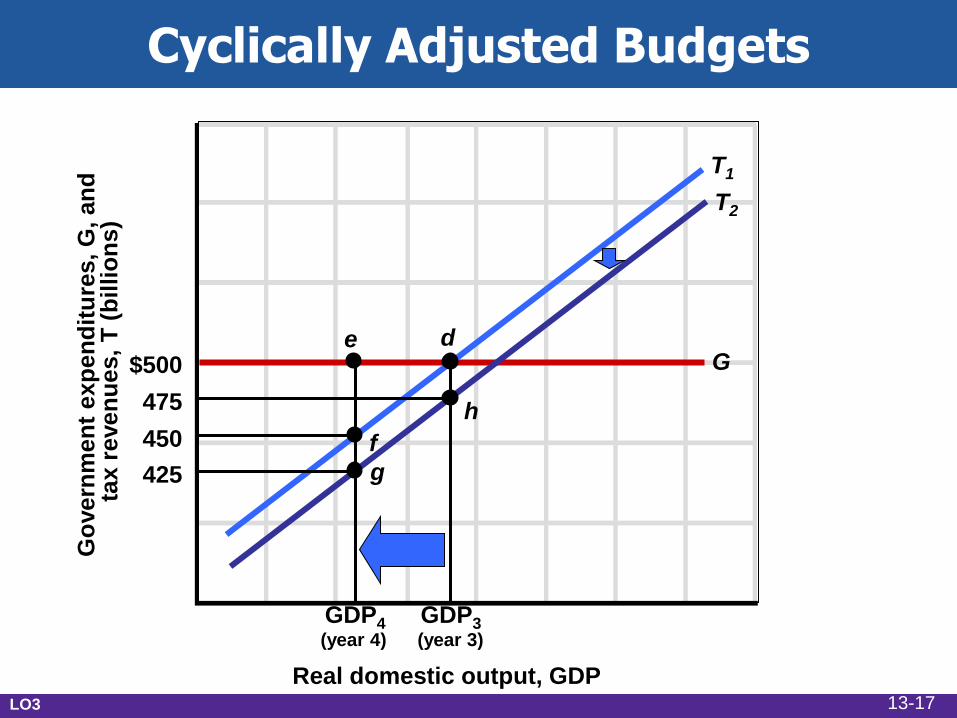
Cyclically Adjusted Budgets
G
T1
GDP4 GDP3
Real domestic output, GDP
Go
vern
men
t exp
en
dit
ure
s, G
, an
d
tax r
even
ues,
T (
bil
lio
ns)
(year 4) (year 3)
$500
450
d e
f
475
425 g
T2
h
LO3 13-17
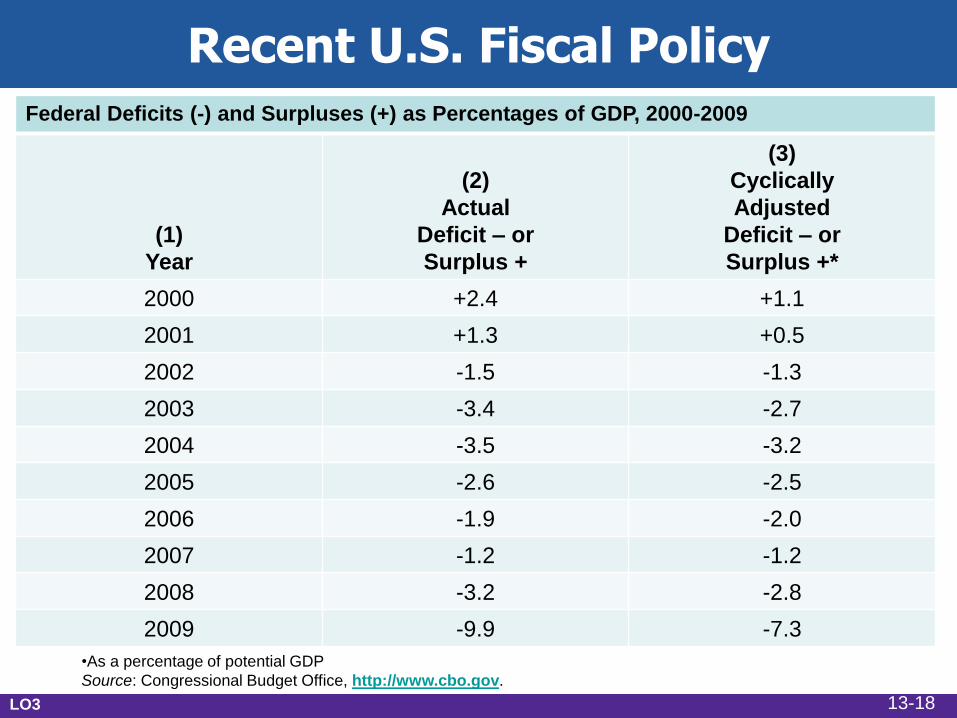
Recent U.S. Fiscal Policy Federal Deficits (-) and Surpluses (+) as Percentages of GDP, 2000-2009
(1)
Year
(2)
Actual
Deficit – or
Surplus +
(3)
Cyclically
Adjusted
Deficit – or
Surplus +*
2000 +2.4 +1.1
2001 +1.3 +0.5
2002 -1.5 -1.3
2003 -3.4 -2.7
2004 -3.5 -3.2
2005 -2.6 -2.5
2006 -1.9 -2.0
2007 -1.2 -1.2
2008 -3.2 -2.8
2009 -9.9 -7.3
•As a percentage of potential GDP
Source: Congressional Budget Office, http://www.cbo.gov.
LO3 13-18
•Horizontal equity: Tax code should be written
so that those in the same economic circumstances
pay the same amount in taxes.
•Vertical equity: Tax code should be written
so that those in different economic circumstances
should pay an unequal amount in taxes.
•Benefits received principle: Those who derive
more benefits from government programs
should pay more taxes.
Principles of Taxation
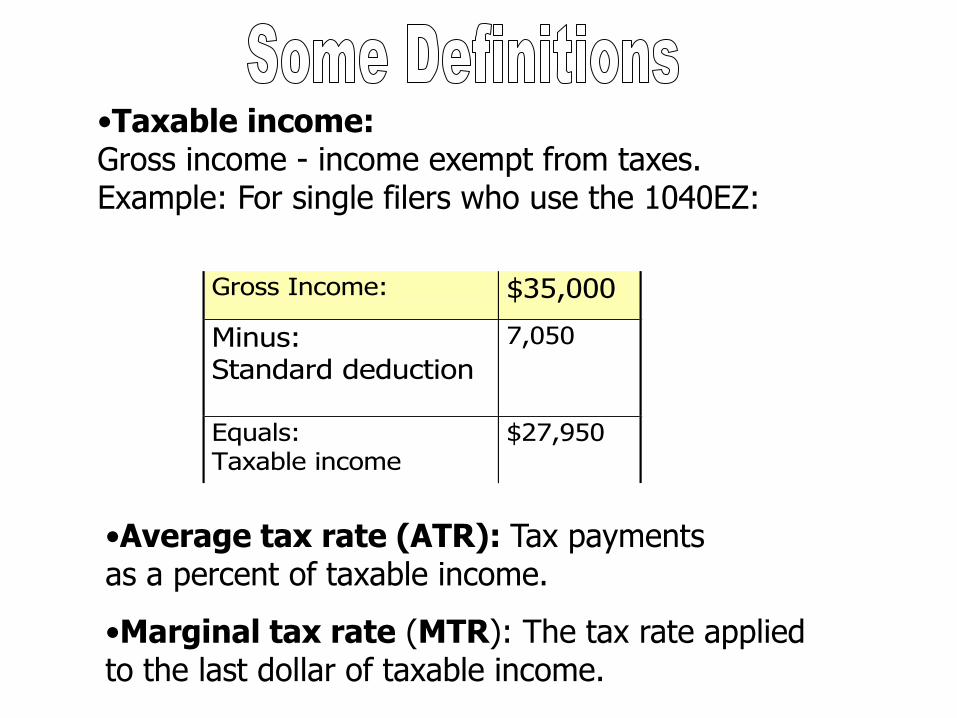
•Taxable income: Gross income - income exempt from taxes. Example: For single filers who use the 1040EZ:
Gross Income: $35,000
Minus: Standard deduction
7,050
Equals: Taxable income
$27,950
•Average tax rate (ATR): Tax payments as a percent of taxable income.
•Marginal tax rate (MTR): The tax rate applied to the last dollar of taxable income.
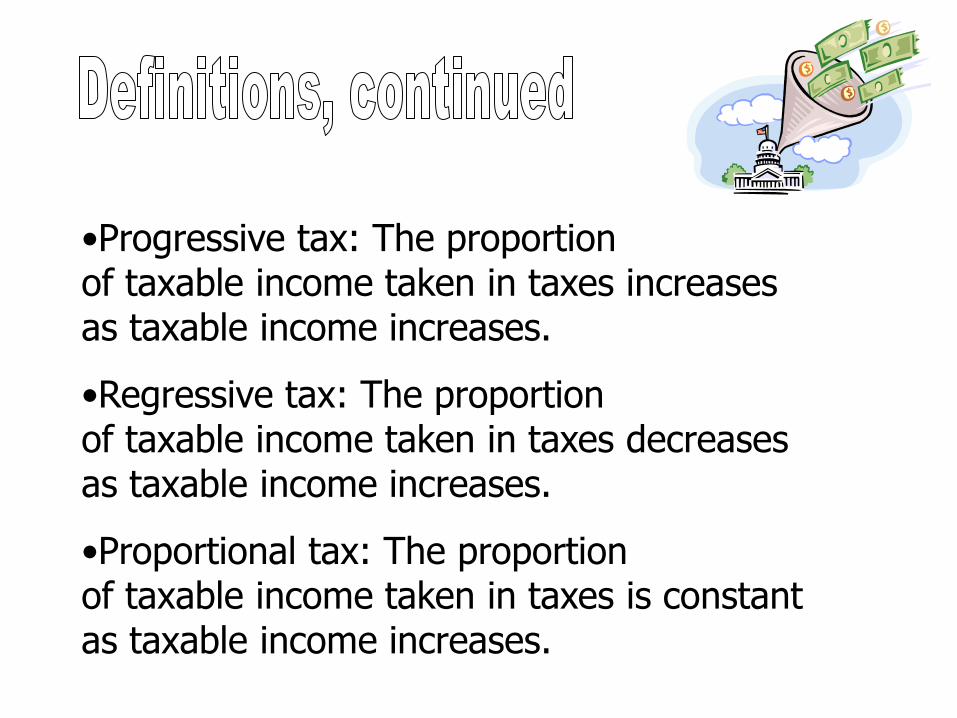
•Progressive tax: The proportion of taxable income taken in taxes increases as taxable income increases.
•Regressive tax: The proportion of taxable income taken in taxes decreases as taxable income increases.
•Proportional tax: The proportion of taxable income taken in taxes is constant as taxable income increases.
Affluent Needy
By making the tax structure
“progressive,” governments can make the after-tax distribution of income more equitable
(or even).
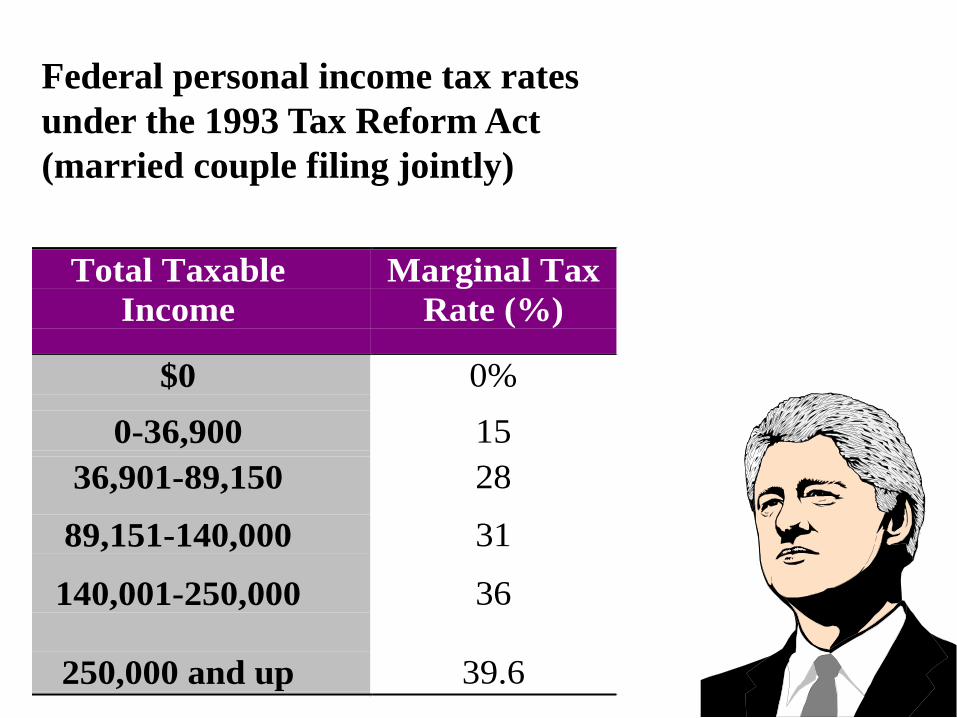
Total Taxable
Income
Marginal Tax
Rate (%)
$0 0%
0-36,900 15
36,901-89,150 28
89,151-140,000 31
140,001-250,000 36
250,000 and up 39.6
Federal personal income tax rates
under the 1993 Tax Reform Act
(married couple filing jointly)
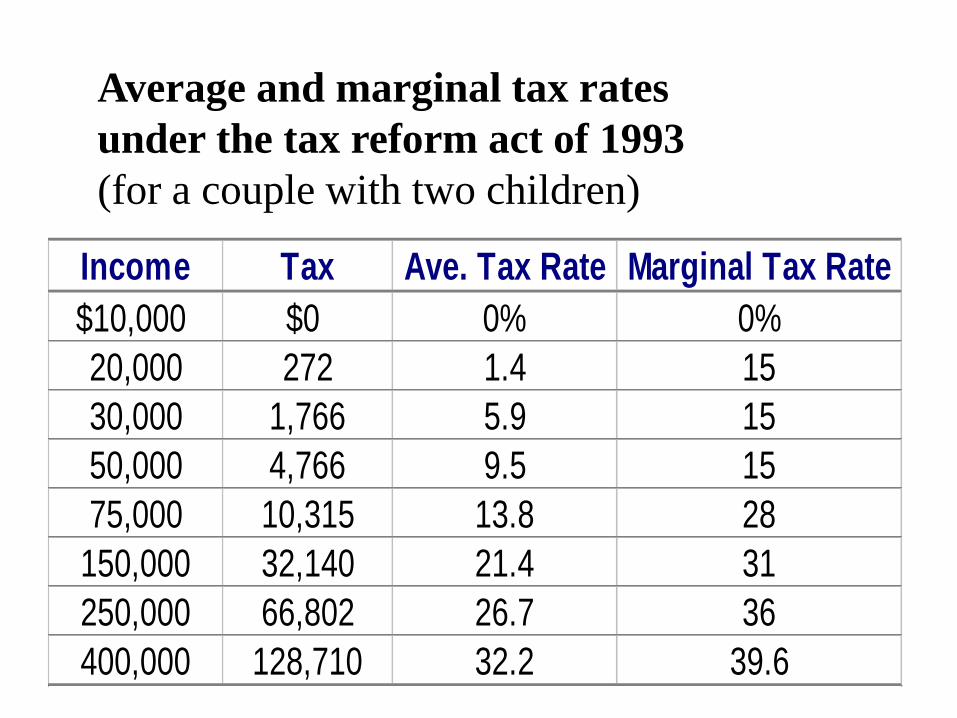
Income Tax Ave. Tax Rate Marginal Tax Rate
$10,000 $0 0% 0%
20,000 272 1.4 15
30,000 1,766 5.9 15
50,000 4,766 9.5 15
75,000 10,315 13.8 28
150,000 32,140 21.4 31
250,000 66,802 26.7 36
400,000 128,710 32.2 39.6
Average and marginal tax rates
under the tax reform act of 1993
(for a couple with two children)
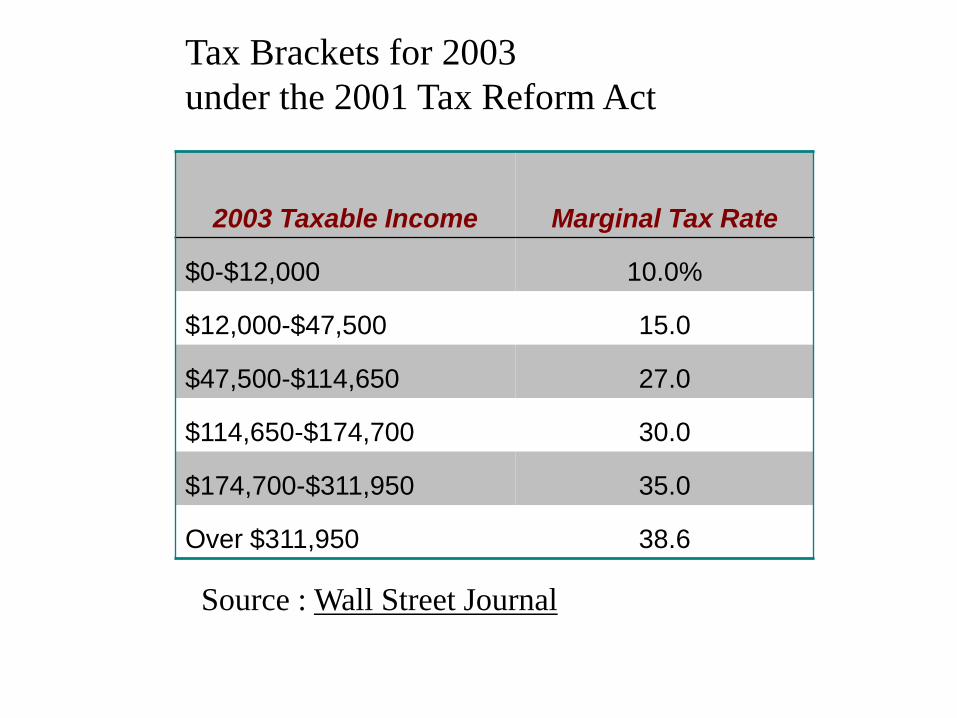
2003 Taxable Income Marginal Tax Rate
$0-$12,000 10.0%
$12,000-$47,500 15.0
$47,500-$114,650 27.0
$114,650-$174,700 30.0
$174,700-$311,950 35.0
Over $311,950 38.6
Tax Brackets for 2003
under the 2001 Tax Reform Act
Source : Wall Street Journal
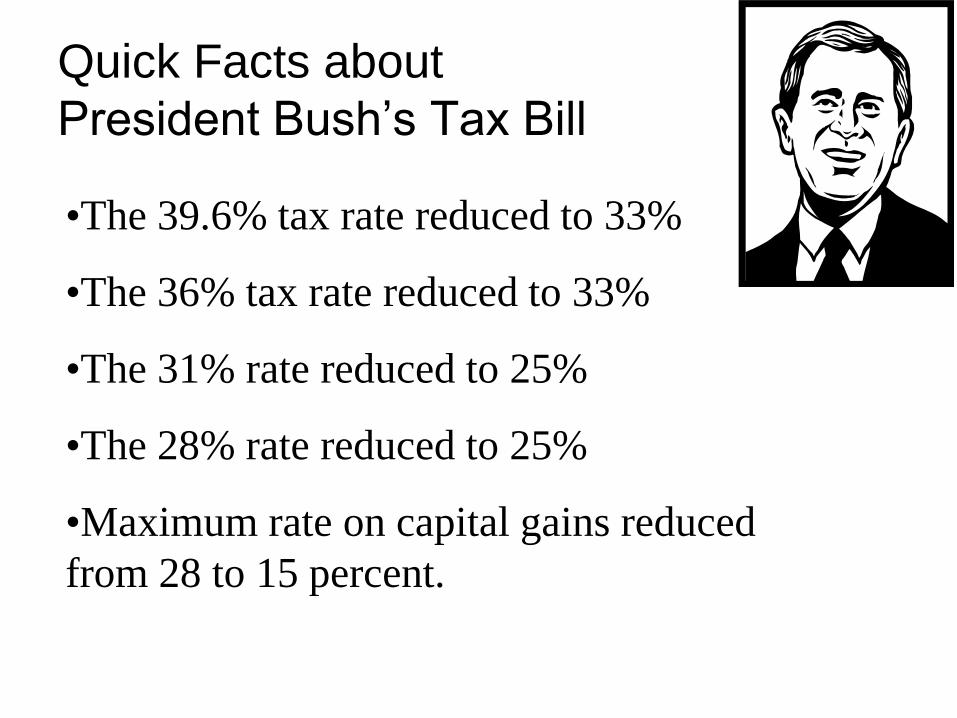
Quick Facts about
President Bush’s Tax Bill
•The 39.6% tax rate reduced to 33%
•The 36% tax rate reduced to 33%
•The 31% rate reduced to 25%
•The 28% rate reduced to 25%
•Maximum rate on capital gains reduced
from 28 to 15 percent.
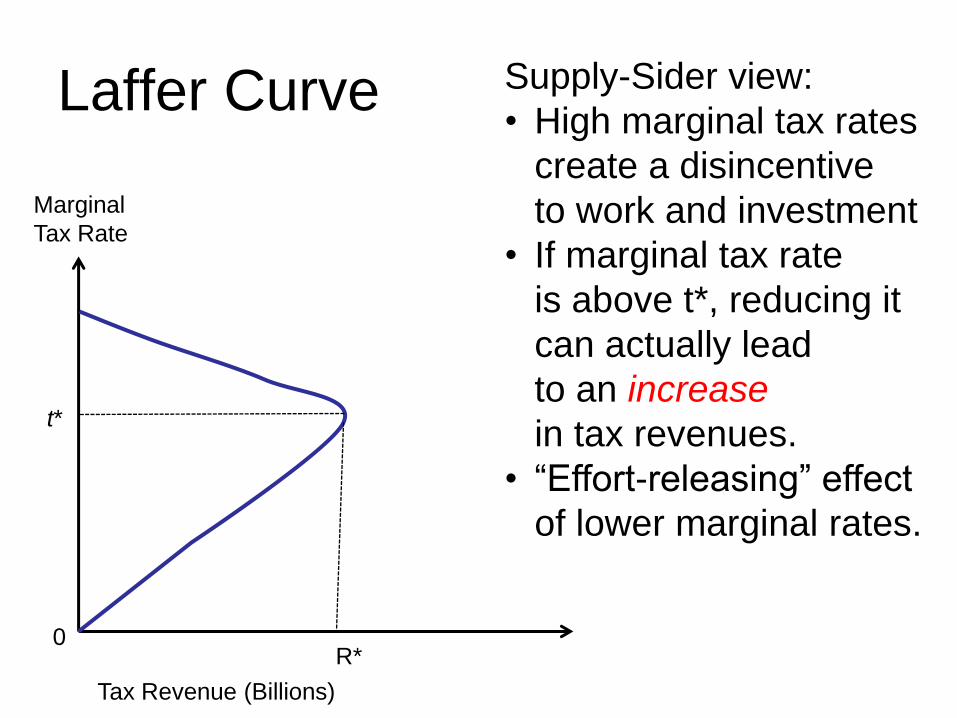
Laffer Curve
Marginal
Tax Rate
Tax Revenue (Billions)
0
t*
R*
Supply-Sider view:
• High marginal tax rates
create a disincentive
to work and investment
• If marginal tax rate
is above t*, reducing it
can actually lead
to an increase
in tax revenues.
• “Effort-releasing” effect
of lower marginal rates.
Fiscal Policy: The Great Recession
• Financial market problems
began in 2007
• Credit market freeze
• Pessimism spread
to the overall economy
• Recession officially began
December 2007 and lasted
18 months
LO4 13-28
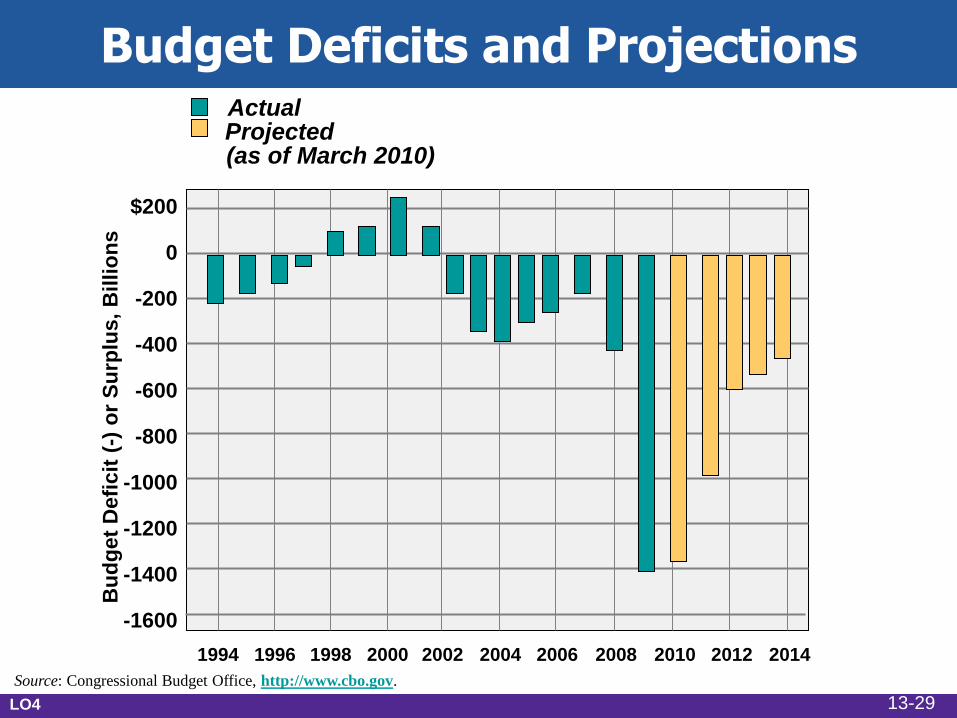
Budget Deficits and Projections
Source: Congressional Budget Office, http://www.cbo.gov.
$200
0
-200
-400
-600
-800
-1000
-1200
-1400
-1600
Bu
dg
et
Defi
cit
(-)
or
Su
rplu
s,
Billio
ns
1994 1996 1998 2000 2002 2004 2006 2008 2010 2012 2014
Actual Projected
(as of March 2010)
LO4 13-29
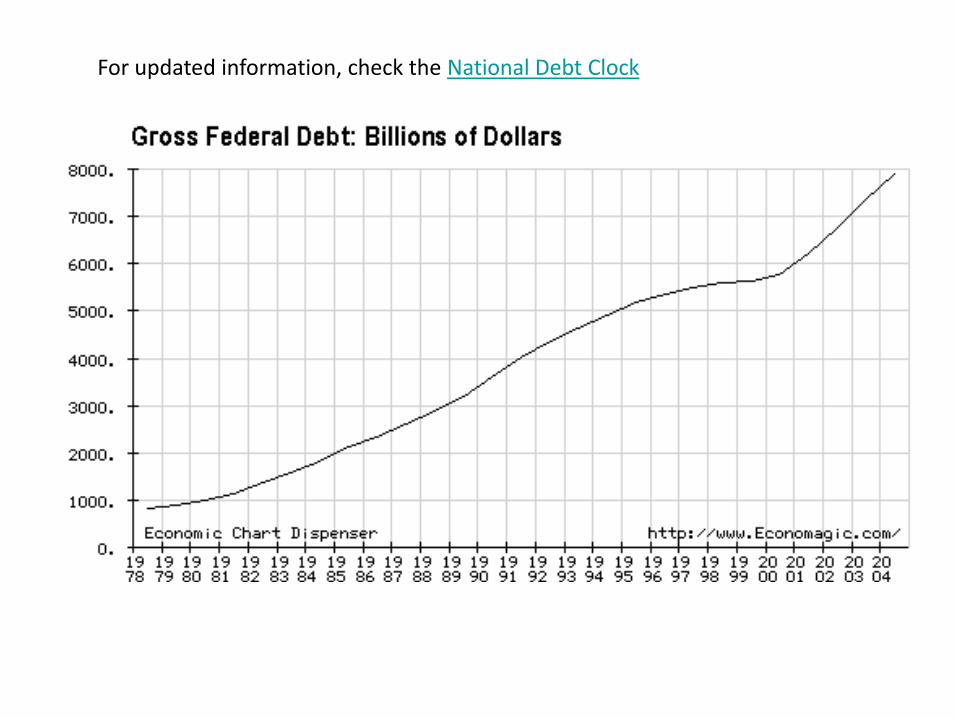
-1400
-1200
-1000
-800
-600
-400
-200
0
200
400
19
78
19
79
19
80
19
81
19
82
19
83
19
84
19
85
19
86
19
87
19
88
19
89
19
90
19
91
19
92
19
93
19
94
19
95
19
96
19
97
19
98
19
99
20
00
20
01
20
02
20
03
20
04
20
05
20
06
20
07
20
08
20
09
Bill
ion
s
Year
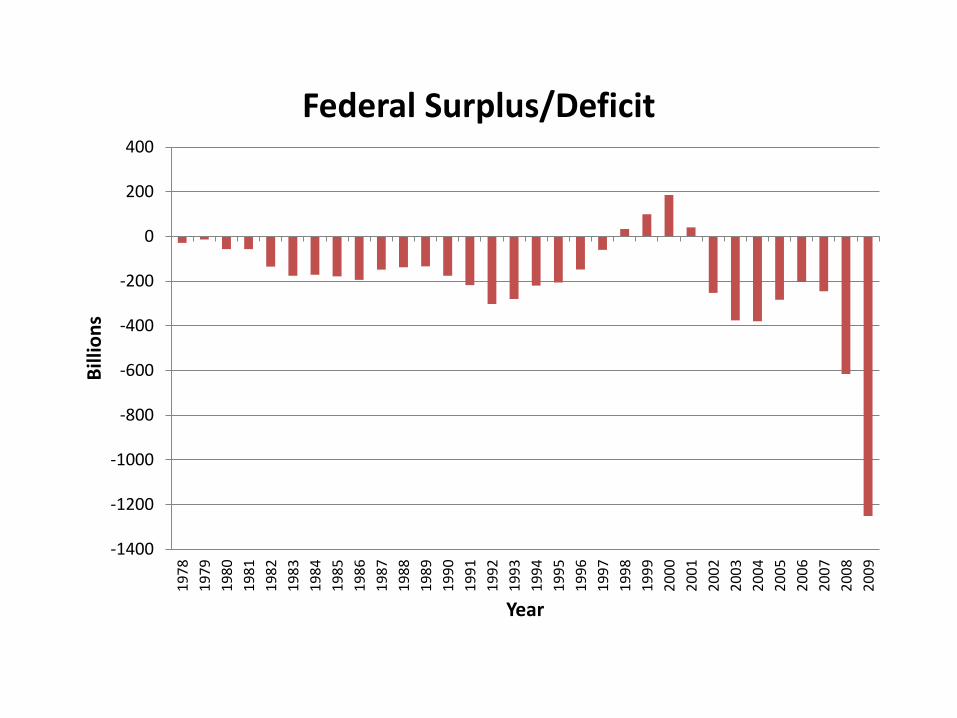
Federal Surplus/Deficit
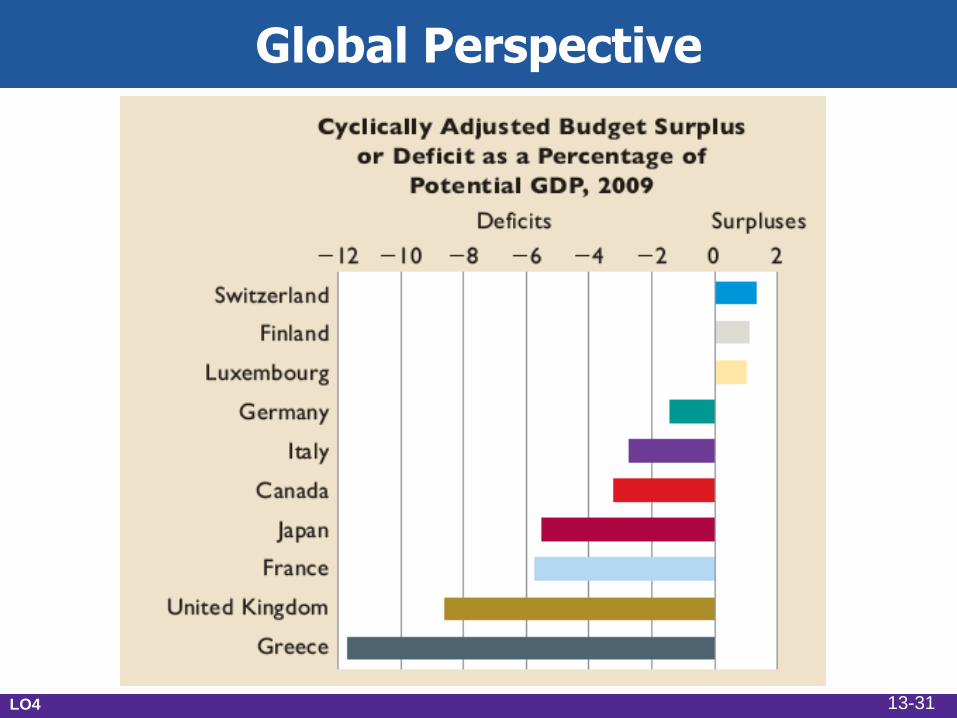
Global Perspective
LO4 13-31
Problems, Criticisms, & Complications
• Problems of Timing
• Recognition lag
• Administrative lag
• Operational lag
• Political business cycles
• Future policy reversals
• Off-setting state and local finance
• Crowding-out effect
LO4 13-32
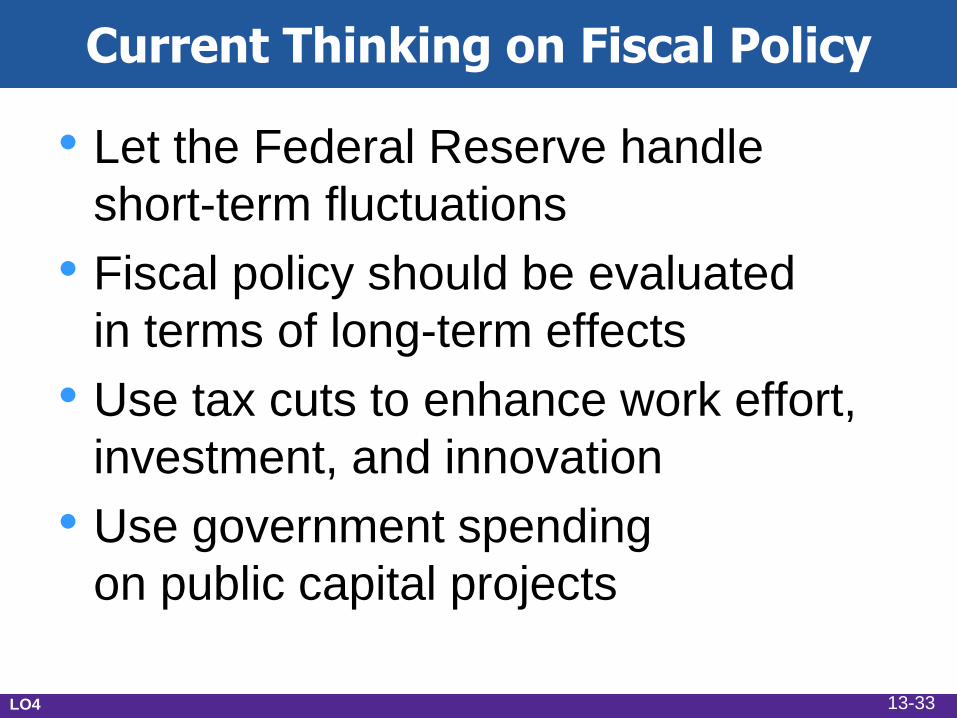
Current Thinking on Fiscal Policy
• Let the Federal Reserve handle
short-term fluctuations
• Fiscal policy should be evaluated
in terms of long-term effects
• Use tax cuts to enhance work effort,
investment, and innovation
• Use government spending
on public capital projects
LO4 13-33
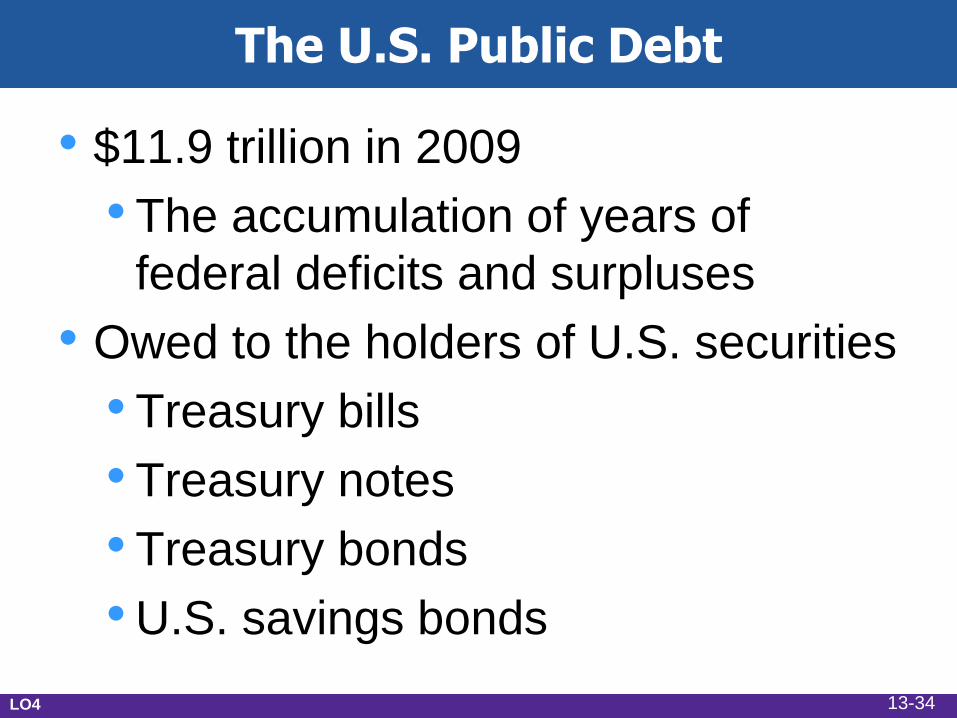
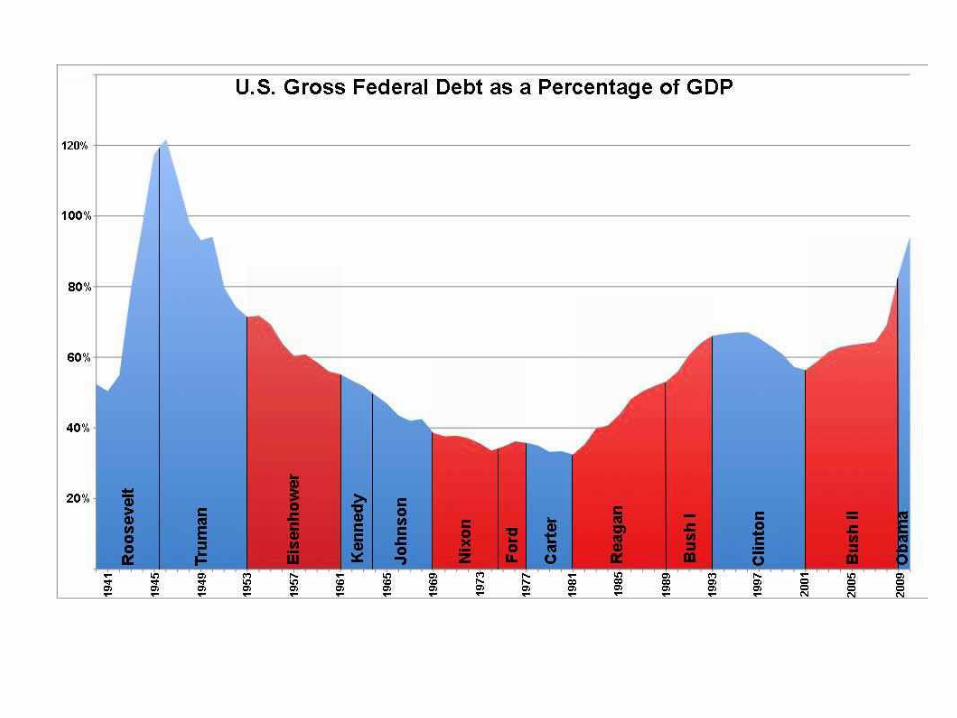
The U.S. Public Debt
• $11.9 trillion in 2009
• The accumulation of years of
federal deficits and surpluses
• Owed to the holders of U.S. securities
• Treasury bills
• Treasury notes
• Treasury bonds
• U.S. savings bonds
LO4 13-34
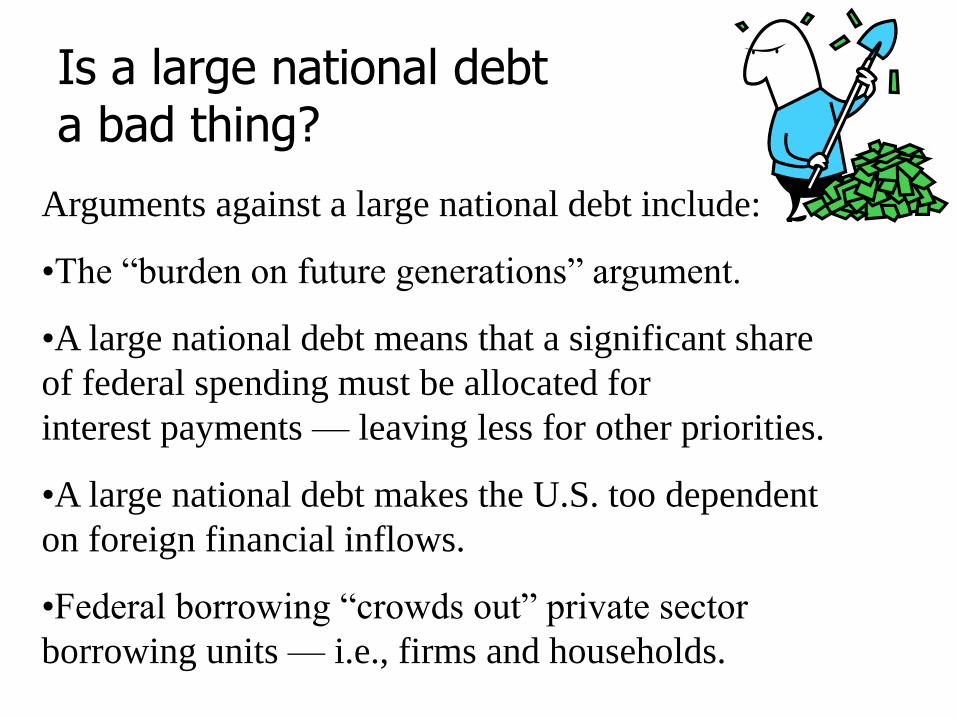
Is a large national debt a bad thing?
Arguments against a large national debt include:
•The “burden on future generations” argument.
•A large national debt means that a significant share
of federal spending must be allocated for
interest payments — leaving less for other priorities.
•A large national debt makes the U.S. too dependent
on foreign financial inflows.
•Federal borrowing “crowds out” private sector
borrowing units — i.e., firms and households.
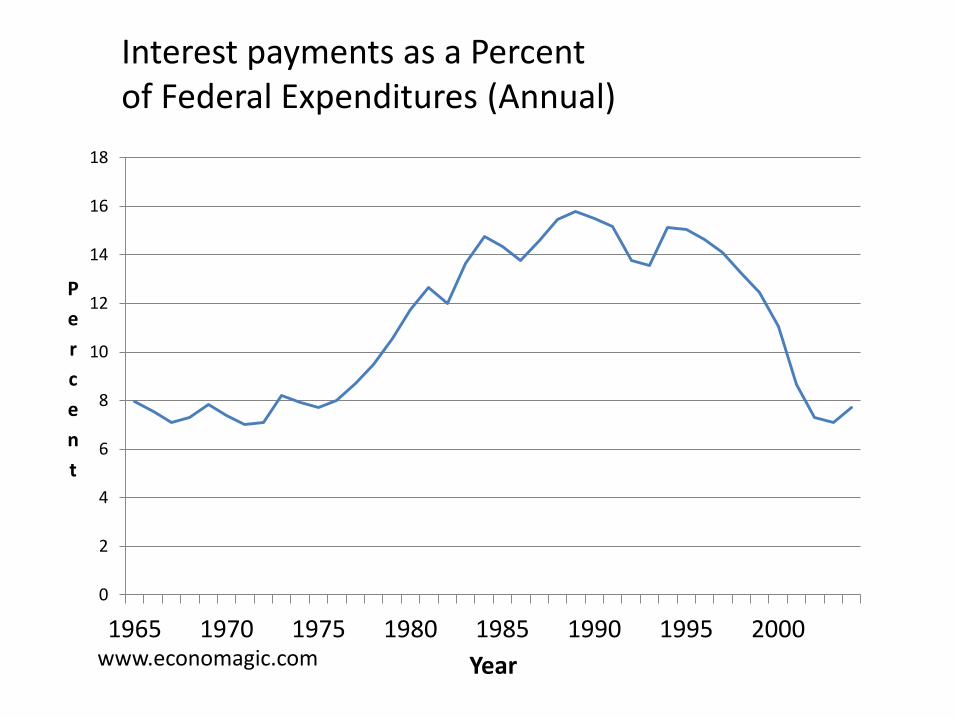
0
2
4
6
8
10
12
14
16
18
1965 1970 1975 1980 1985 1990 1995 2000
P
e
r
c
e
n
t
Year
Interest payments as a Percent of Federal Expenditures (Annual)
www.economagic.com
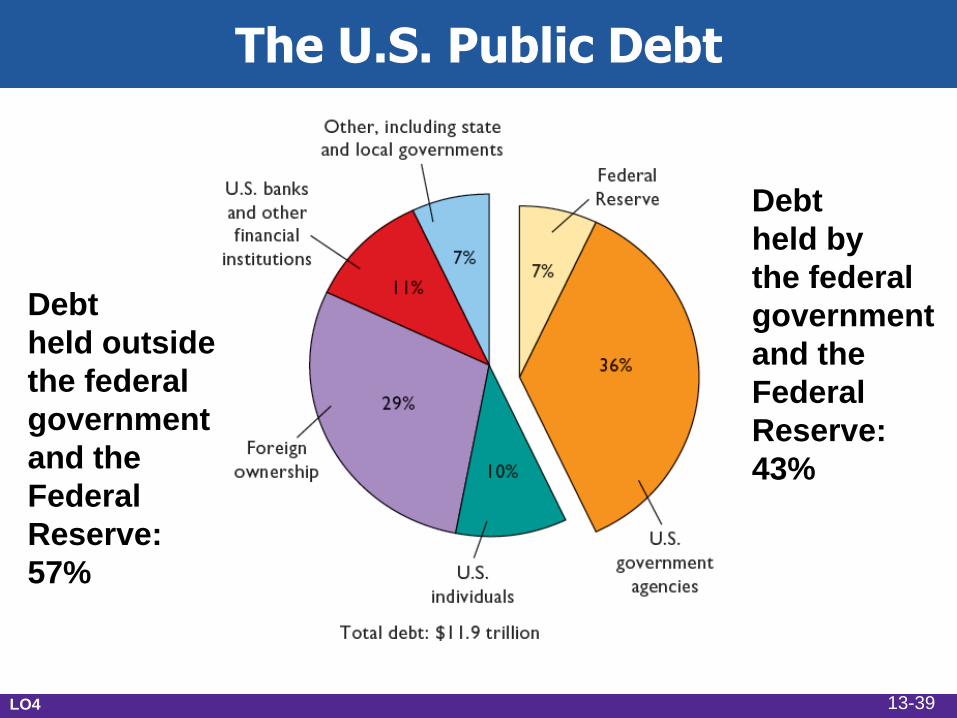
The U.S. Public Debt
LO4
Debt
held outside
the federal
government
and the
Federal
Reserve:
57%
Debt
held by
the federal
government
and the
Federal
Reserve:
43%
13-39
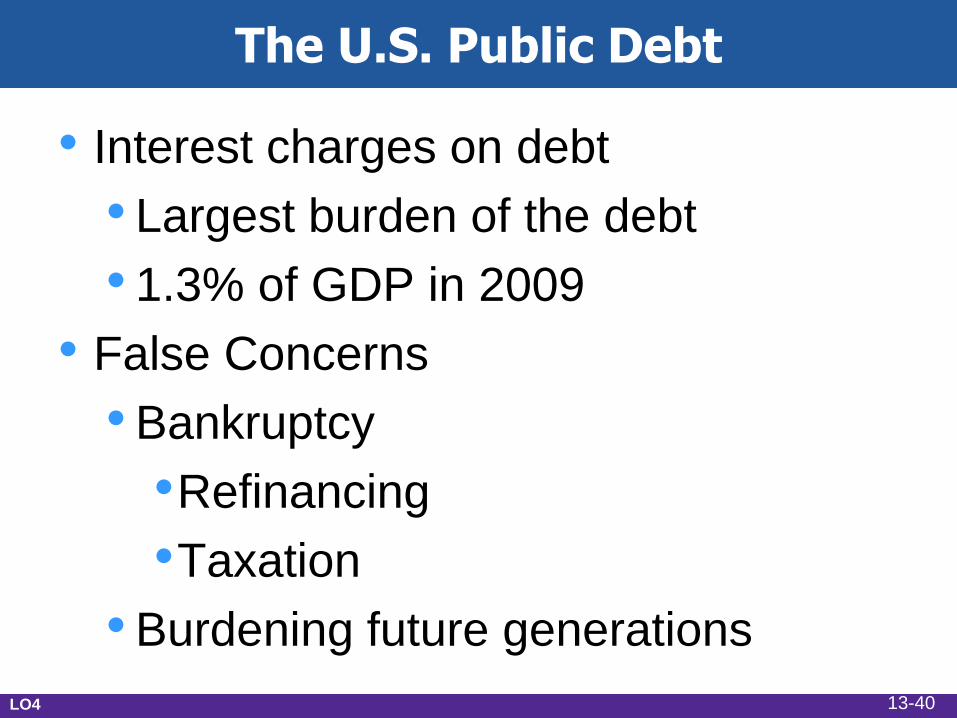
The U.S. Public Debt
• Interest charges on debt
• Largest burden of the debt
• 1.3% of GDP in 2009
• False Concerns
• Bankruptcy
•Refinancing
•Taxation
• Burdening future generations
LO4 13-40
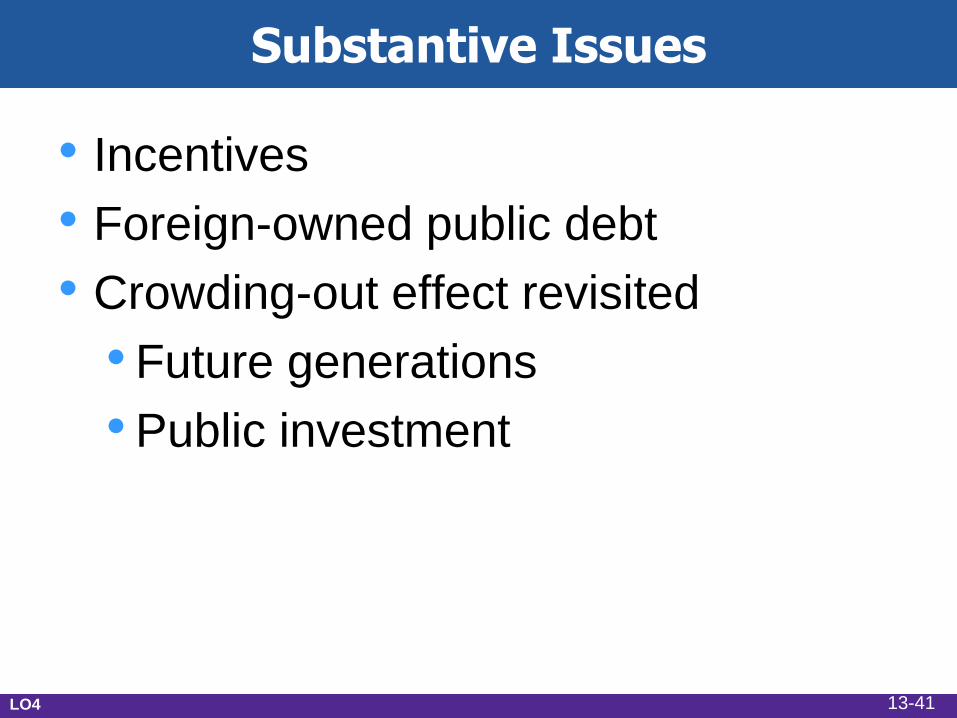
Substantive Issues
• Incentives
• Foreign-owned public debt
• Crowding-out effect revisited
• Future generations
• Public investment
LO4 13-41
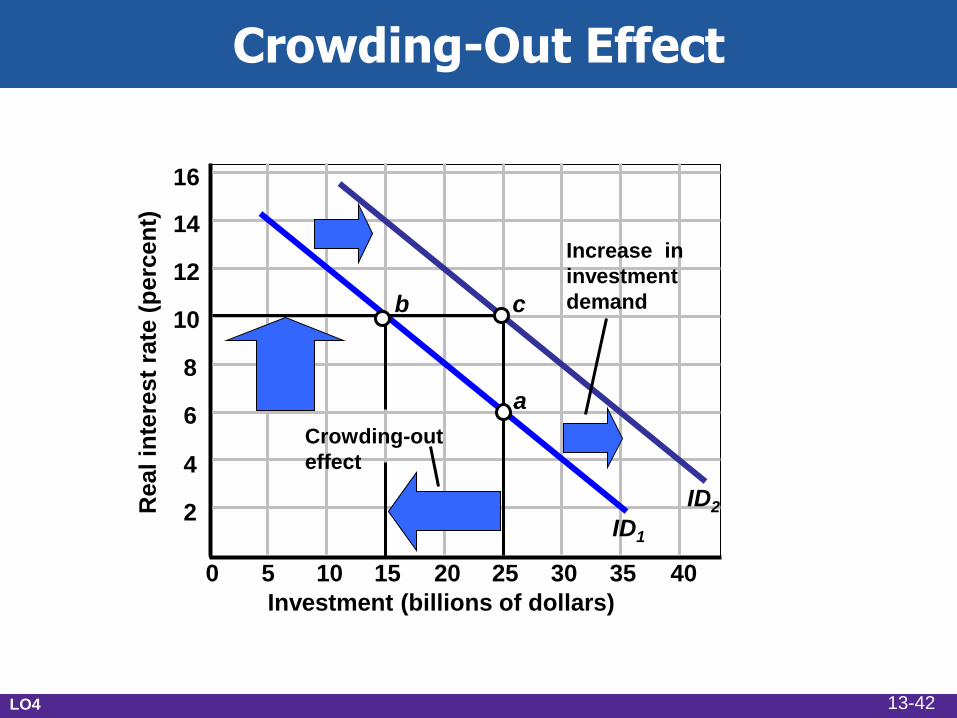
Crowding-Out Effect
5 10 15 20 25 30 35 40 0
2
4
6
8
10
12
14
16
Real in
tere
st
rate
(p
erc
en
t)
Investment (billions of dollars)
ID1
ID2
a
b c
Increase in
investment
demand
Crowding-out
effect
LO4 13-42
Social Security, Medicare Shortfalls
• More Americans will be receiving
benefits as they age
• Social security shortfalls
• Income during retirement
• Funds will be depleted by 2037
• Medicare shortfalls
• Medical care during retirement
• Funds will be depleted by 2017
13-43
Social Security, Medicare Shortfalls
• Possible options “to fix” include:
• Increasing the retirement age
• Increasing the portion of earnings
subject to the social security tax
• Disqualifying wealthy individuals
• Redirecting low-skilled immigrants
to higher-skilled, higher paying work
• Defined contribution plans owned
by individuals 13-44