Embed Size (px)
Citation preview
Preliminary Version. Comments Welcome
Fiscal Policy and EMU:
Antonio Fatas and Ilian MihovINSEAD and CEPR
Abstract This paper presents an empirical study of fiscal policy trends in EMU countries in
the last 10 years. When reviewing these trends, we pay special attention to the last two yearsin order to assess whether EMU has made a difference in terms of fiscal policy. We also look
at some of the longer-term issues of fiscal policy such as the composition of the adjustment
or the targets that countries should keep to ensure that their deficits do not reach the 3%ceiling of the Stability and Growth Pact.
1.- Introduction
This paper studies the behavior of fiscal policy in the EMU countries afterJanuary 1999. To provide a benchmark, we first look at the years that precededthe creation of the single currency area and then we ask whether the last twoyears represent a significant change in the overall trend towards fiscal disciplinestarted with the Maastricht Treaty in 1991.
In the last decade, members of the European Economic and Monetary Unionwent through significant fiscal adjustments in preparation for the launch of thenew currency. In some cases, these adjustments took place in an unfavourableeconomic environment due to the low growth rates experienced during the firsthalf of the 90’s. The process of fiscal adjustment was done in accordance withthe criteria spelled in the Maastricht treaty and led to large reductions in budgetdeficits, especially in the years 1994-1997.
The introduction of the Euro in January 1999 and the replacement of theMaastricht Treaty criteria by the rules of the Stability and Growth Pact haveadded new challenges in the conduct of fiscal policy under EMU. Although theStability and Growth Pact should be conducive to an environment characterizedby discipline in fiscal policy, there are still many unanswered questions on whatis the best way to achieve and monitor that discipline and the effects that it willhave on the real economy.
In this paper we provide a review of some of the questions raised by the
Fiscal Policy 2
behavior of fiscal policy in the first two years of EMU. One of the main issuesthat has arisen is the medium-run target that countries should have in mindin order to keep their budget deficits away from the 3% limit. To answer thisquestion one needs to produce estimates of the normal cyclical behavior of thebudget deficit. These estimates can be, of course, different for different countries,which makes it difficult to adopt any general rule that can be applied to allmembers of EMU. There can also be asymmetries related to the cyclical positionof the economy. While in recessions or slowdowns the budget deficit might bevery responsive to the change in economic activity, this response can be muchmore moderate when growth is strong because of the tendency to spend some ofthe money collected through the cyclical increase in revenues.
A second related question is the need for coordination of fiscal policy in amonetary union. As long as the divergence in fiscal policy is the result of differ-ences in the business cycle, it would be difficult to argue that these differenceswould have any negative impact on the implementation of monetary policy. Butwhen the differences in fiscal policy are the result of discretionary (or exogenous)changes in national fiscal policy, then the implementation of monetary policy andits interaction with fiscal policy might be affected. In order to assess the degreeof coordination of discretionary fiscal policy we look at the cyclically-adjustedbudget balance as well as a constructed indicator of the fiscal stance for each ofthe countries and then calculate correlations of these indicators across differentperiods of time in our sample.
When looking at the trends of the last decade we pay special attention tothe last two years. Has EMU made a difference? The answers to this questioncan only be speculative, given that there are only two years to be studied and itis impossible to control for all other changes that have taken place in those twoyears. One hypothesis that we test is the idea that once EMU started, countrieshave reduced their efforts towards fiscal discipline, not only because the highgrowth rates of 1999 and 2000 that have kept budget balances under control, butalso because the ‘punishments’ associated to the lack of fiscal discipline are notas visible and evident as in the years before EMU was launched.
The paper is organized as follows. Section 2 provides some descriptive statis-tics on the behavior of fiscal policy in European countries before and after EMU.Section 3 calculates a fiscal policy stance index for all countries. This index isused to assess the degree of coordination of fiscal policy among all members ofEMU. Section 4 focuses on the last two years and looks into the question of

Fiscal Policy 3
how different fiscal policy has been under EMU. Section 5 discusses mid-termchallenges of fiscal policy. Section 6 concludes by looking at policy implicationsof our empirical results.
2. Fiscal Policy Before and After EMU
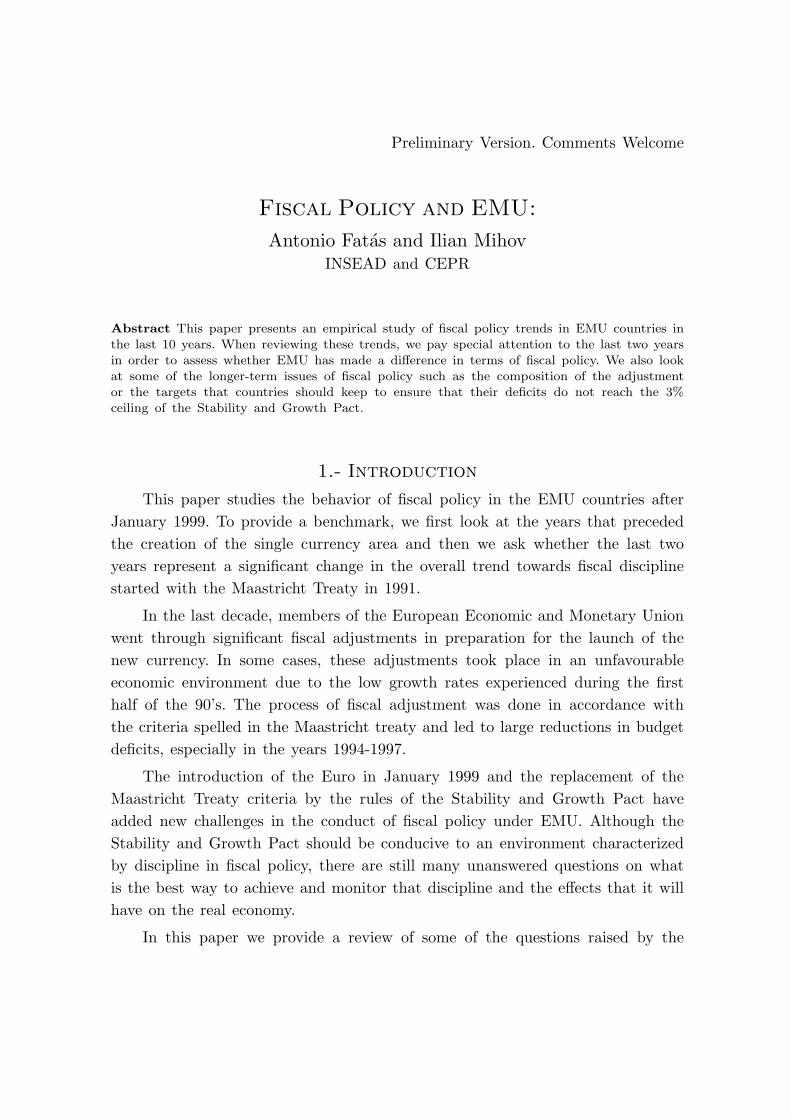
In the last decade, European countries have experienced large budgetaryadjustments as the result of the conditions set by the Maastricht treaty. Theadjustment has been uneven during the decade. While in the first years (1991-1992) fiscal policy was either expansionary or neutral as indicated by differentmeasures of the fiscal stance, starting in 1993 most countries moved to restrictionsin fiscal policy that ensured a reduction in their budget deficits. Figure 1 showsthe evolution of the budget deficit and the cyclically-adjusted budget deficit inthe period 1990-2000 for the Euro11 countries.1
[Insert Figure 1 about here]
The cyclically-adjusted budget deficit in these countries moved from 5.9% ofGDP in 1991 to about 0.7% in 1999. This process of adjustment was uneven, asmost of the adjustment took place in the latter years, after 1995. The two mostrestrictive years were 1996 and 1997. The raw budget deficit shows a similarpattern except for an increase in the first years, which reflects the reduction inGDP growth rates and the associated decrease in the budget balance.
Regarding the composition of the adjustment, the reduction in budget deficitswas achieved through a combination of a reduction in expenditures and an in-crease in tax revenues. Figure 2 shows the cyclically-adjusted figures for govern-ment expenditures and taxes for the Euro11 countries. In the case of expenditures,there is a reduction from 49.6% of GDP in 1991 to 48.3% in 1999. During thesame years, taxes were increased from 43.7% to 47.6%.
[Insert Figure 2 about here]
In terms of timing, the adjustment has been uneven. While most of the fallin government expenditures took part in the second half of the 90’s, the increase
1 We use the terminology Euro11 to refer to the 11 countries that joined EMU in January1999. When we include Greece in the sample we talk about Euro12. In some instances, when
looking at Euro11, we exclude Luxembourg from the sample because data are not available. In
that case we talk about Euro10.
Fiscal Policy 4
in taxes was more pronounced in the first 5 years. For example, during the firstyears (until 1993) government expenditures increased and peaked at a level ofaround 52% to come down to about 47% by the end of the decade.2 Taxes,on the other hand, increased rapidly in the years 1992-1997, reaching a levelof 47.5% of GDP and have remained stable since then.3 One of the reasons forthe uneven adjustment of government expenditures is the evolution of financialexpenditures associated to the interest payments on the government debt. Whileinterest payments increased from 4.8% to 5.5% in the period 1990-1993, after1995 the reduction in interest rates brought this burden down to 4.3% by 1999.This means that about half of the reduction in government expenditures duringthe period 1995-1999 is due to a reduction in interest payments.
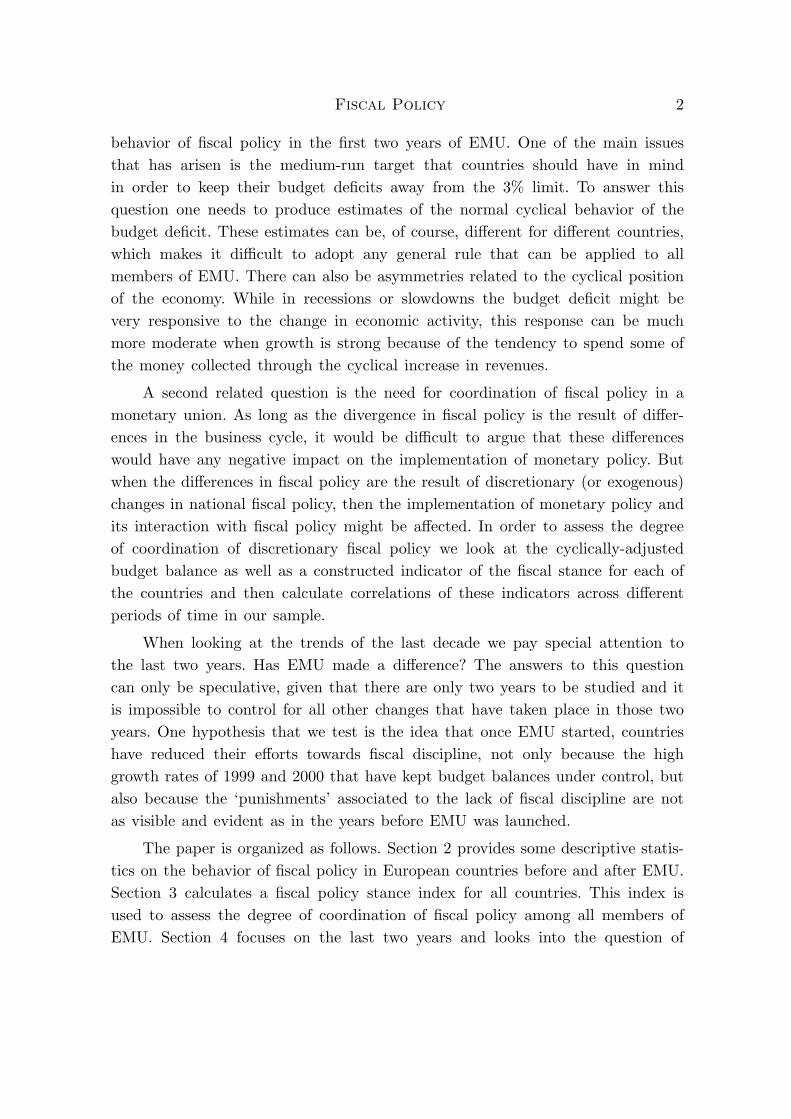
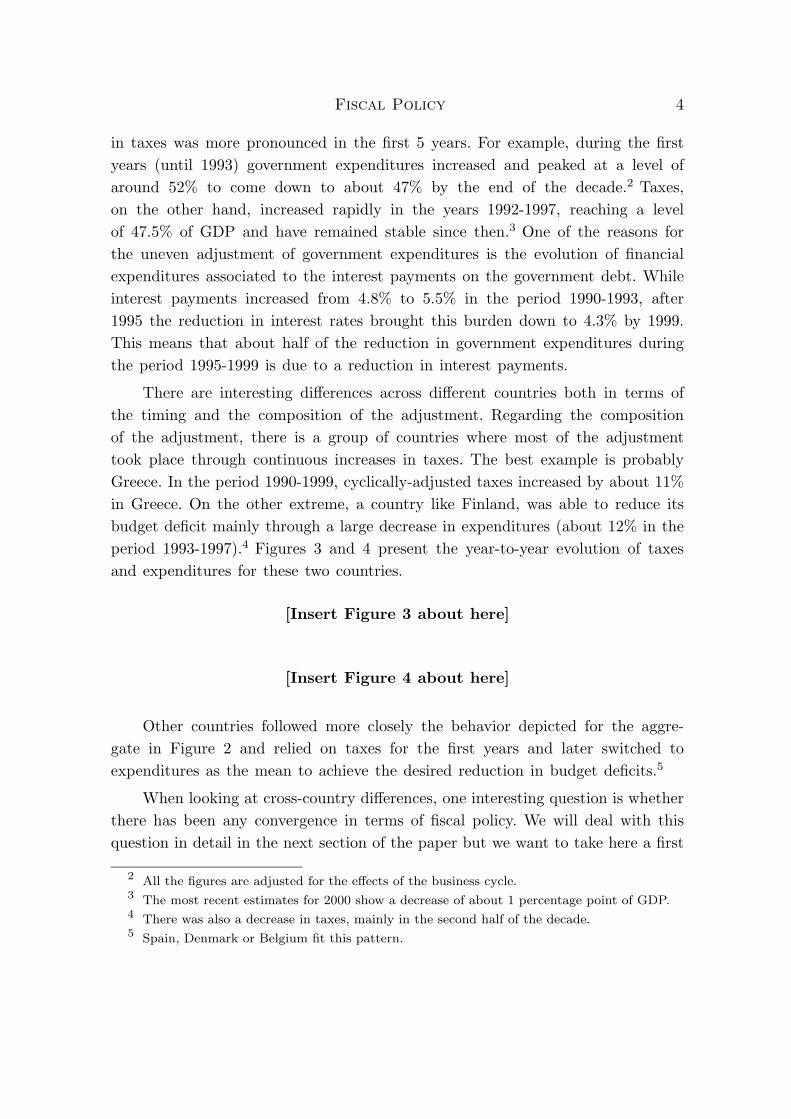
There are interesting differences across different countries both in terms ofthe timing and the composition of the adjustment. Regarding the compositionof the adjustment, there is a group of countries where most of the adjustmenttook place through continuous increases in taxes. The best example is probablyGreece. In the period 1990-1999, cyclically-adjusted taxes increased by about 11%in Greece. On the other extreme, a country like Finland, was able to reduce itsbudget deficit mainly through a large decrease in expenditures (about 12% in theperiod 1993-1997).4 Figures 3 and 4 present the year-to-year evolution of taxesand expenditures for these two countries.
[Insert Figure 3 about here]
[Insert Figure 4 about here]
Other countries followed more closely the behavior depicted for the aggre-gate in Figure 2 and relied on taxes for the first years and later switched toexpenditures as the mean to achieve the desired reduction in budget deficits.5
When looking at cross-country differences, one interesting question is whetherthere has been any convergence in terms of fiscal policy. We will deal with thisquestion in detail in the next section of the paper but we want to take here a first
2 All the figures are adjusted for the effects of the business cycle.3 The most recent estimates for 2000 show a decrease of about 1 percentage point of GDP.4 There was also a decrease in taxes, mainly in the second half of the decade.5 Spain, Denmark or Belgium fit this pattern.

Fiscal Policy 5
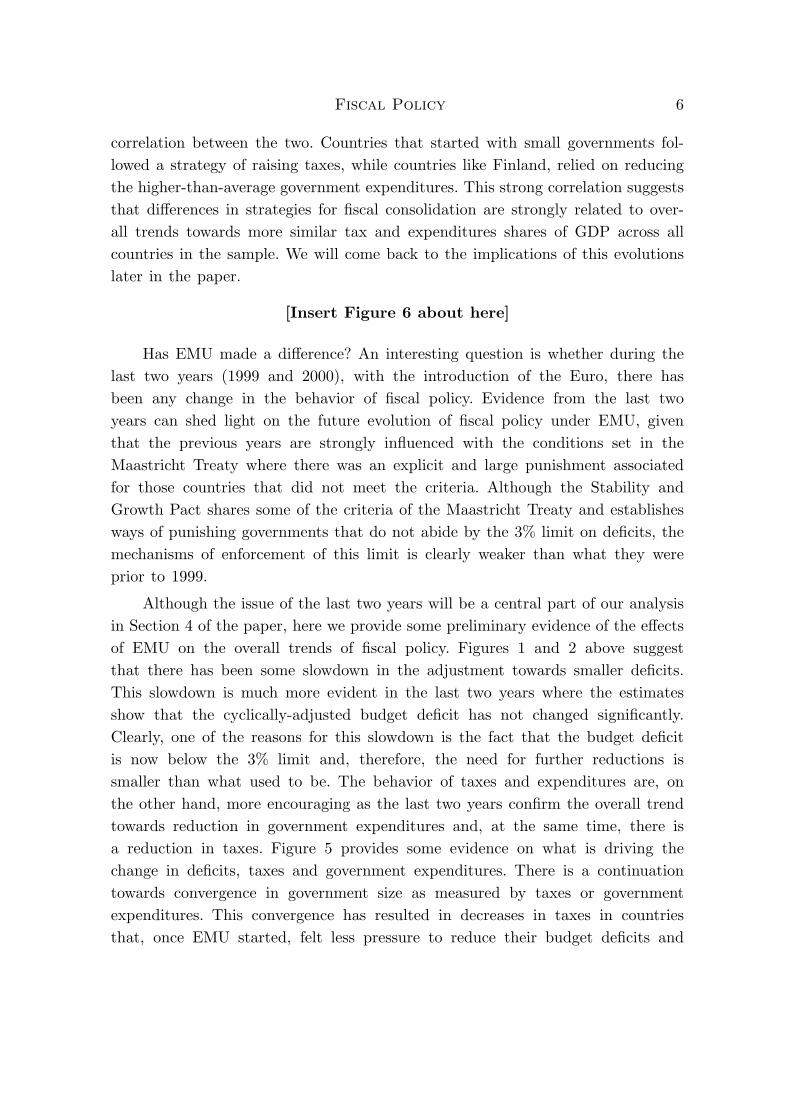
look at some of the raw numbers. Figure 5 displays the standard deviation (forthe Euro11 countries) of the budget balance, taxes and government expenditures,all as a % of GDP.6
[Insert Figure 5 about here]
In all three cases, the pattern is towards convergence, as the standard devia-tion falls during the last 10 years. There should be no surprise in the convergenceof budget deficits, given that it was one of the goals of the Maastricht Treaty, butwhat is more interesting is the convergence in the size of the government (mea-sured by either taxes or government expenditures). While in 1991 the standarddeviation of the taxes-to-GDP ratio in the Euro11 countries was 6.03, it had gonedown to 4.6 by 1999. There is even more convergence if we look at the Euro12countries were the equivalent figures are 6.6 and 4.5 or the EU15 countries, whereit goes down from a peak of about 8.34 in 1993 to 6.3 by 1999.
This evolution of the taxes-to-GDP ratio suggests that behind the trendtowards similar budget deficits, the last ten years have also witnessed a trendtowards a similar government size. This has been achieved largely through in-creases in taxes for the countries with the lowest tax burden but also throughsmall decreases in some of the countries with the highest taxes-to-GDP ratio.Understanding this evolution is key to analyzing the prospects for further fiscalconsolidation.
To illustrate the importance of this convergence in taxes and expenditures,we focus on the differences in strategies for correcting high budget deficits thatwe have observed in the last 10 years.7 As mentioned before, countries like Fin-land relied more heavily on reduction in government expenditures, while countrieslike Greece relied on increases in taxes. Finland is, of course, one of the coun-tries with a large government and Greece, on the other hand, has one of thesmallest governments. Are these two countries isolated examples in terms of theirstrategic choices to reduce budget deficits? Figure 6 suggests that, on the con-trary, this pattern can be generalized to all the countries in the Euro12 group.Figure 6 shows the correlation between the adjustment in taxes during the last10 years and the initial level of taxes to GDP. There is a very strong negative
6 Al figures are cyclically adjusted.7 As shown in Alesina and Perotti (1995), different strategies to correct fiscal imbalances have
very different implications regarding their sustainability.
Fiscal Policy 6
correlation between the two. Countries that started with small governments fol-lowed a strategy of raising taxes, while countries like Finland, relied on reducingthe higher-than-average government expenditures. This strong correlation suggeststhat differences in strategies for fiscal consolidation are strongly related to over-all trends towards more similar tax and expenditures shares of GDP across allcountries in the sample. We will come back to the implications of this evolutionslater in the paper.
[Insert Figure 6 about here]
Has EMU made a difference? An interesting question is whether during thelast two years (1999 and 2000), with the introduction of the Euro, there hasbeen any change in the behavior of fiscal policy. Evidence from the last twoyears can shed light on the future evolution of fiscal policy under EMU, giventhat the previous years are strongly influenced with the conditions set in theMaastricht Treaty where there was an explicit and large punishment associatedfor those countries that did not meet the criteria. Although the Stability andGrowth Pact shares some of the criteria of the Maastricht Treaty and establishesways of punishing governments that do not abide by the 3% limit on deficits, themechanisms of enforcement of this limit is clearly weaker than what they wereprior to 1999.
Although the issue of the last two years will be a central part of our analysisin Section 4 of the paper, here we provide some preliminary evidence of the effectsof EMU on the overall trends of fiscal policy. Figures 1 and 2 above suggestthat there has been some slowdown in the adjustment towards smaller deficits.This slowdown is much more evident in the last two years where the estimatesshow that the cyclically-adjusted budget deficit has not changed significantly.Clearly, one of the reasons for this slowdown is the fact that the budget deficitis now below the 3% limit and, therefore, the need for further reductions issmaller than what used to be. The behavior of taxes and expenditures are, onthe other hand, more encouraging as the last two years confirm the overall trendtowards reduction in government expenditures and, at the same time, there isa reduction in taxes. Figure 5 provides some evidence on what is driving thechange in deficits, taxes and government expenditures. There is a continuationtowards convergence in government size as measured by taxes or governmentexpenditures. This convergence has resulted in decreases in taxes in countriesthat, once EMU started, felt less pressure to reduce their budget deficits and
Fiscal Policy 7
decided to reduce taxes to address the medium-term goal of reducing the taxburden. At the same time, some of the countries where taxes are the lowestcontinued with the adjustment of previous years as they saw no need to reducetaxes. This has led to a mild increase in the dispersion of budget deficits. If thisevolution were to continue we could start a process of increases in disparities interms of budget deficits as long as the countries with larger governments are notable to keep up with the reduction in tax rates through a fall in governmentexpenditures.
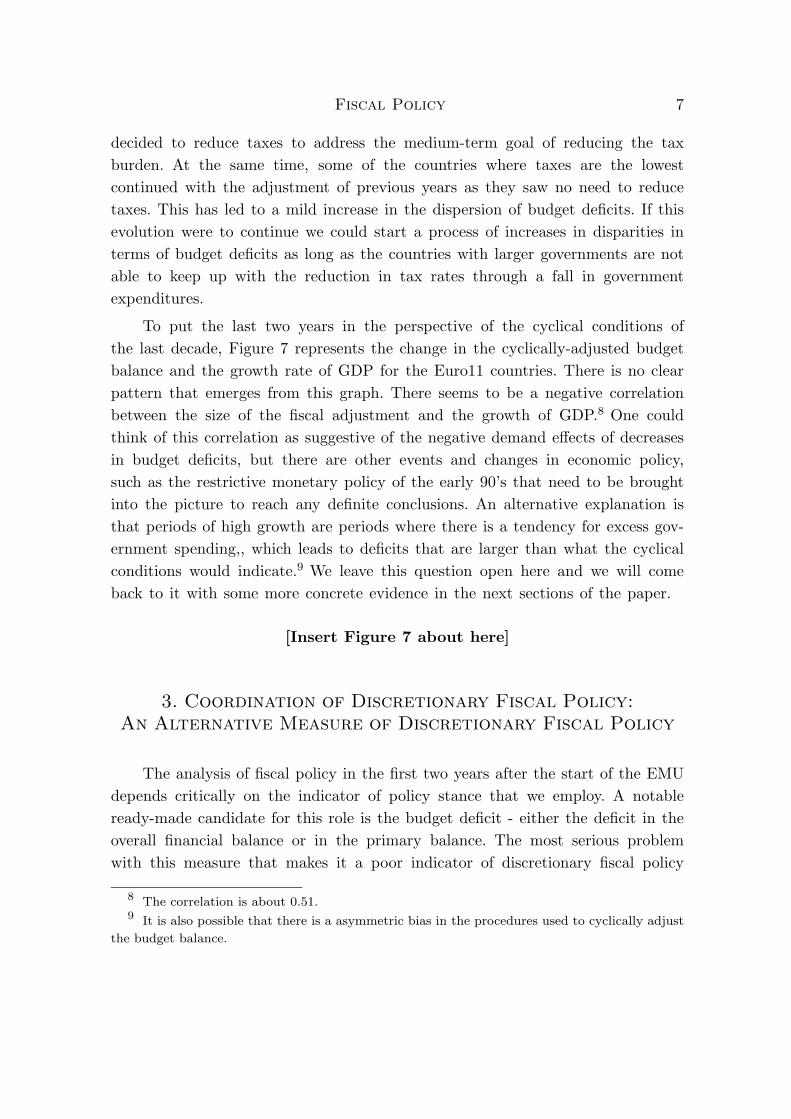
To put the last two years in the perspective of the cyclical conditions ofthe last decade, Figure 7 represents the change in the cyclically-adjusted budgetbalance and the growth rate of GDP for the Euro11 countries. There is no clearpattern that emerges from this graph. There seems to be a negative correlationbetween the size of the fiscal adjustment and the growth of GDP.8 One couldthink of this correlation as suggestive of the negative demand effects of decreasesin budget deficits, but there are other events and changes in economic policy,such as the restrictive monetary policy of the early 90’s that need to be broughtinto the picture to reach any definite conclusions. An alternative explanation isthat periods of high growth are periods where there is a tendency for excess gov-ernment spending,, which leads to deficits that are larger than what the cyclicalconditions would indicate.9 We leave this question open here and we will comeback to it with some more concrete evidence in the next sections of the paper.
[Insert Figure 7 about here]
3. Coordination of Discretionary Fiscal Policy:
An Alternative Measure of Discretionary Fiscal Policy
The analysis of fiscal policy in the first two years after the start of the EMUdepends critically on the indicator of policy stance that we employ. A notableready-made candidate for this role is the budget deficit - either the deficit in theoverall financial balance or in the primary balance. The most serious problemwith this measure that makes it a poor indicator of discretionary fiscal policy
8 The correlation is about 0.51.9 It is also possible that there is a asymmetric bias in the procedures used to cyclically adjust
the budget balance.

Fiscal Policy 8
is its endogeneity. The deficit captures both exogenous policy shifts as well asautomatic reaction of fiscal variables to the state of the economy thus confoundingpolicy effects and endogenous economic fluctuations. In this section we propose amethodology for adjusting the primary budget balance to obtain an indicator ofdiscretionary fiscal policy. On the basis of this indicator we will study whetherthe first two years of the EMU have been accompanied by loose or tight fiscalpolicy and whether these first years have seen increasing dispersion in policystance across member countries.
The construction of cyclically adjusted budget deficit can be carried out ina number of different ways. The endogenous nature of the budget balance can behandled, for example, by removing the reactive components, taxes and transfers,from the fiscal balance thus concentrating only on the autonomous components ofspending. Admittedly this is a crude way of adjustment that might throw awayimportant and interesting information. An alternative method is to construct a‘cyclically-adjusted’ fiscal balance such as the one we have used in the previoussection, a current practice at the European Commission, the IMF and the OECD.The adjustment is carried out by establishing a benchmark cyclical indicator (anoutput gap, for example) and relating the deficit to the state of the cycle relativeto the benchmark.10
An interesting contribution to this literature is a paper by Blanchard (1993).He argues that an indicator of discretionary fiscal policy must be relative innature. The procedure outlined in his paper requires selecting a pre-specifiedbenchmark and estimating elasticities of the different components of the budgetwith respect to a representative set of macroeconomic variables. The response ofthe budget deficit to current economic conditions is then constructed by usingthe estimated elasticities. The difference between this value and the actual budgetdeficit is a measure of discretionary fiscal policy. The original recommendationis to use unemployment, inflation, and interest rates in the construction of theinduced changes in the budget balance. Indeed, a version of this indicator hasbeen recently used in a paper by Alesina and Perotti (1995). In their studyof fiscal consolidations in OECD countries they construct an indicator of fiscalpolicy by using the current rate of unemployment as the driving variable fortransfers and taxes. Here we extend their work by taking a slightly agnostic butmore general approach. We use GDP instead of unemployment and we include a
10 See Alesina and Perotti (1995) for a discussion of these measures.

Fiscal Policy 9
measure of the price level and interest rates.
Our baseline regression contains logarithm of real GDP, logarithm of theimplicit GDP deflator, ratio of primary deficit to output and the real short-terminterest rate. This composition of the vector of explanatory variables must beregarded as the minimal set of macroeconomic variables necessary for the con-struction of an indicator of fiscal policy. The estimated equation is the following:
Yt =k∑i=0
DiXt−i +k∑i=1
giYt−i + vfpt (1)
Where vector X represents the set of macroeconomic variables necessary forestimating the induced changes in the budget balance. Y is a measure of fiscalpolicy stance. The indicator of discretionary fiscal policy is the residual denotedby vfp - this indicator is orthogonal to the state of the economy captured bythe current and lagged values of macroeconomic variables, which in our viewcorresponds to the notion of discretionary, as opposed to reactive, policy.11 We useannual data and we find it reasonable to use only one lag of the macroeconomicvariables and the policy measure in the econometric estimation.12
We turn now to our main data set which includes thirteen countries - USA,UK, Sweden and all Euro10 countries (all Euro11 countries except for Luxem-bourg). The number of countries is restricted by data availability. For each coun-try we have constructed an indicator of fiscal policy by running the regressionsdescribed by equation (1).
The question we want to address is whether the EMU countries have con-verged in terms of discretionary fiscal policy. We have seen in section 2 that therehas been a convergence in terms of the cyclically-adjusted budget balance. Here
11 In Fatas and Mihov (2001b) we offer an extensive discussion of the fiscal policy indicator. In
the same paper we also show how the economy reacts to shifts in discretionary fiscal policy.12 In our previous work, Fatas and Mihov (2001b), we have checked the properties of our
indicator by comparing it to a quarterly measure of fiscal policy proposed by Blanchard. Weused US quarterly data for this exercise and we find that our indicator of fiscal policy stance
is highly correlated with the measure based on Blanchard’s (1993) suggestions and constructed
by Alesina and Perotti (1995) - the correlation at quarterly frequency is 0.82. This result isquite remarkable given the differences in specification and it provides some validation of our
methodology. Moreover, we can identify from our analysis the major changes in fiscal policy inthe US: The Kennedy-Johnson tax cut in 1964, the Reagan tax cut of 1981, and the Gulf war,
among others - hence our indicator of discretionary fiscal policy provides a reasonable match with
the historical record of US policy.
Fiscal Policy 10
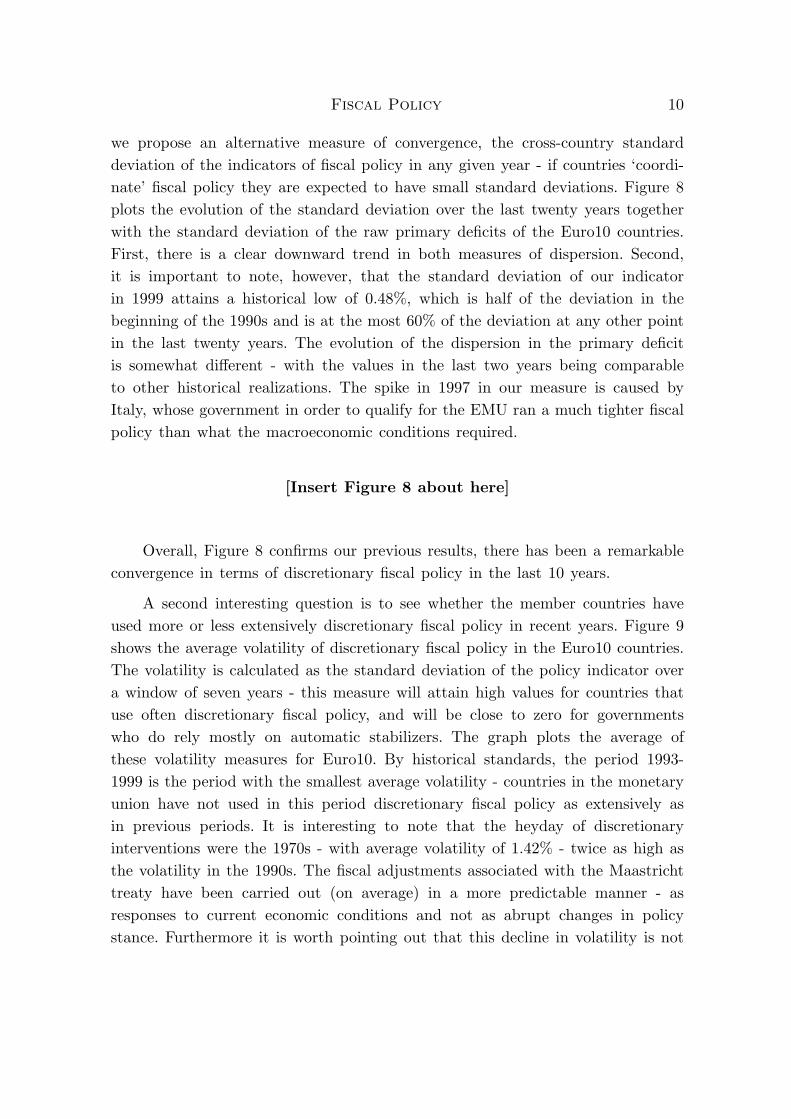
we propose an alternative measure of convergence, the cross-country standarddeviation of the indicators of fiscal policy in any given year - if countries ‘coordi-nate’ fiscal policy they are expected to have small standard deviations. Figure 8plots the evolution of the standard deviation over the last twenty years togetherwith the standard deviation of the raw primary deficits of the Euro10 countries.First, there is a clear downward trend in both measures of dispersion. Second,it is important to note, however, that the standard deviation of our indicatorin 1999 attains a historical low of 0.48%, which is half of the deviation in thebeginning of the 1990s and is at the most 60% of the deviation at any other pointin the last twenty years. The evolution of the dispersion in the primary deficitis somewhat different - with the values in the last two years being comparableto other historical realizations. The spike in 1997 in our measure is caused byItaly, whose government in order to qualify for the EMU ran a much tighter fiscalpolicy than what the macroeconomic conditions required.
[Insert Figure 8 about here]
Overall, Figure 8 confirms our previous results, there has been a remarkableconvergence in terms of discretionary fiscal policy in the last 10 years.
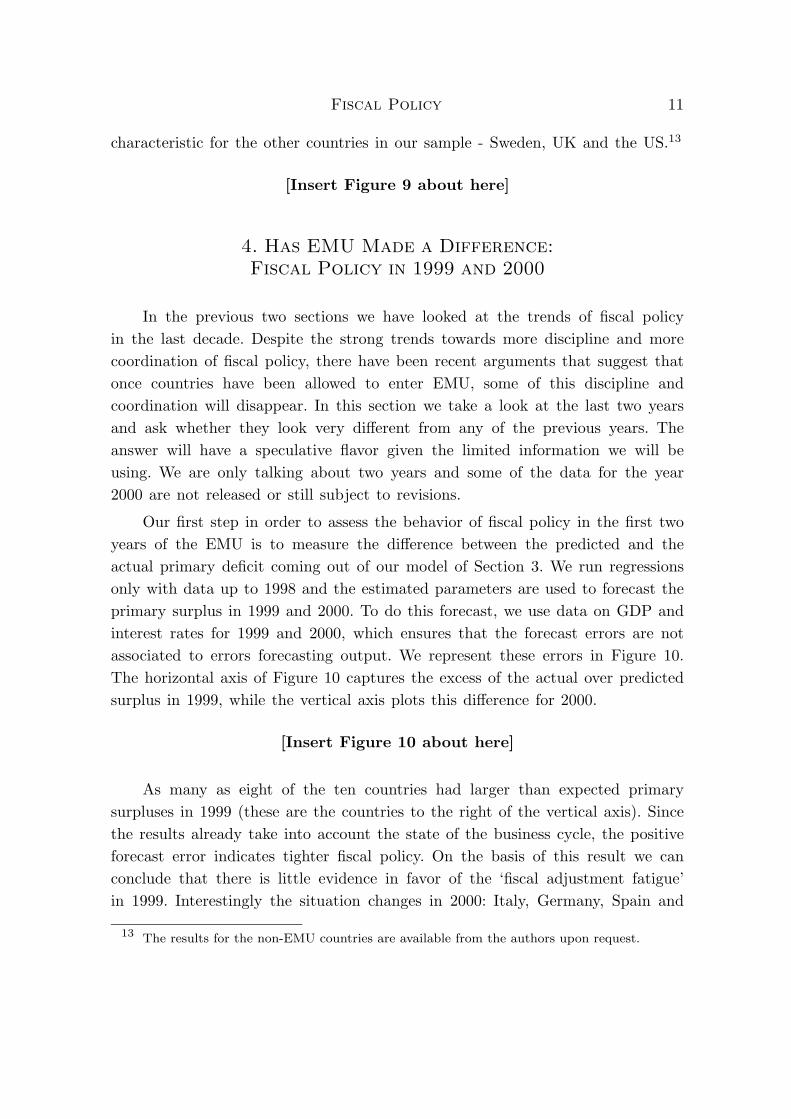
A second interesting question is to see whether the member countries haveused more or less extensively discretionary fiscal policy in recent years. Figure 9shows the average volatility of discretionary fiscal policy in the Euro10 countries.The volatility is calculated as the standard deviation of the policy indicator overa window of seven years - this measure will attain high values for countries thatuse often discretionary fiscal policy, and will be close to zero for governmentswho do rely mostly on automatic stabilizers. The graph plots the average ofthese volatility measures for Euro10. By historical standards, the period 1993-1999 is the period with the smallest average volatility - countries in the monetaryunion have not used in this period discretionary fiscal policy as extensively asin previous periods. It is interesting to note that the heyday of discretionaryinterventions were the 1970s - with average volatility of 1.42% - twice as high asthe volatility in the 1990s. The fiscal adjustments associated with the Maastrichttreaty have been carried out (on average) in a more predictable manner - asresponses to current economic conditions and not as abrupt changes in policystance. Furthermore it is worth pointing out that this decline in volatility is not
Fiscal Policy 11
characteristic for the other countries in our sample - Sweden, UK and the US.13
[Insert Figure 9 about here]
4. Has EMU Made a Difference:
Fiscal Policy in 1999 and 2000
In the previous two sections we have looked at the trends of fiscal policyin the last decade. Despite the strong trends towards more discipline and morecoordination of fiscal policy, there have been recent arguments that suggest thatonce countries have been allowed to enter EMU, some of this discipline andcoordination will disappear. In this section we take a look at the last two yearsand ask whether they look very different from any of the previous years. Theanswer will have a speculative flavor given the limited information we will beusing. We are only talking about two years and some of the data for the year2000 are not released or still subject to revisions.
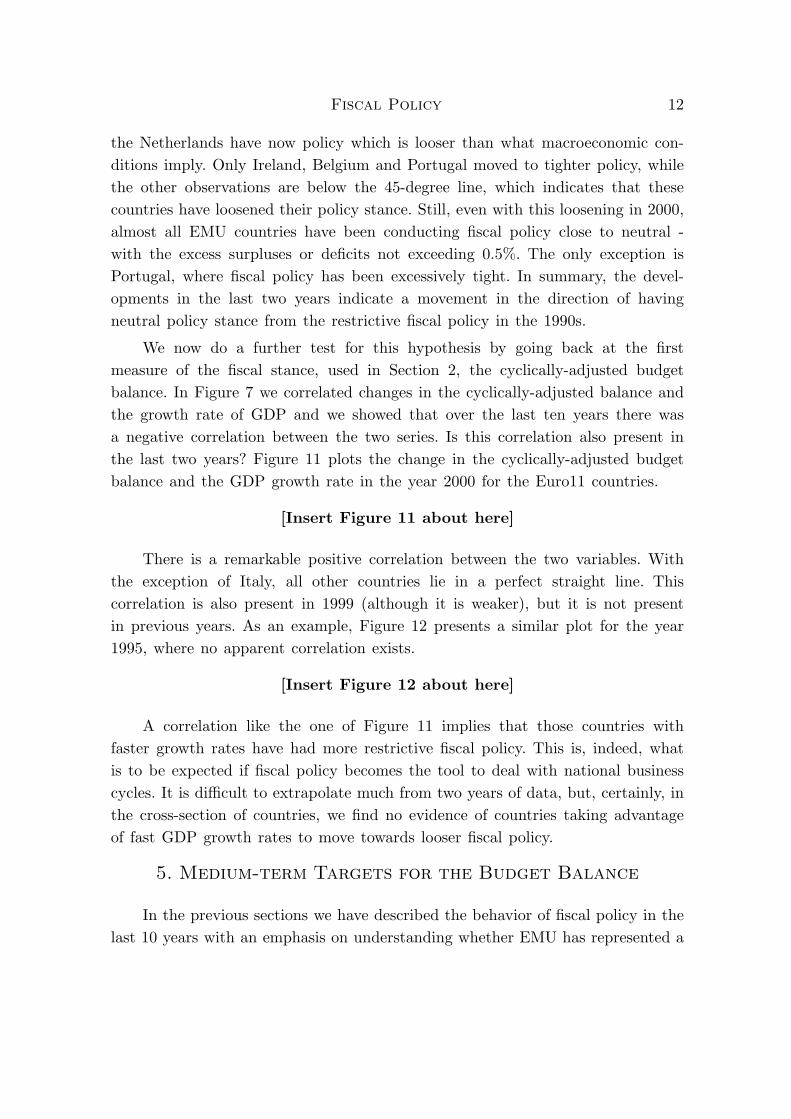
Our first step in order to assess the behavior of fiscal policy in the first twoyears of the EMU is to measure the difference between the predicted and theactual primary deficit coming out of our model of Section 3. We run regressionsonly with data up to 1998 and the estimated parameters are used to forecast theprimary surplus in 1999 and 2000. To do this forecast, we use data on GDP andinterest rates for 1999 and 2000, which ensures that the forecast errors are notassociated to errors forecasting output. We represent these errors in Figure 10.The horizontal axis of Figure 10 captures the excess of the actual over predictedsurplus in 1999, while the vertical axis plots this difference for 2000.
[Insert Figure 10 about here]
As many as eight of the ten countries had larger than expected primarysurpluses in 1999 (these are the countries to the right of the vertical axis). Sincethe results already take into account the state of the business cycle, the positiveforecast error indicates tighter fiscal policy. On the basis of this result we canconclude that there is little evidence in favor of the ‘fiscal adjustment fatigue’in 1999. Interestingly the situation changes in 2000: Italy, Germany, Spain and
13 The results for the non-EMU countries are available from the authors upon request.
Fiscal Policy 12
the Netherlands have now policy which is looser than what macroeconomic con-ditions imply. Only Ireland, Belgium and Portugal moved to tighter policy, whilethe other observations are below the 45-degree line, which indicates that thesecountries have loosened their policy stance. Still, even with this loosening in 2000,almost all EMU countries have been conducting fiscal policy close to neutral -with the excess surpluses or deficits not exceeding 0.5%. The only exception isPortugal, where fiscal policy has been excessively tight. In summary, the devel-opments in the last two years indicate a movement in the direction of havingneutral policy stance from the restrictive fiscal policy in the 1990s.
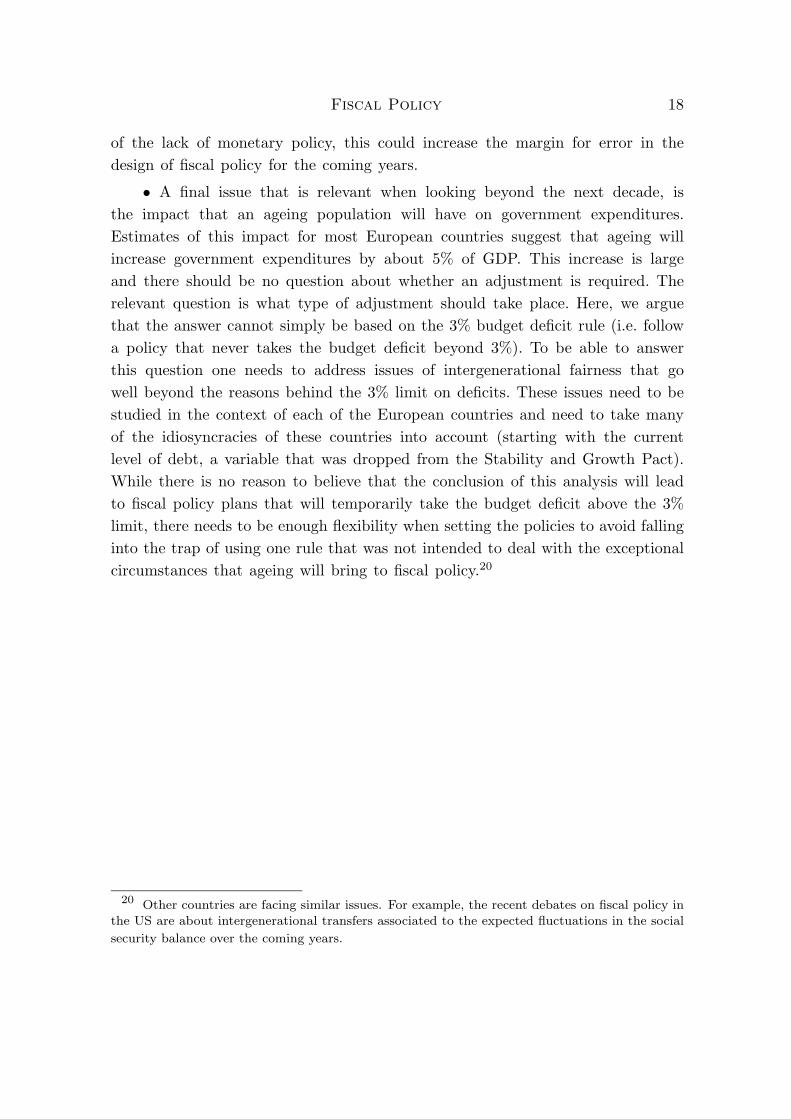
We now do a further test for this hypothesis by going back at the firstmeasure of the fiscal stance, used in Section 2, the cyclically-adjusted budgetbalance. In Figure 7 we correlated changes in the cyclically-adjusted balance andthe growth rate of GDP and we showed that over the last ten years there wasa negative correlation between the two series. Is this correlation also present inthe last two years? Figure 11 plots the change in the cyclically-adjusted budgetbalance and the GDP growth rate in the year 2000 for the Euro11 countries.
[Insert Figure 11 about here]
There is a remarkable positive correlation between the two variables. Withthe exception of Italy, all other countries lie in a perfect straight line. Thiscorrelation is also present in 1999 (although it is weaker), but it is not presentin previous years. As an example, Figure 12 presents a similar plot for the year1995, where no apparent correlation exists.
[Insert Figure 12 about here]
A correlation like the one of Figure 11 implies that those countries withfaster growth rates have had more restrictive fiscal policy. This is, indeed, whatis to be expected if fiscal policy becomes the tool to deal with national businesscycles. It is difficult to extrapolate much from two years of data, but, certainly, inthe cross-section of countries, we find no evidence of countries taking advantageof fast GDP growth rates to move towards looser fiscal policy.
5. Medium-term Targets for the Budget Balance
In the previous sections we have described the behavior of fiscal policy in thelast 10 years with an emphasis on understanding whether EMU has represented a
Fiscal Policy 13
change in this behavior. The last ten years have been dominated by a significanteffort to achieve a level of the budget deficit and the government debt that werewithin the limits set by the Maastricht Treaty. Once that effort has been madeand all countries in the European Union display deficits below the 3% limit, thenew question that arises is what the medium target level for the deficit should be.In the absence of an agreed optimal level of the debt-to-GDP ratio, the decisionon the medium target has been discussed within the context of the Stability andGrowth Pact (SGP). Under the SGP, governments are still committed to keep thebudget deficit below the 3% ceiling. The question on medium-run targets thenbecomes: what level of the budget deficit ensures that countries will never gobeyond the 3% ceiling? There are two issues that are relevant here. First, giventhe cyclical behavior of the budget balance, what level ensures that the deficit isbelow 3%, even under the worst-possible conditions. Second, given the predictionsof large increases in ageing-related government expenditures (pensions, health),should this target be modified to take into account these additional expenses?
To answer the first question, an estimate of the cyclical elasticity of thebudget balance is required. In a recent paper Artis and Buti (2000) review someof the estimates in the literature and provide additional calculations of the cyclicalelastiticies of fiscal variables. The first thing that is obvious from these estimates isthat each country faces a different medium-term target because of the differencesin the elasticity of the budget balance. Countries like Austria or France, becauseof their lower cyclical responsiveness of the budget balance, could ensure that thedeficit never gets above 3% even if their medium-term target is a deficit of 1.3%.On the other hand, Finland needs to maintain, as a medium-run target, a surplusof about 1.3%, given that its business cycle is more volatile and that its budgetsurplus is more procyclical.14 These numbers should be taken with great carebecause of the following three considerations. First, there is no reason to believethat business cycle fluctuations will remain unaffected by EMU. In fact, theliterature on the Endogenous Optimum Currency Areas has argued that businesscycle will change, both in terms of cross-country correlations and volatility ofoutput.15 Second, not only business cycles might change but it can also be thatthe fact that monetary policy is not available anymore as an economic policy tool,causes larger swings in fiscal policy to compensate for national business cycles.We have seen that there is some evidence in this direction from the data on
14 All the above estimates are taken from Table 3 of Artis and Buti (2000).15 See Frankel and Rose (1997), Bayoumi and Eichengreen (1997) and Fatas (1997).
Fiscal Policy 14
cyclically-adjusted balances for the year 2000. Third, the elasticity of the budgetbalance is strongly related to the size of governments.16 If the trend towardsa similar government size continues, we should expect a convergence towards asimilar cyclicality of budget balances.
There is one question that has not been deal with in this debate, the im-plications of these targets on the composition of fiscal policy. Are there anyconsequences on the levels of taxes and government expenditures that can makethe medium-term targets more successful achieving the goal of not having adeficit above 3%? The answer to this question is a complex one and there aremany considerations to be made, from the differences in elasticities of differentcomponents of fiscal policy to the sustainability of different fiscal policy adjust-ments depending on how they are achieved. Without entering into some of thesecomplex debates, one thing that our previous analysis made evident is that coun-tries need to take into account their medium-term targets in terms of taxes andgovernment expenditures to keep them consistent with their targets for budgetbalances. For example, countries with smaller governments have achieved a re-duction of the budget deficit largely through an increase in taxes. These increasescannot continue in the future, which will require more focus on the control ofgovernment expenditures, if there was any trend towards higher deficits. Similarly,for countries with larger governments, there needs to be much more pressure onreducing or, at least, keeping under control government expenditures given that amedium-term goal of reducing taxes needs to be made compatible with the targetof a sustainable budget balance.
Finally, when one looks at the coming decades, the budget implications of thedemographic changes towards an older population need to be taken into consider-ation. As suggested by previous authors, the fact that the demographic transitionmight result in improved budget balances in the short-term but deteriorating bal-ances in the long-term, makes it even more necessary, to foresee its implicationson national budgets and build the necessary room to accommodate these changes.Estimates on the increase in government spending associated to ageing vary dra-matically depending on assumptions on productivity growth, functioning of thelabor market or the fate of ongoing reforms on social security. The forecastedincrease in government expenditures for the next three decades as a result of thisdemographic transition is around 5 percentage points for most of the European
16 van der Noord (2000) presents evidence for OECD economies, Fatas and Mihov (2001a) show
that the result also holds for US states.

Fiscal Policy 15
countries. Given the 3% ceiling on budget deficits, such a large increase in expen-ditures needs to be taken into account when setting medium-term plans for fiscalpolicy.17
How should targets be changed as a result of the predicted increase in gov-ernment expenditures? Should countries stick to the 3% ceiling on budget deficits?While there are benefits to stick to such a rule to ensure that the adjustmentis not simply postponed, from an economic point of view the changes in fiscalpolicy that are required to deal with a demographic transition like this one are farmore cumbersome than what a 3% rule implies. The main issues in this debateare about intergenerational fairness and who is going to pay for the increasedexpenditures in future decades. To answer such a complex question models ofintergenerational transfers that are specific to each country need to be studied.These models need to consider, among many other things, the current level ofgovernment debt, a variable that was present in the Maastricht Treaty but wasremoved from the Stability and Growth Pact. Although it is true that by con-trolling the budget deficit one controls the increase in government debt. It is alsotrue that the optimal response of budget deficits to a demographic transitionthat implies both temporary and permanent changes in government expenditurescannot be the same for a country with practically no government debt and for acountry with a stock of debt around 100% of GDP.18
6. Conclusions and Policy Implications
In the previous sections we have analyzed the behavior of fiscal policy underEMU and during the years that preceded the launch of the single currency, whatimplications can be derived for the future conduct of fiscal policy?
A caveat is needed at this point. The implications that we have collectedbelow need to be taken with great care given that the two last years can onlyprovide us with limited information on the changes in behavior that EMU hastriggered. The design of fiscal policy under EMU is going to be a learning processas countries go through different circumstances introduced by a single monetary
17 Regardless of the ceiling on budget deficits, any sensible plan for fiscal policy over the next
three decades needs to take into account the exceptional circumstance caused by the ageing of the
population of European countries.18 Artis and Buti (2000) also highlight the importance of the current level of government debt
because of the different savings that can be achieved through reductions in interest rate payments.
Fiscal Policy 16
policy and its interactions with 12 national governments that decide on taxes andexpenditures.
• In the last decades, we have seen a significant process of convergence interms of fiscal policy. This convergence goes beyond the well-documented con-vergence in budget deficits, started as a result of the fiscal policy criteria in theMaastricht Treaty. Our analysis of the cyclically-adjusted budget balance as wellas a constructed measures of discretionary fiscal policy also indicates that thereis today much more symmetry in terms of fiscal policy than a decade ago. Thisconvergence has come with a reduction in the use of discretionary policy over thelast 3 decades.
• Although the convergence process has stopped in the last two years, thereis no evidence that this represents a step back in the direction of more divergenceonce countries have been allowed to be part of EMU and are therefore lessthreatened by the possibility of excessive deficits. In other words, there is notmuch evidence of ‘fiscal fatigue’ in the last two years.
• The convergence in budget deficits and the fiscal policy stance has beenaccompanied by a convergence in average tax rates. This convergence has beenprobably faster than the process of real convergence (e.g. convergence in realGDP per capita). These trends can justify the different strategies pursued bydifferent countries in their adjustment towards lower deficits. Countries such asFinland have relied heavily on a reduction in government expenditures becausethey started with a large government size. On the other hand, countries likeGreece, that had the smallest government at the beginning of the decade, hasrelied on large tax increases to reduce its budget deficit.
• The previous trend towards similar government size has also been accom-panied recently by a trend towards smaller governments. The taxes-to-GDP ratioin the EU, while it increased substantially in the period 1990-95, has remainedstable in the last years and is expected to fall in the coming years. This trendposes some challenges to countries that have high tax burdens and have reliedsomehow on tax increases to control the budget deficit. As these countries startdecreasing their tax rates, they will face pressure to reduce their expenditures ifthey do not want their budget deficits to increase. As it is well-known from theliterature on fiscal consolidations, success depends on the ability to control gov-ernment expenditures. If any, this is the only possible sign of fiscal fatigue thatwe see in the data, the fact that some countries have launched ambitious plans to
Fiscal Policy 17
cut taxes and these plans can only be sustainable if government expenditures arekept under control. Although we do not see any alarming signs in the behaviorof budget deficits in 1999 and 2000, this is one of the issues that will need moreattention and monitoring in the coming years.
• In the last two years, has the behavior of fiscal policy been consistent withthe business cycle position of European economies? Overall, we find that fiscalpolicy has been in accordance with the phase of the business cycle and, if any,has been stricter than what it has been in the past, given the current conditions.We reach these conclusion using two different methods. First, in our econometricspecification, we forecast budget balances for 2000 using information on GDPgrowth rates and interest rates for 2000 and, for most countries, the predictionsare very close to the balances observed. Second, we look at the behavior ofcyclically-adjusted budget deficits over the business cycle to see if there is anybias or asymmetries in different phases of the business cycle. In the last decade,there is a negative correlation between these two variables, which suggests thatperiods of high growth tend to be periods where fiscal policy becomes looser.19 Inthe last two years, this bias has been reduced and, more importantly, we observein the year 2000 a very strong and positive correlation between cyclically-adjustedbudget balances and the growth rate of GDP across Euro11 countries. Althoughone cannot read much out of the observations in one year, this evidence couldbe interpreted as a sign that fiscal policy has become the only tool to stabilizenational business cycles and is more related to GDP growth rates than what itused to be in the past.
• We have also discussed briefly the issue on how to set targets for thebudget balance in order to ensure that countries are away from the 3% ceiling onbudget deficits. The existing evidence suggests that, giving the cyclical elasticitiesof budget deficits, a ‘close-to-balance or small surplus’ fits most of the Euro11countries and can accommodate not only the type of downturns that we haveseen in the last decades but also the ‘erratic’ component of the budget. Ouronly qualification regarding these recommendations is the possibility that businesscycles, as well as the cyclicality of the budget, changes with EMU. While thesechanges are not expected to be dramatic, there are reasons to believe that thecyclicality of taxes will be reduced as governments reduce their size. Assumingthat this does not get compensated with more responsive fiscal policy, as a result
19 We are aware of the difficulty in making such a statement given the serious endogeneity
problems when looking at fiscal policy and the business cycle.
Fiscal Policy 18
of the lack of monetary policy, this could increase the margin for error in thedesign of fiscal policy for the coming years.
• A final issue that is relevant when looking beyond the next decade, isthe impact that an ageing population will have on government expenditures.Estimates of this impact for most European countries suggest that ageing willincrease government expenditures by about 5% of GDP. This increase is largeand there should be no question about whether an adjustment is required. Therelevant question is what type of adjustment should take place. Here, we arguethat the answer cannot simply be based on the 3% budget deficit rule (i.e. followa policy that never takes the budget deficit beyond 3%). To be able to answerthis question one needs to address issues of intergenerational fairness that gowell beyond the reasons behind the 3% limit on deficits. These issues need to bestudied in the context of each of the European countries and need to take manyof the idiosyncracies of these countries into account (starting with the currentlevel of debt, a variable that was dropped from the Stability and Growth Pact).While there is no reason to believe that the conclusion of this analysis will leadto fiscal policy plans that will temporarily take the budget deficit above the 3%limit, there needs to be enough flexibility when setting the policies to avoid fallinginto the trap of using one rule that was not intended to deal with the exceptionalcircumstances that ageing will bring to fiscal policy.20
20 Other countries are facing similar issues. For example, the recent debates on fiscal policy in
the US are about intergenerational transfers associated to the expected fluctuations in the social
security balance over the coming years.

Fiscal Policy 19
7.- References
Alesina, Alberto and Roberto Perotti (1995). “Fiscal Adjustment”. EconomicPolicy, 21.
Artis, Michael J. and Marco Buti (2000). “’Close to Balance or in Surplus’: APolicy-maker’s Guide to the Implementation of the Stability and Growth Pact”.CEPR Discussion Paper Series, 2515.
Bayoumi, Tamim and Barry Eichengreen (1997), “Ever Closer to Heaven? AnOptimum-Currency-Area Index for European Countries.” European Economic Re-view.
Blanchard, Olivier (1993). “Suggestions for a New Set of Fiscal Indicators”, inH.A.A. Verbon and F.A.A.M. van Winden (editors), The New Political Economyof Government Debt, Elsevier Science Publishers.
Eichengreen, Barry and Charles Wyplosz (1998). “The Stability Pact: More thana Minor Nuisance?” Economic Policy, 26.
European Commission (2000). “Public Finances in EMU - 200 ” European Econ-omy, 3-2000.
European Commission (2001). ‘Report on the Implementation of the 2000 BroadEconomic Policy Guidelines”, ECFIN/176/01.
Fatas, Antonio (1997). “EMU: Countries or Regions? Lessons from the EMSExperience.” European Economic Review, .
Fatas, Antonio and Ilian Mihov (2001a). “Fiscal Policy and Business Cycles: AnEmpirical Investigation” Moneday y Credito, .
Fatas, Antonio and Ilian Mihov (2001b). “Government Size and Automatic Sta-bilizers” Journal of International Economics, .
Frankel, Jeffrey and Andrew K.Rose (1997) The Endogeneity of the OptimumCurrency Area Criteria. European Economic Review.
Giavazzi, Francesco and Marco Pagano (1990). “Can Severe Fiscal AdjustmentsBe Expansionary?”, NBER Macroeconomics Annual, MIT Press.
van der Nord, Paul (2000). “The Size and Role of Automatic Fiscal Stabilizersin the 1990s and Beyond”. OECD Working Paper,ECO/WKP 2000 (3).

Fiscal Policy 20
8.- Appendix
DATA SOURCES. Cyclically-adjusted figures for taxes, government expendi-tures and budget deficits are from the European Commission (different sources).Data to calculate the indicators of discretionary fiscal policy comes from theOECD economic outlook.

Figure 1. Fiscal Adjustment in the 90's. Euro11
0
1
2
3
4
5
6
7
1990 1991 1992 1993 1994 1995 1996 1997 1998 1999 2000
Cyclically-Adjusted Budget Deficit Budget Deficit
Figure 2. Fiscal Adjustment in the 90's. Cyclically-Adjusted Fiscal Variables. Euro11
42.5
43.5
44.5
45.5
46.5
47.5
48.5
49.5
50.5
51.5
52.5
1990 1991 1992 1993 1994 1995 1996 1997 1998 1999 2000
Taxes Expenditures

Figure 3. Fiscal Adjustment in the 90's. Cyclically-Adjusted Fiscal Variables. Greece
31.533.535.537.539.541.543.545.547.549.551.5
1990 1991 1992 1993 1994 1995 1996 1997 1998 1999 2000
Taxes Expenditures
Figure 4. Fiscal Adjustment in the 90's. Cyclically-Adjusted Fiscal Variables. Finland
46.5
48.5
50.5
52.5
54.5
56.5
58.5
60.5
1990 1991 1992 1993 1994 1995 1996 1997 1998 1999 2000
Taxes Expenditures

Figure 5. Cross-country Standard Deviation of Cyclically-Adjusted Fiscal Variables. Euro11
4
4.5
5
5.5
6
6.5
7
1991 1993 1995 1997 19990
0.5
1
1.5
2
2.5
3
Taxes Expenditures Budget Balance
Figure 6. Fiscal Adjustment and Initial Conditions
FIN
P
A
NL
EL
I
IRL
FE
DB
-3.5
-1.5
0.5
2.5
4.5
6.5
8.5
10.5
30 35 40 45 50 55
Taxes (% of GDP) in 1991
Cha
nge
in T
axes
(% o
f GD
P)19
91-1
999

Figure 7. Fiscal Adjustment and the Business Cycle
-1.5-1
-0.50
0.51
1.52
2.53
3.54
1991 1992 1993 1994 1995 1996 1997 1998 1999 2000
-0.5
0
0.5
1
1.5
2
GDP Growth Change in CAB
Figure 8. Coordination of Fiscal Policy. Standard Deviation of Indicators of Fiscal Policy. Euro10
0.2
0.7
1.2
1.7
2.2
2.7
3.2
3.7
4.2
4.7
1980 1982 1984 1986 1988 1990 1992 1994 1996 1998
Primary Deficit Fiscal Stance

Figure 9. Volatility of Fiscal Policy. Euro10
0.6
0.7
0.8
0.9
1
1.1
1.2
1.3
1.4
1.5
69.75 72.78 75.81 78.84 81.87 84.90 87.93 90.96 93.99
Figure 10. Fiscal Policy Forecast Error. 1999/2000
B
DE
F
IRL
I
NL
A
P
FIN
-1.3
-0.8
-0.3
0.2
0.7
1.2
1.7
-1.3 -0.8 -0.3 0.2 0.7 1.2 1.7
1999
2000
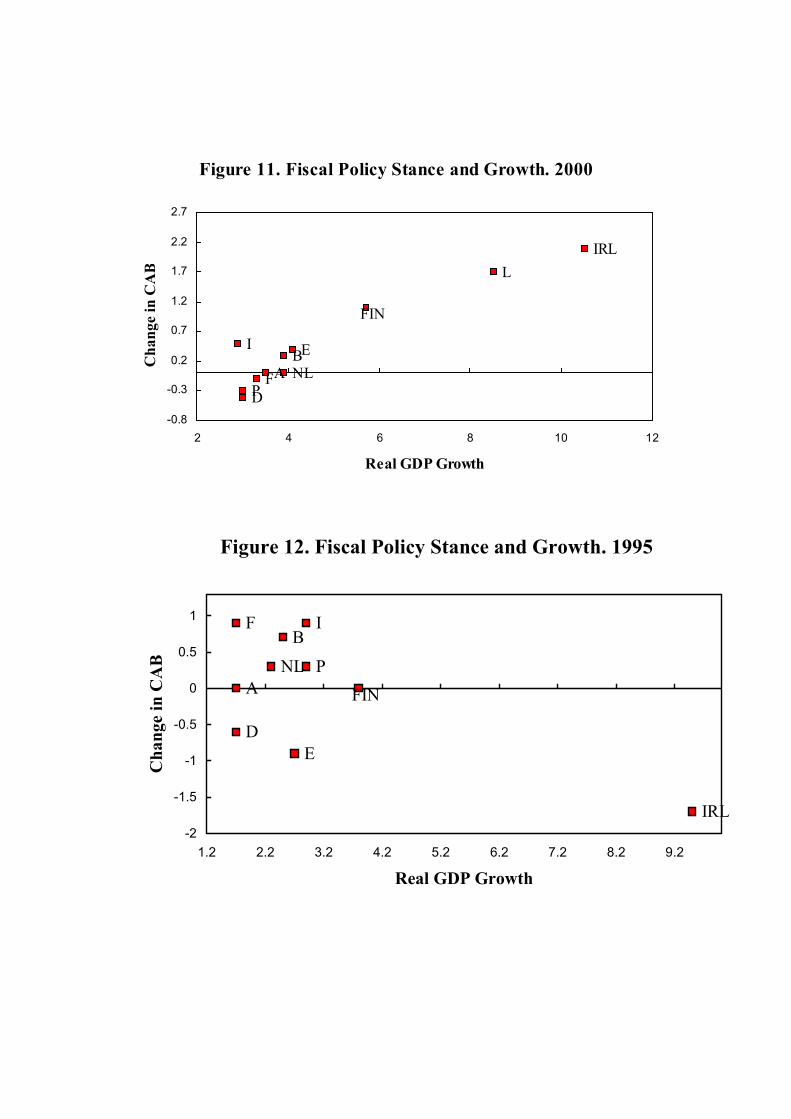
Figure 11. Fiscal Policy Stance and Growth. 2000
B
D
E
F
IRL
I
L
NLAP
FIN
-0.8
-0.3
0.2
0.7
1.2
1.7
2.2
2.7
2 4 6 8 10 12
Real GDP Growth
Cha
nge
in C
AB
Figure 12. Fiscal Policy Stance and Growth. 1995
FINP
ANL
I
IRL
F
ED
B
-2
-1.5
-1
-0.5
0
0.5
1
1.2 2.2 3.2 4.2 5.2 6.2 7.2 8.2 9.2
Real GDP Growth
Cha
nge
in C
AB