Embed Size (px)
DESCRIPTION
Fiscal Policy. What is Fiscal Policy?. Fiscal Policy is the decision of the government about: How to earn revenue and gather resources from various sources For what to spend those earnings and resources How much to spend and When to spend. There are two sides of fiscal policy. - PowerPoint PPT Presentation
Citation preview

What is Fiscal Policy? Fiscal Policy is the decision
of the government about:How to earn revenue and gather
resources from various sources For what to spend those earnings and
resourcesHow much to spend and When to spend
2

There are two sides of fiscal policy
3

4

Why does the government need revenue?
To maintain its daily activities, i.e. to run the government
To ensure protection for the helpless To provide necessary services to
people that otherwise nobody would provide (Market failure)
To ensure development of the country To build buffer against risk!
5

Where does the revenue come from?Tax revenue
Direct: income tax, wealth tax etc.Indirect: VAT, tariff, excise duty
etc.Non-Tax revenue
Fees & charges: registration, sales of forms, stamps etc.
Fines: mobile court fines, police fines etc.
Printing of money
6

Where does the government keep its revenue?
The government’s account is maintained by the Treasury which is located at Bangladesh Bank
The “account” in which all these revenues are deposited is called the “Consolidated Fund”
Consolidated Fund was created under Article 84 of our constitution
7
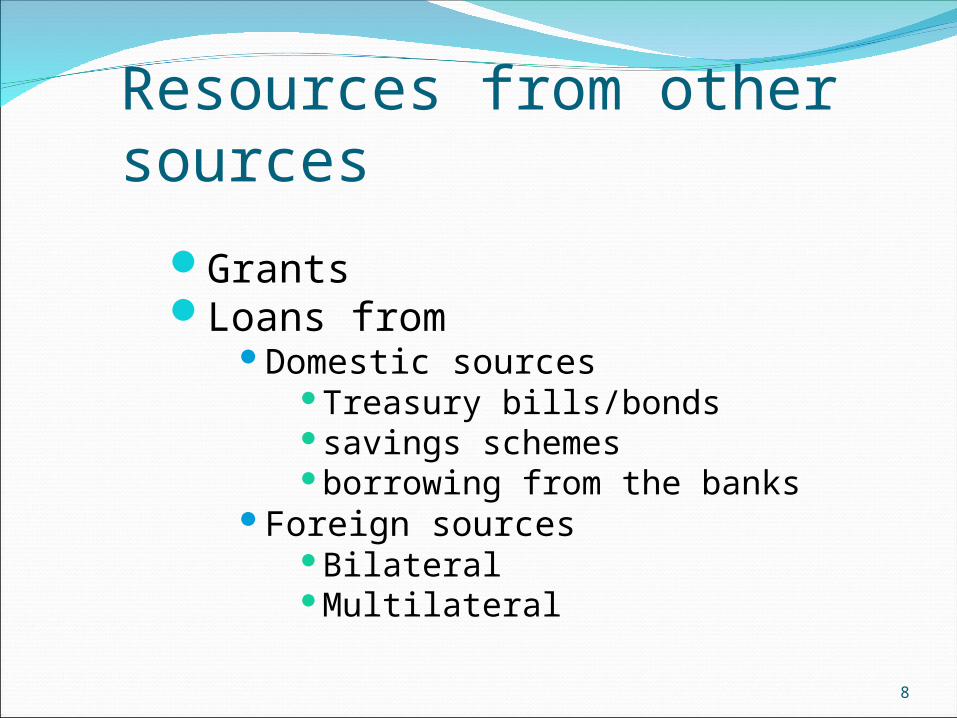
Resources from other sources
GrantsLoans from
Domestic sourcesTreasury bills/bonds savings schemesborrowing from the banks
Foreign sourcesBilateral Multilateral
8

Revenue trend in BangladeshRevenue as percent of GDP is
increasing Around 80 percent of public
revenue in Bangladesh is derived from tax sources.
9
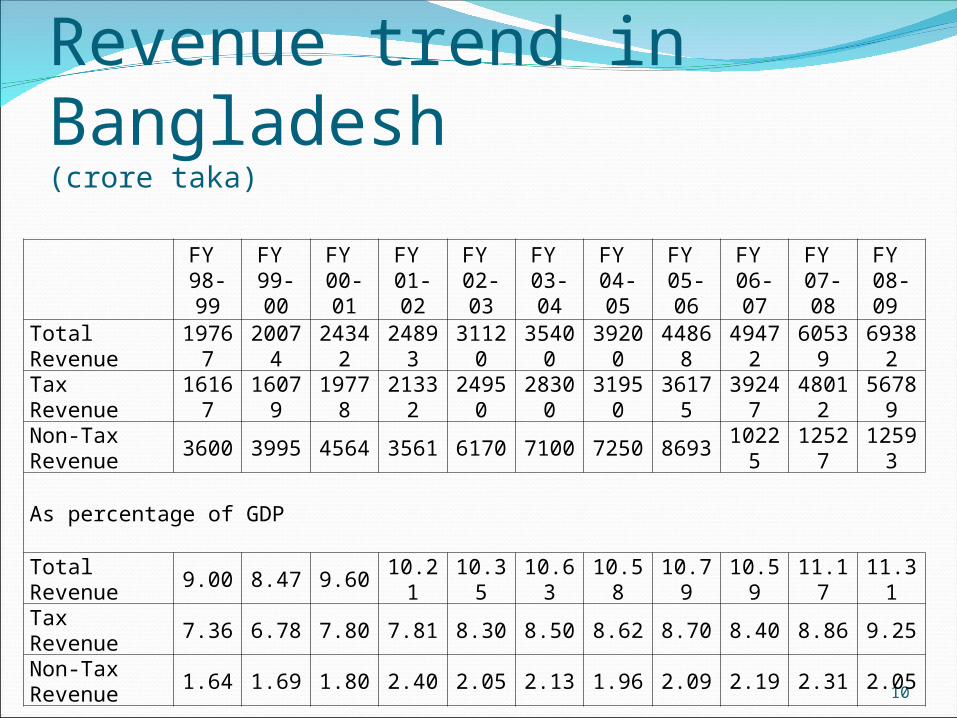
Revenue trend in Bangladesh(crore taka)
10
FY 98-99
FY 99-00
FY 00-01
FY 01-02
FY 02-03
FY 03-04
FY 04-05
FY 05-06
FY 06-07
FY 07-08
FY 08-09
Total Revenue 19767 20074 24342 24893 31120 35400 39200 44868 49472 60539 69382
Tax Revenue 16167 16079 19778 21332 24950 28300 31950 36175 39247 48012 56789
Non-Tax Revenue 3600 3995 4564 3561 6170 7100 7250 8693 10225 12527 12593
As percentage of GDP
Total Revenue 9.00 8.47 9.60 10.21 10.35 10.63 10.58 10.79 10.59 11.17 11.31
Tax Revenue 7.36 6.78 7.80 7.81 8.30 8.50 8.62 8.70 8.40 8.86 9.25
Non-Tax Revenue 1.64 1.69 1.80 2.40 2.05 2.13 1.96 2.09 2.19 2.31 2.05

11

How does spending help? Theoretical framework
How much spending will affect depends on two factors-The multiplier effect andThe crowding-out effect
The multiplier effect denotes that a certain amount of spending will have bigger impact than the size of the spending.
The crowding-out effect arises out of a mechanism that offsets the increase in AD.
12

The multiplier effectThe MPC helps the money spent rolling from hand to hand
in an infinite chain of successive rounds of spending. Suppose, the MPC in Bangladesh is 0.75 and govt.
increases spending by Tk. 20 billion for social safety net. The rounds of spending are as below:
Govt. spending = Tk. 20 billionFirst change in consumption (C) = (MPC X Tk. 20 billion)Second change in C = (MPC X MPC X Tk. 20 billion)Third change in C= (MPC X MPC X MPC X Tk. 20 billion)… … … … … Total change in C = (1 + MPC + MPC2 + MPC3 + …….) X Tk. 20
billion= Tk. 20 billion /(1 – MPC) = Tk. 80 billion.
13

The Crowding-out effect
14
MD1
MD2
AD1AD3
AD2
r1
r2
r
MY
P
1. An increase in G increases AD
2. This increases money demand
3. As a result r increases
4. And AD falls back
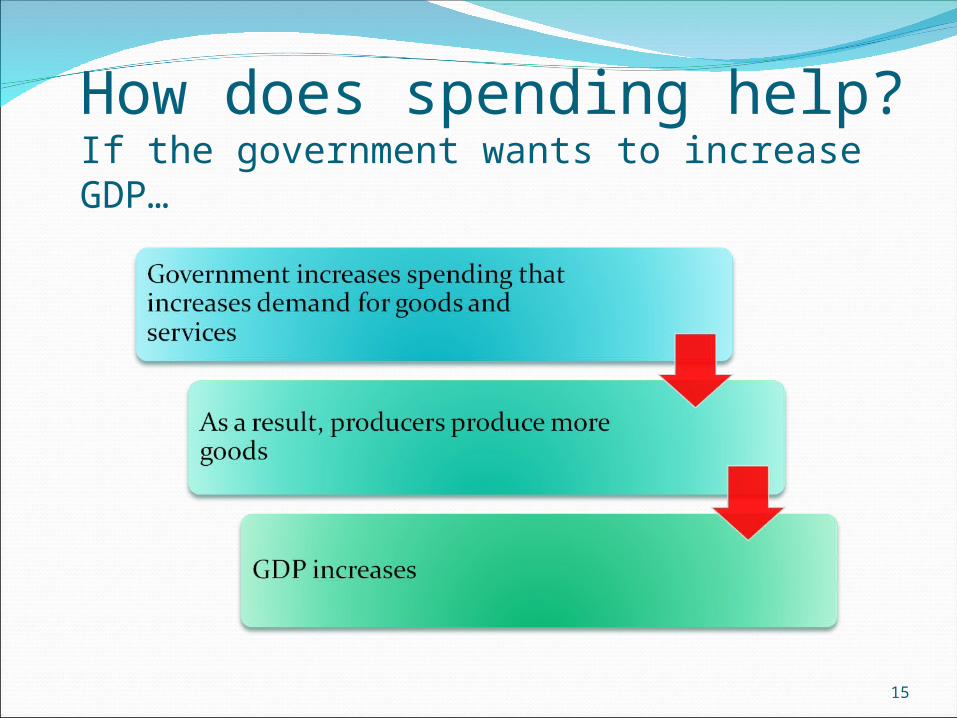
How does spending help?If the government wants to increase GDP…
15

How does spending help?If the government wants to check inflation…
16
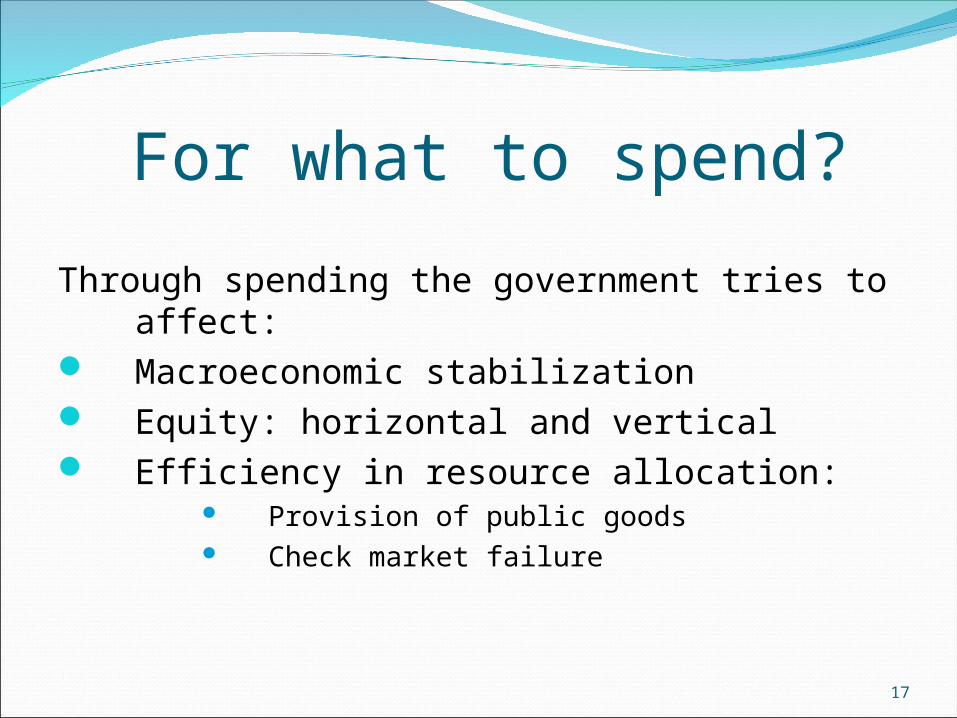
For what to spend?
Through spending the government tries to affect:
Macroeconomic stabilization Equity: horizontal and vertical Efficiency in resource allocation:
Provision of public goods Check market failure
17

Macroeconomic Stabilization
To stabilize priceTo raise growth rateTo raise employment levelTo reduce deficit
18

How government spending helps keep macroeconomic stabilization?
19

How government spending helps keep macroeconomic stabilization?
20
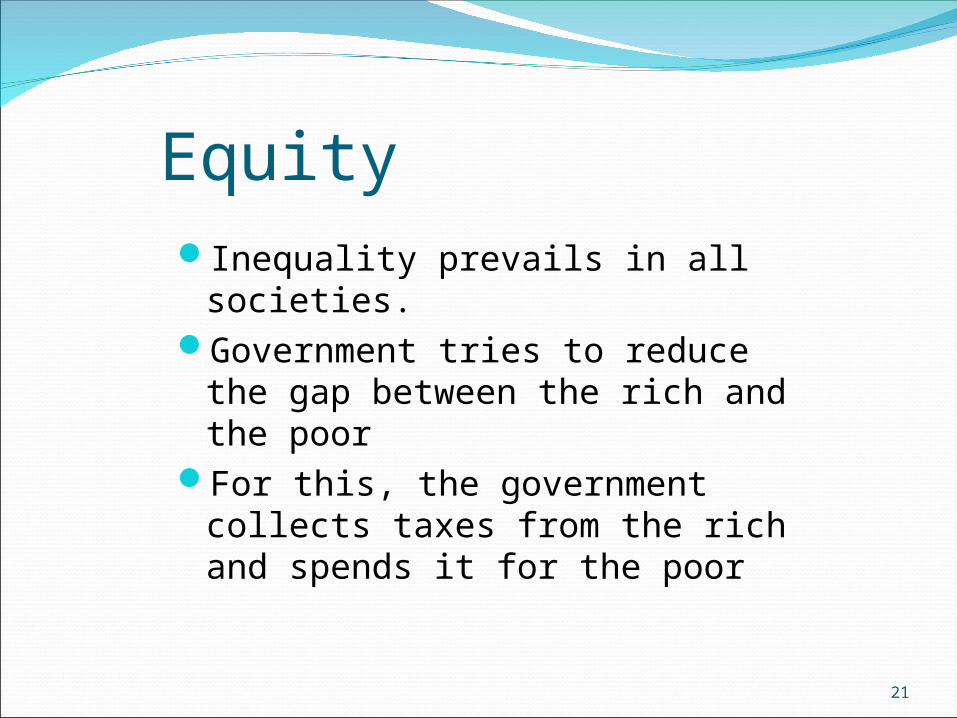
EquityInequality prevails in all societies.Government tries to reduce the
gap between the rich and the poorFor this, the government collects
taxes from the rich and spends it for the poor
21
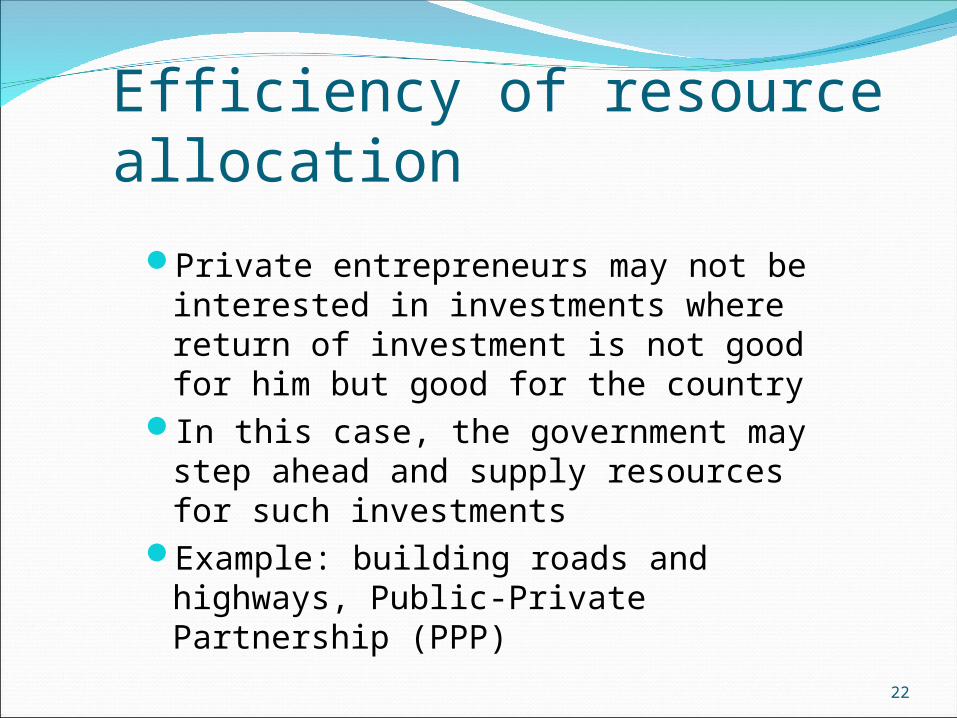
Efficiency of resource allocation
Private entrepreneurs may not be interested in investments where return of investment is not good for him but good for the country
In this case, the government may step ahead and supply resources for such investments
Example: building roads and highways, Public-Private Partnership (PPP)
22
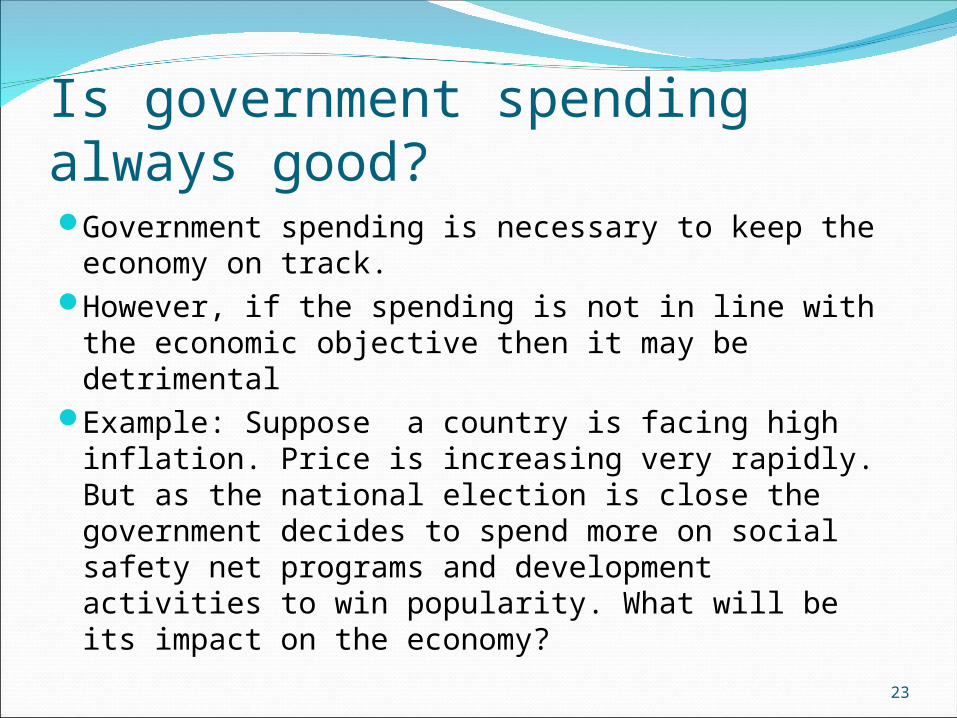
Is government spending always good?Government spending is necessary to keep the
economy on track.However, if the spending is not in line with the
economic objective then it may be detrimentalExample: Suppose a country is facing high
inflation. Price is increasing very rapidly. But as the national election is close the government decides to spend more on social safety net programs and development activities to win popularity. What will be its impact on the economy?
23
Public Expenditure: TypesGovernment spending may be broadly
classified into two categories-Revenue expenditureDevelopment expenditure
Revenue expenditure mainly includes government employees salary, benefits and establishment costs.
Development expenditure mainly includes money spent on development activities.
Is revenue expenditure good or bad?
24
In which way public expenditure of Bangladesh moving?
The government spends huge amounts of money on
building socio-economic and physical infrastructure
human resource development and poverty alleviation.
Besides, the government has to incur expenditure for:
Administrative welfare and other service oriented activities.
25

Recent trend of public expenditure in Bangladesh
26
FY 98-99
FY 99-00
FY 00-01
FY 01-02
FY 02-03
FY 03-04
FY 04-05
FY 05-06
FY 06-07
FY 07-08
FY 08-09 (up to
February)
Public Exp (a+b) 29779 34464 37399 40757 42075 47184 53903 59030 66836 93608 99962
a) Rev Exp 17454 19243 21498 25707 26804 30367 35132 39557 48920 71108 74362
b) Dev Exp 12325 15221 15901 15050 15271 16817 18771 19473 17916 22500 25600
Percentage of GDP
Public Exp (a+b) 13.55 14.54 14.75 14.92 14 14.17 14.54 14.2 14.3 17.27 16.29
a) Rev Exp 7.94 8.12 8.48 9.41 8.92 9.12 9.48 9.52 10.47 13.12 12.12
b) Dev Exp 5.61 6.42 6.27 5.51 5.08 5.05 5.06 4.68 3.83 4.15 4.17

Recent trend of public expenditure% of GDP
27

Economic structure of revenue expenditure% share of major economic categories
28
Particulars FY 03-04 FY 04-05 FY 05-06 FY 06-07 FY 07-08 FY 08-09 (up to February)
Pay and allowances 27.87 26.29 27.64 29.39 26.88 26.68 Pay of officers 2.69 2.58 2.87 2.62 2.38 2.32 Pay of staff 11.33 10.91 13.52 12.57 11.48 10.41 Allowances 13.85 12.80 11.25 14.20 13.02 13.94Goods and services 17.19 17.39 16.93 14.35 14.84 9.69 Supply and services 11.66 10.64 10.46 9.84 9.71 7.92 Repair and maintenance 5.53 6.75 6.47 4.51 5.13 1.77Payment of interest 20.58 19.51 20.61 20.89 21.46 27.63 Domestic 17.05 15.91 17.06 17.92 18.83 24.89 Foreign 3.53 3.60 3.55 2.97 2.63 2.74Subsidies and current transfers 28.83 31.32 30.24 32.59 33.17 34.26 Subsidies 4.75 6.47 4.72 7.24 8.35 8.99 Grants-in-aid 17.25 18.45 19.40 18.59 18.59 18.51 Subscription to the international organizations
0.08 0.08 0.08 0.08 0.08 0.03
Write-off of loan advances 0.00 0.00 0.00 0.00 0.01 0.001 Pension and gratuity 6.75 6.32 6.04 6.68 6.14 6.72Block 1.55 1.90 1.70 1.39 2.83 0.54 Unexpected 0.70 0.51 0.14 0.57 1.59 0.03 Other 0.85 1.39 1.56 0.82 1.24 0.51Procurement of assets & public works 5.58 5.20 4.95 3.82 3.73 1.2
Procurement of assets 4.36 4.03 3.93 3.15 3.18 0.66 Purchase of land 0.03 0.14 0.07 0.12 0.08 0.25 Construction and works 1.19 1.03 0.95 0.55 0.47 0.25Gross total 101.60 101.61 102.07 102.43 102.91 100.00Deduction recovery 1.60 1.61 2.07 2.43 2.91 0.001
Total- Non-development revenue expenditure
100.00 100.00 100.00 100.00 100.00 100.00

Is the government fulfilling its welfare commitment?
Public Expenditure By Social Sectors:
The Social Sectors are getting increasing prominence day by
day
29

Annual Development Program expenditure for social sectors (crore taka)
30
Sector FY 98-99
FY 99-00
FY 00-01
FY 01-02
FY 02-03
FY 03-04
FY 04-05
FY 05-06
FY 06-07
FY 07-08
FY 08-09
Education & Religion 1776 2014 2274 2171 2591 2342 2110 2865 2930 3030 3519Sports and Culture 52 85 113 79 91 117 110 167 96 97 132Health & Family Welfare
1256 1469 1616 1443 1542 1948 1468 2151 2403 2442 2585
Labor & Manpower 9 14 18 18 27 42 72 88 70 105 113Social Welfare, Women & Youth Dev
169 180 189 173 220 183 186 196 160 140 334
Sub-total (1+2+3+4+5) 3262 3762 4210 3884 4471 4632 3946 5467 5659 5814 6683
As % of Total ADP Exp (6/8*100)
23.30 22.80 23.13 24.28 26.15 24.38 19.25 25.43 26.20 25.84 26.11
Total ADP Allocation 14000 16500 18200 16000 17100 19000 20500 21500 21600 22500 25600

Revenue expenditure for social sector(crore taka)
31
Sector FY 98-99 FY 99-00
FY 00-01
FY 01-02
FY 02-03
FY 03-04
FY 04-05
FY 05-06
FY 06-07
FY 07-08
FY 08-09
Education & Religion 2988 3279 3700 3842 4086 4628 5245 6508 8085 8717 9664Health & Family Planning
887 972 1099 1286 1334 1497 1803 2065 2682 2898 3441
Youth, Sports & Cultural Affairs
55 73 67 71 84 140 140 184 205 185 195
Labor & Manpower 28 31 35 36 42 41 45 46 58 70 70Social Welfare & Women Affairs
141 177 203 229 283 455 895 1067 1250 1778 2134
Sub-total (9+10+11+12+13)
4099 4532 5104 5464 5829 6761 8128 9870 12280 13648 15504
As % of Total Rev Exp (14/19*100)
24.45 24.57 24.70 24.08 23.03 23.81 23.45 25.93 27.04 23.56 24.31
Total (ADP+Rev) (6+14) 7361 8294 9314 9348 10300 11393 12074 15337 17939 19462 22187As % of total Pub Exp (16/(8+19)*100)
23.93 23.74 23.97 24.16 24.29 24.04 21.89 25.75 26.77 24.20 24.83
As % of GDP (16/20*100)
3.35 3.50 3.67 3.42 3.43 3.42 3.26 3.69 3.80 3.59 3.62
Total Revenue Allocation 16765 18444 20662 22692 25307 28390 34664 38070 45412 57922 63764
GDP at Market Prices 219697 237086 253546 273201 300580 332973 370707 415728 472477 541919 613640

What is the balance in the government’s pocket?
If revenue earning is higher than expenditure, the government has surplus
If revenue earning is lower than expenditure, the government faces deficit
In Bangladesh the government maintains a deficit budget
32
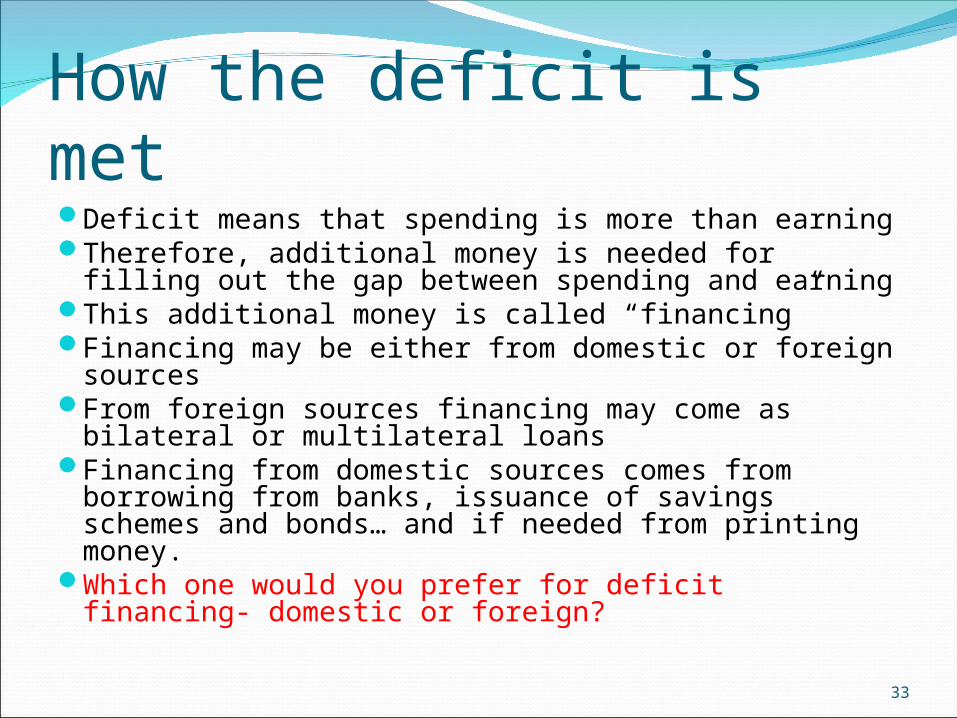
How the deficit is metDeficit means that spending is more than earningTherefore, additional money is needed for filling
out the gap between spending and earningThis additional money is called “financing”Financing may be either from domestic or foreign
sourcesFrom foreign sources financing may come as
bilateral or multilateral loansFinancing from domestic sources comes from
borrowing from banks, issuance of savings schemes and bonds… and if needed from printing money.
Which one would you prefer for deficit financing- domestic or foreign?
33
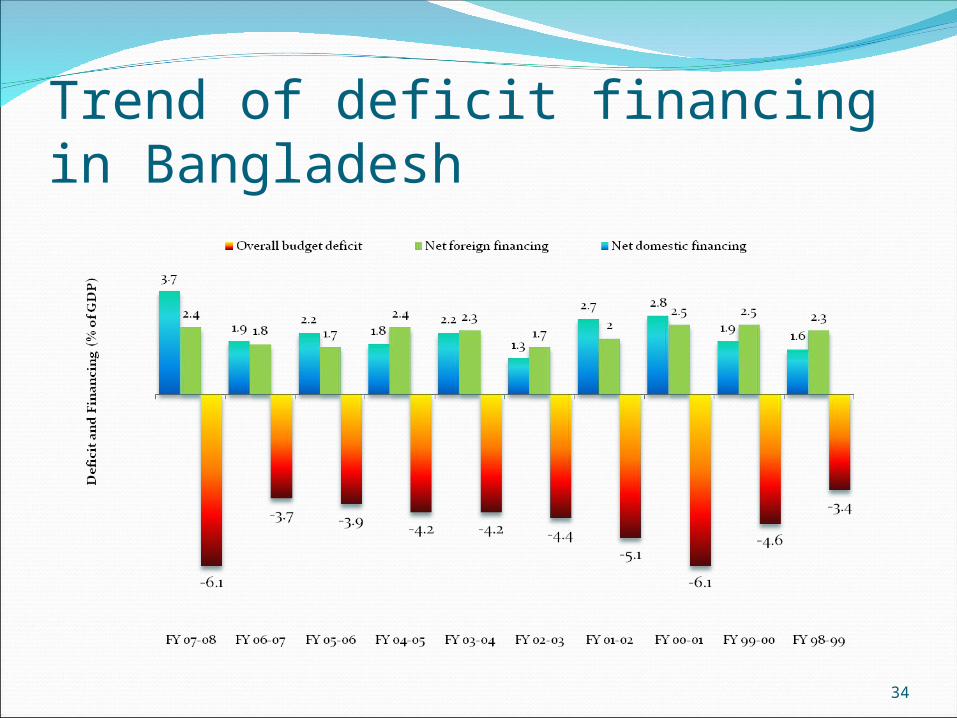
Trend of deficit financing in Bangladesh
34

Implications of budget deficitHigh budget deficit means government is spending
more than its abilityAnd in doing so it is borrowing from various sourcesIf the borrowing comes from domestic sources it
means less money is available for the private sector. This may hinder private sector development initiatives.
If the borrowing comes from foreign sources it means the country is exposed to foreign currency risk (for example- speculative attack, current account deficit)
Increased amount of borrowing increases interest rate and, therefore, debt liabilities. High interest rate may make debt unsustainable. In such cases, the country will be exposed to financial crisis. Recent example is Greece.
35
Question:
What is the most prominent document that elaborates the Fiscal Policy of Bangladesh?
As head of the government how would you design your next fiscal policy?
36

37