Embed Size (px)
Citation preview
FISCAL PLAN FOR PUERTO RICO
San Juan, Puerto Rico
March 13, 2017

The Puerto Rico Fiscal Agency and Financial Advisory Authority (“AAFAF”), the Government of Puerto Rico (the “Government”), and each oftheir respective officers, directors, employees, agents, attorneys, advisors, members, partners or affiliates (collectively, with AAFAF and theGovernment instrumentalities the “Parties”) make no representation or warranty, express or implied, to any third party with respect to theinformation contained herein and all Parties expressly disclaim any such representations or warranties. The Government has had to rely uponpreliminary information and unaudited financials for 2015 and 2016, in addition to the inherent complexities that are part of a government intransition, especially after a prolonged period of public finance obscurity. As such, AAFAF and the Government have made certainassumptions that may materially change once more clarity and transparency takes hold, especially after the Government issues the past dueaudited financials for 2015 and 2016 later this year.
The Parties do not owe or accept any duty or responsibility to any reader or recipient of this presentation, whether in contract or tort, andshall not be liable for or in respect of any loss, damage (including without limitation consequential damages or lost profits) or expense ofwhatsoever nature of such third party that may be caused by, or alleged to be caused by, the use of this presentation or that is otherwiseconsequent upon the gaining of access to this document by such third party.
This document does not constitute an audit conducted in accordance with generally accepted auditing standards, an examination of internalcontrols or other attestation or review services in accordance with standards established by the American Institute of Certified PublicAccountants or any other organization. Accordingly, the Parties do not express an opinion or any other form of assurance on the financialstatements or any financial or other information or the internal controls of the Government and the information contained herein.
Any statements and assumptions contained in this document, whether forward-looking or historical, are not guarantees of futureperformance and involve certain risks, uncertainties, estimates and other assumptions made in this document. The economic and financialcondition of the Government and its instrumentalities is affected by various financial, social, economic, environmental and political factors.These factors can be very complex, may vary from one fiscal year to the next and are frequently the result of actions taken or not taken, notonly by the Government and its agencies and instrumentalities, but also by entities such as the government of the United States. Because ofthe uncertainty and unpredictability of these factors, their impact cannot be included in the assumptions contained in this document. Futureevents and actual results may differ materially from any estimates, projections, or statements contained herein. Nothing in this documentshould be considered as an express or implied commitment to do or take, or to refrain from taking, any action by AAFAF, the Government, orany government instrumentality in the Government or an admission of any fact or future event. Nothing in this document shall be considereda solicitation, recommendation or advice to any person to participate, pursue or support a particular course of action or transaction, topurchase or sell any security, or to make any investment decision.
By receiving this document, the recipient shall be deemed to have acknowledged and agreed to the terms of these limitations.This document may contain capitalized terms that are not defined herein, or may contain terms that are discussed in other documents or thatare commonly understood. You should make no assumptions about the meaning of capitalized terms that are not defined, and you shouldconsult with advisors of AAFAF should clarification be required.
Disclaimer
2

I. Introduction
II. Financial Projections
III. Fiscal Reform Measures
IV. Structural Reforms
V. Debt Sustainability Analysis
VI. TSA Liquidity
VII. Financial Control Reform
Table of Contents
3

I. INTRODUCTION
4

INTRODUCTION
What the Government’s Proposed Fiscal Plan Seeks to Achieve
Closing the Projected Baseline Fiscal Plan Deficit
• At the direction of the Oversight Board, the Government’s new administration has prepared this Fiscal Plan which supersedes the prior administration’s December 2016 fiscal plan that was rejected by the Board. From the date the new administration took office, AAFAF and its advisors have earnestly worked in cooperation with the Board’s input to put forth a credible and reliable Fiscal Plan that will guide Puerto Rico’s fiscal and economic recovery
• The Fiscal Plan commits to fiscal responsibility and implements specific revenue enhancements and targeted expenditure reductions to return Puerto Rico to fiscal stability and economic growth. In particular, the Fiscal Plan averts the $67bn fiscal deficit from the prior administration’s plan and achieves +$7.9bn in cumulative cash flow available for debt service through the 10 year period
Further Improvement
• The Government fully appreciates that despite fiscal and economic uncertainties, now is the time to set the benchmark for the needed fiscal and economic measures as outlined in the Fiscal Plan. The Government is demonstrating its commitment to correcting the mistakes of the past. The Government is also mindful that in stopping the cycle of deficit spending, it must do so without undermining economic recovery or endangering the health, welfare or safety of the 3.5 million US citizens living in Puerto Rico
Bondholder Negotiations and Consensus
• Per PROMESA Section 2.01(b)(1)(I), the fiscal plan must provide a debt sustainability analysis. The Government’s Fiscal Plan consolidates available cash resources that can be made available for debt service payments. The Fiscal Plan as proposed does not presume cash flow for debt service for any particular bondholder constituency, including clawed back cash and special revenues, nor does it take a position with respect to asserted constitutional or contractual rights and remedies, validity of any bond structure, or the dedication or application of tax streams / available resources
• The Government believes that any fiscal plan should reflect commitment to develop and implement operational and structural improvements that demonstrate the Government’s willingness to achieve maximum payment of its debt obligations as restructured. However, in achieving debt sustainability, Puerto Rico’s bondholders will be called upon to share in the sacrifice needed for a feasible debt restructuring. The Government believes communication, grounded in fiscal responsibility, can create the opportunity for maximum consensus among stakeholders and pave the way for Puerto Rico’s long-term fiscal stability and economic growth
5

INTRODUCTION
What the Fiscal Plan does not determine
Major Entities Impacted by the Fiscal Plan
• The Fiscal Plan is for the Government as a covered entity under PROMESA. The Government's various taxes, fees and other revenues are used to fund, subsidize or guarantee payments of the debt of many covered entities by various means. Accordingly, this Fiscal Plan does provide for payment of expenses and capital investments in, among other covered entities: (1) Public Building Authority, (2) PR Sales Tax Financing Corporation (“COFINA”), (3) PR Highways and Transportation Authority (“HTA”), (4) PR Convention Center District Authority (“PRCCDA”), (5) PR Infrastructure Finance Authority (“PRIFA”), (6) Employees' Retirement System (“ERS”), (7) University of Puerto Rico (“UPR”), (8) Puerto Rico Industrial Development Company (“PRIDCO”), and (9) Government Development Bank (“GDB”)
Major Entities Not Covered by the Fiscal Plan
• There are four entities whose revenues and expenses are not included in this Fiscal Plan: (1) Puerto Rico Electric Power Authority (“PREPA”), (2) Puerto Rico Aqueduct and Sewer Authority (“PRASA”), (3) The Children's Trust Fund and (4) Puerto Rico Housing Finance Authority (“PRHFA”). As a result, this Fiscal Plan does not take a position with respect to these entities’ financial prospects or the debt sustainability of such entities
Legal & contractual issues not determined by the Fiscal Plan
The Fiscal Plan does not attempt to resolve, among others, the following issues:
• The mechanisms by which projected cash flow available for debt service should be allocated to different debt instruments
• What is an essential service for purposes of the exercise of the Government's police power
• The scope, timing or specific use of revenues to be frozen or redirected as 'claw back' revenue
• The value, validity and /or perfection of pledges
• Whether any particular bond or debt issuance may have been improvidently issued
• What the Government is permitted to accomplish through the increase or decrease of dedicated taxes, fees, tolls or other revenue sources
6

II. FINANCIAL PROJECTIONS
7

7,873
-31,708
-66,865
+39,580
Cash FlowsPost Measures
Excluding Debt Service
25,683
DebtService
RevenueMeasures
ExpenseMeasures
13,897
35,158
Cash Flow pre-MeasuresBase FinancialCash Flows
The Government will undertake fiscal measures that will reduce the fiscal gap by $39.6B, and create a 10 year cash flow surplus of $7.9B
FINANCIAL PROJECTIONS
1 See Section III, Fiscal Reform Measures for full detail2 See Section II (B)
Accumulated ACA fundingloss of $16.1B
($MM)
Based on the currently stated debt obligations, the 10-year budget gap is expected to reach $66.9B
– ~$35.1B of expected principal and interest payments during the forecast period
The Fiscal Plan estimates cash flows available for debt service. The chart below shows the key components of the forecast,
including:
– Base fiscal gap of $66.9B which includes full cost of debt service and does not include the impact of revenue and expense
measures
– Revenue and expense measures of $13.90B and $25.7B1
Revenue Measures: stabilizing corporate tax revenue through tax reform positively affects cash flows by $7.9B
Expense Measures: $19.2B of $25.1 (76%) due to Government right-sizing initiatives2
8

The current fiscal plan is a significant departure from the version presented in October, as it commits to higher revenue and expense measures of $4.4B and $16.4B, respectively
The October proposed Fiscal Plan estimated negative cumulative cash flows pre-debt service over the projection period (’17-’26)
of ($4.9B) vs. the Current Fiscal Plan projections estimating positive cumulative cash flows pre-debt service of $7.92B. The
change is comprised primarily of:
– Negative net impact on cash flows available for debt service, pre-Measures of -$8.0B
• Decrease in total revenues of $1.7B
• Decreased expenses of $6.3B
– Enhanced revenue measures of $4.4B
– Additional savings from Expense Measures of $16.4B
FINANCIAL PROJECTIONS
($MM)
7,873
-4,947
RevenueMeasures
4,352
Changes to Expenses Baseline
6,301
Changes to Revenue Baseline
October Fiscal Plancum. Cash Flowspre Debt Service
Cash FlowsPost Measures
Excluding Debt Service
ExpenseMeasures
16,427
1,658
9

Fiscal year ending June 30 ($ in millions) 2017 2018 2019 2020 2021 2022 2023 2024 2025 2026 '17 - '26 total
PR Nominal GNP Growth (2.2%) (2.8%) (2.4%) (0.5%) (0.4%) 0.3% 1.0% 1.6% 2.1% 2.6%
Revenues before Measures $18,952 $17,511 $16,407 $16,434 $16,494 $16,590 $16,746 $16,953 $17,204 $17,509 $170,799
Noninterest Exp. before Measures ($17,872) ($18,981) ($19,233) ($19,512) ($19,950) ($20,477) ($20,884) ($21,310) ($21,973) ($22,316) ($202,507)
Cash flows pre-Measures $1,080 ($1,470) ($2,826) ($3,077) ($3,456) ($3,886) ($4,139) ($4,357) ($4,769) ($4,807) ($31,708)
Measures
Revenue measures -- 924 1,381 1,384 1,531 1,633 1,740 1,752 1,766 1,785 13,897
Expense measures -- 951 2,012 2,415 2,983 3,156 3,255 3,357 3,724 3,830 25,683
Net impact of measures -- 1,875 3,393 3,799 4,515 4,789 4,995 5,108 5,491 5,615 39,580
Cash flows post-Measures, before Debt Service $1,080 $404 $567 $722 $1,059 $903 $857 $751 $722 $808 $7,873
($MM)
A summary of financials for the 10-year projection period shows positive cash flows post-measures, before debt service of $7.9B
Cash flows post-measures, before debt service trends:
FY 2017 estimate of $0.8B, declining to a low of $0.4B in FY 2018, driven by GNP contraction and ERS Paygo contributions of
$1.0B in FY 2018
Forecast peaks at $1.1B in FY 2021 before declining to $0.8B by FY 2026. Decline is primarily driven by Affordable Care Act
(“ACA”) funding expiration that increase steadily from ~$0.9B in FY 2018 to ~$2.4B in FY 2026
Expense measures include $1.3B in supplier payment pay downs through the projection period
FINANCIAL PROJECTIONS
2 This addback is illustrative, and is not reflected in the amounts available for debt service elswhere in this Plan
1 Full details in Appendix
1
1
10

($MM)
Revenues before measures
FINANCIAL PROJECTIONS
Fiscal year ending June 30 ($ in millions) 2017 2018 2019 2020 2021 2022 2023 2024 2025 2026 '17 - '26 total
PR Nominal GNP Growth (2.2%) (2.8%) (2.4%) (0.5%) (0.4%) 0.3% 1.0% 1.6% 2.1% 2.6%
Revenues
General Fund Revenues:
Individual Income Taxes $1,811.0 $1,760 $1,718 $1,709 $1,703 $1,708 $1,725 $1,752 $1,789 $1,836 $17,511
Corporate Income Taxes $1,515.0 1,473 1,437 1,430 1,424 1,429 1,443 1,466 1,497 1,536 14,649
Non-Resident Withholdings $685.0 666 650 647 644 646 652 663 677 694 6,624
Alcoholic Beverages $268.0 260 254 253 252 253 255 259 265 272 2,591
Cigarettes $112.0 109 106 106 105 106 107 108 111 114 1,083
Motor Vehicles $330.0 321 313 311 310 311 314 319 326 335 3,191
Excises on Off-Shore Shipment Rum $172.0 173 175 176 178 179 180 182 183 184 1,782
Other General Fund Revenue 506.0 386 377 375 373 374 378 384 392 402 3,948
Total 5,399 5,148 5,030 5,007 4,989 5,005 5,055 5,134 5,239 5,372 51,379
General Fund Portion of SUT (10.5%) 1,718 1,655 1,596 1,553 1,511 1,484 1,472 1,474 1,487 1,512 15,463
Net Act 154 2,075 1,556 1,038 1,038 1,038 1,038 1,038 1,038 1,038 1,038 11,931
General Fund Revenue $9,192 $8,360 $7,664 $7,598 $7,538 $7,527 $7,565 $7,646 $7,764 $7,921 $78,773
Additional SUT (COFINA, FAM & Cine) 850 877 906 936 968 1,003 1,039 1,078 1,118 1,161 9,936
Other Tax Revenues 1,337 1,396 1,401 1,411 1,423 1,429 1,436 1,445 1,455 1,466.6 14,199
Other Non-Tax Revenues 579 576 582 594 622 630 635 642 649 665.8 6,174
Adj. Revenue before Measures $11,958 $11,208 $10,552 $10,539 $10,550 $10,588 $10,675 $10,810 $10,986 $11,215 $109,082
Federal Transfers 6,994 7,168 7,372 7,477 7,623 7,835 8,023 8,212 8,469 8,675 77,847
Loss of Affordable Care Act ("ACA") Funding -- (865) (1,516) (1,582) (1,680) (1,833) (1,953) (2,069) (2,251) (2,382) (16,130)
Revenues before Measures $18,952 $17,511 $16,407 $16,434 $16,494 $16,590 $16,746 $16,953 $17,204 $17,509 $170,799
11

($MM)
Non-interest expenses before measures
FINANCIAL PROJECTIONS
Fiscal year ending June 30 ($ in millions) 2017 2018 2019 2020 2021 2022 2023 2024 2025 2026 '17 - '26 total
Expenses
General Fund Expenditures:
Direct Payroll ($3,271) ($3,309) ($3,342) ($3,375) ($3,413) ($3,458) ($3,509) ($3,563) ($3,619) ($3,675) ($34,532)
Direct Operational Expenses (907) (918) (926) (936) (946) (959) (973) (988) (1,003) (1,019) (9,574)
Utilities (260) (332) (352) (360) (373) (372) (369) (374) (387) (395.5) (3,575)
Special Appropriations (3,890) (4,037) (4,068) (4,068) (4,209) (4,140) (4,143) (4,136) (4,250) (4,147) (41,087)
General Fund Expenses (8,329) (8,596) (8,688) (8,738) (8,941) (8,929) (8,993) (9,060) (9,259) (9,236) (88,768)
Other:
Paygo Contributions in Excess of Asset Balance -- (989) (1,014) (985) (964) (1,151) (1,177) (1,217) (1,251) (1,278) (10,026)
Run-Rate Capital Expenditures (283) (400) (407) (415) (422) (429) (437) (445) (453) (462) (4,154)
Total other (283) (1,389) (1,421) (1,400) (1,386) (1,581) (1,614) (1,662) (1,704) (1,739) (14,180)
Component Units, Non-GF Funds and Ent. Funds:
Net Deficit of Special Revenue Funds (110) (130) (146) (154) (162) (169) (173) (176) (176) (174) (1,571)
Independently Forecasted Non-Enterprise CUs (452) (380) (433) (558) (639) (752) (859) (963) (1,109) (1,210) (7,356)
HTA Operational Expenses (246) (234) (236) (238) (239) (243) (246) (250) (254) (258) (2,444)
Other (44) (41) (30) (30) (30) (31) (31) (32) (32) (33) (335)
Total (853) (785) (845) (980) (1,071) (1,194) (1,310) (1,420) (1,572) (1,675) (11,705)
Disbur. of Tax Revenues to Entities Outside Plan (335) (302) (304) (307) (313) (314) (316) (319) (322) (334) (3,168)
Adj. Expenses before Measures ($9,800) ($11,071) ($11,259) ($11,425) ($11,712) ($12,018) ($12,234) ($12,461) ($12,857) ($12,984) ($117,822)
Federal Programs (6,994) (7,168) (7,372) (7,477) (7,623) (7,835) (8,023) (8,212) (8,469) (8,675) (77,847)
Reconciliation Adjustment (585) (592) (598) (604) (610) (618) (627) (637) (647) (657) (6,175)
Other non-recurring (493) (150) (5) (5) (5) (5) -- -- -- -- (663)
AP paydow n -- -- -- -- -- -- -- -- -- -- --
Total (8,072) (7,910) (7,975) (8,086) (8,238) (8,458) (8,650) (8,849) (9,116) (9,332) (84,685)
Noninterest Exp. before Measures ($17,872) ($18,981) ($19,233) ($19,512) ($19,950) ($20,477) ($20,884) ($21,310) ($21,973) ($22,316) ($202,507)
12

0
-260
-907
-3,271
-3,890
284
-4,147
-396
-462
-1,278
-1,019
-3,675
2
1
3
4
5
6
• Payroll and Operational Expenses
• Education Payroll• Police Payroll
• Legislature • Department of Education• Other Agencies
• Power and Water• PBA Operating Subsidy (Rent)• Insurance Premiums
• UPR• Judicial and Municipalities • Retirement Systems • Health Insurance
• Required Pay-go contribution: ERS, TRS and JRS
Direct Payroll
Direct Operational Expenses
Utilities
Special Appropriations
PaygoContributions in Excess of Asset Balance
Run-Rate Capital Expenditures
• Non-Growth Capital Expenditures in the Base (Run-Rate)
• Growth Capex
• Growth based on previous year multiplied by PR Inflation and Inflation pass-through to payroll
• Growth based on previous year multiplied by PR Inflation and Inflation pass-through to payroll
• PBA Operating Subsidy maintains• Power and water have initial increase due to
subsidy reduction with steady year-over-year growth until 2026
• UPR, Judicial and Municipalities increase in 2018, maintain steady-state following initial growth
• Paygo program for ERS, TRS and JRS is initiated in 2018 with initial expenses of $989MM
• Steady growth in expenses starting in 2020
• Initial increase in 2018 to $400MM and steady growth in following years based on previous year multiplied by PR Inflation following
Assumptions and Methodology: Expenses (1/2)
Category Description2017$MM 2017 – 2016 Growth Methodology
2026$MM
FINANCIAL PROJECTIONS
13

Assumptions and Methodology: Expenses (2/2)
-853
-493
-585
0
-1,675
-657
8
7
9
• Reconciliation Adjustment
• Payment of Past-Due Tax Refunds
• Transition and restructuring costs
Reconciliation Adjustment
Other Non-Recurring
Component Units
• Net Deficit of Special Revenue Funds
• Independently forecasted non-enterprise
• HTA Operational Expenses
• Initial increase in 2018 to $592MM with steady increase until 2026
• Reconciliation adjustment based on midrange estimate provided by E&Y analysis and audit
• Initial decline in tax refunds in 2018 from $493MM to $150MM, decline in 2019 from $150MM to $5MM, and elimination of non-recurring expenses in 2023
• Costs to implement restructuring ($370MM over 10 years)
• Net Deficit of Special Revenue Funds growth is based on previous year multiplied by PR Inflation
• Non-enterprise expenses include ASEM, ASES, ADEA, PRCCDA, PRIDCO, PRITA, Tourism, and UPR deficits
• PBA and the Port Authority run a surplus in 2017 that transitions towards deficit beginning in 2018
• Initial HTA decline in expenses due to a reduction in Past Due AP costs
Category Description2017$MM 2017 – 2026 Growth Methodology
2026$MM
FINANCIAL PROJECTIONS
14

2
1
Category Description, %
3
4
2017 – 2026 Growth Methodology
PR Nominal GNP Growth Factor
PR Inflation
PR Population Growth Factor
US Population Growth
• Initial decrease to 97.2% in 2019• Increase in 2020 to 99.5%• Steady, minimal growth until 2026
• Initial negative inflation of -0.2% in 2017 increasing to 1.2% in 2018, 1.0% in 2019 with steady, minimal growth in Inflation until 2026
• Maintenance of 2017 PR Population Growth Factor of 99.8%
• Maintenance of 2017 US Population Growth of 100.8% until 2024, where it drops to 100.7%
2.62.11.61.00.3
-0.4-0.5-2.4-2.8-2.2
1.61.61.51.51.31.11.01.01.2
-0.2
-0.2-0.2-0.2-0.2-0.2-0.2-0.2-0.2-0.2-0.2
0.70.70.70.80.80.80.80.80.80.8
Assumptions and Methodology: Macroeconomic factors
FINANCIAL PROJECTIONS
15
III. FISCAL REFORM MEASURES
16

FISCAL REFORM MEASURES
Fiscal Reform measures reduce the 10-year financing gap by $39.6B
Note: Values may not add up due to rounding; Excludes expenditures related to rehabilitation of trade terms with local suppliers
Estimated Impact, $MM
1,7851,7661,7521,7401,6331,5311,3841,381924
RevenueEnhancement
A
2,7582,7062,6512,5972,5432,4142,0941,713
851
GovernmentRight-sizing
B
ReducingHealthcareSpending
C
PensionReform
D
1,001945892842795750500299100
7073767880818300
TOTAL
2018 2019 2020 2021 2022 2023 2024 2025 2026 10-year Total
13,897
20,329
6,123
541
40,890
5,4915,3705,2575,0514,7774,061
5,615
3,393
1,875
17
Excludes $1,310MM in supplier pay downs
Tax Compliance
Corporate Tax Reform
Adjust Taxes and Fees
Reform Measures Description
788 838 938 1,038 1,038 1,038 1,038688519
435424415408404403405300150
313305299294292291292255
293
1,785
2025
1,766
2024
1,752
924
2023
1,740
2022
1,633
2021
1,531
2020
1,384
2019
1,381
2018 2026
Corporate Tax Reform
Tax Compliance
Adjust Taxes and Fees
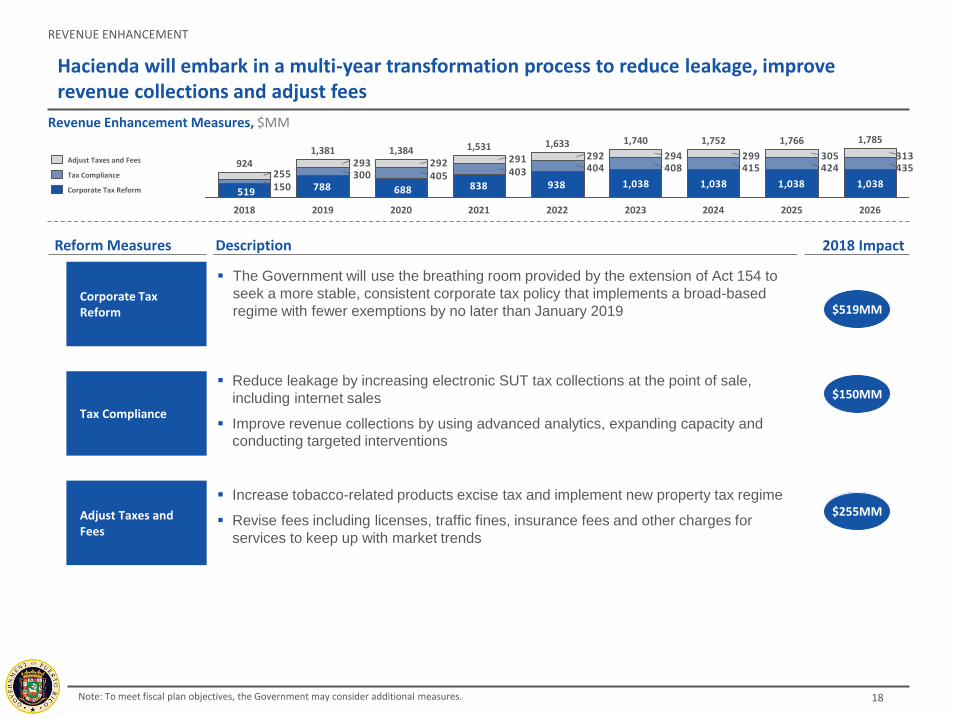
Revenue Enhancement Measures, $MM
$519MM
REVENUE ENHANCEMENT
Hacienda will embark in a multi-year transformation process to reduce leakage, improve revenue collections and adjust fees
The Government will use the breathing room provided by the extension of Act 154 to
seek a more stable, consistent corporate tax policy that implements a broad-based
regime with fewer exemptions by no later than January 2019
Increase tobacco-related products excise tax and implement new property tax regime
Revise fees including licenses, traffic fines, insurance fees and other charges for
services to keep up with market trends
Reduce leakage by increasing electronic SUT tax collections at the point of sale,
including internet sales
Improve revenue collections by using advanced analytics, expanding capacity and
conducting targeted interventions
$255MM
$150MM
Note: To meet fiscal plan objectives, the Government may consider additional measures.
2018 Impact
18

Non-Personnel Related
Personnel Related
Reduction of Subsidies
Reform Measures Description
819 830 842 855 868 882695 785 796 808 820 832
1,0441,018989960929900825750411668459
190602505
250
2021
2,414
2020
2,094
2019
1,713
2018
851
2026
2,758
2025
2,706
2024
2,651
2023
2,597
2022
2,543
Government Right-Sizing Measures1, $MM
$250MM
GOVERNMENT RIGHT-SIZING
The Government must embark on a transformative journey in order to provide core services to citizens in an efficient and fiscally responsible manner
Freeze on payroll increases for fiscal years 2018 to 2020
Improve employee mobilization across government, uniform fringe benefits and
eliminate vacation and sick day liquidations to produce higher attrition rates or other
payroll-related savings
Gradually reduce general fund subsidies to the University of Puerto Rico,
municipalities and other direct subsidies to the private sector
Proactively engage with the University of Puerto Rico, municipalities, as well as
industry partners, to mitigate the economic development impact of subsidy removal
Freeze on operational cost increases for fiscal years 2018 to 2020
Re-design the way the Government works by reducing non-core expenses,
externalizing services to private entities, centralizing services to eliminate duplication,
achieve procurement savings or other cost-cutting measures
$411MM
$190MM
Reduction of Subsidies
Non-Personnel Related
Personnel Related
Note: To meet fiscal plan objectives, the Government may consider additional measures.1) Post 2018, the relative distribution of savings between personnel and non-personnel related expenses will be decided as part of updates to the Fiscal Plan and the annual budget
2018 Impact
19
Improve Payment Integrity
Pay for Value
Reduce Drug Cost
Reform Measures Description
1,00194589284279575050011038
25 8438 60
45
2023
842
2022
795
2019
299
2018
100
2026
1,001
2025
945
2024
892
2021
750
2020
500
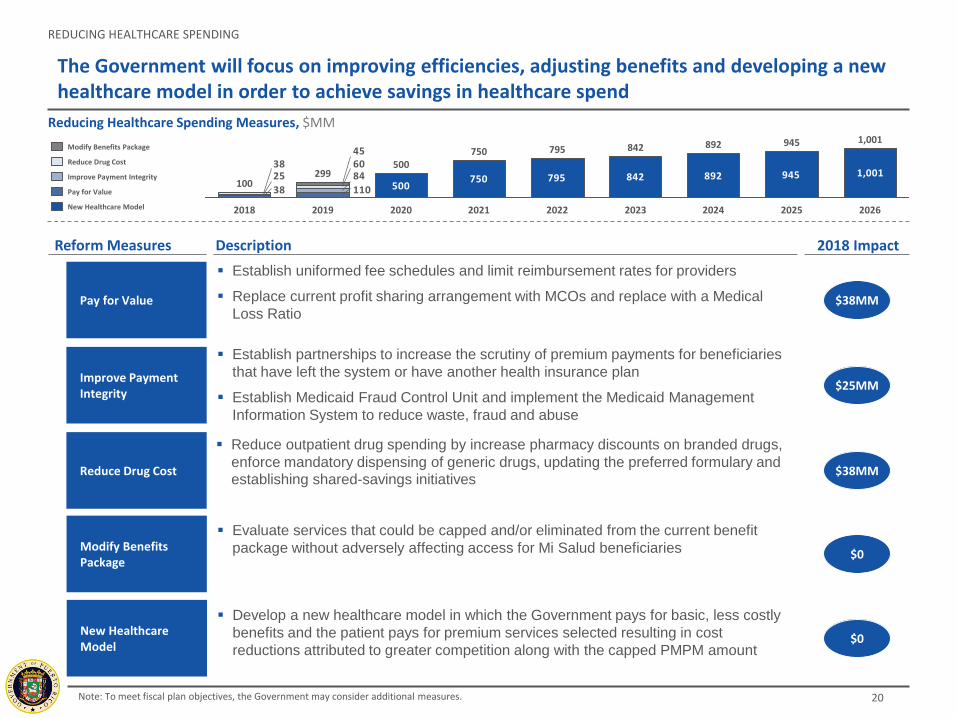
Reducing Healthcare Spending Measures, $MM
$38MM
REDUCING HEALTHCARE SPENDING
The Government will focus on improving efficiencies, adjusting benefits and developing a new healthcare model in order to achieve savings in healthcare spend
Establish uniformed fee schedules and limit reimbursement rates for providers
Replace current profit sharing arrangement with MCOs and replace with a Medical
Loss Ratio
Modify Benefits Package
Evaluate services that could be capped and/or eliminated from the current benefit
package without adversely affecting access for Mi Salud beneficiaries
Reduce outpatient drug spending by increase pharmacy discounts on branded drugs,
enforce mandatory dispensing of generic drugs, updating the preferred formulary and
establishing shared-savings initiatives
Establish partnerships to increase the scrutiny of premium payments for beneficiaries
that have left the system or have another health insurance plan
Establish Medicaid Fraud Control Unit and implement the Medicaid Management
Information System to reduce waste, fraud and abuse
$0
$38MM
$25MM
Reduce Drug Cost
Pay for Value
New Healthcare Model
Modify Benefits Package
Improve Payment Integrity
New Healthcare Model
Develop a new healthcare model in which the Government pays for basic, less costly
benefits and the patient pays for premium services selected resulting in cost
reductions attributed to greater competition along with the capped PMPM amount$0
Note: To meet fiscal plan objectives, the Government may consider additional measures.
2018 Impact
20

Adjust Retirement Benefits
Contribution Segregation and New Benefit Plans
Reform Measures Initiative
45 46 47 47 48 49 50
37 36 33 31 28 24 21
2026
70
0
2018
0
2025
73
2024
76
2023
78
2022
80
2021
81
2020
83
2019
Pension Reform Measures, $MM
$0
PENSION REFORM
Segmentation of the defined contribution structure will protect the retirement savings of government employees
Switch to pay-as-you-go model, segregate prospective employee contributions,
facilitate Social Security enrollment and improve investment alternatives
2018 Impact
Protect benefits for lowest pension income earners. Progressive strategy to reduce
retirement benefit costs including other post-employment benefits.$0
Changes to Special Laws
Changes to Pension Benefits
21Note: To meet fiscal plan objectives, the Government may consider additional measures.

IV. STRUCTURAL REFORMS
22

Externalize the overseeing of marketing
efforts & continuity under a single brand
and as a unified front representing all of
Puerto Rico’s tourism components
Promote productivity growth, attract FDI
& incentivize investments in technology
through collaboration with the private
sector
Implementing the package of structural reforms will provide a cumulative 2.0% increase in GNP growth
Improve Capital EfficiencyImprove Ease of Business Activity
Increase Labor Participation1a
Public-Private Partnerships2b
Permitting Process Reform1b
Energy Reform3aInfrastructure Reform2a
Tax Reform 1c
21 Energy Reform3
Institute public policy measures aimed to attract new businesses, create new employment opportunities, and foster private sector employment growth to increase labor demand
Change welfare and labor incentives to encourage greater sector participation thus increasing labor supply
Centralize, streamline, and modernize and expedite permitting processes; increase business friendly environmental and economic growth
Leverage key public assets through long
term concessions to optimize quality of
public infrastructure, services to public
and sustainable operations and
maintenance
Augmenting competitiveness by
investing in critical infrastructure and
quality of public services in roads, ports,
telecommunications, water and waste,
knowledge services, and other
strategically important sectors
Leverage and facilitate expedited private
sector investments in modern, cost-
efficient, and environmentally compliant
energy infrastructure; reform PREPA
operations and services to clients; and
allow for greater competition in energy
generation
Lower marginal tax rates and broaden the tax base; simplify and optimize the existing tax code to achieve gains in efficiency, ease of doing business and reducing tax evasion
STRUCTURAL REFORM MEASURES
Enterprise Puerto Rico4a
Destination Marketing Organization4b
Promoting Economic Development4
Critical Projects2c
Implement management system to boost
development of critical projects through
expedited processes
Regulatory Reform1d
Reduce unnecessary regulatory burdens to reduce the drag of government on the private sector
23

Key Considerations in the Overall P3 Implementation P3 Key Target Areas %
The initial stage of the P3 program includes launching of ~$5B of projects during the 2017-2019 calendar years that have been identified and are in project preparation
Project sequencing is designed to effectively progress the advancement of projects and avoid major obstacles in the shortest timeline possible. Thus, progression goes from easily executable/advanced permitting to more difficult/less advanced projects
Need to promote and improve funding models to use private funds, where relevant, as leverage to maximize the unused federal funds current available
Need to further expand P3 pipeline by requesting identification of new projects with P3 potential from government heads, monetizing non-essential services with market interest and precedent2 , additional infrastructure concessions3, and pursuit of strategic P3 categories4
2017 2018 2019
Q-17 Q2-17 Q3-17 Q4-17 Q1-18 Q2-18 Q3-18 Q4-18 Q1-19 Q2-19 Q3-19 Q4-19
Group 1Projects
Group 2Projects
Group 3Projects
• Launch Group 1 Projects• Estimated value ~$1B
• Launch Group 2 Projects• Estimated value ~$2B
• Launch Group 3 Projects• Estimated value $2B
• Invest in preparing Group 2• Data gathering, due diligence, etc.
• Invest heavily in preparing Group 3• Data gathering, due diligence, etc.
Capital Improvement Investment: ~$5B | Jobs Created: ~100,00010-Year Impact
(Project timeline includes P3 concessions included in Externalization measures)
P3 Project Identification
Identified initial list of priority projects with P3 potential
Assessing project business cases and impact on the economy
Split into 3 groups based on projected sequencing1, designed to launch in 2017, 2018 and 2019
Transport
Energy
Water
0
7Social infra
43
8
Other
Waste mgmt
22
20
1 Based on existing level of detail, known roadblocks, project complexity 2 May include parking, National Parks, government-owned hotel properties, Puerto Rico lottery, state insurance fund, parking 3 May include regional airports, passenger ports 4 E.g. express lanes with dynamic tolling on existing congested roadways, broadband, infrastructure P3s including real estate funded infrastructure development
INFRASTRUCTURE / P3 REFORM – P3 Program
24
V. DEBT SUSTAINABILITY ANALYSIS
25

Below is a summary of the debt (excluding pension liabilities) considered in the fiscal plan
Note: Amounts are estimated as of February 2017 and based upon preliminary unaudited numbers provided to AAFAF by issuer agencies and from publicly available information. On behalf of the Board, Ernst & Young is conducting an assessment of the debt outstanding to confirm these figures. Estimated amounts are subject to further review and may change
Summary of debt outstanding as of February 2017 ($MM)
Debt summary
DEBT SUBSTAINABILITY
Unpaid Total Bonds & Loans from Total Debt DSRF
Issuers included in Fiscal Plan Bond principal CAB P&I1 Private Loans Private loans GDB/MFA Entities Service FY 17-19 Balance
GO $12,013 $84 $1,146 $24 $13,267 $169 $3,284 --
COFINA 11,725 6,155 -- -- 17,880 -- 2,138 --
HTA2
4,106 135 6 -- 4,247 1,734 978 101
PBA 4,012 -- 117 -- 4,129 182 776 6
GDB3, 4
3,182 -- 742 203 4,126 -- 1,887 --
ERS 2,658 498 -- -- 3,156 -- 500 44
PRIFA5
1,566 409 232 -- 2,207 127 465 2
PFC 1,025 -- 172 -- 1,197 -- 258 --
UPR6
496 -- -- 0 496 76 145 61
PRCCDA 386 -- -- -- 386 145 91 9
PRIDCO 145 11 -- -- 156 78 54 19
AMA -- -- -- 28 28 -- -- --
Other Central Gov't Entities 197 -- 29 413 639 3,897 -- --
Total $41,511 $7,293 $2,444 $668 $51,916 $6,409 $10,575 $242
Debt Issuers not incl. in Fiscal Plan
PREPA 8,259 -- -- 697 8,956 36 2,775 6
PRASA7
3,943 28 13 584 4,568 229 995 93
Children's Trust 847 613 -- -- 1,460 -- 140 85
HFA 542 -- -- -- 542 85 134 33
PRIICO -- -- -- 98 98 -- -- --
Municipality Related Debt8
556 -- -- 1,140 1,696 2,036 n.a. 59
Total $14,147 $641 $13 $2,520 $17,320 $2,386 $4,044 $276
Total $55,658 $7,933 $2,457 $3,188 $69,236 $8,795 $14,619 $518
Less: GDB Bonds (excl. TDF) (3,766)
Plus: Loans from GDB/MFA Entities 8,795
Public Sector Debt $74,265
Notes:
1) Unpaid principal and interest includes debt service that has been paid by insurers and is owed by the government
2) HTA includes Teodoro Moscoso bonds
3) GDB private loans includes Tourism Development Fund ("TDF") guarantees
4) Includes GDB Senior Guaranteed Notes Series 2013-B1 ("CFSE")
5) PRIFA includes PRIFA Rum bonds, PRIFA Petroleum Products Excise Tax BANs, PRIFA Port Authority bonds and $34.9m of PRIFA ASSMCA bonds
6) UPR includes $64.2m of AFICA Desarrollos Universitarios University Plaza Project bonds
7) PRASA bonds includes Revenue Bonds, Rural Development Bonds, Guaranteed 2008 Ref Bonds
8) Municipality Related Debt includes AFICA Guyanabo Municipal Government Center and Guaynabo Warehouse for Emergencies bonds
26

FY 2018 – FY 2027 debt service ($MM)
The table below summarizes the annual debt service through FY 2027 for all issuers included in the fiscal plan
1 HTA includes Teodoro Moscoso Bridge2 PRIFA includes PRIFA BANs3 UPR includes AFICA UPP
DEBT SUBSTAINABILITY
Debt service schedule
Fiscal year ending June 30, 2018 2019 2020 2021 2022 2023 2024 2025 2026 2027
Cash Interest
GO $714 $699 $680 $658 $641 $621 $597 $571 $545 $518
PBA 183 179 175 171 165 158 153 147 140 135
COFINA 690 690 690 689 696 702 708 714 711 708
HTA1
207 201 197 191 182 174 170 166 160 151
PRIFA2
80 77 75 72 69 65 61 57 53 45
PRCCDA 18 17 17 16 15 15 14 13 12 11
PFC 56 54 53 52 50 48 47 44 42 40
UPR3
24 22 21 20 18 17 15 14 12 11
ERS 167 167 167 167 164 159 155 154 152 151
GDB 150 135 92 69 54 49 34 21 14 3
PRIDCO 8 7 7 6 5 5 4 3 2 2
Total $2,296 $2,249 $2,172 $2,109 $2,059 $2,014 $1,957 $1,904 $1,844 $1,774
Principal
GO $351 $392 $439 $334 $358 $378 $402 $428 $454 $481
PBA 66 70 74 101 109 100 101 107 96 106
COFINA 19 48 78 98 120 159 203 248 294 344
HTA1
148 90 120 170 158 101 85 114 187 149
PRIFA2
48 50 51 54 62 86 64 72 74 221
PRCCDA 12 13 14 14 15 16 17 17 18 19
PFC 30 32 33 34 36 37 39 41 43 46
UPR3
25 26 27 29 30 31 33 35 24 26
ERS (0) -- (0) 50 70 80 19 22 29 36
GDB 277 848 432 434 143 47 541 -- 248 127
PRIDCO 10 11 11 11 13 13 14 15 16 17
Total $987 $1,579 $1,280 $1,328 $1,112 $1,049 $1,518 $1,099 $1,484 $1,573
Total debt service
GO $1,066 $1,090 $1,118 $991 $999 $999 $999 $999 $999 $999
PBA 249 249 249 272 273 258 254 253 236 241
COFINA 709 738 768 786 816 861 911 962 1,006 1,052
HTA1
355 291 317 362 340 275 254 280 347 300
PRIFA2
127 127 126 126 130 151 125 130 127 267
PRCCDA 30 30 30 30 30 30 30 30 30 30
PFC 86 86 86 86 86 86 86 86 85 85
UPR3
48 48 48 48 48 48 48 48 36 36
ERS 167 167 167 217 234 239 174 176 181 187
GDB 428 983 525 503 196 97 575 21 261 130
PRIDCO 18 18 18 16 18 18 18 18 18 18
Total $3,283 $3,828 $3,453 $3,437 $3,171 $3,063 $3,475 $3,003 $3,329 $3,347
27

The table below summarizes the annual cash flow available for debt service, and calculates implied debt capacity based on a range of interest rates and coverage ratios assuming an illustrative 35 year term• Cash flow available for debt service incorporates (i) the payment of essential services, (ii) benefit of clawback revenues and (iii) a
prudent contingency reserve• In the Fiscal Plan summarized below, the cash flow after Measures but before Debt Service averages $787m per year during the period
2017 - 2026
28
DEBT SUBSTAINABILITY
Debt sustainability
Debt sustainability sensitivity analysis ($MM)
Fiscal year ending June 30 ($ in millions) 2017 2018 2019 2020 2021 2022 2023 2024 2025 2026 '17 - '26 Total
Baseline ProjectionsRevenues $18,952 $17,511 $16,407 $16,434 $16,494 $16,590 $16,746 $16,953 $17,204 $17,509 $170,799Expenses (17,872) (18,981) (19,233) (19,512) (19,950) (20,477) (20,884) (21,310) (21,973) (22,316) (202,507)
Cash Flow Excl. Debt Service & Measures 1,080 (1,470) (2,826) (3,077) (3,456) (3,886) (4,139) (4,357) (4,769) (4,807) (31,708)
Impact of MeasuresRevenue Measures -- 924 1,381 1,384 1,531 1,633 1,740 1,752 1,766 1,785 13,897Expense Measures -- 951 2,012 2,415 2,983 3,156 3,255 3,357 3,724 3,830 25,683
Total Measures -- 1,875 3,393 3,799 4,515 4,789 4,995 5,108 5,491 5,615 39,580
Cash Flow Available for Debt Service $1,080 $404 $567 $722 $1,059 $903 $857 $751 $722 $808 $7,873
Illustrative Sustainable Debt Capacity Sizing Analysis
Sensitivity Analysis: Implied Debt Capacity at 10% Contingency
Illustrative Cash Flow Available $700 $750 $800 $850 $900 $950 $1,000 $1,050 $1,100
3.5% 12,600 13,500 14,400 15,301 16,201 17,101 18,001 18,901 19,801
Sensitivity Analysis: PV Rate % 4.0% 11,759 12,599 13,439 14,278 15,118 15,958 16,798 17,638 18,478
4.5% 11,000 11,786 12,572 13,358 14,143 14,929 15,715 16,501 17,286
Sensitivity Analysis: Implied Debt Capacity at 4% PV Rate
Illustrative Cash Flow Available $700 $750 $800 $850 $900 $950 $1,000 $1,050 $1,100
5.0% 12,412 13,299 14,185 15,072 15,958 16,845 17,731 18,618 19,505
Sensitivity Analysis: % Contingency 10.0% 11,759 12,599 13,439 14,278 15,118 15,958 16,798 17,638 18,478
15.0% 11,105 11,899 12,692 13,485 14,278 15,072 15,865 16,658 17,451

VI. TSA LIQUIDITY
29

TSA Liquidity
Weekly cash flow forecast through 2017FY
(a) Excludes clawback account. 30
Cash Flows Before Cliffs, Measures and Debt Fcst - 1 Fcst - 2 Fcst - 3 Fcst - 4 Fcst - 5 Fcst - 6 Fcst - 7 Fcst - 8 Fcst - 9 Fcst - 10 Fcst - 11 Fcst - 12 Fcst - 13 Fcst - 14 Fcst - 15 Fcst - 16
(figures in $mm) 3/17 3/24 3/31 4/7 4/14 4/21 4/28 5/5 5/12 5/19 5/26 6/2 6/9 6/16 6/23 6/30
1 General Collections $349 $254 $58 $71 $66 $760 $186 $63 $66 $334 $60 $44 $59 $134 $520 $57
2 Sales and Use Tax 18 13 146 5 17 14 163 5 18 5 167 4 5 18 14 171
3 Excise Tax through Banco Popular 64 – – – 77 – – – – 68 – – – 57 – –
4 Rum Tax – 10 – – – 11 – – – 18 – – – – 22 –
5 Electronic Lottery – – – – – – – – – – – – – – 14 37
6 Subtotal $432 $277 $204 $76 $161 $784 $349 $68 $84 $424 $227 $48 $64 $210 $570 $265
7 Employee/Judiciary Retirement Admin. – – – – 56 – – – 56 – – – – 56 – –
8 Teachers Retirement System – – – – 70 – – – – – – – – – – –
9 Retirement System Transfers – – – – $127 – – – $56 – – – – $56 – –
10 Federal Funds 93 110 83 123 95 119 123 95 126 93 123 49 99 107 107 121
11 Other Inflows 9 – 11 – – 9 11 – – – – 11 – – – 11
12 Tax Revenue Anticipation Notes – – – – – – – – – – – – – – – –
13 Total Inflows $534 $388 $298 $199 $382 $912 $483 $163 $267 $517 $350 $108 $163 $373 $677 $397
14 Payroll and Related Costs (18) (51) (120) (23) (95) (62) (101) (35) (90) (65) (96) (18) (22) (95) (56) (106)
15 Pension Benefits – – (87) – (82) – (87) – (82) – (87) – – (82) – (87)
16 Health Insurance Administration - ASES (53) (53) (55) (53) (53) (53) (60) (53) (53) (53) (53) (7) (53) (53) (53) (55)
17 University of Puerto Rico - UPR (18) (18) (24) (18) (18) (18) (24) (18) (18) (18) (18) (6) – (36) (18) (24)
18 Muni. Revenue Collection Center - CRIM (21) (8) (8) (8) (8) (8) (8) (8) (8) (8) (8) – – (15) (8) (26)
19 Highway Transportation Authority - HTA – – (16) – – – (16) – (19) – – (19) – – (19) (19)
20 Public Building Authority - PBA / AEP (9) (4) (4) (4) (4) (4) (4) (4) (4) (4) – (4) (4) (4) (4) (4)
21 Other Governmental Entities (20) (9) (54) 25 (20) (9) (54) 25 (20) (9) (12) (18) (3) (20) (9) (63)
22 Subtotal - Government Entity Transfers ($120) ($92) ($160) ($57) ($103) ($92) ($165) ($57) ($122) ($92) ($90) ($54) ($59) ($128) ($111) ($191)
23 Supplier Payments (57) (57) (58) (86) (86) (86) (87) (68) (68) (68) (68) (53) (65) (65) (65) (66)
24 Other Legislative Appropriations (24) (14) (5) (2) – (38) (5) (6) (22) (10) (5) (4) – (16) (22) (5)
25 Tax Refunds (12) (13) (4) (1) (6) (39) (4) (7) (4) (4) (31) (3) (1) (4) (6) (41)
26 Nutrition Assistance Program (30) (70) (22) (35) (40) (54) (36) (22) (43) (56) (36) (16) (37) (30) (70) (20)
27 Other Disbursements – – – – – – – – – – – (4) – – – (4)
28 Contingency (16) (16) (16) (29) (29) (29) (29) (29) (29) (29) (29) (23) (23) (23) (23) (23)
29 Tax Revenue Anticipation Notes – – – – – – (152) – – – – (137) – – – (135)
30 Total Outflows ($277) ($313) ($472) ($233) ($440) ($399) ($665) ($223) ($459) ($324) ($442) ($312) ($208) ($443) ($353) ($676)
31 Net Cash Flows Excluding Debt Service, Fiscal Cliffs and Measures $257 $75 ($174) ($34) ($58) $513 ($182) ($60) ($193) $194 ($92) ($204) ($44) ($70) $324 ($279)
32 Bank Cash Position, Beginning (a) $319 $576 $650 $477 $442 $384 $897 $716 $655 $462 $656 $564 $360 $316 $246 $570
33 Bank Cash Position, Ending (a) $576 $650 $477 $442 $384 $897 $716 $655 $462 $656 $564 $360 $316 $246 $570 $291

Liquidity Principles for FY 2018
▪ No external short-term financing
▪ Rollout of Disbursement Authorization Group in order to enforce priority of payments throughdefined critical services (see Section VII)
▪ Consolidate dispersed treasury functions and put in place oversight over accounts not centrally managed
▪ Refine and regularly update 13 week cash analysis with detailed forecasting of cash receipts and disbursements
▪ Provide detailed daily performance projections, results, and variances
1 Cash management authority is granted to AAFAF under Act 5-2017 and other relevant legislation
LIQUIDITY DISCUSSION
31

VII. FINANCIAL CONTROL REFORM
32

Current state of financial controls
Cash is not centrally managed
– No central office has visibility across all spending
– Procurement agencies do not actively enforce terms and specifications
– Limited coordinated effort to eliminate major cash outlays
– Limited sweep of cash into general fund accounts
– Cash disbursements is a manual and subjective process handled at Hacienda
– No formal structure for reporting and release of audited financials
Target is to improve level of detail on forecasting and specificity aroundassumptions
– “Top-down” approach, based on prior year’s Budget
– Bank-to-book reconciliations are not often prepared in a timely manner
– No tracking mechanisms exist to measure intra-year actual expenditures vs.budget on an accrual basis
FINANCIAL CONTROLS
33

Budget certification per PROMESA § 202
March April May June
7/1:▪ Beginning of
FY2018
3/13:▪ Certification of Fiscal
Plan
July
6/5:▪ Budget
certification
4/28:▪ Submit budget
and implementation plan to Oversight Board
5/22:▪ Submit revised
budgets and supporting documents to Board, if necessary
4/14:▪ Adopt procedures
to deliver timely statements and to make public per PROMESA §202(a)
3/17:▪ Set timeline for
budget certification per PROMESA § 202 (a)
▪ Work with Oversight Board in designing a reporting structure and reporting forms
6/30:▪ Last day for budget
certification per PROMESA § 202(e)
FINANCIAL CONTROLS
34
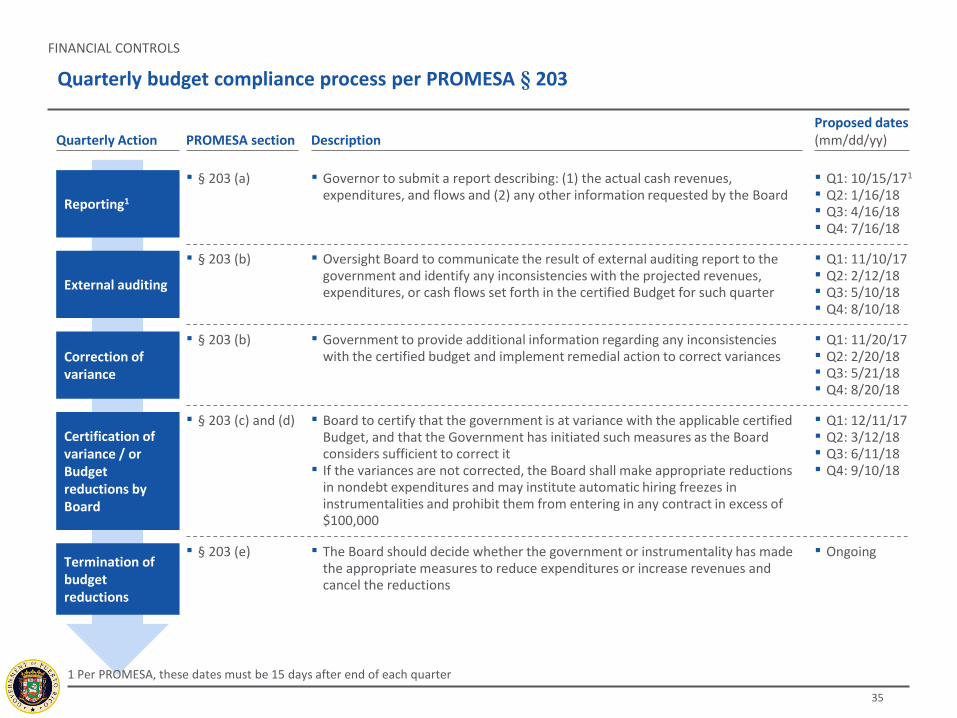
Quarterly budget compliance process per PROMESA § 203
Quarterly Action
Reporting1
External auditing
Correction of variance
Certification of variance / or Budget reductions by Board
Termination of budget reductions
PROMESA section DescriptionProposed dates(mm/dd/yy)
▪ § 203 (a) ▪ Governor to submit a report describing: (1) the actual cash revenues, expenditures, and flows and (2) any other information requested by the Board
▪ Q1: 10/15/171
▪ Q2: 1/16/18▪ Q3: 4/16/18▪ Q4: 7/16/18
▪ § 203 (b) ▪ Oversight Board to communicate the result of external auditing report to the government and identify any inconsistencies with the projected revenues, expenditures, or cash flows set forth in the certified Budget for such quarter
▪ Q1: 11/10/17▪ Q2: 2/12/18▪ Q3: 5/10/18▪ Q4: 8/10/18
▪ § 203 (b) ▪ Government to provide additional information regarding any inconsistencies with the certified budget and implement remedial action to correct variances
▪ Q1: 11/20/17▪ Q2: 2/20/18▪ Q3: 5/21/18▪ Q4: 8/20/18
▪ § 203 (c) and (d) ▪ Board to certify that the government is at variance with the applicable certified Budget, and that the Government has initiated such measures as the Board considers sufficient to correct it
▪ If the variances are not corrected, the Board shall make appropriate reductions in nondebt expenditures and may institute automatic hiring freezes in instrumentalities and prohibit them from entering in any contract in excess of $100,000
▪ Q1: 12/11/17▪ Q2: 3/12/18▪ Q3: 6/11/18▪ Q4: 9/10/18
▪ § 203 (e) ▪ The Board should decide whether the government or instrumentality has made the appropriate measures to reduce expenditures or increase revenues and cancel the reductions
▪ Ongoing
1 Per PROMESA, these dates must be 15 days after end of each quarter
FINANCIAL CONTROLS
35

Budget and Forecasting process
Set, update, and track targets every quarter
Use performance metrics, e.g.,:– Status? On track / Delayed / Completed– Reached target?– Above / below past instances?
Implement measures to correct variances from budget
Set guiding principles for budget and forecasting
Budget should be prepared…– Within the confines of the overall fiscal plan– As a positive cash balance with sufficient safety margin, due to lack
of access to capital markets
Define a timeline for each quarter’s budget
Certification process must adhere to PROMESA requirements Should include, but not be limited to:
– Certification process according to PROMESA requirements– Reporting, external auditing, and variance certifications
FINANCIAL CONTROLS
36

Disbursement process
Set, update, and track metrics every quarter
Establish preventive measures
Implement detective procedures to correct problems before they arise
Design a process to correct variances from budget mid-year
Implement a centralized disbursement digital database
Centralize into a single Treasury account with a corresponding database
Update and review periodically
Set a minimum available liquidity threshold and an alert-system
Define disbursement process
Set guidelines and principles
Work to match budget to disbursement authorizations
Identify an effective, centralized, and time-sensitive disbursement process that involves the adequate authorities
– Incorporate a mechanism that confirms alignment between revenues and expenses
FINANCIAL CONTROLS
37