Embed Size (px)
Citation preview
Month year |0
FISCAL MONITOR (Incorporating the Exchequer Statement) MAY 2018
Department of Finance | Fiscal Monitor: May 2018 |1
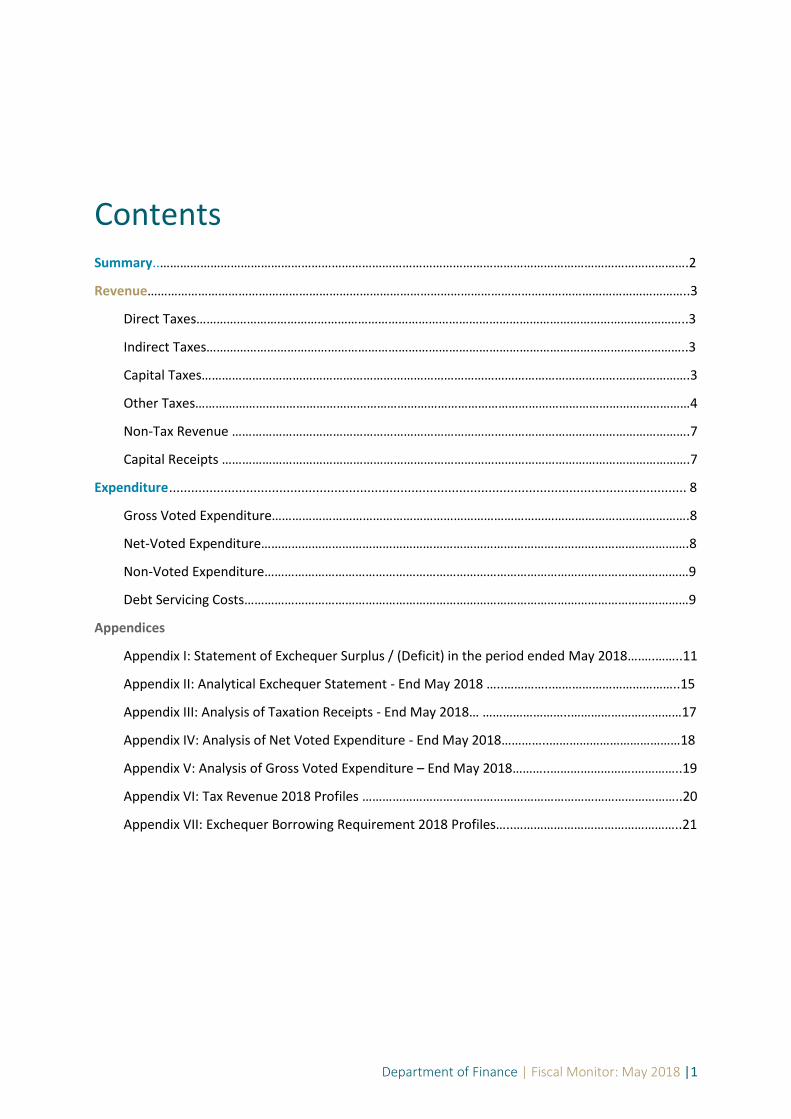
Contents Summary..………………………………………………………………………………………………………………………………………….2
Revenue……………………………………………………………………………………………………………………………………………..3
Direct Taxes………………………………………………………………………………………………………………………………..3
Indirect Taxes……………………………………………………………………………………………………………………………..3
Capital Taxes……………………………………………………………………………………………………………………………….3
Other Taxes…………………………………………………………………………………………………………………………………4
Non-Tax Revenue ……………………………………………………………………………………………………………………….7
Capital Receipts ………………………………………………………………………………………………………………………….7
Expenditure ............................................................................................................................................. 8
Gross Voted Expenditure…………………………………………………………………………………………………………….8
Net-Voted Expenditure……………………………………………………………………………………………………………….8
Non-Voted Expenditure………………………………………………………………………………………………………………9
Debt Servicing Costs……………………………………………………………………………………………………………………9
Appendices
Appendix I: Statement of Exchequer Surplus / (Deficit) in the period ended May 2018….….……..11
Appendix II: Analytical Exchequer Statement - End May 2018 …..…………..………………………………..15
Appendix III: Analysis of Taxation Receipts - End May 2018… ……………………..……………………………17
Appendix IV: Analysis of Net Voted Expenditure - End May 2018…………..…………………………………18
Appendix V: Analysis of Gross Voted Expenditure – End May 2018………..…………………….…………..19
Appendix VI: Tax Revenue 2018 Profiles …………………………………………………………………………………..20
Appendix VII: Exchequer Borrowing Requirement 2018 Profiles…..…………………………………………..21

Department of Finance | Fiscal Monitor: May 2018 |2
D
epartm
ent o
f Finan
ce | Fiscal Mo
nito
r: Mo
nth
20
17
Summary
An Exchequer deficit of €24 million was recorded to end May 2018. This compares
to a surplus of €383 million in the same period last year. The €407 million year-on-
year decrease in the Exchequer balance was primarily due to an increase in
expenditure (both voted and non-voted), which was somewhat offset by increased
tax revenue.
Tax revenues of €20,544 million were collected to end-May 2018, an annual
increase of 5.0% or €973 million on end-May 2017. This was in line with profile, up
0.4% or €77 million.
Overall, total net voted expenditure to end-May 2018, at €19,336 million, was 1.3%
or €249 million below profile, and up €1,504 million or 8.4% in year-on-year terms.
Combined receipts from non-tax revenue and capital receipts of €3,322 million
were up 8.4% (€258 million) year-on-year.
Non-voted expenditure of €4,554 million was up year-on-year by 7.6% or €320
million. This annual increase was driven by a higher EU budget contribution due to
both Ireland’s increased share of EU budget obligations and timing associated with
the call-up of funds by the Commission, and an expected increase in debt servicing
costs.
Figure 1. Tax receipts to end-May 2018
0 5,000 10,000 15,000 20,000 25,000
Total Taxes
Income Tax
VAT
Corporation Tax
Excise Duties
Other
€ millions
2018 Profile 2018 Outturn
Department of Finance | Fiscal Monitor: May 2018 |3
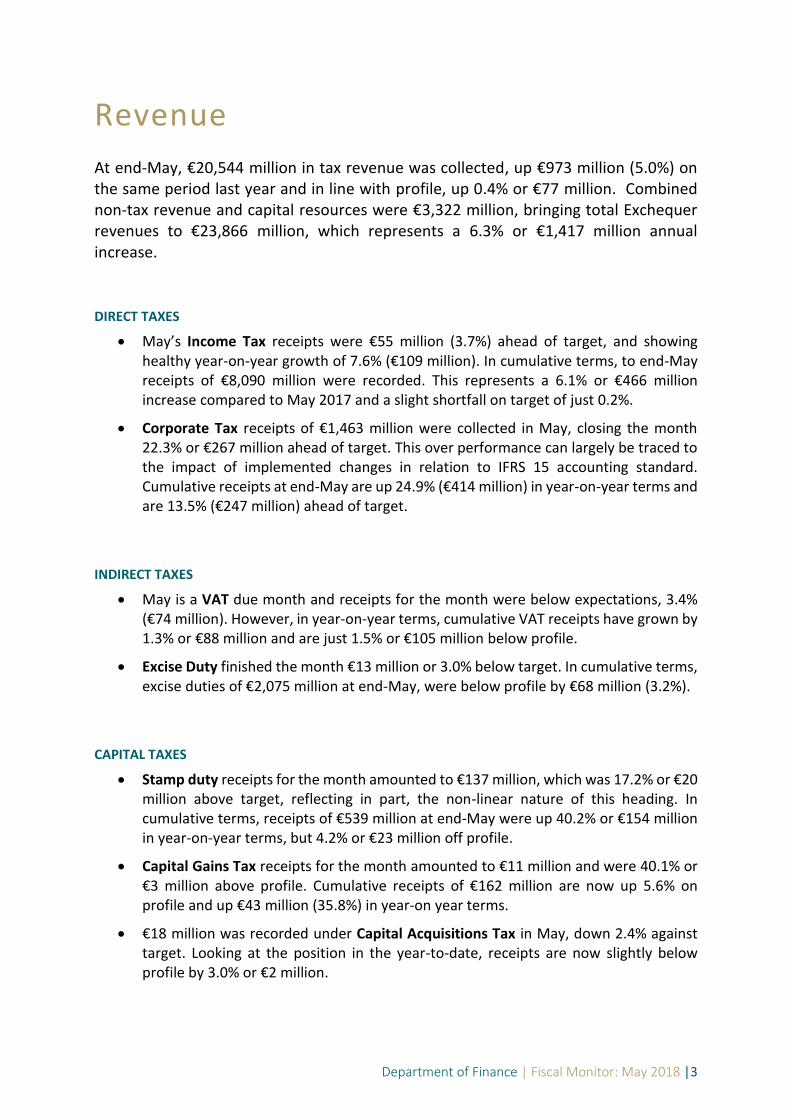
Revenue
At end-May, €20,544 million in tax revenue was collected, up €973 million (5.0%) on the same period last year and in line with profile, up 0.4% or €77 million. Combined non-tax revenue and capital resources were €3,322 million, bringing total Exchequer revenues to €23,866 million, which represents a 6.3% or €1,417 million annual increase.
DIRECT TAXES
May’s Income Tax receipts were €55 million (3.7%) ahead of target, and showing healthy year-on-year growth of 7.6% (€109 million). In cumulative terms, to end-May receipts of €8,090 million were recorded. This represents a 6.1% or €466 million increase compared to May 2017 and a slight shortfall on target of just 0.2%.
Corporate Tax receipts of €1,463 million were collected in May, closing the month 22.3% or €267 million ahead of target. This over performance can largely be traced to the impact of implemented changes in relation to IFRS 15 accounting standard. Cumulative receipts at end-May are up 24.9% (€414 million) in year-on-year terms and are 13.5% (€247 million) ahead of target.
INDIRECT TAXES
May is a VAT due month and receipts for the month were below expectations, 3.4% (€74 million). However, in year-on-year terms, cumulative VAT receipts have grown by 1.3% or €88 million and are just 1.5% or €105 million below profile.
Excise Duty finished the month €13 million or 3.0% below target. In cumulative terms, excise duties of €2,075 million at end-May, were below profile by €68 million (3.2%).
CAPITAL TAXES
Stamp duty receipts for the month amounted to €137 million, which was 17.2% or €20 million above target, reflecting in part, the non-linear nature of this heading. In cumulative terms, receipts of €539 million at end-May were up 40.2% or €154 million in year-on-year terms, but 4.2% or €23 million off profile.
Capital Gains Tax receipts for the month amounted to €11 million and were 40.1% or €3 million above profile. Cumulative receipts of €162 million are now up 5.6% on profile and up €43 million (35.8%) in year-on year terms.
€18 million was recorded under Capital Acquisitions Tax in May, down 2.4% against target. Looking at the position in the year-to-date, receipts are now slightly below profile by 3.0% or €2 million.

Department of Finance | Fiscal Monitor: May 2018 |4
OTHER TAXES
€89 million was collected in Motor Tax receipts in May, up 1.6% against profile.
Customs cumulative receipts of €123 million were collected to end-May, coming in
3.1% or €4 million below and down 2.0% in year-on-year terms.
As mentioned in previous Fiscal Monitors, Local Property Tax is now paid into the Local Government Fund (LGF) and Motor Tax receipts are now paid directly into the Exchequer instead of the LGF. Therefore, all tax revenue year-on-year comparisons are provided on a like-for-like basis with the exception of the Exchequer Statement and the Analytical Exchequer Statement in Appendices I and II respectively.

Department of Finance | Fiscal Monitor: May 2018 |5
Figure 2. Tax Receipts Year-on-Year
a. Total Exchequer Tax Receipts
b. Income Tax Receipts
c. Corporation Tax Receipts
0
10,000
20,000
30,000
40,000
50,000
60,000
Jan Feb Mar Apr May Jun Jul Aug Sep Oct Nov Dec
€m
illio
ns
Total Taxes 2018 receipts 2018 Profile
0
5,000
10,000
15,000
20,000
25,000
Jan Feb Mar Apr May Jun Jul Aug Sep Oct Nov Dec
€m
illio
ns
Income Tax Receipts Income Tax Profile
0
1,000
2,000
3,000
4,000
5,000
6,000
7,000
8,000
9,000
Jan Feb Mar Apr May Jun Jul Aug Sep Oct Nov Dec
€m
illio
ns
Corporation Tax Receipts Corporation Tax Profile
€54,175m
€21,445m
€8,505m

Department of Finance | Fiscal Monitor: May 2018 |6
d. VAT Receipts
e. Excise Duty Rceeipts
f. Capital and other Tax Receipts
0
2,000
4,000
6,000
8,000
10,000
12,000
14,000
16,000
Jan Feb Mar Apr May Jun Jul Aug Sep Oct Nov Dec
€m
illio
ns
VAT Receipts VAT Profile
0
1,000
2,000
3,000
4,000
5,000
6,000
7,000
Jan Feb Mar Apr May Jun Jul Aug Sep Oct Nov Dec
€m
illio
ns
Excise Duties Receipts Excise Duties Profile
0
500
1,000
1,500
2,000
2,500
3,000
3,500
4,000
4,500
5,000
Jan Feb Mar Apr May Jun Jul Aug Sep Oct Nov Dec
€m
illio
ns
Other Tax Receipts Other Tax Profiles
€14,090m
€5,820m
€4,315m

Department of Finance | Fiscal Monitor: May 2018 |7
NON-TAX REVENUE
Non-tax revenue to end-May 2018 amounted to €2,356 million, up €256 million or 12.2% compared to end-May 2017. The year-on-year growth is mainly due to an increase in the surplus income from the Central Bank as it continues to reduce its holding of floating rate notes.
CAPITAL RECEIPTS
Capital receipts at end-May of €966 million, were almost flat, up just €2 million (0.2%) in year-on-year terms.

Department of Finance | Fiscal Monitor: May 2018 |8
Expenditure
Exchequer expenditure to end-May 2018 totalled €23,890 million, consisting of net voted and non-voted expenditure of €19,336 million and €4,554 million respectively.
GROSS VOTED EXPENDITURE
Total Gross voted expenditure of €24,099 million to end-May was €276 million (1.1%)
below profile. This is €1,712 million (7.6%) ahead on the same period in 2017.
Gross voted current expenditure of €22,671 million is €8 million ahead of profile and
up by €1,496 million (7.1%) in year-on-year terms.
Gross voted capital expenditure of €1,429 million is €285 million (16.6%) below profile
and up by €216 million (17.8%) year-on-year.
NET VOTED EXPENDITURE
Total net voted expenditure to end-May 2018, at €19,336 million was 1.3% or €249
million below profile with 14 of the 17 departments below profile. In year-on-year
terms, net voted expenditure was up 8.4% of €1,504 million.
Net voted current expenditure at €17,909 million to end-May, was (0.2%) or €32
million above profile and €1,265 million (7.6%) higher in year-on-year terms. Net
current expenditure in the Department of Health Vote Group is running €66 million or
1.1% above profile, with net current expenditure in the Department of Justice and
Equality is €30 million or 3.3% over profile.
Net voted capital expenditure at end-May amounted to €1,427 million, which was
€280 million (16.4%) below profile. This represents a year-on-year increase of €239
million or 20.1%.
Specifically, capital expenditure in the Department of Housing, Planning and Local
Government Vote Group is running €157 million or 35.4% behind profile. This is largely
due to a slower than anticipated draw down of funding by Irish Water. It is anticipated
that this will be completed in the coming months bringing expenditure back in line with
profile.

Department of Finance | Fiscal Monitor: May 2018 |9
Figure 3. End-May Gross Voted Current Expenditure year-on-year change
NON-VOTED EXPENDITURE
Non-voted current expenditure, excluding debt servicing costs, of €1,166 million, was up €12 million or 1.0% in year-on-year terms. While Ireland’s contribution to the EU budget has increased, this is offset by a reduction in non-voted expenditure due to the Water Services Act 2017 as Local Property tax receipts are now paid directly into the Local Government Fund.
Non-voted capital expenditure of €3 million was down €2 million in year-on-year terms.
DEBT SERVICING COSTS
Exchequer debt servicing costs to end-May 2018 were €3,384 million, compared to
€3,074 million to end-May 2017. This year-on-year increase of 10.1% was expected at
this point in the year. Debt service expenditure is marginally (1.5%) below profile at
end-May; this is due to timing factors which will unwind later in the year.
Figure 4. Debt Servicing Costs against profile
0 200 400 600 800 1000 1200 1400 1600
€ million
Total Other Education and Skills Health Employment Affairs & Social Protection
0
1000
2000
3000
4000
5000
6000
7000
Jan Feb Mar Apr May Jun Jul Aug Sep Oct Nov Dec
€m
illio
n
Outturn Profile
€6,292m

Department of Finance | Fiscal Monitor: May 2018 |10

Department of Finance | Fiscal Monitor: May 2018 |11
APPENDIX I: STATEMENT OF EXCHEQUER SURPLUS / (DEFICIT) in the period ended May 2018
1 January 2017 to 31 May 2017
1 January 2018 to 31 May 2018
Receipts and Expenditure - Current
€000 €000
Receipts
Tax Revenue Note 1 19,385,379 20,544,003
Non-Tax Revenue Note 2 2,100,313 2,356,236
Total 21,485,692 22,900,240
Expenditure
Voted (Departmental Expenditure Voted Annually by the Dail) Note 4 (16,644,634) (17,909,470)
Non-Voted Non-discretionary Expenditure charged directly on the Central Fund
Other Non-Voted Current Expenditure Note 5 (4,227,987) (4,550,395)
Total
(20,872,621) (22,459,865)
Surplus / (Deficit) on Current Account
613,071 440,375
Receipts and Expenditure - Capital
Receipts
Other Capital Receipts Note 3 964,014 966,247
Total 964,014 966,247
Expenditure
Voted (Departmental Expenditure Voted Annually by the Dail) Note 4 (1,187,972) (1,426,844)
Non-Voted (Expenditure charged under particular legislation) Note 6 (5,718) (3,388)
Total (1,193,690) (1,430,232)
Surplus / (Deficit) on Capital Account
(229,676) (463,985)
Exchequer Surplus / (Deficit)
383,395 (23,610)
Source and Application of Funds
Total (Borrowing) / Repayment Note 7 (9,195,462) (13,098,516)
Total Increase / (Decrease) in Exchequer Deposits and Other Balances Note 8 9,578,857 13,074,906
Exchequer Surplus / (Deficit)
383,395 (23,610)

Department of Finance | Fiscal Monitor: May 2018 |12
APPENDIX I (contd): STATEMENT OF EXCHEQUER SURPLUS/(DEFICIT) in the period ended May 2018
Note 1 Tax Revenue 2017 2018
€000 €000
Tax Head Customs 125,277 122,736
Excise Duty 2,249,547 2,074,847
Capital Gains Tax 119,396 162,122
Capital Acquisitions Tax 73,374 73,395
Stamps 384,389 538,739
Income Tax 7,624,513 8,090,095
Corporation Tax 1,666,769 2,081,079
Value Added Tax 6,827,616 6,916,014
Training and Employment Levy 39 0
Local Property Tax 277,129 0
Motor Tax 0 435,655
Unallocated Tax Receipts 37,330 49,321
Total 19,385,379 20,544,003
Note 2 Non-Tax Revenue 2017 2018
€000 €000
Surplus Incomes / Royalties
Central Bank Surplus Income 1,836,225 2,101,313
National Lottery Surplus 78,488 81,075
PSE Kinsale Energy 0 2,634
Income from Credit Inst (Eligible Liabilities Guarantee)
8,374 1,058
Interest on Loans Local Loans Fund 26 3
Other Advances 338 465
Dividends E.S.B. 57,219 4,387
Other Dividends 9,248 19,458
Dublin Airport Authority Dividend 0 37,400
Other Receipts
Property Registration Authority Fees 25,100 27,380
Motoring Fines 1,820 1,696
Other Receipts collected by Departments etc. 78,239 65,896
Miscellaneous 243 7,877
Pension Levy 4,904 5,510
Public Service Pension Payments 89 85
Total 2,100,313 2,356,236
Note 3 Capital Receipts 2017 2018
€000 €000
EU Receipts
European Regional Development Fund 585 31,158
Trans European Network 86 275
Other EU Receipts 6 0
Loan Repayments Local Loans 277 67
FEOGA Intervention 770,000 740,000
Repayment of advances to supply account section 3 Appropriation Act 2013
180,500 193,210
Capital Receipts Under Statute
Carbon Fund Act 2007 0 599
Other Capital Receipts Miscellaneous Capital Receipts 3,180 938
IBRC Payment 9,381 0
Total 964,014 966,247

Department of Finance | Fiscal Monitor: May 2018 |13
APPENDIX I (contd): STATEMENT OF EXCHEQUER SURPLUS/(DEFICIT) in the period ended May 2018
Note 4 Voted Departmental Expenditure (Current and Capital) 2017 2018
€000 €000
Vote Group
Agriculture, Fisheries and Food (271,438) (296,197)
Culture, Heritage and the Gaeltacht (97,594) (117,252)
Communications, Climate Action and the Environment
(77,021) (96,953)
Defence (324,860) (331,794)
Education and Skills (3,518,891) (3,731,424)
Business, Enterprise and Innovation (260,956) (257,117)
Housing, Planning and Local Government (559,216) (761,877)
Finance Group (141,223) (165,533)
Foreign Affairs and Trade (215,788) (221,398)
Health (5,781,615) (6,361,938)
Justice Group (871,839) (968,171)
Employment Affairs and Social Protection (4,352,318) (4,406,333)
Taoiseach's Group (incl Legal Votes) (66,397) (68,379)
Transport, Tourism and Sport (485,914) (566,347)
Public Expenditure and Reform (286,120) (347,182)
Children and Youth Affairs (521,416) (578,185)
Rural & Community Development 0 (60,234)
Total (17,832,606) (19,336,314)
Note 5 Non-Voted Current Expenditure 2017 2018
€000 €000
Service of National Debt Interest (3,012,036) (3,300,212)
Other Debt Management Expenses (61,812) (84,212)
Other Non-Voted Expenditure
Contribution to EU Budget (789,896) (1,037,604)
Election Expenses (357) (9,850)
Payments to Political Parties under the Electoral Acts
(6,604) (6,560)
Salaries, Pensions and Allowances (16,560) (17,271)
Oireachtas Commission (42,890) (47,034)
IDA & ADF - Payments under Development Banks Acts, 2005
(24,570) (24,390)
Miscellaneous (11) (12)
Post & Telecommunications Services Act 1983, Section 46
(33) (28)
Pensions Insolvency Payment (Amendment) Scheme 2011
(2,213) (2,372)
Irish Fiscal Advisory Council (118) (157)
Transfer of Local Property Tax Receipts to Local Government Fund
(269,390) (12,179)
Payments to DSP under S48B of Pensions Act 1990 (1,496) (1,551)
Section 48 (1D) Euro Container Shipping Plc Pensions Scheme
0 (6,963)
Total (4,227,987) (4,550,395)
Note 6 Non-Voted Capital Expenditure 2017 2018
€000 €000
Investment in International Bodies
Development Banks Act, 2005 (2,556) (3,388)
Bretton Woods Acts 1957-1999 (2,731) 0
Other Capital Payments Carbon Fund Act 2007 (431) 0
Total (5,718) (3,388)
Department of Finance | Fiscal Monitor: May 2018 |14
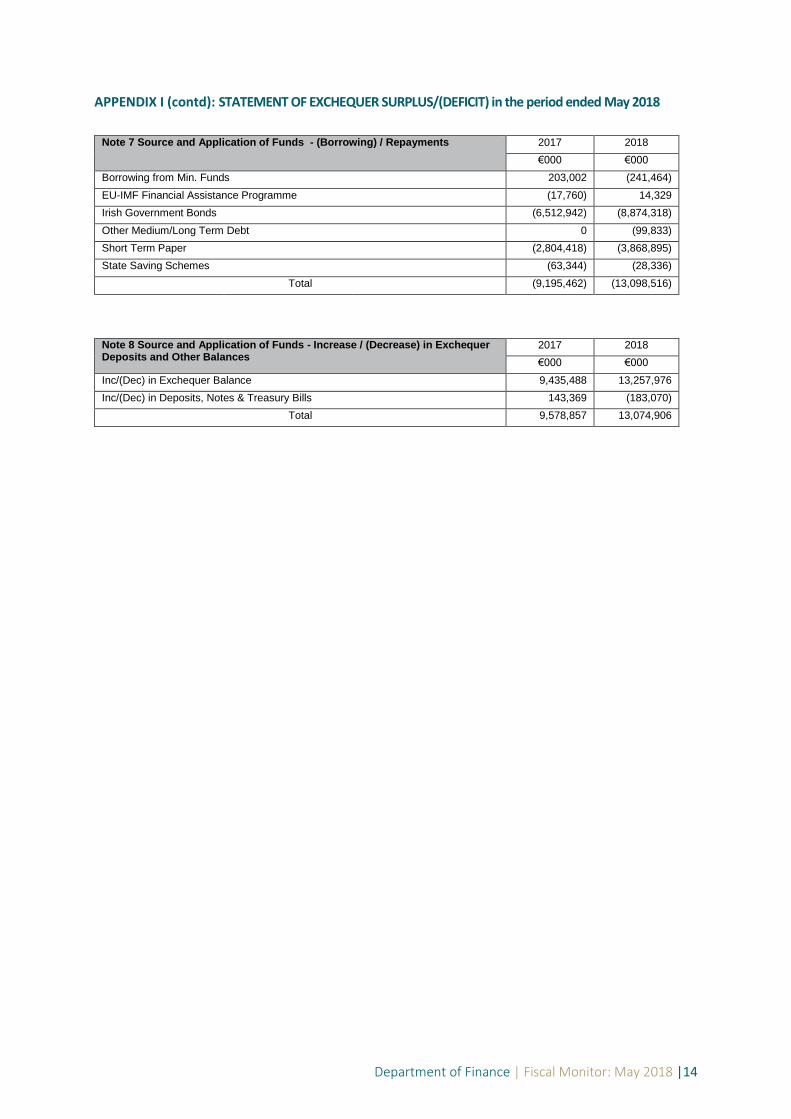
APPENDIX I (contd): STATEMENT OF EXCHEQUER SURPLUS/(DEFICIT) in the period ended May 2018
Note 7 Source and Application of Funds - (Borrowing) / Repayments 2017 2018
€000 €000
Borrowing from Min. Funds 203,002 (241,464)
EU-IMF Financial Assistance Programme (17,760) 14,329
Irish Government Bonds (6,512,942) (8,874,318)
Other Medium/Long Term Debt 0 (99,833)
Short Term Paper (2,804,418) (3,868,895)
State Saving Schemes (63,344) (28,336)
Total (9,195,462) (13,098,516)
Note 8 Source and Application of Funds - Increase / (Decrease) in Exchequer Deposits and Other Balances
2017 2018
€000 €000
Inc/(Dec) in Exchequer Balance 9,435,488 13,257,976
Inc/(Dec) in Deposits, Notes & Treasury Bills 143,369 (183,070)
Total 9,578,857 13,074,906
D
epartm
ent o
f Finan
ce | Fiscal Mo
nito
r: May 2
01
8
|15
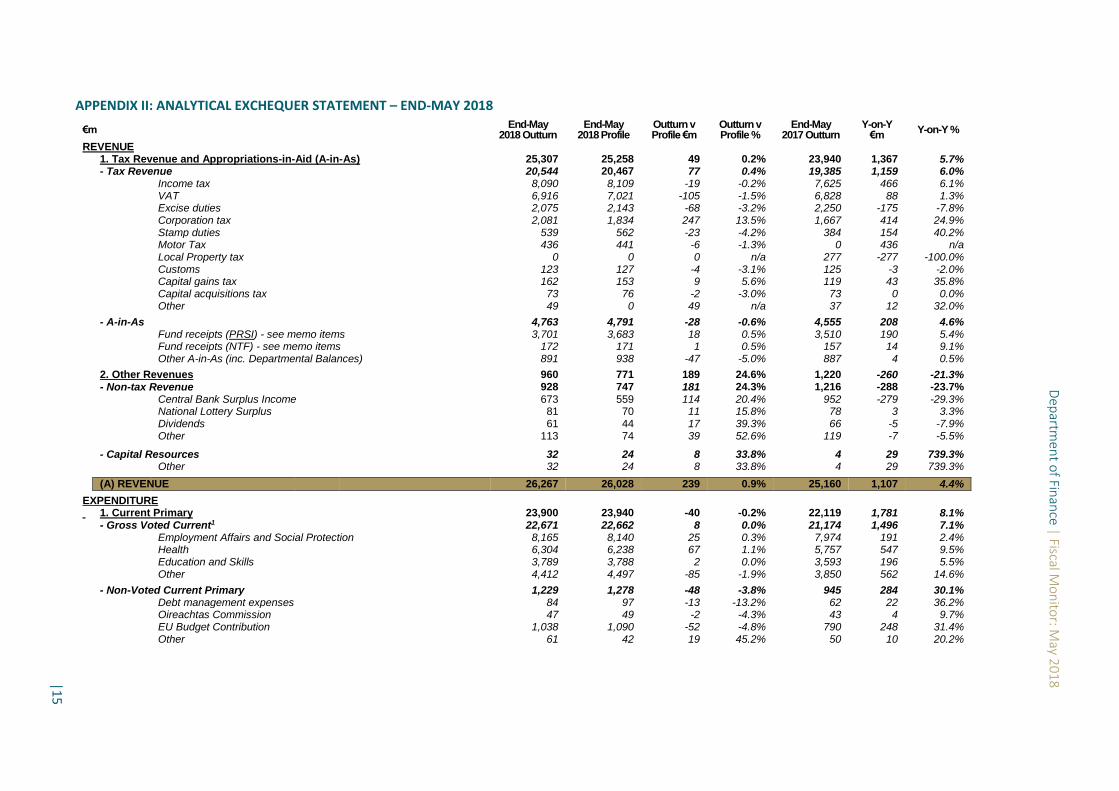
APPENDIX II: ANALYTICAL EXCHEQUER STATEMENT – END-MAY 2018
€m End-May
2018 Outturn End-May
2018 Profile Outturn v Profile €m
Outturn v Profile %
End-May 2017 Outturn
Y-on-Y €m
Y-on-Y %
REVENUE 1. Tax Revenue and Appropriations-in-Aid (A-in-As) 25,307 25,258 49 0.2% 23,940 1,367 5.7% - Tax Revenue 20,544 20,467 77 0.4% 19,385 1,159 6.0% Income tax 8,090 8,109 -19 -0.2% 7,625 466 6.1% VAT 6,916 7,021 -105 -1.5% 6,828 88 1.3% Excise duties 2,075 2,143 -68 -3.2% 2,250 -175 -7.8% Corporation tax 2,081 1,834 247 13.5% 1,667 414 24.9% Stamp duties 539 562 -23 -4.2% 384 154 40.2% Motor Tax 436 441 -6 -1.3% 0 436 n/a Local Property tax 0 0 0 n/a 277 -277 -100.0% Customs 123 127 -4 -3.1% 125 -3 -2.0% Capital gains tax 162 153 9 5.6% 119 43 35.8% Capital acquisitions tax 73 76 -2 -3.0% 73 0 0.0% Other 49 0 49 n/a 37 12 32.0%
- A-in-As 4,763 4,791 -28 -0.6% 4,555 208 4.6% Fund receipts (PRSI) - see memo items 3,701 3,683 18 0.5% 3,510 190 5.4% Fund receipts (NTF) - see memo items 172 171 1 0.5% 157 14 9.1% Other A-in-As (inc. Departmental Balances) 891 938 -47 -5.0% 887 4 0.5%
2. Other Revenues 960 771 189 24.6% 1,220 -260 -21.3% - Non-tax Revenue 928 747 181 24.3% 1,216 -288 -23.7% Central Bank Surplus Income 673 559 114 20.4% 952 -279 -29.3% National Lottery Surplus 81 70 11 15.8% 78 3 3.3% Dividends 61 44 17 39.3% 66 -5 -7.9% Other 113 74 39 52.6% 119 -7 -5.5%
- Capital Resources 32 24 8 33.8% 4 29 739.3% Other 32 24 8 33.8% 4 29 739.3%
(A) REVENUE 26,267 26,028 239 0.9% 25,160 1,107 4.4%
EXPENDITURE 1. Current Primary 23,900 23,940 -40 -0.2% 22,119 1,781 8.1% - Gross Voted Current1 22,671 22,662 8 0.0% 21,174 1,496 7.1% Employment Affairs and Social Protection 8,165 8,140 25 0.3% 7,974 191 2.4% Health 6,304 6,238 67 1.1% 5,757 547 9.5% Education and Skills 3,789 3,788 2 0.0% 3,593 196 5.5% Other 4,412 4,497 -85 -1.9% 3,850 562 14.6%
- Non-Voted Current Primary 1,229 1,278 -48 -3.8% 945 284 30.1% Debt management expenses 84 97 -13 -13.2% 62 22 36.2% Oireachtas Commission 47 49 -2 -4.3% 43 4 9.7% EU Budget Contribution 1,038 1,090 -52 -4.8% 790 248 31.4% Other 61 42 19 45.2% 50 10 20.2%
D
epartm
ent o
f Finan
ce | Fiscal Mo
nito
r: May 2
01
8
|16
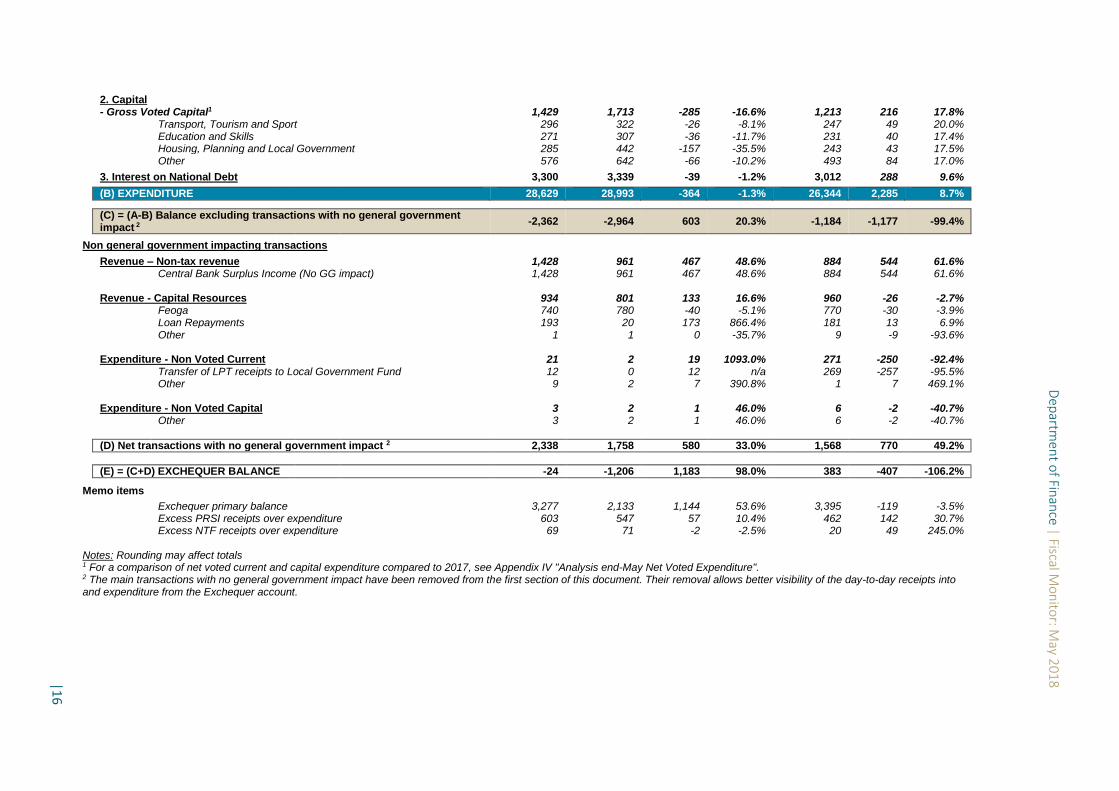
2. Capital
- Gross Voted Capital1 1,429 1,713 -285 -16.6% 1,213 216 17.8% Transport, Tourism and Sport 296 322 -26 -8.1% 247 49 20.0% Education and Skills 271 307 -36 -11.7% 231 40 17.4% Housing, Planning and Local Government 285 442 -157 -35.5% 243 43 17.5% Other 576 642 -66 -10.2% 493 84 17.0%
3. Interest on National Debt 3,300 3,339 -39 -1.2% 3,012 288 9.6%
(B) EXPENDITURE 28,629 28,993 -364 -1.3% 26,344 2,285 8.7%
(C) = (A-B) Balance excluding transactions with no general government impact 2
-2,362 -2,964 603 20.3% -1,184 -1,177 -99.4%
Non general government impacting transactions
Revenue – Non-tax revenue 1,428 961 467 48.6% 884 544 61.6% Central Bank Surplus Income (No GG impact) 1,428 961 467 48.6% 884 544 61.6% Revenue - Capital Resources 934 801 133 16.6% 960 -26 -2.7% Feoga 740 780 -40 -5.1% 770 -30 -3.9% Loan Repayments 193 20 173 866.4% 181 13 6.9% Other 1 1 0 -35.7% 9 -9 -93.6% Expenditure - Non Voted Current 21 2 19 1093.0% 271 -250 -92.4% Transfer of LPT receipts to Local Government Fund 12 0 12 n/a 269 -257 -95.5% Other 9 2 7 390.8% 1 7 469.1%
Expenditure - Non Voted Capital 3 2 1 46.0% 6 -2 -40.7% Other 3 2 1 46.0% 6 -2 -40.7%
(D) Net transactions with no general government impact 2 2,338 1,758 580 33.0% 1,568 770 49.2%
(E) = (C+D) EXCHEQUER BALANCE -24 -1,206 1,183 98.0% 383 -407 -106.2%
Memo items
Exchequer primary balance 3,277 2,133 1,144 53.6% 3,395 -119 -3.5% Excess PRSI receipts over expenditure 603 547 57 10.4% 462 142 30.7% Excess NTF receipts over expenditure 69 71 -2 -2.5% 20 49 245.0% Notes: Rounding may affect totals 1 For a comparison of net voted current and capital expenditure compared to 2017, see Appendix IV "Analysis end-May Net Voted Expenditure". 2 The main transactions with no general government impact have been removed from the first section of this document. Their removal allows better visibility of the day-to-day receipts into and expenditure from the Exchequer account.

D
epartm
ent o
f Finan
ce | Fiscal Mo
nito
r: May 2
01
8
|17
APPENDIX III: ANALYSIS OF TAXATION RECEIPTS – END-MAY 2018
Income Tax (including USC) 8,090 8,109 -19 -0.2% 1,554 1,500 55 3.7%
VAT 6,916 7,021 -105 -1.5% 2,072 2,146 -74 -3.4%
Corporation Tax 2,081 1,834 247 13.5% 1,463 1,196 267 22.3%
Excise 2,075 2,143 -68 -3.2% 414 426 -13 -3.0%
Stamps 539 562 -23 -4.2% 137 117 20 17.2%
Capital Gains Tax 162 153 9 5.6% 11 8 3 40.1%
Capital Acquisitions Tax 73 76 -2 -3.0% 18 19 0 -2.4%
Customs 123 127 -4 -3.1% 23 28 -5 -16.6%
Levies 0 0 0 - 0 0 0 -
Motor Tax 436 441 -6 -1.3% 89 88 1 1.6%
Unallocated Tax Deposits 49 0 49 24 0 24 -
Total 20,544 20,467 77 0.4% 5,807 5,527 279 5.1%
Income Tax (including USC) 8,090 7,625 466 6.1% 1,554 1,445 109 7.6%
VAT 6,916 6,828 88 1.3% 2,072 2,059 12 0.6%
Corporation Tax 2,081 1,667 414 24.9% 1,463 1,080 384 35.6%
Excise 2,075 2,250 -175 -7.8% 414 509 -96 -18.8%
Stamps 539 384 154 40.2% 137 95 42 44.8%
Capital Gains Tax 162 119 43 35.8% 11 13 -2 -14.4%
Capital Acquisitions Tax 73 73 0 0.0% 18 16 2 15.6%
Customs 123 125 -3 -2.0% 23 28 -5 -17.2%
Levies 0 0 0 - 0 0 0 -
Motor Tax 436 462 -27 -5.8% 89 91 -2 -2.0%
Unallocated Tax Deposits 49 37 12 32.1% 24 13 11 87.5%
Total 20,544 19,571 973 5.0% 5,807 5,349 458 8.6%
Note: Rounding may affect totals
End-May 2018
Outturn €m
Excess /
Shortfall
€m
End-May 2018
Target €m
Performance against Profile - Cumulative
Excess /
Shortfall
%
Exchequer Tax Receipts
Performance against Profile - Monthly
May 2018
Outturn €m
May 2018
Target €m
Excess /
Shortfall
€m
Excess /
Shortfall
%
Exchequer Tax Receipts
Year-on-Year Performance - Monthly
May 2018
Outturn €m
May 2017
Outturn €m
Y-on-Y
Change €m
Y-on-Y
Change %
Year-on-Year Performance - Cumulative
End-May 2018
Outturn €m
End-May 2017
Outturn €m
Y-on-Y
Change €m
Y-on-Y
Change %
Local Property Tax is now paid into the Local Government Fund (LGF) and Motor Tax receipts are now paid directly into the Exchequer instead of the LGF. Therefore, all tax revenue year-on-year comparisons are provided on a like-for-like
basis with the exception of the Exchequer Statement and the Analytical Exchequer Statement.

D
epartm
ent o
f Finan
ce | Fiscal Mo
nito
r: May 2
01
8 |1
8
APPENDIX IV: ANALYSIS OF NET VOTED EXPENDITURE – END-MAY 2018
MINISTERIAL VOTE GROUP
End May
Profile*
End May
Outturn Variance Variance
2018
Estimate* 2017 Outturn***
€m €m €m % % €m €m €m %
AGRICULTURE, FOOD AND THE MARINE 275 223 -52 -19.0% 25 9.1% 1,251 1,107 144 13.0%
Current 173 127 -46 -26.8% 9 4.8% 1,003 910 93 10.2%
Capital 103 96 -6 -5.9% 16 19.2% 248 198 51 25.6%
BUSINESS, ENTERPRISE & INNOVATION 269 260 -10 -3.6% -4 -1.5% 819 800 19 2.4%
Current 104 100 -5 -4.5% 8 8.7% 264 254 11 4.3%
Capital 165 160 -5 -3.0% -12 -6.8% 555 546 9 1.6%
CHILDREN AND YOUTH AFFAIRS 624 568 -56 -9.0% 57 10.9% 1,356 1,238 118 9.5%
Current 614 565 -49 -8.0% 59 11.3% 1,328 1,205 123 10.2%
Capital 10 3 -7 - -2 -37.7% 28 33 -5 -15.7%
COMMUNICATIONS, CLIMATE ACTION AND ENVIRONMENT 105 98 -6 -6.0% 20 25.9% 343 258 85 32.9%
Current 59 56 -3 -5.5% 10 22.6% 134 108 27 24.7%
Capital 46 43 -3 -6.6% 10 30.2% 209 151 58 38.8%
CULTURE, HERITAGE AND THE GAELTACHT 129 118 -11 -8.8% 20 20.1% 299 281 18 6.3%
Current 108 100 -8 -7.2% 8 8.6% 244 231 13 5.8%
Capital 21 17 -3 -16.7% 12 20.1% 54 50 4 8.4%
DEFENCE 364 337 -27 -7.5% 7 2.1% 921 884 37 4.2%
Current 345 325 -20 -5.7% 7 2.1% 845 789 56 7.1%
Capital 19 11 -8 -40.3% 0 3.1% 76 95 -19 -20.2%
EDUCATION & SKILLS 3,771 3,745 -26 -0.7% 213 6.0% 9,157 8,773 383 4.4%
Current 3,465 3,474 9 0.3% 172 5.2% 8,414 8,082 332 4.1%
Capital 306 271 -35 -11.4% 41 17.6% 743 691 52 7.5%
EMPLOYMENT AFFAIRS AND SOCIAL PROTECTION 4,376 4,386 10 0.2% 54 1.2% 10,627 10,775 -148 -1.4%
Current 4,373 4,383 11 0.2% 54 1.2% 10,617 10,768 -151 -1.4%
Capital 3 2 -1 -23.6% 0 -1.4% 10 7 3 39.0%
FINANCE 172 167 -5 -2.8% 24 17.2% 407 377 30 7.9%
Current 166 165 -1 -0.5% 25 18.4% 381 356 25 7.0%
Capital 6 2 -4 -61.2% -1 -28.6% 26 21 5 23.4%
FOREIGN AFFAIRS 234 228 -7 -2.9% 6 2.6% 692 641 50 7.9%
Current 232 227 -5 -2.3% 6 2.6% 679 629 50 8.0%
Capital 2 1 -1 -56.2% 0 1.7% 13 13 0 2.3%
HEALTH 6,302 6,364 62 1.0% 580 10.0% 14,872 14,339 533 3.7%
Current 6,167 6,232 66 1.1% 542 9.5% 14,379 13,885 494 3.6%
Capital 135 132 -3 -2.5% 39 41.3% 493 454 39 8.7%
HOUSING, PLANNING AND LOCAL GOVERNMENT 913 762 -151 -16.5% 216 39.7% 3,240 2,024 1,216 60.1%
Current 471 477 6 1.3% 174 57.4% 1,608 1,232 377 30.6%
Capital 442 285 -157 -35.4% 43 17.6% 1,632 792 839 105.9%
JUSTICE & EQUALITY 946 969 23 2.4% 83 9.3% 2,334 2,332 2 0.1%
Current 895 925 30 3.3% 71 8.3% 2,190 2,174 16 0.7%
Capital 50 43 -7 -14.1% 12 36.2% 144 158 -14 -8.7%
PUBLIC EXPENDITURE AND REFORM 370 353 -17 -4.6% 61 21.3% 925 820 105 12.8%
Current 307 295 -12 -3.9% 43 17.3% 751 682 68 10.0%
Capital 63 58 -5 -7.9% 19 46.9% 174 138 36 26.4%
RURAL AND COMMUNITY DEVELOPMENT 76 60 -15 -20.3% 60 - 208 114 94 82.2%
Current 62 56 -6 -10.2% 56 - 136 74 61 82.3%
Capital 14 5 -9 -66.2% 5 - 73 40 33 0.0%
TAOISEACH'S 72 68 -4 -5.9% 2 3.0% 181 163 19 11.5%
Current 72 68 -4 -5.9% 2 3.0% 181 163 19 11.5%
Capital 0 0 0 - - - - - -
TRANSPORT 587 563 -24 -4.1% 80 17% 2,005 1,430 576 40.3%
Current 264 266 2 0.9% 21 8% 679 554 125 22.6%
Capital 322 296 -26 -8.1% 59 25% 1,326 876 450 51.4%
Less DEPARTMENTAL BALANCES -68 - - - -
Total Net Cumulative Voted Spending 19,585 19,336 -249 -1.3% 1,504 8.4% 49,637 46,357 3,280 7.1%
Current 17,878 17,909 32 0.2% 1,265 7.6% 43,834 42,095 1,739 4.1%
Capital 1,707 1,427 -280 -16.4% 239 20.1% 5,803 4,262 1,541 36.2%
**Departmental balances are included for comparison puposes. Some year on year comparisons are affected by transfer of functions across Vote groups and the enactment of the Water Services Act 2017
***Capital carryover of €70.305 million from 2017 into 2018 is not included in these figures for comparison purposes.
Note: rounding may affect totals
* These profiles reflect the Revised Estimates for Public Services 2018 published on 14 December 2017. For more details see http://www.per.gov.ie/en/rev/
Performance against profile at end-May Year-on-Year Annual Estimate for Net Voted Expenditure
End May 17 v End May
18** Year-on-Year Change
D
epartm
ent o
f Finan
ce | Fiscal Mo
nito
r: May 2
01
8 |1
9
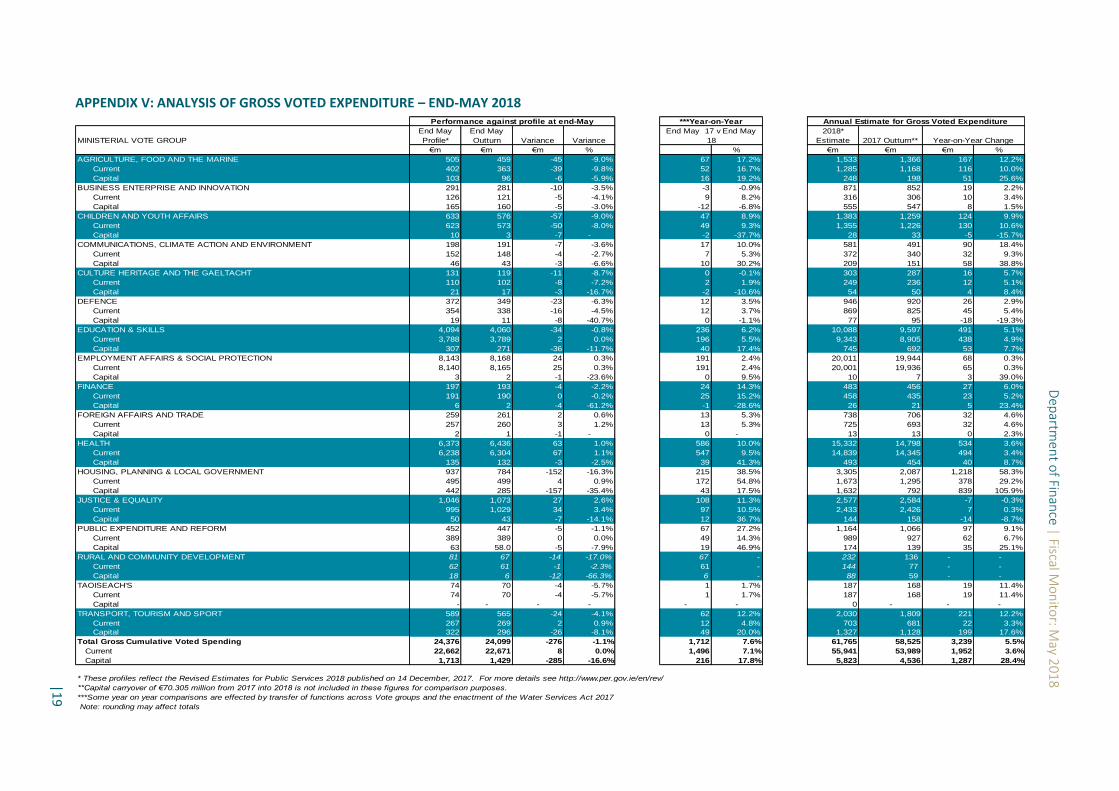
APPENDIX V: ANALYSIS OF GROSS VOTED EXPENDITURE – END-MAY 2018
MINISTERIAL VOTE GROUP
End May
Profile*
End May
Outturn Variance Variance
2018*
Estimate 2017 Outturn**
€m €m €m % % €m €m €m %
AGRICULTURE, FOOD AND THE MARINE 505 459 -45 -9.0% 67 17.2% 1,533 1,366 167 12.2%
Current 402 363 -39 -9.8% 52 16.7% 1,285 1,168 116 10.0%
Capital 103 96 -6 -5.9% 16 19.2% 248 198 51 25.6%
BUSINESS ENTERPRISE AND INNOVATION 291 281 -10 -3.5% -3 -0.9% 871 852 19 2.2%
Current 126 121 -5 -4.1% 9 8.2% 316 306 10 3.4%
Capital 165 160 -5 -3.0% -12 -6.8% 555 547 8 1.5%
CHILDREN AND YOUTH AFFAIRS 633 576 -57 -9.0% 47 8.9% 1,383 1,259 124 9.9%
Current 623 573 -50 -8.0% 49 9.3% 1,355 1,226 130 10.6%
Capital 10 3 -7 - -2 -37.7% 28 33 -5 -15.7%
COMMUNICATIONS, CLIMATE ACTION AND ENVIRONMENT 198 191 -7 -3.6% 17 10.0% 581 491 90 18.4%
Current 152 148 -4 -2.7% 7 5.3% 372 340 32 9.3%
Capital 46 43 -3 -6.6% 10 30.2% 209 151 58 38.8%
CULTURE HERITAGE AND THE GAELTACHT 131 119 -11 -8.7% 0 -0.1% 303 287 16 5.7%
Current 110 102 -8 -7.2% 2 1.9% 249 236 12 5.1%
Capital 21 17 -3 -16.7% -2 -10.6% 54 50 4 8.4%
DEFENCE 372 349 -23 -6.3% 12 3.5% 946 920 26 2.9%
Current 354 338 -16 -4.5% 12 3.7% 869 825 45 5.4%
Capital 19 11 -8 -40.7% 0 -1.1% 77 95 -18 -19.3%
EDUCATION & SKILLS 4,094 4,060 -34 -0.8% 236 6.2% 10,088 9,597 491 5.1%
Current 3,788 3,789 2 0.0% 196 5.5% 9,343 8,905 438 4.9%
Capital 307 271 -36 -11.7% 40 17.4% 745 692 53 7.7%
EMPLOYMENT AFFAIRS & SOCIAL PROTECTION 8,143 8,168 24 0.3% 191 2.4% 20,011 19,944 68 0.3%
Current 8,140 8,165 25 0.3% 191 2.4% 20,001 19,936 65 0.3%
Capital 3 2 -1 -23.6% 0 9.5% 10 7 3 39.0%
FINANCE 197 193 -4 -2.2% 24 14.3% 483 456 27 6.0%
Current 191 190 0 -0.2% 25 15.2% 458 435 23 5.2%
Capital 6 2 -4 -61.2% -1 -28.6% 26 21 5 23.4%
FOREIGN AFFAIRS AND TRADE 259 261 2 0.6% 13 5.3% 738 706 32 4.6%
Current 257 260 3 1.2% 13 5.3% 725 693 32 4.6%
Capital 2 1 -1 - 0 - 13 13 0 2.3%
HEALTH 6,373 6,436 63 1.0% 586 10.0% 15,332 14,798 534 3.6%
Current 6,238 6,304 67 1.1% 547 9.5% 14,839 14,345 494 3.4%
Capital 135 132 -3 -2.5% 39 41.3% 493 454 40 8.7%
HOUSING, PLANNING & LOCAL GOVERNMENT 937 784 -152 -16.3% 215 38.5% 3,305 2,087 1,218 58.3%
Current 495 499 4 0.9% 172 54.8% 1,673 1,295 378 29.2%
Capital 442 285 -157 -35.4% 43 17.5% 1,632 792 839 105.9%
JUSTICE & EQUALITY 1,046 1,073 27 2.6% 108 11.3% 2,577 2,584 -7 -0.3%
Current 995 1,029 34 3.4% 97 10.5% 2,433 2,426 7 0.3%
Capital 50 43 -7 -14.1% 12 36.7% 144 158 -14 -8.7%
PUBLIC EXPENDITURE AND REFORM 452 447 -5 -1.1% 67 27.2% 1,164 1,066 97 9.1%
Current 389 389 0 0.0% 49 14.3% 989 927 62 6.7%
Capital 63 58.0 -5 -7.9% 19 46.9% 174 139 35 25.1%
RURAL AND COMMUNITY DEVELOPMENT 81 67 -14 -17.0% 67 - 232 136 - -
Current 62 61 -1 -2.3% 61 - 144 77 - -
Capital 18 6 -12 -66.3% 6 - 88 59 - -
TAOISEACH'S 74 70 -4 -5.7% 1 1.7% 187 168 19 11.4%
Current 74 70 -4 -5.7% 1 1.7% 187 168 19 11.4%
Capital - - - - - - 0 - - -
TRANSPORT, TOURISM AND SPORT 589 565 -24 -4.1% 62 12.2% 2,030 1,809 221 12.2%
Current 267 269 2 0.9% 12 4.8% 703 681 22 3.3%
Capital 322 296 -26 -8.1% 49 20.0% 1,327 1,128 199 17.6%
Total Gross Cumulative Voted Spending 24,376 24,099 -276 -1.1% 1,712 7.6% 61,765 58,525 3,239 5.5%
Current 22,662 22,671 8 0.0% 1,496 7.1% 55,941 53,989 1,952 3.6%
Capital 1,713 1,429 -285 -16.6% 216 17.8% 5,823 4,536 1,287 28.4%
**Capital carryover of €70.305 million from 2017 into 2018 is not included in these figures for comparison purposes.
***Some year on year comparisons are effected by transfer of functions across Vote groups and the enactment of the Water Services Act 2017
Note: rounding may affect totals
End May 17 v End May
18 Year-on-Year Change
Performance against profile at end-May ***Year-on-Year Annual Estimate for Gross Voted Expenditure
* These profiles reflect the Revised Estimates for Public Services 2018 published on 14 December, 2017. For more details see http://www.per.gov.ie/en/rev/

D
epartm
ent o
f Finan
ce | Fiscal Mo
nito
r: May 2
01
8 |2
0
APPENDIX VI: TAX REVENUE 2018 PROFILES
January February March April May June July August September October November December TOTAL
€m €m €m €m €m €m €m €m €m €m €m €m €m
Outturn
Customs 17 25 28 29 28 26 31 33 35 33 32 29 345
Excise Duties 478 373 445 421 426 516 540 525 494 562 536 504 5,820
Capital Gains Tax 62 62 9 12 8 8 17 11 16 21 71 547 845
Capital Acquisitions Tax 13 12 14 17 19 17 21 22 29 82 204 20 470
Stamp Duties 124 115 102 104 117 100 148 126 103 319 125 186 1,670
Income Taxes 1,760 1,566 1,422 1,861 1,500 1,542 1,783 1,639 1,470 1,735 3,270 1,898 21,445
Corporation Tax 25 205 307 101 1,196 1,864 106 285 763 806 2,239 607 8,505
VAT 2,454 390 1,817 215 2,146 148 2,007 287 2,147 290 2,086 104 14,090
Motor Tax 87 88 93 85 88 84 90 80 77 65 79 68 985
Total Tax Revenue 5,019 2,837 4,237 2,846 5,527 4,306 4,743 3,007 5,135 3,913 8,642 3,964 54,175
January February March April May June July August September October November December
€m €m €m €m €m €m €m €m €m €m €m €m
Outturn
Customs 17 42 70 99 127 153 183 216 251 284 316 345
Excise Duties 478 851 1,296 1,717 2,143 2,659 3,199 3,724 4,218 4,780 5,316 5,820
Capital Gains Tax 62 124 133 145 153 162 178 189 205 226 298 845
Capital Acquisitions Tax 13 25 40 57 76 93 114 136 164 246 450 470
Stamp Duties 124 239 341 445 562 663 811 937 1,040 1,359 1,484 1,670
Income Taxes 1,760 3,326 4,748 6,609 8,109 9,651 11,434 13,072 14,542 16,278 19,547 21,445
Corporation Tax 25 230 536 637 1,834 3,698 3,805 4,090 4,853 5,658 7,898 8,505
VAT 2,454 2,844 4,661 4,876 7,021 7,170 9,176 9,463 11,610 11,900 13,986 14,090
Motor Tax 87 175 268 353 441 525 615 696 773 838 917 985
Total Tax Revenue 5,019 7,856 12,093 14,939 20,467 24,772 29,515 32,522 37,656 41,570 50,211 54,175
Rounding may affect totals Source: Department of Finance
Tax revenue profile is consistent with the tax revenue forecast of €53,660 million as published in Budget 2018, after adjustments have been made to allow for the provisions of the Water Services Act 2017 .
January figures represent the actual tax revenue outturns as per the end-January 2018 Exchequer Statement. Unallocated tax deposits(UTD) for January have been distributed between Income Tax and VAT. Their actual distributions to
the correct tax heads will be carried out by the Revenue Commissioners in due course. For the purpose of profiling, UTD is assumed to be zero.
Monthly Profile of Expected Exchequer Tax Revenue Receipts in 2018
Cumulative Profile of Expected Exchequer Tax Revenue Receipts in 2018
Department of Finance | Fiscal Monitor: May 2018 |21
D
epartm
ent o
f Finan
ce | Fiscal Mo
nito
r: May 2
01
8
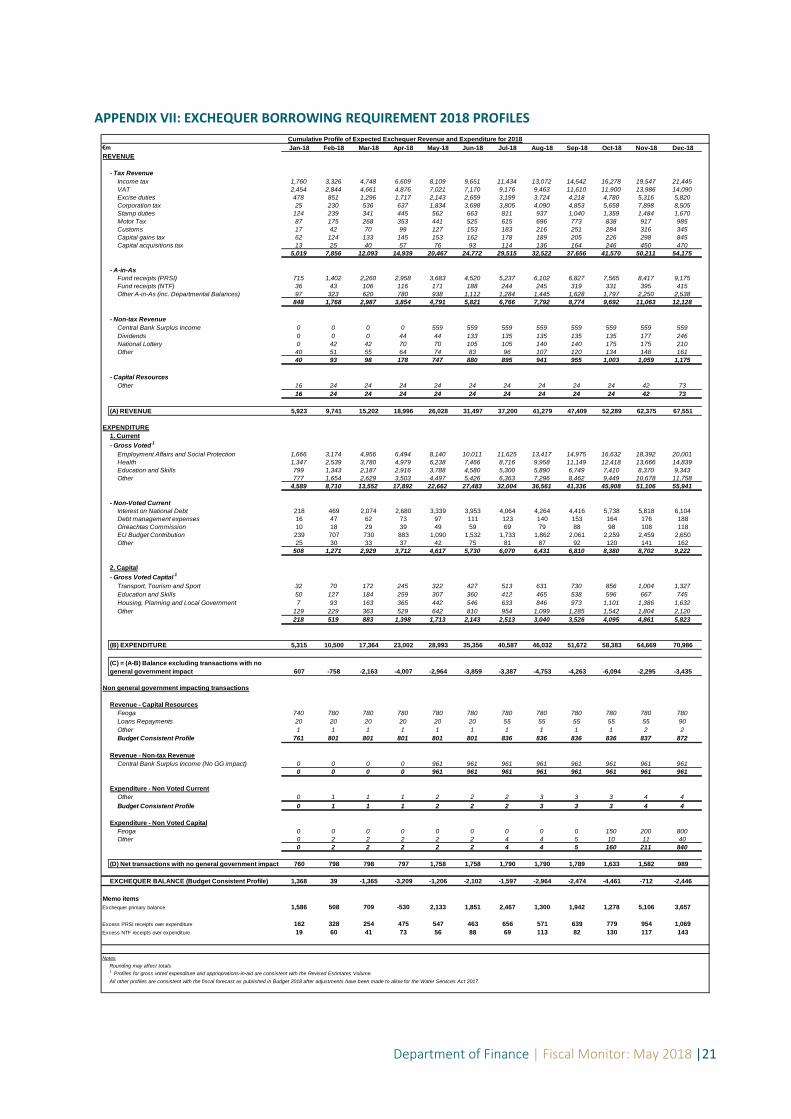
APPENDIX VII: EXCHEQUER BORROWING REQUIREMENT 2018 PROFILES
€m Jan-18 Feb-18 Mar-18 Apr-18 May-18 Jun-18 Jul-18 Aug-18 Sep-18 Oct-18 Nov-18 Dec-18
REVENUE
- Tax Revenue
Income tax 1,760 3,326 4,748 6,609 8,109 9,651 11,434 13,072 14,542 16,278 19,547 21,445
VAT 2,454 2,844 4,661 4,876 7,021 7,170 9,176 9,463 11,610 11,900 13,986 14,090
Excise duties 478 851 1,296 1,717 2,143 2,659 3,199 3,724 4,218 4,780 5,316 5,820
Corporation tax 25 230 536 637 1,834 3,698 3,805 4,090 4,853 5,658 7,898 8,505
Stamp duties 124 239 341 445 562 663 811 937 1,040 1,359 1,484 1,670
Motor Tax 87 175 268 353 441 525 615 696 773 838 917 985
Customs 17 42 70 99 127 153 183 216 251 284 316 345
Capital gains tax 62 124 133 145 153 162 178 189 205 226 298 845
Capital acquisitions tax 13 25 40 57 76 93 114 136 164 246 450 470
5,019 7,856 12,093 14,939 20,467 24,772 29,515 32,522 37,656 41,570 50,211 54,175
- A-in-As
Fund receipts (PRSI) 715 1,402 2,260 2,958 3,683 4,520 5,237 6,102 6,827 7,565 8,417 9,175
Fund receipts (NTF) 36 43 106 116 171 188 244 245 319 331 395 415
Other A-in-As (inc. Departmental Balances) 97 323 620 780 938 1,112 1,284 1,445 1,628 1,797 2,250 2,538
848 1,768 2,987 3,854 4,791 5,821 6,766 7,792 8,774 9,692 11,063 12,128
- Non-tax Revenue
Central Bank Surplus Income 0 0 0 0 559 559 559 559 559 559 559 559
Dividends 0 0 0 44 44 133 135 135 135 135 177 246
National Lottery 0 42 42 70 70 105 105 140 140 175 175 210
Other 40 51 55 64 74 83 96 107 120 134 148 161
40 93 98 178 747 880 895 941 955 1,003 1,059 1,175
- Capital Resources
Other 16 24 24 24 24 24 24 24 24 24 42 73
16 24 24 24 24 24 24 24 24 24 42 73
(A) REVENUE 5,923 9,741 15,202 18,996 26,028 31,497 37,200 41,279 47,409 52,289 62,375 67,551
EXPENDITURE
1. Current
- Gross Voted1
Employment Affairs and Social Protection 1,666 3,174 4,956 6,494 8,140 10,011 11,625 13,417 14,975 16,632 18,392 20,001
Health 1,347 2,539 3,780 4,979 6,238 7,466 8,716 9,958 11,149 12,418 13,666 14,839
Education and Skills 799 1,343 2,187 2,916 3,788 4,580 5,300 5,890 6,749 7,410 8,370 9,343
Other 777 1,654 2,629 3,503 4,497 5,426 6,363 7,296 8,462 9,449 10,678 11,758
4,589 8,710 13,552 17,892 22,662 27,483 32,004 36,561 41,336 45,908 51,106 55,941
- Non-Voted Current
Interest on National Debt 218 469 2,074 2,680 3,339 3,953 4,064 4,264 4,416 5,738 5,818 6,104
Debt management expenses 16 47 62 73 97 111 123 140 153 164 176 188
Oireachtas Commission 10 18 29 39 49 59 69 79 88 98 108 118
EU Budget Contribution 239 707 730 883 1,090 1,532 1,733 1,862 2,061 2,259 2,459 2,650
Other 25 30 33 37 42 75 81 87 92 120 141 162
508 1,271 2,929 3,712 4,617 5,730 6,070 6,431 6,810 8,380 8,702 9,222
2. Capital
- Gross Voted Capital1
Transport, Tourism and Sport 32 70 172 245 322 427 513 631 730 856 1,004 1,327
Education and Skills 50 127 184 259 307 360 412 465 538 596 667 745
Housing, Planning and Local Government 7 93 163 365 442 546 633 846 973 1,101 1,386 1,632
Other 129 229 363 529 642 810 954 1,099 1,285 1,542 1,804 2,120
218 519 883 1,398 1,713 2,143 2,513 3,040 3,526 4,095 4,861 5,823
(B) EXPENDITURE 5,315 10,500 17,364 23,002 28,993 35,356 40,587 46,032 51,672 58,383 64,669 70,986
607 -758 -2,163 -4,007 -2,964 -3,859 -3,387 -4,753 -4,263 -6,094 -2,295 -3,435
Non general government impacting transactions
Revenue - Capital Resources
Feoga 740 780 780 780 780 780 780 780 780 780 780 780
Loans Repayments 20 20 20 20 20 20 55 55 55 55 55 90
Other 1 1 1 1 1 1 1 1 1 1 2 2
Budget Consistent Profile 761 801 801 801 801 801 836 836 836 836 837 872
Revenue - Non-tax Revenue
Central Bank Surplus Income (No GG impact) 0 0 0 0 961 961 961 961 961 961 961 961
0 0 0 0 961 961 961 961 961 961 961 961
Expenditure - Non Voted Current
Other 0 1 1 1 2 2 2 3 3 3 4 4
Budget Consistent Profile 0 1 1 1 2 2 2 3 3 3 4 4
Expenditure - Non Voted Capital
Feoga 0 0 0 0 0 0 0 0 0 150 200 800
Other 0 2 2 2 2 2 4 4 5 10 11 40
0 2 2 2 2 2 4 4 5 160 211 840
760 798 798 797 1,758 1,758 1,790 1,790 1,789 1,633 1,582 989
EXCHEQUER BALANCE (Budget Consistent Profile) 1,368 39 -1,365 -3,209 -1,206 -2,102 -1,597 -2,964 -2,474 -4,461 -712 -2,446
Memo items
Exchequer primary balance 1,586 508 709 -530 2,133 1,851 2,467 1,300 1,942 1,278 5,106 3,657
Excess PRSI receipts over expenditure 162 328 254 475 547 463 656 571 639 779 954 1,069
Excess NTF receipts over expenditure 19 60 41 73 56 88 69 113 82 130 117 143
Notes
All other profiles are consistent with the fiscal forecast as published in Budget 2018 after adjustments have been made to allow for the Water Services Act 2017.
Cumulative Profile of Expected Exchequer Revenue and Expenditure for 2018
(C) = (A-B) Balance excluding transactions with no
general government impact
(D) Net transactions with no general government impact
Rounding may affect totals1 Profiles for gross voted expenditure and apprioprations-in-aid are consistent with the Revised Estimates Volume.

D
epartm
ent o
f Finan
ce | Fiscal Mo
nito
r: May 2
01
8
|22