Embed Size (px)
Citation preview

2021
Fiscal Federalism and the Dependency of Atlantic Canada
Fred McMahon


2021 • Fraser Institute
Fiscal Federalism and the Dependency
of Atlantic Canada
by Fred McMahon

fraserinstitute.org

fraserinstitute.org
Contents
Executive Summary / i
Introduction / 1
Overall federal spending / 3
The numbers / 6
Fiscal federalism going forward / 23
Impact on Atlantic Canada / 27
Conclusion / 31
References / 35
About the author / 39
Acknowledgments / 39
Publishing Information / 40
About the Fraser Institute / 41
Purpose, Funding, and Independence / 41
Editorial Advisory Board / 42

fraserinstitute.org

McMahon • Fiscal Federalism and the Dependency of Atlantic Canada • i
fraserinstitute.org
Executive Summary
Fiscal federalism, the massive and unbalanced flow of federal money to and from the provinces, will create a huge fiscal challenge going forward for at least three reasons: economic difficulties emerging after the COVID-19 pandemic, the overhang of prov-incial and federal deficits prior to COVID-19, and, most importantly, the decline of the energy industry, which arguably funded fiscal federalism in past years. For more than a decade, Alberta’s taxpayers have funded the lion’s share of federal fiscal trans-fers flowing predominantly to Atlantic Canada and Quebec. The decline of the energy industry will dramatically reduce this source of funding. To return to a federal balance, Ottawa will have to cut spending significantly, or reform fiscal federalism, or increase tax revenues.
Federal fiscal flows are larger and more unbalanced than many Canadians would imagine. Equalization forms only a small part of these transfers. Consider Atlantic Canada: over the period from 2007 to 2019, Ottawa spent $423.2 billion and raised revenues of $226.5 billion for a net transfer of $196.7 billion to the region (all amounts inflation-adjusted to 2018 constant dollars, unless otherwise noted). Total federal spending on average equalled over a quarter of the Atlantic economy at 27.5% of GDP. Net federal transfers—the difference between federal revenues and spending in the region—alone averaged 12.8% of GDP.
In Alberta, on the other hand, despite its weakening economy in the last three years of the 2007–2019 period, Ottawa spent $337.1 billion but raised revenues of $617.5 billion or $280.4 billion more than it spent. In Alberta, federal spending equalled 7.7% of the provincial GDP while federal revenues from the province equalled 14.1% of its economy, for a net outflow equivalent to 6.4% of the Alberta economy In the last financial crisis and recovery (2007/08), Alberta taxpayers carried most of the weight of fiscal federal-ism, with a federal surplus of $52.9 over the two years compared to $32.3 billion from Ontario and $13.1 billion from British Columbia. By comparison, Atlantic Canada’s fed-eral deficit was $29.2 billion.
For the foreseeable future, the burden will shift to Ontario taxpayers, as Alberta strug-gles after a period of weak growth, declines in energy prices, and challenges in build-ing energy infrastructure. Calls for reform of fiscal federalism have already come from Alberta and Ontario, the largest contributors to fiscal federalism. The shift of burden and the magnitude of Canada’s fiscal and economic problems are likely to intensify calls for reform of fiscal federalism.
ii • Fiscal Federalism and the Dependency of Atlantic Canada • McMahon
fraserinstitute.org
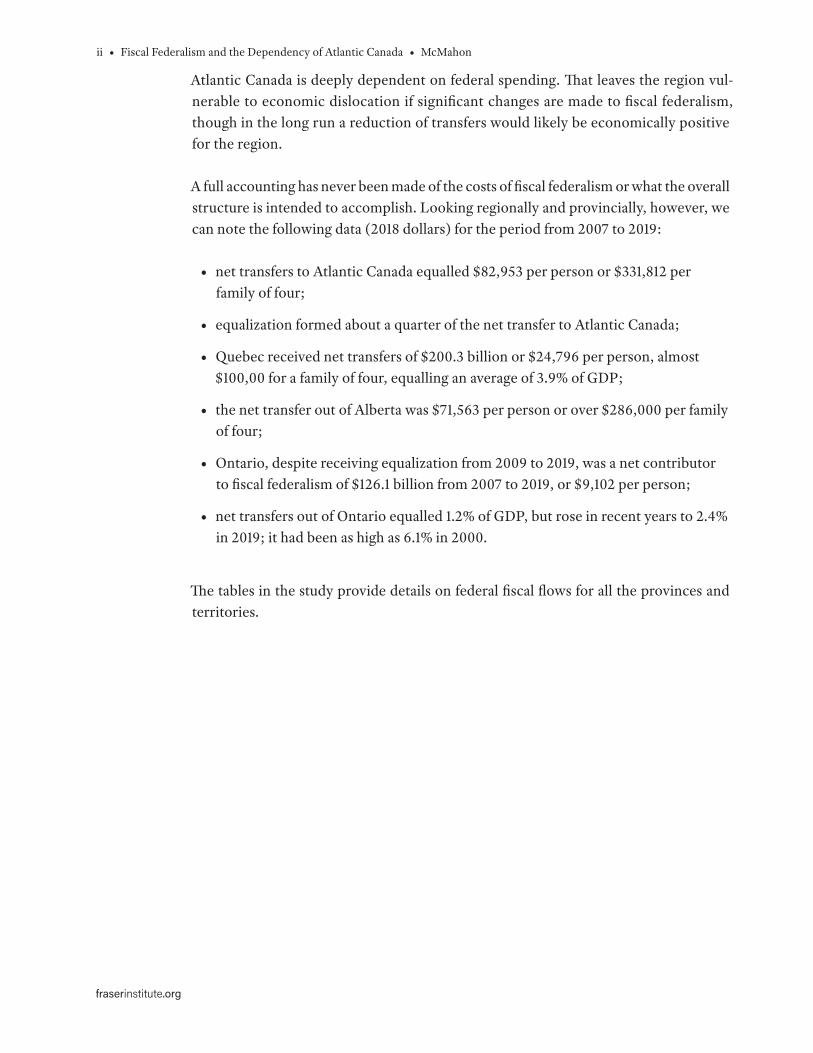
Atlantic Canada is deeply dependent on federal spending. That leaves the region vul-nerable to economic dislocation if significant changes are made to fiscal federalism, though in the long run a reduction of transfers would likely be economically positive for the region.
A full accounting has never been made of the costs of fiscal federalism or what the overall structure is intended to accomplish. Looking regionally and provincially, however, we can note the following data (2018 dollars) for the period from 2007 to 2019:
• net transfers to Atlantic Canada equalled $82,953 per person or $331,812 per family of four;
• equalization formed about a quarter of the net transfer to Atlantic Canada;
• Quebec received net transfers of $200.3 billion or $24,796 per person, almost $100,00 for a family of four, equalling an average of 3.9% of GDP;
• the net transfer out of Alberta was $71,563 per person or over $286,000 per family of four;
• Ontario, despite receiving equalization from 2009 to 2019, was a net contributor to fiscal federalism of $126.1 billion from 2007 to 2019, or $9,102 per person;
• net transfers out of Ontario equalled 1.2% of GDP, but rose in recent years to 2.4% in 2019; it had been as high as 6.1% in 2000.
The tables in the study provide details on federal fiscal flows for all the provinces and territories.

McMahon • Fiscal Federalism and the Dependency of Atlantic Canada • 1
fraserinstitute.org
Introduction
During a societal and economic shock, like COVID-19, a common question becomes: How will this affect life and the economy once the shock has receded? Here, we describe at a high level the flow of federal funds among people and provinces in Canada prior to the crisis to investigate the durability of fiscal federalism after the crisis.
Fiscal federalism concerns the revenues raised and expenditures made by the federal gov-ernment in the provinces and territories. Ottawa raises money in the jurisdictions primarily through taxes, such as the income tax, but also through smaller revenue sources such as the air travelers’ security charge. It spends in the provinces and territories through a number of programs. Sometimes the spending is through transfers directly to provincial and territor-ial governments, such as equalization payments to “have-not” provinces, designed to bring their fiscal capacity up to an acceptable national level.1 Shared-cost programs also involve direct federal transfers to other levels of government; as the name implies, the federal gov-ernment shares the cost of provincially run programs, most notably Medicare. Ottawa also directly spends on programs such as defence and on the wages of federal employees. In other cases, the expenditures are through social programs to provincial and territorial residents, such as employment insurance (EI) and Old Age Security (OAS), among a number of others.
This publication examines federal fiscal flows and the net transfers made by the federal government, in other words, the difference between federal revenues and expenditures in each of the provinces and territories. Fiscal federalism and net fiscal flows are more exten-sive than many imagine. The numbers illustrate the problems they will face as Canada moves past the current medical and economic crisis to face the resulting economic and fiscal challenges.
The study is meant as an accounting diagnostic, to describe the costs of fiscal federalism. A diagnostic is the first step towards analyzing possible problems and finding solutions to them. This is particularly important if, as the numbers suggest, the current shape of fiscal federalism may be difficult to sustain.
Data are shown for all provinces and territories but the commentary will focus on the Atlantic provinces, the greatest recipients on a per-capita basis; and Alberta, the largest contributor to fiscal federalism in recent years. The publication will also look at the costs to Ontario taxpayers, who will likely bear the costs of fiscal federalism going forward;
1. The equalization formula is complex and whether it achieves its aim is much debated. For example, MacKinnon argues that when equalization is considered in the context of other federal transfers, “have-not” provinces may be able to provide better services than “have” provinces in some cases (MacKinnon, 2011).

2 • Fiscal Federalism and the Dependency of Atlantic Canada • McMahon
fraserinstitute.org
and Quebec, the largest overall recipient, though not by much, as a result of its large population. These constraints are meant to keep the commentary manageable and avoid repeating the information that an interested reader can find in the tables, which contain the relevant data.
The scale of federal transfers is seldom understood. Both federal revenues and federal expenditures are unbalanced among the provinces, with several provinces, most notably the Atlantic Provinces and Quebec, receiving large net inflows of federal money while Alberta and Ontario see large net outflows. While COVID-19 adds to stresses on Canada’s system of fiscal federalism, concerns over the system have been raised for decades and have intensified as Alberta’s economy weakened. Alberta taxpayers have funded the lion’s share of the transfers for years. The problems facing Alberta reinforce questions over the fairness and sustainability of the systems. As David MacKinnon notes:
Public debate focuses on equalization but it is the sum total of all regional sub-sidy arrangements that is most important. When one considers the total regional subsidy effort, it is apparent that the economies of several provinces are to a large extent based on subsidy arrangements that are not transparent and that are the main determinants of overall economic activity in those provinces. (Mackinnon, 2011: 11)
To put things in perspective, flows are examined on a per-capita basis and as a percent-age of provincial Gross Domestic Product (GDP). The amounts are calculated in 2018 dollars, using the Consumer Price Index, as this is the most relevant deflator in terms of Canadians’ day-to-day lives.
The Appendix provides a breakdown of federal flows. While the main body of the paper focuses on the overall federal flows, the appendix analyzes flows in more detail and deducts military-related expenditures, which serve a national purpose, from spending in provinces. The federal government also transfers funds directly to individuals under a number of programs that are national rather than regional and serve all Canadians. These are also deducted from expenditures in this analysis, save for Employment Insurance (EI), which has a significant regional component. These deductions do not change the overall picture of large net transfers to Atlantic Canada and Quebec and from Alberta and Ontario, primarily. While this study aims to examine the overall impact of fiscal federalism and the flow of funds, the appendix and several of the tables enable readers to understand the structure at a close level.

McMahon • Fiscal Federalism and the Dependency of Atlantic Canada • 3
fraserinstitute.org
Overall federal spending
Virtually all federal expenditures and revenues occur within the provinces and territor-ies, so the overall federal deficit or surplus reflects the sum of the deficit or surplus in the provinces and territories.2 As noted above, federal expenditures include direct transfers to the provinces and territories; however, a federal deficit or surplus in a province or territory does not directly affect the balance sheet of the jurisdiction. It does affect the citizens. In a province where the federal government is in surplus—that is, a province where the federal government receives more in revenues than it spends—the citizens effectively get less in the way of government services than they pay for.
A federal deficit or surplus does affect the provincial government’s balance sheet indirectly. As often noted, there is only one taxpayer, not a separate federal or provincial or munici-pal taxpayer. Federal taxes reduce the taxation room available to the provinces and thus the expenditures or tax reductions they could otherwise afford. If the federal govern-ment is occupying some of that tax room to send funds to other provinces, a province in surplus will be losing revenues from the overall government pot and thus must have higher overall taxes, or increased borrowing, to support provincial services than it would if all revenues remained in the province.
The story in picturesBefore delving into the numbers, the best way to grasp the scale of fiscal federalism is through some pictures.3 As noted earlier, the focus in the text will be on Atlantic Canada and Alberta, rather than repeating all information the reader will see in the figures.
Figure 1 shows the net transfers per province from 2007 to 2019, which is the full time length of the current series on federal revenues and expenditures. For example, it shows that the net transfer from Alberta over this period was $280.4 billion in constant 2018 dollars. This reflects federal government revenues of $617.5 compared to expenditures of only $337.1 billion. On the other hand, net transfers to Atlantic Canada were $196.7 billion. Only $226.5 billion was raised in the region while Ottawa spent $423.2 billion. Equalization was $46.2 billion, about 11% of the total transfers to the region. In Quebec, net federal transfers equaled $200.3 billion but here equalization accounted for $116.2 billion, almost 60% of the net transfers to Quebec.
2. Both expenditures and revenues outside Canada are relatively small and could only make the difference between surplus or deficit if spending and revenues within Canada were near balance.3. Unless otherwise noted, all numbers are in inflation-adjusted 2018 dollars.

4 • Fiscal Federalism and the Dependency of Atlantic Canada • McMahon
fraserinstitute.org
Figure 2 shows net transfers per person. In Alberta, each resident on average saw a net transfer out of the province over the period of $71,563 or an average per year of $5,505. On a per-person basis, Ottawa spent $84,980 over the period but raised $156,471 in revenues, or an average of expenditures of $6,531 each year per Albertan while raising revenues of $12,036 on average.
In contrast, in Atlantic Canada, each resident on average saw a net transfer into the region over the period of $82,953 or an average of $6,381 per year. On a per-person basis, Ottawa spent $178,466 over the period but raised only $95,513 in revenues, or an average of expenditures of $13,728 per Atlantic Canadian while raising revenues of $7,347 per year on average.
Figure 3 shows the overall economic impact of fiscal federalism as a percentage of GDP. The net fiscal flow out of Alberta equaled 6.4% of the provincial GDP on average over the period, reflecting federal revenues equaling 14.1% of GDP with expenditures of 7.7% of GDP. The net fiscal flow into Atlantic Canada equaled 12.8% of the Atlantic economy, reflecting federal expenditures equaling 27.5% of the Atlantic economy with federal revenues equaling 14.7%.
-300
-250
-200
-150
-100
-50
0
50
100
150
200
QuebecAtlanticCanada
NovaScotia
NewBrunswick
Manitoba Newfoundland& Labrador
PrinceEdwardIsland
SaskatchewanBritishColumbia
OntarioAlberta
Figure 1: Net federal transfers and portion attributable to Equalization ($billions 2018), 2007–2019
Sources: Canada, Dep’t of Finance, 2020; Statistics Canada, 2020d; calculations by the author.
$ bi
llion
s 20
18
Net federal transfers
Portion attributable to Equalization

McMahon • Fiscal Federalism and the Dependency of Atlantic Canada • 5
fraserinstitute.org
-120,000
-100,000
-80,000
-60,000
-40,000
-20,000
0
20,000
40,000
60,000
80,000
Alberta BritishColumbia
Ontario SaskatchewanQuebec Newfoundland& Labrador
Manitoba AtlanticCanada
NewBrunswick
NovaScotia
PrinceEdward Island
Figure 2: Net federal transfers per person ($ 2018), 2007–2019, and average per person per year
Sources: Statistics Canada, 2020a, 2020d; calculations by the author.
$ 20
18Net federal transfers per person
Average per person per year
-10
-5
0
5
10
15
20
25
PrinceEdward Island
NovaScotia
NewBrunswick
AtlanticCanada
ManitobaNewfoundland& Labrador
QuebecSaskatchewanOntarioBritishColumbia
Alberta
Figure 3: Net federal transfers as a percentage of GDP, average 2007–2019
Sources: Statistics Canada, 2020c, 2020d; calculations by the author.
Perc
enta
ge

6 • Fiscal Federalism and the Dependency of Atlantic Canada • McMahon
fraserinstitute.org
The numbers
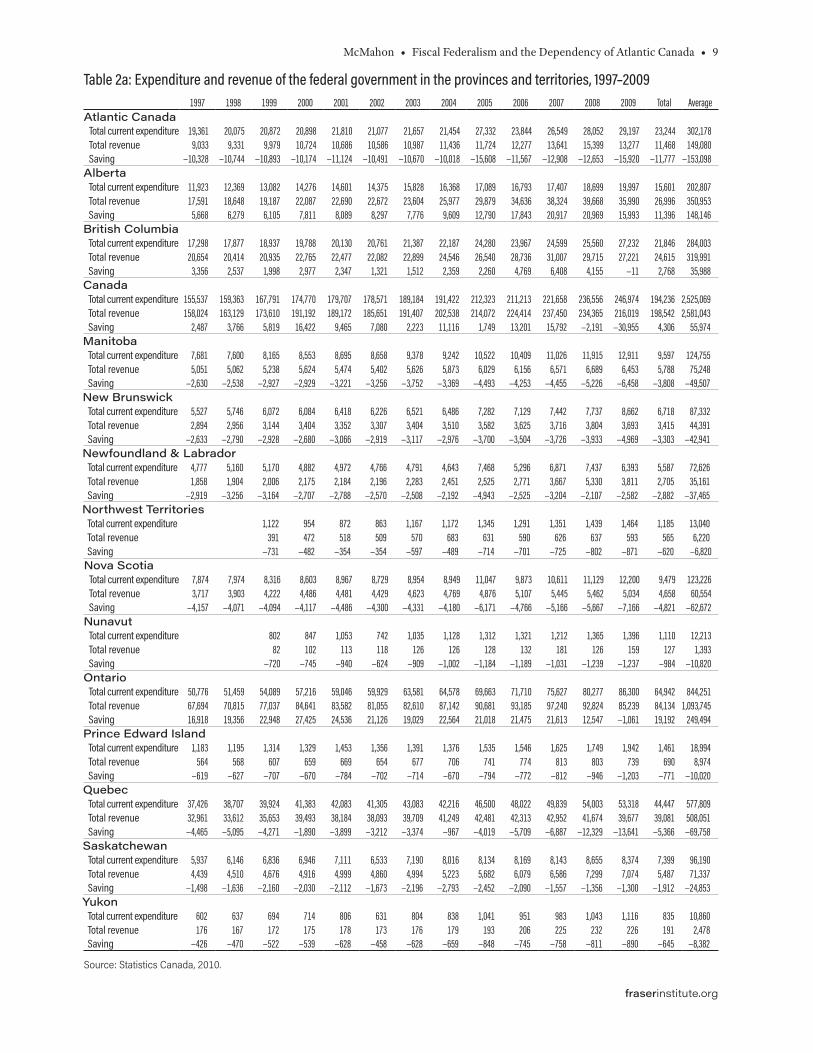
Expenditure and revenue, raw and adjusted for inflationTable 1a reports selected federal fiscal flows from 2007 to 2019 in raw, unadjusted num-bers; table 1b shows the same data adjusted for inflation. Table 2a reports flows from 1997 to 2009 with table 2b reporting the same data adjusted for inflation. Statistics Canada changed its method of calculation for the 2007–2019 series. Overlapping years show the overall flows differ slightly between the two calculations.
I employ the terminology used by Statistics Canada in the tables. Thus, in the 2007–2019 tables, the difference between federal spending and revenue in a jurisdiction is labeled
“Federal government surplus or deficit”. Deficits, in other words more spending than revenues, are marked by negative numbers; a surplus is recorded by a positive number. For the period from 1997 to 2007, this is labeled “Saving”. Deficits are indicated by par-entheses and surpluses by lack of parentheses.
To recap some of the information in the figures, first look at “Federal government surplus or deficit” in the 2007–2019 data in table 1a and in, table 2a, “Saving” in the 1997–2009 data. These series report the net transfer to the provinces, difference between federal revenues and expenditures in each province and territory or, in other words, the net flow of federal money into or out of the province or territory.
Over the 13 years of data in the current series from 2007 to 2019, in inflation-adjusted terms (table 1b), federal spending in Atlantic Canada exceeded federal revenue by $196.7 billion, while Quebec had net transfers of $200.3 billion. In other words, Ottawa spent $196.7 billion more in Atlantic Canada and $200.3 billion more in Quebec than it raised in revenues in these provinces. Alberta taxpayers were a net contributor of $280.4 billion over this period while Ontario, even though it was officially a have-not province receiv-ing equalization from 2009 to 2019, was a net contributor of $126.1 billion.4
Over this period, the federal government ran a $121.6 billion deficit, so on average federal spending in the provinces would be in deficit. However, this only emphasizes the scale of fiscal federalism. The combined difference between federal spending and revenue in Quebec and the Atlantic Provinces was $477.1 billion. In other words, the federal deficit in Quebec and the Atlantic Canada was almost three times the size of the total federal deficit through this period. Put another way, if federal spending in these jurisdictions equaled revenues raised, Canada would have been in a strong surplus position over the period (other things constant).
4. See MacKinnon, 2011 for an excellent overview of the impact of fiscal federalism on Ontario.

McMahon • Fiscal Federalism and the Dependency of Atlantic Canada • 7
fraserinstitute.org
Table 1a: Expenditure and revenue of the federal government in the provinces and territories, 2007–20192007 2008 2009 2010 2011 2012 2013 2014 2015 2016 2017 2018 2019 Average Total
Atlantic CanadaExpenditure 26,725 28,751 28,844 29,618 29,660 29,223 28,876 28,957 29,286 30,102 31,999 33,173 35,446 30,051 390,660Revenue 14,710 16,071 14,402 14,407 15,394 15,110 15,426 16,115 16,048 16,556 17,507 18,693 18,860 16,100 209,299Surplus or deficit −12,015 −12,680 −14,442 −15,211 −14,266 −14,113 −13,450 −12,842 −13,238 −13,546 −14,492 −14,480 −16,586 −13,951 −181,361
AlbertaExpenditure 18,080 19,262 20,790 22,147 21,985 22,140 22,611 22,933 24,950 27,342 29,293 29,755 31,814 24,085 313,102Revenue 40,281 41,766 38,476 38,757 39,873 41,375 46,129 49,989 49,706 43,301 43,869 47,219 49,616 43,874 570,357Surplus or deficit 22,201 22,504 17,686 16,610 17,888 19,235 23,518 27,056 24,756 15,959 14,576 17,464 17,802 19,789 257,255
British ColumbiaExpenditure 25,663 26,322 28,019 31,370 29,776 30,056 29,983 30,037 31,075 32,902 35,304 36,915 39,950 31,336 407,372Revenue 32,303 30,730 28,954 29,547 31,131 33,283 33,161 34,774 37,175 40,104 43,534 48,047 49,661 36,339 472,404Surplus or deficit 6,640 4,408 935 −1,823 1,355 3,227 3,178 4,737 6,100 7,202 8,230 11,132 9,711 5,002 65,032
CanadaExpenditure 231,178 244,417 255,014 275,099 271,647 271,483 273,502 274,094 282,834 295,670 314,900 326,909 350,410 282,089 3,667,157Revenue 246,104 240,976 226,301 229,780 245,703 252,380 261,667 275,229 287,521 293,186 312,261 337,187 351,857 273,858 3,560,152Surplus or deficit 14,926 −3,441 −28,713 −45,319 −25,944 −19,103 −11,835 1,135 4,687 −2,484 −2,639 10,278 1,447 −8,231 −107,005
ManitobaExpenditure 10,929 11,532 11,787 12,279 12,263 12,114 12,145 12,101 12,432 13,027 14,105 14,854 15,948 12,732 165,516Revenue 6,895 6,972 6,835 6,939 7,388 7,647 8,124 8,447 8,810 9,005 9,571 10,336 10,852 8,294 107,821Surplus or deficit −4,034 −4,560 −4,952 −5,340 −4,875 −4,467 −4,021 −3,654 −3,622 −4,022 −4,534 −4,518 −5,096 −4,438 −57,695
New BrunswickExpenditure 7,592 7,950 8,416 8,805 8,930 8,854 8,788 8,822 9,030 9,393 10,000 10,308 10,965 9,066 117,853Revenue 3,909 4,008 4,013 4,000 4,268 4,311 4,351 4,476 4,571 4,814 5,143 5,419 5,599 4,529 58,882Surplus or deficit −3,683 −3,942 −4,403 −4,805 −4,662 −4,543 −4,437 −4,346 −4,459 −4,579 −4,857 −4,889 −5,366 −4,536 −58,971
Newfoundland & LabradorExpenditure 6,403 7,210 6,752 6,876 6,558 5,994 5,656 5,840 5,703 5,868 6,298 6,302 6,857 6,332 82,317Revenue 4,086 5,515 4,166 4,276 4,677 4,304 4,437 4,756 4,464 4,477 4,677 4,761 4,833 4,571 59,429Surplus or deficit −2,317 −1,695 −2,586 −2,600 −1,881 −1,690 −1,219 −1,084 −1,239 −1,391 −1,621 −1,541 −2,024 −1,761 −22,888
Northwest TerritoriesExpenditure 1,502 1,540 1,670 1,696 1,684 1,715 1,743 1,954 2,007 2,091 2,191 2,258 2,485 1,887 24,536Revenue 702 718 693 650 780 719 656 650 612 544 531 515 530 638 8,300Surplus or deficit −800 −822 −977 −1,046 −904 −996 −1,087 −1,304 −1,395 −1,547 −1,660 −1,743 −1,955 −1,249 −16,236
Nova ScotiaExpenditure 11,043 11,789 11,736 11,935 12,227 12,470 12,467 12,402 12,620 12,786 13,436 14,171 15,015 12,623 164,097Revenue 5,947 5,822 5,524 5,424 5,682 5,698 5,829 6,071 6,157 6,352 6,704 7,446 7,330 6,153 79,986Surplus or deficit −5,096 −5,967 −6,212 −6,511 −6,545 −6,772 −6,638 −6,331 −6,463 −6,434 −6,732 −6,725 −7,685 −6,470 −84,111
NunavutExpenditure 1,231 1,391 1,430 1,500 1,557 1,652 1,752 1,757 1,805 1,862 1,936 2,008 2,101 1,691 21,982Revenue 214 164 200 228 258 269 278 287 292 301 327 347 364 271 3,529Surplus or deficit −1,017 −1,227 −1,230 −1,272 −1,299 −1,383 −1,474 −1,470 −1,513 −1,561 −1,609 −1,661 −1,737 −1,419 −18,453
OntarioExpenditure 81,223 84,598 90,187 100,023 98,185 98,231 99,330 98,303 100,890 105,167 111,126 116,355 125,150 100,674 1,308,768Revenue 99,387 93,651 87,662 89,212 97,194 99,502 101,866 107,184 114,388 121,510 131,110 140,399 146,445 109,962 1,429,510Surplus or deficit 18,164 9,053 −2,525 −10,811 −991 1,271 2,536 8,881 13,498 16,343 19,984 24,044 21,295 9,288 120,742
Prince Edward IslandExpenditure 1,687 1,802 1,940 2,002 1,945 1,905 1,965 1,893 1,933 2,055 2,265 2,392 2,609 2,030 26,393Revenue 768 726 699 707 767 797 809 812 856 913 983 1,067 1,098 846 11,002Surplus or deficit −919 −1,076 −1,241 −1,295 −1,178 −1,108 −1,156 −1,081 −1,077 −1,142 −1,282 −1,325 −1,511 −1,184 −15,391
QuebecExpenditure 51,320 55,871 57,292 60,509 60,717 60,207 61,106 62,487 64,292 66,336 71,077 72,884 77,620 63,209 821,718Revenue 44,348 42,845 41,016 42,025 44,948 45,428 46,363 47,576 50,249 52,010 55,608 60,717 64,142 49,021 637,275Surplus or deficit −6,972 −13,026 −16,276 −18,484 −15,769 −14,779 −14,743 −14,911 −14,043 −14,326 −15,469 −12,167 −13,478 −14,188 −184,443
SaskatchewanExpenditure 8,032 8,359 8,053 8,425 8,528 8,533 8,421 8,464 8,676 9,219 10,168 10,638 11,572 9,007 117,088Revenue 6,810 7,538 7,534 7,558 8,262 8,579 9,201 9,734 9,752 9,345 9,662 10,352 10,791 8,855 115,118Surplus or deficit −1,222 −821 −519 −867 −266 46 780 1,270 1,076 126 −506 −286 −781 −152 −1,970
YukonExpenditure 939 1,034 1,125 1,266 1,329 1,305 1,368 1,365 1,388 1,424 1,482 1,562 1,659 1,327 17,246Revenue 258 259 264 267 306 307 312 318 326 335 361 390 404 316 4,107Surplus or deficit −681 −775 −861 −999 −1023 −998 −1056 −1047 −1062 −1089 −1121 −1172 −1255 −1,011 −13,139
Source: Statistics Canada, 2019

8 • Fiscal Federalism and the Dependency of Atlantic Canada • McMahon
fraserinstitute.org
Table 1b: Expenditure and revenue of the federal government (adjusted for inflation, $2018), 2007–20192007 2008 2009 2010 2011 2012 2013 2014 2015 2016 2017 2018 2019 Average Total
Atlantic CanadaExpenditure 31,974 33,614 33,635 33,915 33,000 32,032 31,369 30,854 30,859 31,274 32,735 33,173 34,768 32,554 423,201Revenue 17,599 18,789 16,794 16,497 17,127 16,563 16,758 17,170 16,910 17,201 17,910 18,693 18,499 17,424 226,510Surplus or deficit −14,375 −14,825 −16,841 −17,418 −15,872 −15,470 −14,611 −13,683 −13,949 −14,073 −14,825 −14,480 −16,269 −15,130 −196,691
AlbertaExpenditure 21,631 22,520 24,243 25,360 24,460 24,268 24,563 24,435 26,290 28,407 29,967 29,755 31,206 25,931 337,105Revenue 48,193 48,831 44,866 44,379 44,362 45,353 50,111 53,263 52,376 44,987 44,878 47,219 48,667 47,499 617,486Surplus or deficit 26,562 26,311 20,623 19,020 19,902 21,084 25,548 28,828 26,086 16,580 14,911 17,464 17,462 21,568 280,381
British ColumbiaExpenditure 30,704 30,774 32,673 35,921 33,129 32,946 32,571 32,004 32,744 34,183 36,116 36,915 39,186 33,836 439,865Revenue 38,648 35,928 33,763 33,833 34,636 36,483 36,023 37,052 39,172 41,666 44,536 48,047 48,712 39,115 508,497Surplus or deficit 7,944 5,154 1,090 −2,087 1,508 3,537 3,452 5,047 6,428 7,482 8,419 11,132 9,525 5,279 68,632
CanadaExpenditure 276,584 285,760 297,368 315,006 302,233 297,583 297,110 292,046 298,026 307,184 322,145 326,909 343,711 304,743 3,961,664Revenue 294,442 281,737 263,886 263,113 273,368 276,643 284,254 293,255 302,964 304,603 319,445 337,187 345,130 295,387 3,840,027Surplus or deficit 17,858 −4,023 −33,482 −51,893 −28,865 −20,940 −12,857 1,209 4,939 −2,581 −2,700 10,278 1,419 −9,357 −121,637
ManitobaExpenditure 13,076 13,483 13,745 14,060 13,644 13,279 13,193 12,894 13,100 13,534 14,430 14,854 15,643 13,764 178,933Revenue 8,249 8,151 7,970 7,946 8,220 8,382 8,825 9,000 9,283 9,356 9,791 10,336 10,645 8,935 116,154Surplus or deficit −4,826 −5,331 −5,774 −6,115 −5,424 −4,896 −4,368 −3,893 −3,817 −4,179 −4,638 −4,518 −4,999 −4,829 −62,779
New BrunswickExpenditure 9,083 9,295 9,814 10,082 9,935 9,705 9,547 9,400 9,515 9,759 10,230 10,308 10,755 9,802 127,428Revenue 4,677 4,686 4,679 4,580 4,749 4,725 4,727 4,769 4,817 5,001 5,261 5,419 5,492 4,891 63,582Surplus or deficit −4,406 −4,609 −5,134 −5,502 −5,187 −4,980 −4,820 −4,631 −4,699 −4,757 −4,969 −4,889 −5,263 −4,911 −63,846
Newfoundland & LabradorExpenditure 7,661 8,430 7,873 7,873 7,296 6,570 6,144 6,222 6,009 6,097 6,443 6,302 6,726 6,896 89,647Revenue 4,889 6,448 4,858 4,896 5,204 4,718 4,820 5,067 4,704 4,651 4,785 4,761 4,741 4,965 64,541Surplus or deficit −2,772 −1,982 −3,015 −2,977 −2,093 −1,852 −1,324 −1,155 −1,306 −1,445 −1,658 −1,541 −1,985 −1,931 −25,106
Northwest TerritoriesExpenditure 1,797 1,800 1,947 1,942 1,874 1,880 1,893 2,082 2,115 2,172 2,241 2,258 2,437 2,034 26,440Revenue 840 839 808 744 868 788 713 693 645 565 543 515 520 699 9,081Surplus or deficit −957 −961 −1,139 −1,198 −1,006 −1,092 −1,181 −1,389 −1,470 −1,607 −1,698 −1,743 −1,918 −1,335 −17,359
Nova ScotiaExpenditure 13,212 13,783 13,685 13,666 13,604 13,669 13,543 13,214 13,298 13,284 13,745 14,171 14,728 13,662 177,602Revenue 7,115 6,807 6,441 6,211 6,322 6,246 6,332 6,469 6,488 6,599 6,858 7,446 7,190 6,656 86,524Surplus or deficit −6,097 −6,976 −7,244 −7,456 −7,282 −7,423 −7,211 −6,746 −6,810 −6,685 −6,887 −6,725 −7,538 −7,006 −91,079
NunavutExpenditure 1,473 1,626 1,668 1,718 1,732 1,811 1,903 1,872 1,902 1,935 1,981 2,008 2,061 1,822 23,688Revenue 256 192 233 261 287 295 302 306 308 313 335 347 357 292 3,791Surplus or deficit −1,217 −1,435 −1,434 −1,457 −1,445 −1,516 −1,601 −1,566 −1,594 −1,622 −1,646 −1,661 −1,704 −1,531 −19,898
OntarioExpenditure 97,176 98,908 105,166 114,533 109,240 107,675 107,904 104,741 106,309 109,262 113,683 116,355 122,757 108,747 1,413,709Revenue 118,908 109,492 102,221 102,153 108,137 109,068 110,659 114,204 120,532 126,242 134,126 140,399 143,645 118,445 1,539,787Surplus or deficit 21,732 10,584 −2,944 −12,379 −1,103 1,393 2,755 9,463 14,223 16,979 20,444 24,044 20,888 9,698 126,079
Prince Edward IslandExpenditure 2,018 2,107 2,262 2,292 2,164 2,088 2,135 2,017 2,037 2,135 2,317 2,392 2,559 2,194 28,524Revenue 919 849 815 810 853 874 879 865 902 949 1,006 1,067 1,077 913 11,863Surplus or deficit −1,100 −1,258 −1,447 −1,483 −1,311 −1,215 −1,256 −1,152 −1,135 −1,186 −1,311 −1,325 −1,482 −1,282 −16,660
QuebecExpenditure 61,400 65,322 66,807 69,287 67,553 65,995 66,381 66,580 67,745 68,919 72,712 72,884 76,136 68,286 887,721Revenue 53,059 50,092 47,828 48,121 50,009 49,795 50,365 50,692 52,948 54,035 56,887 60,717 62,916 52,882 687,465Surplus or deficit −8,341 −15,229 −18,979 −21,165 −17,544 −16,200 −16,016 −15,888 −14,797 −14,884 −15,825 −12,167 −13,220 −15,404 −200,256
SaskatchewanExpenditure 9,610 9,773 9,390 9,647 9,488 9,353 9,148 9,018 9,142 9,578 10,402 10,638 11,351 9,734 126,539Revenue 8,148 8,813 8,785 8,654 9,192 9,404 9,995 10,372 10,276 9,709 9,884 10,352 10,585 9,551 124,169Surplus or deficit −1,462 −960 −605 −993 −296 50 847 1,353 1,134 131 −518 −286 −766 −182 −2,370
YukonExpenditure 1,123 1,209 1,312 1,450 1,479 1,430 1,486 1,454 1,463 1,479 1,516 1,562 1,627 1,430 18,591Revenue 309 303 308 306 340 337 339 339 344 348 369 390 396 341 4,427Surplus or deficit −815 −906 −1,004 −1,144 −1,138 −1,094 −1,147 −1,116 −1,119 −1,131 −1,147 −1,172 −1,231 −1,090 −14,164
Sources: Statistics Canada, 2019, 2020b; calculations by the author.
McMahon • Fiscal Federalism and the Dependency of Atlantic Canada • 9
fraserinstitute.org
Table 2a: Expenditure and revenue of the federal government in the provinces and territories, 1997–20091997 1998 1999 2000 2001 2002 2003 2004 2005 2006 2007 2008 2009 Total Average
Atlantic Canada Total current expenditure 19,361 20,075 20,872 20,898 21,810 21,077 21,657 21,454 27,332 23,844 26,549 28,052 29,197 23,244 302,178Total revenue 9,033 9,331 9,979 10,724 10,686 10,586 10,987 11,436 11,724 12,277 13,641 15,399 13,277 11,468 149,080Saving −10,328 −10,744 −10,893 −10,174 −11,124 −10,491 −10,670 −10,018 −15,608 −11,567 −12,908 −12,653 −15,920 −11,777 −153,098
Alberta Total current expenditure 11,923 12,369 13,082 14,276 14,601 14,375 15,828 16,368 17,089 16,793 17,407 18,699 19,997 15,601 202,807Total revenue 17,591 18,648 19,187 22,087 22,690 22,672 23,604 25,977 29,879 34,636 38,324 39,668 35,990 26,996 350,953Saving 5,668 6,279 6,105 7,811 8,089 8,297 7,776 9,609 12,790 17,843 20,917 20,969 15,993 11,396 148,146
British ColumbiaTotal current expenditure 17,298 17,877 18,937 19,788 20,130 20,761 21,387 22,187 24,280 23,967 24,599 25,560 27,232 21,846 284,003Total revenue 20,654 20,414 20,935 22,765 22,477 22,082 22,899 24,546 26,540 28,736 31,007 29,715 27,221 24,615 319,991Saving 3,356 2,537 1,998 2,977 2,347 1,321 1,512 2,359 2,260 4,769 6,408 4,155 −11 2,768 35,988
Canada Total current expenditure 155,537 159,363 167,791 174,770 179,707 178,571 189,184 191,422 212,323 211,213 221,658 236,556 246,974 194,236 2,525,069Total revenue 158,024 163,129 173,610 191,192 189,172 185,651 191,407 202,538 214,072 224,414 237,450 234,365 216,019 198,542 2,581,043Saving 2,487 3,766 5,819 16,422 9,465 7,080 2,223 11,116 1,749 13,201 15,792 −2,191 −30,955 4,306 55,974
Manitoba Total current expenditure 7,681 7,600 8,165 8,553 8,695 8,658 9,378 9,242 10,522 10,409 11,026 11,915 12,911 9,597 124,755Total revenue 5,051 5,062 5,238 5,624 5,474 5,402 5,626 5,873 6,029 6,156 6,571 6,689 6,453 5,788 75,248Saving −2,630 −2,538 −2,927 −2,929 −3,221 −3,256 −3,752 −3,369 −4,493 −4,253 −4,455 −5,226 −6,458 −3,808 −49,507
New BrunswickTotal current expenditure 5,527 5,746 6,072 6,084 6,418 6,226 6,521 6,486 7,282 7,129 7,442 7,737 8,662 6,718 87,332Total revenue 2,894 2,956 3,144 3,404 3,352 3,307 3,404 3,510 3,582 3,625 3,716 3,804 3,693 3,415 44,391Saving −2,633 −2,790 −2,928 −2,680 −3,066 −2,919 −3,117 −2,976 −3,700 −3,504 −3,726 −3,933 −4,969 −3,303 −42,941
Newfoundland & LabradorTotal current expenditure 4,777 5,160 5,170 4,882 4,972 4,766 4,791 4,643 7,468 5,296 6,871 7,437 6,393 5,587 72,626Total revenue 1,858 1,904 2,006 2,175 2,184 2,196 2,283 2,451 2,525 2,771 3,667 5,330 3,811 2,705 35,161Saving −2,919 −3,256 −3,164 −2,707 −2,788 −2,570 −2,508 −2,192 −4,943 −2,525 −3,204 −2,107 −2,582 −2,882 −37,465
Northwest Territories Total current expenditure 1,122 954 872 863 1,167 1,172 1,345 1,291 1,351 1,439 1,464 1,185 13,040Total revenue 391 472 518 509 570 683 631 590 626 637 593 565 6,220Saving −731 −482 −354 −354 −597 −489 −714 −701 −725 −802 −871 −620 −6,820
Nova ScotiaTotal current expenditure 7,874 7,974 8,316 8,603 8,967 8,729 8,954 8,949 11,047 9,873 10,611 11,129 12,200 9,479 123,226Total revenue 3,717 3,903 4,222 4,486 4,481 4,429 4,623 4,769 4,876 5,107 5,445 5,462 5,034 4,658 60,554Saving −4,157 −4,071 −4,094 −4,117 −4,486 −4,300 −4,331 −4,180 −6,171 −4,766 −5,166 −5,667 −7,166 −4,821 −62,672
Nunavut Total current expenditure 802 847 1,053 742 1,035 1,128 1,312 1,321 1,212 1,365 1,396 1,110 12,213Total revenue 82 102 113 118 126 126 128 132 181 126 159 127 1,393Saving −720 −745 −940 −624 −909 −1,002 −1,184 −1,189 −1,031 −1,239 −1,237 −984 −10,820
Ontario Total current expenditure 50,776 51,459 54,089 57,216 59,046 59,929 63,581 64,578 69,663 71,710 75,627 80,277 86,300 64,942 844,251Total revenue 67,694 70,815 77,037 84,641 83,582 81,055 82,610 87,142 90,681 93,185 97,240 92,824 85,239 84,134 1,093,745Saving 16,918 19,356 22,948 27,425 24,536 21,126 19,029 22,564 21,018 21,475 21,613 12,547 −1,061 19,192 249,494
Prince Edward IslandTotal current expenditure 1,183 1,195 1,314 1,329 1,453 1,356 1,391 1,376 1,535 1,546 1,625 1,749 1,942 1,461 18,994Total revenue 564 568 607 659 669 654 677 706 741 774 813 803 739 690 8,974Saving −619 −627 −707 −670 −784 −702 −714 −670 −794 −772 −812 −946 −1,203 −771 −10,020
Quebec Total current expenditure 37,426 38,707 39,924 41,383 42,083 41,305 43,083 42,216 46,500 48,022 49,839 54,003 53,318 44,447 577,809Total revenue 32,961 33,612 35,653 39,493 38,184 38,093 39,709 41,249 42,481 42,313 42,952 41,674 39,677 39,081 508,051Saving −4,465 −5,095 −4,271 −1,890 −3,899 −3,212 −3,374 −967 −4,019 −5,709 −6,887 −12,329 −13,641 −5,366 −69,758
SaskatchewanTotal current expenditure 5,937 6,146 6,836 6,946 7,111 6,533 7,190 8,016 8,134 8,169 8,143 8,655 8,374 7,399 96,190Total revenue 4,439 4,510 4,676 4,916 4,999 4,860 4,994 5,223 5,682 6,079 6,586 7,299 7,074 5,487 71,337Saving −1,498 −1,636 −2,160 −2,030 −2,112 −1,673 −2,196 −2,793 −2,452 −2,090 −1,557 −1,356 −1,300 −1,912 −24,853
Yukon Total current expenditure 602 637 694 714 806 631 804 838 1,041 951 983 1,043 1,116 835 10,860Total revenue 176 167 172 175 178 173 176 179 193 206 225 232 226 191 2,478Saving −426 −470 −522 −539 −628 −458 −628 −659 −848 −745 −758 −811 −890 −645 −8,382
Source: Statistics Canada, 2010.

10 • Fiscal Federalism and the Dependency of Atlantic Canada • McMahon
fraserinstitute.org
Table 2b: Expenditure and revenue of the federal government (adjusted for inflation, $2018), 1997–20091997 1998 1999 2000 2001 2002 2003 2004 2005 2006 2007 2008 2009 Average Total
Atlantic Canada Total current expenditure 28,570 29,332 29,971 29,222 29,749 28,117 28,104 27,335 34,076 29,155 31,764 32,797 34,046 30,172 392,237Total revenue 13,330 13,634 14,329 14,996 14,576 14,122 14,257 14,571 14,617 15,011 16,320 18,004 15,482 14,865 193,248Saving −15,241 −15,698 −15,642 −14,227 −15,173 −13,995 −13,846 −12,764 −19,459 −14,143 −15,443 −14,793 −18,564 −15,307 −198,989
Alberta Total current expenditure 17,594 18,073 18,785 19,962 19,916 19,176 20,539 20,855 21,305 20,533 20,826 21,862 23,318 20,211 262,746Total revenue 25,958 27,247 27,552 30,885 30,949 30,244 30,630 33,098 37,251 42,351 45,851 46,378 41,967 34,643 450,361Saving 8,364 9,174 8,766 10,922 11,033 11,068 10,091 12,243 15,946 21,817 25,025 24,516 18,649 14,432 187,616
British ColumbiaTotal current expenditure 25,526 26,120 27,193 27,670 27,457 27,695 27,753 28,269 30,271 29,305 29,431 29,883 31,755 28,333 368,328Total revenue 30,478 29,827 30,062 31,833 30,659 29,457 29,715 31,274 33,088 35,136 37,097 34,741 31,742 31,932 415,111Saving 4,952 3,707 2,869 4,163 3,201 1,762 1,962 3,006 2,818 5,831 7,667 4,858 −13 3,599 46,783
Canada Total current expenditure 229,520 232,848 240,940 244,385 245,122 238,214 245,498 243,894 264,709 258,257 265,194 276,569 287,992 251,780 3,273,142Total revenue 233,190 238,351 249,296 267,348 258,032 247,658 248,382 258,057 266,890 274,398 284,088 274,008 251,896 257,815 3,351,595Saving 3,670 5,503 8,356 22,963 12,910 9,445 2,885 14,163 2,181 16,141 18,894 −2,562 −36,096 6,035 78,452
Manitoba Total current expenditure 11,335 11,104 11,725 11,960 11,860 11,550 12,170 11,775 13,118 12,727 13,192 13,930 15,055 12,423 161,501Total revenue 7,454 7,396 7,522 7,864 7,467 7,206 7,301 7,483 7,517 7,527 7,862 7,820 7,525 7,534 97,942Saving −3,881 −3,708 −4,203 −4,096 −4,393 −4,344 −4,869 −4,292 −5,602 −5,200 −5,330 −6,110 −7,531 −4,889 −63,559
New BrunswickTotal current expenditure 8,156 8,396 8,719 8,507 8,754 8,305 8,462 8,264 9,079 8,717 8,904 9,046 10,101 8,724 113,409Total revenue 4,271 4,319 4,515 4,760 4,572 4,412 4,417 4,472 4,466 4,432 4,446 4,447 4,306 4,449 57,835Saving −3,885 −4,077 −4,204 −3,748 −4,182 −3,894 −4,045 −3,792 −4,613 −4,284 −4,458 −4,598 −5,794 −4,275 −55,574
Newfoundland & LabradorTotal current expenditure 7,049 7,539 7,424 6,827 6,782 6,358 6,217 5,916 9,311 6,476 8,221 8,695 7,455 7,251 94,268Total revenue 2,742 2,782 2,881 3,041 2,979 2,929 2,963 3,123 3,148 3,388 4,387 6,232 4,444 3,464 45,038Saving −4,307 −4,757 −4,543 −3,785 −3,803 −3,428 −3,255 −2,793 −6,163 −3,087 −3,833 −2,463 −3,011 −3,787 −49,230
Northwest Territories Total current expenditure 1,611 1,334 1,189 1,151 1,514 1,493 1,677 1,579 1,616 1,682 1,707 1,273 16,555Total revenue 561 660 707 679 740 870 787 721 749 745 691 608 7,910Saving −1,050 −674 −483 −472 −775 −623 −890 −857 −867 −938 −1,016 −665 −8,645
Nova ScotiaTotal current expenditure 11,619 11,651 11,941 12,030 12,231 11,644 11,619 11,402 13,773 12,072 12,695 13,011 14,226 12,301 159,916Total revenue 5,485 5,703 6,063 6,273 6,112 5,908 5,999 6,076 6,079 6,244 6,514 6,386 5,870 6,055 78,713Saving −6,134 −5,948 −5,879 −5,757 −6,119 −5,736 −5,620 −5,326 −7,694 −5,828 −6,181 −6,626 −8,356 −6,246 −81,203
Nunavut Total current expenditure 1,152 1,184 1,436 990 1,343 1,437 1,636 1,615 1,450 1,596 1,628 1,190 15,467Total revenue 118 143 154 157 164 161 160 161 217 147 185 136 1,766Saving −1,034 −1,042 −1,282 −832 −1,180 −1,277 −1,476 −1,454 −1,234 −1,449 −1,442 −1,054 −13,701
Ontario Total current expenditure 74,928 75,188 77,669 80,006 80,539 79,945 82,507 82,280 86,851 87,682 90,481 93,856 100,633 84,044 1,092,566Total revenue 99,894 103,469 110,621 118,355 114,007 108,127 107,200 111,029 113,055 113,940 116,339 108,525 99,396 109,535 1,423,958Saving 24,965 28,281 32,952 38,349 33,467 28,182 24,693 28,749 26,204 26,258 25,858 14,669 −1,237 25,492 331,392
Prince Edward IslandTotal current expenditure 1,746 1,746 1,887 1,858 1,982 1,809 1,805 1,753 1,914 1,890 1,944 2,045 2,265 1,896 24,644Total revenue 832 830 872 921 913 872 879 900 924 946 973 939 862 897 11,662Saving −913 −916 −1,015 −937 −1,069 −936 −927 −854 −990 −944 −971 −1,106 −1,403 −999 −12,982
Quebec Total current expenditure 55,228 56,555 57,329 57,867 57,402 55,101 55,907 53,788 57,973 58,718 59,628 63,138 62,173 57,754 750,807Total revenue 48,639 49,111 51,196 55,224 52,083 50,816 51,529 52,556 52,962 51,737 51,388 48,723 46,267 50,941 662,233Saving −6,589 −7,444 −6,133 −2,643 −5,318 −4,285 −4,378 −1,232 −5,011 −6,981 −8,240 −14,414 −15,907 −6,813 −88,574
SaskatchewanTotal current expenditure 8,761 8,980 9,816 9,713 9,699 8,715 9,330 10,213 10,141 9,988 9,742 10,119 9,765 9,614 124,984Total revenue 6,550 6,590 6,715 6,874 6,819 6,483 6,481 6,655 7,084 7,433 7,880 8,534 8,249 7,103 92,345Saving −2,211 −2,390 −3,102 −2,839 −2,881 −2,232 −2,850 −3,559 −3,057 −2,556 −1,863 −1,585 −1,516 −2,511 −32,639
Yukon Total current expenditure 888 931 997 998 1,099 842 1,043 1,068 1,298 1,163 1,176 1,219 1,301 1,079 14,024Total revenue 260 244 247 245 243 231 228 228 241 252 269 271 264 248 3,222Saving −629 −687 −750 −754 −857 −611 −815 −840 −1,057 −911 −907 −948 −1,038 −831 −10,802
Sources: Statistics Canada, 2010, 2019, 2020b; calculations by the author.

McMahon • Fiscal Federalism and the Dependency of Atlantic Canada • 11
fraserinstitute.org
A similar pattern occurs in the 1997–2007 period, though with one significant difference. Net transfers to Atlantic Canada over the period equal $199.0 billion in 2018 dollars while Quebec received $88.6 billion, less than half the total amount received by the Atlantic provinces, despite a population three and a half times as large.5 Alberta’s net contribu-tion was $187.6 billion and Ontario’s was $331.4 billion.
Through the earlier period, federal revenues overall exceeded expenditures by $78.5 bil-lion so on average federal spending in the provinces would have been in a surplus pos-ition, but the deficit in Quebec and the Atlantic provinces combined was $287.6, three times the overall surplus, and thus leading to large federal net outflows from Alberta and Ontario despite the overall surplus.
Expenditure and revenue per capitaTable 3a, 2007 to 2019, and table 3b, 1997 to 2009, report the same data in per-capita 2018 dollars. These are the key tables for overall expenditure and revenue data, with the focus on table 3a, 2007 to 2019. The table for 1997 to 2007 provides a longer-term con-text but, as a result of the change in accounting practices by Statistics Canada, the two series differ slightly, as noted.6
From 2007 to 2019, federal spending in Atlantic Canada exceeded federal revenue by $6,381 per year, per person on average. In Alberta, over the same period, federal rev-enue exceeded federal spending by $5,505 per person on average each year. The table also shows the sharp fall-off in Alberta’s net contribution in recent years. Per-person net transfers to Quebec were much lower, $1,907 per person on average.
The net per-capita contribution from Ontario taxpayers over this period averaged $700 per person annually or $9,102 per person over the full period. However, this represented a period of relative weakness in Ontario, a recipient of equalization for most of the years. The average contribution of Ontario taxpayers from 1997 to 2009 (table 3b) was $2,121 per person annually or $27,573 per person for the full period.
From 1997 to 2009, on a per-person basis in Atlantic Canada. federal spending exceeded revenue by $84,879 or an average of $6,529 a year. In Quebec, the total per-person sub-sidy was $11,698 or $900 a year on average. In Alberta, net revenue exceeded expendi-tures by $57,006 per person or an average of $4,385 a year.
5. Please note the early series and the later series overlap in 2007, 2008, and 2009.6. The last two lines in each province, “Adjusted for defence” and “Adj. for defence/household”, are discussed in the appendix.

12 • Fiscal Federalism and the Dependency of Atlantic Canada • McMahon
fraserinstitute.org
Table 3a: Expenditure and revenue per capita ($2018) of the federal government, 2007–20192007 2008 2009 2010 2011 2012 2013 2014 2015 2016 2017 2018 2019 Average Total
Atlantic Canada Expenditure 13,739 14,408 14,344 14,378 13,930 13,499 13,235 13,019 13,032 13,126 13,662 13,767 14,327 13,728 178,466
Revenue 7,562 8,053 7,162 6,994 7,230 6,980 7,070 7,245 7,141 7,219 7,475 7,758 7,623 7,347 95,513
Surplus or deficit −6,177 −6,354 −7,182 −7,384 −6,700 −6,519 −6,164 −5,774 −5,891 −5,907 −6,188 −6,009 −6,704 −6,381 −82,953
Adjusted for defence −5,206 −5,332 −6,180 −6,370 −5,632 −5,435 −5,106 −4,737 −4,841 −4,869 −5,113 −4,970 −5,672 −5,343 −69,463
Adj. for defence/household −4,841 −4,925 −5,695 −5,868 −5,130 −4,902 −4,548 −4,178 −4,270 −4,258 −4,438 −4,336 −4,975 −4,797 −62,366
Alberta Expenditure 6,155 6,263 6,590 6,795 6,456 6,264 6,170 5,984 6,343 6,770 7,062 6,919 7,139 6,531 84,908
Revenue 13,714 13,580 12,195 11,891 11,708 11,705 12,587 13,043 12,637 10,721 10,576 10,979 11,133 12,036 156,471
Surplus or deficit 7,558 7,317 5,606 5,096 5,253 5,442 6,417 7,059 6,294 3,951 3,514 4,061 3,995 5,505 71,563
Adjusted for defence 7,513 7,274 5,562 4,990 5,130 5,309 6,282 6,922 6,143 3,797 3,351 3,900 3,827 5,385 70,000
Adj. for defence/household 7,299 7,042 5,241 4,659 4,813 4,989 5,981 6,602 5,799 3,380 2,925 3,508 3,399 5,049 65,636
British ColumbiaExpenditure 7,155 7,076 7,408 8,044 7,358 7,214 7,035 6,799 6,855 7,035 7,334 7,381 7,727 7,263 94,422
Revenue 9,007 8,261 7,655 7,577 7,693 7,989 7,780 7,871 8,201 8,575 9,044 9,607 9,605 8,374 108,865
Surplus or deficit 1,851 1,185 247 −467 335 775 746 1,072 1,346 1,540 1,710 2,226 1,878 1,111 14,443
Adjusted for defence 1,643 957 36 −689 99 549 531 863 1,138 1,329 1,487 2,009 1,663 893 11,615
Adj. for defence/household 1,699 1,000 59 −662 136 582 558 877 1,130 1,301 1,464 2,001 1,668 909 11,815
Canada Expenditure 8,410 8,595 8,843 9,264 8,801 8,572 8,469 8,241 8,347 8,507 8,815 8,822 9,144 8,679 112,830
Revenue 8,953 8,474 7,847 7,738 7,961 7,969 8,102 8,275 8,486 8,436 8,742 9,099 9,182 8,405 109,262
Surplus or deficit 543 −121 −996 −1,526 −841 −603 −366 34 138 −71 −74 277 38 −274 −3,568
Adjusted for defence 543 −121 −996 −1,526 −841 −603 −366 34 138 −71 −74 277 38 −274 −3,568
Adj. for defence/household 543 −121 −996 −1,526 −841 −603 −366 34 138 −71 −74 277 38 −274 −3,568
Manitoba Expenditure 10,993 11,256 11,373 11,517 11,060 10,623 10,433 10,081 10,137 10,299 10,808 10,975 11,423 10,845 140,979
Revenue 6,935 6,805 6,595 6,509 6,663 6,706 6,979 7,037 7,184 7,119 7,334 7,637 7,773 7,021 91,276
Surplus or deficit −4,058 −4,451 −4,778 −5,009 −4,397 −3,917 −3,454 −3,044 −2,953 −3,180 −3,474 −3,338 −3,650 −3,823 −49,703
Adjusted for defence −3,993 −4,386 −4,658 −4,931 −4,358 −3,842 −3,384 −2,984 −2,909 −3,150 −3,442 −3,318 −3,643 −3,769 −49,001
Adj. for defence/household −3,681 −4,069 −4,382 −4,655 −4,112 −3,613 −3,163 −2,793 −2,699 −2,936 −3,216 −3,075 −3,390 −3,522 −45,783
New BrunswickExpenditure 12,185 12,445 13,086 13,389 13,147 12,797 12,585 12,385 12,539 12,784 13,342 13,371 13,845 12,915 167,901
Revenue 6,274 6,274 6,240 6,082 6,284 6,231 6,231 6,284 6,347 6,552 6,862 7,029 7,070 6,443 83,759
Surplus or deficit −5,911 −6,171 −6,846 −7,306 −6,864 −6,566 −6,354 −6,101 −6,192 −6,232 −6,480 −6,342 −6,776 −6,472 −84,141
Adjusted for defence −5,379 −5,623 −6,186 −6,587 −6,165 −5,814 −5,631 −5,413 −5,516 −5,556 −5,746 −5,647 −6,095 −5,797 −75,360
Adj. for defence/household −5,020 −5,221 −5,708 −6,092 −5,676 −5,301 −5,131 −4,906 −4,993 −4,977 −5,097 −5,049 −5,439 −5,278 −68,609
Newfoundland & LabradorExpenditure 15,049 16,477 15,236 15,083 13,898 12,483 11,656 11,781 11,379 11,515 12,194 11,990 12,896 13,203 171,639
Revenue 9,603 12,604 9,401 9,380 9,912 8,963 9,144 9,595 8,907 8,786 9,056 9,058 9,090 9,500 123,497
Surplus or deficit −5,446 −3,874 −5,835 −5,703 −3,986 −3,520 −2,512 −2,187 −2,472 −2,730 −3,139 −2,932 −3,807 −3,703 −48,142
Adjusted for defence −5,675 −4,093 −6,047 −5,923 −4,206 −3,749 −2,733 −2,386 −2,673 −2,931 −3,352 −3,140 −4,014 −3,917 −50,921
Adj. for defence/household −5,270 −3,636 −5,517 −5,372 −3,608 −3,096 −1,999 −1,661 −1,933 −2,153 −2,521 −2,430 −3,183 −3,260 −42,380
Northwest Territories Expenditure 41,433 41,524 45,124 44,866 43,067 43,069 43,225 47,443 47,806 48,656 49,911 50,227 54,377 46,210 600,727
Revenue 19,365 19,360 18,725 17,195 19,948 18,056 16,268 15,782 14,578 12,658 12,096 11,456 11,597 15,930 207,085
Surplus or deficit −22,068 −22,164 −26,399 −27,671 −23,119 −25,013 −26,956 −31,661 −33,228 −35,997 −37,815 −38,771 −42,779 −30,280 −393,642
Adjusted for defence −21,325 −21,439 −25,604 −26,958 −22,299 −24,297 −26,209 −30,927 −32,497 −35,274 −37,052 −38,043 −42,048 −29,536 −383,973
Adj. for defence/household 1,248 1,495 −547 −597 −522 −684 −732 −496 −535 −556 −577 −513 −493 −270 −3,509

McMahon • Fiscal Federalism and the Dependency of Atlantic Canada • 13
fraserinstitute.org
Table 3a, cont’d: Expenditure and revenue per capita ($2018) of the federal government, 2007–20192007 2008 2009 2010 2011 2012 2013 2014 2015 2016 2017 2018 2019 Average Total
Nova ScotiaExpenditure 14,129 14,727 14,586 14,506 14,407 14,485 14,401 14,080 14,199 14,090 14,462 14,769 15,162 14,462 188,003
Revenue 7,609 7,273 6,866 6,592 6,695 6,619 6,733 6,892 6,927 7,000 7,216 7,760 7,402 7,045 91,584
Surplus or deficit −6,520 −7,454 −7,721 −7,914 −7,712 −7,866 −7,668 −7,187 −7,272 −7,090 −7,246 −7,009 −7,760 −7,417 −96,419
Adjusted for defence −4,387 −5,199 −5,607 −5,809 −5,448 −5,585 −5,431 −4,987 −5,028 −4,877 −4,983 −4,817 −5,585 −5,211 −67,743
Adj. for defence/household −4,060 −4,834 −5,164 −5,346 −5,002 −5,112 −4,934 −4,487 −4,521 −4,341 −4,386 −4,202 −4,928 −4,717 −61,315
Nunavut Expenditure 46,911 50,994 51,155 51,499 50,664 52,227 53,859 52,044 52,125 52,319 52,731 52,650 53,142 51,717 672,321
Revenue 8,155 6,012 7,155 7,828 8,395 8,504 8,546 8,501 8,432 8,458 8,907 9,098 9,207 8,246 107,199
Surplus or deficit −38,756 −44,981 −44,000 −43,671 −42,269 −43,723 −45,313 −43,543 −43,693 −43,862 −43,825 −43,551 −43,935 −43,471 −565,123
Adjusted for defence −39,033 −45,275 −44,289 −43,972 −42,581 −44,054 −45,628 −43,853 −44,011 −44,188 −44,130 −43,847 −44,213 −43,775 −569,074
Adj. for defence/household −38,865 −44,038 −44,636 −44,237 −42,915 −44,433 −46,045 −44,405 −44,372 −44,555 −44,429 −44,179 −44,638 −43,981 −571,748
Ontario Expenditure 7,613 7,677 8,091 8,719 8,237 8,041 7,987 7,692 7,756 7,875 8,078 8,126 8,427 8,024 104,318
Revenue 9,315 8,499 7,864 7,777 8,154 8,145 8,190 8,387 8,793 9,098 9,531 9,805 9,861 8,725 113,420
Surplus or deficit 1,702 822 −227 −942 −83 104 204 695 1,038 1,224 1,453 1,679 1,434 700 9,102
Adjusted for defence 1,740 869 −195 −882 −1 180 274 764 1,102 1,292 1,528 1,754 1,516 765 9,940
Adj. for defence/household 1,622 734 −281 −967 −85 97 190 688 1,032 1,226 1,452 1,701 1,453 682 8,861
Prince Edward IslandExpenditure 14,656 15,184 16,171 16,183 15,032 14,448 14,814 13,979 14,091 14,527 15,398 15,575 16,306 15,105 196,364
Revenue 6,672 6,118 5,827 5,715 5,928 6,045 6,099 5,996 6,240 6,454 6,683 6,947 6,862 6,276 81,585
Surplus or deficit −7,984 −9,067 −10,345 −10,468 −9,104 −8,403 −8,715 −7,983 −7,851 −8,073 −8,715 −8,627 −9,443 −8,829 −114,779
Adjusted for defence −8,096 −9,235 −10,480 −10,601 −9,239 −8,601 −8,900 −8,154 −8,006 −8,235 −8,884 −8,795 −9,625 −8,989 −116,853
Adj. for defence/household −7,591 −8,702 −9,846 −9,986 −8,653 −8,013 −8,284 −7,552 −7,394 −7,581 −8,149 −8,110 −8,932 −8,369 −108,795
Quebec Expenditure 7,981 8,416 8,518 8,738 8,439 8,187 8,184 8,169 8,287 8,378 8,762 8,689 8,973 8,440 109,721
Revenue 6,897 6,454 6,098 6,069 6,247 6,177 6,210 6,220 6,477 6,569 6,855 7,239 7,415 6,533 84,925
Surplus or deficit −1,084 −1,962 −2,420 −2,669 −2,192 −2,010 −1,975 −1,949 −1,810 −1,809 −1,907 −1,451 −1,558 −1,907 −24,796
Adjusted for defence −1,316 −2,213 −2,661 −2,911 −2,461 −2,272 −2,220 −2,181 −2,024 −2,020 −2,131 −1,667 −1,775 −2,142 −27,852
Adj. for defence/household −1,294 −2,172 −2,603 −2,855 −2,407 −2,216 −2,166 −2,111 −1,945 −1,905 −2,013 −1,609 −1,709 −2,077 −27,003
SaskatchewanExpenditure 9,590 9,606 9,075 9,175 8,901 8,630 8,318 8,103 8,155 8,431 9,038 9,147 9,665 8,910 115,834
Revenue 8,131 8,662 8,490 8,231 8,623 8,677 9,089 9,319 9,167 8,547 8,588 8,901 9,012 8,726 113,436
Surplus or deficit −1,459 −943 −585 −944 −278 47 770 1,216 1,011 115 −450 −246 −652 −184 −2,398
Adjusted for defence −1,766 −1,274 −917 −1,307 −656 −315 419 866 654 −246 −830 −614 −1,026 −539 −7,011
Adj. for defence/household −1,254 −699 −639 −1,050 −422 −106 610 1,006 809 −124 −713 −471 −859 −301 −3,912
Yukon Expenditure 34,510 36,541 38,891 41,902 41,756 39,478 40,691 39,163 38,805 38,380 38,198 38,462 39,832 38,970 506,611
Revenue 9,482 9,153 9,127 8,837 9,614 9,287 9,280 9,124 9,114 9,029 9,305 9,603 9,700 9,281 120,655
Surplus or deficit −25,028 −27,388 −29,765 −33,065 −32,142 −30,191 −31,411 −30,039 −29,691 −29,351 −28,894 −28,858 −30,132 −29,689 −385,956
Adjusted for defence −25,499 −27,906 −30,272 −33,575 −32,654 −30,685 −31,913 −30,530 −30,185 −29,850 −29,421 −29,394 −30,666 −30,196 −392,550
Adj. for defence/household −24,732 −27,549 −30,314 −33,562 −32,628 −30,681 −31,992 −30,665 −30,210 −29,924 −29,639 −29,675 −30,823 −30,184 −392,393
Note: the rows, “Adjusted for defence” and “Adj. for defence/household”, show adjustments of net transfers.Sources: Statistics Canada, 2019, 2020a; calculations by the author.

14 • Fiscal Federalism and the Dependency of Atlantic Canada • McMahon
fraserinstitute.org
Table 3b: Expenditure and revenue per capita (adjusted for inflation, $2018), 1997–20091997 1998 1999 2000 2001 2002 2003 2004 2005 2006 2007 2008 2009 Average Total
Atlantic Canada Total current expenditure 12,045 12,439 12,732 12,441 12,708 12,011 11,995 11,661 14,572 12,502 13,648 14,057 14,520 12,941 167,333 Total revenue 5,620 5,782 6,087 6,384 6,226 6,033 6,086 6,216 6,251 6,437 7,012 7,717 6,603 6,343 82,453 Saving −6,425 −6,657 −6,645 −6,057 −6,481 −5,978 −5,910 −5,445 −8,322 −6,065 −6,636 −6,341 −7,917 −6,529 −84,879
Alberta Total current expenditure 6,217 6,234 6,362 6,645 6,512 6,130 6,453 6,439 6,414 6,001 5,926 6,080 6,338 6,289 81,752 Total revenue 9,173 9,399 9,331 10,281 10,120 9,668 9,623 10,220 11,214 12,378 13,048 12,898 11,407 10,674 138,758 Saving 2,956 3,165 2,969 3,636 3,608 3,538 3,170 3,780 4,800 6,377 7,121 6,818 5,069 4,385 57,006
British ColumbiaTotal current expenditure 6,465 6,558 6,779 6,850 6,735 6,754 6,729 6,803 7,214 6,909 6,859 6,871 7,200 6,825 88,724 Total revenue 7,719 7,488 7,494 7,881 7,520 7,184 7,205 7,526 7,886 8,283 8,645 7,988 7,197 7,693 100,015 Saving 1,254 931 715 1,031 785 430 476 723 671 1,375 1,787 1,117 −3 869 11,291
Canada Total current expenditure 7,675 7,722 7,925 7,964 7,902 7,596 7,758 7,636 8,210 7,929 8,063 8,319 8,564 7,943 103,262 Total revenue 7,797 7,904 8,200 8,712 8,318 7,897 7,849 8,079 8,277 8,425 8,638 8,242 7,490 8,141 105,830 Saving 123 182 275 748 416 301 91 443 68 496 574 −77 −1,073 198 2,568
Manitoba Total current expenditure 9,976 9,762 10,263 10,424 10,300 9,985 10,459 10,037 11,133 10,753 11,091 11,630 12,457 10,636 138,271 Total revenue 6,561 6,502 6,584 6,854 6,484 6,230 6,274 6,378 6,379 6,360 6,609 6,529 6,226 6,459 83,972 Saving −3,416 −3,260 −3,679 −3,570 −3,816 −3,755 −4,184 −3,659 −4,754 −4,394 −4,481 −5,101 −6,231 −4,177 −54,300
New BrunswickTotal current expenditure 10,838 11,186 11,616 11,335 11,675 11,083 11,291 11,027 12,136 11,691 11,944 12,111 13,468 11,646 151,404 Total revenue 5,675 5,755 6,015 6,342 6,098 5,887 5,894 5,967 5,970 5,945 5,964 5,955 5,742 5,939 77,208 Saving −5,163 −5,432 −5,601 −4,993 −5,577 −5,196 −5,397 −5,060 −6,167 −5,746 −5,980 −6,157 −7,726 −5,707 −74,196
Newfoundland & LabradorTotal current expenditure 12,796 13,966 13,920 12,930 12,991 12,239 11,992 11,433 18,102 12,683 16,149 16,996 14,426 13,894 180,622 Total revenue 4,977 5,153 5,401 5,761 5,706 5,639 5,714 6,035 6,121 6,636 8,618 12,181 8,600 6,657 86,542 Saving −7,819 −8,813 −8,519 −7,170 −7,285 −6,600 −6,277 −5,398 −11,982 −6,047 −7,530 −4,815 −5,826 −7,237 −94,079
Northwest Territories Total current expenditure 39,646 32,955 29,120 27,608 35,549 34,482 38,637 36,558 37,267 38,801 39,558 35,471 390,181 Total revenue 13,816 16,305 17,298 16,284 17,363 20,095 18,126 16,707 17,268 17,176 16,023 16,951 186,461 Saving −25,830 −16,650 −11,822 −11,325 −18,186 −14,387 −20,511 −19,851 −19,999 −21,625 −23,535 −18,520 −203,719
Nova ScotiaTotal current expenditure 12,462 12,503 12,788 12,882 13,117 12,452 12,391 12,134 14,684 12,872 13,576 13,903 15,163 13,148 170,926 Total revenue 5,883 6,120 6,492 6,717 6,555 6,318 6,398 6,466 6,481 6,658 6,966 6,823 6,257 6,472 84,135 Saving −6,579 −6,383 −6,296 −6,165 −6,562 −6,134 −5,993 −5,668 −8,203 −6,214 −6,610 −7,079 −8,907 −6,676 −86,792
Nunavut Total current expenditure 42,939 43,071 51,054 34,343 45,805 48,136 53,914 52,420 46,187 50,040 49,939 47,077 517,850 Total revenue 4,390 5,187 5,479 5,462 5,576 5,377 5,260 5,238 6,898 4,619 5,688 5,379 59,173 Saving −38,549 −37,885 −45,575 −28,881 −40,228 −42,759 −48,654 −47,182 −39,290 −45,421 −44,251 −41,698 −458,677
Ontario Total current expenditure 6,674 6,615 6,751 6,848 6,769 6,610 6,738 6,640 6,932 6,925 7,088 7,285 7,742 6,894 89,618 Total revenue 8,897 9,103 9,615 10,130 9,582 8,940 8,755 8,960 9,024 8,999 9,114 8,424 7,647 9,015 117,190 Saving 2,224 2,488 2,864 3,282 2,813 2,330 2,017 2,320 2,092 2,074 2,026 1,139 −95 2,121 27,573
Prince Edward IslandTotal current expenditure 12,827 12,857 13,845 13,617 14,502 13,215 13,154 12,734 13,861 13,711 14,118 14,738 16,188 13,797 179,367 Total revenue 6,115 6,111 6,396 6,752 6,677 6,374 6,402 6,533 6,691 6,865 7,063 6,766 6,160 6,531 84,906 Saving −6,712 −6,746 −7,449 −6,865 −7,825 −6,842 −6,752 −6,200 −7,170 −6,847 −7,055 −7,971 −10,028 −7,266 −94,461
Quebec Total current expenditure 7,592 7,752 7,828 7,866 7,761 7,404 7,468 7,138 7,647 7,694 7,751 8,134 7,927 7,689 99,962 Total revenue 6,686 6,731 6,991 7,506 7,042 6,829 6,884 6,974 6,986 6,779 6,680 6,277 5,899 6,790 88,264 Saving −906 −1,020 −837 −359 −719 −576 −585 −164 −661 −915 −1,071 −1,857 −2,028 −900 −11,698
SaskatchewanTotal current expenditure 8,607 8,827 9,676 9,640 9,697 8,743 9,364 10,241 10,207 10,066 9,722 9,946 9,436 9,552 124,172 Total revenue 6,435 6,477 6,618 6,823 6,817 6,504 6,504 6,673 7,130 7,491 7,863 8,388 7,971 7,053 91,694 Saving −2,172 −2,350 −3,057 −2,817 −2,880 −2,239 −2,860 −3,568 −3,077 −2,575 −1,859 −1,558 −1,465 −2,498 −32,478
Yukon Total current expenditure 27,938 29,880 32,371 32,809 36,454 27,748 33,720 33,944 40,682 36,032 36,127 36,860 38,580 34,088 443,145 Total revenue 8,168 7,834 8,023 8,041 8,051 7,608 7,381 7,251 7,542 7,805 8,269 8,199 7,813 7,845 101,984 Saving −19,770 −22,046 −24,348 −24,767 −28,404 −20,140 −26,338 −26,693 −33,140 −28,227 −27,858 −28,661 −30,767 −26,243 −341,160
Sources: Statistics Canada, 2010, 2020a; calculations by the author.

McMahon • Fiscal Federalism and the Dependency of Atlantic Canada • 15
fraserinstitute.org
Expenditure and revenue as a percentage of provincial GDPThe magnitude of the differences in federal spending as a proportion of provincial GDP is also large (table 4a and table 4b). For Atlantic Canada, federal expenditures equal an average 27.5% of GDP from 2007 to 2019, with net transfers equal to 12.8% of GDP. Federal transfers are less significant in Quebec. On average, expenditures equal 17.1% of GDP with net transfers equaling 3.9% of GDP.
In Alberta, over the period federal spending averaged only 7.7% of GDP while revenue equaled 14.1% of GDP, so federal net transfers took an amount equal to 6.4% of GDP out of the province. For Ontario, federal expenditure equaled 14.1% of GDP while revenue equaled 15.3% of GDP.
Table 3b reports the same data for the period from 1997 to 2009. While the contribu-tions of Ontario’s taxpayers have been relatively low in recent years as a result of its own economic weakness and the strength of Alberta’s economy, it was much higher in the earlier period, reaching a net transfer out of the province of 6.1% of GDP.
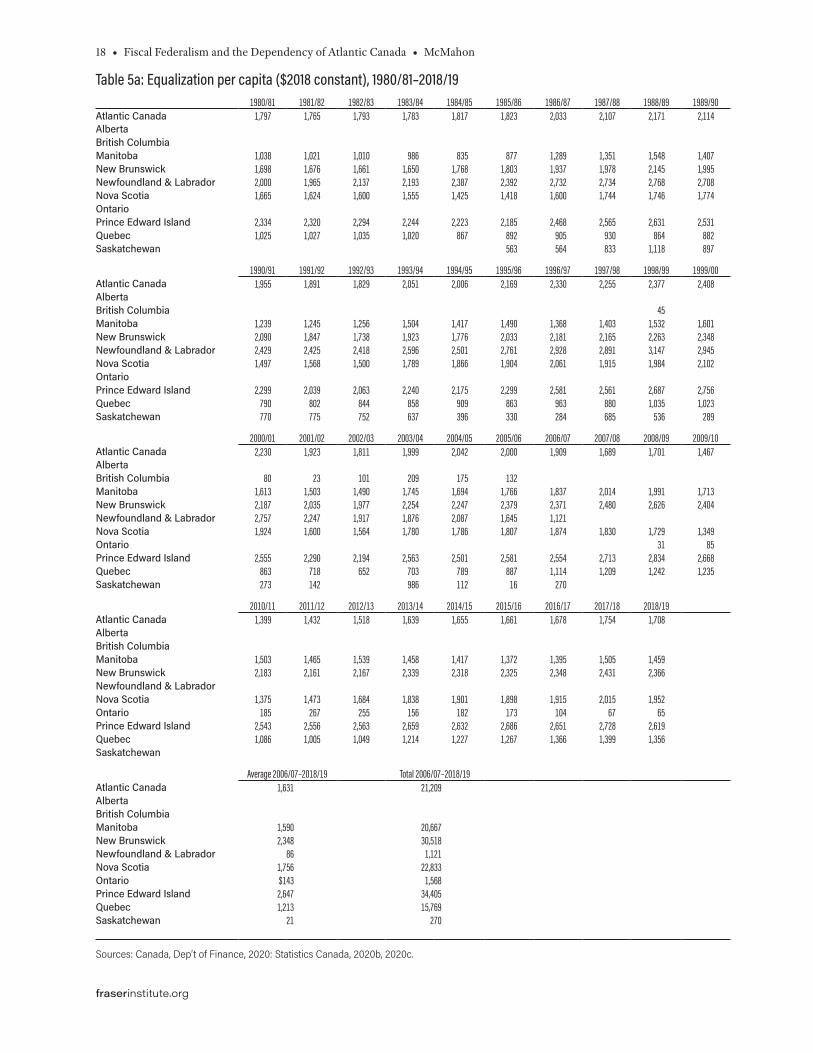
EqualizationFortunately, a longer consistent time series is available for Equalization payments (table 5a and table 5b).7 These form only a small part of the overall burden of fiscal fed-eralism. For example, in 2018/19, Equalization payments to Atlantic Canada were $1,708 per person, about a quarter of net federal transfers to the region in 2019 at $6,704 per person. The average net transfer between 2007 and 2019 was $6,381, almost four times the size of Equalization payments over the period at $1,631 per person. However, equal-ization payments for Quebec equaled 60% of net federal transfers over the same period (figure 1). Equalization payments will continue to grow because of the rules embedded in the program (Eisen, Lafleur, Fuss, and Hill, 2020; Eisen, Emes, Lafleur, and Hill, 2020).8
The equalization program is entering into an era of uncertainty and potential instability. Equalization is determined by a province’s fiscal capacity, that is each province’s abil-ity to generate own-source revenues at identical levels of taxation. Provinces below the national average receive equalization to make up the difference (see Eisen and Palacios, 2020) for details.
7. Equalization is reported on a fiscal-year basis, April 1 to March 31, so, for example, fiscal 2018/19 mostly overlaps the calendar year of 2018.8. The two references in this paragraph provide an important overview of the workings of the Equalization and its flaws. See also Tombe, 2018. Eisen, Emes, Lafleur, and Hill (2020) also provide an analysis of the federal Fiscal Stabilization Program and its inadequacies. The program, now a relatively a small part of fiscal transfers, is not discussed separately here.

16 • Fiscal Federalism and the Dependency of Atlantic Canada • McMahon
fraserinstitute.org
Table 4a: Expenditure and revenue as a percentage of provincial GDP, 2007–20192007 2008 2009 2010 2011 2012 2013 2014 2015 2016 2017 2018 2019 Average
Atlantic CanadaExpenditure 27.8% 28.6% 30.7% 29.2% 27.4% 27.2% 26.0% 25.7% 26.3% 26.4% 26.8% 27.0% 27.8% 27.5%Revenue 15.3% 16.0% 15.3% 14.2% 14.2% 14.1% 13.9% 14.3% 14.4% 14.5% 14.6% 15.2% 14.8% 14.7%Surplus or deficit −12.5% −12.6% −15.4% −15.0% −13.2% −13.1% −12.1% −11.4% −11.9% −11.9% −12.1% −11.8% −13.0% −12.8%
AlbertaExpenditure 6.9% 6.5% 8.5% 8.2% 7.3% 7.1% 6.6% 6.1% 7.7% 9.0% 8.8% 8.7% 9.0% 7.7%Revenue 15.4% 14.1% 15.7% 14.3% 13.3% 13.2% 13.5% 13.3% 15.3% 14.2% 13.2% 13.7% 14.1% 14.1%Surplus or deficit 8.5% 7.6% 7.2% 6.1% 6.0% 6.2% 6.9% 7.2% 7.6% 5.2% 4.4% 5.1% 5.0% 6.4%
British ColumbiaExpenditure 12.8% 12.8% 14.1% 15.2% 13.6% 13.5% 13.0% 12.3% 12.4% 12.5% 12.5% 12.5% 12.9% 13.1%Revenue 16.1% 14.9% 14.6% 14.3% 14.2% 14.9% 14.4% 14.3% 14.8% 15.2% 15.4% 16.2% 16.1% 15.0%Surplus or deficit 3.3% 2.1% 0.5% −0.9% 0.6% 1.4% 1.4% 1.9% 2.4% 2.7% 2.9% 3.8% 3.1% 2.0%
CanadaExpenditure 14.7% 14.8% 16.2% 16.5% 15.3% 14.9% 14.4% 13.7% 14.2% 14.6% 14.7% 14.7% 15.2% 14.9%Revenue 15.6% 14.5% 14.4% 13.8% 13.8% 13.8% 13.8% 13.8% 14.4% 14.5% 14.6% 15.1% 15.2% 14.4%Surplus or deficit 0.9% −0.2% −1.8% −2.7% −1.5% −1.0% −0.6% 0.1% 0.2% −0.1% −0.1% 0.5% 0.1% −0.5%
ManitobaExpenditure 22.0% 22.1% 23.2% 23.0% 21.8% 20.2% 19.5% 18.8% 18.9% 19.4% 19.8% 20.3% 21.6% 20.8%Revenue 13.9% 13.4% 13.4% 13.0% 13.1% 12.8% 13.0% 13.1% 13.4% 13.4% 13.4% 14.1% 14.7% 13.4%Surplus or deficit −8.1% −8.7% −9.7% −10.0% −8.7% −7.5% −6.4% −5.7% −5.5% −6.0% −6.4% −6.2% −6.9% −7.4%
New BrunswickExpenditure 26.8% 27.6% 29.1% 29.1% 28.3% 27.8% 27.6% 27.2% 27.0% 27.4% 27.9% 27.8% 28.7% 27.9%Revenue 13.8% 13.9% 13.9% 13.2% 13.5% 13.6% 13.6% 13.8% 13.7% 14.0% 14.4% 14.6% 14.6% 13.9%Surplus or deficit −13.0% −13.7% −15.2% −15.9% −14.8% −14.3% −13.9% −13.4% −13.3% −13.3% −13.6% −13.2% −14.0% −14.0%
Newfoundland & LabradorExpenditure 22.0% 22.8% 27.0% 23.6% 19.5% 18.7% 16.4% 17.0% 18.3% 18.6% 18.7% 18.6% 19.4% 20.1%Revenue 14.0% 17.5% 16.6% 14.7% 13.9% 13.4% 12.9% 13.9% 14.3% 14.2% 13.9% 14.0% 13.7% 14.4%Surplus or deficit −8.0% −5.4% −10.3% −8.9% −5.6% −5.3% −3.5% −3.2% −4.0% −4.4% −4.8% −4.5% −5.7% −5.7%
Northwest TerritoriesExpenditure 32.2% 30.6% 41.6% 35.2% 35.6% 39.0% 38.9% 40.9% 42.5% 47.0% 47.4% 47.7% 54.7% 41.0%Revenue 15.0% 14.3% 17.3% 13.5% 16.5% 16.4% 14.6% 13.6% 13.0% 12.2% 11.5% 10.9% 11.7% 13.9%Surplus or deficit −17.1% −16.4% −24.4% −21.7% −19.1% −22.7% −24.2% −27.3% −29.5% −34.8% −35.9% −36.8% −43.0% −27.1%
Nova ScotiaExpenditure 32.5% 33.2% 33.5% 32.3% 32.4% 32.9% 32.2% 31.1% 31.0% 30.7% 31.0% 31.6% 32.2% 32.1%Revenue 17.5% 16.4% 15.8% 14.7% 15.1% 15.0% 15.1% 15.2% 15.1% 15.3% 15.5% 16.6% 15.7% 15.6%Surplus or deficit −15.0% −16.8% −17.7% −17.6% −17.3% −17.9% −17.1% −15.9% −15.9% −15.5% −15.5% −15.0% −16.5% −16.4%
NunavutExpenditure 93.3% 88.8% 93.0% 78.3% 76.5% 75.1% 76.3% 73.7% 74.6% 72.1% 63.9% 59.9% 57.0% 75.6%Revenue 16.2% 10.5% 13.0% 11.9% 12.7% 12.2% 12.1% 12.0% 12.1% 11.7% 10.8% 10.3% 9.9% 12.0%Surplus or deficit −77.1% −78.3% −80.0% −66.4% −63.8% −62.9% −64.2% −61.7% −62.5% −60.5% −53.1% −49.5% −47.1% −63.6%
OntarioExpenditure 13.5% 13.9% 15.1% 15.8% 14.9% 14.4% 14.3% 13.5% 13.3% 13.3% 13.5% 13.5% 14.0% 14.1%Revenue 16.5% 15.4% 14.6% 14.1% 14.7% 14.6% 14.6% 14.7% 15.0% 15.4% 15.9% 16.3% 16.4% 15.3%Surplus or deficit 3.0% 1.5% −0.4% −1.7% −0.2% 0.2% 0.4% 1.2% 1.8% 2.1% 2.4% 2.8% 2.4% 1.2%
Prince Edward IslandExpenditure 36.4% 37.8% 39.3% 38.3% 35.8% 34.1% 34.1% 32.3% 31.8% 32.2% 33.4% 34.0% 34.7% 34.9%Revenue 16.6% 15.2% 14.2% 13.5% 14.1% 14.3% 14.0% 13.9% 14.1% 14.3% 14.5% 15.2% 14.6% 14.5%Surplus or deficit −19.8% −22.6% −25.1% −24.8% −21.7% −19.8% −20.0% −18.5% −17.7% −17.9% −18.9% −18.8% −20.1% −20.4%
QuebecExpenditure 16.7% 17.7% 18.2% 18.4% 17.6% 16.9% 16.7% 16.6% 16.6% 16.6% 17.0% 16.5% 16.9% 17.1%Revenue 14.4% 13.6% 13.0% 12.8% 13.0% 12.8% 12.7% 12.6% 13.0% 13.0% 13.3% 13.8% 13.9% 13.2%Surplus or deficit −2.3% −4.1% −5.2% −5.6% −4.6% −4.2% −4.0% −4.0% −3.6% −3.6% −3.7% −2.8% −2.9% −3.9%
SaskatchewanExpenditure 15.3% 12.4% 13.4% 13.3% 11.4% 10.9% 10.1% 10.2% 10.9% 12.2% 12.7% 12.8% 14.0% 12.3%Revenue 13.0% 11.1% 12.5% 11.9% 11.0% 11.0% 11.1% 11.7% 12.2% 12.3% 12.0% 12.5% 13.0% 12.0%Surplus or deficit −2.3% −1.2% −0.9% −1.4% −0.4% 0.1% 0.9% 1.5% 1.4% 0.2% −0.6% −0.3% −0.9% −0.3%
YukonExpenditure 51.7% 50.6% 52.6% 54.7% 53.3% 51.0% 51.5% 49.7% 52.7% 51.1% 51.4% 51.1% 52.5% 51.8%Revenue 14.2% 12.7% 12.4% 11.5% 12.3% 12.0% 11.8% 11.6% 12.4% 12.0% 12.5% 12.8% 12.8% 12.4%Surplus or deficit −37.5% −37.9% −40.3% −43.2% −41.0% −39.0% −39.8% −38.2% −40.3% −39.0% −38.9% −38.4% −39.8% −39.5%
Source: Statistics Canada, 2019

McMahon • Fiscal Federalism and the Dependency of Atlantic Canada • 17
fraserinstitute.org
Table 4b: Expenditure and revenue as a percentage of provincial GDP, 1997–20091997 1998 1999 2000 2001 2002 2003 2004 2005 2006 2007 2008 2009 Average
Atlantic CanadaExpenditure 37.2% 36.8% 35.3% 32.6% 32.9% 29.8% 28.8% 27.1% 32.4% 26.9% 27.6% 27.9% 31.1% 31.3%Revenue 17.3% 17.1% 16.9% 16.8% 16.1% 15.0% 14.6% 14.4% 13.9% 13.9% 14.2% 15.3% 14.1% 15.4%Surplus or deficit −19.8% −19.7% −18.4% −15.9% −16.8% −14.8% −14.2% −12.7% −18.5% −13.0% −13.4% −12.6% −17.0% −15.9%
AlbertaExpenditure 10.9% 11.3% 11.0% 9.7% 9.5% 9.3% 9.1% 8.4% 7.6% 6.8% 6.7% 6.3% 8.1% 8.8%Revenue 16.1% 17.0% 16.1% 15.0% 14.7% 14.7% 13.6% 13.3% 13.2% 14.1% 14.7% 13.4% 14.6% 14.7%Surplus or deficit 5.2% 5.7% 5.1% 5.3% 5.2% 5.4% 4.5% 4.9% 5.7% 7.3% 8.0% 7.1% 6.5% 5.8%
British ColumbiaExpenditure 14.6% 14.9% 15.1% 14.5% 14.5% 14.4% 14.1% 13.5% 13.7% 12.6% 12.3% 12.4% 13.7% 13.9%Revenue 17.4% 17.0% 16.7% 16.7% 16.2% 15.3% 15.1% 14.9% 15.0% 15.1% 15.5% 14.4% 13.7% 15.6%Surplus or deficit 2.8% 2.1% 1.6% 2.2% 1.7% 0.9% 1.0% 1.4% 1.3% 2.5% 3.2% 2.0% 0.0% 1.7%
CanadaExpenditure 17.1% 16.9% 16.6% 15.8% 15.7% 15.0% 15.1% 14.3% 14.9% 14.1% 14.0% 14.3% 15.7% 15.4%Revenue 17.4% 17.3% 17.2% 17.3% 16.5% 15.6% 15.3% 15.2% 15.1% 15.0% 15.1% 14.1% 13.7% 15.8%Surplus or deficit 0.3% 0.4% 0.6% 1.5% 0.8% 0.6% 0.2% 0.8% 0.1% 0.9% 1.0% −0.1% −2.0% 0.4%
ManitobaExpenditure 25.4% 23.9% 24.9% 24.5% 24.1% 23.0% 24.3% 22.5% 24.4% 22.3% 22.1% 22.8% 25.4% 23.8%Revenue 16.7% 15.9% 16.0% 16.1% 15.1% 14.3% 14.6% 14.3% 14.0% 13.2% 13.2% 12.8% 12.7% 14.5%Surplus or deficit −8.7% −8.0% −8.9% −8.4% −8.9% −8.6% −9.7% −8.2% −10.4% −9.1% −8.9% −10.0% −12.7% −9.3%
New BrunswickExpenditure 31.6% 31.5% 30.7% 29.1% 29.8% 28.2% 28.1% 26.5% 28.4% 26.6% 26.2% 26.8% 30.0% 28.7%Revenue 16.6% 16.2% 15.9% 16.3% 15.6% 15.0% 14.7% 14.3% 14.0% 13.5% 13.1% 13.2% 12.8% 14.7%Surplus or deficit −15.1% −15.3% −14.8% −12.8% −14.3% −13.2% −13.4% −12.1% −14.4% −13.1% −13.1% −13.6% −17.2% −14.0%
Newfoundland & LabradorExpenditure 44.5% 45.7% 41.8% 34.4% 34.4% 28.4% 26.0% 23.6% 33.5% 21.5% 23.6% 23.5% 25.5% 31.3%Revenue 17.3% 16.9% 16.2% 15.3% 15.1% 13.1% 12.4% 12.4% 11.3% 11.3% 12.6% 16.9% 15.2% 14.3%Surplus or deficit −27.2% −28.8% −25.6% −19.1% −19.3% −15.3% −13.6% −11.1% −22.2% −10.3% −11.0% −6.7% −10.3% −17.0%
Northwest TerritoriesExpenditure 46.1% 35.8% 27.6% 26.9% 30.0% 25.9% 30.2% 29.1% 28.9% 28.6% 36.5% 31.4%Revenue 16.1% 17.7% 16.4% 15.9% 14.6% 15.1% 14.2% 13.3% 13.4% 12.7% 14.8% 14.9%Surplus or deficit −30.0% −18.1% −11.2% −11.0% −15.3% −10.8% −16.1% −15.8% −15.5% −16.0% −21.7% −16.5%
Nova ScotiaExpenditure 37.5% 36.2% 34.9% 33.7% 33.5% 31.1% 30.0% 28.9% 34.3% 30.1% 31.2% 31.4% 42.2% 33.4%Revenue 17.7% 17.7% 17.7% 17.6% 16.7% 15.8% 15.5% 15.4% 15.1% 15.6% 16.0% 15.4% 17.4% 16.4%Surplus or deficit −19.8% −18.5% −17.2% −16.1% −16.7% −15.3% −14.5% −13.5% −19.2% −14.5% −15.2% −16.0% −24.8% −17.0%
NunavutExpenditure 98.8% 94.8% 112.7% 72.7% 100.7% 100.7% 112.8% 106.4% 91.9% 87.1% 5.6% 89.5%Revenue 10.1% 11.4% 12.1% 11.6% 12.3% 11.3% 11.0% 10.6% 13.7% 8.0% 0.6% 10.2%Surplus or deficit −88.7% −83.4% −100.6% −61.1% −88.4% −89.5% −101.8% −95.7% −78.2% −79.1% −4.9% −79.2%
OntarioExpenditure 13.7% 13.2% 12.9% 12.6% 12.6% 12.1% 12.5% 12.1% 12.5% 12.4% 12.6% 13.2% 246.5% 30.7%Revenue 18.3% 18.2% 18.4% 18.7% 17.8% 16.4% 16.2% 16.3% 16.3% 16.1% 16.1% 15.2% 243.5% 34.4%Surplus or deficit 4.6% 5.0% 5.5% 6.1% 5.2% 4.3% 3.7% 4.2% 3.8% 3.7% 3.6% 2.1% −3.0% 3.7%
Prince Edward IslandExpenditure 41.6% 40.1% 41.5% 39.2% 42.0% 36.5% 36.5% 34.1% 35.9% 34.9% 35.0% 36.7% 39.3% 37.9%Revenue 19.8% 19.0% 19.1% 19.4% 19.3% 17.6% 17.8% 17.5% 17.4% 17.4% 17.5% 16.9% 15.0% 18.0%Surplus or deficit −21.8% −21.0% −22.3% −19.7% −22.7% −18.9% −18.7% −16.6% −18.6% −17.4% −17.5% −19.9% −24.4% −20.0%
QuebecExpenditure 19.3% 19.3% 18.5% 17.9% 17.6% 16.5% 16.6% 15.5% 16.5% 16.5% 16.2% 17.1% 6.6% 16.5%Revenue 17.0% 16.7% 16.5% 17.1% 16.0% 15.2% 15.3% 15.1% 15.1% 14.5% 14.0% 13.2% 4.9% 14.7%Surplus or deficit −2.3% −2.5% −2.0% −0.8% −1.6% −1.3% −1.3% −0.4% −1.4% −2.0% −2.2% −3.9% −1.7% −1.8%
SaskatchewanExpenditure 20.3% 20.6% 21.9% 20.2% 21.1% 18.6% 19.1% 19.3% 18.1% 17.7% 15.5% 12.8% 8.9% 18.0%Revenue 15.2% 15.1% 15.0% 14.3% 14.8% 13.8% 13.3% 12.6% 12.6% 13.2% 12.6% 10.8% 7.5% 13.1%Surplus or deficit −5.1% −5.5% −6.9% −5.9% −6.3% −4.8% −5.8% −6.7% −5.5% −4.5% −3.0% −2.0% −1.4% −4.9%
YukonExpenditure 50.8% 56.3% 60.6% 56.6% 60.2% 47.9% 59.1% 57.2% 66.2% 55.9% 54.2% 51.0% 52.3% 56.0%Revenue 14.8% 14.8% 15.0% 13.9% 13.3% 13.1% 12.9% 12.2% 12.3% 12.1% 12.4% 11.4% 10.6% 13.0%Surplus or deficit −35.9% −41.6% −45.5% −42.7% −46.9% −34.7% −46.2% −45.0% −53.9% −43.8% −41.8% −39.7% −41.7% −43.0%
Source: Statistics Canada, 2019
18 • Fiscal Federalism and the Dependency of Atlantic Canada • McMahon
fraserinstitute.org
Table 5a: Equalization per capita ($2018 constant), 1980/81–2018/191980/81 1981/82 1982/83 1983/84 1984/85 1985/86 1986/87 1987/88 1988/89 1989/90
Atlantic Canada 1,797 1,765 1,793 1,783 1,817 1,823 2,033 2,107 2,171 2,114 AlbertaBritish ColumbiaManitoba 1,038 1,021 1,010 986 835 877 1,289 1,351 1,548 1,407 New Brunswick 1,698 1,676 1,661 1,650 1,768 1,803 1,937 1,978 2,145 1,995 Newfoundland & Labrador 2,000 1,965 2,137 2,193 2,387 2,392 2,732 2,734 2,768 2,708 Nova Scotia 1,665 1,624 1,600 1,555 1,425 1,418 1,600 1,744 1,746 1,774 OntarioPrince Edward Island 2,334 2,320 2,294 2,244 2,223 2,185 2,468 2,565 2,631 2,531 Quebec 1,025 1,027 1,035 1,020 867 892 905 930 864 882 Saskatchewan 563 564 833 1,118 897
1990/91 1991/92 1992/93 1993/94 1994/95 1995/96 1996/97 1997/98 1998/99 1999/00Atlantic Canada 1,955 1,891 1,829 2,051 2,006 2,169 2,330 2,255 2,377 2,408 AlbertaBritish Columbia 45 Manitoba 1,239 1,245 1,256 1,504 1,417 1,490 1,368 1,403 1,532 1,601 New Brunswick 2,090 1,847 1,738 1,923 1,776 2,033 2,181 2,165 2,263 2,348 Newfoundland & Labrador 2,429 2,425 2,418 2,596 2,501 2,761 2,928 2,891 3,147 2,945 Nova Scotia 1,497 1,568 1,500 1,789 1,866 1,904 2,061 1,915 1,984 2,102 OntarioPrince Edward Island 2,299 2,039 2,063 2,240 2,175 2,299 2,581 2,561 2,687 2,756 Quebec 790 802 844 858 909 863 963 880 1,035 1,023 Saskatchewan 770 775 752 637 396 330 284 685 536 289
2000/01 2001/02 2002/03 2003/04 2004/05 2005/06 2006/07 2007/08 2008/09 2009/10Atlantic Canada 2,230 1,923 1,811 1,999 2,042 2,000 1,909 1,689 1,701 1,467 AlbertaBritish Columbia 80 23 101 209 175 132 Manitoba 1,613 1,503 1,490 1,745 1,694 1,766 1,837 2,014 1,991 1,713 New Brunswick 2,187 2,035 1,977 2,254 2,247 2,379 2,371 2,480 2,626 2,404 Newfoundland & Labrador 2,757 2,247 1,917 1,876 2,087 1,645 1,121 Nova Scotia 1,924 1,600 1,564 1,780 1,786 1,807 1,874 1,830 1,729 1,349 Ontario 31 85 Prince Edward Island 2,555 2,290 2,194 2,563 2,501 2,581 2,554 2,713 2,834 2,668 Quebec 863 718 652 703 789 887 1,114 1,209 1,242 1,235 Saskatchewan 273 142 986 112 16 270
2010/11 2011/12 2012/13 2013/14 2014/15 2015/16 2016/17 2017/18 2018/19Atlantic Canada 1,399 1,432 1,518 1,639 1,655 1,661 1,678 1,754 1,708 AlbertaBritish ColumbiaManitoba 1,503 1,465 1,539 1,458 1,417 1,372 1,395 1,505 1,459 New Brunswick 2,183 2,161 2,167 2,339 2,318 2,325 2,348 2,431 2,366 Newfoundland & LabradorNova Scotia 1,375 1,473 1,684 1,838 1,901 1,898 1,915 2,015 1,952 Ontario 185 267 255 156 182 173 104 67 65 Prince Edward Island 2,543 2,556 2,563 2,659 2,632 2,686 2,651 2,728 2,619 Quebec 1,086 1,005 1,049 1,214 1,227 1,267 1,366 1,399 1,356 Saskatchewan
Average 2006/07–2018/19 Total 2006/07–2018/19Atlantic Canada 1,631 21,209 Alberta British Columbia Manitoba 1,590 20,667 New Brunswick 2,348 30,518 Newfoundland & Labrador 86 1,121 Nova Scotia 1,756 22,833 Ontario $143 1,568 Prince Edward Island 2,647 34,405 Quebec 1,213 15,769 Saskatchewan 21 270
Sources: Canada, Dep’t of Finance, 2020: Statistics Canada, 2020b, 2020c.

McMahon • Fiscal Federalism and the Dependency of Atlantic Canada • 19
fraserinstitute.org
Table 5b: Equalization as a percentage of provincial GDP, 1981/82–2018/191981/82 1982/83 1983/84 1984/85 1985/86 1986/87 1987/88 1988/89 1989/90
Atlantic Canada 7.1% 7.0% 6.8% 6.4% 6.4% 6.1% 6.6% 6.7% 6.8%AlbertaBritish ColumbiaManitoba 2.9% 3.1% 3.0% 2.8% 2.3% 2.4% 3.5% 3.5% 4.0%New Brunswick 6.7% 6.7% 6.2% 5.9% 6.2% 5.8% 6.0% 6.0% 6.6%Newfoundland & Labrador 8.1% 8.2% 8.9% 8.9% 9.6% 9.2% 10.1% 9.8% 9.9%Nova Scotia 6.5% 6.1% 5.7% 5.2% 4.6% 4.4% 4.9% 5.2% 5.2%OntarioPrince Edward Island 10.0% 10.2% 9.3% 9.4% 9.3% 8.2% 9.2% 9.1% 9.2%Quebec 3.0% 3.2% 3.2% 3.0% 2.5% 2.4% 2.4% 2.4% 2.2%Saskatchewan 1.6% 1.6% 2.4% 3.2%
1990/91 1991/92 1992/93 1993/94 1994/95 1995/96 1996/97 1997/98 1998/99 1999/00Atlantic Canada 6.8% 6.5% 6.3% 6.0% 6.5% 6.2% 6.8% 7.2% 6.7% 6.6%AlbertaBritish Columbia 0.1%Manitoba 3.7% 3.5% 3.5% 3.6% 4.1% 3.8% 3.9% 3.5% 3.4% 3.7%New Brunswick 6.3% 6.9% 6.0% 5.5% 5.9% 5.1% 5.9% 6.4% 6.1% 6.0%Newfoundland & Labrador 9.9% 9.0% 9.1% 9.1% 9.2% 8.6% 9.7% 10.2% 9.5% 9.4%Nova Scotia 5.4% 4.6% 4.8% 4.7% 5.5% 5.7% 5.9% 6.2% 5.5% 5.4%OntarioPrince Edward Island 8.9% 8.2% 7.3% 7.0% 7.5% 7.2% 7.3% 8.4% 8.0% 8.0%Quebec 2.3% 2.2% 2.2% 2.3% 2.3% 2.4% 2.3% 2.5% 2.2% 2.4%Saskatchewan 2.5% 2.2% 2.3% 2.1% 1.7% 1.0% 0.8% 0.7% 1.6% 1.2%
2000/01 2001/02 2002/03 2003/04 2004/05 2005/06 2006/07 2007/08 2008/09 2009/10Atlantic Canada 6.3% 5.8% 4.8% 4.3% 4.6% 4.5% 4.3% 3.9% 3.3% 3.6%AlbertaBritish Columbia 0.2% 0.0% 0.2% 0.4% 0.3% 0.2%Manitoba 3.8% 3.8% 3.5% 3.5% 3.9% 3.7% 3.7% 3.7% 4.0% 4.1%New Brunswick 6.0% 5.6% 5.2% 4.9% 5.4% 5.3% 5.4% 5.2% 5.5% 5.8%Newfoundland & Labrador 7.8% 7.3% 5.2% 4.2% 3.9% 3.9% 2.8% 1.6%Nova Scotia 5.5% 4.9% 4.0% 3.8% 4.2% 4.2% 4.2% 4.3% 4.1% 4.0%Ontario 0.1%Prince Edward Island 7.9% 7.4% 6.3% 6.1% 6.9% 6.5% 6.6% 6.3% 6.8% 6.9%Quebec 2.3% 2.0% 1.6% 1.4% 1.5% 1.7% 1.9% 2.3% 2.5% 2.6%Saskatchewan 0.6% 0.6% 0.3% 1.9% 0.2% 0.0% 0.4%
2010/11 2011/12 2012/13 2013/14 2014/15 2015/16 2016/17 2017/18 2018/19Atlantic Canada 3.0% 2.8% 2.9% 3.0% 3.2% 3.3% 3.3% 3.3% 3.5%AlbertaBritish ColumbiaManitoba 3.4% 3.0% 2.8% 2.9% 2.7% 2.6% 2.6% 2.6% 2.8%New Brunswick 5.2% 4.7% 4.7% 4.7% 5.1% 5.0% 5.0% 4.9% 5.1%Newfoundland & LabradorNova Scotia 3.0% 3.1% 3.3% 3.8% 4.1% 4.2% 4.1% 4.1% 4.4%Ontario 0.2% 0.3% 0.5% 0.5% 0.3% 0.3% 0.3% 0.2% 0.1%Prince Edward Island 6.3% 6.1% 6.0% 5.9% 6.1% 5.9% 6.0% 5.8% 6.0%Quebec 2.6% 2.3% 2.1% 2.1% 2.5% 2.5% 2.5% 2.6% 2.7%Saskatchewan
Source: Canada, Dep’t of Finance, 2020: Statistics Canada, 2020a, 2020b..

20 • Fiscal Federalism and the Dependency of Atlantic Canada • McMahon
fraserinstitute.org
Provincial fiscal capacity has been converging, largely as a result of the decline in the energy sector, which earlier led to a significant fiscal gap between provinces with large energy sectors—Alberta, Saskatchewan, and Newfoundland & Labrador—and the other provinces. In 2007/08, Alberta had the highest per-capita fiscal capacity at $16,743 ($2020) compared to $5,744 for Prince Edward Island, which had the lowest. In the cur-rent fiscal year, Eisen and Palacios (2020) estimate Alberta’s capacity at $9,189 compared to $6,389 for Prince Edward Island and $6,343 for New Brunswick, now ranked lowest. But, regardless of fiscal capacity, equalization is required to grow at the rate of nominal GDP, which is likely to resume strongly as the economy recovers from COVID-19.
However, distribution of the funds will change, with Newfoundland & Labrador likely to qualify for equalization in future. Even Alberta might become eligible. The shrinking difference in fiscal capacity may create some instability in the system. With the prov-inces ever more closely bunched together in fiscal capacity, small changes could alter the provinces’ ranking relative to each other and to the national average, and thus the size of equalization payments. However, this will be muted by the equalization formula, based on a weighted average of three prior years’ fiscal capacity, lagged by two years—a formula specifically created to deal with what had been the system’s instability and unpredictability.
Employment insuranceThe same pattern found in the expenditure and revenue data emerges in the benefit and con-tribution data for Employment Insurance. Workers and employers in Alberta and, in some years, all the other provinces, including Quebec, make net contributions into the system while payments in the Atlantic provinces not only exceed contributions but are typically about twice the amount of the contribution. In fact, the “primary purpose [of the insurance system’s structure] was to effect an ongoing interregional transfer of benefits. Moreover, allowing claimants who worked in a low-unemployment region to file for benefits in a high-unemployment region contributed to the size of this transfer” (Courchene and Allan, 2009).
Employment insurance, as can be seen from table 6, is a significant part of fiscal federal-ism. Regional rules, based on unemployment levels, lead to much higher payout rates in Eastern Canada. Typically, workers in Atlantic Canada receive about twice the amount they put in. Alberta workers receive only about 60% of what they contribute. The system will be difficult to sustain: from 2007 to 2019, every province except the Atlantic prov-inces made a net contribution to the Employment Insurance program though Quebec’s contribution was small (table 6). However, in the new post-COVID-19 world, every prov-ince could be in EI deficit for four reasons: the increased level of unemployment leading to more benefits; a more generous system as a result of changes in rules as unemployment rises, federal rule changes in response to COVID-19, which also increase generosity, and fewer contributions from employees and employers as employment falls.

McMahon • Fiscal Federalism and the Dependency of Atlantic Canada • 21
fraserinstitute.org
Table 6: Employment insurance ($2018) per labour-force participant, 2007–20182007 2008 2009 2010 2011 2012 2013 2014 2015 2016 2017 2018 Average Total
Canada Benefits 842 857 1,203 1,097 946 898 860 868 927 976 933 856 939 11,264
Contributions 1,172 1,106 1,089 1,100 1,105 1,157 1,260 1,267 1,282 1,278 1,077 1,121 1,168 14,014 Difference −330 −249 114 −3 −159 −258 −399 −399 −355 −302 −144 −265 −229 −2,749
Atlantic Canada Benefits 2,358 2,344 2,696 2,538 2,456 2,405 2,250 2,240 2,401 2,535 2,595 2,512 2,444 29,329
Contributions 1,187 1,137 1,153 1,174 1,185 1,216 1,295 1,318 1,349 1,371 1,168 1,193 1,229 14,744 Difference 1,172 1,208 1,543 1,364 1,271 1,189 954 922 1,052 1,164 1,427 1,319 1,215 14,585
Alberta Benefits 513 540 987 904 707 617 621 657 901 1,298 1,138 913 816 9,794
Contributions 1,292 1,240 1,190 1,223 1,246 1,333 1,524 1,540 1,469 1,373 1,154 1,176 1,313 15,759 Difference −779 −700 −203 −320 −539 −716 −903 −883 −568 −75 −16 −263 −497 −5,965
British ColumbiaBenefits 671 734 1,151 1,071 896 831 786 807 835 825 787 709 842 10,103
Contributions 1,231 1,162 1,129 1,138 1,147 1,203 1,325 1,334 1,363 1,363 1,166 1,230 1,233 14,791 Difference −559 −428 22 −67 −251 −372 −539 −527 −528 −538 −380 −521 −391 −4,689
Manitoba Benefits 677 697 896 891 784 781 754 782 838 893 882 896 814 9,770
Contributions 1,208 1,159 1,178 1,188 1,188 1,239 1,347 1,360 1,369 1,387 1,182 1,205 1,251 15,009 Difference −531 −462 −282 −297 −404 −457 −593 −578 −531 −494 −300 −309 −437 −5,238
New BrunswickBenefits 2,154 2,117 2,485 2,405 2,362 2,388 2,243 2,204 2,344 2,420 2,436 2,317 2,323 27,875
Contributions 1,213 1,162 1,175 1,205 1,198 1,226 1,242 1,258 1,288 1,321 1,143 1,194 1,219 14,626 Difference 941 955 1,311 1,199 1,164 1,162 1,001 946 1,056 1,099 1,292 1,124 1,104 13,249
Newfoundland & LabradorBenefits 3,899 3,890 4,401 3,924 3,707 3,490 3,301 3,351 3,564 4,002 4,304 4,151 3,832 45,983
Contributions 1,192 1,150 1,200 1,219 1,287 1,342 1,532 1,573 1,611 1,612 1,354 1,347 1,368 16,418 Difference 2,707 2,740 3,201 2,705 2,420 2,148 1,769 1,778 1,953 2,390 2,950 2,804 2,464 29,565
Nova ScotiaBenefits 1,607 1,609 1,891 1,817 1,765 1,729 1,609 1,602 1,743 1,751 1,737 1,722 1,715 20,581
Contributions 1,169 1,114 1,114 1,136 1,131 1,149 1,229 1,248 1,273 1,294 1,098 1,124 1,173 14,078 Difference 438 495 777 681 635 579 380 353 471 457 639 598 542 6,503
Ontario Benefits 700 731 1,115 967 809 768 753 750 767 751 732 689 794 9,532
Contributions 1,211 1,138 1,129 1,139 1,138 1,189 1,270 1,271 1,309 1,327 1,132 1,179 1,203 14,431 Difference −511 −407 −14 −172 −329 −421 −517 −520 −543 −576 −399 −490 −408 −4,900
Prince Edward IslandBenefits 3,109 3,055 3,304 3,186 3,057 3,000 2,645 2,561 2,760 2,941 2,993 2,944 2,963 35,554
Contributions 1,146 1,104 1,131 1,120 1,115 1,147 1,167 1,184 1,225 1,270 1,102 1,120 1,153 13,832 Difference 1,963 1,951 2,172 2,066 1,942 1,854 1,478 1,377 1,535 1,671 1,891 1,824 1,810 21,722
Quebec Benefits 929 896 1,122 1,051 916 882 826 838 855 820 763 701 883 10,597
Contributions 990 914 887 887 877 913 996 1,002 1,012 1,015 817 868 931 11,178 Difference −61 −19 235 164 39 −31 −170 −163 −157 −195 −54 −167 −48 −580
SaskatchewanBenefits 665 657 860 840 754 733 711 754 870 1,044 1,076 1,000 830 9,965
Contributions 1,101 1,080 1,120 1,159 1,216 1,291 1,413 1,423 1,404 1,365 1,145 1,154 1,239 14,871 Difference −436 −423 −259 −319 −462 −558 −702 −669 −534 −320 −69 −155 −409 −4,906
Note: Contributions include payments from both employers and employees.Sources: Statistics Canada, 2020a; 2020b; 2020d.; calculations by the author.

22 • Fiscal Federalism and the Dependency of Atlantic Canada • McMahon
fraserinstitute.org
Employment Insurance is intended to be self-financing, so a system deeply in the red would become another drain on government finances. Initially, the policy response to COVID-19 and payments to workers were absorbed by the Canada Emergency Response Benefit (CERB). However, this has been transferred to the EI program and EI collection rules further relaxed and made more generous. This has extended something like the EI system in Atlantic Canada across the nation. Both the changes in rules, albeit temporary, and unemployment as a result of COVID-19 going forward will reduce EI revenues from those in the workforce and substantially increase EI payments. The resultant red ink will drive the system into a significant deficit (see McMahon, 2020, for detailed information).9
The Parliamentary Budget Office in its Fall Economic Statement 2020 projects a $52 bil-lion deficit for the EI system by the end of 2024 (PBO, 2020). To bring the system back into long-term balance, as required by law, the federal government will have to increase premiums or cut benefits; it has presented no strategy for doing so. As the PBO dryly states: “Parliamentarians may wish to ask the Government to furnish its plan to address the anticipated shortfall in the EI Operating Account” (PBO, 2020: 15).
AccountabilityMacKinnon raises important questions concerning the accountability and transparency of fiscal federalism, requirements of good public policy. For government and civil-service administrators to establish accountability, the purpose of the program must be articu-lated and metrics set to determine whether the program is meeting those goals. Both goals and metrics should be transparent, that is, available to the public.
Some aspects of fiscal federalism do have stated purposes, but the structure of fiscal fed-eralism is much larger than its individual components and overall goals and metrics have not been established. Even where goals are stated for individual programs, they are often unclear and/or contradictory. For instance, as discussed earlier, equalization is meant to enable all provinces to provide similar levels of services but, in the long term, it may ham-per the provinces’ ability to provide these services on their own, as it rewards growth-inhibiting policies. EI is supposed to be an employment insurance program and yet region-ally extended EI has become a regional subsidy program that supports workers who every year spend long periods unemployed. As MacKinnon notes: “Successive provincial and federal governments cannot, with any quantitative precision, advise the … public on the economic impact of regional subsidies on consumption, investment, productivity or, indeed, any other economic variable of interest” (MacKinnon, 2011: 11). It is beyond the scope of this paper to discuss accountability issues in detail, but this examination of the scale of fiscal federalism could serve as a step towards developing accountability measures.
9. The government could try to address the deficit this by either increasing the workers’ EI contributions to the system or reducing payments to workers but the government’s changes to the program go in the opposite direction by making the system more generous (Government of Canada, 2020).
McMahon • Fiscal Federalism and the Dependency of Atlantic Canada • 23
fraserinstitute.org
Fiscal federalism going forward
Economic and fiscal situationIn this section, we look at the challenges that face the nation as a whole. These are related to COVID-19, the decline of the energy sector and thus of energy-related revenues dis-cussed below, and to the build-up of deficit spending over the past several years.
The Parliamentary Budget Office (2020) projects a budget deficit of $382.8 billion for the 2020/21 fiscal year compared to $24.9 billion in 2019/20. The 2019/20 deficit indi-cates Canada’s weak fiscal position going into period affected by COVID-19. With the economy strong and growing in 2019, the nation should have been running surpluses. The deficit situation will be slow to improve, with projected deficits of $121.2 billion in 2021/22 and $50.7 billion the following year. The debt will reach 50.7% of GDP in the 2020/21 fiscal year. The PBO criticizes Ottawa for not providing a fiscal “anchor”, in particular on the acceptable trajectory of the debt growth in coming years: “Fiscal transparency and accountability would be enhanced if the Government identified its fiscal anchor” (PBO, 2020: 2)
This is only part of the story since it does not include provincial debt. A study published in January 2020 of the debt of all levels of government—federal, provincial, and muni-cipal combined—projected an overall debt-to-GDP ratio of 64.3% for 2019/20 (Fuss and Palacios, 2020). Many of the provinces have worrisome debt levels. Ontario has the highest combined federal-provincial debt-to-GDP ratio at 75.4%, closely followed by Newfoundland & Labrador (73.6%) and Quebec (70.0%). The average government debt per person across Canada was estimated to be $39,483 for 2019–2021. It is import-ant to stress that the projections by Fuss and Palacios were made prior to the COVID-19 crisis and to recall that the estimates of the federal deficit made after the COVID-19 crisis struck are 13 times the deficit of 2019, so these numbers are likely to get much worse on the provincial level.
Shifting the burden—the financial crises of 2007 and 2020As noted, the contribution of taxpayers in Ontario and Alberta to fiscal federalism can equal several percentage points of provincial GDP and several thousand dollars a year per resident draining out of the provincial economy without contributing to government ser-vices. High taxes have been found in a number of studies to inhibit economic growth and job creation, including here in Canada (Eisen and Hill, 2019; Lafleur and Palacios, 2019).
With “energy” provinces in relative decline, Ontario’s taxpayers will become the largest overall contributor to fiscal federalism with British Columbian taxpayers making the

24 • Fiscal Federalism and the Dependency of Atlantic Canada • McMahon
fraserinstitute.org
biggest per-capita contribution (Eisen and Palacios, 2020). The higher level of taxes required to finance fiscal federalism, however, will ultimately have a negative impact on all Canadians:
the equalization program is, in some ways, merely the tip of a much larger ice-berg. There are a number of other ways by which Canadian public policy extracts disproportionate amounts of tax revenue from residents of certain provinces and transfers that money to the large public sectors that exist in other provinces. The effect of these additional transfers is to exacerbate the problems caused by equaliz-ation—subsidizing disproportionately large and inefficient governments in recipi-ent provinces while burdening … Canadians with higher taxes. (Eisen, 2010: 5)
The last time Canada and the world faced a grave crisis, the financial crisis that began in 2007, Alberta’s taxpayers effectively kept fiscal federalism afloat. For reasons discussed below, Alberta, with its energy industry under huge strain, will not be able to provide the lion’s share of funding for fiscal federalism going forward. That will largely leave Ontario’s and British Columbia’s taxpayers with the bill. The Atlantic provinces, Quebec, and Manitoba were net beneficiaries of fiscal federalism in every year since at least 1997. Saskatchewan and Newfoundland & Labrador will also suffer from the decline of the energy industry, adding to the strain on fiscal federalism.
The start of the financial crisis is usually dated to the bankruptcy of Lehman Brothers on September 15, 2007. For the full year, 2007, three provinces reported federal fiscal sur-pluses—in other words, in only three provinces, did the federal government report lower spending than revenues: Alberta, British Columbia, and Ontario. As noted earlier, the federal deficit/surplus balance is the sum of surpluses and deficits in the provinces and ter-ritories, leaving aside Ottawa’s relatively minor spending outside Canada. To take a closer look at the 2007–2009 financial crisis, we examine only those provinces that were produ-cing a surplus for the federal government, using the 2007–2019 data series (see table 1b).
For example, in 2007 the three provinces in surplus were Alberta by $26.6 billion, British Columbia by $7.9 billion, and Ontario by $21.7 billion. This means that Alberta’s tax-payers provided 47.2% of the total surplus by province, compared to 14.1% from British Columbia and 38.6% from Ontario. In 2008, Alberta’s taxpayers provided 62.6% of the total surplus by province, compared to 12.3% from British Columbia and 25.2% from Ontario. By 2009, Albertans were providing 95% of the surplus with British Columbians providing 5%. In 2010, Alberta was the only province recording a surplus. That fell to 93.0% in 2011, 80.9% in 2012, and 78.4% in 2013.
While the accounting can be complicated, to put things simply, when federal spend-ing in all the provinces and territories, that is all across Canada, exceeds revenues, the federal government borrows to make up the deficit (see footnote 2). As Eisen, Lafleur,

McMahon • Fiscal Federalism and the Dependency of Atlantic Canada • 25
fraserinstitute.org
and Palacios put it in the subtitle to A Friend in Need (2020), Albertans Continue to Keep Federal Finances Afloat. In other words, the federal surplus in Alberta stabilizes the fed-eral fiscal structure by reducing the borrowing the federal government would otherwise require to maintain spending levels.
While this remains true to some extent, it is a particularly apt description of Canadian finances during and following the 2007 financial crisis. The federal government ran large deficits at the time but, after the Chretien years, overall debt was low and the government had been recording surpluses. The nation was well positioned to face the crisis: govern-ment spending had been under control and Albertans, with a thriving petrochemical industry, could make a large contribution to the costs of Confederation.
This time will be much different. Governments are in a weaker fiscal position than last time. The federal government, which was in a strong fiscal position for the earlier finan-cial crisis, has been running large deficits for the past several years, pushing up the national debt. Both Alberta and Ontario, historically the largest contributors to fiscal federalism, have also been running up significant deficits and adding to debt. Moreover, both provinces have been weakened by policies that sapped economic growth (Lafleur and Palacios, 2019; Eisen and Hill, 2019).
Alberta has also been hit by the difficulty of sustaining its energy industry in light of a number of decisions, particularly related to pipelines, that have stalled development and created a flashing red light for those thinking of investing in the province (Stedman and Aliakbari, 2019). To make things worse, Alberta’s energy sector has been slammed by low prices, a situation exacerbated by a huge shrinkage of demand during COVID-19. Premier Jason Kenny described this as Alberta being hit by a “triple whammy”: “the fra-gility of our economy after five years of economic stagnation … the global spread of the novel coronavirus and, thirdly, the total collapse of energy” (Craddock, 2020).
The International Energy Agency (IEA), while it does not make precise predictions, argues: “The energy industry that emerges from this crisis will be significantly differ-ent from the one that came before” (Mammoser, 2020). It notes weak energy prices, an historic fall in investment, and increased, often government-subsidized, competition from alternate energy sources.
Alberta’s economic problems almost certainly mean that the relative fiscal burden of fed-eralism will shift dramatically to the taxpayers of Ontario and British Columbia. What does this mean? As noted earlier, there is only one taxpayer, not a separate federal or provincial or municipal taxpayer. Taxpayers mainly in Ontario and British Columbia will have to make up the difference in net transfers between have and have-not provinces that in earlier years was largely covered by taxes from energy provinces. This means in turn that taxpayers in Ontario and British Columbia will get less in the way of government

26 • Fiscal Federalism and the Dependency of Atlantic Canada • McMahon
fraserinstitute.org
services than they pay for. This could put a severe strain on the Ontario economy after years of weak growth as it attempts to emerge from the COVID-19 crisis. Certainly, if Ontario experienced a net negative transfer of 6.6% of its GDP, as it has in the past, recovery could be weakened.
Over the next few years, Ottawa’s fiscal transfers will add to the federal debt, and ser-vicing this debt is something that all Canadian taxpayers will have to pay for, though again the burden will largely fall on Ontario and British Columbia. However, it is not the COVID-19 fiscal crisis, aided and abetted by overspending in prosperous times, that is at the heart of the challenge of fiscal federalism. Instead, it is the long-term questions about the fairness and efficiency of Canada’s massive system of fiscal transfers combined with a seismic shift in the Canadian economy. Energy-rich provinces largely funded the transfer system. Federal revenues from these provinces allowed Ottawa to finance the transfers without resorting to large tax increases, or significant expenditure cuts, or bal-looning deficits.
McMahon • Fiscal Federalism and the Dependency of Atlantic Canada • 27
fraserinstitute.org
Impact on Atlantic Canada
Economic vulnerabilityThis study is mostly an accounting exercise to measure the scale of fiscal federalism, rather than a discussion of the political economy that created this system of transfers or its effects. However, this section will provide some quick observations on the political debate on fiscal federalism and a brief review of the literature that discusses the impact of the system on Atlantic Canada.
The size of federal net transfers has raised considerable resentment in both Alberta and Ontario. MacKinnon’s critique of fiscal federalism (2011) and his view that the system is inequitable was sponsored by the Ontario Chamber of Commerce. Fairness Alberta was recently formed by a number of prominent Albertans of differing political stripes to lobby for the “Urgent Need for Reform” of fiscal federalism that would reduce the flow of money out of Alberta (Fairness Alberta, 2020). Pressure to reform may well be increased by the current economic and fiscal crisis, the growth of federal deficits and debt, the magnitude of funds transferred through fiscal federalism compared to national deficits, the economic weakness in Alberta, and the shift of the burden to Ontario’s taxpayers.
The current structure of Employment Insurance (EI) may also come under pressure. EI has run a large surplus nationally and a huge deficit in Atlantic Canada. However, as a result of COVID-related unemployment, it will begin running large deficits nationally, adding to the nation’s fiscal challenges. As noted, the EI system has many critics of its fairness to workers nationally and of its economic efficiency. Yet, it underpins much of the Atlantic workforce (McMahon, 2000a). Any restructuring of fiscal federalism or EI would thus create significant economic and human dislocation in Atlantic Canada and yet efforts to reform both are ongoing and likely to continue.
Yet, it may well be that such a restructuring over the long term would benefit Atlantic Canadians. High taxes have been shown to dampen growth and overall taxes, particu-larly in Alberta and Ontario, have been higher than needed to fund the level of services provided since net federal transfers out of the provinces go to funding services in other provinces. But, there is a flip side to this. High and politicized government spending can also retard growth, reduce economic efficiency, and distort the labour market, so a re-ordering of fiscal federalism may bring benefits to the Atlantic provinces, though transition plans would be essential. Both the economy and the labour would need time to adjust to changes of the magnitude now on the table.

28 • Fiscal Federalism and the Dependency of Atlantic Canada • McMahon
fraserinstitute.org
Hindered growth and economic dependencyA number of studies that have examined fiscal federalism conclude that its structure damp-ens economic growth and reduces productivity while trapping recipient provinces into a cycle of dependency. One self-evident and ironic effect of fiscal federalism is that it creates incentives for “bad” economic policies almost by design. While much debate concerns what is “good” and “bad” policy, few would disagree that growth and prosperity should be a policy goal.10 Yet, fiscal federalism moves resources from provinces with successful growth policies to provinces with weaker growth and prosperity. As Jack Mintz writes:
Most harmful … is that the equalization program penalizes provinces that try to grow their economies either through resource development or better economic policies. When their per-capita tax base gets larger (say by reducing corporate income tax rates or developing mineral deposits), they lose equalization payments. This also means that equalization becomes an incentive to recipient governments to raise taxes to spend on pet programs. (Mintz, 2020)
MacKinnon also notes that the “regional subsidy system … punishes productivity, rewards inefficiency, [and] does so on a massive scale” (2011: 10).
Fiscal federalism raises equity as well as efficiency issues. Why should a poor waitress in Alberta subsidize well-off government officials in Nova Scotia. MacKinnon (2011) argues that many public services in “have-not” provinces are superior to those in “have” provinces. In other words, instead of creating equity, the programs increase inequity.
The greatest damage though is to recipient provinces:
Over the years, a substantial body of research has demonstrated that massive federal regional subsidies have greatly hindered economic growth in recipient provinces … [T]ransfers have encouraged the growth of large and inefficient public sectors which dominate recipient economies, have discouraged labour mobility, an essential fea-ture of efficient labour markets, and have elevated wage rates to levels that cannot be supported in the market component of the economy. (MacKinnon 2011: 7)
He also quotes McMahon: “Regional development policies in Atlantic Canada inflated wages, dampened investment, politicized the economy, weakened business activity, dis-couraged educational achievement and froze in place declining economic activities. It also likely had an effect on the regional psyche. People came to expect government to support them” (MacKinnon 2011: 7).
10. This is not to say that the only markers of good policy are growth and prosperity. Goals such as good public services, such as health and education, and reduced poverty are also important. But, economic growth provides resources for these goals too.

McMahon • Fiscal Federalism and the Dependency of Atlantic Canada • 29
fraserinstitute.org
The Equalization program, in particular, has incentives that encourage receiving prov-inces to increase taxes, even at the expense of economic growth. This is because raising taxes can increase the amount of equalization received by a province:
Since grant-receiving provinces can adjust the way their fiscal capacities are cal-culated and reflected in the equalization formula—by adjusting tax rates and spending, for instance—governments are confronted with incentives to design their fiscal regimes in ways that maximize the size of the grants they receive, even if the fiscal policies are designed for less-than-optimal economic efficiency. (Ferede, 2014: summary)
This is in part accomplished by keeping a poor province poor:
[W]hen measured tax bases respond negatively to tax rate increases, this [Equalization] formula may induce higher levels of distortionary taxation: increasing local tax rates causes measured tax bases to decline, as economic activity shifts to other regions of the country or to other, more lightly taxed forms—and so causes capacity equaliza-tion transfers to rise. Thus the grants in effect subsidize increases in distortionary taxes by equalization-receiving governments. The empirical work reported in this paper suggests indeed that the tax-raising effect of equalization grants can be large. (Smart, 2007: 14)
Ferede and Smart also find that such programs contain incentives to increase spending. Dahlby finds that, not only does equalization lead to increased taxes and spending, but that it includes incentives for favouring consumption over growth-enhancing programs:
Fiscal equalization grants will tend to reduce a recipient government’s marginal cost of public funds, leading to higher tax rates, excessive spending on consump-tive public services, and a biased tax mix in favour of those taxes where its tax base is below the standard tax base. With regard to expenditure policy, the recipient government will tend to under-provide tax base-enhancing expenditures such as education and infrastructure. (Dahlby, 2002: v)
Atlantic Canada’s growth weakened after federal transfers were dramatically increased in the early 1970s. Through the 1960s, Atlantic Canada was catching up with the rest of Canada, growth was faster, unemployment (except in Newfoundland & Labrador) was roughly at the Canadian average, and private-sector investment on a per-capita basis had risen to about the Canadian average (McMahon, 2000a).
Fiscal transfers in the 1960s were small by today’s standards and yet the Atlantic econ-omy was a catch-up success story. Then in the early 1970s, Ottawa opened the fiscal floodgates, including regionally extended Unemployment Insurance (now Employment

30 • Fiscal Federalism and the Dependency of Atlantic Canada • McMahon
fraserinstitute.org
Insurance). This made Unemployment Insurance (UI) much easier to collect and con-siderably more generous in Atlantic Canada. Unsurprisingly, both unemployment and labour shortages soared in Atlantic Canada as employers had to bid against generous unemployment payments, initially with individuals needing only eight weeks of work to qualify for 51 weeks of payments.
As public spending increased, it crowded out the private sector. A study commissioned by the government development agencies found that the great amount of government money available to business through subsidies and contracts made businesses less com-petitive and more politicized as many switched from creating products for the market place to landing government subsidies and contracts (O’Farrell, 1990).
The current economic and fiscal difficulties combined with the history of deep concerns about the structure of fiscal federalism could lead to reforms that would have signifi-cant ramifications for Atlantic Canada, possibly negative in the short run but positive in the long run.

McMahon • Fiscal Federalism and the Dependency of Atlantic Canada • 31
fraserinstitute.org
Conclusion
COVID-19 pandemic is an unprecedented challenge to modern economies. Even if the course of COVID-19 were understood, the economic side of things would contain mys-teries. The time-frame, trajectory, and magnitude of both the economic decline and recovery would be surrounded by uncertainty. Even in a best-case scenario, where Canada gets back to something like normal sometime this year, the economic forecasts indicate large ongoing deficits. This will put a huge strain on fiscal federalism and force policy makers and governments to take a close look at the state of fiscal federalism and ask whether the current structure is sustainable or even worth sustaining.
The state of the energy sector adds urgency to the need to re-examine fiscal federalism. For over a decade, Alberta’s taxpayers have funded the lion’s share of federal funding flowing to Atlantic Canada and Quebec. The decline of the energy industry will remove this source of funding. To return to a federal balance, Ottawa will have to dramatically cut spending, reform fiscal federalism, or raise taxes, which could result in little increase or even a decrease in revenues. However, the deeper and longer-term questions concern the fairness and efficiency of Canada’s massive system of fiscal transfers.
Appendix
The main purpose of this paper is to examine the overall fiscal flows in Canada to gain a sense of the strains this may create after COVID-19 has been contained. The federal government spends money through a multitude of programs. Some of these are specific-ally regional or part of the flows between various levels of government. Other programs are for national interest or transfer money directly to Canadians rather than other gov-ernments or government organizations. This Appendix analyzes the structure of fiscal flows in Canada on this basis for interested readers, even though this is somewhat to the side of the primary objective of this paper.
Defence spendingDefence is a national concern and thus, arguably, defence expenditures should not be considered part of fiscal federalism. Spending decisions, at least theoretically, are made independently of regional, policy, or equity considerations, considering only national

32 • Fiscal Federalism and the Dependency of Atlantic Canada • McMahon
fraserinstitute.org
defence. Independent of other policy considerations, defence spending will be natur-ally biased to coastal provinces, particularly Nova Scotia, and biased away from inland provinces, like Alberta.
In table 3a, the net transfer is corrected to normalize defence spending. If a province has above-average military spending then the amount of spending above the average is sub-tracted from the net transfer. Thus, for example, per-capita defence spending in Nova Scotia is the highest in Canada. In 2019, it was $2,757 compared to the Canadian average of $522, or $2,175 more than the Canadian average. This amount was then subtracted from the “Federal government surplus or deficit” of $7,760, bringing the net transfer to Nova Scotia to $5,585.
Given Canada’s relatively low level of defence spending, the adjustments are small except for Nova Scotia and, because of that, Atlantic Canada. Once the adjustment is made, the average net transfer to Atlantic Canada is $5,343 per person or $69,463 per person over the period. Alberta is much less affected. The average per-person net transfer falls to $5,385 or $70,000 in total.
Federal program spendingThis is spending on federal programs and involves direct federal transfers to households. Some would argue that these monies should not be included in fiscal federalism flows. Household transfers are to individuals, not to other governments, departments, or bod-ies. They should treat an individual in Alberta the same as an individual in Nova Scotia.
Spending for many of these programs, such as the Military Veterans Benefits, Social Assistance, and the Old Age Security Guaranteed Income Supplement, will nonethe-less be biased towards the Atlantic region and away from Alberta. Aside from the rela-tively large number of retired military personnel who live in Atlantic Canada, this is also because the demographic structure of Atlantic Canada has a higher proportion of older citizens and poorer citizens who disproportionately benefit from these programs.
Since household transfers do not have a regional component, the overall net transfers to provinces perhaps should be adjusted for the level of federal payments to households. In other words, if per-capita spending on social programs in, say, Prince Edward Island, is higher on a per-capita basis than the national average, the difference should be deducted from net transfers. However, one of these programs, regionally extended Employment Insurance (EI), does treat individuals differently in various regions. Thus, the average Albertan is not treated the same as the average Nova Scotian under this system.11 Albertans have a less generous program than most Nova Scotians, with much restricted access.
11. Since the system is formally based on unemployment rates, it will also create differences in treatment within a province.
McMahon • Fiscal Federalism and the Dependency of Atlantic Canada • 33
fraserinstitute.org
Thus, EI in part is designed to benefit particular regions or provinces and, therefore, differences in EI payments should be considered part of fiscal federalism and the flows between the provinces. The simplest way to deal with this is to subtract net EI flows from other social spending that treats all Canadian equally. Table 3a shows the impact on net transfers when social spending, excluding Employment Insurance, is normalized across Canada
Once this is done, transfers to households can be adjusted in the same way as defence spending to equalize spending across Canada. The line “Adj. for defence/household” reports this adjustment. Using this metric, per-capita net transfers to Atlantic Canada fall to an average of $4,797 per year or $62,366 for the full period. Net transfers out of Alberta are $5,049 per year or $65,636 for the full period per person.
The bottom lineHowever, having shown the calculations for full transparency, it is the overall numbers that will be cited in this report—in other words, the bottom line for difference between federal expenditure and revenue for each province and territory. Although household transfers are direct payments to individuals and have been adjusted for EI payments, they are nonetheless spending to which all Canadians contribute and involve large inter-provincial net transfers.
Similarly, Alberta, as the largest net contributor to Confederation, is also by definition the largest net contributor to the military and to transfers to individuals, and this should be counted in the net contribution to record the overall flows in fiscal federalism. Thus, these corrections are not made for the 1997–2009 series. While the adjustments affect the size of fiscal flows, they do not affect the overall structure of the flows, with large amounts of funds flowing into Atlantic Canada and Quebec and out of Alberta and Ontario. The sums remain large, whether adjusted or not.

fraserinstitute.org

McMahon • Fiscal Federalism and the Dependency of Atlantic Canada • 35
fraserinstitute.org
References
Canada, Department of Finance (2020). Major Federal Transfers. <https://www.canada.ca/
en/department-finance/programs/federal-transfers/major-federal-transfers.html>, as of April 19, 2020.
Canada, Parliamentary Budget Office [PBO] (2020). Fall Economic Statement 2020: Issues for Parliamentarians (November). <https://www.pbo-dpb.gc.ca/en/blog/news/RP-2021-
037-S--fall-economic-statement-2020-issues-parliamentarians--enonce-economique-automne-2020-
enjeux-parlementaires>, as of January 5, 2020.
Courchene, Thomas J., and John R. Allan (2009). A Short History of EI and a Look at the Road Ahead. Policy Options (September 1). Institute for Research on Public Policy. <https://policyoptions.irpp.org/magazines/employment-insurance/a-short-history-of-ei-and-a-
look-at-the-road-ahead/>, as of May 8, 2020.
Craddock, Derek (2020) Premier Kenney Responds to Federal Support for COVID-19. 660 News: Calgary, March 11. <https://www.660citynews.com/2020/03/11/premier-kenney-
responds-to-federal-support-for-covid-19/>, as of May 7, 2020.
Dahlby, Bev (2002). The Incentive Effects of Fiscal Equalization Grants. Paper presented at the AIMS/MEI/FCPP Conference, Equalization: Welfare Trap or Helping Hand? (Montreal, October 25, 2001). Atlantic Institute for Market Studies and Frontier Centre for Public Policy. <https://www.fcpp.org/pdf/equalization_papers4.pdf>, as of July 29, 2020.
Eisen, Ben (2010). Stealth Equalization: How Federal Government Employment Acts as a Regional Economic Subsidy in Canada. Frontier Centre for Public Policy. <https://fcpp.
org/files/1/PS95_Stealth_NV05F5.pdf>, as of July 22, 2020.
Eisen, Ben, Joel Emes, Steve Lafleur, and Tegan Hill (2020). Equalization and Stabilization Post-Recession: Is Canada Ready? Fraser Institute. <https://www.
fraserinstitute.org/sites/default/files/equalization-and-stabilization-post-recession-is-canada-ready.
pdf>, as of July 15, 2020.
Eisen, Ben, and Tegan Hill (2019). The Power of Comprehensive Policy Reform: Lessons for Ontario from Michigan. Fraser Institute. <https://www.fraserinstitute.org/sites/default/files/
power-of-comprehensive-policy-reform-ontario-michigan.pdf>, as of May 2, 2020.
Eisen, Ben, Steve Lafleur, Jake Fuss, and Tegan Hill (2019). Why Is Equalization Still Growing? Fraser Institute. <https://www.fraserinstitute.org/studies/why-is-equalization-still-
growing>, as of April 27, 2020.
36 • Fiscal Federalism and the Dependency of Atlantic Canada • McMahon
fraserinstitute.org
Eisen, Ben, Steve Lafleur, and Milagros Palacios (2020). A Friend in Need: How Albertans Continue to Keep Federal Finances Afloat, 2020. Fraser Institute. <https://
www.fraserinstitute.org/studies/a-friend-in-need-how-albertans-continue-to-keep-federal-finances-
afloat-2020>, as of April 29, 2020.
Eisen, Ben, and Milagros Palacios (2020). The Great Convergence: Measuring the Fiscal Capacity Gap between “Have” and “Have-Not” Provinces. Fraser Institute. <https://www.
fraserinstitute.org/studies/great-convergence-measuring-the-fiscal-capacity-gap-between-have-and-
have-not-provinces>, as of January 11, 2021.
Fairness Alberta (2020). Fairness Alberta Launches Public Awareness Campaign. <https://
www.fairnessalberta.ca/fairness-alberta-launches-public-awareness-campaign/>, as of October 21, 2020.
Ferede, Ergete (2014). The Incentive Effects of Equalization Grants on Fiscal Policy. SPP Research Paper 7, 23. The School of Public Policy, University of Calgary. <https://www.
policyschool.ca/wp-content/uploads/2016/03/ferede-equalization.pdf>, as of July 29, 2020.
Fuss, Jake, and Milagros Palacios (2020). The Growing Debt Burden for Canadians. <https://www.fraserinstitute.org/studies/growing-debt-burden-for-canadians>, as of April 15, 2020
Government of Canada (2020). EI Regular Benefits: Eligibility. <https://www.canada.ca/en/
services/benefits/ei/ei-regular-benefit/eligibility.html>, as of May 5.
Graney, Emma, Kelly Cryderman, and Robert Fife (2020). Alberta Unemployment to Likely Surpass 25 Per Cent Because of Pandemic, Kenney Says. Globe and Mail. <https://www.theglobeandmail.com/business/article-alberta-unemployment-to-likely-surpass-25-
percent-because-of-pandemic/>, as of May 7, 2020.
Hall, Peter (2020). Global Economic Outlook: We’re Not through The Worst Bit…Yet. EDC Economics. Export Development Corporation. <https://www.edc.ca/en/weekly-
commentary/global-outlook-covid-19.html>, as of May 2, 2020.
Hill, Tegan, Milagros Palacios, and Jake Fuss (2020). Examining Federal Debt in Canada by Prime Minister since Confederation, 2020. Fraser Institute. <https://
www.fraserinstitute.org/studies/examining-federal-debt-in-canada-by-prime-ministers-since-
confederation-2020>, as of April 25.
Lafleur, Steve, and Milagros Palacios (2019). Lessons from the Lone Star State: Comparing the Economic Performance of Alberta and Texas. Fraser Institute. <https://
www.fraserinstitute.org/studies/lessons-from-the-lone-star-state-comparing-the-economic-
performance-of-alberta-and-texas>, as of May 3, 2020.

McMahon • Fiscal Federalism and the Dependency of Atlantic Canada • 37
fraserinstitute.org
MacKinnon, David (2011). Dollars and Sense: A Case for Modernizing Canada’s Transfer Agreements. Ontario Chamber of Commerce.
Makarenko, Jay (2009). Employment Insurance in Canada: History, Structure and Issues. Mapleleafweb. <https://www.mapleleafweb.com/features/employment-insurance-canada-
history-structure-and-issues.html>, as of May 5, 2020
Mammoser, Alan (2020). IEA: The Energy Sector Will Never Be the Same Again. OilPrice.com ( June 15). <https://oilprice.com/Energy/Energy-General/IEA-The-Energy-Sector-Will-
Never-Be-The-Same-Again.html>, as of July 15, 2020.
McMahon, Fred (2000a). Retreat from Growth: Atlantic Canada and the Negative-Sum-Economy. Atlantic Institute for Market Studies. <https://www.aims.ca/books-papers/retreat-
from-growth/>, as of November 18, 2020.
McMahon, Fred (2000b). Road to Growth: How Lagging Economies Become Prosperous. Atlantic Institute for Market Studies. <https://www.aims.ca/books-papers/road-to-growth/>, as of November 18, 2020.
McMahon, Fred (2020). Extended Employment Insurance Now Open to All: Atlantic Canada’s Warning for Other Provinces. Fraser Institute. <https://www.fraserinstitute.org/
studies/extended-employment-insurance-now-open-to-all>, as of November 19, 2020.
Mintz, Jack M. (2020). Scrap Equalization and Replace It with Something Better. Financial Post ( January 28). <https://financialpost.com/opinion/jack-mintz-scrap-equalization-
and-replace-it-with-something-better>, as of July 22, 2020.
O’Farrell, P.N. (1990). Small Manufacturing Competitiveness and Performance: An Analysis of Matched Pairs in Nova Scotia and New England. Produced in association with Gardner Pinfold Consulting Economists Ltd. Commissioned by the Nova Scotia Department of Industry, Trade and Technology, and Atlantic Canada Opportunities Agency.
Rathore, Mumal, and Indradip Ghosh (April 28, 2020). Canada’s Economy in Deepest Recession on Record, U-Shaped Recovery Likely: Reuters Poll. Business Newswire (April 28). <https://ca.reuters.com/article/businessNews/idCAKCN22A26C>, as of April 29, 2020.
Smart, Michael (2007). Raising Taxes through Equalization. CESifo Working Paper, No. 1926. Center for Economic Studies and ifo Institute (CESifo), Munich. <https://
www.ifo.de/DocDL/cesifo1_wp1926.pdf>, as of July, 2020.

38 • Fiscal Federalism and the Dependency of Atlantic Canada • McMahon
fraserinstitute.org
Statistics Canada (2010) Table 36-10-0314-01. Archived - Government Sector Revenue and Expenditure, Provincial Economic Accounts, Annual, 1981–2009. <https://www150.
statcan.gc.ca/t1/tbl1/en/cv.action?pid=3610031401#timeframe>, as of April 19, 2020.
Statistics Canada (2020a). Table 17-10-0005-01. Population Estimates on July 1st, by Age and Sex. <https://www150.statcan.gc.ca/t1/tbl1/en/tv.action?pid=1710000501>, as of April 19, 2020.
Statistics Canada (2020b). Table 18-10-0005-01. Consumer Price Index, Annual Average, Not Seasonally Adjusted. <https://www150.statcan.gc.ca/t1/tbl1/en/cv.action?pid=1810000501>, as of April 9, 2020
Statistics Canada (2020c). Table 36-10-0402-01. Gross Domestic Product (GDP) at Basic Prices, by Industry, Provinces and Territories. <https://www150.statcan.gc.ca/t1/tbl1/en/
cv.action?pid=3610040201#timeframe>, as of April 14, 2020.
Statistics Canada (2020d). Table 36-10-0450-01. Revenue, Expenditure and Budgetary Balance - General Governments, Provincial and Territorial Economic Accounts. <https://
www150.statcan.gc.ca/t1/tbl1/en/tv.action?pid=3610045001>, as of November 13, 2020.
Statistics Canada (2020e). Table 14-10-0018-01. Labour Force Characteristics by Sex and Detailed Age Group, Annual, Inactive. <https://www150.statcan.gc.ca/t1/tbl1/en/
cv.action?pid=1410009001>, as of April 29, 2020
Stedman, Ashley, and Elmira Aliakbari (2019). Canada-US Energy Sector Competitiveness Survey 2019. Fraser Institute. <https://www.fraserinstitute.org/studies/canada-
us-energy-sector-competitiveness-survey-2019>, as of April 28.
Tasker, John Paul (2020). May and Blanchet Declare the Oilpatch “Dead,” Warn Ottawa against Financial Supports. CBC News (May 6). <https://www.cbc.ca/news/politics/
oil-is-dead-green-bloc-parties-1.5557725>, as of May 7, 2020.
Tombe, Trevor (2018). “Final and Unalterable”—but Up for Negotiation: Federal-Provincial Transfers in Canada. Finances of the Nation. Canadian Tax Journal / Revue Fiscale Canadienne 66, 4: 871–917. <https://econ.ucalgary.ca/manageprofile/sites/econ.ucalgary.
ca.manageprofile/files/unitis/publications/1-9565968/Tombe_2018_CTJ.pdf>, as of July 16, 2020.
West, Stephen (2007). Federal Government Revenue and Spending by Province: A Scorecard of Winners and Losers in Confederation? Catalogue no. 11-010-X20070029586. Canadian Economic Observer. <https://www150.statcan.gc.ca/n1/en/
catalogue/11-010-X20070029586>, as of April, 29, 2020.

McMahon • Fiscal Federalism and the Dependency of Atlantic Canada • 39
fraserinstitute.org
About the author
Fred McMahonFred McMahon is a Fraser Institute Resident Fellow and holder of the Dr. Michael A. Walker Research Chair in Economic Freedom. He has an M.A. in Economics from McGill University. Mr. McMahon manages the Economic Freedom of the World Project and coordin-ates the Economic Freedom Network, an international alliance of over 100 think-tank partners in about 100 nations and territories. His research focuses on global regional issues such as develop-ment, trade, governance, and economic structure. Mr. McMahon is the author of numerous research articles and several books including, Looking the Gift Horse in the Mouth: The Impact of Federal Transfers on Atlantic Canada, which won the Sir Antony Fisher International Memorial Award for advancing public-policy debate, Road to Growth: How Lagging Economies Become Prosperous, and Retreat from Growth: Atlantic Canada and the Negative Sum Economy. He has written for numerous publi-cations including the European Journal of Political Economy, SAIS Journal (School of Advanced International Studies, Johns Hopkins University), Wall Street Journal, Policy Options, National Post, Time (Canada), Globe and Mail, Ottawa Citizen, and most other major Canadian newspapers. Recent research articles of which he has been the author or a co-author include: Economic Freedom of North America, Quebec Prosperity: Taking the Next Step, The Unseen Wall: The Fraser Institute’s Annual Trade Survey, and Economic Freedom of the Arab World.
AcknowledgmentsThe author wishes to thank the Lotte & John Hecht Memorial Foundation for its gener-ous support of this project. He would also like to express thanks to David MacKinnon for his careful review and insights on fiscal federalism; Steve Globerman and Ben Eisen for their comprehensive advice on this paper, which has made it considerably better; and Milagros Palacios for advice on changes in Statistics Canada’s data generation. All remaining errors and oversights are the responsibility of the author. As the researcher has worked independently, the views and conclusions expressed in this paper do not neces-sarily reflect those of the Board of Directors of the Fraser Institute, the staff, or supporters.

40 • Fiscal Federalism and the Dependency of Atlantic Canada • McMahon
fraserinstitute.org
Publishing Information
DistributionThese publications are available from <http://www.fraserinstitute.org> in Portable Document Format (PDF) and can be read with Adobe Acrobat® or Adobe Reader®, versions 7 or later. Adobe Acrobat Reader® DC, the most recent version, is available free of charge from Adobe Systems Inc. at <http://get.adobe.com/reader/>. Readers having trouble view-ing or printing our PDF files using applications from other manufacturers (e.g., Apple’s Preview) should use Reader® or Acrobat®.
Ordering publicationsTo order printed publications from the Fraser Institute, please contact us via e-mail: [email protected]; telephone: 604.688.0221, ext. 580 or, toll free, 1.800.665.3558, ext. 580; or fax: 604.688.8539.
MediaFor media enquiries, please contact our communications department via e-mail: [email protected]; telephone: 604.714.4582.
CopyrightCopyright © 2021 by the Fraser Institute. All rights reserved. No part of this publication may be reproduced in any manner whatsoever without written permission except in the case of brief passages quoted in critical articles and reviews.
Date of issue ISBN2021 978-0-88975-631-1
CitationFred McMahon (2021). Fiscal Federalism and the Dependency of Atlantic Canada. Fraser Institute. <http://www.fraserinstitute.org>.
Supporting the Fraser InstituteTo learn how to support the Fraser Institute, please contact us via post: Development Department, Fraser Institute, Fourth Floor, 1770 Burrard Street, Vancouver, British Columbia, V6J 3G7, Canada; telephone: toll-free to 1.800.665.3558, ext. 548; e-mail: development@
fraserinstitute.org; or visit our webpage: <http://www.fraserinstitute.org/support-us/overview.aspx>.

McMahon • Fiscal Federalism and the Dependency of Atlantic Canada • 41
fraserinstitute.org
About the Fraser Institute
Our mission is to improve the quality of life for Canadians, their families and future gen-erations by studying, measuring and broadly communicating the effects of government policies, entrepreneurship and choice on their well-being.
Notre mission consiste à améliorer la qualité de vie des Canadiens et des générations à venir en étudiant, en mesurant et en diffusant les effets des politiques gouvernementales, de l’entrepreneuriat et des choix sur leur bien-être.
Purpose, Funding, and Independence
The Fraser Institute provides a useful public service. We report objective information about the economic and social effects of current public policies, and we offer evidence-based research and education about policy options that can improve the quality of life.
The Institute is a non-profit organization. Our activities are funded by charitable dona-tions, unrestricted grants, ticket sales, and sponsorships from events, the licensing of products for public distribution, and the sale of publications.
All research is subject to rigorous review by external experts, and is conducted and published separately from the Institute’s Board of Directors and its donors.
The opinions expressed by authors are their own, and do not necessarily reflect those of the Institute, its Board of Directors, its donors and supporters, or its staff. This publica-tion in no way implies that the Fraser Institute, its directors, or staff are in favour of, or oppose the passage of, any bill; or that they support or oppose any particular political party or candidate.
As a healthy part of public discussion among fellow citizens who desire to improve the lives of people through better public policy, the Institute welcomes evidence-focused scrutiny of the research we publish, including verification of data sources, replication of analytical methods, and intelligent debate about the practical effects of policy recommendations.
42 • Fiscal Federalism and the Dependency of Atlantic Canada • McMahon
fraserinstitute.org
* deceased; † Nobel Laureate
Peer review —validating the accuracy of our researchThe Fraser Institute maintains a rigorous peer review process for its research. New re-search, major research projects, and substantively modified research conducted by the Fraser Institute are reviewed by experts with a recognized expertise in the topic area being addressed. Whenever possible, external review is a blind process. Updates to pre-viously reviewed research or new editions of previously reviewed research are not re-viewed unless the update includes substantive or material changes in the methodology.
The review process is overseen by the directors of the Institute’s research departments who are responsible for ensuring all research published by the Institute passes through the appropriate peer review. If a dispute about the recommendations of the reviewers should arise during the Institute’s peer review process, the Institute has an Editorial Advisory Board, a panel of scholars from Canada, the United States, and Europe to whom it can turn for help in resolving the dispute.
Editorial Advisory BoardMembers
Past members
Prof. Terry L. AndersonProf. Robert BarroProf. Jean-Pierre CentiProf. John ChantProf. Bev DahlbyProf. Erwin DiewertProf. Stephen EastonProf. J.C. Herbert EmeryProf. Jack L. Granatstein
Prof. Herbert G. GrubelProf. James GwartneyProf. Ronald W. JonesDr. Jerry JordanProf. Ross McKitrickProf. Michael ParkinProf. Friedrich SchneiderProf. Lawrence B. SmithDr. Vito Tanzi
Prof. Armen Alchian*Prof. Michael Bliss*Prof. James M. Buchanan* †
Prof. Friedrich A. Hayek* †
Prof. H.G. Johnson*
Prof. F.G. Pennance*Prof. George Stigler* †
Sir Alan Walters*Prof. Edwin G. West*