Embed Size (px)
Citation preview
1
Fiscal Developments: Fourth Quarter and Full Year 2014
Contents Fiscal Summary Full Year 2014: Budget Execution Highlights.......................................................3
B. Revenue Performance 2014...........................................................................................................6
Total Net/Gross Revenues................................................................................................................6
Domestic Revenues..........................................................................................................................6
Clearance revenues.........................................................................................................................8
C. Expenditures................................................................................................................................10
Total Expenditures.........................................................................................................................10
Wages and Salaries.......................................................................................................................11
Social Contributions......................................................................................................................12
Use of Goods and Services............................................................................................................13
Transfers........................................................................................................................................14
Minor Capital................................................................................................................................14
Interest...........................................................................................................................................14
Net Lending...................................................................................................................................15
Development Expenditures............................................................................................................15
D. Balance and financing.................................................................................................................16
Balance..........................................................................................................................................16
Development Financing.................................................................................................................16
E. Arrears..........................................................................................................................................17
2
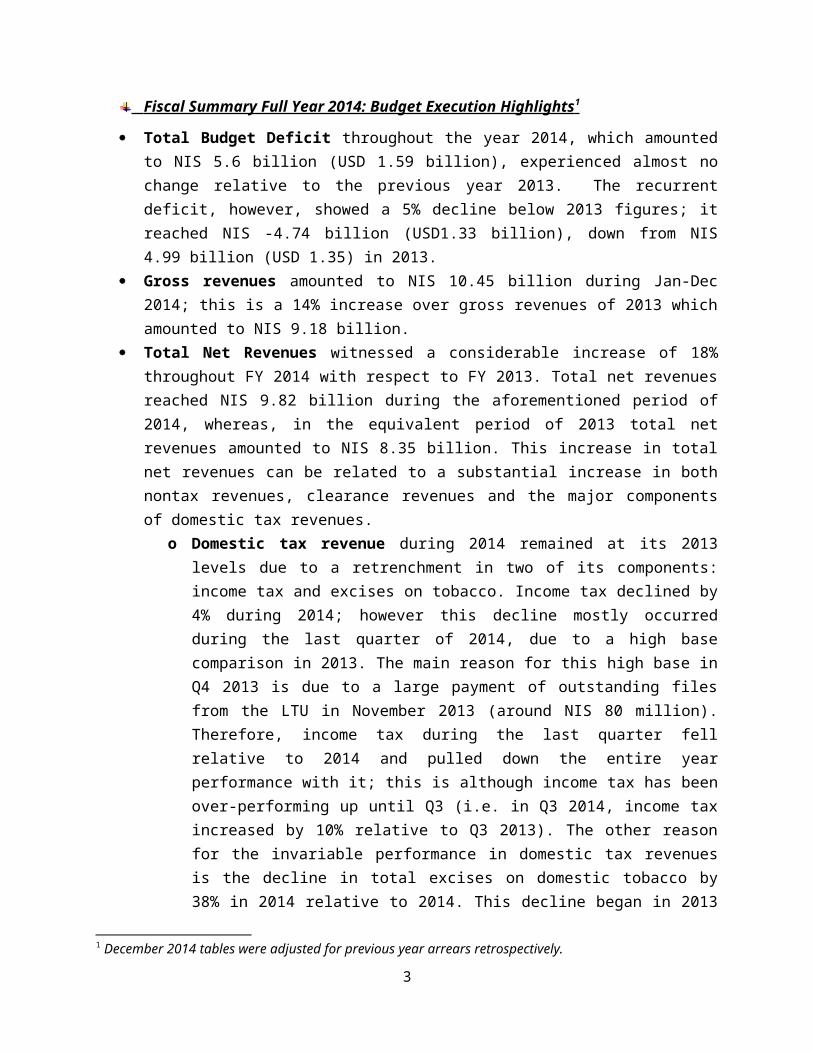
Fiscal Summary Full Year 2014: Budget Execution Highlights 1
Total Budget Deficit throughout the year 2014, which amounted to NIS 5.6 billion (USD 1.59 billion), experienced almost no change relative to the previous year 2013. The recurrent deficit, however, showed a 5% decline below 2013 figures; it reached NIS -4.74 billion (USD1.33 billion), down from NIS 4.99 billion (USD 1.35) in 2013.
Gross revenues amounted to NIS 10.45 billion during Jan-Dec 2014; this is a 14% increase over gross revenues of 2013 which amounted to NIS 9.18 billion.
Total Net Revenues witnessed a considerable increase of 18% throughout FY 2014 with respect to FY 2013. Total net revenues reached NIS 9.82 billion during the aforementioned period of 2014, whereas, in the equivalent period of 2013 total net revenues amounted to NIS 8.35 billion. This increase in total net revenues can be related to a substantial increase in both nontax revenues, clearance revenues and the major components of domestic tax revenues.
o Domestic tax revenue during 2014 remained at its 2013 levels due to a retrenchment in two of its components: income tax and excises on tobacco. Income tax declined by 4% during 2014; however this decline mostly occurred during the last quarter of 2014, due to a high base comparison in 2013. The main reason for this high base in Q4 2013 is due to a large payment of outstanding files from the LTU in November 2013 (around NIS 80 million). Therefore, income tax during the last quarter fell relative to 2014 and pulled down the entire year performance with it; this is although income tax has been over-performing up until Q3 (i.e. in Q3 2014, income tax increased by 10% relative to Q3 2013). The other reason for the invariable performance in domestic tax revenues is the decline in total excises on domestic tobacco by 38% in 2014 relative to 2014. This decline began in 2013 when the PNA decided to reduce support for domestically produced tobacco. Overall, however, the decline in domestic tobacco was accompanied by an even greater increase in imported tobacco. Hence, even with the decline in income tax during Q4 2014, domestic tax revenue performance would have exceeded the previous year’s performance by 7.6%, if the tobacco excises are exempted from analysis due to change in government policy.
o Non-tax Revenue was higher by 5% relative to 2013 mostly because a 8% increase in Fees and charges by 8%. Investment profits, disbursed by the PIF, witnessed a decline of 37% comparing to 2013 and fell below their 2014 budget target by 60%.
o Clearance Revenue grew by 20% in 2014 relative to 2013; the high performance is mostly due to the over-performance in VAT, customs and petroleum excise where they grew by 13%, 22% and 26% during Jan-Dec 2014 relative to the previous year. This is due to improved data sharing with Israel, regular field campaigns by PA officials and more thorough follow up on the revenue collection process.
o Tax refunds fell by 25% in 2014 over 2013; this is due to a decline fuel subsidy by 27% due to PNA policy to reduce fuel subsidies to sustainable levels; the
1 December 2014 tables were adjusted for previous year arrears retrospectively.
3
implementation of this policy was accelerated by the decline in international fuel prices during the five months of 2014.
Total Expenditure and Net Lending during 2014 witnessed a 9% increase relative to 2013, and exceeded its budget target by 4.6%. This increase is mostly attributed to:
o An increase in use of goods & services, which increased by 28% relative to the previous year, and was 20% above its budgeted mark. The reason for this increase in use of goods is mostly due to high health referral costs, which are directly deducted from clearance revenues; in 2014, health deductions amounted to NIS 348 million (a 44% increase over 2013 where health deductions amounted to a lesser NIS 241 million).
o Other expenditure components that contributed to the augmented expenditures are the wage bill and social contributions, which both have increased by 6% in 2014 over 2013. The wage bill exceeded its budget target by 1%; this increase in the wage bill could be attributed to the implementation of court orders and agreements reached with labor unions regarding cost of living, promotions, and risk allowances.
o Transfers increased by a slight 3%, however it is below the budget mark by 7.5%.o Minor Capital, the smallest expenditure component, was above 2013 figures by
107%; nonetheless it reached 80% of its budget target. o Interest Payments was NIS 199 million, lower by 39% relative to 2013 which
amounted to NIS 325 million. Domestic interest payments reached NIS 183 million declining by 40% below 2013 figures, and external interest payments amounted to NIS 15 million, also declining by 18% below 2013 figures.
o Net Lending increased by 35% compared to 2013, this increase is mainly attributed to increased clearance deductions of water, electricity and sewage by 10%, 27%, and 5% respectively.
Development Expenditure grew by 39% in 2014 relative to 2013; this, however, remains below the budget target by 26%.
External budget support reached NIS 3.68 billion, a decline of 19% below 2013 figures and 23% below its budget target. Development financing reached NIS 726 million, representing an increase of 89% above 2013 figure, but still fell below its budget target by 33%.
Total domestic debt stock amounted to NIS 4.4 billion at the end of December 2014; this is a decline of 1.6% over November 2014.
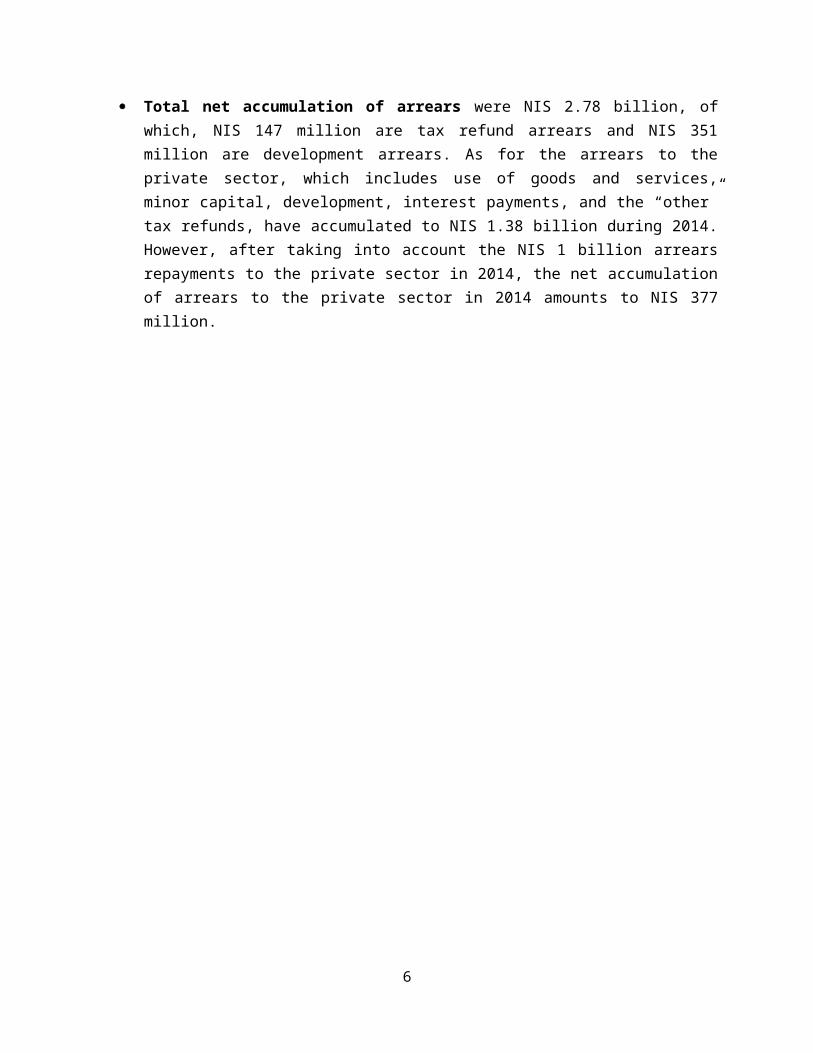
Total net accumulation of arrears were NIS 2.78 billion, of which, NIS 147 million are tax refund arrears and NIS 351 million are development arrears. As for the arrears to the private sector, which includes use of goods and services, minor capital, development, interest payments, and the “other” tax refunds, have accumulated to NIS 1.38 billion during 2014. However, after taking into account the NIS 1 billion arrears repayments to the private sector in 2014, the net accumulation of arrears to the private sector in 2014 amounts to NIS 377 million.
4
5
Full Year 14 Full Year 13
FY 2014/ FY 2013
Q4 2014 Q4 2013Q4 2014/ Q4 2013
2014 Budget
% of budgetDeviation
from budget
Deviation from
budget
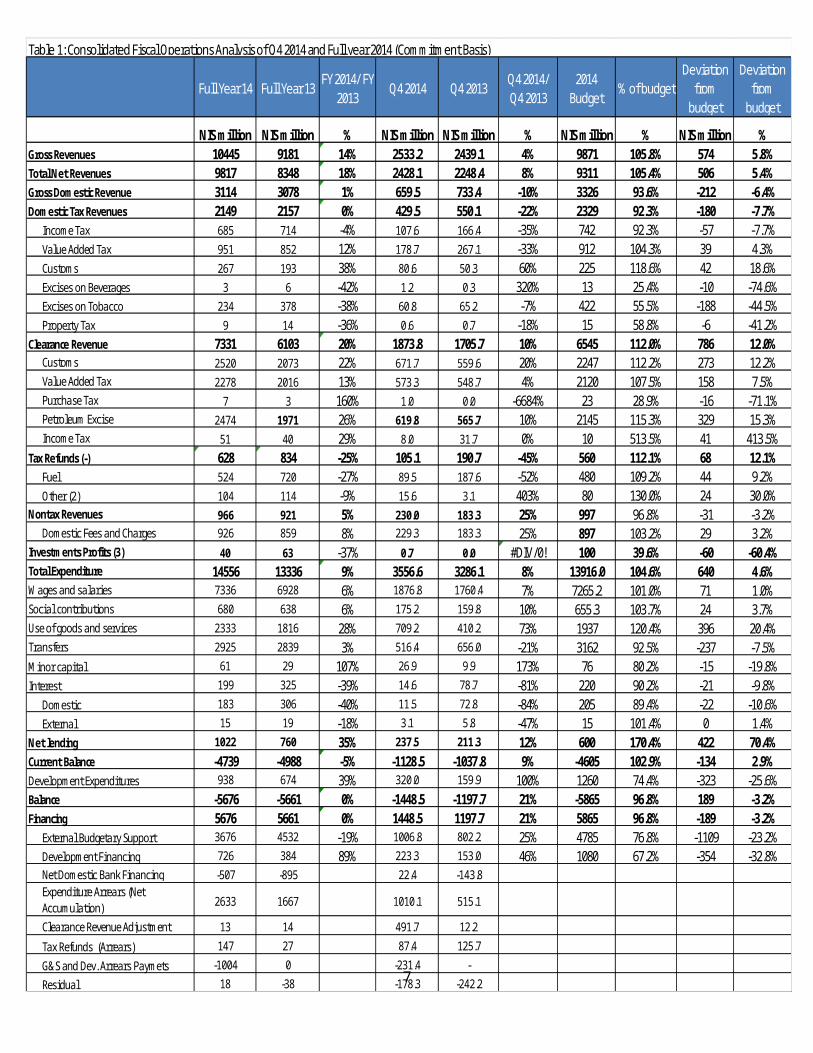
NIS million NIS million % NIS million NIS million % NIS million % NIS million %Gross Revenues 10445 9181 14% 2533.2 2439.1 4% 9871 105.8% 574 5.8%Total Net Revenues 9817 8348 18% 2428.1 2248.4 8% 9311 105.4% 506 5.4%Gross Domestic Revenue 3114 3078 1% 659.5 733.4 -10% 3326 93.6% -212 -6.4%Domestic Tax Revenues 2149 2157 0% 429.5 550.1 -22% 2329 92.3% -180 -7.7%
Income Tax 685 714 -4% 107.6 166.4 -35% 742 92.3% -57 -7.7%Value Added Tax 951 852 12% 178.7 267.1 -33% 912 104.3% 39 4.3%Customs 267 193 38% 80.6 50.3 60% 225 118.6% 42 18.6%Excises on Beverages 3 6 -42% 1.2 0.3 320% 13 25.4% -10 -74.6%Excises on Tobacco 234 378 -38% 60.8 65.2 -7% 422 55.5% -188 -44.5%Property Tax 9 14 -36% 0.6 0.7 -18% 15 58.8% -6 -41.2%
Clearance Revenue 7331 6103 20% 1873.8 1705.7 10% 6545 112.0% 786 12.0%Customs 2520 2073 22% 671.7 559.6 20% 2247 112.2% 273 12.2%Value Added Tax 2278 2016 13% 573.3 548.7 4% 2120 107.5% 158 7.5%Purchase Tax 7 3 160% 1.0 0.0 -6684% 23 28.9% -16 -71.1%Petroleum Excise 2474 1971 26% 619.8 565.7 10% 2145 115.3% 329 15.3%Income Tax 51 40 29% 8.0 31.7 0% 10 513.5% 41 413.5%
Tax Refunds (-) 628 834 -25% 105.1 190.7 -45% 560 112.1% 68 12.1%Fuel 524 720 -27% 89.5 187.6 -52% 480 109.2% 44 9.2%Other (2) 104 114 -9% 15.6 3.1 403% 80 130.0% 24 30.0%
Nontax Revenues 966 921 5% 230.0 183.3 25% 997 96.8% -31 -3.2%Domestic Fees and Charges 926 859 8% 229.3 183.3 25% 897 103.2% 29 3.2%
Investments Profits (3) 40 63 -37% 0.7 0.0 #DIV/0! 100 39.6% -60 -60.4%Total Expenditure 14556 13336 9% 3556.6 3286.1 8% 13916.0 104.6% 640 4.6%Wages and salaries 7336 6928 6% 1876.8 1760.4 7% 7265.2 101.0% 71 1.0%Social contributions 680 638 6% 175.2 159.8 10% 655.3 103.7% 24 3.7%Use of goods and services 2333 1816 28% 709.2 410.2 73% 1937 120.4% 396 20.4%Transfers 2925 2839 3% 516.4 656.0 -21% 3162 92.5% -237 -7.5%Minor capital 61 29 107% 26.9 9.9 173% 76 80.2% -15 -19.8%Interest 199 325 -39% 14.6 78.7 -81% 220 90.2% -21 -9.8%
Domestic 183 306 -40% 11.5 72.8 -84% 205 89.4% -22 -10.6%External 15 19 -18% 3.1 5.8 -47% 15 101.4% 0 1.4%
Net lending 1022 760 35% 237.5 211.3 12% 600 170.4% 422 70.4%Current Balance -4739 -4988 -5% -1128.5 -1037.8 9% -4605 102.9% -134 2.9%Development Expenditures 938 674 39% 320.0 159.9 100% 1260 74.4% -323 -25.6%Balance -5676 -5661 0% -1448.5 -1197.7 21% -5865 96.8% 189 -3.2%Financing 5676 5661 0% 1448.5 1197.7 21% 5865 96.8% -189 -3.2%
External Budgetary Support 3676 4532 -19% 1006.8 802.2 25% 4785 76.8% -1109 -23.2%Development Financing 726 384 89% 223.3 153.0 46% 1080 67.2% -354 -32.8%Net Domestic Bank Financing -507 -895 22.4 -143.8Expenditure Arrears (Net Accumulation) 2633 1667 1010.1 515.1
Clearance Revenue Adjustment 13 14 491.7 12.2
Tax Refunds (Arrears) 147 27 87.4 125.7
G&S and Dev. Arrears Paymets -1004 0 -231.4 -
Residual 18 -38 -178.3 -242.2
Table 1: Consolidated Fiscal Operations Analysis of Q4 2014 and Full year 2014 (Commitment Basis)
B. Revenue Performance 2014
Total Net/Gross Revenues
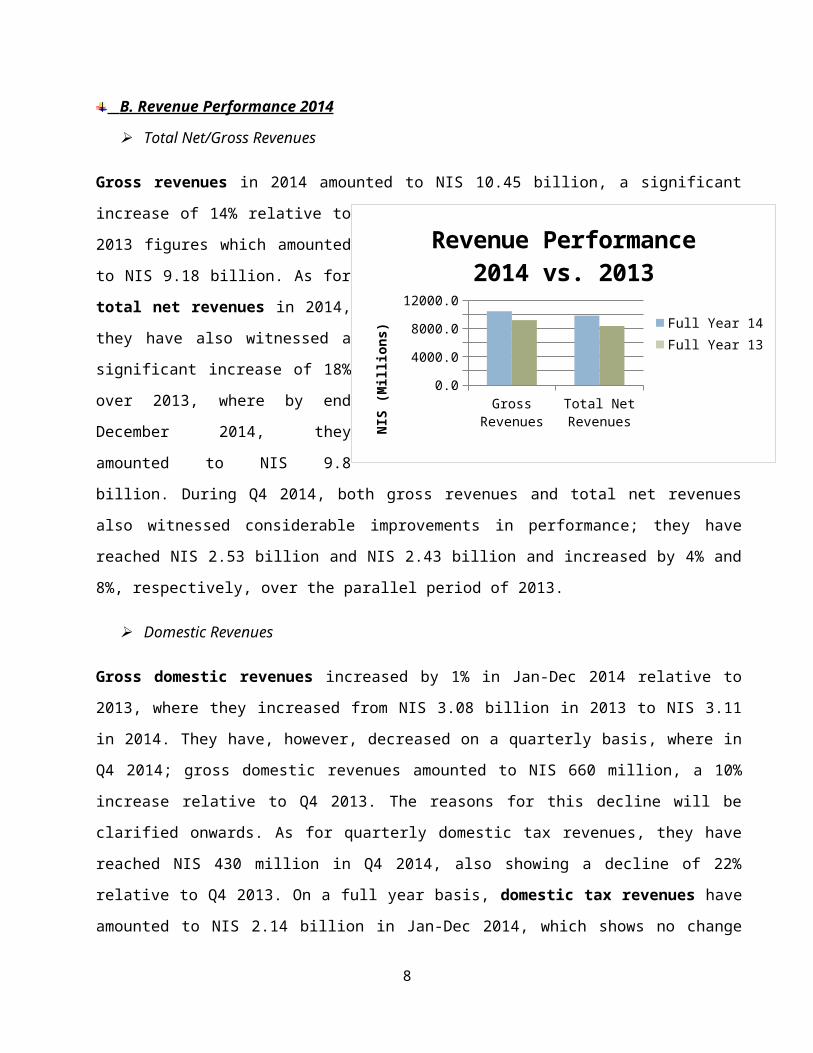
Gross revenues in 2014 amounted to NIS 10.45 billion, a significant increase of 14% relative to 2013
figures which amounted to NIS 9.18
billion. As for total net revenues in
2014, they have also witnessed a
significant increase of 18% over 2013,
where by end December 2014, they
amounted to NIS 9.8 billion. During Q4
2014, both gross revenues and total net
revenues also witnessed considerable
improvements in performance; they have
reached NIS 2.53 billion and NIS 2.43
billion and increased by 4% and 8%,
respectively, over the parallel period of 2013.
Domestic Revenues
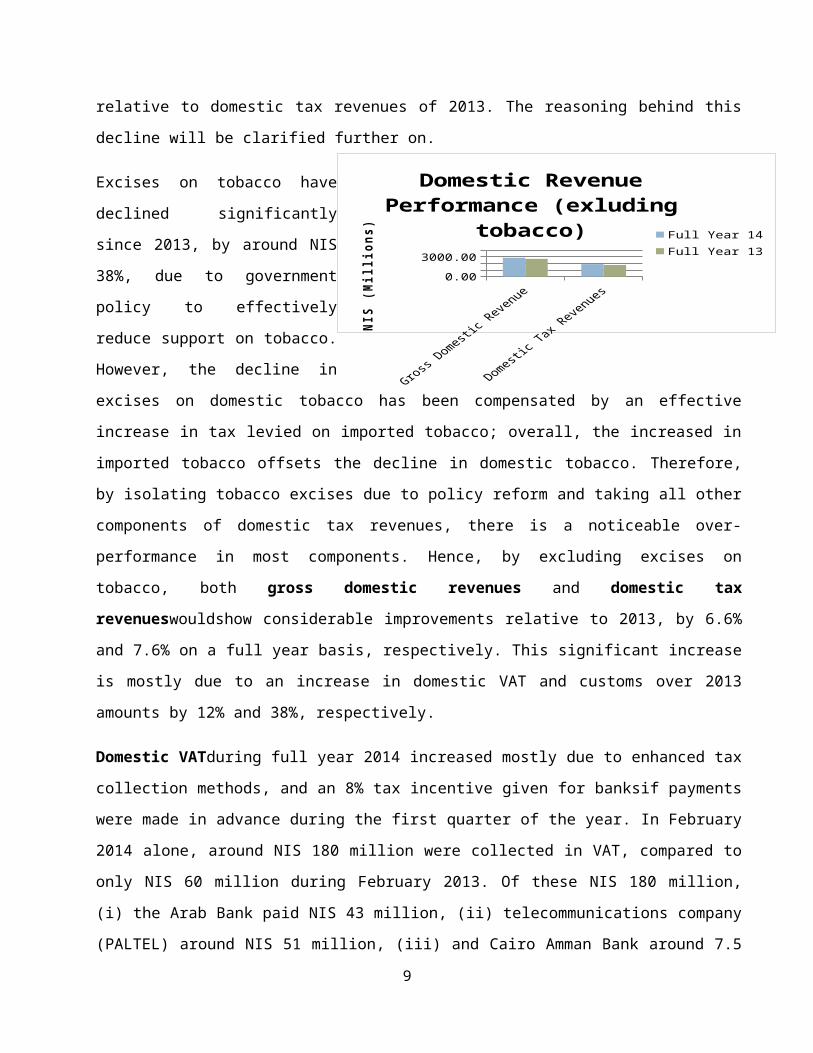
Gross domestic revenues increased by 1% in Jan-Dec 2014 relative to 2013, where they increased from
NIS 3.08 billion in 2013 to NIS 3.11 in 2014. They have, however, decreased on a quarterly basis, where
in Q4 2014; gross domestic revenues
amounted to NIS 660 million, a 10%
increase relative to Q4 2013. The
reasons for this decline will be
clarified onwards. As for quarterly
domestic tax revenues, they have
reached NIS 430 million in Q4 2014,
also showing a decline of 22% relative
to Q4 2013. On a full year basis,
domestic tax revenues have amounted
to NIS 2.14 billion in Jan-Dec 2014, which shows no change relative to domestic tax revenues of 2013.
The reasoning behind this decline will be clarified further on.
6
Gross Domestic Revenue
Domestic Tax Revenues
0.00500.00
1000.001500.002000.002500.003000.003500.00
Domestic Revenue Performance (exluding tobacco)
Full Year 14Full Year 13
NIS
(Mill
ions
)
Gross Revenues Total Net Revenues0.0
2000.0
4000.0
6000.0
8000.0
10000.0
12000.0
Revenue Performance2014 vs. 2013
Full Year 14Full Year 13
NIS
(Mill
ions
)
Excises on tobacco have declined significantly since 2013, by around NIS 38%, due to government
policy to effectively reduce support on tobacco. However, the decline in excises on domestic tobacco has
been compensated by an effective increase in tax levied on imported tobacco; overall, the increased in
imported tobacco offsets the decline in domestic tobacco. Therefore, by isolating tobacco excises due to
policy reform and taking all other components of domestic tax revenues, there is a noticeable over-
performance in most components. Hence, by excluding excises on tobacco, both gross domestic
revenues and domestic tax revenueswouldshow considerable improvements relative to 2013, by 6.6%
and 7.6% on a full year basis, respectively. This significant increase is mostly due to an increase in
domestic VAT and customs over 2013 amounts by 12% and 38%, respectively.
Domestic VATduring full year 2014 increased mostly due to enhanced tax collection methods, and an
8% tax incentive given for banksif payments were made in advance during the first quarter of the year. In
February 2014 alone, around NIS 180 million were collected in VAT, compared to only NIS 60 million
during February 2013. Of these NIS 180 million, (i) the Arab Bank paid NIS 43 million, (ii)
telecommunications company (PALTEL) around NIS 51 million, (iii) and Cairo Amman Bank around
7.5 million. March 2014 also recorded highly compared to the parallel month of 2013, where NIS 116
million were collected in domestic VAT. Of this amount, the Bank of Palestine ltd. paid around NIS 61
million as advanced VAT payment.Quarterly comparison of VAT, however, portrays a 33% decline in
Q4 2014 relative to 2013; this is mostly due to a one time occurrence of settling outstanding files; a large
payment was made by Bank of Palestine and Cairo Amman during November 2013, of around NIS 47
million and NIS 19 million respectively. These once-occurring payments enlarged the total VAT
collection for that month to around NIS 127 million, making Q4 2013 base comparison very high.
Excluding these non-recurring settling of outstanding files by the large tax payers, Q4 2014 would have
exceeded Q4 2013 by over 35%. Notwithstanding, overall improved performance in VAT collection
throughout 2014 acted to offset the decline in the fourth quarter.
As for customs, the considerable 38% increase in 2014; fourth quarter customs figures in 2014 also
shows a significant increase of 60% relative to the parallel quarter of 2013. This improvement in customs
is due to three mains reasons: a small increase in the number of used cars, enhanced cooperation with the
Ministry of Transportation by intensifying internal control,andfinally, accounting for customs lawsuits
tolls under this item which used to be accounted for under “other revenues” in previous years. Income
tax fell by 4% relative to 2013 figures; however this deviation is attributed mostly to a non-recurrent
event that increased 2013 income tax significantly: during November 2013, around NIS 80 million were
7
paid from outstanding LTU files, which is why income tax declined by 35% in Q4-2014 alone, due to a
high Q4-2013 income tax as a result of this payment. Consequently, by excluding the non-recurring
incident of settling of outstanding NIS 80 million paid in November 2013, income tax in 2014 would
increase by 8% relative to 2013. Therefore, the decline in income tax is mostly due to the high base
comparison in 2013 as a result of this.Overall, excluding non-recurrent items (i.e. outstanding files of
LTU in 2013) and excises on tobacco both domestic tax revenues and gross domestic revenues would
increase significantly in 2014 relative to 2013 by 13% and 9%, respectively. Finally, property tax and
excises on beverages both declined by 36% and 42; excises on beverages declined for the same policy
adoption as excises on tobacco.
As a component of gross domestic revenues, nontax revenues have also increased during 2014 when
compared to the previous year. During Jan-Dec 2014, nontax revenues reached NIS 965 million, an
increase of 5% relative to Jan-Dec 2013, mostly due to an increase in: (i) civil registration fees by 57%;
(ii) transportation fees by 16%; (iii) domestic fees and charges by 8%; (iv) higher court of justice fees by
19%; (v) and fees by Ministries of Economy (106%) and Ministry of Education (18%); (vi) land
registration fees by 865% and (vii) other fees by 14%. The over-performance in 2014 nontax revenues
has occurred even though the 2014 budget assumed NIS 100 million in investment profits from PIF
whereas only NIS 40 million were collected. This implies that although investment profits fell short of
expectations, nontax revenues continued to perform well due to the aforementioned increases in various
fee collections. Even on a quarterly basis, nontax revenues continued to exceed previous collections in
2013; in Q4-2014, nontax revenues exceeded Q4-2013’s nontax revenues by 25% (reaching NIS 230
million) although only NIS 0.7 million were realized in investment profits.
Clearance revenues
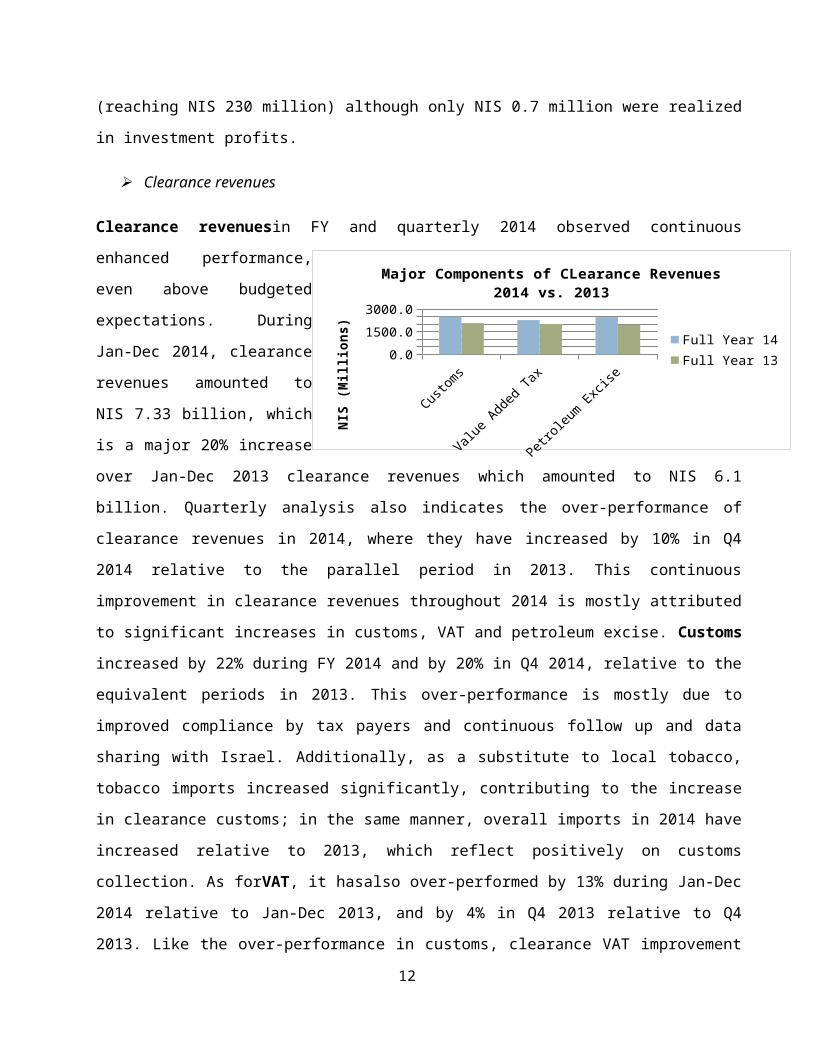
Clearance revenuesin FY and quarterly 2014 observed continuous enhanced performance, even above
budgeted expectations. During Jan-Dec 2014, clearance revenues amounted to NIS 7.33 billion, which is
a major 20% increase over Jan-Dec 2013 clearance revenues which amounted to NIS 6.1 billion.
Quarterly analysis also indicates the over-performance of clearance revenues in 2014, where they have
increased by 10% in Q4 2014 relative to the parallel period in 2013. This continuous improvement in
clearance revenues throughout 2014 is mostly attributed to significant increases in customs, VAT and
petroleum excise. Customs increased by 22% during FY 2014 and by 20% in Q4 2014, relative to the
equivalent periods in 2013. This over-performance is mostly due to improved compliance by tax payers
and continuous follow up and data sharing with Israel. Additionally, as a substitute to local tobacco,
8
tobacco imports increased
significantly, contributing to the
increase in clearance customs; in
the same manner, overall imports
in 2014 have increased relative to
2013, which reflect positively on
customs collection. As forVAT, it
hasalso over-performed by 13%
during Jan-Dec 2014 relative to Jan-Dec 2013, and by 4% in Q4 2013 relative to Q4 2013. Like the over-
performance in customs, clearance VAT improvement can also be attributed to enhanced cooperation
with Israel which entails better data sharing, more thorough follow ups and field campaigns for enhanced
collection. Petroleum excises during Jan-2014 increased over 2013 parallel period by a significant 26%.
Quarterly analysis of Q4 2014 petroleum excisealso shows a 10% increase over 2013 corresponding
period. The over-performance in petroleum excise is mostly due to increased imports of fuel products;
and this increase in imports also contributed to the increase in VAT considerably. Finally, the remaining
components of clearance revenues, which are purchase tax and income tax, also increased significantly
throughout 2014, by 160% and 29%.
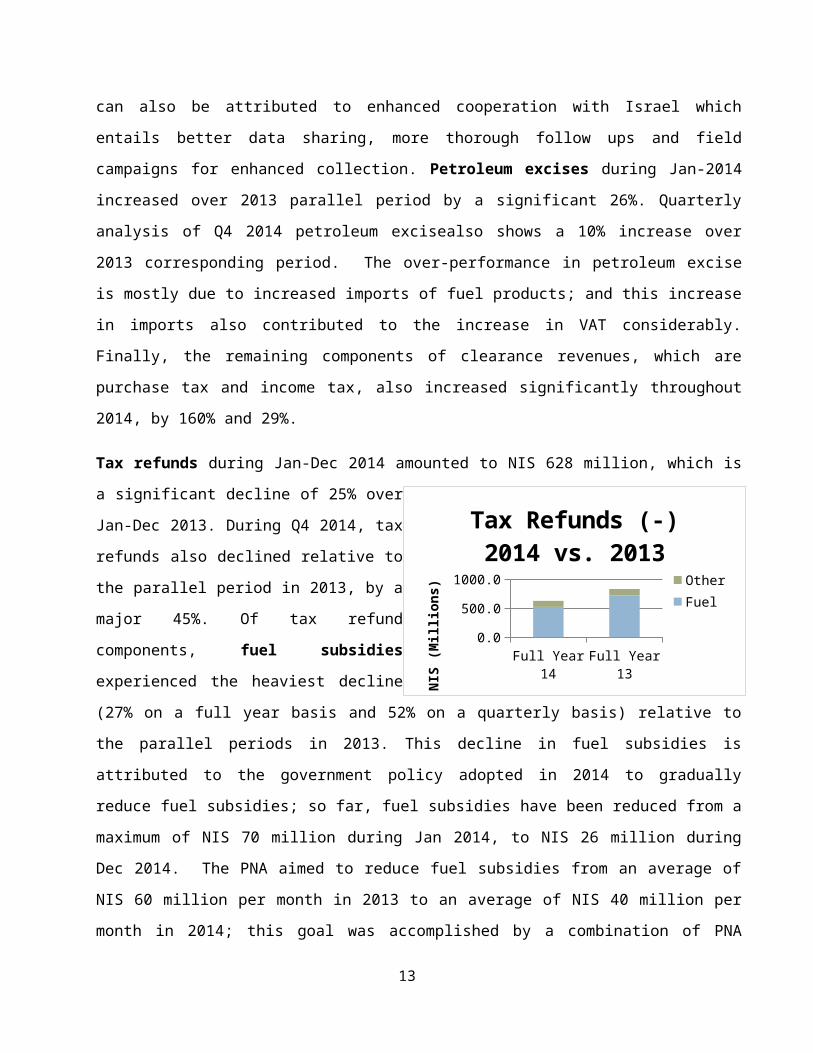
Tax refunds during Jan-Dec 2014 amounted to NIS 628 million, which is a significant decline of 25%
over Jan-Dec 2013. During Q4 2014, tax refunds
also declined relative to the parallel period in
2013, by a major 45%. Of tax refund components,
fuel subsidies experienced the heaviest decline
(27% on a full year basis and 52% on a quarterly
basis) relative to the parallel periods in 2013. This
decline in fuel subsidies is attributed to the
government policy adopted in 2014 to gradually
reduce fuel subsidies; so far, fuel subsidies have
been reduced from a maximum of NIS 70 million during Jan 2014, to NIS 26 million during Dec 2014.
The PNA aimed to reduce fuel subsidies from an average of NIS 60 million per month in 2013 to an
average of NIS 40 million per month in 2014; this goal was accomplished by a combination of PNA
efforts and declining international fuel prices during the last five months of 2014. Additional reform on
the issue was made in 2014 with the elimination of the 35 days paymentlagand a conversion to cash basis
9
Customs Value Added Tax Petroleum Excise0.0
500.01000.01500.02000.02500.03000.0
Major Components of CLearance Revenues2014 vs. 2013
Full Year 14Full Year 13
NIS
(Mill
ions
)
Full Year 14 Full Year 130.0
200.0400.0600.0800.0
1000.0
Tax Refunds (-)2014 vs. 2013
Other Fuel
NIS
(Mill
ions
)
with the majority of operators (i.e. gas stations) in the West Bank (40% of West Bank operators) and
Gaza (100% Gaza operators). In 2015, the Ministry of Finance aims to achieve this for all operators in
the West Bank and Gaza, in hopes of improving cash management issues.
C. Expenditures 2
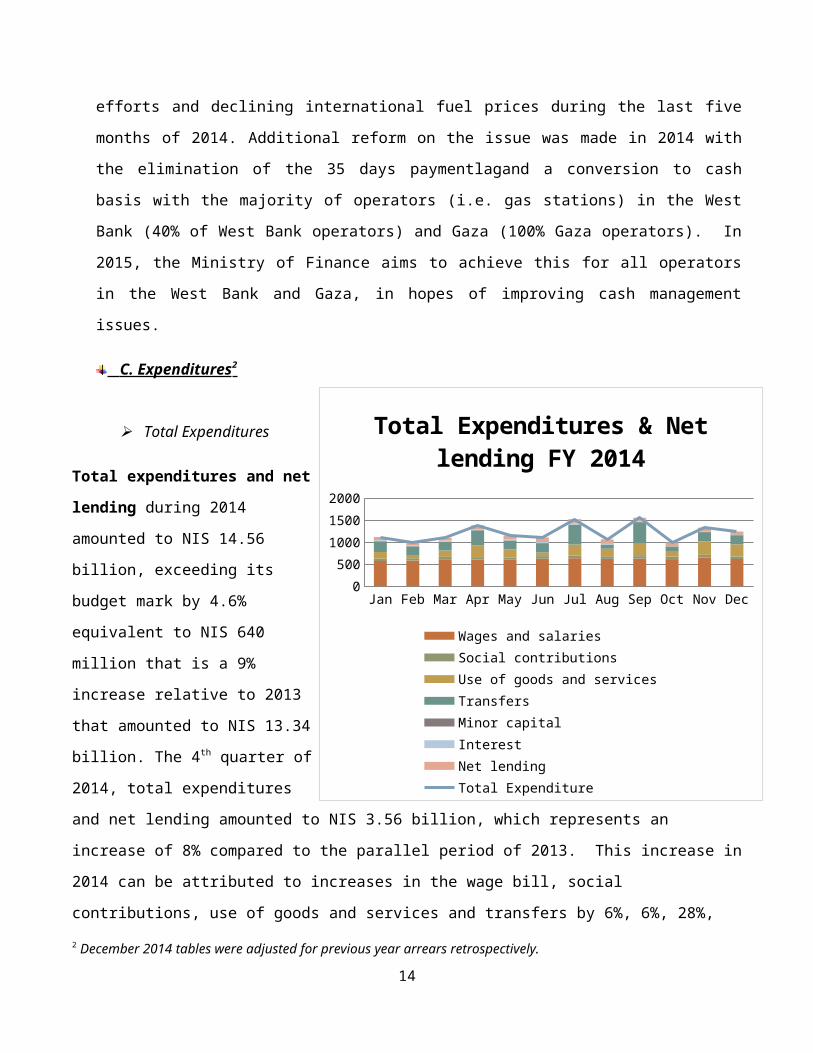
Total Expenditures
Total expenditures and net lending
during 2014 amounted to NIS 14.56
billion, exceeding its budget mark by
4.6% equivalent to NIS 640 million that
is a 9% increase relative to 2013 that
amounted to NIS 13.34 billion. The 4th
quarter of 2014, total expenditures and
net lending amounted to NIS 3.56
billion, which represents an increase of
8% compared to the parallel period of
2013. This increase in 2014 can be
attributed to increases in the wage bill,
social contributions, use of goods and
services and transfers by 6%, 6%, 28%,
and 3% respectively. Interest payments on the other hand fell by 39% compared to 2013 and amounted to
NIS 199 million, where domestic interest payments declined by 40%, and external interest payments also fell
by 18%, all in comparison with 2013 figures. As for the 4th quarter of 2014, and relative to the 4th quarter of
2013, the wage bill increased by 7%, social contributions by 10%, use of goods and services grew by 73%,
whereas transfers in the last quarter fell by 21% due to no payment for vulnerable Palestinian families in
December. The final quarter of 2014 also experienced a decline in Interest Payments by 81%, with regards to
the corresponding period of 2013.
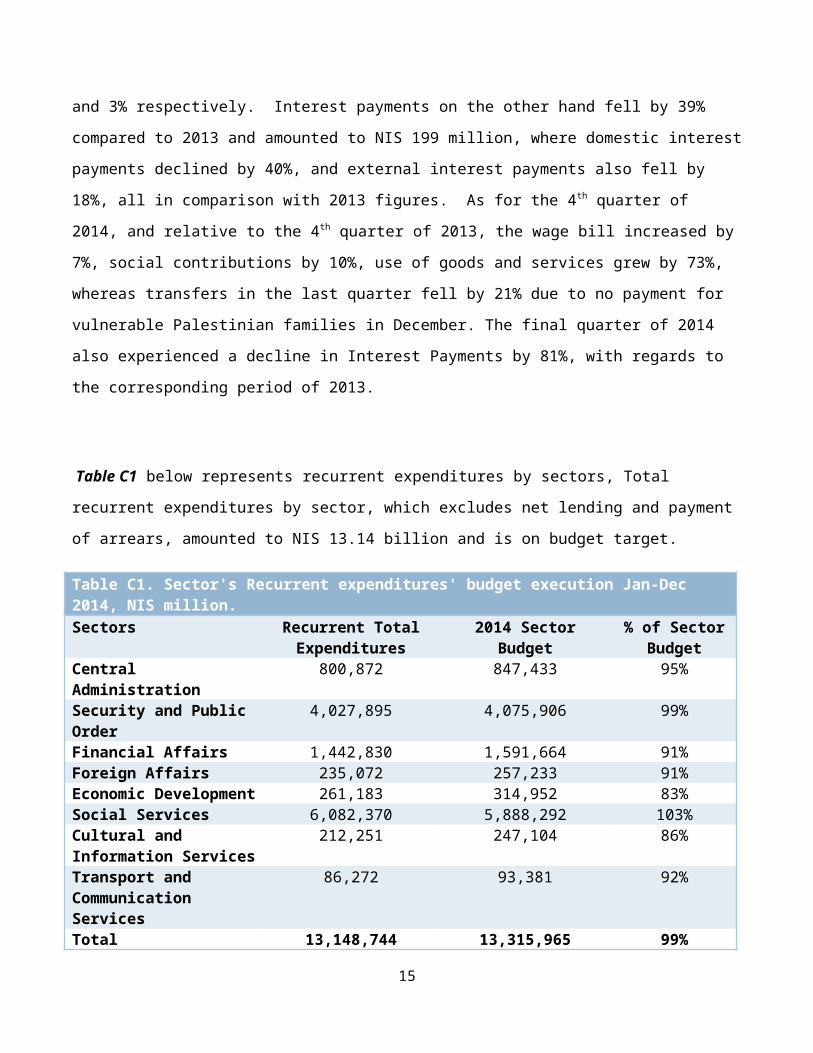
Table C1 below represents recurrent expenditures by sectors, Total recurrent expenditures by sector, which
excludes net lending and payment of arrears, amounted to NIS 13.14 billion and is on budget target. 2 December 2014 tables were adjusted for previous year arrears retrospectively.
10
Jan Feb Mar Apr May Jun Jul Aug Sep Oct Nov Dec0
200
400
600
800
1000
1200
1400
1600
1800
Total Expenditures & Net lending FY 2014
Wages and salaries Social contributionsUse of goods and services TransfersMinor capital InterestNet lending Total Expenditure
Table C1. Sector's Recurrent expenditures' budget execution Jan-Dec 2014, NIS million.Sectors Recurrent Total
Expenditures2014 Sector Budget % of Sector
BudgetCentral Administration 800,872 847,433 95%Security and Public Order 4,027,895 4,075,906 99%Financial Affairs 1,442,830 1,591,664 91%Foreign Affairs 235,072 257,233 91%Economic Development 261,183 314,952 83%Social Services 6,082,370 5,888,292 103%Cultural and Information Services
212,251 247,104 86%
Transport and Communication Services
86,272 93,381 92%
Total 13,148,744 13,315,965 99%
Wages and Salaries
Wages and Salaries as mentioned above, increased by 6% in 2014 with respect to 2013, and exceeded its
budget target by 1%, and amounting to NIS 7.34 billion. Regarding the final quarter of 2014, wages and
salaries amounted to NIS 1.88 billion growing by 7% over the final quarter of 2013. Various details explain
the increases in the wage bill, where several agreements with labor unions and policies where implemented
that contributed to increase the wage bill. This increase
of 6% of the wage bill in 2014 over 2013 is broken
down into: annual increase of 1.25%, inflation 2.03%
and 0.5% paid on behalf of 3 months of 2013, cost of
living allowance 0.86%, security sector promotions
contributed 0.2%, agreement with teachers labor union
increased the bill by 0.7%, and 0.4% represent court
orders increases and risk allowances applied to various
professions.
Table C2. Budget Execution Jan-Dec 2014, Wages and Salaries by Sector, NIS million.Sectors Wages and Salaries 2014 Sector Budget % of Sector BudgetCentral Administration 385,448 374,824 103%
11
Jan Feb Mar Apr May Jun Jul Aug Sep Oct Nov Dec520540560580600620640660
Wages and Salaries 2014
Security and Public Order
3,236,809 3,272,515 99%
Financial Affairs 228,901 232,467 98%Foreign Affairs 135,760 142,180 95%Economic Development 188,402 187,798 100%Social Services 2,967,139 2,860,384 104%Cultural and Information Services
124,150 124,171 100%
Transport and Communication Services
69,650 70,819 98%
Total 7,336,258 7,265,159 101%
Social Contributions
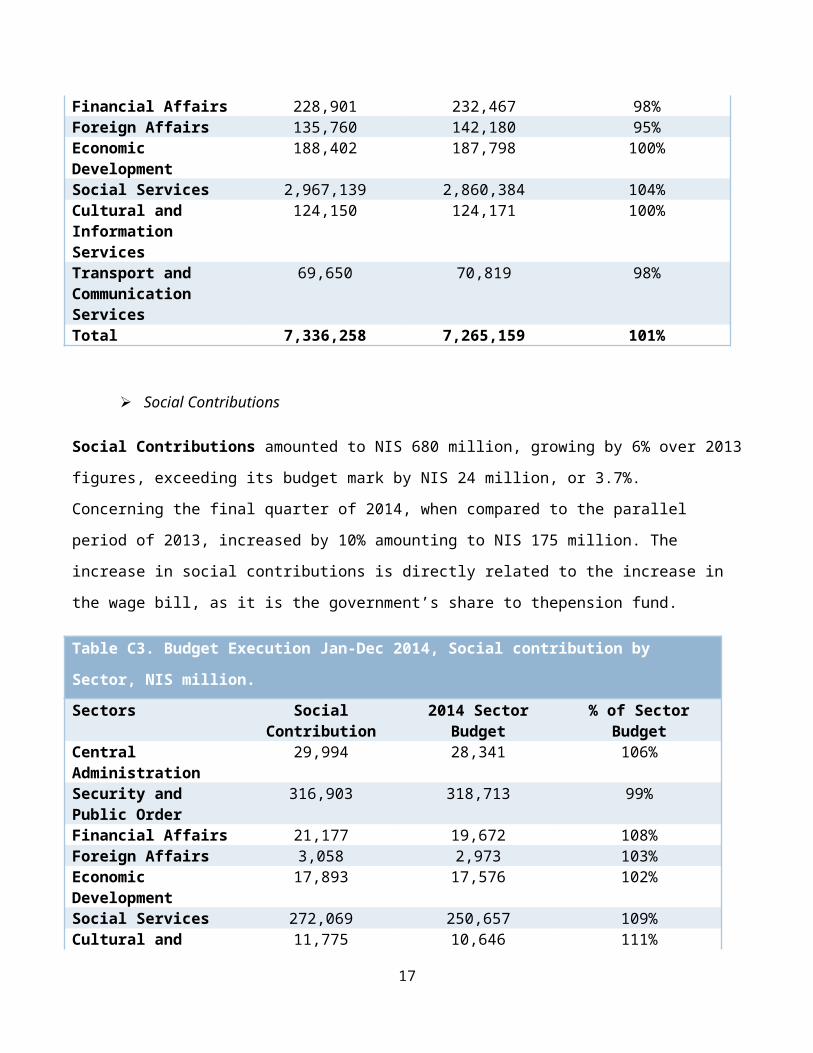
Social Contributions amounted to NIS 680 million, growing by 6% over 2013 figures, exceeding its budget
mark by NIS 24 million, or 3.7%. Concerning the final quarter of 2014, when compared to the parallel
period of 2013, increased by 10% amounting to NIS 175 million. The increase in social contributions is
directly related to the increase in the wage bill, as it is the government’s share to thepension fund.
Table C3. Budget Execution Jan-Dec 2014, Social contribution by Sector, NIS million.
Sectors Social Contribution 2014 Sector Budget % of Sector BudgetCentral Administration 29,994 28,341 106%Security and Public Order
316,903 318,713 99%
Financial Affairs 21,177 19,672 108%Foreign Affairs 3,058 2,973 103%Economic Development 17,893 17,576 102%Social Services 272,069 250,657 109%Cultural and Information Services
11,775 10,646 111%
Transport and Communication Services
6,664 6,762 99%
Total 679,534 655,339 104%
12
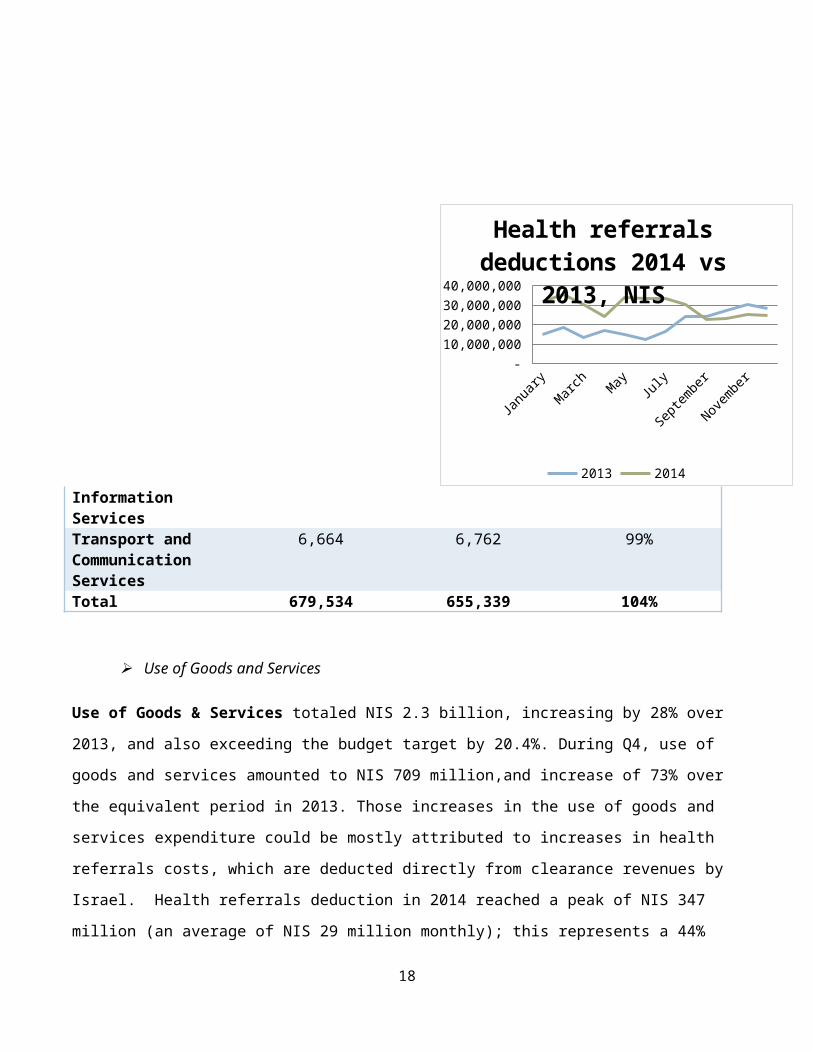
Use of Goods and Services
Use of Goods & Services totaled NIS 2.3 billion, increasing by 28% over 2013, and also exceeding the
budget target by 20.4%. During Q4, use of goods and
services amounted to NIS 709 million,and increase of 73%
over the equivalent period in 2013. Those increases in the
use of goods and services expenditure could be mostly
attributed to increases in health referrals costs, which are
deducted directly from clearance revenues by Israel.
Health referrals deduction in 2014 reached a peak of NIS
347 million (an average of NIS 29 million monthly); this
represents a 44% increase over 2013 health deductions,
which amounted to NIS 241 million (an average NIS 20
million monthly). Table C4 highlights the social services
sector as having the highest portion of the central governments’ spending on use of goods and services, and
exceeding its budget mark by 31%. If health referrals are deducted from use of goods expenditure it would
maintain its budget target level.
Table C4. Budget Execution Jan-Dec 2014, Use of Goods & Services by Sector, NIS million.Sectors Use of Goods & Services 2014 Sector Budget % of Sector
BudgetCentral Administration 260,831 304,486 86%Security and Public Order 382,683 340,238 112%Financial Affairs 48,522 73,875 66%Foreign Affairs 80,420 92,980 86%Economic Development 24,025 53,847 45%Social Services 1,251,519 955,716 131%Cultural and Information Services
70,799 100,957 70%
Transport and Communication Services
9,614 15,150 63%
Total 2,128,414 1,937,249 110%
13
January
February
March
AprilMay June
July
August
Septem
ber
October
November
December
- 10,000,000 20,000,000 30,000,000 40,000,000
Health referrals deductions 2014 vs 2013, NIS
2013 2014
Transfers
Transfers increased by 3%, totaled NIS 2.92billion; however it is below the budget mark by 7.5% (around
NIS 237 million. The increase in the overall transfers’ expenditure is attributed to increases in the number of
beneficiaries in September, specifically following the war on Gaza. Quarter four of 2014 relative
toquarterfour of 2013, transfers declined by 21% amounting to NIS 516 million. The decline in the 4 th quarter
when compared to the corresponding period of 2013 is due to no cash transfer payment in the last quarter of
2014.
Table C5. Budget Execution Jan-Dec 2014, Transfers by Sector, NIS million.Sectors Transfer Expenditure 2014 Sector Budget % of Sector BudgetCentral Administration 121,273 131,915 92%Security and Public Order
75,397 130,000 58%
Financial Affairs 1,057,867 1,039,100 102%Foreign Affairs 11,687 14,000 83%Economic Development 29,161 50,000 58%Social Services 1,581,581 1,796,915 88%Total 2,876,967 3,162,130 91%
Minor Capital
Minor Capital reached NIS 61 million, increasing by 107% when compared to NIS 29 million in 2013. On
quarterly basis, the final quarter of 2014 witnessed a substantial 173% over the 4 th quarter of 2013, and
amounted to NIS 26.9 million.
Interest
Interest payments of 2014 were NIS 199 million, broken down into NIS 183 million domestically and NIS
15 million externally. Interest payments represent a 39% decline below the 2013 figures which stood at NIS
325 million. Nevertheless Interest payments for 2014 remained at 9.8% below the budget target. The
4thquarter of the year 2014 interest payments amounted to NIS 14.6 million, and was below the levels of the
corresponding period of 2013 by 81%.
14
Net Lending
Net lending reached around NIS 1.02 billion
exceeding the 2013 figures by 35%, also
exceeding the budgeted mark by 70.4%. The
4th quarter of the year shows an increase of
12% over the 4th quarter of 2013. The increase
in net lending is attributed to increased
unilateral electricity deductions by Israel to the
Israeli Electric Company (IEC). Water,
electricity, and sewage deductions increased by 10%, 27%, and 5% respectively. Electricity deductions
averaged NIS 73 million monthly when compared to NIS 57 million monthly in 2013. Average monthly
deductions excluding health referrals amounted to NIS 97 million, while in 2013 deductions averaged around
NIS 80 million.
Development Expenditures
Development expenditure grew by 39% over 2013 figures, and stood at NIS 938 million; however, it
remained below the budget target by NIS 323 million (25.6%). The increase in development expenditure is
the result of increased development financing by a substantial 89% from the 2013 levels. The 4 th quarter of
2014 also witnessed an increase in development expenditure by 100% above the 4 th quarter of 2013, standing
at NIS 320 million, also attributed to increased development financing in the final quarter of the year by
46%, compared to the corresponding period of 2013. The following chart represents expenditure by
component in 2014 and 2013.
15
January
February
March
April May JuneJuly
August
Septem
ber
October
November
December
- 20,000,000 40,000,000 60,000,000 80,000,000
100,000,000 120,000,000
Electricity Deductions 2014 vs. 2013
2013 2014
NIS
(Mill
ions
)

Wages a
nd salar
ies
Socia
l contri
butions
Use of g
oods and se
rvices
Transfe
rs
Minor cap
ital
Interest
Developmen
t Exp
enditu
res
030006000
7336
6802333 2925
61 199 938
6928
638 1816 283929 325 674
Expenditures Breakdown2014 vs 2013
2014 2013
NIS
(Mill
ions
)
D. Balance and financing
Balance
Balance: the 2014 recurrent deficit amounted to NIS 4.74 billion, declining by 5% when compared to 2013
figures which stood at NIS 4.99 billion. The recurrent deficit for the last quarter of 2014 was higher by 9%
than that of the final quarter for 2013, and stood at NIS 1.1 billion. As for the overall balance, the 2014
deficit amounted to NIS 5.68 billion. In the 4th quarter of the year the deficit amounted to 1.45 billion, higher
by 21% over the 4th quarter of 2013, in which the deficit was NIS 1.19 billion.
Balance Financing External Budgetary Support Development Financing
-8000
-6000
-4000
-2000
0
2000
4000
6000
8000
-5676
5676
3676
726
-5661
56614532
384
Balance & Financing 2014 vs 2013
2014 2013
Budget Support
External budgetary support was NIS 3.68 billion, below 2013 support figures by 19%, which stood at NIS
4.53 billion. The major reason for this differential is the decline in support from the USA by around $248
16
million, where $100 million were given this year, compared to $348 last year. The 4 th quarter of the year
showed an increase in budgetary support by 25% in comparison to the 4 th quarter of 2013.
Development Financing
Development financing was 89% higher than 2013, amounting to NIS 726 million comparable to NIS 384
million in 2013. The final quarter of 2014 relative to the corresponding period of 2013 also witnessed an
increase of 46% and stood at NIS 223 million. Nevertheless external budgetary support and development
financing both fell short from their budget mark by 23% and 33% respectively. The substantial increase in
the 4th quarter of the year compared to the 4th quarter of the previous year is due to a payment made by Qatar
towards Gaza reconstruction of $25 million in December.
E. Arrears
Total net accumulation of arrears was NIS 2.78
billion, of which, NIS 147 million are tax refund
arrears and NIS 351 million are development
arrears. As for the arrears to the private sector,
which includes use of goods and services, minor
capital, development, interest, and the “other” tax
refunds, have accumulated to NIS 1.38 billion.
However, after taking into account the NIS 1 billion
arrears repayments to the private sector in 2014, the
net accumulation of arrears to the private sector in
2014 amounts to NIS 377 million.
The following chart describes the composition of arrears to different expenditure items. The largest
components mounting up arrears are use of goods & services, social contributions, and the wage bill in that
order.
17
Table E1: Net Accumulations of Arrears by component, 2014
Budget Classification NIS millions
Wages & Salaries 569.8Social Contributions 679.5Use of Goods & Services 937.0Transfers 48.4Minor Capital 19.2Interest 27.3Development Expenditure 351.2Tax refunds 146.5Total 2779.0
21%
24%
34%
2%1%1%
13% 5%
2014 Net Accumulation of Arrears by Com-ponent
Wages & Salaries Social ContributionsUse of Goods & ServicesTransfersMinor CapitalInterestDevelopment ExpenditureTax refunds
18