Embed Size (px)
Citation preview

North Highline Governance Study
FISCAL BALANCE REPORT
October 20, 2005 Draft
North Highline Unincorporated Area Council
Nesbitt Planning and Management, Inc.
In conjunction with
Northwest Small Cities Services and The Connections Group
Funded by The King County Council

North Highline Governance Study FISCAL BALANCE REPORT Page i
Nesbitt Planning & Management, Inc. Seattle, WA
EXECUTIVE SUMMARY
This report is the fourth in a series of papers prepared by Nesbitt Planning & Management, Inc. to analyze the financial implications of the North Highline unincorporated area governance options. The study reviews the financial impacts of an incorporation of North Highline. This report and the prior reports in the series are the building blocks of a final governance options study report that is expected to be completed in December 2005.
The “Fiscal Bases” paper that was prepared as the first in this study series presented the fiscal parameters upon which revenues and costs for either incorporation or annexation of the area can be calculated. These fiscal bases were then used to projected revenues in the Revenue Report. The same fiscal bases, with supplemental departmental data, were next used to project costs in the Cost Report. This Fiscal Balance Report compares revenues to costs and discusses the nature of the difference between them.
The comparison of costs to revenues summarized in this report indicates that it is not fiscally feasible for North Highline to incorporate under any set of assumptions explored. Using the assumptions included in the Cost and Revenues Reports, the core revenue that can be generated was $8 million short of the revenue needed to pay the costs desired for the new City should North Highline incorporate.1 This paper provides a tool for modifying some of those assumptions to reduce costs and/or increase revenues, but there is no realistic scenario of services and revenues that will balance. Even if utility taxes and B&O tax rates were pushed to statutory limits – or to maximum viable levels, when there are no statutory limits – there would still be a gap of $2.3 million in the prospective city’s General Fund and another gap of $3.2 million in the Capital Fund (see Figure 2 below.)
Revenues Costs Net
General Fund $ 8,017,000 $ 14,703,000 $ (6,686,000)
Capital Fund $ 1,038,000 $ 4,250,000 $ (3,212,000)
Table 1 Costs versus Revenues with Status Quo Taxes and Services
Revenues Costs Net
General Fund $ 11,489,000 $ 13,754,000 $ (2,265,000)
Capital Fund $ 1,038,000 $ 4,250,000 $ (3,212,000)
Table 2 Costs versus Revenues at Greatly Increased Utility and B&O Tax Rates
1 These costs included some relatively modest services beyond those reflected in the strict status quo of Table 1, above.
North Highline Governance Study FISCAL BALANCE REPORT Page ii
Nesbitt Planning & Management, Inc. Seattle, WA
Table of Contents EXECUTIVE SUMMARY ............................................................................................................. i
Table of Contents............................................................................................................................ ii
List of Tables ................................................................................................................................. iii
List of Figures ................................................................................................................................ iii
INTRODUCTION .......................................................................................................................... 1
REVENUES SUMMARY.............................................................................................................. 2
COSTS SUMMARY ...................................................................................................................... 5
THE BOTTOM LINE..................................................................................................................... 7

North Highline Governance Study FISCAL BALANCE REPORT Page iii
Nesbitt Planning & Management, Inc. Seattle, WA
List of Tables Table 1 Costs versus Revenues with Status Quo Taxes and Services...................................................... i
Table 2 Costs versus Revenues at Greatly Increased Utility and B&O Tax Rates .................................. i
Table 3 Summary of Annual and One-Time Revenues (Core Revenues Only)...................................... 2
Table 4 Summary of Annual and One-Time Revenues (Including Potential Revenues) ........................ 4
Table 5 Summary of Annual and One-Time Costs ................................................................................. 6
Table 6 The Bottom Line With Current Tax Rates and Levels of Service ............................................. 8
Table 7 The Bottom Line With Aggressive Revenue Increases and Cost Reductions.......................... 10
Table 8 The Bottom Line [Clean Table for Additional Trials] ............................................................. 11
List of Figures Figure 1 The Critical Balance................................................................................................................... 1

North Highline Governance Study FISCAL BALANCE REPORT Page 1
Nesbitt Planning & Management, Inc. Seattle, WA
INTRODUCTION
This report is the fourth in a series of papers prepared by Nesbitt Planning & Management, Inc. to analyze the financial implications of the North Highline unincorporated area governance options. The study reviews the financial impacts of an incorporation of North Highline. This report and the prior reports in the series are the building blocks of a final governance options study report that is expected to be completed in December 2005.
The “Fiscal Bases” paper that was prepared as the first in this study series presented the fiscal parameters upon which revenues and costs for either incorporation or annexation of the area could be calculated. These fiscal bases were then used to project revenues in the Revenue Report. The same fiscal bases, with supplemental departmental data, were next used to project costs in the Cost Report. This Fiscal Balance report compares revenues to costs and discusses the nature of the difference between them.
Cities are obligated to balance costs and revenues. There is no allowable deficit spending for cities. Even when cities borrow through bond sales, they must demonstrate the ability to pay debt service on the bonds through added tax levies or other General Fund sources. Figure 1, “The Critical Balance,” below, portrays the relationship of a city’s revenues versus costs and shows the need to generate sufficient revenues in excess of operating costs to be able to fund the city’s capital needs. In essence, sufficient revenue must be generated at acceptable taxpayer impacts to fund costs at acceptable levels of service and to have funds left over to fund a reasonable capital improvements program. Adding taxes beyond what citizens can or are willing to pay or reducing services below what citizens find acceptable would not be reasonable choices for balancing costs versus revenues.
Figure 1 The Critical Balance

North Highline Governance Study FISCAL BALANCE REPORT Page 2
Nesbitt Planning & Management, Inc. Seattle, WA
REVENUES SUMMARY
A city’s core revenues are those that are based on rates that generally exist for the area when it is unincorporated. Revenues resulting from these rates would accrue to a new City of North Highline without any change in the tax burden on North Highline taxpayers. The core revenues include those listed in Table 3, below. North Highline would generate $7,573,200 in General Fund core revenue from its municipal levy, state shared revenues, criminal justice sales tax, local option sales tax, real estate excise tax, gambling tax, leasehold excise tax, stormwater fees, business license fees, admission tax, and franchise fees, plus an additional $1,038,500 in revenue restricted to capital purposes.
Fund Type
Revenue Type
Revenue AnnualRevenue One-TimeRevenue
General Fund 7,573,200$ Core Revenue 7,573,200$
Assessed Value Based 3,064,800$ Municipal Levy 3,064,800$
Miscellaneous Bases 1,268,400$ Business License Fee 46,800$ Franchise Fees 318,200$ Gambling Tax 896,400$ Leasehold Excise Tax 7,000$
Population Based 1,811,200$ Criminal Justice Sales Tax 641,200$ State Shared Revenues 1,170,000$
Sales Tax Based 1,428,800$ Local Option Sales Tax 1,428,800$
Potential RevenueUtility Tax
CableDrainageElectricityNatural GasSewerWaterTelephoneCellularSolid Waste
BusinessBusiness and Occupation Tax
Capital Funds 1,038,500$ Core Revenue 1,038,500$
Real Estate Excise Tax 1,038,500$ 1st 0.25% REET 519,250$ 2nd 0.25% REET 519,250$
SWM Fund 1,527,000$ Core Revenue 1,527,000$
Surface Water 1,527,000$ User Charge 1,527,000$
Grand Total 10,138,700$
Table 3 Summary of Annual and One-Time Revenues (Core Revenues Only)

North Highline Governance Study FISCAL BALANCE REPORT Page 3
Nesbitt Planning & Management, Inc. Seattle, WA
In addition to core revenues, the City of North Highline would have the opportunity to charge some potential revenues, mainly business and occupation taxes and utility taxes. Under Washington State law, these revenues are authorized for cities but not for counties. These revenues are also listed in addition to the core revenues in Table 4, below.
Business and Occupation (“B&O”) taxes may be established by a city on businesses with annual gross income exceeding $20,000. This tax may be set at a percentage rate established by the city and is applied on the gross receipts of the business, less certain quite limited deductions. Although cities may establish different rates for different types of businesses, such as manufacturing, retail, services and wholesale (most cities levy a B&O tax rate at 0.002 or lower because voter approval is required for a higher rate), this report uses the rounded mean tax used by Washington cities2, 0.002, for calculation of potential revenue for the incorporation option. At the 0.002 tax rate, North Highline could generate $411,000 in a B&O tax.
Utility taxes can be an even more significant source of city revenue. These tax rates are also established only by cites and may be levied at rates up to 6% without voter approval (more with voter approval) for electric, gas, steam and telephone (including cell phones and pagers); and at any rate selected by the city with no restrictions on the tax rates for water, sewer, and stormwater utilities. The rate on cable television is governed by the Cable Communications Policy Act of 1984, which requires that the rate not be "unduly discriminatory against cable operators and subscribers.”
To project the revenue which would accrue to the city if North Highline were to incorporate and enact a package of utility taxes, this draft report uses a trial rate of 3% for electricity3 and 6% for all other utilities, based on the highest allowable rate for gas, steam4 and telephone (including cell phones and pagers) and the Municipal Research Services Center suggestion that a rate of 6% for cable TV would be considered “reasonable”5. Using this assumption, $3,505,000 million in utility tax revenue could be generated.
2 Association of Washington Cities, www.awcnet.org/documents/2004botaxrates.pdf 3 Under current local agreements, the 6% tax on Seattle City Lights generation and distribution charges outside the City of Seattle is split approximately equally between Seattle and the other City. 4 This report does not include any assumptions about a steam utility, because it is so uncommon. We are not aware of any such utility in the North Highline area. 5 Municipal Research & Services Center, The New City Guide; How to Start a New City in Washington, February 2002, p.29

North Highline Governance Study FISCAL BALANCE REPORT Page 4
Nesbitt Planning & Management, Inc. Seattle, WA
Thus, the North Highline area would generate a total of $11,489,200 in General Fund core revenues and $1,038,500 in core Capital Revenues if it incorporates and imposes an additional utility taxes and B&O taxes yielding $3,505,000 and $411,000 respectively.
FundType
Revenue Type
Revenue AnnualRevenue One-TimeRevenue
General Fund 11,489,200$ Core Revenue 7,573,200$
Assessed Value Based 3,064,800$ Municipal Levy 3,064,800$
Miscellaneous Bases 1,268,400$ Business License Fee 46,800$ Franchise Fees 318,200$ Gambling Tax 896,400$ Leasehold Excise Tax 7,000$
Population Based 1,811,200$ Criminal Justice Sales Tax 641,200$ State Shared Revenues 1,170,000$
Sales Tax Based 1,428,800$ Local Option Sales Tax 1,428,800$
Potential Revenue 3,916,000$ Utility Tax 3,505,000$
Cable 382,000$ Drainage 47,000$ Electricity 832,000$ Natural Gas 384,000$ Sewer 256,000$ Water 411,000$ Telephone 433,000$ Cellular 248,000$ Solid Waste 512,000$
Business 411,000$ Business and Occupation Tax 411,000$
Capital Funds 1,038,500$ Core Revenue 1,038,500$
Real Estate Excise Tax 1,038,500$ 1st 0.25% REET 519,250$ 2nd 0.25% REET 519,250$
Grand Total 12,527,700$ Table 4 Summary of Annual and One-Time Revenues (Including Potential Revenues)

North Highline Governance Study FISCAL BALANCE REPORT Page 5
Nesbitt Planning & Management, Inc. Seattle, WA
COSTS SUMMARY
To generate estimated costs for North Highline, should it incorporate, the level of service guidance provided by the North Highline Unincorporated Area Council (UAC) was used. In essence, this included maintaining the same level of service as currently received under King County for most services but with increases in parks and recreation, social and health services, and planning and economic development. It was assumed that the City would annex back into the Fire District and the King County Library District, and that police services would be provided via contract with King County.
The Cost Report described these levels of service in detail and estimated the cost of incorporation as $15,478,000 annually, exclusive of the capital improvement program and one-time start-up costs.
Table 5, below, summarizes these costs, differentiating between annual costs and those that would occur only once – in the first year or first few years of operation as the new city begins.
However, the annual City costs would be modified if higher or lower levels of service were assumed. For example, this annual cost would be even higher if the new City were to increase the number of police patrols. The annual cost could also be reduced if the City were to reduce levels of service below those assumed in the Cost Report by reducing the number of police patrols or by reducing the assumed level of parks maintenance, recreation programs, or economic development. This paper shows that even at substantially reduced services, the new City could not achieve a fiscal balance.

North Highline Governance Study FISCAL BALANCE REPORT Page 6
Nesbitt Planning & Management, Inc. Seattle, WA
Department Service AnnualCost
One-TimeCost
FTE's
Administration $3,132,342 $680,950 14.0City Manager $1,124,039 $0 4.0Finance $1,038,676 $323,950 6.0HR $157,718 2.0Legal $711,909 2.0Property Services $100,000 $357,000
Legislative Branch $126,376 7.0City Council $126,376 7.0
Planning & Community Development $1,670,362 $401,000 19.0Administration $258,782 3.0Building & Code Enforcement $626,938 $46,000 8.0Economic Development $192,344 $60,000 2.0Planning $592,298 $295,000 6.0
Parks & Recreation $1,718,903 $168,250 15.0Administration $192,200 2.0Aquatics $599,751 6.0Recreation $169,390 2.0Maintenance $323,734 $168,250 3.0Maintenance - Additional $279,823Recreation - Additional $154,005 2.0
Police $6,152,410 45.8Communications $580,093 6.8Precinct Staff $4,210,577 39.0Support / Specialized Functions $1,361,740
Public Works $2,259,285 $54,000 8.9Administration $192,200 2.0Roads $1,096,707 6.9Engineering Services $154,168 $54,000Surface Water Management $816,210
Social/Health Services $418,228 $50,000 1.0Administration $78,228 1.0Contracts $340,000 $50,000
Grand Total $15,477,906 $1,354,200 110.7 Table 5 Summary of Annual and One-Time Costs

North Highline Governance Study FISCAL BALANCE REPORT Page 7
Nesbitt Planning & Management, Inc. Seattle, WA
THE BOTTOM LINE
To examine the financial viability of incorporation, balancing tables are provided. These balancing tables parallel the Critical Balance diagram of Figure 1 on page 1. Two examples of how these balancing tables may be used are provided below. (See Table 6, page 8 and Table 7, page 10). Additionally, a blank balancing table for readers’ use is included as Table 8 on page 11.
To determine the financial viability of incorporation, one compares the estimated city revenues (the left side of these balancing sheets) to estimated city costs (the right side of the sheets). Revenues must cover both operating and capital costs needed to support the city. The balancing sheets offer the opportunity to change assumptions for both revenues and costs in order to strive for a balance.
In Table 6 core revenues – those based on existing tax bases in North Highline – are supplemented with an assumed small unspecified utility tax sufficient to make up for the slight loss of revenue that would follow from removal of the County road levy and the substitution of the municipal levy upon incorporation. This brings core revenues to $8,017,000 for the General Fund and $1,038,000 revenue dedicated to capital expenditures.
To explore the impacts of reducing costs, Table 6 also incorporates reductions in operating costs down from the UAC directed levels of service back down to the levels of service now provided by King County. For example, the additional park maintenance and recreation services suggested by the UAC for the cost analysis are removed on the right hand side of the table. Also subtracted on the right side of the table are the costs associated with Evergreen Pool, because it may be assumed to be a regional, rather than local, facility. Further reductions include the added economic development program that was included in the original Cost Report. The net effect of the small changes in revenue with these cost reductions, is a remaining deficit of $6,686,000.
A similar deficit is demonstrated when considering capital costs. The Capital Budget tables provided separately from this report show annual capital budget expenses of $4,250,000. With no operating budget surplus available, and revenues restricted to capital expenditures of only $1,038,000, there would be a capital deficit of $3,212,000.

North Highline Governance Study FISCAL BALANCE REPORT Page 8
Nesbitt Planning & Management, Inc. Seattle, WA
Revenues Costs
Core Revenues $7,573,000 $15,478,000 Base Annual Costs
Potential Adjustments Potential Adjustments
Adjustment for difference between the municipal levy and the road levy which it replaces (assume a small utility tax)
$444,000 $451,000 One-Time Costs amortized over 3 years
($600,000) Cost Reduction from Removing ___Parks Aquatics________
($280,000) Cost Reduction from Removing LOS Increase __Park Maintenance - Additional ______
($154,000) Cost Reduction from Removing LOS Increase __Park Recreation - Additional ______
($192,000) Cost Reduction from Lowered LOS ___Economic Development_______
Total Revenues $8,017,000 $14,703,000 Total Annual Costs
General Fund Surplus / (Deficit)
Net Annual General Fund Surplus Available for Capital
No Surplus Available
Revenues Statutorily Restricted to Capital
$1,038,000
Total Annual Funds Available for Capital $1,038,000 $4,250,000 Projected Annual Capital Needs
Capital Fund Surplus / (Deficit)
($6,686,000)
($3,212,000)
Table 6 The Bottom Line With Current Tax Rates and Levels of Service
North Highline Governance Study FISCAL BALANCE REPORT Page 9
Nesbitt Planning & Management, Inc. Seattle, WA
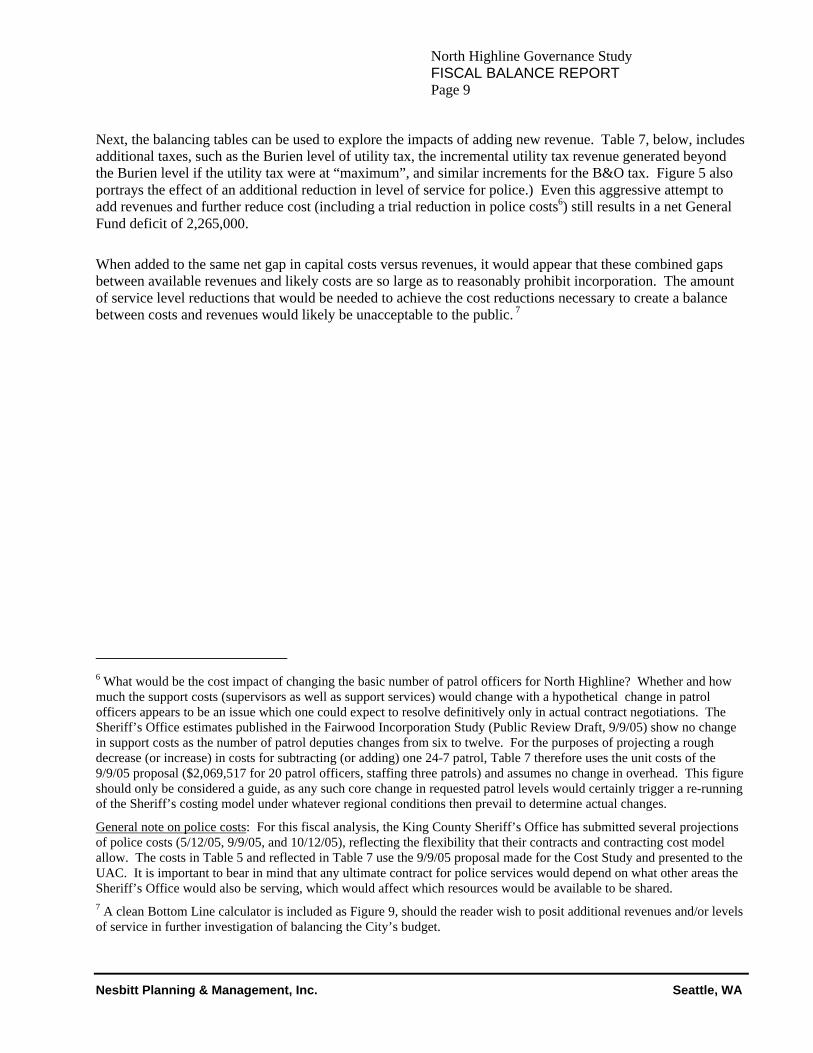
Next, the balancing tables can be used to explore the impacts of adding new revenue. Table 7, below, includes additional taxes, such as the Burien level of utility tax, the incremental utility tax revenue generated beyond the Burien level if the utility tax were at “maximum”, and similar increments for the B&O tax. Figure 5 also portrays the effect of an additional reduction in level of service for police.) Even this aggressive attempt to add revenues and further reduce cost (including a trial reduction in police costs6) still results in a net General Fund deficit of 2,265,000.
When added to the same net gap in capital costs versus revenues, it would appear that these combined gaps between available revenues and likely costs are so large as to reasonably prohibit incorporation. The amount of service level reductions that would be needed to achieve the cost reductions necessary to create a balance between costs and revenues would likely be unacceptable to the public. 7
6 What would be the cost impact of changing the basic number of patrol officers for North Highline? Whether and how much the support costs (supervisors as well as support services) would change with a hypothetical change in patrol officers appears to be an issue which one could expect to resolve definitively only in actual contract negotiations. The Sheriff’s Office estimates published in the Fairwood Incorporation Study (Public Review Draft, 9/9/05) show no change in support costs as the number of patrol deputies changes from six to twelve. For the purposes of projecting a rough decrease (or increase) in costs for subtracting (or adding) one 24-7 patrol, Table 7 therefore uses the unit costs of the 9/9/05 proposal ($2,069,517 for 20 patrol officers, staffing three patrols) and assumes no change in overhead. This figure should only be considered a guide, as any such core change in requested patrol levels would certainly trigger a re-running of the Sheriff’s costing model under whatever regional conditions then prevail to determine actual changes.
General note on police costs: For this fiscal analysis, the King County Sheriff’s Office has submitted several projections of police costs (5/12/05, 9/9/05, and 10/12/05), reflecting the flexibility that their contracts and contracting cost model allow. The costs in Table 5 and reflected in Table 7 use the 9/9/05 proposal made for the Cost Study and presented to the UAC. It is important to bear in mind that any ultimate contract for police services would depend on what other areas the Sheriff’s Office would also be serving, which would affect which resources would be available to be shared. 7 A clean Bottom Line calculator is included as Figure 9, should the reader wish to posit additional revenues and/or levels of service in further investigation of balancing the City’s budget.

North Highline Governance Study FISCAL BALANCE REPORT Page 10
Nesbitt Planning & Management, Inc. Seattle, WA
Revenues Costs
Core Revenues $7,573,000 $15,478,000 Base Annual Costs
Potential Adjustments Potential Adjustments
Adjustment for difference between the municipal levy and the road levy which it replaces (assume a small utility tax)
$444,000 $0 One-Time Costs [Assume County covers entire $1.5 million as incorporation incentive.]
Yield Utility Tax Package to bring total up to Burien level $2,347,000 ($690,000) Cost Reduction from Lowered LOS
____(2 Police Patrols instead of 3)___
Yield (beyond Burien level) for Utility Tax Package at high level $714,000 ($600,000) Cost Reduction from Lowered LOS
___remove pool__________
Yield from assumed B&O tax at Burien Level $103,000 ($280,000)
Cost Reduction from Removing LOS Increase __Park Maintenance - Additional ______
Yield (beyond Burien level) from assumed B&O tax at roughly the average level of all cities imposing a B&O (0.002 for services)
$308,000 ($154,000) Cost Reduction from Removing LOS Increase __Park Recreation - Additional ______
Yield from Additional Source Cost Increase/Decrease from Raised/Lowered LOS _____________
Total Revenues $11,489,000 $13,754,000 Total Annual Costs
General Fund Surplus / (Deficit)
Net Annual General Fund Surplus Available for Capital
No Surplus Available
Revenues Statutorily Restricted to Capital
$1,038,000
Total Annual Funds Available for Capital $1,038,000 $4,250,000 Projected Annual Capital Needs
Capital Fund Surplus / (Deficit)
($2,265,000)
($3,212,000)
Table 7 The Bottom Line With Aggressive Revenue Increases and Cost Reductions
Figure 9, which follows, provides an opportunity for any reader to examine service reductions and revenue options in various combinations and test the authors’ conclusions that there do not appear to be financially viable options for incorporation of North Highline. To make service level reductions at a level to achieve a fiscal balance would require dramatic changes in levels of services and also reductions in road maintenance to half of current levels and/or provision of no parks capital programs. These do not appear to be reasonable choices for the public.

Nesbitt Planning & Management, Inc. Seattle, WA
Revenues Costs
Core Revenues $7,573,000 $15,478,000 Base Annual Costs
Potential Adjustments Potential Adjustments
$451,000 One-Time Costs amortized over 3 years
Total Revenues $7,573,000 $15,929,000 Total Annual Costs
General Fund Surplus / (Deficit)
Net Annual General Fund Surplus Available for Capital
No Surplus Available
Revenues Statutorily Restricted to Capital
$1,038,000
Total Annual Funds Available for Capital
$1,038,000 $4,250,000 Projected Annual Capital Needs
Capital Fund Surplus / (Deficit)
($8,356,000)
($3,212,000)
Table 8 The Bottom Line [Clean Table for Additional Trials]