Embed Size (px)
Citation preview

1
Fiscal and Financial Crises*
April 5, 2015
Michael D. Bordo
(Rutgers University & NBER)
Christopher M. Meissner
(University of California, Davis & NBER)
* Paper prepared for the Handbook of Macroeconomics Vol. 2 Conference, Stanford University April 9-11, 2015. We thank Sarah Quincy for invaluable research assistance.
2
1. Introduction
The recent financial crisis in the Eurozone involved both sovereign debt and the
banking system. The circumstances of this crisis were unique but the combined incidence of
debt and banking crises is not new. It goes back to the nineteenth century. Moreover debt
and banking crises have on occasion been associated with currency crises.
In the recent Eurozone crisis a threatened sovereign default by Greece fed into a
banking crisis because banks in Greece and the other financially integrated Eurozone
countries held large amounts of Greek and other peripheral Eurozone sovereign debt. Also
in that crisis, in the case of Ireland, a blanket guarantee of the Irish financial sector by the
Irish government, following the bursting of a property price boom which made the Irish
banks insolvent, led to a sovereign debt crisis because the Irish government could not
service the large run up in its debt that followed. Thus the recent crisis is a fine example of
the interconnection between fiscal and banking crises.
Such interconnections between types of financial crises have occurred before. In the
Asian Crisis of 1997-98,, the guarantee provided to the banks of Thailand and Indonesia led
both to a currency crisis,, a banking crisis and a debt crisis (a triple crisis) because the
liabilities of the banks and other financial institutions which were in foreign currency were
guaranteed by the government and ultimately by the international reserves of the central
bank. The crises in Argentina and Russia at the turn of the twenty first century were also
triple crises. Resonance to these recent triple crises can even be traced back to emerging
market crisis in the 1890s (Bordo and Flandreau, 2003).
In this paper we examine the interconnections between financial and fiscal crises
based on history, theory, and empirics. Section 2 presents a brief historical overview of
financial crises. Banking crises can be traced back hundreds of years. Before the advent of
deposit insurance and effective use of the lender of last resort, banking crises were banking
panics. Since World War II, banking panics have evolved into fiscally resolved banking
crises. Banking crises have often been global events as countries have been linked together
by fixed exchange rates, capital flows and other sources of contagion. Debt crises—
sovereign debt defaults-- have also been around for centuries, associated with over-
borrowing and have been triggered by shocks. Today they occur primarily in emerging
countries. Currency crises—speculative attacks on pegged exchange rates – often
accompanied banking crises and sometimes debt crises.

3
Section 3 surveys theoretical perspectives on financial crises. Banking crises
traditionally were analyzed using three approaches: the monetarist approach, the financial
fragility approach and the business cycle approach. Modern perspectives build upon these
earlier theories. The key approach is based on the Diamond and Dybvig (1983) notion of the
inherent instability of banking because of a maturity mismatch. Also seminal are theories
based on asymmetric information. The pioneering modern work to explain why countries
issue sovereign debt and try to avoid debt crises traces back to Eaton and Gersovitz (1981)
who emphasize reputation. By contrast Bulow and Rogoff(1989) focus on the deterrence
effect of sanctions. Reinhart and Rogoff(2009) emphasize serial defaults, debt intolerance,
and the distinction between domestic and foreign debt.
In the post-World War II period, especially since the 1970s, banking, currency and
debt crises became linked because governments guaranteed the liabilities of the banking
system. The seminal paper by Diaz Alejandro (1987) generated an enormous literature to
explain the Latin American crises. The Asian crisis of 1997-98 led to new theories which
explained triple crises based on guarantees and original sin (foreign currency denominated
debt). Finally the recent Eurozone crisis has led to new work which emphasizes the feedback
loop between bank guarantees and banks holding of member states sovereign debt which
links financial to debt crises.
Section 4 provides empirical perspectives. We discuss the methodological issue of
crisis measurement (the definition, dating and incidence) of financial crises. Different
approaches to definition and dating in the literature lead to very different patterns of
incidence and hence very different interpretations of the historical record. We also discuss
the many and varied causes or determinants of financial crises, including bank credit driven
asset booms which have resonance for the recent crisis.,. Our reading of the literature is that
it is very difficult to predict crises with a high level of accuracy both because of Goodhart’s
law as well as because of the complex economic eco-system represented by the financial
sector. We then review measures of the output costs of financial crises. Again different
approaches in the literature lead to significantly different conclusions and hence different
perspectives on the economic importance of crises.
Section 5 contains a preliminary examination of the empirical connection between
financial and fiscal crises and identifies a potential new Trilemma. This three-pronged choice

4
argues that in the future countries will be able to have two of the following three: a large
financial sector (with a high level of leverage in the economy), fiscal bailouts devoted to the
inevitable crises that accompany leverage, and discretionary fiscal policy aimed at raising
demand in the recessions occasioned by financial crises. This story is different from the
argument that fiscal policy is pro-cyclical in less-developed countries. Moreover, as the
recent crisis suggests, this trilemma may become more binding at higher initial levels of debt
to GDP.
Section 6 to be done is the conclusion.
2. Historical Overview
Financial crises can be traced back hundreds of years (Kindleberger 1987). Historical
narratives identify separate banking, currency and debt crises and combinations of them
(Reinhart and Rogoff 2009, Bordo and Eichengreen 1999, Bordo and Meissner 2005,). While
financial crises cum fiscal crises are certainly not a new phenomenon, it would be incorrect
to say that the recent global financial crisis and the subsequent Eurozone crisis were no
different than all of those that have come before. The nature and origins of fiscal crises and
their relationship to financial crises has changed dramatically over the long-run in important
ways.
Banking crises before the advent of deposit insurance were banking panics--attempts
by the public en mass to convert their deposits into currency. Banking panics unless resolved
by lender of last resort actions could seriously impact the real economy by reducing the
money supply (Friedman and Schwartz 1963) and by reducing financial intermediation
(Bernanke 1983). Banking panics would propagate through asset markets as banks under
threat dumped their earning assets in fire sales . They could also propagate via interbank
connections and other institutional arrangements to create a systemic collapse (Mitchener
and Richardson 2014).
Banking panics could be caused by shocks leading to the failure of important
financial firms, eg shadow banks (Rockoff 2014). They could also occur as a consequence of
a bank credit driven asset price boom bust. Brunnermeir and Omke (2013), Taylor (2015)

5
and many others recently have argued that systemic banking crises are very likely to follow
bank credit driven asset price booms.
Finally banking crises can also have an international dimension as for example during
the Baring Crisis of 1890-91, the global instability of 1907, the Credit Anstalt Crisis of 1931,
the Asian Financial Crisis and the subprime mortgage crisis of 2007-2009. Bordo and
Landon Lane (2010a) identify 5 global financial crises(1890-91, 1914, 1929-30, 1980-81,
2007-2008) where the incidence of banking crises affected banks in multiple countries and in
several continents in the same year. In all of these cases of contagion, cross-border claims
and faltering foreign banks or counterparties led to insolvency or liquidity problems at home.
In addition, interest rate shocks in leading financial centers (e.g., by the Bank of England in
1890, the Federal Reserve in 1929 and in 1980-81) could contribute directly or indirectly to
starting or exacerbating financial stress, especially in emerging countries(Kaminsky and Vega
Garcia 2014)
The incidence of banking panics was high in many advanced countries in the
nineteenth century before monetary authorities learned to act as lenders of last resort. In the
UK the last banking panic was in 1866. In France it was in 1882 and Germany in 1873. In
the U.S. it took until 1933 and the advent of deposit insurance before banking panics ceased
(Schwartz 1987).
With the advent of deposit insurance and other forms of government guarantees
during the Great Depression and in some countries earlier (Grossman 2010), the nature of
banking crises changed from panics to crises which were increasingly resolved by a fiscal
rescue. This created a direct link between the banking system and the government’s balance
sheet. A costly bailout could create significant fiscal imbalance and even lead to a default.
Moreover guarantees could lead to moral hazard, i.e that protected banks would increase
their balance sheets and take on more risk knowing that they would be bailed out. This
would in turn increase the cost of bailouts ex post and increase the strain on the
government’s finances, in turn increasing the likelihood of a default.
Before the 1930s, sovereign defaults had long been a fact of life reflecting over-
borrowing (often in foreign currencies) to finance wars, infrastructure expenditure. Sudden
stops of capital flows often led to sovereign defaults (Bordo, 2006; Bordo, Cavallo and
Meissner,2010). Banking crises, even in the absence of guarantees could lead to fiscal distress
by reducing real income and government revenue.

6
A wave of sovereign defaults tied to international capital flows occurred in the 1820s
in many Latin American Republics as over-optimistic investors from Europe lent these
fledgling republics more than their weak public finances could handle. It took four decades
before these countries paid into arrears and could access the capital markets again. In the
next two centuries Latin America had three more waves of default (Marichal 1989,)1. Most
countries, with the principal exception of a few advanced countries, had sovereign debt
defaults in the nineteenth and twentieth centuries (Reinhart and Rogoff 2009). Many of them
were serial defaulters (Reinhart, Rogoff and Savastano,2003).
Currency crises—a speculative attack on a pegged exchange rate reflecting an
inconsistency between domestic fundamentals and the peg—also were a frequent occurrence
for emerging countries throughout the nineteenth and twentieth centuries (Bordo and
Schwartz 1999). Advanced countries generally avoided them under the pre 1914 gold
standard but they became a bigger problem for them in the interwar and during the Bretton
Woods system (Bordo, Eichengreen et al 2001).
Currency crises often occurred simultaneously with banking crises, referred to as
twin crises (Kaminsky and Reinhart 1999). Causality between them was often two-way. A
banking crisis could lead to capital flight by foreign depositors as occurred in 1931 in
Germany (Eichengreen 1992). Per contra a currency crisis could lead to insolvency for banks
with extensive foreign currency denominated liabilities and domestic currency denominated
assets as occurred in a number of emerging countries in both the pre-1914 and post 1973
eras of financial globalization.(Bordo and Meissner 2006, Reinhart and Rogoff, 2009).
Currency crises became linked to debt crises for emerging countries who had
borrowed abroad in foreign currencies in the 1890s (Bordo and Flandreau 2003). With the
advent of government guarantees on top of original sin (foreign currency denominated
debt), currency, banking and debt crisis became interlinked in the emerging market crises of
the late 1990s and early 2000s.
Thus the recent Eurozone crisis was the culmination of a long history of different
types of crises and their growing interconnections which evolved along with the deep seated
forces of financial globalization and a belief in the necessity for government to socialize the
income losses of financial crises.
1 Kaminsky and Vega Garcia (2014) show that most of these defaults followed systemic financial crises in the core countries of Europe.
7
3 Financial and Fiscal Crises; Theory
In this section we survey the theoretical literature on financial and fiscal crises. We
first survey traditional approaches. Most of the literature treated the two types of crises,
along with currency crises separately. We then examine more recent approaches based on
rational expectations and game theory that often combine financial and fiscal crises along
with currency crises.
3.1 Banking Crises
The traditional view of a banking crisis was a banking panic or a liquidity crisis. It
involved a scramble by the public for means of payment. Two frequent scenarios in which it
occurred were: contagious banking panics when the public fearful that their banks will not
be able to convert their deposits into currency attempts en masse to do so; the second is a
stock market crash that leads to fears that loans will become unavailable at any price.
Without intervention by the monetary authorities or lender of last resort—through open
market operations or liberal discount window lending—the real economy will be impacted
by a decline in the money supply, by impairment of the payment system, and by the
interruption of bank lending.
In the post-World War II period, with the widespread adoption of deposit insurance
(both explicit and implicit), and with the understanding of the role of the lender of last
resort, old fashioned banking panics have become rare events. Instead banking crises largely
involve the insolvency of significant parts of the banking system. They have occurred when
asset prices have plunged, whether prices of equities, real estate or commodities; when the
exchange value of a national currency experiences substantial depreciation; when a large
financial firm or non-financial firm faces bankruptcy, or a sovereign debtor defaults. Unlike
banking panics which are brief episodes resolved by the central bank, a banking crisis is a
prolonged disturbance that is resolved by agencies other than the lender of last resort,
although at some stage it may supply liquidity through the discount window or open market
operations.

8
Three traditional approaches to the subject of banking crises are: the monetarist
approach; the financial fragility approach and the business cycles approach. The modern
literature based on rational expectations and game theory follows from these.
3.1.1 The Monetarist Approach
The monetarist approach of Friedman and Schwartz (1963) identifies financial crises
with banking panics that either produce or aggravate the effects of monetary contractions. In
a Monetary History of the United States 1867-1960, Friedman and Schwartz devote considerable
attention to the role of banking panics in producing monetary instability in the United States.
For Friedman and Schwartz, banking panics are important because of their effects on the
money supply, and hence on economic activity.
According to them, banking panics occur because the public loses confidence in the
ability of banks to convert deposits into currency. A loss of confidence is typically associated
with the failure of some important financial institution (as happened in 1873, 1893 and
1907). Attempts by the public in a fractional reserve banking system to increase currency as a
fraction of its money holdings, if not offset, can only be met by a multiple contraction of
deposits. A banking panic, in turn, if not prevented by the monetary authorities, will lead to
massive bank failures of otherwise sound banks. They are forced into insolvency by a fall in
the value of their assets in a vain attempt to satisfy a mass scramble for liquidity. Banking
panics such as occurred in 1930-33, have deleterious effects on economic activity primarily
by reducing the money stock through a decline in both the deposit- currency and deposit-
reserve ratios.
An extensive literature in economic history has been devoted to re-examining the
banking panics of the 1930s. The debate swirled over the issue of whether the banking crises
were really liquidity panics driven by “a contagion of fear” or whether they reflected bank
insolvency as an endogenous response to the recession. Temin (1976) and most recently
Calomiris and Mason (2005) provided evidence that cast doubt on the Friedman and
Schwartz liquidity panic story. Richardson (2007) and Bordo and Landon Lane (2010b)
provide evidence in its favor.
3.1.2 The Financial Fragility Approach

9
A tradition going back to the nineteenth century regards financial crises as an
essential part of the upper turning point of the business cycle, as a necessary consequence of
the ‘ excesses ‘ of the previous boom. Its twentieth century proponents, Hyman Minsky
(1977) and Henry Kaufman (1986), basically extend the views Irving Fisher expressed in
Booms and Depressions (1932) and in the ‘”Debt Deflation Theory of Great Depressions”
(1933).
According to Fisher, the business cycle is explained by two key factors; over-
indebtedness and deflation. Some exogenous event (displacement) that provides new,
profitable opportunities for investment in key sectors of the economy that increase output
and prices initiates the upswing in the cycle. Rising prices, by raising profits, encourages
more investment and also speculation for capital gain. The whole process is debt financed,
primarily by bank loans, which in turn, by increasing deposits and the money supply, raise
the price level. An overall sense of optimism raises velocity, fueling the expansion further.
Moreover, the rising price level, by reducing the real value of outstanding debt encourages
further borrowing. The process continues until a general state of ‘over-indebtedness’ is
reached. It exists when individuals, firms, and banks have insufficient cash flow to service
their liabilities. In such a situation a crisis can be triggered by errors in judgment by debtors
or creditors. Debtors, unable to pay debts when due or to refinance their positions, may be
required to liquidate their assets.
Distress selling, if engaged in by a sufficiently large segment of the market, produces
a decline in the price level because, as loans are extinguished and not renewed, bank deposits
decline. Falling prices reduce net worth and profits, leading to bankruptcy. Both factors
contribute to a decline in output and employment. In addition, while nominal interest rates
fall with deflation, real rates increase, worsening the situation. The process continues until
either widespread bankruptcy has eliminated the over-indebtedness, or at any stage
reflationary monetary policy is adopted. However, once recovery begins, the whole process
will repeat itself.
This approach has been revived since the Financial Crisis of 2007-2009. Indeed some
commentators have described the failure of Lehman Brothers in September 2007 as a
‘Minsky moment ‘(Brunnermeier and Omke 2013). It is also consistent with the credit boom
approach of the BIS (Borio 2012) and the long-run comparative empirical work on credit

10
and asset price booms by Taylor and Schularick (2009) and Jordà, Schularick and Taylor
(2011).
3.1.3 The Business Cycle Approach
This approach (Mitchell 1941) views banking panics as more likely during a recession
because the returns on bank assets are likely to fall as borrowers become less like likely to
repay their loans. Depositors anticipating an increase in non-performing loans will try to
protect their wealth by withdrawing their deposits precipitating a bank run (Allen and Gale
2007). Gorton (1988) following this approach finds that depositors anticipating a decline in
income in an attempt to smooth their consumption remove their funds from banks before
the business cycle peak .
3.2 Recent Approaches to Banking Crises
3.2.1 Diamond Dybvig ; The Inherent Instability of Banking
In a seminal article Diamond and Dybvig(1983) argue that banks transform illiquid
ones by offering liabilities with a different smoother pattern of returns over time. Banks
provide efficient risk sharing which the private market cannot provide. However banks are
vulnerable to runs because of the illiquidity of their assets. Thus there is a liquidity mismatch.
A run can be triggered even on a sound bank by a random event (a sunspot) because rational
depositors, not wishing to be last in line, will rush to convert deposits into currency. Only
the presence of deposit insurance or a lender of last resort can prevent banking instability.
An explosion of articles in the past two decades build upon the Diamond and
Dybvig model. A number of articles were critical of the sequential servicing constraint in the
original Diamond and Dybvig model—that depositors had to wait their turn at the bank to
access their cash. It was argued that as in the pre 1914 National banking era, banks could
suspend convertibility (Jacklin 1987), on the other hand Wallace(1988) justified the
sequential constraint endogenously in his model. Other papers that rationalized the
Diamond Dybvig sequential service constraint were Diamond and Rajan (2001) and
Calomiris and Kahn (2000). In an influential article Morris and Shin (1998) used the global
games approach to reach a unique equilibrium without using a sunspot equilibrium as a
coordinating device as in Diamond Dybvig.

11
Subsequent literature extended the basic Diamond Dybvig (DD) framework to
encompass financial markets and the banking system (Allen and Gale 1998, 2004); to include
bubbles and crises (Allen and Gale 2000b); to include money and monetary policy in the
basic DD type model (Diamond and Rajan 2001, 2005, 2006, 2011, 2012); to include
interbank markets (Bhattacharya and Gale 1987). The DD model also is embedded in several
articles justifying lender of last resort intervention to provide liquidity in a financial crisis
(Holmstrom and Tirole 1998, Gorton and Huang 2010 and Rochet and Vives 2004).
3.2.2 Information Asymmetry
The explanation of banking panics that the asymmetric information approach offers
is that depositors cannot costlessly value individual bank assets, and hence have difficulty in
monitoring the performance of banks (Jacklin and Bhattacharya1988, Chari and
Jagannathan 1988). On this view, a panic is a form of monitoring. Faced with new
information, which raises the perceived riskiness of bank assets, depositors force out both
sound and unsound banks by a system wide panic.
3.3 Fiscal Crises
The canonical fiscal crisis is a debt crisis. It is a situation where a debtor is unable to
service the interest and or principle as scheduled, hence impairing the financial health of the
lender. A debt crisis arises when the fiscal authorities are unable to raise sufficient tax
revenue in the present and the future to service and amortize the debt.
A debt crisis can then become a financial crisis when it impinges on the banking
system and a currency crisis when it threatens the reserves of the central banks as was the
case in the Asian crisis of the 1990s. Banking crises can feed into debt crises when the fiscal
authorities bail out insolvent banks which then increases sovereign debt to a point where it
becomes unsustainable. Debt crisis can also spill into banking crises when banks hold
significant amounts of sovereign debt whether by choice or because of government attempts
to force banks to hold significant levels of governments debt.
Below we survey the literature on sovereign debt crises and their linkages to
financial(banking ) crises.
3.3.1 Debt Crises; Theory

12
Two seminal articles have driven much of the modern literature on debt crises 2
Eaton and Gersovitz (1981) explained the existence of sovereign debt markets and the
incentive of sovereign borrowers to repay their debt is access to credit markets. Debtors
worried that a default could ruin their reputation and cut off future access to the foreign
capital needed to finance economic development and to smooth output over time. Bulow
and Rogoff (1989 a and 1989 b) argued that other methods of self-insurance can substitute
for foreign borrowing and that the main reasons countries avoid default is because of the
threat of sanctions, e.g., as in the nineteenth century the British (and other European
lenders) would send in the gunboats to seize the defaulting countries customs revenues.
Another early development was the analysis of Grossman and van Huyck (1988) of
excusable default—that countries that defaulted because of a large shock to their economy
not of their own making, they were treated better by the credit markets than countries which
defaulted because of bad economic policy decisions.
The subsequent literature was doubtful of sanctions in the post-World War II era
(Cole and Kehoe 1995, Eaton 1996, Kletzer and Wright 2000) although there is considerable
historical evidence for this (Mitchener and Weidenmeir 2005) for the pre-World War I era.
Emphasis was placed by some on the collateral damage to the economy from default(Cole
and Kehoe 1998).3
An additional development was the focus on serial default. Reinhart, Rogoff, and
Savastano (2003) showed that a number of defaulting emerging countries had a long
historical record of debt default. This pattern of persistence extended to a number of
European countries e.g. Spain and France which had an earlier history of serial defaulting.
Moreover they found that countries which were serial defaulters also had debt intolerance,
i.e. that they would tend to default at significantly lower debt to GDP ratios than advanced
countries, e.g. Argentina defaulted in 2002 at a debt to GDP ratio of 35% whereas Japan
today has a debt to GDP ratio well above 200% and it is not even close to defaulting.
Reinhart and Rogoff (2009 )make an important distinction between domestic debt and
foreign debt. They argue that domestic debt default by inflation, financial repression,
2 See Panizza, Sturzenegger and Zettelmeyer (2009) for a recent survey. 3 Two recent models of sovereign defaults which occur following adverse shocks to the economy are Aguiar and Gopinath (2006) and Arellano (2008).

13
redenomination, abrogation of gold clauses can have consequences as serious as external
default. In addition they argue that defaulting on high domestic debt may be a strong
rationale for the use of the inflation tax in many countries.
3.4 Fiscal Crises and Financial Crises
After the breakdown of the Bretton Woods system and the liberalization of global
financial markets, as well as domestic financial systems across the world, the stage was set
for waves of systemic financial and fiscal crises. A key integrating element between financial
and fiscal crises was the widespread use of guarantees by the government of the liabilities of
the banking system. The seminal article which lays out clearly the dynamics of fiscal financial
crisis interaction was by Diaz Alejandro (1985). He describes the unfolding disaster that
occurred in Chile from 1977 to 1982 after it liberalized its domestic financial system and
opened up its capital account. Chile,, like the other Latin American countries, had extensive
controls over the domestic financial system as well as capital controls since the 1930s. It was
part of the plans of Raul Prebisch (1950) and others to insulate the region from foreign
shocks.
The Pinochet regime, under the influence of the “Chicago boys” – students of Al
Harberger-- liberalized every aspect of the economy. They reduced tariffs, eliminated
controls over the domestic financial system and removed capital controls. They also in 1977
reduced barriers to entry into banking, they explicitly did not introduce deposit insurance,
and they forswore a bailout of the banking system in the event of trouble. They also pegged
the Chilean peso to the U.S. dollar.
The new liberalized regime encouraged massive capital inflows which led to increases
in bank credit and fueled an asset price boom. A major bank failure in 1977 led to a bail out
for fear of contagion. Afterwards the government again forswore against future bailouts. The
bailout which soon did follow encouraged moral hazard and the credit boom continued. In
early 1982 more banks failed and their liabilities were guaranteed. This meant that the
government had taken on a new contingent liability which in turn led to a growing fiscal
deficit. The central bank financed the deficit with the inflation tax. This led to inflation and
set the stage for a speculative attack on its reserves. A major banking and currency crisis
14
ensued in the summer of 1982 leading Chile to abandon its peg and nationalize its banking
system. It was followed by a debt crisis in 1983.4
McKinnon and Pill (1986) model the effects of liberalization and reform on a
previously financially repressed emerging country. In their model, like in Diaz Alejandro
(1985), there is a large unsustainable lending boom financed by foreign capital, intermediated
by the banks. The banks believe that their foreign loans are guaranteed by the government.
This over borrowing phenomenon leads to rising domestic credit, an increase in money
growth, inflation and an asset price boom. A foreign shock leads to a collapse in the boom, a
banking crisis, a currency crisis and a reversal of the reforms.
3.4.1The Asian Crisis
The Asian crisis of 1997-98 involved banking, currency and debt crises and these
crises were all connected by government guarantees and an ostensibly “new” factor “original
sin’. A key mechanism by which foreign borrowing led to banking crises was that the Asian
tigers (Thailand, Indonesia, Malaysia, and Korea) borrowed abroad extensively in foreign
currency denominated securities. They did this because they had not yet financially
developed enough to issue debt in their own currencies as could the advanced countries.
Borrowing abroad e.g. in dollars, gave access to foreign capital at low international interest
rates. The risk associated with original sin is that if the country has a currency crisis and ends
up devaluing its currency then it will have to generate greater tax revenues in domestic
currency and export earnings to service its foreign debt. This in turn would depress the real
economy and increase the likelihood of a sovereign default. The likelihood that exports
could rise sufficiently depended on strong global demand and high elasticities. Moreover the
banking systems in these countries funded their loans with foreign securities (often short-
term) and after the devaluation, their balance sheets would become impaired increasing the
likelihood of insolvency and a banking crisis.
The Asian crisis led to the creation of ‘third generation” speculative attack models.
They were an extension of both first and second generation speculative attack models . The
first generation model of currency crises (Krugman 1979) posited that a speculative attack
4 Velasco (1987) provided a model of this experience.

15
would occur once agents with perfect foresight realized that domestic fiscal and monetary
fundamentals were inconsistent with adherence to a pegged exchange rate. The second
generation models (Obstfeld 1994) which posited that speculative attacks would occur when
agents, who understood the weights that the government placed on the stability of the
domestic economy and adhering to a peg, anticipated that the government would prefer
domestic stability in the event of a crisis and thereby by selling the currency short made it
happen.
Several authors extended the first and second generation models to incorporate
special features of the Asian Crisis including moral hazard (guarantees), short-term
borrowing in foreign currencies, and currency depreciation. Krugman (1998) argued that the
currency and financial crises in Asia reflected the role of moral hazard as the progenitor of
financial instability which in turn was a key cause of currency crises. According to his story,
financial institutions in these countries engaged in risky lending on the assumption that they
would be bailed out, financed by offshore loans at close to international interest rates. The
capital inflow and domestic bank lending fueled an asset market boom which in turn
encouraged the banks to lend more. This process encouraged a domestic investment and
consumption boom and a growing current account deficit. When external factors revealed
the exchange rate to be overvalued a classic speculative attack led to devaluation. The
devaluation in turn sparked a financial crisis as the banks’ short-term, foreign currency
denominated loans mushroomed,, making them both illiquid and insolvent. Bailouts of the
financial system and especially of their dollar obligations in turn precipitated further
speculative attacks and exhausted the monetary authorities international reserves.
Dooley (2000) viewed the liabilities of the monetary authorities backing the financial
safety net as an alternative claimant on emerging countries international reserves. Market
agents understood this and staged a speculative attack at the moment that net liabilities
exceeded international reserves.
Krugman (1999) focused on the balance sheets of firms which have borrowed
abroad in foreign currencies. A speculative attack would occur when market agents
anticipate that a depreciating currency will lead to insolvency and contracting economic
activity pull out their funds hence precipitating the adverse chain of events.
Burnside, Eichenbaum and Rebelo (2004) also emphasize the key role of
government guarantees in explaining the Asian, crisis. In their model banks borrow in
16
foreign currencies unhedged because their foreign debt is guaranteed by the government.
But when a devaluation occurs, following an external shock, the banks default on their
foreign debt and declare bankruptcy, but the government does not have the resources to pay
for a bailout. This leads to both a banking crisis and a currency crisis when the central bank
uses seigniorage to fund the fiscal deficit .
Corsetti, Pesenti and Roubini (1999) also model the Asian crisis. In their model the
government guarantees the banks foreign currency loans which are used to finance domestic
investment. This leads to a capital inflow boom, a current account deficit and an investment
boom. Private sector borrowers believe that they and the banks will be bailed out When a
foreign shock occurs this leads to both a banking crisis and a possible debt crisis as the
contingent liabilities that the government has to cover increase the fiscal deficit.5
3.4.2 The Eurozone crisis.
The Eurozone crisis of 2010 -2014 was a sequel to the global financial crisis of 2007
-2009. Reinhart and Rogoff (2009, 2011) provide comprehensive evidence on the link
between banking and fiscal crises. They show that banking crises often precede debt crises
and that for a large panel of advanced and emerging countries in the twentieth century that
the debt to GDP ratio rises by 86% in the three years following a banking crisis setting the
stage for a downgrading of credit and a possible default. The Eurozone crisis seems to fit
this prediction well. During the subprime mortgage crisis several European countries that
had been connected to the US crisis engaged in expensive bond financed bank bailouts
which increased the fiscal deficit leading to debt surges. The bailouts across Europe
followed the example of Ireland which in September 2008 guaranteed its entire financial
system To fight the recession that accompanied the crisis they also engaged in expansionary
automatic and discretionary fiscal policy which also increased the deficits. Reinhart and
Rogoff argue that the decline in tax revenues produced by the fall in output plus the
expansionary government expenditures explained more of the run up in deficits and debt
than the bailouts themselves. Laeven and Valencia (2013) provide a crude measure that
5 Other papers that model the Asian crisis and place emphasis on government guarantees include : Arellano and Bond (2008) Burnside, Eichenbaum and Rebelo (2001), Burnside (2004), and Schneider and Tornell (2000).

17
separates out the rise in debt due to bailouts and a remaining portion due to discretionary
fiscal expansion.
Against this background of weakening fiscal positions across the Eurozone, the
announcement in 2009 that the Greek government had falsified its fiscal books, set the stage
for the Eurozone debt crisis which first involved the threat of a Greek default and then
contagion to other members via their banks which had significant holdings of Greek and
other peripheral countries sovereign debt. Unsurprisingly bond spreads in Ireland, Portugal,
Spain, and Italy spiked.
Bolton and Jeanne (2011) model the interconnection between sovereign risk and the
banking system in a currency union where the banks in each country diversify their
portfolios by holding the sovereign debt of other member states. Holding government
bonds serves as safe collateral which allows them to increase their leverage. The default by
one member spreads to the others via the weakening of bank portfolios.
Gennaioli, Martin and Rossi(2014) also model the interconnection between
sovereign default and the banking system. As in Bolton and Jeanne, banks hold sovereign
debt as collateral which allows them to increase their lending. A debt crisis leads to a credit
crunch and a decline in real income. The authors demonstrate that the costs of a fiscal shock
are higher for more financially developed countries.
Acharya, Drechsler and Schnabl (2013) model a two way interconnection between
fiscal crises and banking crises. Bank bailouts lead to an increase in sovereign risks because
of the increase in fiscal deficits and debt ratios. This in turn weakens the banking system
which holds sovereign debt as collateral.
They use the Irish bailout of 2008 as their example. Their model predicts that the
spreads between bank CDSs and sovereign CDSs should rise during the banking crisis. Then
after the bailout, bank CDSs should decline and Sovereign CDSs should rise. This reflects
the transfer of risk from the banks to the government. Empirical evidence for the advanced
countries in the Euro zone backs this up. After the subprime crisis began in 2007 bank
CDSs rise dramatically with no change in Sovereign CDSs. Then after the Lehman collapse
and the Irish guarantee at the end of September 2008 Sovereign CDSs rise and bank CDSs
decline.
Mody and Sandri (2012) examine the behavior of sovereign risk spreads of the
Eurozone countries before and after the crisis of 2007-2009. They show that after the

18
creation of the Euro in 1999 sovereign spreads converged across the Eurozone. Then after
the Bear Stearns bailout in March 2008 spreads increased in countries which had vulnerable
financial sectors likely to be bailed out. After the Lehman failure in September 2008 spreads
increased dramatically in countries that had higher debt ratios. Then after the failure of
Anglo Irish bank in January 2009 spreads increased across the Eurozone reflecting the
increased vulnerability of the financial systems of all the member countries.
4. Empirics of Financial Crises Over the Long Run
4.1 Dating of Financial Crises: A History of Comprehensive Chronologies
A number of different chronologies of financial crises exist. The crisis dates
enumerated by each source are quite different. The coverage also varies in terms of the years
and number of countries included in each sample. Because of all these discrepancies, the
conclusions from each study are likely to differ and sometimes dramatically so. In this
section we survey the methodologies of the leading databases for dating financial crises.
Economists for the last 200 years have been drawn to major financial events and
used them to learn about the macro-economy. Charles Conant (1915) surveyed the history of
central banking in many different nations in the early 20th century along the way detailing the
prospective causes and impacts of financial events. The National Monetary Commission of
the United States held lengthy hearings from leading financial experts and significant
amounts of evidence on the financial histories of many countries were submitted as
evidence.
Edwards and Santaella (1993) provided a chronology of currency devaluations from
the Bretton Woods period. By the 1990s, researchers at the World Bank like Caprio and
Klingebiel (1996) were providing dates for systemic banking crises in a large sample of
countries. These crises were an economic phenomenon that had mainly disappeared between
the 1940s and the 1970s. By the 1980s and early 1990s such crises became increasingly
common place in advanced and emerging economies alike which attracted significant
interest by policy makers and academic researchers alike.

19
Kaminsky and Reinhart (1999) provided a systematic account of banking, currency
and “twin” crises for non-advanced countries. Laeven and Valencia (2008, 2013) compile a
comprehensive dataset of banking, currency and debt crises for the period 1970-2011.
Laeven and Valencia’s dataset covers the experience of 162 countries advanced, emerging
and less developed economies.
For the long run, three major contributions stand out. Bordo, Eichengreen,
Klingebiel and Martinez-Peria (2001) dated banking, currency and twin crises for all years
between 1880 and 1997. For the years 1880-1945 their sample included 21 now advanced
countries and from 1945 data from 56 countries is available. Reinhart and Rogoff (2009) and
Reinhart (2010) provide accessible data on banking, currency and debt crises for up to 70
countries. Their record on sovereign debt crises extends back to the medieval period but
only for a select number of European kingdoms and countries. From 1800 this source is able
to track banking, currency, and debt crises for an increasingly broad sample. Carmen
Reinhart’s website provides an excellent set of excel spreadsheets for researchers..6 Finally,
Alan Taylor (2015) provides the dates for “systemic” financial crises (mainly banking crises)
for 17 countries 1870-2010.
Recently Romer and Romer (2015) have collected a new set of dates for financial
distress based on their readings of the OECD Economic Outlook 1967-2007. While
previous studies have mainly provided binary indicators of the various financial crises,
Romer and Romer generate a measure based on a scale of 0 to 15. We discuss the merits of
all of these dating methodologies below.
4.2 Financial Crises: The Record
Figures 1 through 9 show the sample probabilities of experiencing a financial crisis.
This variable is calculated as the ratio of the number of years in which the set of countries in
the sample is in the first year of a banking, currency, debt, twin (banking and currency) or
triple (banking, currency, debt) crisis to the total number of country years.7 We compare
6 http://www.carmenreinhart.com/ 7 Twin crises happen when a currency crisis event takes place within two years before or after a banking crisis. Triple crises are twin crises with an associated sovereign default within a two year window. We avoid double counting by assigning a zero to all banking and currency crises that occur in the context of twin or triple crisis. Similarly we any twin crisis that occurs with a sovereign default is only counted as a triple crisis.

20
outcomes for various chronologies and across four time periods: The classical gold standard
(1880-1913), the interwar period (1919-1939), Bretton Woods (1945-1972), and the recent
period of globalization (1973-present).
Currency crises are the most frequent types of crises followed by banking crises, debt
crises, twin crises, and finally triple crises. By and large, all of the different chronologies
agree on the trends. For the three datasets that cover the Interwar period, only two out of
three agree (Bordo et. al. and Taylor) that this period saw the highest frequency. Reinhart
and Rogoff’s dating seems to suggest that the recent period has a higher incidence of
banking, currency, triple, and debt crises than in the interwar period. Their data also show
the same frequency of twin crises in the Interwar and the post-1973 period.
Figures 3 through 9 also present frequencies by crisis type for up to four leading
chronologies. Roughly speaking the frequencies in Bordo et. al are in agreement. This
agreement hides some dis-similarity in terms of dating crises for a constant country sample,
as we discuss below. It also compares frequencies across different samples of countries. In a
constant 21 country sample, for 1973-1997, Bordo et. al. report banking crises to have a
0.021 probability while Reinhart and Rogoff report a 0.032 probability. The dating
methodology of Taylor shows a noticeably higher probability of a banking crisis in all
periods.
Figure 4 shows that currency crises shot up in probability in the Interwar period and
from then on have remained fairly constant with Bordo et. al and Rinehart and Rogoff
reporting probabilities in the range of 0.07 to 0.09. These two datasets are in strong
disagreement with the Laeven and Valencia dataset in the recent period. Even in samples
where the years and countries overlap exactly Laeven and Valencia report only half the
currency crises that are recorded in Reinhart and Rogoff or Bordo et. al.
Figures 10 through 14 show the number of crises that occur alone or coincidentally
with other types of crises. We leave for future revisions an attempt to provide a measure of
how frequently and which types of crises precede the other. Of course research along the
lines of Kaminsky and Reinhart (1999) provide evidence that currency crises frequently
accompany banking crises in LDCs and Reinhart and Rogoff (2009) suggest that many debt
crises are preceded by banking crises. Bordo and Meissner (2006) discuss the historical
experience in some detail.

21
In terms of time trends in twin crises, Bordo et. al find that their frequency was
highest in the Interwar and lowest in the Bretton Woods period. Reinhart and Rogoff’s data
disagree showing that a country would be equally likely to suffer a twin crisis in the interwar
period as in the recent period. Once again, Laeven and Valencia date many fewer twin crises
due to their comparatively lower number of currency crises which are included in the other
two datasets.
Finally for triple crises, both Bordo et. al. and Reinhart and Rogoff agree that these
are rare events and they occur in less than 1% of the country years within sample. Both data
sets agree they are now more frequent than in the previous three periods. 8 Once again,
Laeven and Valencia do not concur for the 1973-2011 period suggesting that triple crises are
much more rare than in the other two datasets at (0.001 %).
4.3 Definitions and Disagreements
In our view the leading chronologies are those of Bordo et. al., Reinhart and Rogoff
and Laeven and Valencia. The dataset provided by Taylor is limited by the fact that it
restricts attention to systemic financial/banking crises for 17 countries. The other data sets
allow researchers to separate currency, banking, debt, twin, and triple crises, each of which
are important phenomena. Two questions immediately arise. How well do these sources
agree on their documented dates and which source(s) are the best?
In answer to the first question regarding agreement, there is some significant
evidence that the correlation between dating methodologies is not extremely high even
within constant country samples. Tables 1 through 5 show cross-tabulations of crisis
indicators for each of four sources (Bordo et. al., Reinhart and Rogoff, Taylor and Laeven
and Valencia) for four different periods (1880-1913, 1919-1939, 1945-1972 and the years
after 1973). We restrict attention in these tables to the first year of a banking crisis for a
country.
In each sub-table we show the number of non-crisis country-years, and the number
of country-years with crises in either of the two datasets at hand. The entry in column 2, row
2 of each table records the number of times both datasets are in agreement, and the last two
columns provide a measure of the agreement between sources calculated as the percentage
of all crisis-years dated within the period and the country sample in which the two sources 8 Note we use Reinhart and Rogoff’s debt crisis dates when dating a triple crisis within the Bordo et. al. dataset.

22
agree. We provide this percentage for crises occurring in the same year and then allow for a
one year-window to allow for small variations in timing.
The minimum percentage in Tables 1 to 5 is 0.34 (comparing Reinhart and Rogoff to
Taylor for Taylor’s 17 countries in the years, 1880-1913). For the years excluding the Bretton
Woods period, the maxima are 0.73 (Bordo et. al. vs. Reinhart and Rogoff for 21 countries
1919-1939) and 0.72 (Bordo et. al. vs. Reinhart and Rogoff for 21 countries 1973-1997. The
average percentage of times that the head-to-head comparisons agree is 0.59.
Matters are obviously slightly worse in terms of correspondence than these numbers
suggest since the figures are calculated based only on overlapping samples of countries. The
fact that Reinhart and Rogoff and Laeven and Valencia provide much larger samples means
that the absolute number of crises reported will be higher. Frequencies also vary as seen
above in Figures 1 through 9.
Disagreement amongst datasets exists because of differing definitions of what
constitutes a crisis. Table 6 gives the stated criteria for dating the various types of crises. As
is evident, for banking and currency crises, the definitions vary by sets of authors leading to
significant disagreements both about timing and whether there was or was not a crisis. In
particular, for banking crises, authors disagree about how many banks must be closed or
what percentage of capital must be impaired for a crisis to be classified as systemic. Laeven
and Valencia require that major policy interventions take place. Reinhart and Rogoff classify
more crises than other authors likely because they only require bank runs lead to the “closing
of one or more financial institutions” (our emphasis).***
Another issue with the historical dating of crises is that authors must rely on the
research of other economic historians or significant amounts of scattered primary sources
from multiple country-specific sources. Often historical sources are vague as to how many
financial institutions were closed or faced runs which leads to discrepancies in the dating of
crises. Andy Jalil (forthcoming) studied six leading chronologies of the American banking
system in the 19th and early 20th century and observed major discrepancies amongst them.
Jalil argues that “quantitative sources alone are not sufficient to identify banking panics”, and
carries out an extensive and careful reading of contemporary sources to identify banking
panics (as opposed to systemic banking crises).
Matters are significantly worse for dating currency crises in history especially in the
19th century. As it turns out, finding reliable exchange rate data for samples outside of the

23
leading 21 countries is extremely difficult if not impossible since active and liquid markets in
foreign exchange did not exist without some prior financial development. Reinhart and
Rogoff (2009) provide an extensive list of dates for which nominal exchange rates are
available from which shows cases in point such as: Argentina (available from 1880 only),
Finland (from 1900), Korea (1905), Greece (1872), New Zealand (1892), South Africa
(1900), Uruguay (1900) etc. In other cases using an exchange market pressure index will be
difficult prior to the 1930s or even the 1950s and the Frankel and Romer approach will have
to suffice. Relying exclusively on exchange rates changes neglects many important episodes.
More disconcerting is the disagreement on sovereign defaults in the period since
1973. These data are mainly gathered from primary and secondary sources as noted in
Laeven and Valencia (2013) and Reinhart and Rogoff (2009). While Reinhart and Rogoff
find 64 defaults between 1973 and 2009 Laeven and Valencia (2013), in the same set of countries,
only find 34. This is not simply a matter of widening the window of years in which a default
is classified. Many defaults in Reinhart and Rogoff such as Algeria (1991), Brazil (2002),
Uruguay (1990) etc. are not recorded in the Laeven and Valencia dataset. This is hard to
understand given the fact that most sovereign defaults are highly publicized events and the
IMF and World Bank keep careful track of their member countries’ experiences.
4.4 Causes of Crises
As discussed above there are many forms of financial crises. Banking crises for
example can be caused by panic and sudden losses on the liability side of the balance sheet a
la Diamond Dybvig and as recently occurred in the repo market in the sub-prime crisis.
Banking crises can also arise due to impaired assets which stem from large declines in asset
prices and the business cycle impact on a bank’s assets. The question arises, are banking
crises predictable and if so which economic variables are the best predictors?
A large number of variables are on the list of potential determinants of banking
crises. Recent literature has focused on the credit growth and capital inflows. Credit booms,
whatever their origins, cause a build-up of household or non-financial firm debt. Economic
shocks can then cause large losses on the balance sheets of banks leading to a systemic crisis
(Taylor and Schularick, 2009; Reinhart and Rogoff, 2009; Jordà et al. 2011; Mian and Sufi,
2014). Capital inflows, especially in small open economies, subject these nations to credit

24
booms, sudden stops and reversals adverse changes in the real exchange rate and sharp
changes in demand (Calvo, Izquierdo and Mejia, 2004; Mendoza and Terrones, 2012).
A number of other variables have also been highlighted as potential determinants of
banking crises. These include the growth rate of M2 (possibly relative to reserves), real
interest rates and global interest rate shocks, output and asset price shocks, corporate
governance issues (limited liability, moral hazard e.g., the S&L crisis in the US), loose fiscal
policy and regulations that feed banks excess government debt, the exchange rate regime, the
level of capital controls etc. Kaminsky and Reinhart (1999) amongst others provide detailed
econometric tests of the predictive power of these variables. The historical literature on
banking crises in the US and in comparative perspective has focused on issues related to
regulation, inter-bank contagion, limited liability, the exchange rate regime, the types of
shocks countries are exposed etc. (Grossman, 1994, Carlson and Mitchener, 2006 Mitchener,
2005).
Our initial reading from the literature is that overall it is very hard to predict the
exact timing of financial crises with a high degree of accuracy. Jordà et. al. argue that credit
provides good predictive power while other variables add little to the predictive power of
econometric models. It could be asked whether this is a product of the selected country and
crisis sample they use. Larger samples from other studies highlight other key, statistically
significant determinants. Our reading from the literature is that it is very hard to predict
financial crises with a high degree of accuracy..
In terms of fiscal crises, Reinhart and Rogoff highlight both private and public
borrowing surges. In their review of the historical record, private borrowing, mediated by
the banking sector often precedes fiscal crises. They emphasize the possibility that when and
if private debts go bad that governments provide large bailouts to the financial sector.
Another possibility is that a banking crisis leads to output losses, lost revenue, higher outlays
if automatic stabilizers are present, and a worsening debt burden relative to GDP. Countries,
especially in the developing world, would be in an especially tight situation if borrowing or
lending constraints tighten in the downturn. Austerity measures could have a negative impact
on output assuming there is a fiscal multiplier of one or higher.
The literature has typically found that fiscal policy was more pro-cyclical in LDCs
than in advanced economies. However, the recent crisis has shown that such an outcome
can arise in advanced economies. Ireland, Spain, Portugal, Italy, and possibly Greece faced
25
massive economic shocks and lacked “fiscal space”. These countries, despite their advanced
economic status were viewed as being close to a threshold where increases in debt were
unsustainable. Other countries have worried about fiscal sustainability and limited their fiscal
response such as the United Kingdom, Germany and to an extent, the United States.
Over the long run this type of dynamic seems less common in advanced countries.
For the most part governments were much smaller in scope. The use of bailouts and
guarantees was not uncommon prior to the 1940s, but the size and scope was more limited.
Moreover, these economies had greater wage and price flexibility, especially prior to the
1930s such that adjustment obtained relatively quickly. There are of course exceptions to the
rule in history as in Argentina in 1890-1891 when government guarantees of the banking
system and the non-financial sector became overwhelming.
4.5 Output Losses of Financial Crises
Financial crises are often associated with economic downturns and deviations of
output from long-run trends. A large number of studies investigate the path of output,
output growth, other macroeconomic aggregates, and even health indicators (Stuckler,
Meissner, Fishback, Basu, and Mckee, 2010). It is our intention, in the next draft to provide a
brief meta-study of this body of research. We expect to find that banking crises and other
financial crises are associated with significant output losses and deviations of growth from
trend.
For the time being, Table 7 provides a short-list of papers, methodologies and
bottom lines for the impact of financial crises. There is substantial variation in the
methodologies used for calculating the costs of financial crises. Some authors prefer to study
the marginal impact of crises and financial distress on growth rates. Others calculate the
cumulative loss of output or GDP per capita from the peak of economic activity and up to
five years later. Differences in methodologies, dependent variables, and samples leads to
large differences in the size of the estimated costs of financial crises. Still, nearly all studies
agree that financial crises are associated with economically significant downturns in output
and growth.

26
One major issue is causality. Real shocks may cause an output decline and problems
in the financial sector, but equally, financial shocks are widely believed to generate output
declines. Reinhart and Rogoff (2014) observe in their sample that the peak of economic
expansions usual coincides with banking crises but that in several instances the peak pre-
dates the crisis.
If unobservable shocks are the worry, then it may be difficult to establish the “causal
impact” of financial crises on output. For now we highlight two approaches that have been
taken to deal with causality. Bordo et. al. compare recessions without financial crises to
recessions with financial crises. After controlling for a small set of observables the authors
find that financial crises are associated with higher output losses. Della’Ariccia et. al. (2008)
argue that if financial sector distress matters then it should be the case that sectors which are
more dependent on external finance should be the hardest hit when the banking sector is in
trouble. Their evidence is consistent with this line of reasoning. Mladjan (2012) provides
similar evidence for the Great Depression. In addition Ziebarth (2013) and found strong
quasi-experimental evidence from the 1930s that where bank failures were larger these were
associated with greater declines in output, lower revenue and a slower pace of entry by firms.
Using crisis data from Bordo et. al, Reinhart and Rogoff, and Laeven and Valencia
and data on output per capita from Barro and Ursua (2008) we calculate the output losses in
different periods and using different crisis dates. Here the goal is to use one methodology to
compare output losses in a consistent fashion over the long-run. In particular we study the
cumulative deviation of GDP per capita from the pre-crisis trend level from the outbreak of
the crisis to three years later. Pre-crisis trends are given by the average change in log points
of the logarithm of GDP per capita in up to 10 years prior to a crisis. 9
We provide these losses for banking, twin and triple crises in Figures 15 through 39.
Output losses as we define them here are economically very large. In the period 1880-1913
Figure 15 shows that these averaged about 26-27%. Twin crises and triple crises are
associated with much larger losses in the Reinhart and Rogoff (RR) data than in the Bordo
9 We eliminate crises that occur within 3 years of another crisis. Previous crises may have an impact on the trend and level of output. We also estimate losses separately for banking crises without currency and currency and debt crises so as to separate the event states into mutually exclusive bins.

27
et. al. (BEKM) data. Losses are much larger in the interwar, largely driven by the Great
Depression. Here, for the three different crises losses are never lower than 30%. Losses in
the BEKM and RR data sets are even larger in the post 1973 period. Here the averages are
on the order of 70% in the BEKM data ranging in the RR data from 57% (banking crises) to
86% (6 triple crises).
Output losses are different in size due to different methodologies. Laeven and
Valencia (Figure 18) report much lower losses than we have calculated when using the
BEKM or RR dates. Laeven and Valencia use GDP and not per capita GDP, although, in
practice this should have only a minimal effect. LV also use an HP filter whereas we have
opted for a simplified exponential de-trending procedure. One interesting fact is that while
we find some instances where losses are not negative (i.e., below trend), probably because
the pre-trend is already quite low, LV report no instances where this is the case. It appears
that the lag length for calculating the trend matters. Figure 20 shows the median output
losses as calculated by Laeven and Valencia for advanced and EM/LDC countries. Local
polynomial regressions in Figures 21 and 22 and 31 through 33 show the data on a case-by-
case basis for various years. Figures 23 through 30 show kernel density plots over various
data sets, periods and types of crises so the reader can see the enormous variation in output
losses. Figures 34 to 39 provide the time series plots for two of the most significant crises in
each of three periods (1880-1913, 1919-1939 and 1973-1997) so the reader can explicitly see
how output losses are calculated and how they can be so large.
Our bottom line is that financial crises are associated with significant deviations of
output from trend. This stylized fact occurs over the long-run in different periods of
institutional development. Surprisingly output losses seem to larger in the recent despite a
greater reliance on liquidity support, fiscal interventions and other policies which attempt to
remedy the financial shocks that regularly occur. Of course, without such interventions,
output losses might have been higher although without further work on the research design
to sort out causality and selection we can take no firm stance on the causal impact of
financial distress and systemic banking crises.
TO BE DONE: A REVIEW OF THE DETERMINANTS OF THE SPEED OF
RECOVERIES AFTER FINANCIAL CRISES. THERE IS A LARGE DEBATE HERE.

28
5. Fiscal Crises, Banking Crises and a new Trilemma
Following the research of Reinhart and Rogoff (2009) and after observation of
events in Europe, research has focused on the impact of banking crises on the probability of
a debt crisis especially in advanced countries. While developing countries faced such troubles
from the 1970s, advanced countries largely had fewer and smaller crises until recently.
Reinhart and Rogoff suggest however that public debt increased by about 86 percent in the
wake of banking crises due to the impact of falling revenues. These increases were not
apparently due to the fiscal costs of bailouts and guarantees.
Laeven and Valencia provide a systematic data set on the rise in Debt to GDP ratios
for all of the banking crises in their data set. The average rise in the debt to GDP ratio for all
systemic crises in their data was 12 percent while in advanced economies this figure rises to
21.4%. Fiscal costs, counted as the rise in outlays due to restructuring the financial sector
averaged 6.8% (in terms of GDP. Laeven and Valencia subtract the rise in fiscal outlays due
to restructuring from the rise in total debt to calculate the degree of discretionary fiscal
policy. The median for this variable is 7%.
Tagkalakis (2013) empirically examines the feedback loop from fiscal policy to
financial markets and back in a sample of 20 OECD countries 1990-2010. Fiscal instability
leads to financial instability and financial instability leads to fiscal instability via bailouts.
Fratzscher and Rieth (2015) using structural VARs with daily financial markets data for
2003-2013 confirms the two way causality between sovereign risk shocks and bank risk.
They find that sovereign risk shocks are more important in explaining bank risk, than the
reverse.
The findings in Tagkalakis (2013) are intriguing since it appears that the rise in debt
following a financial crisis is larger the bigger the size of the financial sector. Laeven and
Valencia (2013) also argue that the largest fiscal costs of crises since the 1970s have been in
Ireland, Iceland, Israel (1977), Greece, and Japan (1990s).
Putting all of these findings together suggests the possibility that there is a potential
tradeoff for countries along the lines of a trilemma. This trilemma suggests that countries
have two of the following three choices: a large financial sector (measured by total
assets/GDP), a large bailout package, and a strong discretionary reaction to the downturn
associated with financial crises. The logic is as follows. A country with a large financial sector
will be more likely to have a financial crisis. If so, then the government can either provide a

29
large bailout package and use up its fiscal space in this way, or else it could lower the size of
the bailout and devote its fiscal space to discretionary fiscal policy. Obviously the smaller the
financial sector the less binding will be the fiscal constraints since the size of the bailout
would by definition be smaller.
The cases of the United States and Greece post 2007 are illustrative. The US had a
large financial sector, but its bailout, as measured by the fiscal costs was relatively small
(4.5% pf GDP). On the other hand the rise in the debt to GDP ratio was on the order of 19
percentage points (Laeven and Valencia, 2013). While Greece also had a rise in debt to
GDP of about 17 percent, its downturn was much larger and likely merited, based on past
experience a much larger response. Its fiscal costs of the bailout are reported by LV to be
27% (as a percentage of GDP) which does not account for the various bailout packages
provided by the troika and re-scheduling of the national debt. Obviously the ability of
countries to finance either a bailout or a discretionary package depends on the willingness of
capital markets to fund deficits. In this regard, the trilemma would be more applicable or
more binding for countries which had better debt sustainability measures at the beginning of
their crisis events.
TO BE DONE: We will attempt to construct a more systematic test of this hypothesis in
our future draft.
6.Conclusions
To be done…

30
References
Franklin Allen and Douglas Gale (1998) “ Optimal Financial Crises” Journal of Finance, 53,
1245-1284.
Franklin Allen and Douglas Gale (2004)” Financial Intermediation and Markets”
Econometrica 72, pp 1023-1061.
Franklin Allen and Douglas Gale (2007) Understanding Financial Crises. New York: Oxford
University Press
Viral Acharya, Itamar Drechsler and Philipp Schnabl (2011) “ A Pyrrhic Victory?- Bank
Bailouts and Sovereign Credit Risk “
NBER Working Paper 17136 June
Mark Aguiar and Gita Gopinath (2006)” Defaultable Debt, Interest Rates and the Current
Account” Journal of International Economics Vol 69 pp 64-83.
Christina Arellano (2008) “ Default Risk and Income Fluctuations in Emerging Economies’
American Economic Review Vol 98(3) pp 690-712.
Cristina Arellano and Narayana Kocherlakota (2008) “ Internal Debt Crises and Sovereign
Defaults” NBER Working Paper 13794 February

31
Barro, R. J. and Ursúa, J. F. (2008) “Macroeconomic Crises since 1870”, Brookings Papers
on Economic Activity, spring, pp. 255-335.
S. Bhattacharya and D. Gale (1987) “ Preference Shocks, Liquidity and Central bank Policy”
in W. Barnett and K. singleton (eds) New Approaches to Monetary Economics. New York:
Cambridge University Press 69-88
Patrick Bolton and Olivier Jeanne(2011) “ Sovereign Default Risk and Bank Fragility in
Financially Integrated Economies “ NBER Working Paper 16899 March
Michael Bordo and Barry Eichengreen (1999) “ Is our International Economic Environment
Unusually Crisis Prone?” in David Gruen and Luke Gower (eds) Capital Flows and the
International Financial System. Sydney: Reserve Bank of Australia.
Michael Bordo, Barry Eichengreen, Daniela Klingebiel and Soleded Martinez-Peria (2001) “
Is the Crisis Problem Growing More Severe?” Economic Policy April, pp 52-82
Michael Bordo and Marc Flandreau (2003) “ Core, Periphery, Exchange Rate Regimes and
Globalization” in Michael Bordo, Alan Taylor and Jeffrey Williamson (eds) Globalization in
Historical Perspective. University of Chicago Press for the NBER
Michael Bordo and Christopher Meissner (2006) “ The Role of Foreign Currency Debt in
Financial Crises: 1880-1913 vs 1972-1997” Journal of Banking and Finance

32
Michael Bordo and Anna J. Schwartz (1999) “ Why Currency Clashes between Internal and
External Stability Goals end in Currency Crises, 1797-1995” Open Economies Review. April
Michael Bordo, Alberto Cavallo and Christopher Meissner (2010) “ Sudden Stops:
Determinants and Output Effects in the First Era of Globalization, 1880-1913” Journal of
Development Economics .February
Michael Bordo and Christopher Meissner (2007) “ Financial Crises, 1880-1913: The Role of
Foreign Currency Debt” in S. Edwards, S. Esquivel and G. Marquez (eds) Growth, Protection
and Crises: Latin America from an Historical Perspective. University of Chicago Press.
Michael Bordo (2006) “ Sudden Stops, Financial Crises and Original Sin in Emerging
Countries: Déjà vu? NBER Working Paper 12393
Michael Bordo and John Landon Lane (2010b) ‘ The Banking Panics in the United States in
the 1930s: some Lessons for Today” Oxford Review of Economic Policy Vol 26, pp 486-509
Michael Bordo and John Landon Lane (2010a) “ The Global Banking Crisis of 2007-2008 :
Is it Unprecedented?” NBER Working Paper 16589
Claudio Borio (2012) “ The Financial Cycle and Macroeconomics: What Have We learnt?”
BIS Working paper 395

33
Markus Brunnermeir and Martin Oehmke (2013) “ Bubbles, Financial Crises, and Systemic
Risk’ North Holland Handbook of the Economics of Finance. Volume 2.
Jeremy Bulow and Kenneth Rogoff (1989a) “ A Constant Recontracting Model of
Sovereign Debt” Journal of Political Economy 97(1) :pp155-178
Jeremy Bulow and Kenneth Rogoff (1989b) “ Sovereign Debt: Is to Forgive to Forget?”
American Economic Review 79 (1) pp43-52.
Craig Burnside (2004) “ Currency Crises and Contingent Liabilities” Journal of International
Economics 62 pp 25-52
Craig Burnside, Martin Eichenbaum and Sergio Rebelo (2006) Government Finance in the
Wake of Currency Crises” Journal of Monetary Economics 53, pp 401-440.
Craig Burnside, Martin Eichenbaum and Sergio Rebelo (2004) “ Government Guarantees
and Self- Fulfilling Speculative Attacks ‘ Journal of Economic Theory, 119 pp 31-63
Craig Burnside, Martin Eichenbaum and Sergio Rebelo (2001) “ Prospective Deficits and the
Asian Currency Crisis “ Journal of Political Economy, Vol 109, No.6 (December) pp 1155-1197.
Charles Calomiris and Charles Kahn (1991) “ The Role of Demandable Debt in Structuring
Optimal banking Arrangements” American Economic Review Vol 93 (5) pp1615-1646.

34
Calvo, G. A., A. Izquierdo and L.-F. Mejia (2004). “On the Empirics of Sudden Stops: The
Relevance of Balance-Sheet Effects.” National Bureau of Economic Research Working
Paper Series No. 10520.
Charles Calomiris and Joseph Mason (2003) “ Fundamentals, Panic and Bank Distress
During the Depression” American Economic Review vol 93 (5) pp1615-1647
Caprio, G., Jr and D. Klingebiel (1996). 'Bank insolvencies: cross-country experience', Policy
Research Working Paper 1620, The World Bank, Washington, DC.
Carlson, Mark, and Kris James Mitchener. (2006) “Branch Banking, Bank Competition, and
Financial Stability.” Journal of Money, Credit, and Banking 38(5). Pp. 1293-1328.
V.V. Chari and R. Jagannathan (1989), “ Banking Panics, Information and Rational
Expectations Equilibrium” Journal of Finance Vol 43 (3) pp 749-61.
Harold Cole and Patrick Kehoe (1995) “ The Role of Institutions in Reputation Models of
Sovereign Debt” Journal of Monetary Economics 35 (1) 45-46
Harold Cole and Patrick Kehoe (1998) “ (1998) “ Models of Sovereign Debt: partial versus
General Reputation” International Economic Review 29 (1) pp55-70.

35
Conant, C. (1915) A History of Modern Banks of Issue. 5th ed. New York: G.P. Putnam’s
and Sons.
Giancarlo Corsetti, Paolo Pesenti and Nouriel Roubini (1999) “ Paper Tigers? A Model of
the Asian Crisis “ European Economic Review 43 pp 1211-1236.
Dell'Ariccia, Giovanni, Enrica Detragiache, and Raghuram Rajan (2008) “The real effect of
banking crises.” Journal of Financial Intermediation 17.1 pp. 89-112.
Douglas Diamond and Philip Dybvig (1983) “ Bank Runs, Deposit Insurance, and
Liquidity” Journal of Political Economy 91 pp 401-419.
Douglas Diamond and Raghuram Rajan (2001) “ Liquidity Risk, Liquidity Creation and
financial Fragility: A Theory of Banking” Journal of Political Economy 109, pp 2431-2465.
Douglas Diamond and Raghuram Rajan (2005) “ Liquidity Shortages and Banking Crisis”
Journal of Finance 60 (2) pp 615-647.
Douglas Diamond and Raghuram Rajan (2011) “ Fear of Fire Sales, Illiquidity Seeking and
Credit Squeezes” Quarterly Journal of Economics Vol 126 (2) pp 557-591.
Douglas Diamond and Raghuram Rajan (2012) “ Illiquid banks, Financial stability and
Interest Rate Policy’ Journal of Political Economy Vol 120 No.3 June pp 552-591.

36
Carlos Diaz-Alejandro (1985) “ Good Bye Financial Repression, Hello Financial Crash”
Journal of Development Economics 19, pp 1-24.
Michael Dooley (2000) “ A Model of Crises in Emerging Markets” Economic Journal.
Jonathan Eaton and Mark Gersowitz (1981) “ Debt with Potential Repudiation: Theoretical
and Empirical Analysis’ Review of Economic Studies 48 (2) pp 289-309.
Jonathan Eaton (1996) “ Sovereign Debt, Reputation and Credit Terms” International Journal
of Finance and Economics 1(1)pp 25-35
Edwards, S. (2004) “Financial Openness, Sudden Stops and Current Account Reversals”
American Economic Review 94 (2) pp. 59-64.
Edwards, S. and Santaella, J. Devaluation (1993) Controversies in the Developing Countries:
Lessons from the Bretton Woods Era” in M.D. Bordo and B. Eichnegreen (eds.) A
Retrospective on the Bretton Woods System: Lessons for International Monetary Reform,
University of Chicago Press, Chicago. pp. 405-460
Barry Eichengreen (1992). Golden Fetters. Oxford University Press
37
Barry Eichengreen and Ricardo Haussman (1999) “ Exchange Rates and Financial Fragility”
in New Challenges for Monetary Policy . Federal Reserve Bank of Kansas City.
Irving Fisher (1932) Booms and Depressions. New York: Adelphi.
Irving Fisher (1933) “ The Debt Deflation Theory of Great Depressions” Econometrica Vol 1
pp 337-357.
Frankel, Jeffrey A., and Andrew K. Rose. (1996) “Currency crashes in emerging markets: An
empirical treatment.” Journal of international Economics 41.3 pp. 351-366.
Marcel Fratzscher and Malte Rieth (2015) “ Monetary Policy, Bank Bailouts and the
Sovereign –Bank Risk Nexus in the Euro Area” CEPR Working Paper No. 10370. January.
Milton Friedman and Anna J Schwartz (1963) A Monetary History of the United States 1867 to
1960, Princeton: Princeton University Press
Nicola Gennaioli, Alberto Martin, and Steffano Rossi (2014) “ Sovereign Default, Domestic
Banks, and Financial Institutions” Journal of Finance Vol LXIX No.2 April pp 819-886.
Gary Gorton (1988) “ Banking Panis and Business Cycles “ Oxford Economic Papers 40 pp
756-781.
38
Gary Gorton and I. Huang (2004) “ Liquidity, Efficiency and Bank Bailouts “ American
Economic Review 94 pp 455-483
Grossman, Richard S. (1994) “The shoe that didn't drop: explaining banking stability during
the Great Depression.” The Journal of Economic History 54.03: 654-682.
Richard Grossman (2010) Unsettled Account: The Evolution of Banking in the Industrialized World
Since 1820. Princeton University Press.
Herschel Grossman and John van Huyck (1988) “ Sovereign Debt as a Contingent Claim:
Excusable Default, Repudiation and Reputations” American Economic Review 78 (8) pp1088-
B. Holmstrom and J. Tirole (1991) “ Private and Public Supply of Liquidity” Journal of
Political Economy 106, pp 1-40.
97.
C. Jacklin (1987) “ Demand Deposits, Trading Restrictions, and Risk Sharing “ in E.
Prescott and N. Wallace (eds) Contractual Arrangements for Intertemporal Trade. University of
Minnesota Press
C. Jacklin and S. Bhattacharya (1988) “ Distinguishing Panics and Information Based Bank
Runs; Welfare and Policy Implications” Journal of Political Economy 96 pp 568-592.
Jalil, A. (forthcoming) A New History of Banking Panics in the United States, 1825-1929:
Construction and Implications. American Economic Journal: Macroeconomics.

39
Jordà, Ò., Schularick, M., and A. M. Taylor. “Financial Crises, Credit Booms, and External
Imbalances: 140 Years of Lessons.” IMF Economic Review 59 (June 2011): 340–378.
Jordà, Oscar, Schularick, M. and Taylor, A.M. (2013) “When credit bites back.” Journal of
Money, Credit and Banking 45.2. 3-28.
Kaminsky, Graciela L., and Carmen M. Reinhart. (1999) “The twin crises: the causes of
banking and balance-of-payments problems.” American economic review, pp. 473-500.
Henry Kaufman (1986) “ Debt: The Threat to Economic and Financial Stability” in Debt,
Financial Stability and Public Policy. Federal Reserve Bank of Kansas City.
Charles Kindleberger (1978) Manias, Panics and Crashes : A History of Financial Crises. Basic
Books
Kenneth Kletzer and Brian Wright (2000) “ Sovereign Debt as Intertemporal Barter”
American Economic Review 90 (3) pp 621-639
Paul Krugman(1979) “ A Model of Balance of Payments Crises” Journal of Money, Credit
and Banking
Paul Krugman (1998) “ Currency Crises’ Princeton University (mimeo).
40
Paul Krugman (1989) “ Balance Sheets, the Transfer Problem and financial Crises”
International Finance and Financial Crises : Essays in Honor of Robert B. Flood. Kluwer pp31-44.
Laeven, Luc and Fabian Valencia, 2008, “Systemic Banking Crises: A New Database,” IMF
Working Paper No. 08/224.
Laeven, Luc and Fabian Valencia, 2013, “Systemic Banking Crises Database: An Update,”
IMF Working Paper No. 12/163.
Carlos Marichal (1989) A Century of Debt Crisis in Latin America: From Independence to the Great
Depression, 1820-1930. Princeton University Press
Ronald McKinnon and Huw Pill (1986) “ Credible Liberalizations and International Capital
Flows; The “ Over Borrowing Syndrome” in T Ito and A. Kreuger (eds) Financial Deregulation
and Integration in East Asia. Chicago; University of Chicago Press
Enrique G. Mendoza & Marco E. Terrones, (2012) “An Anatomy of Credits Booms and
their Demise,” Journal Economia Chilena (The Chilean Economy), Central Bank of Chile,
vol. 15(2), pages 04-32.
Mian, A. and Sufi, A. (2104) House of Debt: How They and You Caused the Great
Recession and How We Can Prevent it from Happening Again. University of Chicago Press,
Chicago.

41
Hyman Minsky (1977) “ A Theory of Systemic Fragility” in Edward J. Altman and Arthur
Sametz (eds) Financial Crises: Institutions and Markets in a Fragile Environment . New York Wiley
pp138-152
Wesley Mitchell (1941) Business Cycles and Their Causes. Berkeley. University of California
Press
Mitchener, Kris James. (2005) “Bank supervision, regulation, and instability during the Great
Depression.” The Journal of Economic History 65(1). pp. 152-185.
Kris Mitchener and Mark Wiedenmeir (2010) “ Supersanctions and Sovereign Debt
Repayment” Journal of International Money and Finance 29 (1) pp 19-36.
Mladjan, M. (2012) “Accelerating into the Abyss: Financial Dependence and the Great
Depression” mimeo. EBS Business School.
Ashoka Mody and Damiano Sandri (2012) “ The Eurozone Crisis: How Banks and
Sovereigns Came to be Joined at the Hip” Economic Policy April, pp 199-230.
S. Morris and H. Shinn (1988) “ Unique equilibrium in a Model of Self-Fulfilling Currency
Attack” American Economic Review 88, pp 587-597.
Maurice Obstfeld (1994) “ The Logic of Currency Crises” NBER Working Papers No. 4640.

42
Ugo Panizza, Federico Sturzenegger and Jeromin Zettelmeyer (2009) “ The Economics and
Law of Sovereign Debt and Default” Journal of Economic Literature. 47 (3) pp 651-669.
Raul Prebisch (1950) The Economic Development of Latin America and its Principal Problems. New
York: United Nations
Reinhart, Carmen (2010) This Time is Different Chartbook: Country Histories on Debt,
Default and Financial Crises. NBER working paper 15815.
Carmen Reinhart and Kenneth Rogoff (2009) This Time is Different: Eight Centuries of Financial
Folly. Princeton; Princeton University Press
Reinhart, C. and Rogoff, K. (2011) “From Financial Crash to Debt Crisis,” American
Economic Review, American Economic Association, vol. 101(5), pages 1676-1706,
Carmen Reinhart and Kenneth Rogoff (2011) “ From Financial Crash to Debt Crisis”
American Economic Review 101 (August) pp 1676 -1706
Carmen M. Reinhart & Kenneth S. Rogoff, (2014) “Recovery from Financial Crises:
Evidence from 100 Episodes,” American Economic Review, American Economic
Association, vol. 104(5), pages 50-55.
Carmen Reinhart, Kenneth Rogoff and Miguel Savastano (2003) “Debt Intolerance”
Brookings Papers in Economic Activity 1; pp1-62.

43
Gary Richardson (2007) “ Categories and Causes of Bank Distress during the Great
Depression, 1920-1935: The Liquidity and Insolvency Debate Revisited” Explorations in
Economic History Vol 44. No 4 October pp 588-607.
J. Rochet and X. Vives (2004) “ Coordination Failures and the Lender of Last Resort; Was
Bagehot Right after All” Journal of the European Economic Association
Hugh Rockoff (2014) “ It is Always the Shadow banks: The Failures that Ignited America’s
Financial Panics” Rutgers University (mimeo)
Martin Schneider and Aaron Tornell (2000) “ Balance Sheet Effects, Bailout Guarantees and
Financial Crises” NBER Working Paper 8060 December
Anna J Schwartz (1987) “ The Lender of Last Resort and the Federal Safety Net” in Journal
of Financial Services Research Vol 1 pp 77-111.
Athanasios Tagkalakis (2013) “ The Effects of Financial Crisis on Fiscal Positions “ European
Journal of Political Economy, 29, pp 197-213.
Alan M. Taylor (2015) Credit, Stability and the Macroeconomy” NBER Working paper
21039 March
Peter Temin (1976) Did Monetary Forces cause the Great Depression? New York: WW Norton`

44
Andres Velasco (1987) “ Financial Crises and Balance of Payments Crises: A Simple Model
of the Southern Cone Experience” Journal of Development Economics 27 pp 263-283.
Neil Wallace (1988) “ Another Attempt to Explain an Illiquid Banking system: the Diamond
Dybvig Model with Sequential Service Taken Seriously” Federal Reserve Bank of Minneapolis
Quarterly Economic Review Fall pp 3-16.
Ziebarth, N. (2013) “ Identifying the Effects of Bank Failures from a Natural Experiment in
Mississippi during the Great Depression” American Economic Journal: Macroeconomics
5(1), pp. 81-101.

45
Figure 1 Crisis Frequencies Bordo, et. al. 1880-1997
0
0.02
0.04
0.06
0.08
0.1
0.12
1880-1913 1919-1939 1945-1972 1973-1997 (21 countries)1973-1997 (55 countries)
Cri
si Fr
eque
ncy
(ann
ual %
pro
babi
lity)
Banking Crises Currency Crises Twin Crises Triple Crises

46
Figure 2 Crisis Frequencies Reinhart and Rogoff . 1880-2009
0
0.01
0.02
0.03
0.04
0.05
0.06
0.07
0.08
0.09
0.1
1880-1913 1919-1939 1945-1972 1973-2009
Cri
sis F
requ
ency
(ann
ual %
pro
babi
lity)
Banking Crises Currency Crises Debt Crises Twin Crises Triple Crises

47
Figure 3 Banking Crisis Frequencies Four Datasets, 1880-2011

48
Figure 4 Currency Crisis Frequencies, three Datasets, 1880-2011
0
0.02
0.04
0.06
0.08
0.1
0.12
1880-1913 1919-1939 1945-1972 1973-
Cri
sis F
requ
ency
(ann
ual %
pro
babi
lity)
Bordo et. al Reinhart and Rogoff Laeven & Valencia
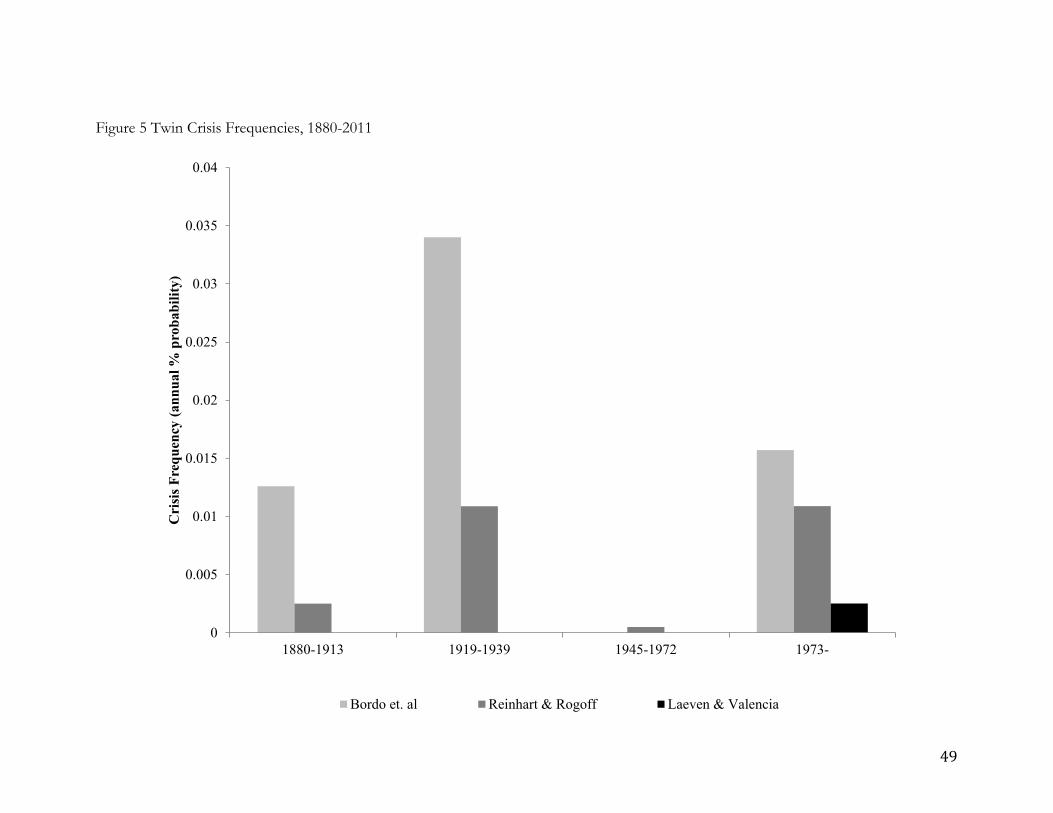
49
Figure 5 Twin Crisis Frequencies, 1880-2011
0
0.005
0.01
0.015
0.02
0.025
0.03
0.035
0.04
1880-1913 1919-1939 1945-1972 1973-
Cri
sis F
requ
ency
(ann
ual %
pro
babi
lity)
Bordo et. al Reinhart & Rogoff Laeven & Valencia

50
Figure 6 Triple Crisis Frequencies, Three datasets 1880-2011
0
0.001
0.002
0.003
0.004
0.005
0.006
0.007
0.008
0.009
1880-1913 1919-1939 1945-1972 1973-
Cri
sis F
requ
ency
(ann
ual %
pro
babi
lity)
Title
Bordo et. al. Reinhart & Rogoff Laeven & Valencia

51
Figure 7 Number of Countries Experiencing a Banking Crisis, by level of development, 1975-2011. (Laeven and Valencia)
0 5 10 15 0 5 10 15
2009200820072003200220012000199819971996199519941993199219911990198919881987198619851984198319821981198019771976
2009200820072003200220012000199819971996199519941993199219911990198919881987198619851984198319821981198019771976
Year Year
Emerging/LDC Advanced
Number of CountriesGraphs by advanced

52
Figure 8 Percentage of Advanced Countries in Banking Crisis, 1975-2011 (21 Advanced countries-Laeven and Valencia)
0.2
.4.6
.8P
erce
ntag
e of
Adv
ance
d C
ount
ries,
N =
21
1976 1977 1980 1981 1982 1983 1984 1985 1986 1987 1988 1989 1990 1991 1992 1993 1994 1995 1996 1997 1998 2000 2001 2002 2003 2007 2008 2009Year

53
Figure 9 Percentage of Advanced and LDC/Emerging Market Countries in Banking Crisis, 1975-2011 (Laeven and Valencia)
0.0
5.1
.15
Per
cent
age
LDC
s an
d E
Ms,
N=
95
1976 1977 1980 1981 1982 1983 1984 1985 1986 1987 1988 1989 1990 1991 1992 1993 1994 1995 1996 1997 1998 2000 2001 2002 2003 2007 2008 2009Year
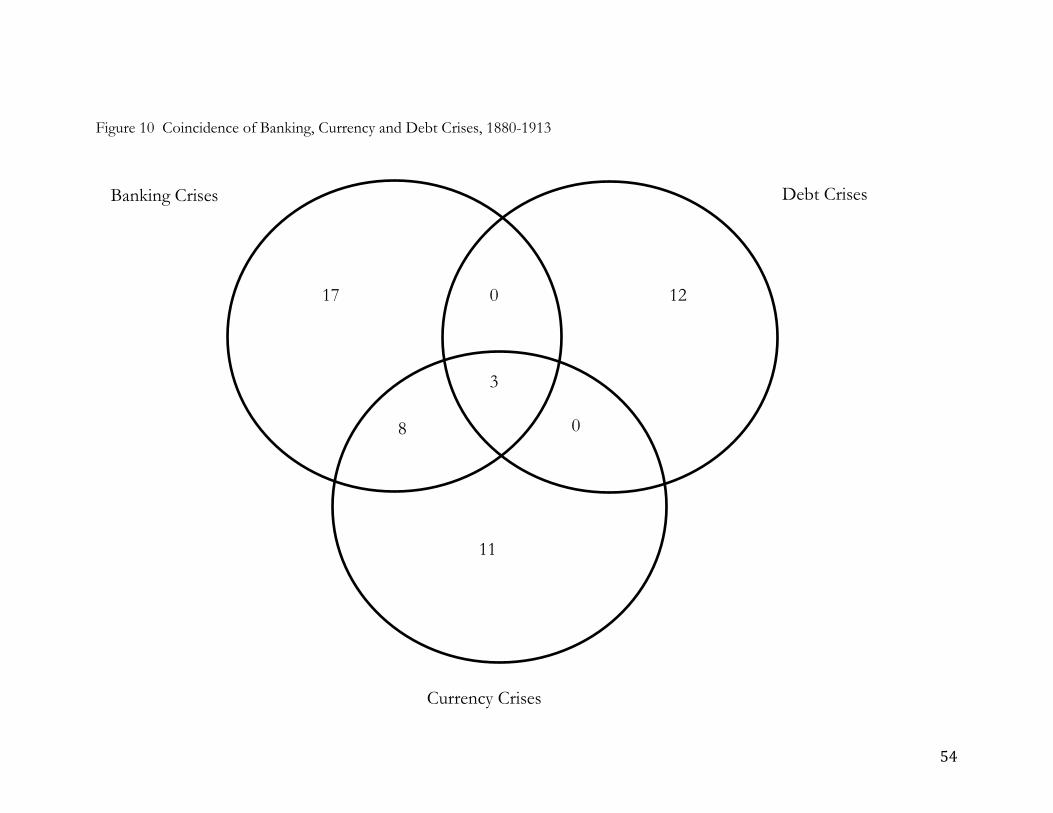
54
Figure 10 Coincidence of Banking, Currency and Debt Crises, 1880-1913
17
3
8 0
12 0
11
Banking Crises Debt Crises
Currency Crises
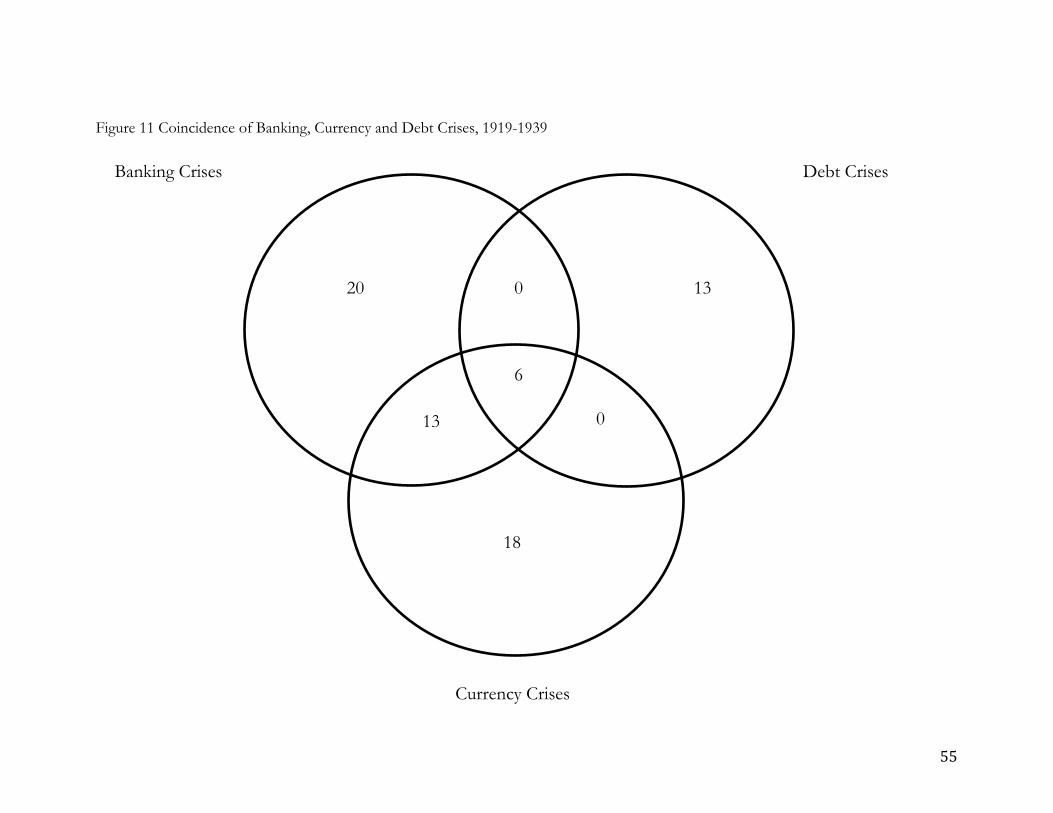
55
Figure 11 Coincidence of Banking, Currency and Debt Crises, 1919-1939
Banking Crises Debt Crises
Currency Crises
20
6
13 0
13 0
18
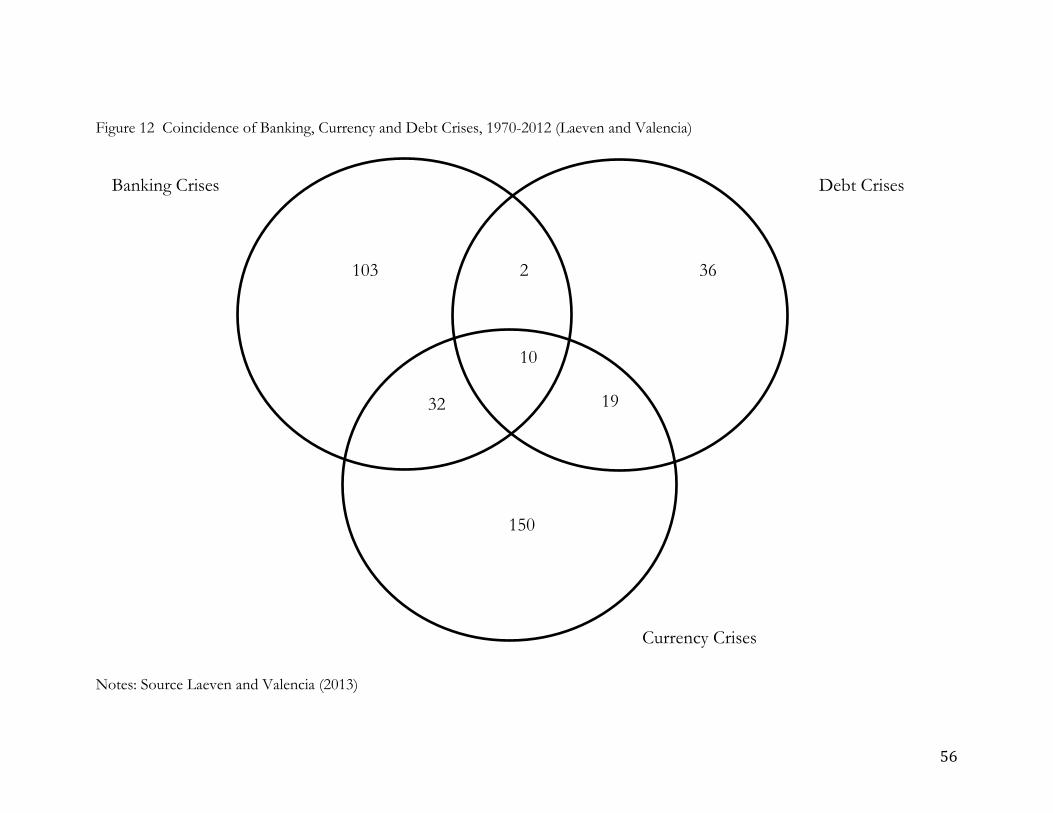
56
Figure 12 Coincidence of Banking, Currency and Debt Crises, 1970-2012 (Laeven and Valencia) Notes: Source Laeven and Valencia (2013)
Banking Crises Debt Crises
Currency Crises
103
10
32 19
36 2
150
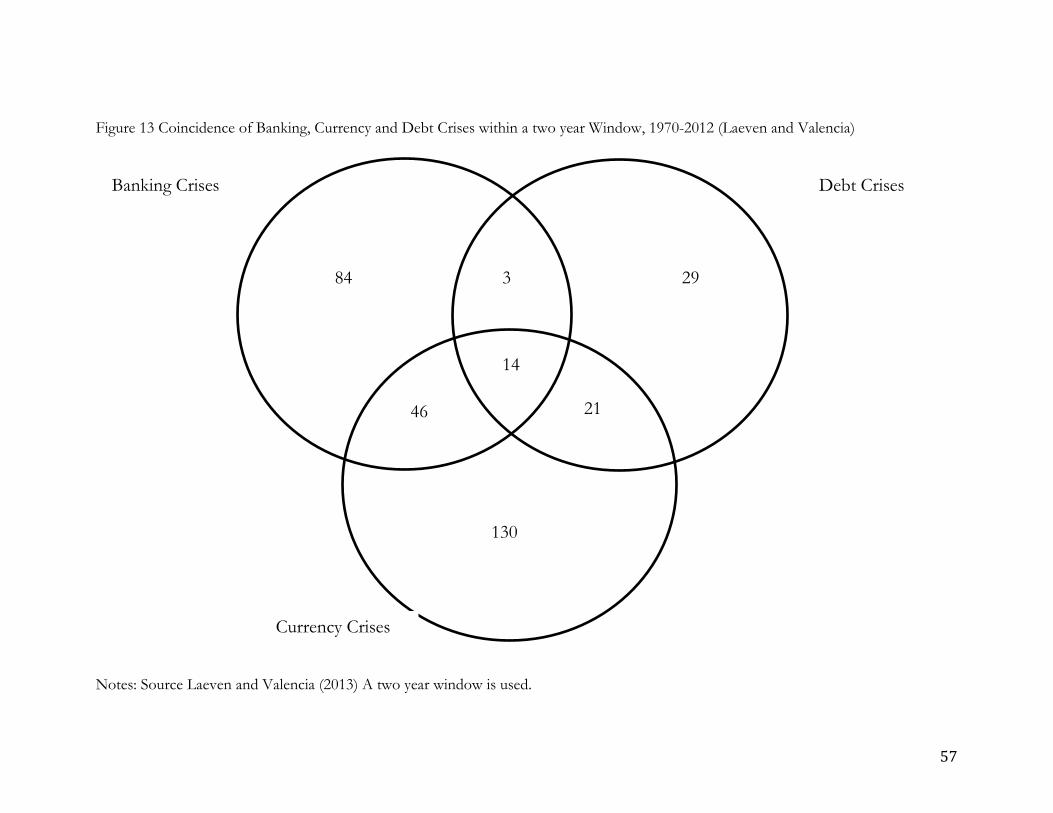
57
Figure 13 Coincidence of Banking, Currency and Debt Crises within a two year Window, 1970-2012 (Laeven and Valencia) Notes: Source Laeven and Valencia (2013) A two year window is used.
Banking Crises Debt Crises
Currency Crises
84
14
46 21
29 3
130

58
Figure 14 Coincidence of Banking, Currency and Debt Crises, 1970-2012 (Reinhart and Rogoff) Notes: Source Reinhart and Rogoff (2009)
Banking Crises Debt Crises
Currency Crises
75
8
31 18
34 7
180

59
Figure 15 Output Losses 1880-1912 Bordo et. al. and Reinhart & Rogoff
0
20
40
60
80
100
120
Banking Crises Twin Crises Triple Crises
Cum
ulat
ive
Dev
iatio
n fr
om T
rend
O
utpu
t, (%
x 1
00)
Bordo et. al Reinhart and Rogoff
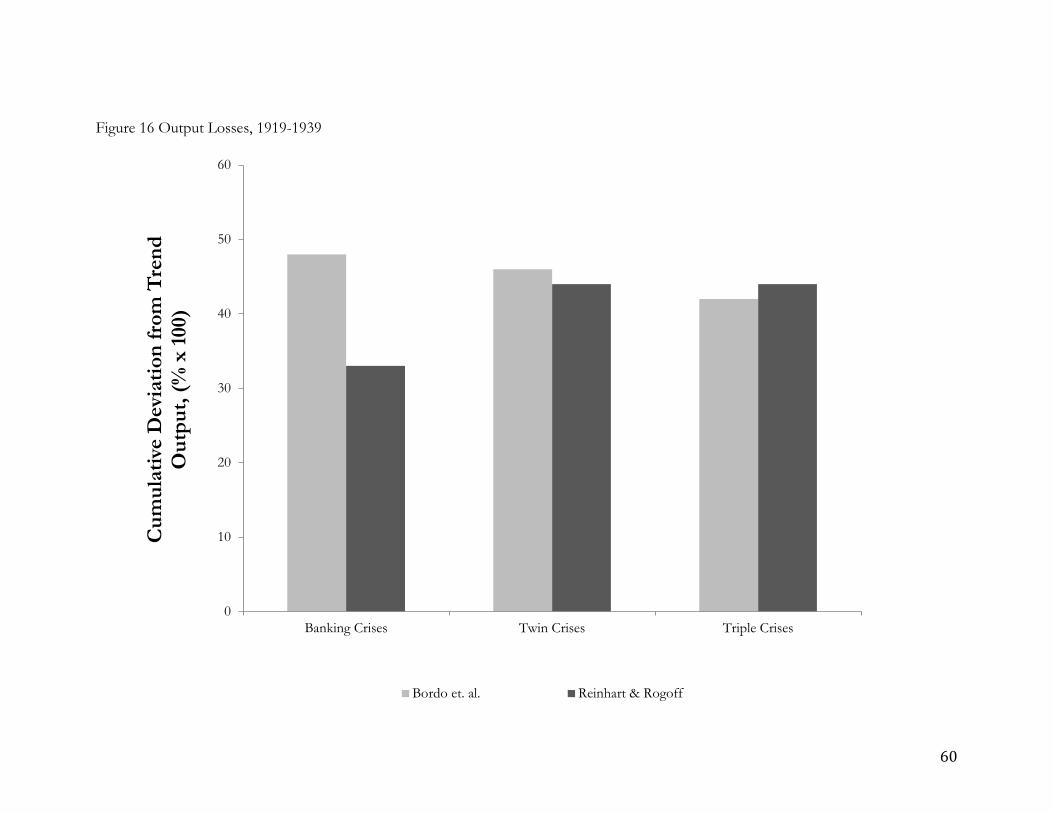
60
Figure 16 Output Losses, 1919-1939
0
10
20
30
40
50
60
Banking Crises Twin Crises Triple Crises
Cum
ulat
ive
Dev
iatio
n fr
om T
rend
O
utpu
t, (%
x 1
00)
Bordo et. al. Reinhart & Rogoff

61
Figure 17 Output Losses, 1973-1997 (Bordo et. al.), 1973-2009 (Reinhart and Rogoff)
0
10
20
30
40
50
60
70
80
90
100
Banking Crises Twin Crises Triple Crises
Cum
ulat
ive
Dev
iatio
n fr
om T
rend
O
utpu
t, (%
x 1
00)
Bordo et. al. Reinhart & Rogoff

62
Figure 18 Output Losses 1973-2011 as reported in Laeven and Valencia (2013)
0
10
20
30
40
50
60
Banking Crises Twin Crises Triple Crises
Cum
ulat
ive
Dev
iatio
n fr
om T
rend
O
utpu
t, (%
x 1
00)
Advanced Countries LDCs/EMs

63
Figure 19 Output Losses, Three data sets, 1973-1997 (21 countries in Bordo et. al.)
54
56
58
60
62
64
66
68
70
72
Bordo et. al Reinhart & Rogoff Laeven & Valencia
Cum
ulat
ive
Dev
iatio
n fr
om T
rend
O
utpu
t, (%
x 1
00)

64
Figure 20 Median Output Losses by Level of Development and year, 1975-2011 (Laeven and Valencia)
0 20 40 60 80 0 20 40 60 80
2009200820072003200220012000199819971996199519941993199219911990198919881987198619851984198319821981198019771976
2009200820072003200220012000199819971996199519941993199219911990198919881987198619851984198319821981198019771976
Year Year
Emerging/LDC Advanced
Median GDP loss in percentage x 100Graphs by advanced

65
Figure 21 Output Losses from Banking Crises for Advanced Countries, 1985-2011 (Laeven and Valencia losses are zero prior to 198)
-50
050
100
Out
put l
oss
in p
erce
nt x
100
1990 1995 2000 2005 2010year
kernel = epan2, degree = 2, bandwidth = 64.86, pwidth = 97.28
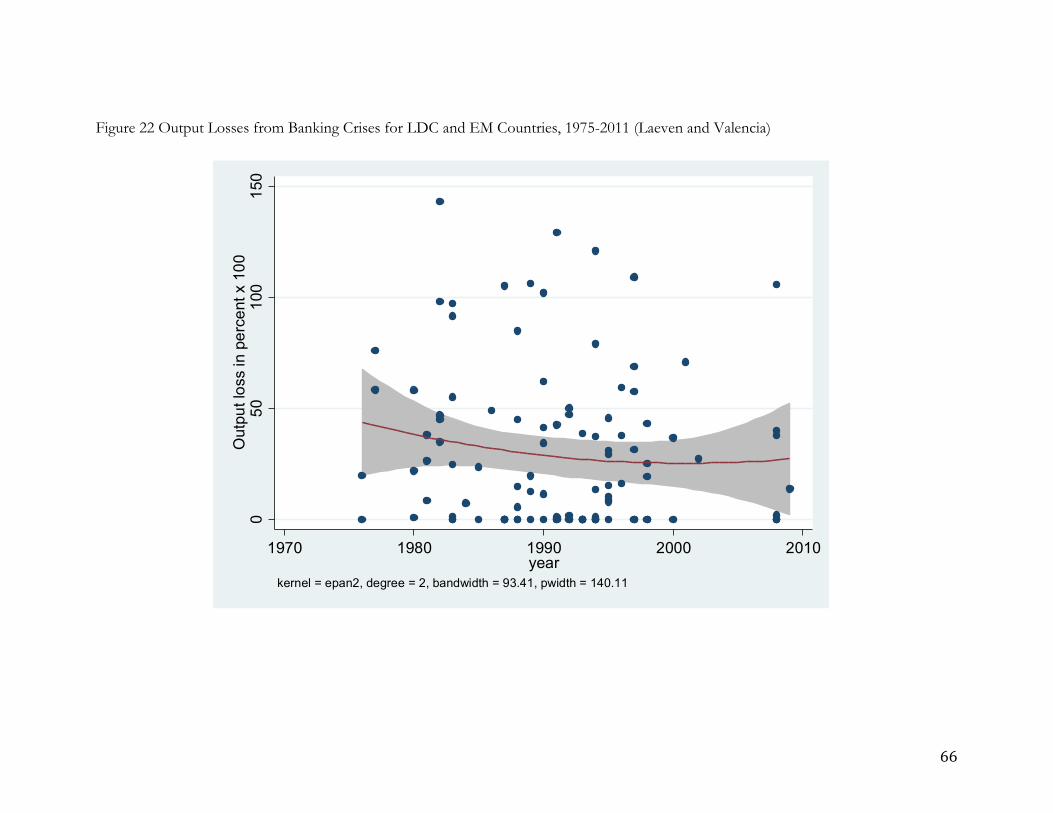
66
Figure 22 Output Losses from Banking Crises for LDC and EM Countries, 1975-2011 (Laeven and Valencia)
050
100
150
Out
put l
oss
in p
erce
nt x
100
1970 1980 1990 2000 2010year
kernel = epan2, degree = 2, bandwidth = 93.41, pwidth = 140.11
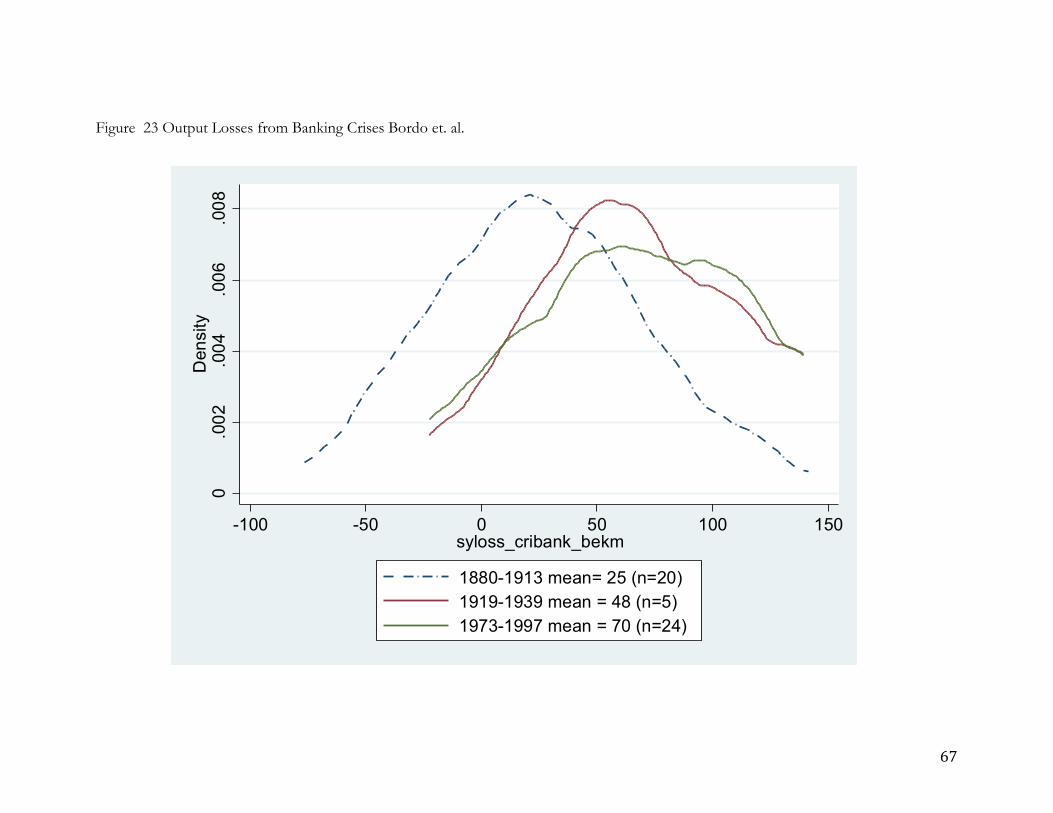
67
Figure 23 Output Losses from Banking Crises Bordo et. al.
0.0
02.0
04.0
06.0
08D
ensi
ty
-100 -50 0 50 100 150syloss_cribank_bekm
1880-1913 mean= 25 (n=20)1919-1939 mean = 48 (n=5)1973-1997 mean = 70 (n=24)
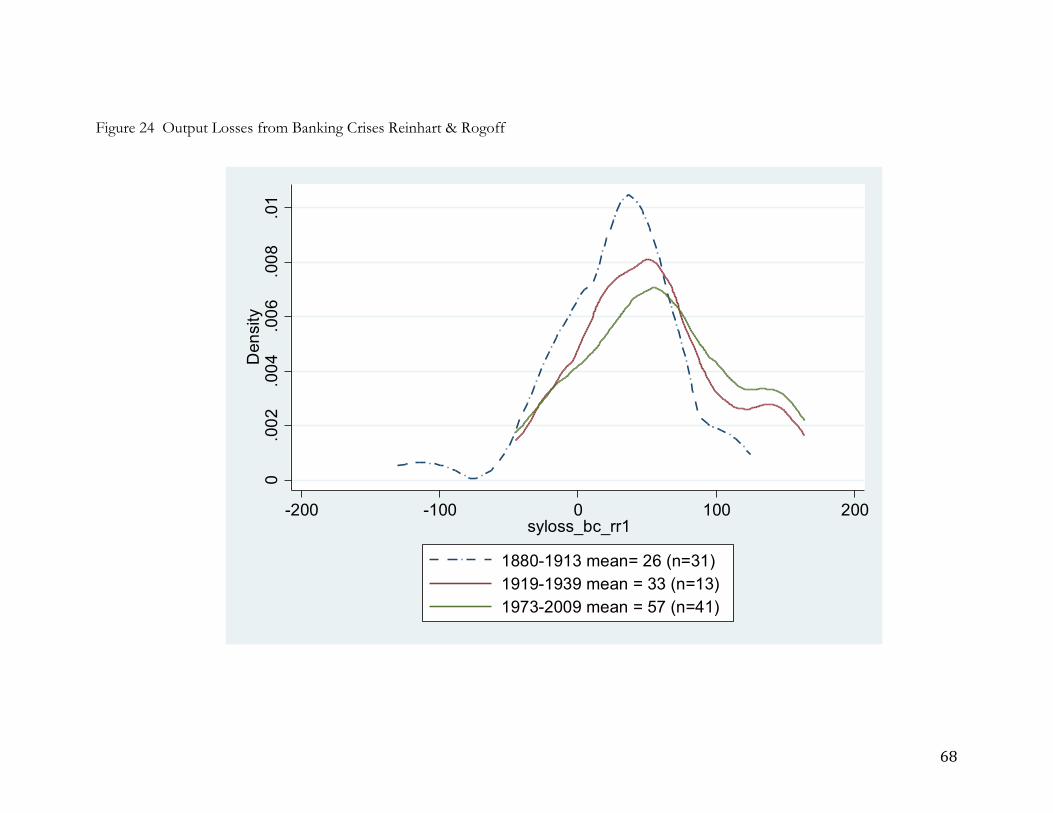
68
Figure 24 Output Losses from Banking Crises Reinhart & Rogoff
0.0
02.0
04.0
06.0
08.0
1D
ensi
ty
-200 -100 0 100 200syloss_bc_rr1
1880-1913 mean= 26 (n=31) 1919-1939 mean = 33 (n=13)1973-2009 mean = 57 (n=41)
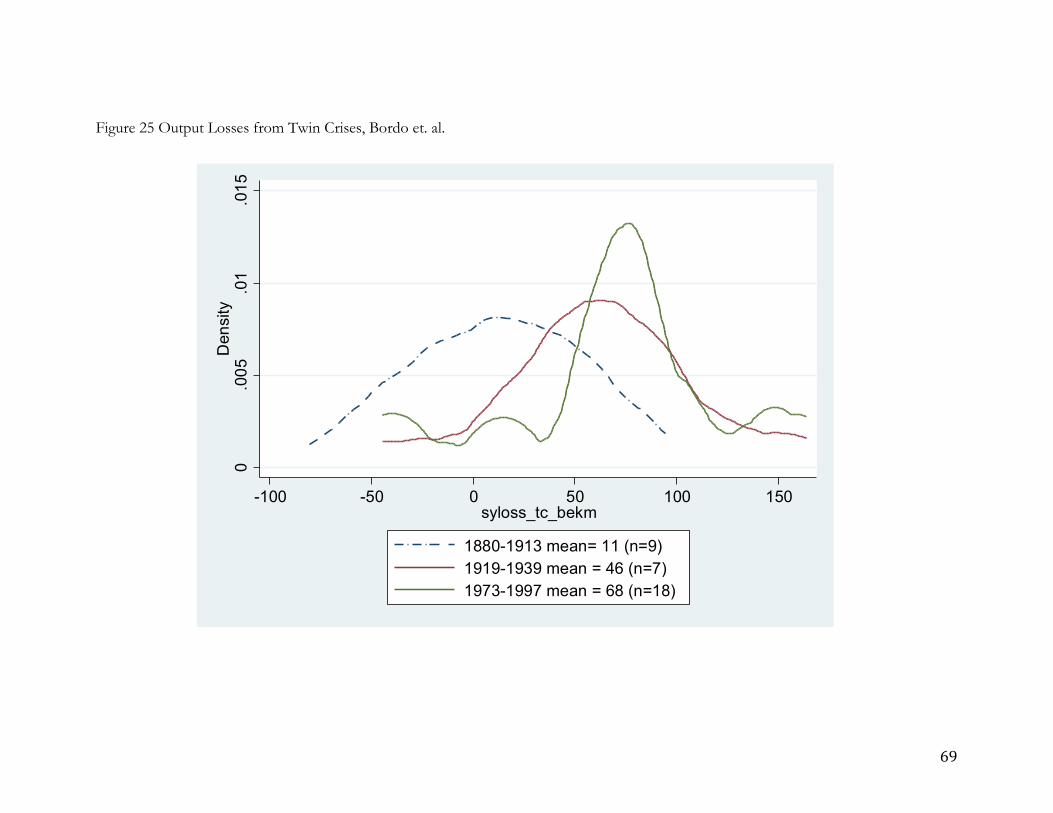
69
Figure 25 Output Losses from Twin Crises, Bordo et. al.
0.0
05.0
1.0
15D
ensi
ty
-100 -50 0 50 100 150syloss_tc_bekm
1880-1913 mean= 11 (n=9)1919-1939 mean = 46 (n=7)1973-1997 mean = 68 (n=18)

70
Figure 26 Output Losses from Twin Crises, Reinhart and Rogoff
0.0
05.0
1.0
15D
ensi
ty
-50 0 50 100 150syloss_tc_rr1
1880-1913 mean= 49 (n=5) 1919-1939 mean = 44 (n=3)1973-2009 mean = 73 (n=15)

71
Figure 27 Output Losses from Triple Crises Bordo et. al.
0.0
02.0
04.0
06.0
08D
ensi
ty
-200 -100 0 100 200 300syloss_tr_bekm
1880-1913 mean= 42 (n=3)1919-1939 mean = 42 (n=2)1973-1997 mean = 68 (n=10)
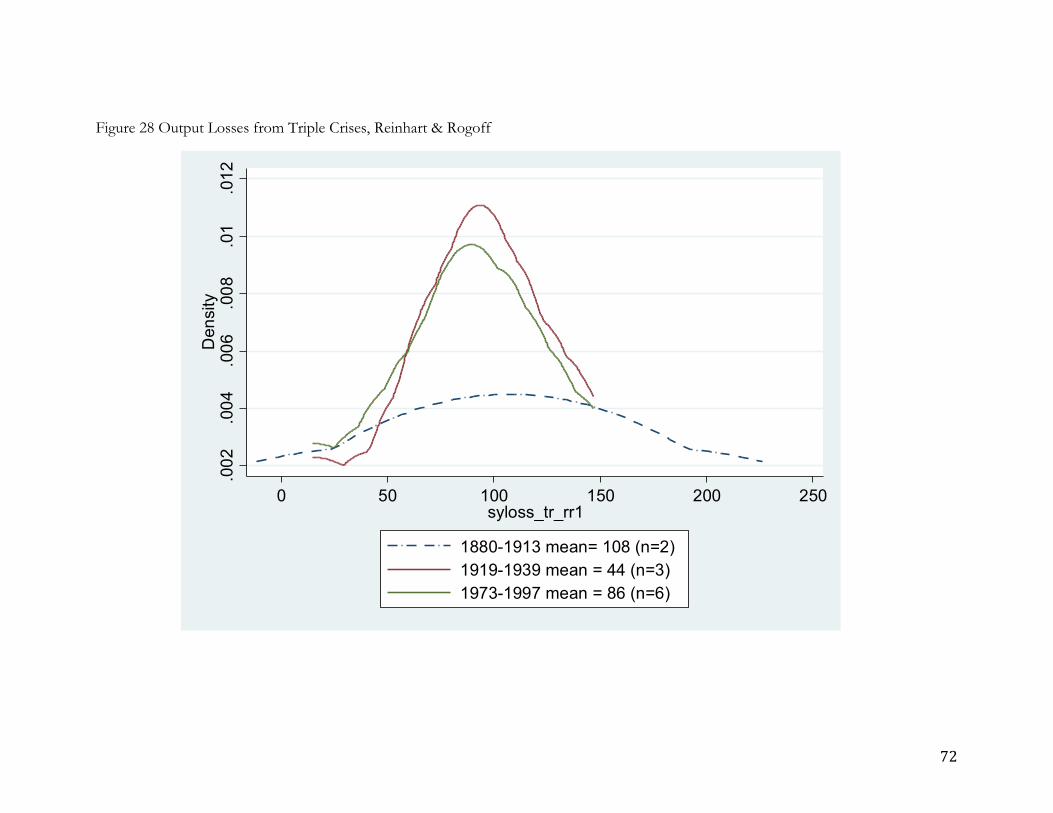
72
Figure 28 Output Losses from Triple Crises, Reinhart & Rogoff
.002
.004
.006
.008
.01
.012
Den
sity
0 50 100 150 200 250syloss_tr_rr1
1880-1913 mean= 108 (n=2)1919-1939 mean = 44 (n=3)1973-1997 mean = 86 (n=6)

73
Figure 29 Output Losses from Banking Crises, Laeven and Valencia
0.0
05.0
1.0
15.0
2D
ensi
ty
0 50 100 150Output Loss Cumulative Deviation from Trend %
LV Banking Crises mean= 28 (n=105)LV Twin Crises mean = 36 (n=16)LV Triple Crises mean = 37 (n=7)

74
Figure 30 Output Losses from Banking Crises, Bordo et. al., Reinhart & Rogoff, Laeven & Valencia, 1973-1997
0.0
02.0
04.0
06.0
08.0
1D
ensi
ty
-50 0 50 100 150Output Loss Cumulative Deviation from Trend %
Bordo et. al. mean= 70 (n=24)RR mean = 60 (n=39)LV mean = 63 (n=15)

75
Figure 31 Output Losses from Banking Crises, 1973-1997 Bordo, et. al.
Chile
Spain
Egypt
Colombia
Singapore
Canada
PhilippinesTaiwan
United States
Iceland
Malaysia
Denmark
Norway
Australia
Sri LankaEgypt
Greece
Japan
Iceland
Brazil
France
Indonesia
Mexico
Taiwan-5
00
5010
015
0O
utpu
t Los
s C
umul
ativ
e D
evia
tion
from
Tre
nd %
1975 1980 1985 1990 1995year
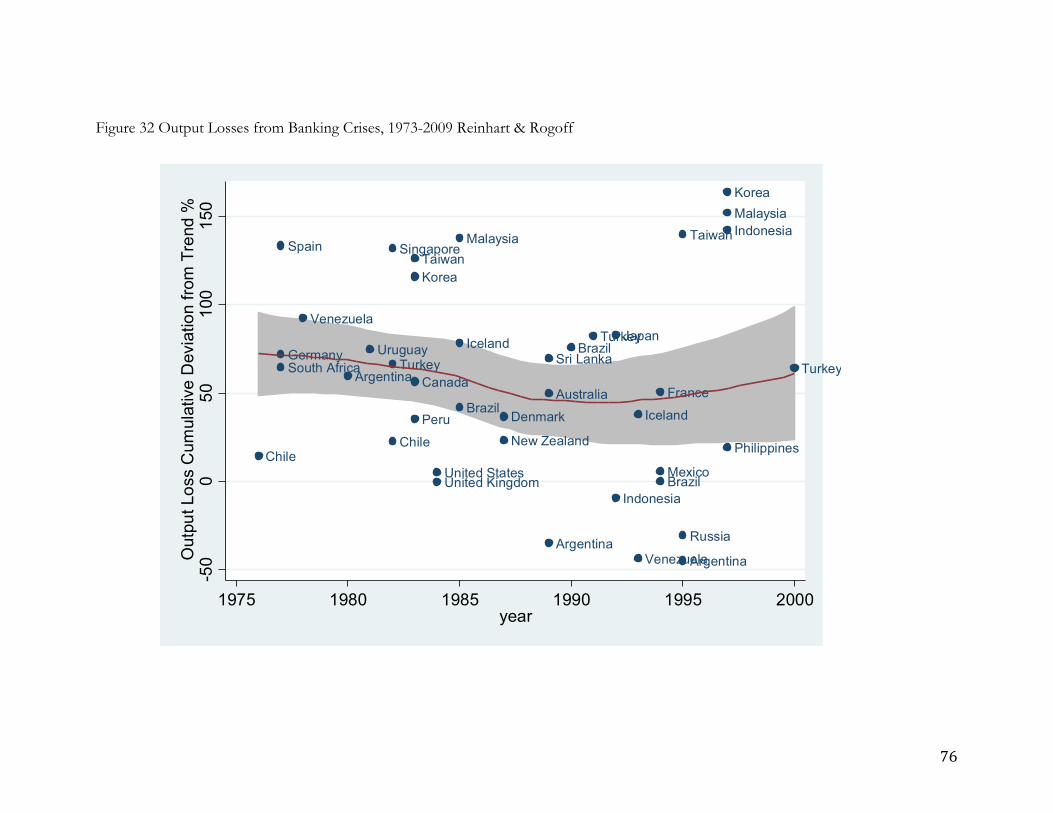
76
Figure 32 Output Losses from Banking Crises, 1973-2009 Reinhart & Rogoff
Chile
GermanySouth Africa
Spain
Venezuela
Argentina
Uruguay
Chile
Singapore
TurkeyCanada
Korea
Peru
Taiwan
United KingdomUnited States
Brazil
Iceland
Malaysia
Denmark
New Zealand
Argentina
Australia
Sri LankaBrazil
Turkey
Indonesia
Japan
Iceland
Venezuela
Brazil
France
Mexico
Argentina
Russia
Taiwan Indonesia
KoreaMalaysia
Philippines
Turkey
-50
050
100
150
Out
put L
oss
Cum
ulat
ive
Dev
iatio
n fro
m T
rend
%
1975 1980 1985 1990 1995 2000year

77
Output 33 Losses from Banking Crises, Laeven and Valencia, 1973-2012
Central African Republic
Chile
Israel
Spain
Egypt
MoroccoMexico
Uruguay
Colombia
Ecuador
Kuwait
Turkey
ChadCongo, Dem. Rep. ofEquatorial Guinea
Niger
Peru
Philippines
Thailand
MauritaniaGuinea
Kenya
Bolivia
Bangladesh
Cameroon
Costa RicaMaliMozambiqueTanzania
Benin
Cote d'Ivoire
MadagascarNepal
Panama
SenegalUnited StatesEl Salvador
Jordan
Sri Lanka
Algeria
Lebanon
Nicaragua
Romania
Sierra Leone
Congo, Dem. Rep. of
Djibouti
HungaryNigeriaNorwayTunisiaChad
Congo, Rep. ofKenya
PolandSao Tome and PrincipeCape VerdeGuineaGuyanaIndiaMacedonia
Togo
Bolivia
Burundi
Costa Rica
Haiti
UgandaArgentinaCameroonCentral African Republic
Guinea-Bissau
Paraguay
Swaziland
Zambia
Zimbabwe
Jamaica
Yemen
Japan
Vietnam
China
Colombia
Slovak RepNicaragua
United KingdomUnited States
AustriaBelgium
Denmark
France
Germany
GreeceHungary
Ireland
Italy
Kazakhstan
Latvia
Luxembourg
Mongolia
Netherlands
Portugal
Russia
SloveniaSpain
Sweden
Switzerland
Nigeria
050
100
150
Out
put L
oss
Cum
ulat
ive
Dev
iatio
n fro
m T
rend
%
1970 1980 1990 2000 2010year

78
Figure 34 GDP per person Actual and Counterfactual, USA, 1907
2.4
2.6
2.8
33.
2ln
(GD
P/P
OP
.)
1902 1904 1906 1908 1910 1912year
Trend of ln(GDP/POP.) ln(GDP/POP.)
USA, Crisis of 1907

79
Figure 35 GDP per person Actual and Counterfactual, Argentina, Baring Crisis
3.2
3.4
3.6
3.8
44.
2ln
(GD
P/P
OP
.)
1885 1890 1895year
Trend of ln(GDP/POP.) ln(GDP/POP.)
Argentina, Baring Crisis, 1890

80
Figure 36 GDP per person Actual and Counterfactual, France, Great Depression
2.8
2.9
33.
13.
2ln
(GD
P/P
OP
.)
1926 1928 1930 1932 1934 1936year
Trend of ln(GDP/POP.) ln(GDP/POP.)
France, Great Depression
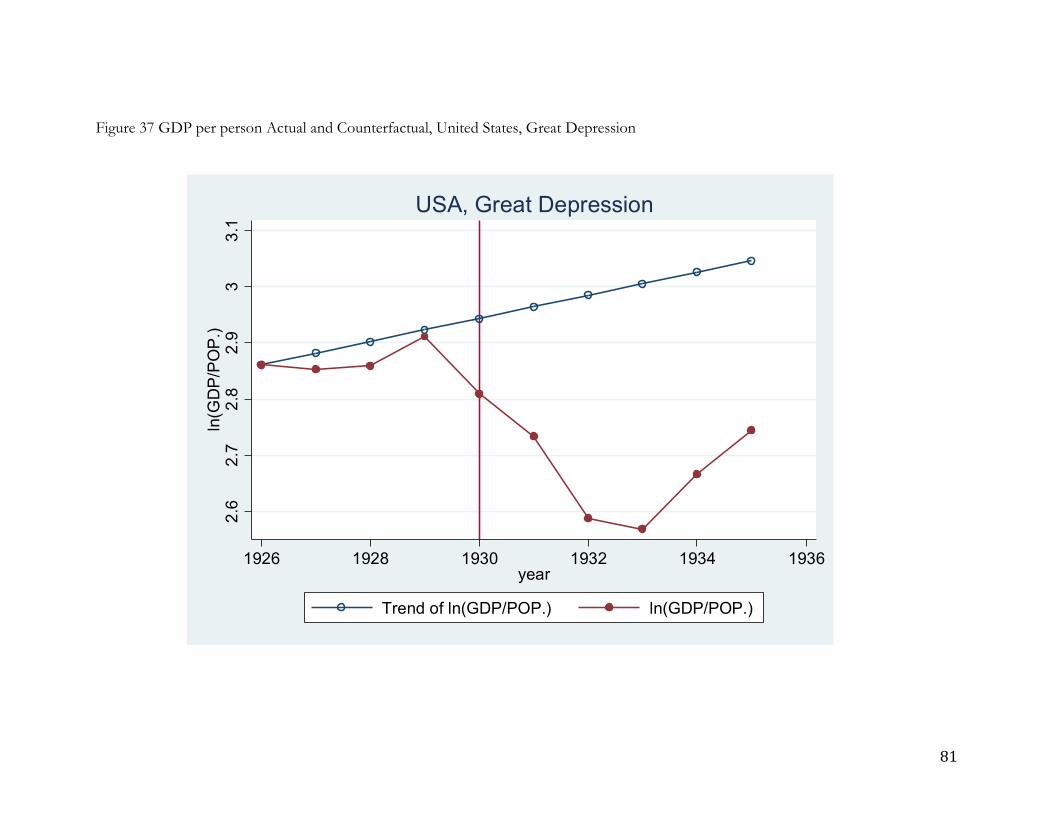
81
Figure 37 GDP per person Actual and Counterfactual, United States, Great Depression
2.6
2.7
2.8
2.9
33.
1ln
(GD
P/P
OP
.)
1926 1928 1930 1932 1934 1936year
Trend of ln(GDP/POP.) ln(GDP/POP.)
USA, Great Depression

82
Figure 38 GDP per person Actual and Counterfactual, Sweden, 1991
4.2
4.3
4.4
4.5
4.6
ln(G
DP
/PO
P.)
1986 1988 1990 1992 1994 1996year
Trend of ln(GDP/POP.) ln(GDP/POP.)
Sweden, 1991

83
Figure 39 GDP per person Actual and Counterfactual, Argentina, 2001
4.2
4.4
4.6
4.8
5ln
(GD
P/P
OP
.)
1996 1998 2000 2002 2004 2006year
Trend of ln(GDP/POP.) ln(GDP/POP.)
Argentina, 1991
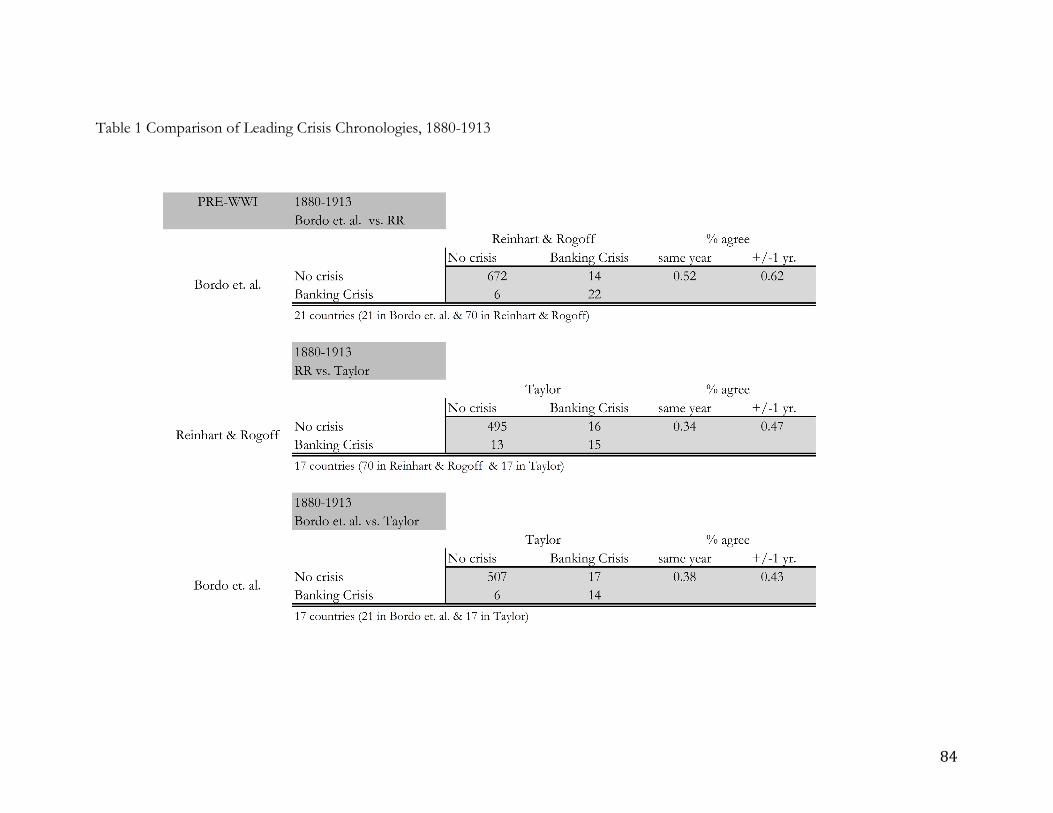
84
Table 1 Comparison of Leading Crisis Chronologies, 1880-1913

85
Table 2 Comparison of Leading Crisis Chronologies, 1919-1939

86
Table 3 Comparison of Leading Crisis Chronologies, 1950-1972
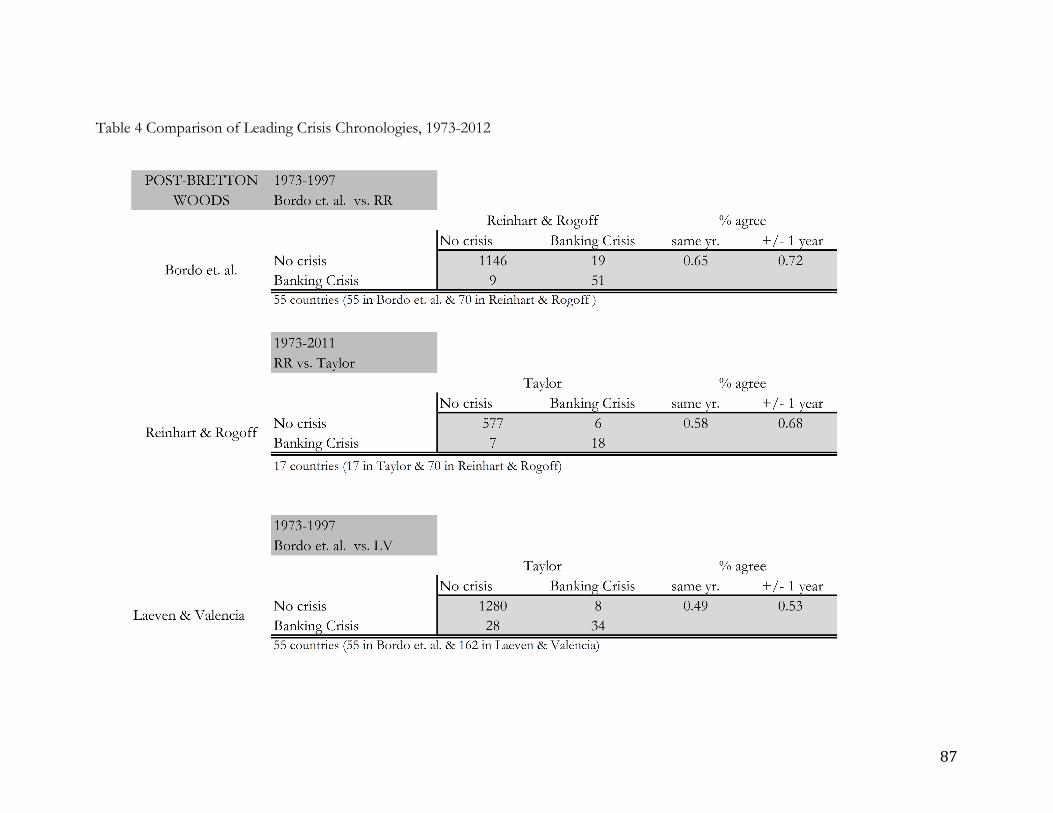
87
Table 4 Comparison of Leading Crisis Chronologies, 1973-2012
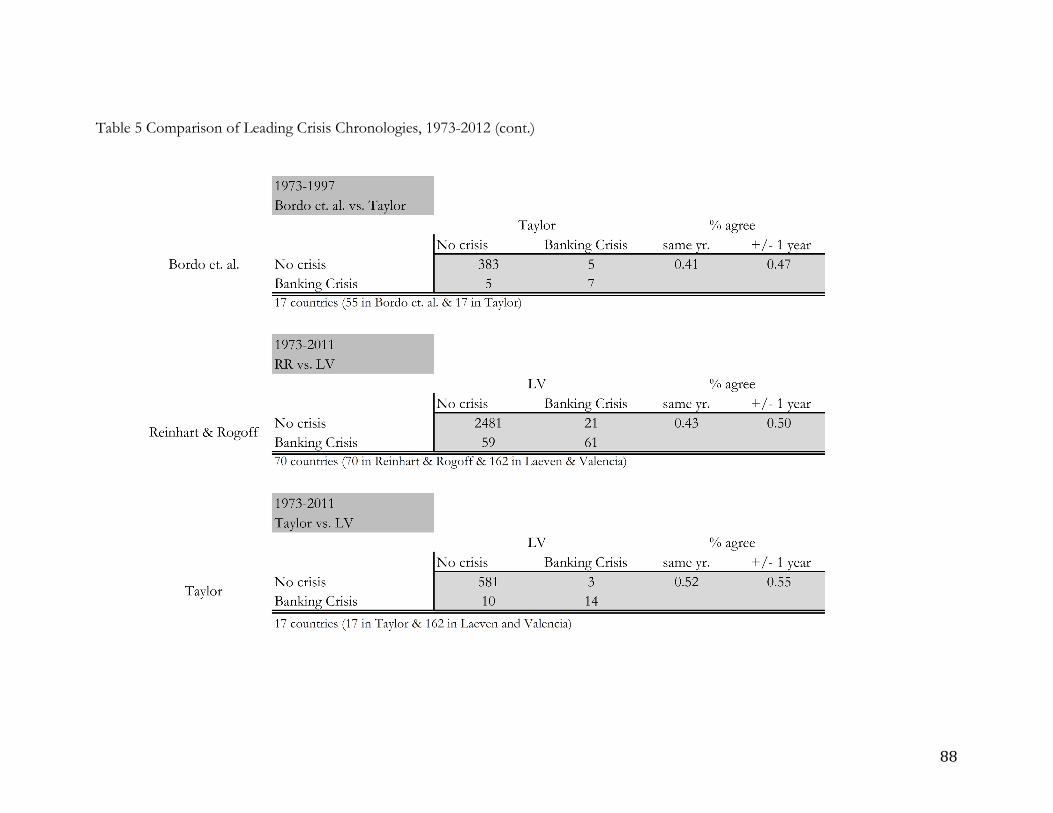
88
Table 5 Comparison of Leading Crisis Chronologies, 1973-2012 (cont.)

89
Table 6 Crisis Definitions 4 Data sets Sample Banking Crisis Definition
Currency Crisis Definition Debt Crisis Definition
Bordo et. al. (2001) 1880-1939 21 Advanced Countries 1945-1997 21 Advanced Countries + 34 LDCs and Emerging Markets
Financial distress resulting in the erosion of most or all of aggregate banking system capital as in Caprio and Klingebiel (1996, 1999)
Forced change in parity, abandonment of a pegged exchange rate, or an international rescue. Or: an exchange market pressure above a critical threshold (calculated as a weighted average of exchange rate change, short-term interest rate change, and reserve change relative to the same for the center country, the UK before 1913 and the US after). A crisis is said to occur when this index exceeds a critical threshold. We score an episode as a currency crisis when it shows up according to either or both of these indicators
No debt crises are dated in this data set.
Reinhart and Rogoff (2009)
1800-2011 70 Countries
A banking crisis occurs when there are one of two types of events: (1) bank runs that lead to the
Reinhart (2010) refers to a working paper version of Reinhart and Rogoff (2011) stating they follow
“External debt crises involve outright default on payment of debt obligations

90
closure, merging, or takeover by the public sector of one or more financial institutions; or (2) if there are no runs, the closure, merging, takeover, or large-scale government assistance of an important financial institution (or group of institutions), that marks the start of a string of similar outcomes for other financial institutions.
Frankel and Rose (1996). Frankel and Rose date a currency crisis as a period with a nominal depreciation of more than 25% which represents a greater than 10% increase in the rate of depreciation. Reinhart’s website provides the following definition: “An annual depreciation versus the US Dollar…of 15 percent or more.
incurred under foreign legal jurisdiction, repudiation, or the restructuring of debt into terms less favorable to the lender than in the original” (Reinhart and Rogoff, 2011)
Laeven and Valencia (2013)
1970-2011 162 countries
Two conditions 1.“Significant signs of financial distress in the banking system (as indicated by significant bank runs, losses in the banking system, and/or bank liquidations) 2.Significant banking policy intervention measures in response to significant losses in the banking system.
Nominal depreciation of the currency against the dollar of at least 30% that is also 10 percentage points higher than the rate of depreciation in the year before.
“default and restructuring” Data from Calomiris and Beim (2001), World Bank (2002), Sturzenegger and Zettlemeyer (2006), IMF staff reports and reports from rating agencies.
Taylor (2015) 1870-2011 17 Countries
Taylor (2015) and Jordà et. al. (2011)describe their coding as following Bordo et. al. Reinhart and
Not dated. Not dated.

91
Rogoff, Laeven and Valencia and Cechetti et. al (2009).
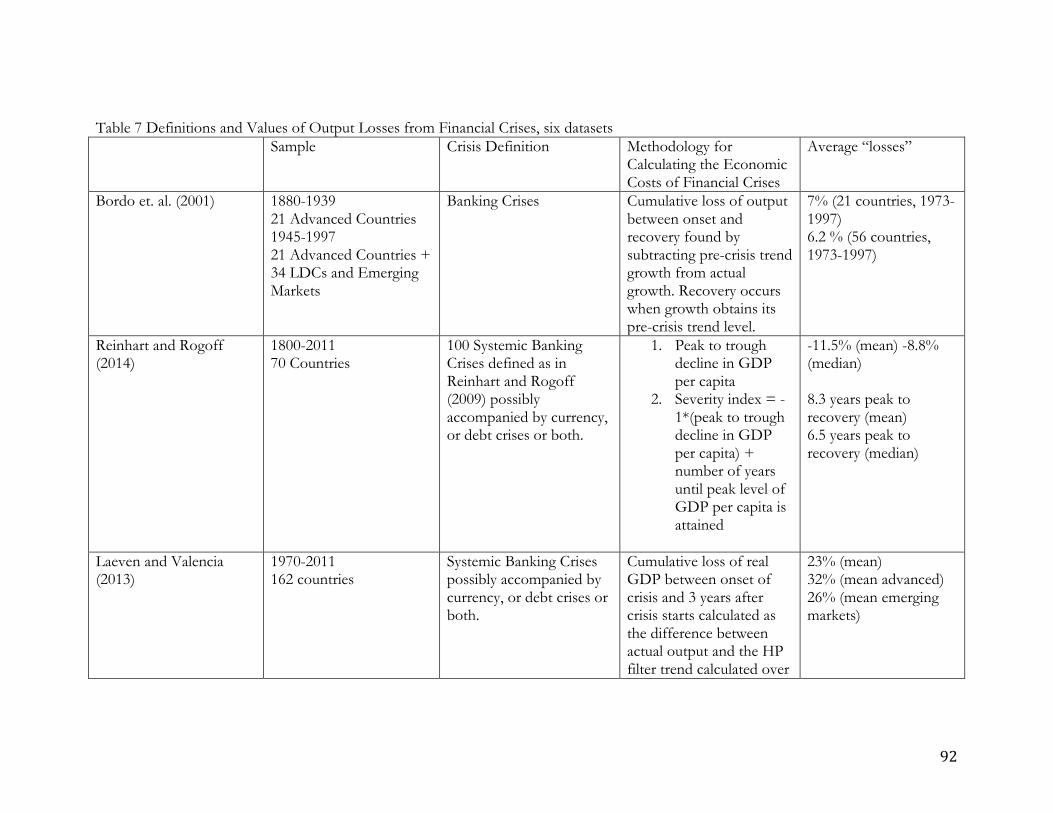
92
Table 7 Definitions and Values of Output Losses from Financial Crises, six datasets Sample Crisis Definition
Methodology for Calculating the Economic Costs of Financial Crises
Average “losses”
Bordo et. al. (2001) 1880-1939 21 Advanced Countries 1945-1997 21 Advanced Countries + 34 LDCs and Emerging Markets
Banking Crises Cumulative loss of output between onset and recovery found by subtracting pre-crisis trend growth from actual growth. Recovery occurs when growth obtains its pre-crisis trend level.
7% (21 countries, 1973-1997) 6.2 % (56 countries, 1973-1997)
Reinhart and Rogoff (2014)
1800-2011 70 Countries
100 Systemic Banking Crises defined as in Reinhart and Rogoff (2009) possibly accompanied by currency, or debt crises or both.
1. Peak to trough decline in GDP per capita
2. Severity index = -1*(peak to trough decline in GDP per capita) + number of years until peak level of GDP per capita is attained
-11.5% (mean) -8.8% (median) 8.3 years peak to recovery (mean) 6.5 years peak to recovery (median)
Laeven and Valencia (2013)
1970-2011 162 countries
Systemic Banking Crises possibly accompanied by currency, or debt crises or both.
Cumulative loss of real GDP between onset of crisis and 3 years after crisis starts calculated as the difference between actual output and the HP filter trend calculated over
23% (mean) 32% (mean advanced) 26% (mean emerging markets)
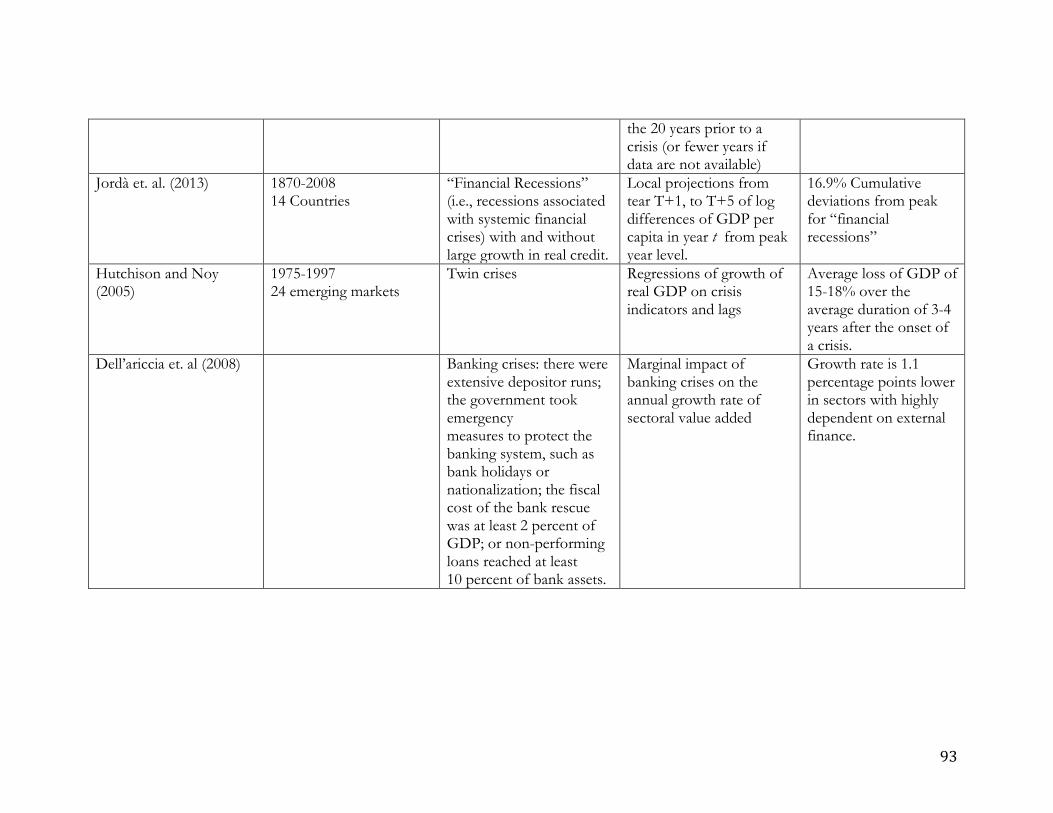
93
the 20 years prior to a crisis (or fewer years if data are not available)
Jordà et. al. (2013) 1870-2008 14 Countries
“Financial Recessions” (i.e., recessions associated with systemic financial crises) with and without large growth in real credit.
Local projections from tear T+1, to T+5 of log differences of GDP per capita in year t from peak year level.
16.9% Cumulative deviations from peak for “financial recessions”
Hutchison and Noy (2005)
1975-1997 24 emerging markets
Twin crises Regressions of growth of real GDP on crisis indicators and lags
Average loss of GDP of 15-18% over the average duration of 3-4 years after the onset of a crisis.
Dell’ariccia et. al (2008) Banking crises: there were extensive depositor runs; the government took emergency measures to protect the banking system, such as bank holidays or nationalization; the fiscal cost of the bank rescue was at least 2 percent of GDP; or non-performing loans reached at least 10 percent of bank assets.
Marginal impact of banking crises on the annual growth rate of sectoral value added
Growth rate is 1.1 percentage points lower in sectors with highly dependent on external finance.

94