Embed Size (px)
Citation preview

FISCAL ACCOUNTABILITY REPORT
FISCAL YEARS 2012 – 2016
A REPORT TO
THE APPROPRIATIONS COMMITTEE AND
THE FINANCE, REVENUE AND BONDING COMMITTEE
PURSUANT TO SECTION 2-36B OF THE CONNECTICUT GENERAL STATUTES
OFFICE OF POLICY AND MANAGEMENT BENJAMIN BARNES, SECRETARY
NOVEMBER 15, 2011


SUMMARY
THIS REPORT INDICATES THE FOLLOWING: • The state’s budgetary picture has stabilized
as compared to the current services projection presented in the 2010 fiscal accountability report. This is due to the structural changes adopted during the 2011 legislative session, including increased revenues, reduced spending, and concessions by the state’s workforce. o A year ago, the state faced current
services shortfalls in excess of $3 billion in each year of the current budget biennium.
o The enacted budget returns the state to structural balance for the foreseeable future, with operating surpluses projected in each year of the biennium.
o Maintaining these structural surpluses over the long term is the key to achieving budgetary balance in accordance with Generally Accepted Accounting Principles, and to addressing the state’s long‐term obligations.
• State government has become leaner and more efficient. The number of state agencies and the size of the state workforce have been reduced.
• The state faces significant long‐term obligations including debt, unfunded pension liabilities and unfunded post‐employment retirement benefits that are estimated to exceed $71 billion in total.
• Significant cost drivers include health and pension costs for active and retired state employees and teachers, and expenditures related to the Medicaid program. Debt service will continue to consume a significant portion of the budget.
• While not a budgeted fund, the state’s Unemployment Insurance Trust Fund is insolvent and has relied on federal loans, which must be repaid, to maintain benefits. Repayment of the principal and interest on these loans will affect employers, who will pay increased assessments.
MAJOR ISSUES AND TRENDS IMPACTING THE STATE’S FISCAL SITUATION • Despite the budget stability that can be
expected in the near term, high fixed costs and the lack of reserves (i.e., a depleted Budget Reserve Fund) leave the state unprepared for the next recession.
• The state has not adopted a comprehensive plan to reduce its significant liabilities and to rebuild reserves, which is a negative factor in the state’s credit rating.
• The economic recovery has been slower and more prolonged than past recoveries and will affect the state’s economy and job picture. o During the most recent recession the
state lost 119,200 jobs and has only regained 23% of those jobs over the past 20 months.
o The state’s unemployment rate is expected to remain elevated due to the slow recovery.
CONNECTICUT MUST MEET THE CHALLENGE Connecticut must continue to get its fiscal house in order.
• The state must continue to look for opportunities to efficiently serve the public, and to support business and industry as they create jobs.
• The state must plan for and undertake a disciplined approach to addressing its unfunded liabilities.
• The state must embark on rebuilding the Rainy Day Fund in order to be prepared for the next recession.
Fiscal Accountablilty Report
i

Estimated
Revised
Enacted(6)
General Fund 2011‐12 2012‐13 2013‐14 2014‐15 2015‐16Revenues(1) 18,777.5$ 19,354.0$ 20,290.9$ 21,275.1$ 22,303.6$ Expenditures 18,710.4$ 19,056.5 20,127.5 21,114.5 21,783.0
Balance 67.1$ 297.5$ 163.4$ 160.6$ 520.6$ Reserve for GAAP (67.1) (4) (50.0) (160.0) (160.0) (160.0) Reduce Indebtedness/Reserves ‐$ (247.5)$ (3.4)$ (0.6)$ (360.6)$
Balance ‐$ ‐$ ‐$ ‐$ ‐$
Special Transportation FundRevenues 1,243.7$ 1,316.1$ 1,351.2$ 1,368.8$ 1,401.6$ Expenditures 1,241.9 1,277.8 1,318.7 1,372.2 1,430.1
Balance 1.8$ 38.3$ 32.5$ (3.4)$ (28.5)$
Other Funds (2)
Revenues 171.5$ 170.1$ 247.4$ 251.8$ 255.7$ Expenditures 171.2 169.6 247.0 251.3 255.3
Balance 0.3$ 0.5$ 0.4$ 0.5$ 0.4$
Total All Appropriated FundsRevenues 20,192.7$ 20,840.2$ 21,889.5$ 22,895.7$ 23,960.9$ Expenditures 20,123.5 20,504.0 21,693.2 22,738.0 23,468.5
Balance 69.2$ 336.2$ 196.3$ 157.7$ 492.4$
Expenditure Cap ResultsTotal All Appropriated Funds 20,140.8$ (5) 20,504.0$ 21,693.2$ 22,738.0$ 23,468.5$ Allowed Appropriations per Cap 20,141.9 20,699.1 21,040.5 21,624.7 22,252.6
Over/(Under) the Cap (1.0)$ (195.1)$ 652.7$ 1,113.3$ 1,215.9$
Revenues and the Expenditure Cap(3)
Revenues ‐ All Funds 21,889.5$ 22,895.7$ 23,960.9$ Allowed Appropriations per Cap 21,040.5 21,624.7 22,252.6
Revenues Less Allowed Approps. 849.0$ 1,271.0$ 1,708.3$
(1) Revenues reflect the October 14, 2011 consensus revenue forecast as revised by PA 11‐1 of the October Special Session. (2)
(3) Article 3, section 18 of the State Constitution requires a balanced budget.(4)
(5) FY 2012 reflects appropriated budget level and does not tie to estimated expenditure levels shown above.(6) FY 2013 reflects enacted budget plus roll‐out of FY 2012 projected deficiencies.
Public Act 11‐48 section 46 requires the Comptroller to reserve any unappropriated surplus not to exceed $75 million in FY 2012 and $50 million in FY 2013, to prevent an increase in the cumulative GAAP deficit. Amounts in FY 2014 through FY 2016 reflect estimated requirement to convert to GAAP accounting, including amount needed to amortize the cumulative GAAP deficit over fifteen years.
INTRODUCTION
FINANCIAL SUMMARY OF FUNDS(in millions)
This report has been prepared in accordance with Section 2‐36b of the Connecticut General Statutes. It contains the estimated revenues for the three fiscal years next ensuing the 2011‐13 biennium and projected expenditures for the same period.
Other funds include the: a) Mashantucket Pequot and Mohegan Fund, b) Soldiers, Sailors and Marines' Fund, c) Regional Market Operating Fund, d) Banking Fund, e) Insurance Fund, f) Consumer Counsel and Public Utility Control Fund, g) Workers' Compensation Fund, h) Criminal Injuries Compensation Fund.
Projected
Fiscal Accountablilty Report
ii
Section 1 Estimate of State Revenues,
Expenditures and Ending Balance


ASSUMPTIONS ASSUMPTIONS USED TO DEVELOP EXPENDITURE ESTIMATES
The Estimated FY 2012 and the Revised Enacted FY 2013 columns show the original appropriation (PA 11‐6, PA 11‐61, and PA 11‐1(JSS)) adjusted to reflect the rollout of recognized FY 2012 deficiencies. The three out years have been developed based on the Revised Enacted FY 2013 level using the inflation factors noted below.
GENERAL ASSUMPTIONS
With notable exceptions, those expenditures not governed by statute were increased by projected standard inflation rates as follows:
FY 2014 2.95% FY 2015 3.07% FY 2016 2.09%
In addition, the following medical inflation rates were used where appropriate:
FY 2014 4.15% FY 2015 4.01% FY 2016 3.87%
Personal Services was inflated by 4.5% each year. Expenditures increased by the standard inflation rates include: Other Expenses, Other Current Expenses, and Grants. Partial year costs are annualized. Equipment costs are not inflated and reflect the FY 2013 enacted budget; agency equipment requirements beyond this level are assumed to be funded from the Capital Equipment Purchase Fund.
NOTABLE EXCEPTIONS
Listed below are significant items within the three out years that were developed using other than the standard inflation guidelines, or that require further explanation. STATE COMPTROLLER ‐ FRINGE BENEFITS • State Employees Retirement System ‐ FY 2012 through FY 2014 based on June 30, 2010 valuation. A revised valuation
reflecting the pension changes from the 2011 SEBAC agreement is due later in calendar year 2011. FY 2015 and FY 2016 assume an average increase of 4.4%.
• Higher Education Alternate Retirement Plan and Employer's Social Security Tax ‐ Reflects decrease to 26 pay periods in FY 2013 from 27 pay periods in FY 2012.
• Judges and Compensation Commissioners' Retirement ‐ FY 2012 through FY 2014 based on June 30, 2010 valuation. FY 2015 and FY 2016 assume an average increase of 5.2%.
• State Employee and Retiree Health Service Costs ‐ Reflects medical inflation. OFFICE OF POLICY AND MANAGEMENT • Adjustment to Pequot Grant ‐ Fiscal years 2014, 2015 and 2016 assume funding at the statutory transfer level of $135
million. DEPARTMENT OF PUBLIC HEALTH • Breast and Cervical Cancer, Medicaid Administration, Children's Health Initiative ‐ Reflects Personal Services inflation
applied to salary component of account. Medical inflation applied to remainder of Breast and Cervical Cancer Detection and Treatment, and standard inflation applied to remainder of Medicaid Administration and Children's Health Initiatives accounts.
• Community Health Services, X‐Ray Screening and TB Care, Immunization Services, Venereal Disease Control ‐ Reflects medical inflation.
• Local & District Departments of Health ‐ Per capita grant reflects 0.5% population growth per year.
Fiscal Accountablilty Report
1

OFFICE OF THE CHIEF MEDICAL EXAMINER • Medicolegal Investigations – Reflects medical inflation rate. DEPARTMENT OF DEVELOPMENTAL SERVICES • Cooperative Placements Program, Employment Opportunities and Day Services, Community Residential Services ‐
Reflects anticipated caseload growth including high school graduates and age outs, Messier‐related placements, Money Follows the Person eligible placements, and court ordered placements.
• Cooperative Placements Program, Voluntary Services, Community Residential Services ‐ Reflects leap year payments for FY 2016.
• Clinical Services, Early Intervention ‐ Reflects medical inflation rate. DEPARTMENT OF MENTAL HEALTH & ADDICTION SERVICES • Personal Services and Other Expenses ‐ Adjustments include inflation on Disproportionate Share amount of
$79,818,546 which is budgeted in the Department of Social Services ‐ DMHAS/Disproportionate Share Account. • TBI Community Services, Discharge and Diversion Services, and General Assistance Managed Care ‐ Reflects anticipated
caseload growth. • General Assistance Managed Care, Professional Services ‐ Reflects leap year payments in FY 2016. • Home and Community Based Waiver ‐ Reflects anticipated current costs and caseload trends. DEPARTMENT OF TRANSPORTATION • Town Aid Road Grants ‐ Reflects level funding at the $30 million level. • Highway & Bridge Renewal Equipment – Reflects level funding. DEPARTMENT OF SOCIAL SERVICES • State‐Funded Supplemental Nutrition Assistance Program, HUSKY Program, Charter Oak Health Plan, Medicaid, Old
Age Assistance, Aid to the Blind, Aid to the Disabled, Temporary Assistance to Families, ConnPACE, Connecticut Home Care Program, Child Care ‐ TANF/CCDBG, State Administered General Assistance ‐ Reflects anticipated cost and caseload changes based on current trends.
• Medicaid, Old Age Assistance, Aid to the Blind, Aid to the Disabled ‐ Reflects leap year payments in FY 2016. • Medicaid, Charter Oak Health Plan ‐ Reflects expansion of Medicaid coverage for low‐income adults with income up to
133% of the federal poverty level beginning January 1, 2014 and reduction in expenditures under the Charter Oak Health Plan.
• Medicaid, Housing/Homeless Services ‐ Reflects transition of additional clients under the Money Follows the Person initiative.
SOLDIERS, SAILORS AND MARINES’ FUND • Award Payments to Veterans ‐ Medical inflation applied to portion of account dedicated to hospital and medical
payments. BUREAU OF REHABILITATIVE SERVICES • Part‐Time Interpreters, Educational Aid for Blind and Handicapped Children ‐ Reflects Personal Services inflation rates. DEPARTMENT OF EDUCATION • Technical High Schools ‐ Reflects Personal Services inflation increases for salary portion of the account. • Transportation of School Children, Adult Education, Health Services for Pupils Private Schools, Excess Cost ‐ Student
Based (Special Education) and Non‐Public School Transportation ‐ Reflect funding grants at the statutory, un‐capped level.
• Charter Schools, OPEN Choice Program and Magnet Schools – Reflect anticipated cost based on estimated enrollment. TEACHERS' RETIREMENT BOARD • Retirement Contributions ‐ FY 2014 and beyond reflect a 4% increase per year. • Retirees Health Service Cost and Municipal Health Insurance Cost ‐ Reflects medical inflation rate.
Fiscal Accountablilty Report
2

DEPARTMENT OF CHILDREN AND FAMILIES • Personal Services – Raise the Age of Juvenile Jurisdiction ‐ Reflects annualized costs in FY 2015 and FY 2016 to reflect
the delayed hire of additional Connecticut Juvenile Training School staff. • Board and Care for Children ‐ Residential, Juvenile Justice Outreach, No Nexus Special Education ‐ Raise the Age of
Juvenile Jurisdiction ‐ Reflects anticipated services required to meet the needs of youth who will be considered juveniles under the recent legislation. The age of juvenile jurisdiction was increased to include 16 year olds as of January 1, 2010; 17 year olds will be considered juveniles as of July 1, 2012.
• Board and Care for Children ‐ Adoption, Foster Care, Residential ‐ Leap Year ‐ Board and Care for Children accounts have been adjusted in FY 2016 for the cost of an additional per diem payment due to leap year.
• Board and Care for Children ‐ Adoption, Foster Care ‐ Caseload Growth ‐ Board and Care accounts reflect anticipated growth in the number of clients served.
• Board and Care for Children ‐ Residential, No Nexus Special Education ‐ Reflects anticipated number of children and youth placed in facility settings; and rate increases determined through the Single Cost Accounting System for residential treatment facilities and no‐nexus special education costs as authorized in statute.
• Supportive Housing for Families ‐ Supportive Housing Rent Supports ‐ Reflects funding to support housing vouchers for new families in the Supportive Housing for Families program and assumes current caseload remains in program.
• Local Systems of Care – Reflects Personal Services inflation on salary component; standard inflation on remainder. PUBLIC DEFENDER SERVICES COMMISSION • Personal Services and Other Expenses ‐ Reflects additional costs related to the transition of the 17‐year‐old population
to juvenile jurisdiction under the Raise the Age initiative.
Fiscal Accountablilty Report
3

SUMMARY OF APPROPRIATED FUND PROJECTIONS(in millions)
RevisedEstimated Enacted Estimated
GENERAL FUND FY 2012 FY 2013 FY 2014 FY 2015 FY 2016
DSS ‐ Medicaid 4,662.1$ 4,855.2$ 5,253.3$ 5,651.0$ 5,939.2$ STATEWIDE ‐ Personal Services 2,366.9 2,266.5 2,372.7 2,483.5 2,598.2 SDE ‐ Education Equalization Grants 1,889.6 1,889.6 1,945.4 2,005.1 2,047.0 OTT ‐ Debt Service 1,697.4 1,678.3 1,719.3 1,776.7 1,656.0 TRB ‐ Retirement Contributions 757.2 787.5 819.0 851.8 885.9 OSC ‐ Employee Retirement Contribution 722.1 715.5 773.7 807.8 843.3 OSC ‐ State Employees Health Serv Cost 602.4 663.8 691.4 719.1 746.9 OSC ‐ Retired Employee Health Serv Cost 565.1 614.1 639.6 665.2 691.0 STATEWIDE ‐ Other Expenses 466.1 465.0 478.9 493.7 504.1 DDS ‐ Community Residential Services 419.6 431.9 455.3 469.3 493.5 DSS ‐ Disproportionate Share‐Med Emer Asst 268.5 268.5 268.5 268.5 268.5 OSC ‐ Employers Social Security Tax 244.9 245.9 253.1 260.9 266.3 SDE ‐ Magnet Schools 215.9 235.4 254.5 263.6 267.7 UOC ‐ Operating Expenses 213.5 210.4 219.9 229.8 240.2 DCF ‐ Board & Care ‐ Residential 189.2 196.9 190.5 200.3 207.8 DDS ‐ Employment Opportunities & Day Svcs 186.6 197.1 205.2 211.5 215.9 MHA ‐ General Assistance Managed Care 182.5 195.8 205.5 215.8 226.6 BOR ‐ Connecticut State University 157.4 153.5 160.4 167.7 175.2 BOR ‐ Regional Community ‐ Technical Colleges 153.8 150.1 156.8 163.9 171.3 SDE ‐ Regional Vocational‐Technical School Sys 149.6 143.7 149.9 156.4 163.0 SDE ‐ Excess Cost ‐ Student Based 139.8 139.8 184.8 196.0 207.9 UHC ‐ Operating Expenses 121.0 109.2 114.1 119.2 124.6 DSS ‐ Temporary Assist to Families ‐ TANF 120.6 122.2 120.0 124.9 129.1 SDE ‐ Priority School Districts 116.6 116.1 119.5 123.2 125.8 DCF ‐ Board and Care for Children ‐ Foster 115.5 120.1 120.6 128.1 134.3 OPM ‐ Loss Taxes Private Tax‐Exempt Property 115.4 115.4 115.4 115.4 115.4 OTT ‐ UConn 2000 ‐ Debt Service 110.3 130.0 144.9 157.4 161.7 DSS ‐ DMHAS – Disproportionate Share 105.9 105.9 105.9 105.9 105.9 DSS ‐ Child Care Services ‐ TANF/CCDBG 97.6 104.3 111.5 117.8 123.5 DOC ‐ Inmate Medical Services 97.0 94.7 98.7 102.6 106.6 DCF ‐ Board and Care for Children ‐ Adoption 87.1 92.9 92.6 97.4 101.7 OTT ‐ Pension Obligation Bonds ‐ TRB 80.9 121.4 145.1 133.9 132.9 MHA ‐ Grants for Mental Health Services 76.4 76.4 79.6 82.8 86.0 OPM ‐ Loss of Taxes on State Property 73.5 73.5 73.5 73.5 73.5 DSS ‐ Connecticut Home Care Program 62.6 65.1 49.6 52.0 54.6 DSS ‐ Aid to the Disabled 61.8 62.0 65.8 70.3 73.2 MHA ‐ Young Adult Services 60.8 64.8 67.7 70.7 73.9 SDE ‐ Charter Schools 57.1 59.8 64.8 67.4 68.9 JUD ‐ Alternative Incarceration Program 56.7 56.6 58.3 60.1 61.4 DSS ‐ Housing/Homeless Services 55.3 59.8 63.3 67.1 70.2 OPM ‐ Reserve for Salary Adjustments 42.6 200.1 206.0 212.3 216.8 DOC ‐ Community Support Services 40.4 40.4 41.6 42.8 43.7 MHA ‐ Managed Service System 38.8 38.7 40.3 42.0 43.6 OSC ‐ Higher Ed Alternative Retirement Sys 38.0 37.7 38.9 40.0 40.9 DSS ‐ HUSKY Program 37.7 42.6 32.1 33.7 35.4 DDS ‐ Early Intervention 36.3 34.7 36.1 37.6 39.0 DSS ‐ Old Age Assistance 35.6 36.1 38.6 40.1 41.5 DDS ‐ Voluntary Services 31.3 31.2 32.1 33.1 34.8 DOC ‐ Workers' Compensation Claims 30.6 29.9 30.8 31.8 32.4 JUD ‐ Juvenile Alternative Incarceration 30.2 30.2 31.1 32.0 32.7 DHE ‐ CT Aid for Public College Students 29.8 29.8 30.7 31.6 30.4 DAS ‐ Workers' Compensation Claims 27.7 27.2 28.0 28.9 29.5 DOL ‐ Workforce Investment Act 27.4 27.4 27.4 27.4 27.4
Fiscal Accountablilty Report
4

SUMMARY OF APPROPRIATED FUND PROJECTIONS(in millions)
RevisedEstimated Enacted Estimated
GENERAL FUND FY 2012 FY 2013 FY 2014 FY 2015 FY 2016TRB ‐ Retirees Health Service Cost 27.4 30.5 31.8 33.0 34.3 OPM ‐ Tax Relief for Elderly Renters 26.2 29.2 30.0 31.0 31.6 SDE ‐ Transportation of School Children 25.8 24.9 84.5 86.8 89.1 MHA ‐ Grants for Substance Abuse Services 25.0 25.0 26.1 27.1 28.2 DCF ‐ Community KidCare 23.6 23.6 24.3 25.0 25.5 DDS ‐ Cooperative Placements Program 21.9 22.6 24.2 24.9 26.2 SDE ‐ Adult Education 21.0 21.0 20.7 20.9 21.0 OPM ‐ Prop Tax Relief Elder‐Circuit Breaker 20.5 20.5 21.1 21.8 22.2 SDE ‐ OPEN Choice Program 19.8 22.1 30.1 32.6 33.9 SDE ‐ Develop of Mastery Exams Grades 4,6&8 19.1 19.1 19.6 20.2 20.6 SDE ‐ Child Care Services 18.4 18.4 19.0 19.5 20.0 DHE ‐ CT Independent College Student Grant 18.1 16.2 16.6 17.1 17.5 DOL ‐ Jobs First Employment Services 17.7 17.7 18.2 18.7 19.1 DCF ‐ Individualized Family Supports 16.4 16.4 17.6 18.2 18.6 DDS ‐ Workers' Compensation Claims 15.5 15.2 15.7 16.2 16.5 OSC ‐ Judges & Comp Commissioner Ret 15.1 16.0 18.0 19.0 20.0 ECD ‐ Statewide Marketing 15.0 15.0 15.4 15.9 16.2 DSS ‐ State Administered General Assistance 14.6 14.7 15.0 15.6 16.2 DCF ‐ Support for Recovering Families 14.5 16.8 19.2 21.8 24.3 MHA ‐ Housing Supports and Services 14.4 15.0 15.6 16.2 16.9 DCF ‐ Gts Psychiatric Clinics for Children 14.1 14.1 14.5 15.0 15.3 DAS ‐ IT Services 13.6 13.4 13.8 14.2 14.5 DDS ‐ Supplemental Payments for Medical Services 13.1 13.4 13.4 13.4 13.4 DAS ‐ Insurance & Risk Operations 13.0 13.0 13.4 13.8 14.1 DCF ‐ Juvenile Justice Outreach Services 12.6 13.4 14.2 15.1 15.4 OSC ‐ Unemployment Compensation 12.5 8.9 9.2 9.4 9.6 DAS ‐ Rents and Moving 12.4 12.7 13.1 13.5 13.8 DSS ‐ Children's Trust Fund 12.3 13.1 13.5 13.9 14.2 MHA ‐ Professional Services 11.8 11.8 12.3 12.8 13.3 PDS ‐ Contracted Attorneys 11.4 10.8 11.1 11.5 11.7 MHA ‐ TBI Community Services 11.2 12.7 14.8 15.4 16.0 SDE ‐ Interdistrict Cooperation 11.1 11.1 11.5 11.8 12.1 MHA ‐ Workers' Compensation Claims 10.8 10.6 11.1 11.5 12.0 DSS ‐ Connecticut Children's Medical Center 10.6 10.6 10.6 10.6 10.6 DPH ‐ School Based Health Clinics 10.4 10.4 10.7 11.1 11.3 MHA ‐ Employment Opportunities 10.4 10.4 10.7 11.1 11.3 DEP ‐ Environmental Quality Fees Fund 10.4 10.2 10.5 10.8 11.0 DCF ‐ Workers' Compensation Claims 10.4 10.3 10.6 11.0 11.2 MHA ‐ Discharge and Diversion Services 10.3 12.6 14.7 15.3 15.9 STATEWIDE ‐ ALL OTHER 537.5 538.2 554.4 577.0 597.4
General Fund ‐ Gross 19,518.6$ 20,022.3$ 21,093.3$ 22,080.3$ 22,748.8$ Unallocated Lapse (92.0) (91.7) (91.7) (91.7) (91.7) Unallocated Lapse ‐ Legislative (2.7) (3.0) (3.0) (3.0) (3.0) Unallocated Lapse ‐ Judicial (3.5) (5.4) (5.4) (5.4) (5.4) General Personal Services Reduction – Legislative (0.5) (0.5) (0.5) (0.5) (0.5) General Personal Services Reduction ‐ Executive (11.5) (11.5) (11.5) (11.5) (11.5) General Other Expenses Reductions ‐ Legislative (0.4) (0.4) (0.4) (0.4) (0.4) General Other Expenses Reductions ‐ Executive (9.1) (9.1) (9.1) (9.1) (9.1) Labor Management Savings Lapse – Legislative (4.6) (6.7) (6.7) (6.7) (6.7) Labor Management Savings Lapse – Executive (625.9) (807.0) (807.0) (807.0) (807.0) Labor Management Savings Lapse – Judicial (27.7) (30.6) (30.6) (30.6) (30.6) Other Allocated Lapses (30.3) ‐ ‐ ‐ ‐
General Fund ‐ Net 18,710.4$ 19,056.5$ 20,127.5$ 21,114.5$ 21,783.0$
Fiscal Accountablilty Report
5

SUMMARY OF APPROPRIATED FUND PROJECTIONS(in millions)
RevisedEstimated Enacted Estimated
GENERAL FUND FY 2012 FY 2013 FY 2014 FY 2015 FY 2016
SPECIAL TRANSPORTATION FUND ‐ Gross 1,315.5$ 1,345.8$ 1,386.6$ 1,440.1$ 1,498.0$ Estimated Unallocated Lapses (11.0) (11.0) (11.0) (11.0) (11.0) Labor Management Savings Lapse (42.5) (56.9) (56.9) (56.9) (56.9) Other Allocated Lapses (20.0) ‐ ‐ ‐ ‐
Special Transportation Fund ‐ Net 1,241.9$ 1,277.8$ 1,318.7$ 1,372.2$ 1,430.1$
BANKING FUND ‐ Gross 26.8$ 26.2$ 27.1$ 28.1$ 29.0$ Judicial Branch Savings Target Lapse (0.3) (0.1) ‐ ‐ ‐
Banking Fund ‐ Net 26.6$ 26.1$ 27.1$ 28.1$ 29.0$
INSURANCE FUND 26.6$ 26.1$ 27.3$ 28.4$ 29.6$
CONSUMER COUNSEL/PUBLIC UTILITY FUND 26.4$ 26.0$ 27.0$ 28.0$ 28.9$
WORKERS' COMPENSATION FUND 22.3$ 22.0$ 22.9$ 23.7$ 24.5$
MASHANTUCKET PEQUOT AND MOHEGAN FUND 61.8$ 61.8$ 135.0$ 135.0$ 135.0$
SOLDIERS, SAILORS AND MARINES FUND 3.1$ 3.1$ 3.2$ 3.3$ 3.4$
REGIONAL MARKET OPERATION FUND 1.0$ 0.9$ 1.0$ 1.0$ 1.0$
CRIMINAL INJURIES COMPENSATION FUND 3.5$ 3.6$ 3.7$ 3.8$ 3.9$
TOTAL ALL FUNDS ‐ NET 20,123.5$ 20,504.0$ 21,693.2$ 22,738.0$ 23,468.5$
Fiscal Accountablilty Report
6

Taxes FY 2012 FY 2013 FY 2014 FY 2015 FY 2016Personal Income Tax 8,456.9$ 8,839.3$ 9,411.0$ 10,030.0$ 10,648.6$ Sales & Use Tax 3,765.5 3,916.0 4,053.0 4,164.4 4,279.0 Corporation Tax 707.7 774.5 723.3 701.5 779.5 Public Service Tax 268.7 275.2 279.3 285.3 287.8 Inheritance & Estate Tax 158.0 162.1 166.9 171.9 177.1 Insurance Companies Tax 228.7 229.8 221.6 225.8 230.2 Cigarettes Tax 443.8 425.9 414.2 402.8 391.8 Real Estate Conveyance Tax 97.8 105.5 112.2 117.1 122.2 Oil Companies Tax 115.5 143.1 149.8 151.3 151.7 Electric Generation Tax 71.0 71.0 ‐ ‐ ‐ Alcoholic Beverages Tax 54.9 58.0 58.4 58.8 59.2 Admissions & Dues Tax 37.8 39.7 40.1 40.5 40.8 Health Provider Tax 525.9 530.7 533.3 535.9 538.6 Miscellaneous Tax 16.3 16.1 16.4 16.6 16.7 Total Taxes 14,948.5$ 15,586.9$ 16,179.5$ 16,901.9$ 17,723.2$ Less Refunds of Tax (816.1) (884.0) (927.7) (974.1) (1,022.3) Less Earned Income Tax Credit (110.2) (116.5) (122.3) (128.4) (134.9) Less R&D Credit Exchange (9.0) (9.5) (10.0) (10.5) (11.0) Total ‐ Taxes Less Refunds 14,013.2$ 14,576.9$ 15,119.5$ 15,788.9$ 16,555.0$
Other RevenueTransfers‐Special Revenue 292.3$ 293.7$ 295.2$ 296.7$ 298.2$ Indian Gaming Payments 354.8 365.5 373.8 381.3 388.9 Licenses, Permits, Fees 274.1 247.8 277.3 251.6 281.1 Sales of Commodities 36.4 37.3 38.7 40.0 42.0 Rents, Fines, Escheats 127.4 121.7 119.2 116.8 114.5 Investment Income 2.0 3.2 4.7 5.7 7.2 Miscellaneous 168.0 168.5 169.3 170.1 171.0 Less Refunds of Payments (50.0) (35.8) (36.0) (36.6) (37.3) Total ‐ Other Revenue 1,205.0$ 1,201.9$ 1,242.2$ 1,225.6$ 1,265.6$
Other SourcesFederal Grants 3,606.0$ 3,716.7$ 4,146.0$ 4,478.4$ 4,692.4$ Transfer From Tobacco Settlement 96.1 93.1 91.0 90.0 98.4 Transfers From (To) Other Funds (142.8) (234.6) (307.8) (307.8) (307.8) Total ‐ Other Sources 3,559.3$ 3,575.2$ 3,929.2$ 4,260.6$ 4,483.0$
Total ‐ General Fund Revenues 18,777.5$ 19,354.0$ 20,290.9$ 21,275.1$ 22,303.6$
Taxes FY 2012 FY 2013 FY 2014 FY 2015 FY 2016Motor Fuels Tax 491.8$ 491.8$ 495.0$ 498.6$ 502.9$ Oil Companies Tax 226.9 199.4 222.7 226.8 231.4 Sales Tax ‐ DMV 74.3 74.7 75.5 77.0 78.5 Total Taxes 793.0$ 765.9$ 793.2$ 802.4$ 812.8$ Less Refunds of Taxes (7.4) (7.5) (7.6) (7.7) (8.3) Total ‐ Taxes Less Refunds 785.6$ 758.4$ 785.6$ 794.7$ 804.5$
Other SourcesMotor Vehicle Receipts 237.5$ 242.4$ 246.0$ 251.3$ 255.0$ Licenses, Permits, Fees 141.9 142.5 143.9 145.2 146.6 Interest Income 9.0 12.0 15.0 17.0 20.0 Federal Grants 13.1 13.1 13.1 13.1 13.1 Transfers From (To) Other Funds 60.1 151.3 151.3 151.3 166.3 Less Refunds of Payments (3.5) (3.6) (3.7) (3.8) (3.9) Total ‐ Other Sources 458.1$ 557.7$ 565.6$ 574.1$ 597.1$
Total ‐ STF Revenues 1,243.7$ 1,316.1$ 1,351.2$ 1,368.8$ 1,401.6$
PROJECTED REVENUESConsensus Revenue Forecast Adjusted for the October Special Session
(In Millions)
General Fund
Special Transportation Fund
Fiscal Accountablilty Report
7

FY 2012 FY 2013 FY 2014 FY 2015 FY 2016Mashantucket Pequot and Mohegan Fund 61.8$ 61.8$ 135.0$ 135.0$ 135.0$
Soldiers, Sailors, and Marines Fund 3.1$ 3.1$ 3.2$ 3.3$ 3.4$
Regional Market Operating Fund 1.0$ 1.0$ 1.0$ 1.1$ 1.1$
Banking Fund 26.6$ 26.2$ 27.2$ 28.2$ 29.0$
Insurance Fund 26.7$ 26.2$ 27.3$ 28.5$ 29.7$
Consumer Counsel & Public Utility Control 26.5$ 26.0$ 27.0$ 28.0$ 29.0$
Workers' Compensation Fund 22.3$ 22.1$ 22.9$ 23.8$ 24.5$
Criminal Injuries Fund 3.5$ 3.7$ 3.8$ 3.9$ 4.0$
All Appropriated Funds Revenues 20,192.7$ 20,840.2$ 21,889.5$ 22,895.7$ 23,960.9$
Personal Income Tax FY 2012 FY 2013 FY 2014 FY 2015 FY 2016 Angel Investor Tax Credit ‐$ (1.5)$ ‐$ ‐$ ‐$ Job Expansion Tax Credit ‐ (5.0) (5.0) (5.0) (5.0)
Total Personal Income Tax ‐$ (6.5)$ (5.0)$ (5.0)$ (5.0)$
Corporation Tax Biennial Business Entity Tax ‐$ ‐$ ‐$ (40.0)$ ‐$ Relocated Film Production Credit ‐ (15.0) (10.0) (10.0) (10.0) Airport Enterprise Zones ‐ (0.1) (0.2) (0.5) (0.5) Manufacturers' Reinvestment Accounts ‐ (0.2) (0.3) (0.6) (0.6) Job Expansion Tax Credit ‐ (10.0) (12.5) (12.5) (5.0)
Total Corporation Tax ‐$ (25.3)$ (23.0)$ (63.6)$ (16.1)$
Insurance Premiums Tax Raise 30% Cap to 55%‐ Film & Infrastructure Credit (8.5)$ (8.5)$ ‐$ ‐$ ‐$
Grand Total (8.5)$ (40.3)$ (28.0)$ (68.6)$ (21.1)$
PROJECTED REVENUES
Impact of the October 2011 Jobs Session on Consensus RevenueGeneral Fund(In Millions)
(In Millions)
Fiscal Accountablilty Report
8
FY 2012 FY 2013 FY 2014 FY 2015 FY 2016
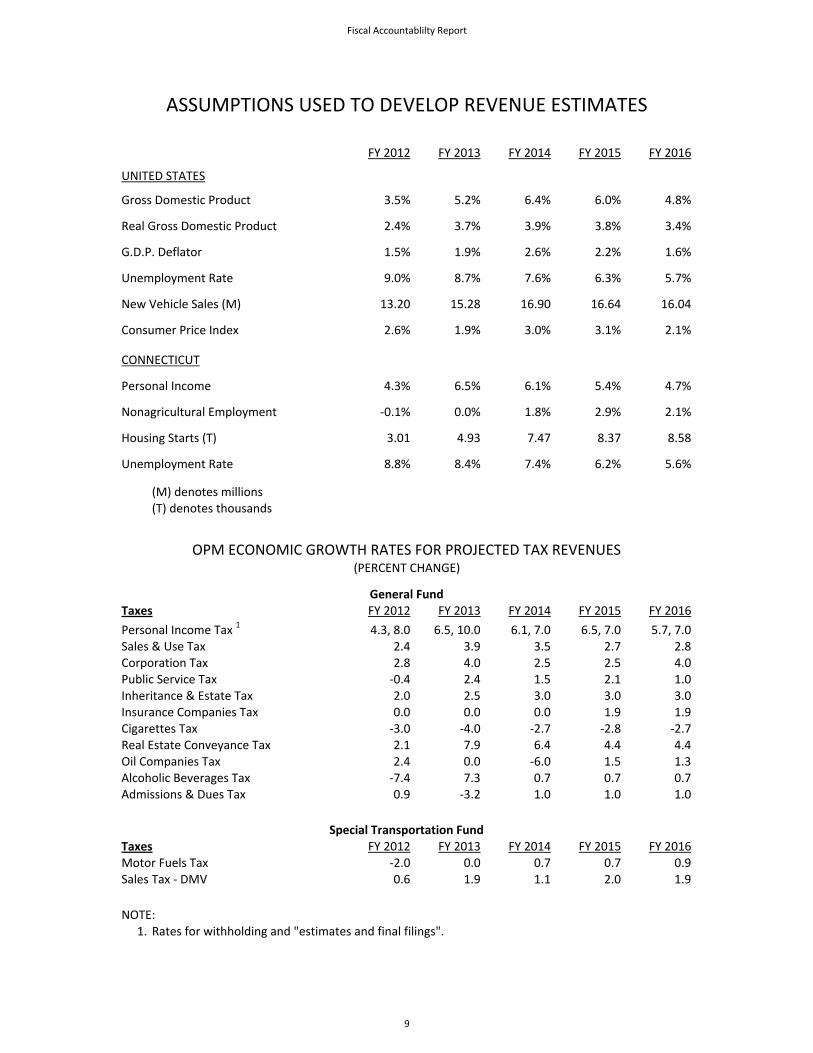
UNITED STATES
Gross Domestic Product 3.5% 5.2% 6.4% 6.0% 4.8%
Real Gross Domestic Product 2.4% 3.7% 3.9% 3.8% 3.4%
G.D.P. Deflator 1.5% 1.9% 2.6% 2.2% 1.6%
Unemployment Rate 9.0% 8.7% 7.6% 6.3% 5.7%
New Vehicle Sales (M) 13.20 15.28 16.90 16.64 16.04
Consumer Price Index 2.6% 1.9% 3.0% 3.1% 2.1%
CONNECTICUT
Personal Income 4.3% 6.5% 6.1% 5.4% 4.7%
Nonagricultural Employment ‐0.1% 0.0% 1.8% 2.9% 2.1%
Housing Starts (T) 3.01 4.93 7.47 8.37 8.58
Unemployment Rate 8.8% 8.4% 7.4% 6.2% 5.6%
(M) denotes millions(T) denotes thousands
General FundTaxes FY 2012 FY 2013 FY 2014 FY 2015 FY 2016
Personal Income Tax 1 4.3, 8.0 6.5, 10.0 6.1, 7.0 6.5, 7.0 5.7, 7.0Sales & Use Tax 2.4 3.9 3.5 2.7 2.8Corporation Tax 2.8 4.0 2.5 2.5 4.0Public Service Tax ‐0.4 2.4 1.5 2.1 1.0Inheritance & Estate Tax 2.0 2.5 3.0 3.0 3.0Insurance Companies Tax 0.0 0.0 0.0 1.9 1.9Cigarettes Tax ‐3.0 ‐4.0 ‐2.7 ‐2.8 ‐2.7Real Estate Conveyance Tax 2.1 7.9 6.4 4.4 4.4Oil Companies Tax 2.4 0.0 ‐6.0 1.5 1.3Alcoholic Beverages Tax ‐7.4 7.3 0.7 0.7 0.7Admissions & Dues Tax 0.9 ‐3.2 1.0 1.0 1.0
Special Transportation FundTaxes FY 2012 FY 2013 FY 2014 FY 2015 FY 2016Motor Fuels Tax ‐2.0 0.0 0.7 0.7 0.9Sales Tax ‐ DMV 0.6 1.9 1.1 2.0 1.9
NOTE:1. Rates for withholding and "estimates and final filings".
ASSUMPTIONS USED TO DEVELOP REVENUE ESTIMATES
OPM ECONOMIC GROWTH RATES FOR PROJECTED TAX REVENUES(PERCENT CHANGE)
Fiscal Accountablilty Report
9


Section 2 Projected Tax Credits


FY 2012 FY 2013 FY 2014 FY 2015 FY 2016
Personal Income Tax CreditsProperty Tax 214,000$ 218,000$ 222,000$ 226,000$ 231,000$ Job Tax Credits ‐ 5,000 5,000 5,000 2,000 Angel Investor 1,000 6,000 3,000 3,000 3,000
Total Personal Income Tax 215,000$ 224,000$ 225,000$ 229,000$ 234,000$
Business Tax CreditsFixed Capital 50,000$ 51,500$ 53,000$ 54,600$ 56,200$ Human Capital 1,500 1,500 1,500 1,500 1,500
Electronic Data Processing(1) 28,000 28,800 29,700 30,600 31,500 Research and Experimental Expenditures 10,000 10,300 10,600 10,900 11,200 Research and Development Expenditures 5,000 5,200 5,400 5,600 5,800
Film Industry Production(1) 40,000 50,000 52,500 55,100 57,900
Film Industry Digital Animation(1) 15,000 15,000 15,000 15,000 15,000
Film Industry Infrastructure(1) ‐ 5,000 5,300 5,600 5,900 Urban and Industrial Reinvestment 15,000 18,000 30,000 30,000 30,000 Job Tax Credits 3,000 15,000 15,000 15,000 8,000
Housing Program Contribution(1) 2,000 2,000 2,000 2,000 2,000 Historic Rehabilitation 1,500 1,500 1,500 1,500 1,500 Machinery and Equipment 1,000 1,000 1,000 1,000 1,000 All Other Credits 5,000 5,000 10,000 10,000 10,000
Total Business Tax Credits 177,000$ 209,800$ 232,500$ 238,400$ 237,500$
Total Projected Amount Claimed 392,000$ 433,800$ 457,500$ 467,400$ 471,500$
(1) Includes credits claimed under the Corporation Tax and the Insurance Premiums Tax
Projected Total Amounts of Tax Credits Claimed(In Thousands)
It should be noted that the basis for projections of tax credits claimed relies upon data from several years ago. This is dueto the fact that information regarding tax credits is typically delayed as firms often request an extension to file their finalreturns. This delays the receipt of such data by the tax department which then must still have the return information datacaptured.
In calculating the expected amount of credits to be claimed, OPM examined the most recent relevant years available(income years ranging from 2005 to 2009 for business credits and income year 2009 for the personal income tax credit).An average value was derived over that time period which then became the base for fiscal year 2011. From fiscal year2012 and forward, the dollar value of credits claimed was grown by appropriate growth rates.
PROJECTED TAX CREDITS
Fiscal Accountablilty Report
10


Section 3 Summary of Estimated Deficiencies


SUMMARY OF ESTIMATED DEFICIENCIES (REASONS FOR DEFICIENCIES AND BASIS OF ASSUMPTIONS)
The following deficiencies are anticipated in the General Fund:
DEPARTMENT OF SOCIAL SERVICES
After accounting for various offsetting lapses, a net shortfall of $30.0 million is forecast in the Medicaid account, largely due to the Medicaid expansion for low‐income adults (LIA). To comply with federal requirements, the previous asset limit of $1,000 was eliminated and greater access to long‐term care, home health and non‐emergency medical transportation benefits became available under LIA. Elimination of the asset test, economic conditions, and inclusion of populations who did not formerly qualify for State Administered General Assistance have created an unanticipated level of caseload growth – from 46,156 in June, 2010, to 73,320 in October, 2011, an increase of 59% over sixteen months. Although caseload growth appears to be slowing, the enacted budget did not assume the current caseload level of 73,320 would be reached until January 2013.
PUBLIC DEFENDERS SERVICES COMMISSION
A $2.0 million shortfall is projected in the Contracted Attorneys account in order to resolve payments for cases handled by contracted child protection attorneys, with a net deficiency of $555,000 anticipated after considering lapses in various accounts. The Commission on Child Protection incurred a significant deficiency last fiscal year due to increased rates paid to child protection attorneys. Given the consolidation of that agency into the Public Defenders Services Commission, the merged agency is left with the carryover of claims for reimbursement from prior periods.
TEACHERS’ RETIREMENT BOARD
This agency is expected to experience a deficiency of $2.4 million in its Retirees Health Service Cost account due to higher than anticipated membership in the plan. The appropriation for this account assumed 17,048 members would be enrolled in the health plan, but enrollment is currently at 18,547 members and is expected to reach 19,000 by the end of the fiscal year.
WATCH AREAS
Several areas of the budget have the potential to significantly impact General Fund balance. First, deficiencies are not currently projected in the accounts within the Office of the State Comptroller that fund health costs for active and retired state employees. However, based on higher than anticipated enrollment in the Health Enhancement Plan and given limited expenditure data available to OPM, a significant shortfall is possible. Second, while a shortfall is not currently projected in the Comptrollers’ account that covers pension contributions to the State Employee Retirement Fund, the impacts of changes negotiated between the State and SEBAC in combination with recent market changes will affect the State’s actuarially required pension contribution. An updated valuation and ARC calculation is underway and is expected to be available in January. Lastly, the federal government has not adopted a budget and continues to operate under a continuing resolution that reduces discretionary funding relative to federal fiscal year 2011. The current process calls for automatic across‐the‐board cuts if the Joint Select Committee (supercommittee) is unable to approve a plan by November 23rd that would reduce the federal deficit by at least $1.2 trillion over the next decade. The impacts of any potential federal funding reductions on programs important to Connecticut, including LIHEAP, are not known.
Fiscal Accountability Report
11


Section 4 Projected Balance of the
Budget Reserve Fund


BUDGET RESERVE FUND ACTIVITYFY 2011 FY 2012 FY 2013 FY 2014 FY 2015 FY 2016(3)
Beginning Balance 103.2$ ‐$ ‐$ ‐$ 662.1$ 1,890.9$
Deposits/(Withdrawals) [see below] (103.2) ‐ ‐ 662.1 1,228.8 1,489.2
Ending Balance ‐$ ‐$ ‐$ 662.1$ 1,890.9$ 3,380.1$ Balance as Percent of Budget 0.6% 0.0% 0.0% 3.3% 9.2% 15.9%
Balance Over/(Under) Target(1) (1,870.8)$ (1,905.7)$ (1,952.2)$ (1,346.0)$ (174.5)$ 1,255.6$
Available Over BRF Target (2) ‐$ ‐$ ‐$ ‐$ ‐$ 1,255.6$
STATUTORY DISPOSITION OF FUTURE SURPLUSESNote: C.G.S. 4‐30a directs any unappropriated surplus to the Budget Reserve Fund, except as provided below:
Legislative FY 2011‐FY 2013 ReferenceAny surplus shall be used to:
1. ERN's‐ Redeem FY 2009 Economic Recovery Notes PA 09‐3‐ JSS2. Budget Reserve Fund C.G.S. 4‐30a
FY 2014‐FY 2017Any surplus shall be used to:
1. GAAP‐ Annual amortization of the deferred charge PA 11‐48, sec. 462. ERN's‐Redeem FY 2009 Economic Recovery Notes PA 09‐3‐ JSS3. Budget Reserve Fund C.G.S. 4‐30a
FY 2018‐FY 2028Any surplus shall be used to:
1. GAAP‐ Annual amortization of the deferred charge PA 11‐48, sec. 462. Budget Reserve Fund C.G.S. 4‐30a
EXPLANATION OF PROJECTED DEPOSITS TO THE BUDGET RESERVE FUNDFY 2011 FY 2012 FY 2013 FY 2014 FY 2015 FY 2016
FY 2013 General Fund Surplus 53.1$ 194.4$ ‐$ Projected General Fund Surplus‐ FY 2014‐ FY 2016 3.4 0.6 360.6 Expenditure Reductions Necessary 605.6 1,033.8 1,128.6 to Remain Below Expenditure Cap
Budget Reserve Fund Deposit 662.1$ 1,228.8$ 1,489.2$
(1) Target Balance is equal to ten percent of the next fiscal year's adjusted general fund appropriations.(2) Available for debt service and/or unfunded liabilities when BRF target of 10% has been reached.(3) FY 2016 Target Balance assumes average expenditure growth rate of previous two years.
Note: Assumes General Fund expenditures will remain within the spending cap in FY 2014 ‐ FY 2016.
BUDGET RESERVE FUNDPROJECTED FUND BALANCE
(in millions)
Fiscal Accountability Report
12


Section 5 Projected Bond Authorizations,
Allocations and Issuances


FY 2012 FY 2013 FY 2014 FY 2015 FY 2016Bond Authorizations General Obligation Bonds 1,422,550,606$ 1,710,140,135$ 1,000,000,000$ 1,000,000,000$ 1,000,000,000$ Special Tax Obligation Bonds 628,649,193 515,239,168 525,000,000 525,000,000 525,000,000 Clean Water Fund Revenue Bonds 233,420,000 238,360,000 150,000,000 150,000,000 150,000,000 Bioscience Collaboration Program 34,162,000 85,113,000 59,728,000 19,669,000 21,425,000 UCONN 21st Century 157,200,000 143,000,000 198,000,000 208,500,000 199,500,000 CSUS 2020 95,000,000 95,000,000 95,000,000 95,000,000 95,000,000
Total Bond Authorizations 2,570,981,799$ 2,786,852,303$ 2,027,728,000$ 1,998,169,000$ 1,990,925,000$ Bond Allocations General Obligation Bonds School Construction Program 400,000,000$ 575,000,000$ 500,000,000$ 500,000,000$ 500,000,000$ Urban Action Grants 75,000,000 60,000,000 60,000,000 60,000,000 60,000,000 Small Town Economic Assistance Program 20,000,000 20,000,000 20,000,000 20,000,000 20,000,000 Housing Trust Fund & Housing Programs 75,000,000 60,000,000 65,000,000 65,000,000 65,000,000 Supportive Housing Program 30,000,000 ‐ ‐ ‐ ‐ Clean Water Grants 92,600,000 94,000,000 60,000,000 60,000,000 60,000,000 Manufacturing Assistance Act 165,000,000 100,000,000 100,000,000 50,000,000 50,000,000 Local Capital Improvement Program 30,000,000 30,000,000 30,000,000 30,000,000 30,000,000 Community College System 73,000,000 60,000,000 37,000,000 74,000,000 125,000,000 Connecticut State University System ‐ CSUS2020 95,000,000 95,000,000 95,000,000 95,000,000 95,000,000 UConn Technology Park Development 18,000,000 154,500,000 ‐ ‐ ‐ Bioscience Collaboration Program 34,162,000 85,113,000 59,728,000 19,669,000 21,425,000 Connecticut Innovations Recapitalization 25,000,000 25,000,000 25,000,000 25,000,000 25,000,000 All other GO projects/programs 250,000,000 100,000,000 100,000,000 150,000,000 100,000,000 UCONN 21st Century 157,200,000 143,000,000 198,000,000 208,500,000 199,500,000
Total General Obligation Bonds 1,539,962,000$ 1,601,613,000$ 1,349,728,000$ 1,357,169,000$ 1,350,925,000$ Special Tax Obligation Bonds 600,000,000 600,000,000 600,000,000 600,000,000 600,000,000 Clean Water Fund Revenue Bonds 233,420,000 238,360,000 150,000,000 150,000,000 150,000,000
Total Bond Allocations 2,373,382,000$ 2,439,973,000$ 2,099,728,000$ 2,107,169,000$ 2,100,925,000$
FY 2012 FY 2013 FY 2014 FY 2015 FY 2016Bond Issuance General Obligation Bonds 1,150,000,000$ 1,250,000,000$ 1,250,000,000$ 1,300,000,000$ 1,300,000,000$ Special Tax Obligation Bonds 550,000,000 575,000,000 600,000,000 600,000,000 600,000,000 Clean Water Revenue Bonds 200,000,000 200,000,000 150,000,000 150,000,000 150,000,000 UCONN 21st Century 138,800,000 157,200,000 143,000,000 198,000,000 208,500,000
Total Bond Issuance 2,038,800,000$ 2,182,200,000$ 2,143,000,000$ 2,248,000,000$ 2,258,500,000$ Debt Service General Fund 1,840,380,839$ 1,935,247,677$ 2,014,696,735$ 2,073,505,815$ 1,956,194,476$ Transportation Fund 458,835,373 492,217,529 502,675,455 525,307,250 556,059,365
Total Debt Service 2,299,216,212$ 2,427,465,206$ 2,517,372,190$ 2,598,813,065$ 2,512,253,841$ Debt Service as a Percentage of Budget GO Debt Service as Percentage of General Fund 9.84% 10.16% 10.01% 9.82% 8.98%Total Debt Service 11.52% 11.94% 11.74% 11.56% 10.82%
Assumptions
Bond Authorizations
Clean Water Program Revenue Bond authorizations based on projected allocations.UCONN 21st Century authorizations in accordance with C.G.S. 10a‐109g as amended.CSUS2020 authorizations in accordance with C.G.S. 10a‐91e as amended.
Bond AllocationsProjected bond allocations do not represent a commitment to fund any of these programs or projects.
Projected General Obligation Bond authorizations assume that authorizations continue at historical average levels.
FIVE YEAR BOND PROJECTIONS
Fiscal Accountablilty Report
13


Section 6 Revenue and Expenditure Trends,
Major Cost Drivers


WATCH LIST FY 2012 AREAS OF CONCERN
GENERAL FUND AND SPECIAL TRANSPORTATION FUND
• SEBAC 2011
o Healthcare savings
o State Employee Retirement System revaluation
• Unallocated Lapse
• Department of Social Services ‐ Medicaid
o Low Income Adult (LIA) caseload growth
o Administrative Service Organization (ASO) conversion
• State share of costs related to Tropical Storm Irene and Storm Alfred
• Federal budget reductions
Fiscal Accountablilty Report
14

5.1%
-2.4%-1.9%
4.9%4.3%
6.5%6.1%
-3.0%
-2.0%
-1.0%
0.0%
1.0%
2.0%
3.0%
4.0%
5.0%
6.0%
7.0%
2008 2009 2010 2011 2012 2013 2014
Perc
enta
ge G
row
th
Fiscal Year
5.9%
4.5%
3.4%3.1%
1.9%
2.7%
3.92%
‐2.0%
‐1.0%
0.0%
1.0%
2.0%
3.0%
4.0%
5.0%
6.0%
7.0%
2010 2011 2012 2013 2014 2015* 2016
Percen
tage
Growth
Fiscal Year
EXPENDITURE CAP
CT PERSONAL INCOME GROWTH CT EXPENDITURE CAP GROWTH RATE
• Although revenues have been the sole limiting factor for the budget over the past few years, that is about
to change.
• Personal Income growth serves as the expenditure cap’s proxy for the economy’s ability to pay for government services.
• Two years of declines in Connecticut personal income will take their toll on upcoming expenditure cap rates.
• The next few years will witness the lowest allowable expenditure cap growth rates since the inception of
the cap.
• So low, in fact, that the secondary measure of inflation is projected to be the limiting factor in 2015. The 5‐year moving average of Personal Income is projected to fall to 2.2% which is below the projected growth in inflation of 2.7%.
* Inflation is the limiting factor
Fiscal Accountablilty Report
15

LONG‐TERM OBLIGATIONS
• The state’s long‐term obligations total $71.6 billion, up 5.6% from last year’s reported amount of $67.8 billion.
• This equates to approximately $20,450 for every man, woman and child in Connecticut, up
$1,050 from last year’s reported amount of $19,400.
• In comparison, total Personal Income Tax collections in FY 2012 will only be $8.7 billion.
LONG‐TERM OBLIGATIONS (In Billions)
LONG‐TERM OBLIGATIONS ARE SIGNIFICANT (In Millions)
Bonded Indebtedness - As of 7/31/11 19.5$ State Employee Pensions - Unfunded 6/30/10 11.7 Teachers' Pension - Unfunded 6/30/10 9.1 State Employee Post Retirement Health and Life - Unfunded 26.6 Teachers' Post Retirement Health and Life - Unfunded 3.0 Cumulative GAAP Deficit (General Fund Unreserved) 6/30/2010 1.7 Total 71.6$
$(26,600)
$(19,500)
$(11,700)
$(9,100)
$(3,000)$(1,700)
$0.0
$(30,000)
$(25,000)
$(20,000)
$(15,000)
$(10,000)
$(5,000)
$-
Budget Reserve
Fund
Teachers'Pension
Teachers'OPEB
StateEmployees'
Pension
BondedIndebtedness
StateEmployees'
OPEB
Budget Reserve
GAAPDeficit
Teachers'Pension
StateEmployees'
Pension
BondedIndebtedness
StateEmployees'
OPEB
Fiscal Accountablilty Report
16
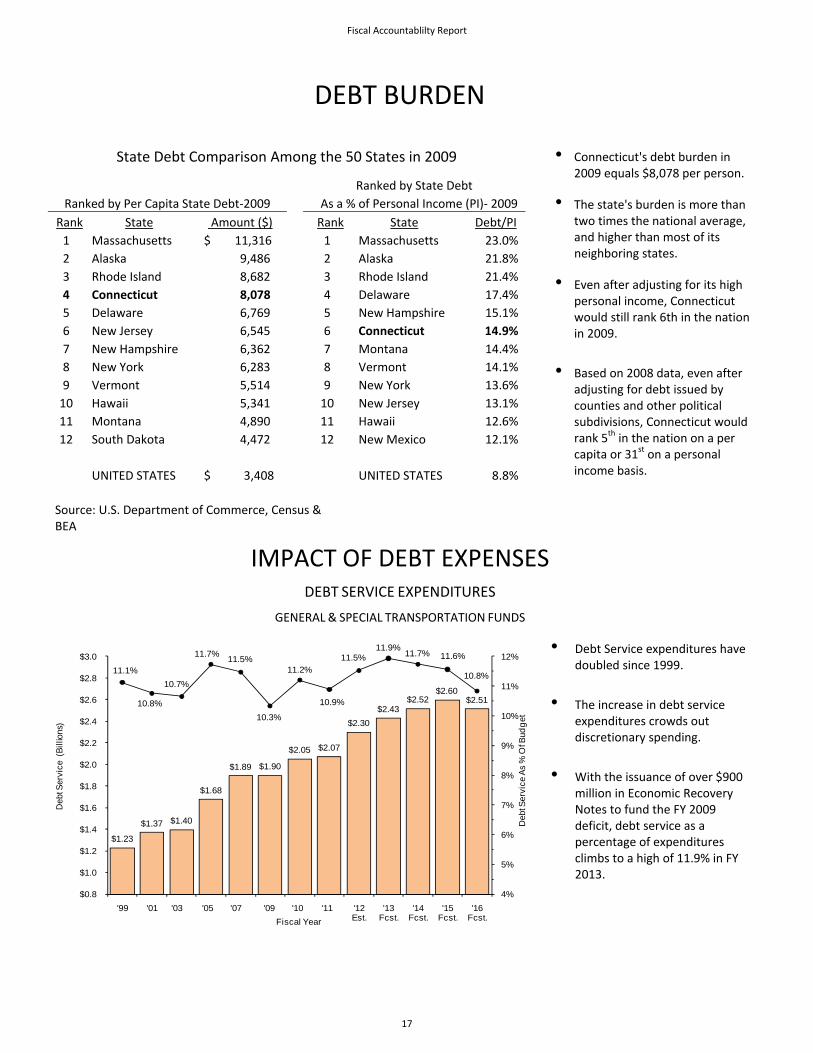
DEBT BURDEN
State Debt Comparison Among the 50 States in 2009
Ranked by State Debt Ranked by Per Capita State Debt‐2009 As a % of Personal Income (PI)‐ 2009
Rank State Amount ($) Rank State Debt/PI 1 Massachusetts $ 11,316 1 Massachusetts 23.0% 2 Alaska 9,486 2 Alaska 21.8% 3 Rhode Island 8,682 3 Rhode Island 21.4% 4 Connecticut 8,078 4 Delaware 17.4% 5 Delaware 6,769 5 New Hampshire 15.1% 6 New Jersey 6,545 6 Connecticut 14.9% 7 New Hampshire 6,362 7 Montana 14.4% 8 New York 6,283 8 Vermont 14.1% 9 Vermont 5,514 9 New York 13.6% 10 Hawaii 5,341 10 New Jersey 13.1% 11 Montana 4,890 11 Hawaii 12.6% 12 South Dakota 4,472 12 New Mexico 12.1%
UNITED STATES $ 3,408 UNITED STATES 8.8%
Source: U.S. Department of Commerce, Census & BEA
• Connecticut's debt burden in 2009 equals $8,078 per person.
• The state's burden is more than two times the national average, and higher than most of its neighboring states.
• Even after adjusting for its high personal income, Connecticut would still rank 6th in the nation in 2009.
• Based on 2008 data, even after adjusting for debt issued by counties and other political subdivisions, Connecticut would rank 5th in the nation on a per capita or 31st on a personal income basis.
IMPACT OF DEBT EXPENSES DEBT SERVICE EXPENDITURES
GENERAL & SPECIAL TRANSPORTATION FUNDS
$1.23
$1.37 $1.40
$1.68
$1.89 $1.90
$2.05 $2.07
$2.30 $2.43
$2.52 $2.60
$2.51
11.1%
10.8%
10.7%
11.7% 11.5%
10.3%
11.2%
10.9%
11.5%11.9%
11.7% 11.6%
10.8%
4%
5%
6%
7%
8%
9%
10%
11%
12%
$0.8
$1.0
$1.2
$1.4
$1.6
$1.8
$2.0
$2.2
$2.4
$2.6
$2.8
$3.0
'99 '01 '03 '05 '07 '09 '10 '11 '12 Est.
'13 Fcst.
'14 Fcst.
'15 Fcst.
'16 Fcst.
Deb
t Ser
vice
As
% O
f Bud
get
Deb
t Ser
vice
(Bi
llion
s)
Fiscal Year
• Debt Service expenditures have doubled since 1999.
• The increase in debt service expenditures crowds out discretionary spending.
• With the issuance of over $900 million in Economic Recovery Notes to fund the FY 2009 deficit, debt service as a percentage of expenditures climbs to a high of 11.9% in FY 2013.
Fiscal Accountablilty Report
17

CONNECTICUT’S BOND RATING CURRENT GENERAL OBLIGATION BOND RATING
Moody’s Standard & Poor’s Fitch
Rating Aa2 AA AA
Outlook Negative Stable Stable
• Prior to 1975, Connecticut’s General Obligation (GO) bonds had the highest rating possible: Aaa by Moody’s and AAA by Standard & Poor’s (S&P).
• The most recent revision in Connecticut’s bond rating was an outlook change to negative by Moody’s in June 2011.
NUMBER OF STATES RATED BY
Rating Moody's S&P Fitch
Better than CT 25 19 27
Equal to CT 10 15 5
Lower than CT 3 4 4
Total* 38 38 36 * 39 states issue GO bonds. All 39 states are rated by Moody’s and Standard and Poor’s; Fitch does not rate Arkansas and New Mexico.
CONNECTICUT’S CREDIT RATING State Credit Strengths
• Historical application of operating surpluses to the Budget Reserve Fund. • Early repayment of the Economic Recovery Notes issued to cover operating deficits. • Wealthiest state in the nation with per capita income well above national levels.
State Credit Challenges
• Vulnerability to financial market fluctuations due to effect on capital gains for high wealth residents and employment in the financial services sector .
• Deterioration of already weak GAAP‐basis balance sheet due to negative unreserved/under‐designated general fund balance and depletion of Budget Reserve Fund.
• Debt ratios are among the highest in the nation. • Pension systems have low funding ratios.
What could make the state rating improve
• Achievement and maintenance of high GAAP‐basis combined available reserve levels. • Established trend of structural budget balance. • Evidence of a stronger economic performance. • Reduced debt ratios. • Significantly improving the funding of pension and post‐retirement liabilities.
What could make the state rating deteriorate
• Lack of improvement in available reserve levels. • Failure to identify a plan that improves the state pension funded ratios and lowers its overall fixed costs. • Reversion to significant one‐time budget solutions including the use of deficit financings to resolve budget gaps. • Reduction in cash flow; reduced liquidity.
Fiscal Accountablilty Report
18

Bargaining UnitFull Time Employees
Full Time Payroll (All Funds)
Contract Expires End of FY 20121. Correctional Supervisors (NP‐8) 460 35,774,941$ 2. State Police (NP‐1) 1,040 75,527,143$
Contract Expires End of FY 20133. Supervising Judicial Marshals 60 3,822,981$
Contract Expires End of FY 20164. Service/Maintenance (NP‐2) 3,745 181,019,198$ 5. Administrative Clerical (NP‐3) 3,801 193,659,775
6. Correctional Officers (NP‐4) 4,608 245,995,444 7. Protective Services (NP‐5) 807 48,260,017 8. Health Care Paraprofessional (NP‐6) 3,338 176,802,890 9. Health Care Professionals (P‐1) 2,782 220,118,593 10. Social and Human Services (P‐2) 3,613 246,042,531 11. Education ‐ Administrators (P‐3A) 244 23,284,174 12. Education ‐ Educators (P‐3B) 679 191,577,681 13. Engineering, Scientific and Technical (P‐4) 2,378 191,577,681 14. Administrative and Residual (P‐5) 2,820 220,691,285 15. Vocational Technical Faculty 1,098 81,632,578 16. Vocational Technical Administration 49 5,720,692 17. Technical College Faculty 187 12,447,167 18. Connecticut State University Faculty (AAUP) 1,849 113,674,757 19. Connecticut State University Administrative Faculty 691 50,778,860 20. Community College Faculty 624 44,483,173 21. University of Connecticut Faculty (AAUP) 1,497 145,395,511 22. University of Connecticut Professionals (UCPEA) 1,526 98,905,985 23. Judicial Professional Employees 1,290 98,776,889 24. Judicial Non‐Professional Employees 1,386 72,415,046 25. UConn Health Center Faculty 508 83,678,776 26. UConn Health Center Non‐Faculty Professionals 2,323 150,480,827 27. Criminal Justice Prosecutors 242 26,369,748 28. Technical College Administrators 78 5,532,245 29. Criminal Justice Employees 120 6,377,322 30. Department of Higher Education Professionals 34 2,473,386 31. Charter Oak State College Professionals 61 4,040,226 32. Judicial Marshals 727 32,065,706 33. Criminal Justice Inspectors 76 6,567,169
Total 6/30/2016 43,181 2,980,845,332$
Total ‐ All Contracts 44,741 3,095,970,397$
Not Covered by Collective Bargaining1. Auditors of Public Accounts 112 9,916,184$ 2. Other Employees 5,136 508,264,574
Total Not Covered by Collective Bargaining 5,248 518,180,758$
Full‐Time WorkforceAs of October 31, 2011
Note: Payroll numbers include all wages for full time employees excluding overtime.
Fiscal Accountablilty Report
19

SEBAC 2011 Provisions
FY 2012 FY 2013
1. Cap salary that can be considered as part of an individual’s pension benefit as provided under the Internal Revenue Code. $ 2,400,000 $ 2,500,000
2. Pension savings due to 2 year wage freeze. 69,316,000 71,198,000 3. Change the minimum COLA for individuals who retire after 9/2/11 from 2.5%
to 2.0% with the highest amount going from 6.0% to 7.5%. 32,525,000 34,315,000
4. Change the Early Retirement reduction factor from 3% to 6% for each year before eligible to take Normal Retirement. Includes associated health care savings.
35,000,000 32,400,000
5. Increase the Employee Contribution to 3% for Retiree health care trust fund for all employees (not just new employees) phased in beginning 7/1/13. ‐ ‐
6. For current employees who retire after 7/1/2022, Normal Retirement eligibility increase from Age 60 and 25 YOS or Age 62 and 10 YOS to Age 63 and 25 YOS or Age 65 and 10 YOS. By 7/1/13, present employees may elect to pay the actuarial pension costs of maintaining the normal retirement eligibility that exists in the present plan which is scheduled to change effective July 1, 2022.
22,000,000 22,000,000
7. New Tier III for individuals hired after 7/1/11, Normal Retirement eligibility Age 63 and 25 YOS or Age 65 and 10 YOS and salary based on Final five year average; HD 20 Years of HD service and age 50 or 25 Years of HD Service regardless of age and salary based on final five year average pay; Early Retirement Age 60 and 15 YOS; Ten year cliff vesting.
‐ 9,649,000
8. Increase number of retirees due to absence of ERIP; reduce refills. 65,000,000 65,000,000 9. Provide the availability of individuals in the Alternate Retirement Plan to
switch to a Hybrid‐Defined benefit/Defined contribution type plan. 10,750,000 11,190,000
10. Value Based Health and Dental Care Plan under which individuals and their families could chose to participate and agree to follow all plan and physician recommended physicals, disease management protocols and diagnostic testing. This plan is available for active employees and individuals who retire on and after 9/2/11. The plan is also offered on a voluntary basis to current retirees. The cost for this plan would be the same as the current plan plus any scheduled experience determined increases.
102,500,000 102,500,000
Implement edits currently existing in the plan design but not fully implemented by the vendors, such as prior authorization for certain diagnostic procedures.
Institute a $35 Emergency Room Co‐pay when the person is not admitted to the hospital.
11. Non‐Value Based Health and Dental ‐ If the employee chooses not to participate in the value based plan, or fails to comply with the plan's provisions, the cost for health care would be the same as calculated in the first year for Value Based, plus $100.00 per month additional. Institute a $350 Medical Deductible per year per individual for the regular plan.
19,200,000 21,700,000
Fiscal Acoountability Report
20

SEBAC 2011 Provisions (continued) FY 2012 FY 2013
12. Reduce Costs with Generics ‐ Drugs coming off patent. $ 1,500,000 $12,000,000 13. Tobacco and Obesity ‐ Reduce costs through voluntary referral Program. 1,000,000 2,000,000 14. Other Health Cost Containment Initiatives ‐ The Healthcare Cost Containment
Committee will identify additional cost savings through renegotiation of contracts and improved service delivery.
40,000,000 35,000,000
15. Mandatory Mail Order / Pharmacy Co‐pays: Mandatory Mail Order ‐maintenance drugs for active employees, future retirees and current retirees under 65 must be ordered through the mail. Voluntary for current retirees over 65 (mandatory once enrolled). Increase co‐pay to $5, $20 and $35 for non maintenance drugs.
19,876,000 20,500,000
16. Healthcare Cost for Early Retirement: Healthcare cost for early retirees until they reach their normal retirement date, or age 65, whichever is earlier. 2,000,000 4,000,000
17. Minimum Service for Retiree Medical – Increase to 15 years of actual state service for normal, early retirement and HD retirement with continuation of Rule of 75 for Deferred Vested.
1,822,000 5,705,000
18. Hard Wage Freeze – FY 2012 and FY 2013. No state employee would receive any increase in salary for either of the next two fiscal years, including no payment for individuals who were at their top step. 138,852,400 309,549,857
19. Adjust break point in Tier 2, Tier 2A and Tier 3. ‐ ‐
20. Salary Increases – FY 2014, FY 2015 and FY 2016 ‐ Provide three percent plus step increases or their equivalent in those units with them. ‐ ‐
21. Technology Initiatives ‐ Utilize new technologies and reduced licensing procurement and consulting costs. 40,000,000 50,000,000
22. SEBAC Budget Savings Initiative ‐ Implement savings ideas proposed by employees to reduce costs in agencies through reduced procurement costs, more efficient agency operations and other initiatives.
90,000,000 90,000,000
23. Longevity – No longevity payment would be made in October, 2011 to those units with capped longevity and an equivalent savings amount would be negotiated from those with uncapped longevity. No one during the biennium will have those years count for that period. Individuals first hired on or after 7/1/11 (military service counts) would never receive a longevity payment. These provisions are contingent upon similar changes being enacted that would apply to non‐represented employees.
7,000,000 ‐
Grand Total $ 700,741,400 $ 901,206,857
Fiscal Acoountability Report
21

STATE EMPLOYEES RETIREMENT SYSTEM ANTICIPATED ARC REQUIREMENT THROUGH FY 2033
Based on 6/30/10 Valuation ($ in Thousands)
% of Total
Retired/Deferred Liability $14,073,812 66.8%Active – Tier I Hazardous 107,541 0.5%Active – Tier IB 1,844,954 8.8%Active – Tier IC 71,223 0.3%Active – Tier II Hazardous 1,369,336 6.5%Active – Tier II Others 2,419,201 11.5%Active – Tier IIA Hazardous 474,651 2.3%Active – Tier II Others 687,620 3.3%Longley Load 5,859 0.0%Total Accrued Liability $21,054,197 100%Actuarial Value of Assets 9,349,605 Unfunded Accrued Liability $11,704,592 Normal Cost $296,568 Amortization of UAL 726,883 Annual Required Contribution $1,023,451
• Even though the state is paying the actuarially required contribution (ARC), the pension fund’s funded ratio will remain low until late in the amortization period of the unfunded actuarial accrued liability.
• The amortization method (Level Percent of Payroll) and SEBAC IV & V adjustments have the effect of increasing the ARC payments dramatically towards the end of the amortization period.
46.4%49.3%
47.2%45.9%47.0%48.4%49.2%50.1%51.2%52.4%53.7%55.3%
57.0%59.1%
61.5%64.2%
67.5%
71.3%
75.8%
81.2%
87.8%
100.0%
0.0%
10.0%
20.0%
30.0%
40.0%
50.0%
60.0%
70.0%
80.0%
90.0%
100.0%
$0
$500
$1,000
$1,500
$2,000
$2,500
$3,000
$3,500
$4,000
2012 2013 2014 2015 2016 2017 2018 2019 2020 2021 2022 2023 2024 2025 2026 2027 2028 2029 2030 2031 2032 2033
Th
ou
san
ds
Estimated Total State Contribution Funded Ratio
Fiscal Accountablilty Report
22

UNFUNDED PENSIONS STATE EMPLOYEES RETIREMENT SYSTEM AS OF 6/30
• State Employees unfunded pension liabilities continue to grow.
• The State’s obligations at the end of FY 2010 total $11.7 billion.
• This obligation represents roughly $3,275 for every man, woman, and child in the State.
STATE EMPLOYEES RETIREMENT SYSTEM CONTRIBUTIONS (In Millions)
• This obligation rose even with the large increase in equity valuations that took place over the 1990s.
• The deferral of the SERS contribution was $50M in FY 2009, $164.5M in FY 2010 and $100M in FY 2011.
$3.2$3.4 $3.5
$3.9$4.3
$4.9
$6.9
$7.9
$9.3
$11.7
51%
54%
57%59%
63%62%
54%
53%52%
44%
$2.0
$3.0
$4.0
$5.0
$6.0
$7.0
$8.0
$9.0
$10.0
$11.0
$12.0
40%
45%
50%
55%
60%
65%
1992 1994 1996 1998 2000 2002 2004 2006 2008 2010
Billi
ons
Fund
ed R
atio
Unfunded Actuarial Accrued Liabilities
Unfunded Pensions
Funded Ratio
$940 $905
$984
$1,087 $1,131
$84 $120
$131
$132$138
$343$376
$416 $426$474
$516
$623$664
$717 $704$732
$844
$1,024$1,025
$1,115
$1,219$1,269
$200
$400
$600
$800
$1,000
$1,200
$1,400
'00 '01 '02 '03 '04 '05 '06 '07 '08 '09 '10 '11 '12 '13 Fcst
'14 Fcst.
'15 Fcst.
'16 Fcst.
SEBAC 2011 Savings
Required Contribution
Fiscal Year
Mill
ions
* FYs '09 through '11 include contribution deferrals per the 2009 SEBAC Agreement. FYs '12 through '16 reflect preliminary SEBAC 2011 savings estimates pending formal revaluation.
Fiscal Accountablilty Report
23
UNFUNDED PENSIONS
CONNECTICUT TEACHERS’ RETIREMENT SYSTEM AS OF 6/30
TEACHERS’ RETIREMENT SYSTEM CONTRIBUTIONS *
$2.4 $2.6$3.0 $3.2
$2.2
$3.3
$5.2
$6.9 $6.5
$9.1
67%68%
69%70%
81%
76%
65%
60%
70%
61%
$1.5
$2.5
$3.5
$4.5
$5.5
$6.5
$7.5
$8.5
$9.5
50%
55%
60%
65%
70%
75%
80%
85%
1992 1994 1996 1998 2000 2002 2004 2006 2008 2010
Billion
s
Fund
ed Ratio
Unfunded Actuarial Accrued Liabilities
Unfunded Pensions
Funded Ratio
$226 $237
$429 $329
$559 $582
$757 $788 $819 $852 $886
$170 $176
$90 $210
$59$65
$81$121
$145$134
$133
$204 $215 $205 $180 $185 $185
$396 $412
$519 $539
$618 $647
$838
$909
$964 $986 $1,019
($80)
$20
$120
$220
$320
$420
$520
$620
$720
$820
$920
$1,020
'00 '01 '02 '03 '04 '05 '06 '07 '08 '09 '10 '11 '12 '13 Fcst.
'14 Fcst.
'15 Fcst.
'16 Fcst.
Millions
Fiscal Year
Debt Service
Surplus Funds
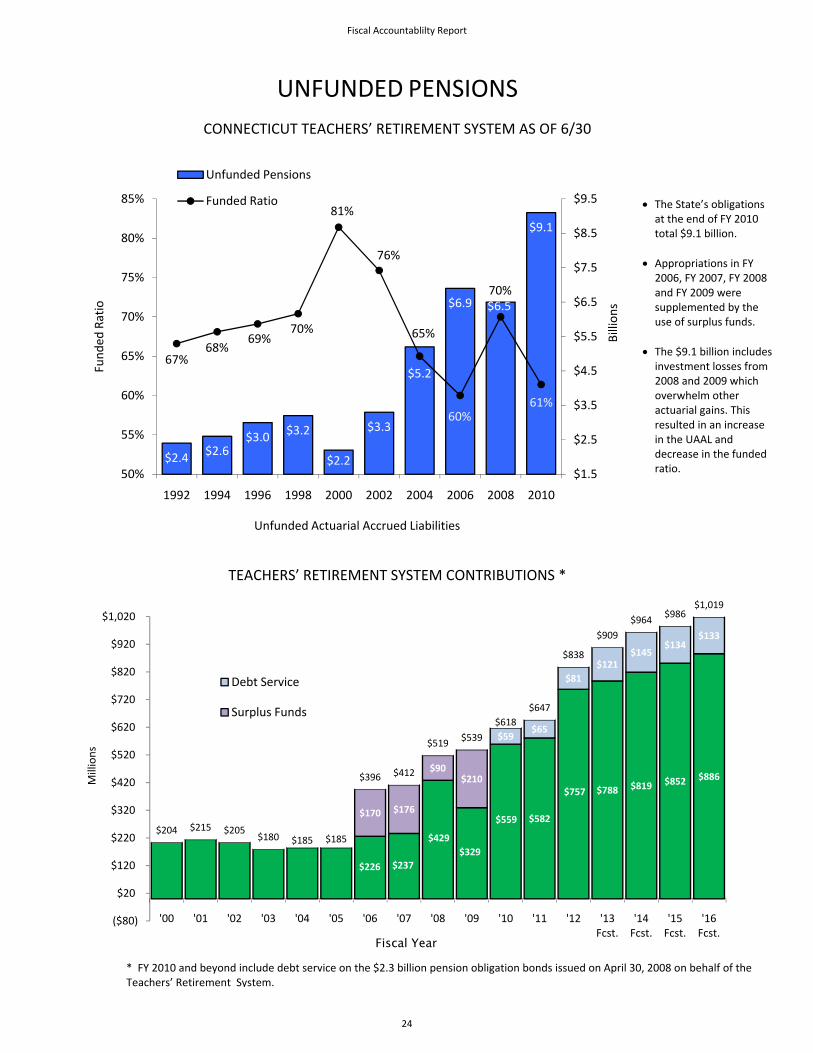
• The State’s obligations at the end of FY 2010 total $9.1 billion.
• Appropriations in FY 2006, FY 2007, FY 2008 and FY 2009 were supplemented by the use of surplus funds.
• The $9.1 billion includes investment losses from 2008 and 2009 which overwhelm other actuarial gains. This resulted in an increase in the UAAL and decrease in the funded ratio.
* FY 2010 and beyond include debt service on the $2.3 billion pension obligation bonds issued on April 30, 2008 on behalf of the Teachers’ Retirement System.
Fiscal Accountablilty Report
24

OTHER POST EMPLOYMENT BENEFITS
• The Governmental Accounting Standards Board (GASB) requires states to report on unfunded liabilities due to other post‐employment benefits (OPEB), such as health, dental and life insurance for retirees.
• There is currently no requirement to pre‐fund OPEB liabilities. (Some states have already begun pre‐funding OPEB, which is looked upon favorably by rating agencies.)
• Among the New England states, Connecticut has the highest per capita OPEB actuarially accrued liability (AAL) and actuarially required contribution (ARC).
• Under various measures, Connecticut consistently ranks among the states with the highest unfunded Other Post Employment Benefit levels.
State 2008 OPEB AAL Per Capita
(as % of Per Capita Income) 2008 OPEB ARC Per
Capita 2008 Funding Ratio
Connecticut* $7,428 (11.8%) $491 0%
Maine 3,334 (8.7%) 124 1.2%
Massachusetts 2,338 (4.1%) 128 1.8%
New Hampshire 2,443 (5.1%) 203 5.4%
Rhode Island 748 (1.7%) 44 0%
Vermont 2,606 (6.1%) 173 0.2%* The figures for Connecticut reflect a 4.5% pay‐as‐you‐go discount rate.
Source: “The Trillion Dollar Gap: Underfunded State Retirement Systems and the Roads to Reform”, The Pew Center on the States, February 2010.
• The actuarial OPEB liability, updated in December 2010, is estimated to be in the range of $14.0 billion to $26.6 billion, excluding the Teachers Retirement System (TRS). A revised valuation for OPEB is expected later this calendar year which will include the impact of recent plan changes made per the 2011 State Employees Bargaining Agent Coalition (SEBAC) agreement.
• Deposits to the OPEB Trust Fund: o $10 million – FY 2008. In FY 2008, the state appropriated $10 million for OPEB and
represented the state’s first deposit into the fund. o $14.5 million – FY 2011. An additional $14.5 million was deposited at the end of FY 2011
from the year end fund balance per the 2009 SEBAC agreement. o $1.4 million – FY 2010. Approximately $1.4 million was collected in FY 2010 from new
employees per the 2009 SEBAC agreement. o $21.3 million – FY 2011. Approximately $21.3 million was collected in FY 2011 from new
employees and employees with less than 5 years of service per the 2009 SEBAC agreement.
Fiscal Accountablilty Report
25

• Recent OPEB Reforms: o 2009 – The state entered into an agreement with SEBAC which specified that:
• New Employees – Effective 7/1/2009, all new health care eligible employees will, for their first 10 years of employment, contribute 3% of their salaries to fund retiree health.
• Employees with fewer than 5 years – Effective 7/1/2010, any health care eligible employee with fewer than 5 years of service will contribute 3% of their salaries until they reach 10 years of employment.
o 2011 –The state entered into a further agreement with SEBAC which incorporates additional changes that impact the state’s OPEB liability:
• All Employees – The agreement expands the 3% contribution to all employees, not just new employees, phased‐in as follows:
0.5% effective the first day of the pay period after July 1, 2013; 2.0% effective the first day of the pay period after July 1, 2014; 3.0% effective the first day of the pay period after July 1, 2015.
The contributions will continue for ten years or until retirement, whichever is sooner.
• State Match – Effective July 1, 2017, the state will contribute to the Retiree Health Care Trust Fund an amount equal to the amount contributed by employees in each year.
• Greater Premium Share for Early Retirees – Before this agreement, the premium shares for retiree health care coverage were minimal, ranging from zero to a maximum of three percent. The new agreement imposes premium sharing on individuals who elect early retirement, ranging from two percent to forty percent, based on the number of years of service and the number of years retiring early. The premium for any given employee will be capped at 25% of the person’s actual pension benefit.
Fiscal Accountablilty Report
26

FREQUENCY AND LENGTH OF U.S. RECESSIONS
Post WWII Era Economic Cycles Recessions Expansions Average Length 11.1 months 60.5 months
Longest 18 months 120 months Shortest 6 months 12 months
Source: National Bureau of Economic Research
• The US has experienced eleven recessions since World War II ended including the most recent in 2008/09.
• On average, a recession occurs about every six years, from start to start.
• Given that the last recession began in December of 2007, this means that the nation could face its next recession as early as 2013, assuming the average holds.
• Although great strides have been made in re‐establishing structural balance to the state’s
budget, the state is currently not prepared to face another recession because:
o The Budget Reserve Fund is depleted. o The Unemployment Trust Fund is insolvent and the state must repay the federal
government at least $810 million for amounts borrowed to date, and potentially more than $1.2 billion for amounts projected to be borrowed through 2015.
o The state will still owe approximately $600 million on the Economic Recovery Notes that were issued in 2009 to finance that year’s operating deficit.
Fiscal Accountablilty Report
27

SLOWER ECONOMIC RECOVERY Latest Economic Projections Are Not as Robust Compared to a Year Ago
4.3%4.9%
3.5%
2.4%
3.7%3.9%
0.0%
1.0%
2.0%
3.0%
4.0%
5.0%
6.0%
2012 2013 2014
Growth
Fiscal Year
U.S. Real Gross Domestic ProductAs of November 15, 2010 As of November 15, 2011
• The U.S. economy was originally projected to grow by 4.3% in FY 2012. That has now been revised downward to 2.4%.
• Similarly, the forecast for FY 2013 was 4.9%, but now has been lowered to 3.7%.
100.0
94.9
99.6
100.2
94.0
95.0
96.0
97.0
98.0
99.0
100.0
101.0
US Real Gross Domestic ProductPeak, 2007Q4=100; In 2005 Dollar
Source: US Department of Commerce, BEA
Peak 2007Q4 GDP: $13,326.0B
3.75 years
• From peak to trough, economic output in America fell 5.1%.
• It has taken 3 years and 9 months for the U.S. economy to finally re‐attain output levels last seen before the onset of the recession.
Fiscal Accountablilty Report
28

SLOWER ECONOMIC RECOVERY Latest Economic Projections Are Not as Robust Compared to a Year Ago
8.8%
7.1%
5.8%
8.8% 8.4%7.4%
0.0%
2.0%
4.0%
6.0%
8.0%
10.0%
2012 2013 2014Fiscal Year
Connecticut Unemployment RateAs of November 15, 2010 As of November 15, 2011
Source: Moody’s Economy.com
• A year ago, economic projections called for a more rapid improvement in the state’s unemployment rate.
• Those projections now appear overly optimistic.
0.6%
0.2% 0.2%
‐0.1%
0.0%
1.8%
‐0.4%
0.0%
0.4%
0.8%
1.2%
1.6%
2.0%
2012 2013 2014
Fiscal Year
Connecticut Employment GrowthAs of November 15, 2010 As of November 15, 2011
Source: Moody’s Economy.com
• Last year projections called
for employment growth of 0.6% and 0.2% in FY 2011 and FY 2012 respectively.
• Latest employment
projections call for ‐0.1% and 0.0% in FY 2011 and FY 2012 respectively.
Fiscal Accountablilty Report
29

SLOWER ECONOMIC RECOVERY Latest Economic Projections Are Not as Robust Compared to a Year Ago
(2,400)
(3,400)
2,600
(4,000)
4,400
(1,100)
2,200
5,100
(3,700)
(300)
(7,500)
(5,000)
(2,500)
0
2,500
5,000
7,500
Dec‐10 Jan‐11 Feb‐11 Mar‐11 Apr‐11 May‐11 Jun‐11 Jul‐11 Aug‐11 Sep‐11
Cumulative CT Jobs Gained/(Lost) Since November 2010
Source: CT Dept. of Labor
• Connecticut job growth has stagnated over the past year.
• Cumulatively Connecticut had virtually no growth in jobs.
5.97
9.910.56
3.01
4.93
7.47
0
2
4
6
8
10
12
2012 2013 2014
Fiscal Year
Connecticut Housing Starts(in Thousands)
As of November 15, 2010 As of November 15, 2011
Source: Moody’s Economy.com
• The recovery in the housing sector has been delayed and will be less substantial than projected last year at this time.
Fiscal Accountablilty Report
30

CAPITAL GAINS ARE NOT A STABLE REVENUE SOURCE (In Millions)
Conn. S&P 500 Income Capital Percent Percent Year Gains Change Change 1994 $2,547 ‐16% ‐2% 1995 $3,832 50% 34% 1996 $4,732 23% 20% 1997 $7,787 65% 31% 1998 $9,867 27% 27% 1999 $11,800 20% 20% 2000 $15,435 31% ‐10% 2001 $7,391 ‐52% ‐13% 2002 $6,231 ‐16% ‐23% 2003 $8,723 40% 26% 2004 $10,626 22% 9% 2005 $13,765 30% 3% 2006 $15,784 15% 12% 2007 $21,006 33% 4% 2008 $8,377 ‐60% ‐38% 2009 $5,172 ‐38% 23% 2010 Data not yet available 13% 2011 ‐2% YTD
Sources: Department of Revenue Services and Internal Revenue Service various years YTD through 11/2/2010
INCOME TAX GROWTH REMAINS TENUOUS CONNECTICUT CAPITAL GAINS AND THE S&P 500
‐80%
‐60%
‐40%
‐20%
0%
20%
40%
60%
80%
1994 1996 1998 2000 2002 2004 2006 2008 2010
Percent Change
Income/Calendar Year
Conn. Capital Gains
S&P 500
• Boom periods can encourage unsustainable levels of expenditures when capital gains collapse.
• While the equity markets provided a healthy recovery in 2009 & 2010, returns in 2011 do not bode well for accelerated and sustained growth in the short run.
• Capital gains income is strongly influenced by the performance of the stock market.
• In high years, capital gains can
represent almost 15% of total adjusted gross income.
• In low years, capital gains can
represent just 5% of total adjusted gross income.
• Unfortunately, a record high year
can be immediately followed by a record low year, devastating state finances.
• In 2009, capital gains revenue was
less than 25% of the 2007 record high.
Fiscal Accountablilty Report
31

PERSONAL INCOME TAX TRENDS ECONOMIC GROWTH RATES OF THE PERSONAL INCOME TAX
9.5% 8.7%
‐1.5% ‐1.8%
6.0%7.8% 7.1% 7.8%
4.5%
‐3.7%
0.8%
5.2%4.3%
6.5%
14.9%
19.0%
‐23.5%
‐14.7%
21.9% 22.8%
19.4%
13.0%
17.9%
‐27.3%
‐21.3%
27.7%
8.0%10.0%
‐32%
‐24%
‐16%
‐8%
0%
8%
16%
24%
'00 '01 '02 '03 '04 '05 '06 '07 '08 '09 '10 '11 '12 Est.
'13 Fcst.
Econom
ic Growth Rate
Fiscal Year
Withholding TaxEstimates & Final
• Over the past decade Connecticut’s income tax revenue has fluctuated dramatically. • This was due to the performance of the stock market and two recessions.
• Performance in the financial markets significantly influences the growth in this revenue source.
Fiscal Accountablilty Report
32
ESTIMATES AND FINALS PERSONAL INCOME TAX
ACTUAL INCOME TAX COLLECTIONS
(In Millions)
$1,501.0
$1,785.8
$1,361.7 $1,230.6
$1,588.4
$1,943.5
$2,322.0
$2,616.6
$3,135.0
$2,230.6
$2,685.0
$0
$500
$1,000
$1,500
$2,000
$2,500
$3,000
$3,500
2000 2001 2002 2003 2004 2005 2006 2007 2008 2009 2010 2011
Fiscal Year
$2,308.8
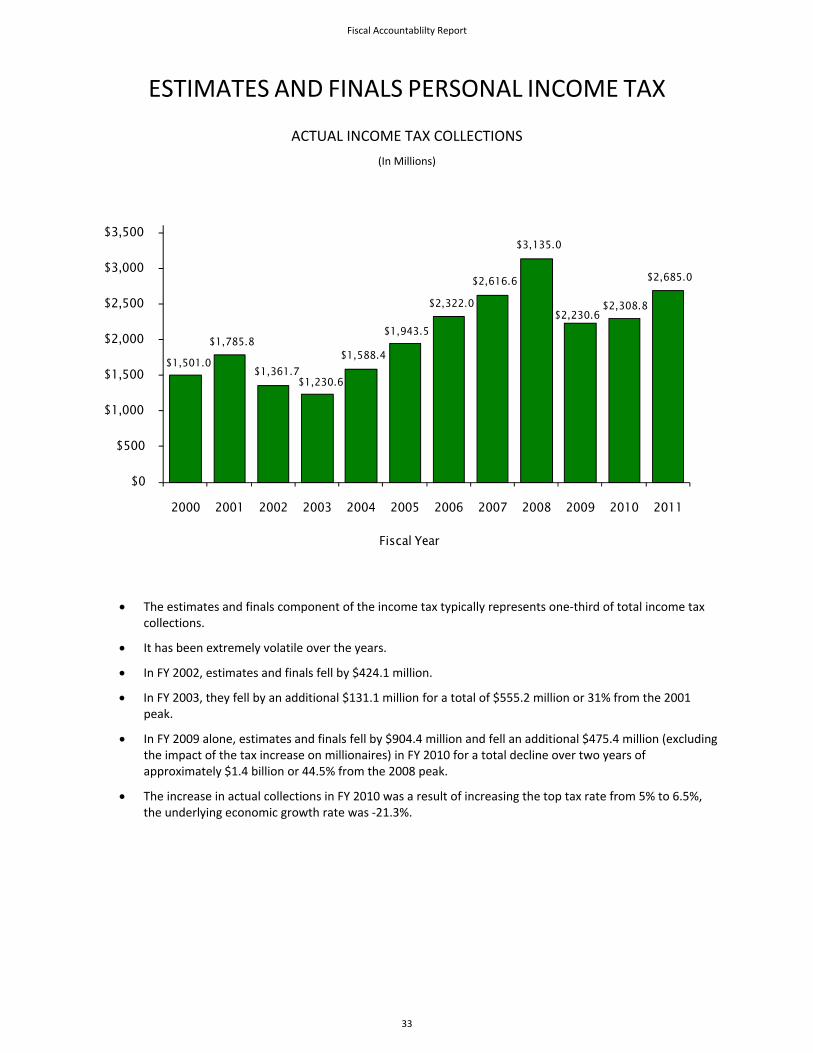
• The estimates and finals component of the income tax typically represents one‐third of total income tax collections.
• It has been extremely volatile over the years.
• In FY 2002, estimates and finals fell by $424.1 million.
• In FY 2003, they fell by an additional $131.1 million for a total of $555.2 million or 31% from the 2001 peak.
• In FY 2009 alone, estimates and finals fell by $904.4 million and fell an additional $475.4 million (excluding the impact of the tax increase on millionaires) in FY 2010 for a total decline over two years of approximately $1.4 billion or 44.5% from the 2008 peak.
• The increase in actual collections in FY 2010 was a result of increasing the top tax rate from 5% to 6.5%, the underlying economic growth rate was ‐21.3%.
Fiscal Accountablilty Report
33

SALES TAX TRENDS
ECONOMIC GROWTH RATES OF THE SALES AND USE TAX
7.1%
4.9%
1.2%
‐1.9%
5.6%
3.9%2.8% 3.0%
2.3%
‐7.9%
‐3.5%
4.9%
2.4%
3.9%
‐10%
‐7%
‐4%
‐1%
2%
5%
8%
'00 '01 '02 '03 '04 '05 '06 '07 '08 '09 '10 '11 '12 Est.
'13 Fcst.
Econom
ic Growth Rate
Fiscal Year
• The sales tax dropped in two consecutive years, fiscal 2009 and 2010, due to chaos in the financial market and
the worst economic downturn since the WWII. • Beginning in late FY 2008, collections started to weaken as the housing market deteriorated with prices declining
and foreclosure rates increasing.
• Without the federal stimulus packages, FY 2009 and FY 2010 would have been worse.
• Collections in late FY 2011 showed some signs of improvement as employment and personal income increased.
• A 1.0% increase in the sales and use tax growth rate results in a revenue gain of more than $30 million.
Fiscal Accountablilty Report
34

MOTOR FUELS TAX TRENDS AND THE SPECIAL TRANSPORTATION FUND
ECONOMIC GROWTH RATES OF THE MOTOR FUELS TAX
2.62%
1.34%0.91%
4.17%
‐0.63% ‐0.54%
‐3.70%‐3.18%
0.93%
‐1.10%
‐5.0%
‐3.0%
‐1.0%
1.0%
3.0%
5.0%
2002 2003 2004 2005 2006 2007 2008 2009 2010 2011
Fiscal Year
• Consumers began to curtail consumption as prices began to rise.
• By the summer of 2008, record high gasoline prices and the onset of a severe national recession forced
consumers to significantly alter their driving habits and/or mode of transportation in an effort to reduce their gasoline bill in the short term.
• Gasoline consumption rose in FY 2010 but the decline in FY 2011 consumption, again due to rising prices, more than offset the one year of positive growth.
• In FY 2011, Motor Fuels tax revenue equaled 41% of the total revenue of the Special Transportation Fund.
Fiscal Accountablilty Report
35

GROWTH IN SIGNIFICANT STATE EXPENDITURES Fiscal Year 2006 through Estimated FY 2016
• Significant cost drivers include health and pension costs for active and retired state employees and teachers, and expenditures related to the Medicaid program. Debt service will continue to consume a significant portion of the budget.
• Pension and health benefits for state employees and teachers, and Medicaid have grown at annual rates that are significantly higher than either the Consumer Price Index or the growth in personal income and are anticipated to continue to be the principal cost drivers for the foreseeable future.
• The above figures reflect actual General Fund and Special Transportation Fund expenditures through FY 2011 and estimated expenditures for FY 2012 through FY 2016, net of holdbacks in FY 2012 and including FY 2013 budgeted lapses from FY 2013 through FY 2016. The above figures do not reflect amortization of Other Post Employment Benefits (OPEB) obligations.
Medicaid
State Employee Pensions
Teachers' Pensions
Education Equalization Grants
Debt Service
State Employee Healthcare
All Other Expenditures
Personal Income
CPI
80%
100%
120%
140%
160%
180%
200%
220%
2006 2007 2008 2009 2010 2011 2012 2013 2014 2015 2016
Growth vs. FY 20
06
Fiscal Year
Fiscal Accountablilty Report
36

SUMMARY OF LOCAL AID
• Amounts include appropriations, revenue intercepts, Teachers’ Retirement Fund contributions, state share of school construction costs, and other bonding programs in support of municipalities.
• LoCIP, STEAP, Local School Construction and Teachers’ Retirement Debt Service are funded with General Obligation bonds.
• Regional Performance Incentive Grants, as well as the Manufacturing Transition & Revenue Sharing Grants are funded through revenue intercepts.
• The provisions that cap the Public School Transportation, Non‐Public School Transportation, Adult Education, and Special Education Student Based grants expire at the end of the 2012‐2013 biennium, therefore the grants are fully funded at statutory formulas for FYs 2014‐16.
• Assumes standard inflationary rate for ECS, School Based Health clinics, Early Childhood, Extended School Building Hours, and School Accountability.
• Estimates for Magnet Schools and Open Choice grants are based on anticipated enrollment.
• Assumes level funding for Town Aid Road, municipal PILOT programs, LoCIP and STEAP and the statutory transfer amount for the Mashantucket Pequot and Mohegan Grant.
• Support to municipalities constitutes 22.3% of the FY 2012 General Fund Budget.
• Support to municipalities will be approximately $4.45 billion in FY 2013 which is a 6.8% increase over the FY 2012 level.
$4.17
$4.45
$4.69
$4.81 $4.92
$3.60
$3.80
$4.00
$4.20
$4.40
$4.60
$4.80
$5.00
FY 12 FY 13 FY 14 FY 15 FY 16
In Billions
All Sources of Municipal Support FY 2012‐FY 2016
Fiscal Accountablilty Report
37

GRANT FY 2012 FY 2013 FY 2014 FY 2015 FY 2016
State Owned PILOT $ 78.1 $ 78.1 $ 78.1 $ 78.1 $ 78.1
College & Hospital PILOT 115.4 115.4 115.4 115.4 115.4
Mashantucket Pequot & Mohegan Grant 61.8 61.8 135.0 135.0 135.0
Town Aid Road Grant 30.0 30.0 30.0 30.0 30.0
LoCIP 30.0 30.0 30.0 30.0 30.0
Regional Performance Incentive Grants 7.2 7.4 7.7 7.9 8.1 Manufacturing Transition & Municipal Revenue Sharing Grants
93.3 99.1 103.6 107.1 110.9
STEAP 20.0 20.0 20.0 20.0 20.0
Miscellaneous General Government Grants 13.3 13.3 13.6 14.0 14.2 Subtotal ‐ General Government $ 449.2 $ 455.2 $ 533.4 $ 537.5 $ 541.6
Public School Transportation $ 25.8 $ 24.9 84.5 86.8 89.1
Non‐Public School Transportation 3.6 3.6 4.6 4.6 4.7
Adult Education 20.6 20.6 20.7 20.9 21.0
Education Cost Sharing 1,889.6 1,899.6 1,945.4 2,005.1 2,047.0
Magnet Schools 214.8 234.2 254.5 263.6 267.7
Special Education ‐ Student Based 139.8 139.8 184.8 196.0 207.9
Local School Construction Debt Service 400.0 575.0 500.0 500.0 500.0
Miscellaneous Education Grants 159.8 161.6 173.8 180.6 185.1 Subtotal ‐ Education $ 2,854.0 $ 3,059.3 $ 3,168.3 $ 3,257.5 $ 3,322.4
Teachers' Retirement Contributions, Retiree Health Service Cost & Debt Service
$ 865.3 $ 939.5 $ 995.8 $ 1,019.0 $ 1,053.3
Subtotal ‐ Teachers' Retirement $ 865.3 $ 939.5 $ 995.8 $ 1,019.0 $ 1,053.3
Total ‐ Aid to Municipalities $ 4,168.5 $ 4,454.0 $ 4,697.5 $ 4,814.1 $ 4,917.4
Notes:
Figures for the State Owned PILOT includes annual transfers from the Bradley Enterprise Fund in an amount necessary to pay 20% of the PILOT for certain Bradley International Airport Property.
STATE AID TO OR ON BEHALF OF LOCAL GOVERNMENTS(in millions)
This does not include town specific revenue of $22.8 million in FY 12 nor $25.4 million in FY 13 derived from: 1) motor vehicle fines for un‐registered vehicles; and 2) making permanent the 0.25% municipal real estate conveyance tax for all municipalities.
Also, this does not include $10.0 million in General Obligation Bond funds for municipal aid for Main Street iniatives authorized in PA 11‐1 (October Special Session).
Fiscal Accountablilty Report
38

DEPARTMENT OF SOCIAL SERVICES
MEDICAID EXPENDITURES
• With expenditures increasing 89% from FY 2006 to FY 2016, growth in the Medicaid program is a major cost driver in the state budget.
• In FY 2011, Medicaid accounted for approximately 83% of DSS’ budget.
• Medicaid growth since FY 2006 has been affected by utilization and rate increases for hospitals, nursing homes, physicians and other providers. Medicaid expenditures grew by only 0.35% from FY 2006 to FY 2007 due to the shift of pharmaceutical costs to the federal government under Medicare Part D and by only 0.1% from FY 2009 to FY 2010 largely as a result of increased pharmacy rebates and lower Medicare Part D clawback payments (due to enhanced reimbursement available under ARRA) and reduced nursing home expenditures.
• Expenditures for FY 2011 and projected expenditures for FY 2012 thru FY 2016 reflect the Medicaid expansion for low‐income adults, which resulted in additional growth in Medicaid beginning in FY 2011. Projected expenditures also reflect the impact of federal health care reform, which expands Medicaid coverage under LIA by increasing income eligibility to 133% of the federal poverty level beginning January 1, 2014.
• Future growth will also be impacted by increased alternatives to nursing home care under the Money Follows the Person demonstration.
$3,141 $3,152
$3,471
$3,852 $3,855
$4,466 $4,662
$4,855
$5,253
$5,651
$5,939
$2,500
$3,000
$3,500
$4,000
$4,500
$5,000
$5,500
$6,000
'06 '07 '08 '09 '10 '11 '12Est.
'13Fcst.
'14Fcst.
'15Fcst.
'16Fcst.
(in m
illio
ns)
Fiscal Year Low-Income Adults
Fiscal Accountablilty Report
39

EFFORTS TO PRESERVE AND MAXIMIZE FEDERAL FUNDING
The administration continues to make federal revenue maximization efforts a priority. Numerous Medicaid state plan amendments and waivers have been submitted or are in the process of being submitted to the federal government. Initiatives not requiring federal approval are being operationalized by impacted state agencies. In the current fiscal year and next, millions of dollars could be gained in new federal revenue due to these initiatives – above and beyond normal increases in federal Medicaid revenue resulting from caseload growth.
Some of the major revenue maximization efforts under development include:
• Serving existing clients of the Departments of Developmental Services, Mental Health and Addiction Services and Children and Families under three autism waivers, allowing the state to receive federal reimbursement for services currently being provided at 100% state cost;
• Billing for inpatient and outpatient care for certain offenders in the Department of Correction, allowing the state to receive federal reimbursement for services that are currently being supported at 100% state cost;
• Developing a waiver that will allow the state to claim federal reimbursement for services rendered in a private institutional setting that are currently provided at 100% state cost;
• Developing a waiver that will allow Medicaid reimbursement for certain rehabilitation services being provided by the Department of Mental Health and Addiction Services that are currently at 100% state cost;
• Billing for costs in several state agencies associated with the administration of Medicaid services; • Amending the comprehensive waiver operated by the Department of Developmental Services to allow for
inclusion of continuous residential supports as a waiver service, thus qualifying those services for reimbursement;
• Providing nursing home care for individuals currently being cared for in infirmaries in the Department of Correction and Connecticut Valley Hospital. Providing these services in the community will permit reimbursement for care that is currently at 100% state cost;
• Developing a limited new waiver for individuals with acquired brain injury to allow Medicaid reimbursement for services supported by DMHAS’ state‐funded TBI Community Services account;
• Exploring the potential for enhanced reimbursement of the costs for administrative services organizations (ASOs) in DSS, DCF and DMHAS; and
• Reviewing the impact of including coverage of various independent practitioners providing services to individuals 21 years of age and over as an optional service under Medicaid.
While much effort goes into maximizing revenue, equal or greater effort goes into preserving existing sources of federal reimbursement. The Centers for Medicare and Medicaid Services has strengthened its compliance activities, resulting in significantly greater scrutiny of all state claims. DSS staff and impacted state agencies have experienced significantly increased time and effort explaining and justifying revenue items in order to sustain claims worth hundreds of millions of dollars that had once been considered “routine.” DSS is hiring additional staff to oversee projects and analyze the fiscal implications and OPM has, through a new legislative appropriation, dedicated contractual resources toward revenue maximization efforts.
Until Congress acts on the federal budget, final funding levels for many of the state’s federally funded discretionary programs are unknown. In addition, it is not known how the work of the federal Joint Select Committee on Deficit Reduction and other federal budget efforts will ultimately affect the state’s discretionary grants, as well as the entitlement programs that are supported with federal dollars. Perhaps of greater significance is the potential impact of federal budget reductions on the state’s economy, particularly in areas such as defense spending.
Fiscal Accountablilty Report
40

RACE TO THE TOP – EARLY LEARNING CHALLENGE
Governor Malloy recently submitted Connecticut’s application for the federal Race to the Top – Early Learning Challenge competitive grant program, in which the state could be awarded up to $50 million in funds for a grant period from 12/31/2011 to 12/31/2015.
The purpose of the Race to the Top – Early Learning Challenge (RTT‐ELC) program is to improve the quality of early learning and development and close the achievement gap for children with high needs. Specifically, Connecticut will seek to achieve a dramatic increase in the percentage of Children with High Needs who enter Kindergarten ready to succeed, and to cut in half the percentage of children unprepared for school by accelerating ongoing efforts to strengthen state systems and support communities to work collaboratively to better meet the needs of high‐need children and families through improved service coordination and quality improvements.
To ensure the leadership necessary to change the culture of early childhood systems in Connecticut, Governor Malloy issued Executive Order 11 to establish a State Early Childhood Office, which will coordinate the efforts of many state agencies and many more stakeholders who have committed to work together to integrate the transformative RTT‐ELC projects into the existing efforts outlined in Public Act No. 11‐181, which mandates the continued development of a coordinated system of early care, education and child development through increased collaboration among State agencies. Governor Malloy also committed to fund one thousand new early childhood education slots targeted to high need children.
Fiscal Accountablilty Report
41

HEALTH CARE REFORM The Patient Protection and Affordable Care Act, P.L. 111‐148, and the Health Care and Education Reconciliation Act of 2010, P.L. 111‐152, were both signed into law in March of 2010 and together they are referred to as the Affordable Care Act. This act includes a wide variety of health care provisions and requirements. Key points of the health care reform law:
• Requires most US citizens and legal residents to obtain health coverage. • Encourages employers to offer health care coverage to their employees by providing tax credits to small
businesses who purchase health insurance for their employees; taxes employers who do not provide health care coverage for their employees.
• Creates a state‐based Health Insurance Exchange which allows individuals and small businesses to purchase health insurance coverage. These exchanges include premium and cost‐sharing credits to individuals and families within specific income brackets.
• Establishes an office of health insurance consumer assistance or an ombudsman program to serve as an advocate for people with private coverage in the individual and small group markets.
• Prohibits lifetime limits on coverage, and prohibits pre‐existing condition exclusions for children. Insurance rating rules allow variation based solely on age, area, family composition, and tobacco usage.
• Establishes a temporary high‐risk pool to provide health coverage to individuals with pre‐existing medical conditions. This pool has limited federal funding for qualified States.
• Establishes reporting requirements regarding medical loss ratios and premium rate increases. • Creates a website to assist consumers in finding and understanding health care coverage options. • Makes many Medicare and Medicaid enhancements and changes.
DEPARTMENT OF SOCIAL SERVICES
Medicaid Eligibility Allows states the option of covering childless adults up to 133% FPL under a Medicaid state plan amendment beginning 4/1/10. Effective 1/1/14, states will be required to provide Medicaid coverage to parents, children age 6 and older, and all childless adults up to 133% FPL. Impact: To reflect the extension of Medicaid benefits to individuals who would have otherwise been eligible for the State Administered General Assistance program, the enacted budget assumed a net revenue gain to the state of $53 million for the 15‐month period ending 6/30/11. Program expenditures in both DSS and DMHAS have been higher than budgeted, however, due to significant caseload growth.
Maintenance of Effort (MOE) Prohibits states from reducing eligibility standards, methodologies, or procedures for (1) adults on Medicaid until 12/31/13 or (2) children until 9/30/19 (both Medicaid and the Children’s Health Insurance Program (CHIP)). Between 1/1/11 and 12/31/13, a state can be exempt from MOE for optional non‐pregnant non‐disabled adult populations above 133% FPL if the state certifies that it is currently experiencing a budget deficit or projects a budget deficit in the following fiscal year. Impact: Reduces state’s flexibility to make certain reductions.
Federal Payments for Newly Eligible Individuals Provides federal Medicaid matching payments for the costs of services to newly eligible individuals at the following rates for non‐expansion states such as Connecticut: 100% in 2014, 2015, and 2016; 95% in 2017; 94% in 2018; 93% in 2019; and 90% thereafter. Impact: Gross costs are estimated at $270 million. These costs will be fully reimbursed thru 2016, after which federal reimbursement will be reduced each year, stabilizing at 90% in 2020. Because Connecticut fully appropriates Medicaid expenditures, this will affect the state spending cap.
Fiscal Accountablilty Report
42

Definition of Medical Assistance Redefines medical assistance to include not only payment for medical care and services, but also the care and services themselves. Impact: Could increase litigation against states, particularly lawsuits claiming delays in the delivery of services due to access issues.
Legal Immigrants Makes legal immigrants with income under 133% FPL, who are not eligible for Medicaid by virtue of the 5 year waiting period, eligible for the basic health program. Impact: Expands federal reimbursement for non‐citizens beyond the Children’s Health Insurance Program Reauthorization Act (CHIPRA), which extended federal reimbursement to children and pregnant women. Would result in additional federal reimbursement after 2014.
Incentives for States to Provide Home & Community‐Based Services (HCBS) Creates financial incentives for states to shift Medicaid beneficiaries out of nursing homes and into the community by extending the Money Follows the Person (MFP) Rebalancing Demonstration through FFY 2016 and reducing the six month requirement for institutionalization to three months. Impact: Will result in enhanced federal reimbursement with more individuals leaving skilled nursing facilities through the MFP program.
Medicaid Disproportionate Share Hospital (DSH) Payments Reduces federal DSH payments by $500 million in FFY 2014, increasing to $4 billion in FFY 2020. Directs HHS to develop a methodology for reducing federal DSH allotments to all states in order to achieve the mandated reductions, imposing larger reductions to states with lower percentages of uninsured. Impact: In FY 2012, the state will receive approximately $200 million in DSH. By 2019, the state’s DSH amount will be reduced by at least 50%. Because Connecticut is a “high DSH” state, the actual reduction is expected to be larger.
Tobacco Cessation Requires states to provide coverage under Medicaid for tobacco cessation services for pregnant women. Impact: Potential short term costs and long term savings.
Fraud, Waste and Abuse Reduces waste, fraud, and abuse in public programs by strengthening efforts in this area. Impact: Should help in the state’s ongoing efforts. STATE OF CONNECTICUT EMPLOYEE HEALTH PLAN Early Retiree Reinsurance Program (ERRP) The ERRP provides financial relief for employers, unions and state and local governments to help them maintain coverage for early retirees age 55 and older who are not yet eligible for Medicare, and their spouses, surviving spouses, and dependents. The amount of reimbursement to the employer is 80% of medical claims costs for health benefits between $15,000 and $90,000. The Affordable Care Act provides $5 billion in financial assistance. Impact: The state’s application to participate in the ERRP has been approved by the U.S. Department of Health and Human Services. The program ends on January 1, 2014. INSURANCE DEPARTMENT Regulation Enhancements Insurance policy forms and rates will need to conform to the requirements of the federal law and be filed for approval. Claims payment policies, enrollment and disenrollment data, financial disclosures, claims denials, rating practices, out‐of‐network payments and other information must be filed with DOI and available for public inspection. DOI must annually review unreasonable rates for group and individual plans.
Fiscal Accountablilty Report
43

UNEMPLOYMENT COMPENSATION FUND The Unemployment Compensation Fund (“Trust Fund”) is established pursuant to Connecticut General Statutes Section 31‐261 for the purpose of paying benefits to unemployed workers. The Trust Fund is funded through payroll tax contributions paid by employers, and is not a budgeted fund of the state. The recent high unemployment rates in Connecticut will have an effect on Connecticut businesses for the next several years.
• As of September 2011, the Connecticut seasonally adjusted unemployment rate was 8.9%, leading to a sustained high level of claims against the fund.
• The maximum weekly benefit rate is currently $573 per employee. Connecticut also pays $15 per dependent child up to a maximum of $75. Connecticut ranks 8th in the nation as to the maximum amount of benefits provided.
• In 2010, increases in job losses resulted in benefit payouts of approximately $1.3 billion from the trust fund, while only $700 million in taxes were collected. Although not to the same degree as in 2010, it is expected benefit payouts will outpace revenues in 2011 as well.
• Even with the fund solvency tax generating its maximum revenue annually, the trust fund became insolvent in October 2009.
• To continue making unemployment payments, Connecticut, like other states, has been borrowing from the federal government. The American Recovery and Reinvestment Act provided interest free borrowing through calendar year 2010, however, states with loans outstanding at the beginning of 2011 are subject to interest on these loans.
• Since Connecticut was unable to repay borrowed funds within two years, in January 2012 the federal government will increase federal unemployment taxes on employers by increasing the current federal unemployment tax by 0.3% increments annually until the loan is fully repaid.
• Current projections*, which are based on existing statutory provisions (both state and federal), indicate the need for continued borrowing until at least CY 2015. It is anticipated that final repayment of the loans will occur in CY 2015.
Projected Cash Flow ‐ Federal Unemployment Insurance *
Calendar Year
Amount Borrowed
Repaid by State UI Taxes
Repaid by Increased Federal
UI Taxes
2009 $180,000,000 $0 $0
2010 $345,000,000 $0 $0
2011 $285,000,000 $0 $0
2012 $100,000,000* $100,000,000* $30,000,000
2013 $100,000,000* $330,000,000* $60,000,000
2014 $100,000,000* $500,000,000* $90,000,000
2015 $100,000,000* $100,000,000* $0
Totals $1,210,000,000 $1,030,000,000 $180,000,000
*The figures above are based on current statutory provisions as well as projections of many variables such as unemployment benefit payouts, tax revenues, growth in wages and growth in labor force. Changes in these variables could result in changes in the borrowing amounts and also in the repayment schedule. Loan repayments by state taxes are estimated after payment of benefits. Please note that while borrowing is anticipated in calendar years 2012 to 2015, amounts borrowed in those years are anticipated to be paid back in the year borrowed and are classified as “cash flow loans” which may not be subject to interest.
Fiscal Accountablilty Report
44

REDUCING THE SIZE OF STATE GOVERNMENT
As a result of the enacted budget and through the efforts of Governor Malloy’s administration, during calendar year 2011 the size of state government has been reduced. This reduction applies to the number of state agencies, which experienced a number of significant consolidations and mergers, as well as to the size of the state workforce, which saw substantial attrition during the year.
• State agencies
o Reduced the number of budgeted state agencies by 27%, from 81 to 59.
o Major consolidations include:
Higher education ‐ Creation of the Board of Regents for Higher Education and the Office of Financial and Academic Affairs for Higher Education (affecting DHE, CSU, CTCs, Charter Oak State College).
Department of Administrative Services (combining DAS, DOIT, portions of DPW).
Department of Economic and Community Development (merging DECD, OWC, CCT).
Department of Emergency Services and Public Protection (consolidating DPS, DEMHAS, POST, FPC).
Office of Governmental Accountability (merging watchdog agencies and various other offices and commissions).
• State workforce (not including Legislative or Judicial branches, or higher education)
o Executive Branch vacancies 3,226
o Positions held vacant
Through holdbacks based on SEBAC accord 1,592
Not requested for refill by agencies 228
Not approved for refill by OPM, Oct. 2011 416
Total positions held vacant 2,236 69%
o Positions approved for refill 990 31%
1Based on Executive Branch General Fund and Special Transportation Fund payroll data for 3/27/09, 12/30/10, and 10/21/11 payrolls, excludes constituent units of Higher Education.
Fiscal Accountablilty Report
45

GENERALLY ACCEPTED ACCOUNTING PRINCIPLES One of the hallmarks of Governor Malloy’s administration has been to improve financial transparency and accountability. On January 5, 2011, immediately following his taking the oath of office, the Governor issued Executive Order No. 1 directing the state to initiate a process to reflect the use of Generally Accepted Accounting Principles (GAAP) for budgeting purposes. The legislative outgrowth of that directive was sections 43‐49 of Public Act 11‐48 which mandate the use of GAAP for budgeting purposes beginning July 1, 2013. Specifically, the law made the following changes: 1. Transition Years FY 2012 and FY 2013. Sets up FY 2012 and FY 2013 as transition years whereby GAAP principles
are initiated on a state‐wide basis, but not an agency specific basis. It achieves this by directing the Comptroller to reserve from unappropriated surplus a maximum of $75 million in fiscal year 2012 and a maximum of $50 million in FY 2013 to be applied toward any increase in the unreserved negative general fund balance on the theory that these amounts were the estimated increase in the GAAP annual deficits for those years. [Section 46]
2. GAAP Start Date FY 2014. Requires the implementation of GAAP for budgeting purposes beginning with FY 2014. [Sections 45, 47]
3. Amortization of Deferred Charge. Directs the Comptroller to establish a deferred charge for accrued and unpaid expenses on the balance sheet of the state as of June 30, 2013 and directs that such charge be amortized in equal increments over 15 years commencing with FY 2014. [Section 45]
4. Balanced Budget Definition and Prior Year Annual Deficits. Modifies the definition of what constitutes a balanced budget. Beginning with FY 2014, any prior year’s deficit reported in the most recently published Comprehensive Annual Financial Report (CAFR) must be rolled into the balance calculation of the Governor’s proposed and the Legislature’s adopted budget. Revenues must exceed the sum of total appropriations plus any prior year deficit. Given the timing of the CAFR release this will typically mean any deficit two years prior to the budget in question. [Sections 43, 48]
5. Preliminary Comptroller’s Report. Revises the date by which the Comptroller must release a preliminary, unaudited report on the most recently completed fiscal year from September 1st of each year to September 30th. [Section 44]
6. Future Surpluses. Dedicates, beginning with fiscal year 2014, any future unappropriated surpluses toward the annual amortization of the deferred charge. This would place the deferred charge ahead of the early repayment of the 2009 Economic Recovery Notes and deposits to the Budget Reserve Fund. [Section 46]
7. End of Year Payments. Removes the 30 day grace period after the close of the fiscal year for certain expenditures to be made if there is no succeeding appropriation in the new fiscal year. Because expenditures will accrue to the appropriate period under GAAP principles, this limitation no longer applies. [Section 49]
In addition, section 165 of Public Act 11‐6 repealed the GAAP salary reserve account which was established to accommodate the 27th payroll that occurs approximately every 11 years. With the implementation of GAAP budgeting, this account will no longer be necessary. Lastly, efforts are underway to identify changes to the State’s financial systems that are needed to implement GAAP, with any modifications anticipated to be completed concurrently with the State’s migration to an upgraded version of the CORE‐CT software, which is anticipated to be completed during FY 2013.
Fiscal Accountablilty Report
46


Section 7 Analysis of Possible Uses of Surplus
Funds


ANALYSIS OF POSSIBLE USES OF SURPLUS FUNDS Given the structural budget reforms enacted during the 2011 legislative session, surpluses are projected over the next several years. Under current law, these surpluses have already been committed. Specifically, the General Assembly passed Public Act 11‐48, section 46 that modified the disposition of any future surplus for fiscal years 2012 through 2028. Should the state experience surpluses during those fiscal years, any surplus would be distributed as follows:
1. Reserve an amount not to exceed $75 million in FY 2012 and $50 million in FY 2013 in order to reduce the GAAP deficit. Starting in FY 2014 the amount to be reserved shall equal the annual amortization of the deferred GAAP charge, and then
2. Redeem any of the outstanding Economic Recovery Notes that were issued to finance the FY 2009 deficit of $947.6 million, and then
3. Deposit to the Budget Reserve Fund. The current estimate of the GAAP deficit is $1.7 billion. Replenishment of the Budget Reserve Fund to the ten percent level would require approximately $2.0 billion. Beyond these commitments, other priorities could include:
Reducing bonded indebtedness; Reducing the unfunded liability in the State Employees Retirement Fund; Reducing the unfunded liability in the Teachers Retirement Fund; Actuarially funding the unfunded liability for Other Post Employment Benefits; or Providing funds for Higher Education Matching Grants as per sections 10a‐77a, 10a‐99a, 10a‐109c, 10a‐
109i and 10a‐143a of the General Statutes.
Fiscal Accountablilty Report
47