Embed Size (px)
Citation preview
Fiscal 2020 ResultsFixed Income Investors Presentation
June 2021
2
Disclaimer
This document contains forward-looking statements in regard to forecasts, targets and plans of Mitsubishi UFJ Financial Group, Inc. (“MUFG”) and its groupcompanies (collectively, the “group”). These forward-looking statements are based on information currently available to the group and are stated here on thebasis of the outlook at the time when this document was produced. In addition, in making these statements, certain assumptions (premises) have been utilized.These statements and assumptions (premises) are subjective and may prove to be incorrect or may not be realized in the future. Underlying such assumptionsare a large number of risks and uncertainties. Please see other disclosures and public filings made or to be made by MUFG and the other companies comprisingthe group, including our latest consolidated summary report, financial report, securities report, quarterly securities report, and annual report, and our latestannual report on Form 20-F and other reports submitted to the U.S. Securities and Exchange Commission, for additional information regarding such risks anduncertainties. The group has no obligation or intent to update any forward-looking statements contained in this document.
In addition, information on companies and other entities outside the group that is included in this document has been obtained from publicly availableinformation and other sources. The accuracy and appropriateness of that information has not been verified by the group and cannot be guaranteed.
The financial information used in this document was prepared in accordance with accounting principles generally accepted in Japan (“Japanese GAAP”), unlessotherwise stated. Accounting principles generally accepted in the United States (“U.S. GAAP”) differ in certain important respects. You should consult your ownprofessional advisers for a more complete understanding of the differences between U.S. GAAP and Japanese GAAP and the generally accepted accountingprinciples of other jurisdictions and how those differences might affect the financial information contained in this document.
This document may not be reproduced, redistributed or passed on to any other person or published, in whole or in part, for any purpose, without our priorwritten consent.
The information included in this document is not an offer to sell, or a solicitation of an offer to buy, any securities in the United States, Japan or any otherjurisdiction.
This document is as of June 1, 2021.
Definitions of abbreviations used in this document
the Bank: MUFG Bank, Ltd. R&C: Retail & Commercial Banking Business Group
the Trust Bank: Mitsubishi UFJ Trust & Banking Corporation JCIB: Japanese Corporate & Investment Banking Business Group
the Securities HD: Mitsubishi UFJ Securities Holdings Co., Ltd. GCIB: Global Corporate & Investment Banking Business Group
NICOS: Mitsubishi UFJ NICOS Co., Ltd. GCB: Global Commercial Banking Business Group
MUMSS: Mitsubishi UFJ Morgan Stanley Securities Co., Ltd. AM/IS: Asset Management & Investor Services Business Group
MUAH: MUFG Americas Holdings Corporation Global Markets: Global Markets Business Group
KS: Bank of Ayudhya Public Company Limited (Krungsri)
BDI: PT Bank Danamon Indonesia, Tbk.
FSI: First Sentier Investors (Australia) Services Pty Limited
Definitions of figures used in this document
Consolidated: Mitsubishi UFJ Financial Group Inc. (consolidated) the Bank consolidated: MUFG Bank, Ltd. (consolidated)
Non-consolidated: Simple sum of MUFG Bank, Ltd. (non-consolidated) and Mitsubishi UFJ Trust & Banking Corporation (non-consolidated)
3
Contents
Section 1 Overview 4
Section 2 Financial results 8
Section 3 Capital raising strategy 18
Section 4 MUFG’s Approach for ESG 23
Appendix 30
4
Section 1 Overview

5
Overview Financial results Capital raising strategy MUFG’s Approach for ESG
Group structure
As of March 31, 2021
*1 Morgan Stanley and Morgan Stanley MUFG Securities are equity method investees of MUFG as of March 31, 2021
Mitsubishi UFJ Financial Group, Inc.(MUFG)
HoldingCompany
Morgan Stanley*1
Strategicalliance
Mitsubishi UFJNICOS Co., Ltd.
(NICOS)
ACOM Co., Ltd.
Morgan Stanley MUFGSecurities Co., Ltd.*1
Mitsubishi UFJMorgan Stanley
SecuritiesCo., Ltd. (MUMSS)
MUFG Bank, Ltd. (the Bank)
PT Bank DanamonIndonesia, Tbk. (BDI)
MUFGAmericas Holdings
Corporation (MUAH)
Bank of AyudhyaPublic Company
Limited (KS)
Mitsubishi UFJ SecuritiesHoldings Co., Ltd.(the Securities HD)
Mitsubishi UFJTrust and Banking
Corporation (the Trust Bank)
First Sentier Investors (Australia) Services Pty Limited (FSI)
Mitsubishi UFJKokusai Asset
Management Co., Ltd.
MUFG InvestorServices Holdings
Limited
6
Overview Financial results Capital raising strategy MUFG’s Approach for ESG
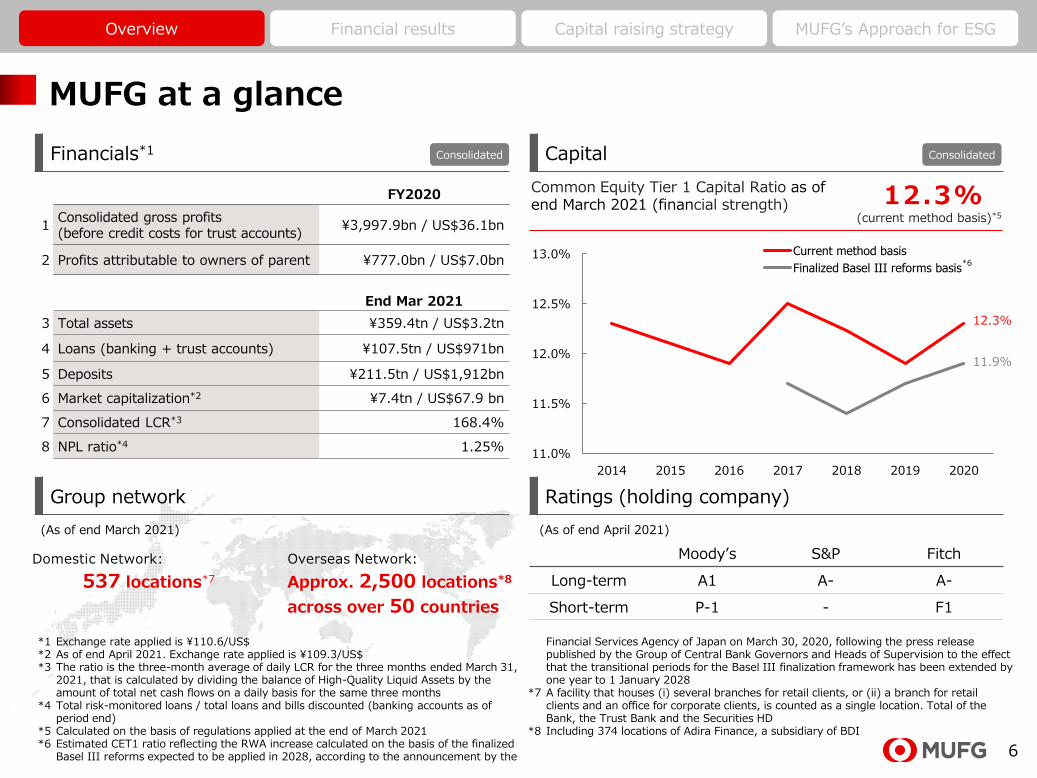
MUFG at a glance
Financials*1 Capital
Ratings (holding company)
FY2020
1Consolidated gross profits(before credit costs for trust accounts)
¥3,997.9bn / US$36.1bn
2 Profits attributable to owners of parent ¥777.0bn / US$7.0bn
End Mar 2021
3 Total assets ¥359.4tn / US$3.2tn
4 Loans (banking + trust accounts) ¥107.5tn / US$971bn
5 Deposits ¥211.5tn / US$1,912bn
6 Market capitalization*2 ¥7.4tn / US$67.9 bn
7 Consolidated LCR*3 168.4%
8 NPL ratio*4 1.25%
Domestic Network:
537 locations*7
Overseas Network:
Approx. 2,500 locations*8
across over 50 countries
(As of end March 2021)
Moody’s S&P Fitch
Long-term A1 A- A-
Short-term P-1 - F1
(As of end April 2021)
(current method basis)*5
12.3%Common Equity Tier 1 Capital Ratio as of end March 2021 (financial strength)
11.0%
11.5%
12.0%
12.5%
13.0%
2014 2015 2016 2017 2018 2019 2020
Current method basis
Finalized Basel III reforms basis
*1 Exchange rate applied is ¥110.6/US$*2 As of end April 2021. Exchange rate applied is ¥109.3/US$*3 The ratio is the three-month average of daily LCR for the three months ended March 31,
2021, that is calculated by dividing the balance of High-Quality Liquid Assets by the amount of total net cash flows on a daily basis for the same three months
*4 Total risk-monitored loans / total loans and bills discounted (banking accounts as of period end)
*5 Calculated on the basis of regulations applied at the end of March 2021*6 Estimated CET1 ratio reflecting the RWA increase calculated on the basis of the finalized
Basel III reforms expected to be applied in 2028, according to the announcement by the
Financial Services Agency of Japan on March 30, 2020, following the press release published by the Group of Central Bank Governors and Heads of Supervision to the effect that the transitional periods for the Basel III finalization framework has been extended by one year to 1 January 2028
*7 A facility that houses (i) several branches for retail clients, or (ii) a branch for retail clients and an office for corporate clients, is counted as a single location. Total of the Bank, the Trust Bank and the Securities HD
*8 Including 374 locations of Adira Finance, a subsidiary of BDI
Consolidated Consolidated
12.3%
11.9%
*6
Group network
7
Overview Financial results Capital raising strategy MUFG’s Approach for ESG
AT1, Tier 2 bonds
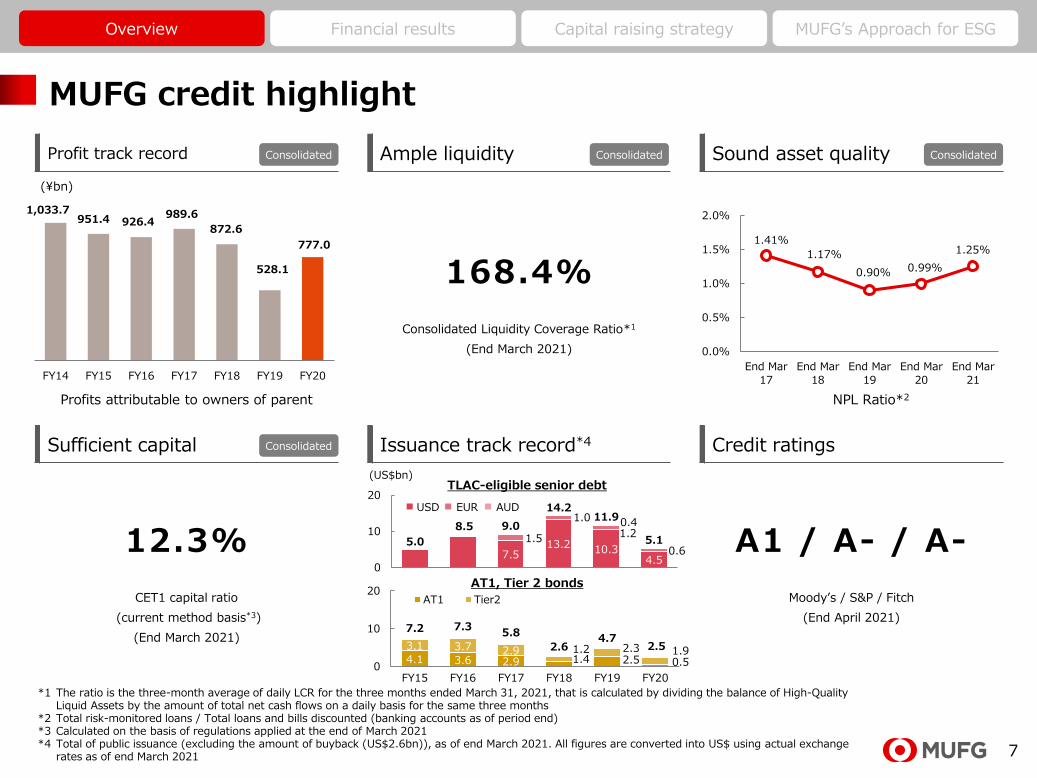
MUFG credit highlight
Profit track record Ample liquidity Sound asset quality
(¥bn)
Sufficient capital Issuance track record*4 Credit ratings
168.4%
Consolidated Liquidity Coverage Ratio*1
(End March 2021)
1.41%
1.17%
0.90% 0.99%
1.25%
0.0%
0.5%
1.0%
1.5%
2.0%
End Mar
17
End Mar
18
End Mar
19
End Mar
20
End Mar
21
*1 The ratio is the three-month average of daily LCR for the three months ended March 31, 2021, that is calculated by dividing the balance of High-Quality Liquid Assets by the amount of total net cash flows on a daily basis for the same three months
*2 Total risk-monitored loans / Total loans and bills discounted (banking accounts as of period end)*3 Calculated on the basis of regulations applied at the end of March 2021*4 Total of public issuance (excluding the amount of buyback (US$2.6bn)), as of end March 2021. All figures are converted into US$ using actual exchange
rates as of end March 2021
12.3%
CET1 capital ratio
(current method basis*3)
(End March 2021)
A1 / A- / A-
Moody’s / S&P / Fitch
(End April 2021)
NPL Ratio*2Profits attributable to owners of parent
Consolidated Consolidated Consolidated
Consolidated
7.513.2 10.3
4.5
1.5
1.0
1.2
0.6
0.4
5.0
8.5 9.0
14.2 11.9
5.1
0
10
20
4.1 3.6 2.9 1.4 2.5 0.5
3.1 3.7 2.9 1.2 2.3 1.9
7.2 7.35.8
2.64.7
2.5
0
10
20
FY15 FY16 FY17 FY18 FY19 FY20
AT1 Tier2
(US$bn)
USD EUR AUD
TLAC-eligible senior debt
FY14 FY15 FY16 FY17 FY18 FY19 FY20
872.6
1,033.7951.4 926.4
989.6
528.1
777.0
8
Section 2 Financial results
9
Overview Financial results Capital raising strategy MUFG’s Approach for ESG
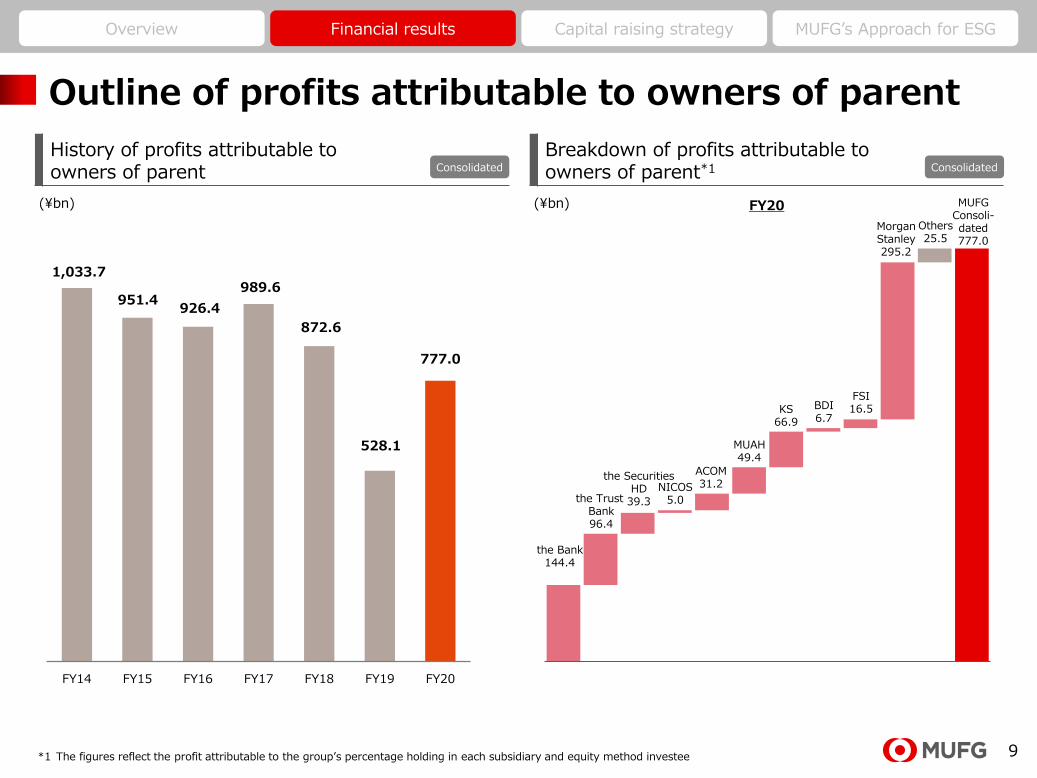
Outline of profits attributable to owners of parent
History of profits attributable to owners of parent
Breakdown of profits attributable to owners of parent*1
*1 The figures reflect the profit attributable to the group’s percentage holding in each subsidiary and equity method investee
FY20 (¥bn)(¥bn)
Consolidated Consolidated
FY14 FY15 FY16 FY17 FY18 FY19 FY20
872.6
1,033.7
951.4926.4
989.6
528.1
777.0
the Trust Bank96.4
MUAH49.4
KS66.9
the SecuritiesHD
39.3
NICOS5.0
ACOM31.2
MorganStanley295.2
Others25.5
MUFGConsoli-dated777.0
BDI6.7
the Bank144.4
FSI16.5
10
Overview Financial results Capital raising strategy MUFG’s Approach for ESG
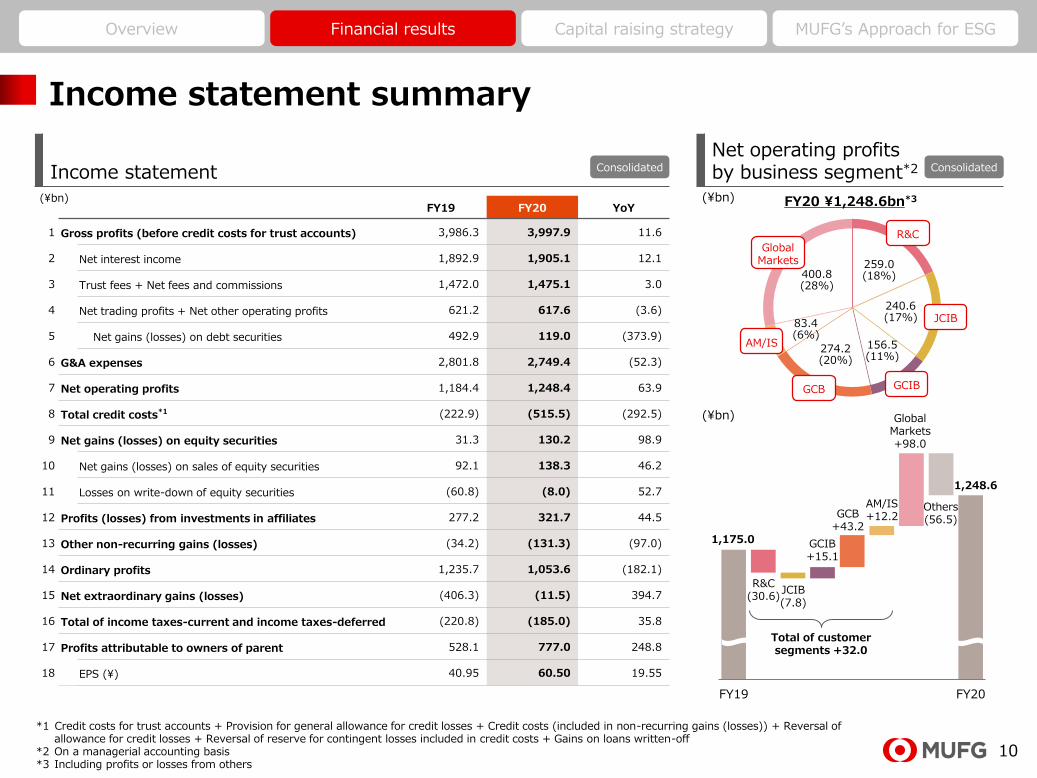
Income statement summary
Income statementNet operating profitsby business segment*2
FY19 FY20 YoY
1 Gross profits (before credit costs for trust accounts) 3,986.3 3,997.9 11.6
2 Net interest income 1,892.9 1,905.1 12.1
3 Trust fees + Net fees and commissions 1,472.0 1,475.1 3.0
4 Net trading profits + Net other operating profits 621.2 617.6 (3.6)
5 Net gains (losses) on debt securities 492.9 119.0 (373.9)
6 G&A expenses 2,801.8 2,749.4 (52.3)
7 Net operating profits 1,184.4 1,248.4 63.9
8 Total credit costs*1 (222.9) (515.5) (292.5)
9 Net gains (losses) on equity securities 31.3 130.2 98.9
10 Net gains (losses) on sales of equity securities 92.1 138.3 46.2
11 Losses on write-down of equity securities (60.8) (8.0) 52.7
12 Profits (losses) from investments in affiliates 277.2 321.7 44.5
13 Other non-recurring gains (losses) (34.2) (131.3) (97.0)
14 Ordinary profits 1,235.7 1,053.6 (182.1)
15 Net extraordinary gains (losses) (406.3) (11.5) 394.7
16 Total of income taxes-current and income taxes-deferred (220.8) (185.0) 35.8
17 Profits attributable to owners of parent 528.1 777.0 248.8
18 EPS (¥) 40.95 60.50 19.55
(¥bn)
FY19 FY20
*1 Credit costs for trust accounts + Provision for general allowance for credit losses + Credit costs (included in non-recurring gains (losses)) + Reversal of allowance for credit losses + Reversal of reserve for contingent losses included in credit costs + Gains on loans written-off
*2 On a managerial accounting basis*3 Including profits or losses from others
(¥bn) FY20 ¥1,248.6bn*3
(¥bn)
1,175.0
R&C(30.6)
JCIB(7.8)
GCIB+15.1
GCB+43.2
AM/IS+12.2
GlobalMarkets+98.0
Others(56.5)
1,248.6
ConsolidatedConsolidated
Total of customersegments +32.0
R&C
JCIB
GCIB
GlobalMarkets
GCB
AM/IS
259.0(18%)
240.6(17%)
156.5(11%)
274.2(20%)
400.8(28%)
83.4(6%)
11
Overview Financial results Capital raising strategy MUFG’s Approach for ESG
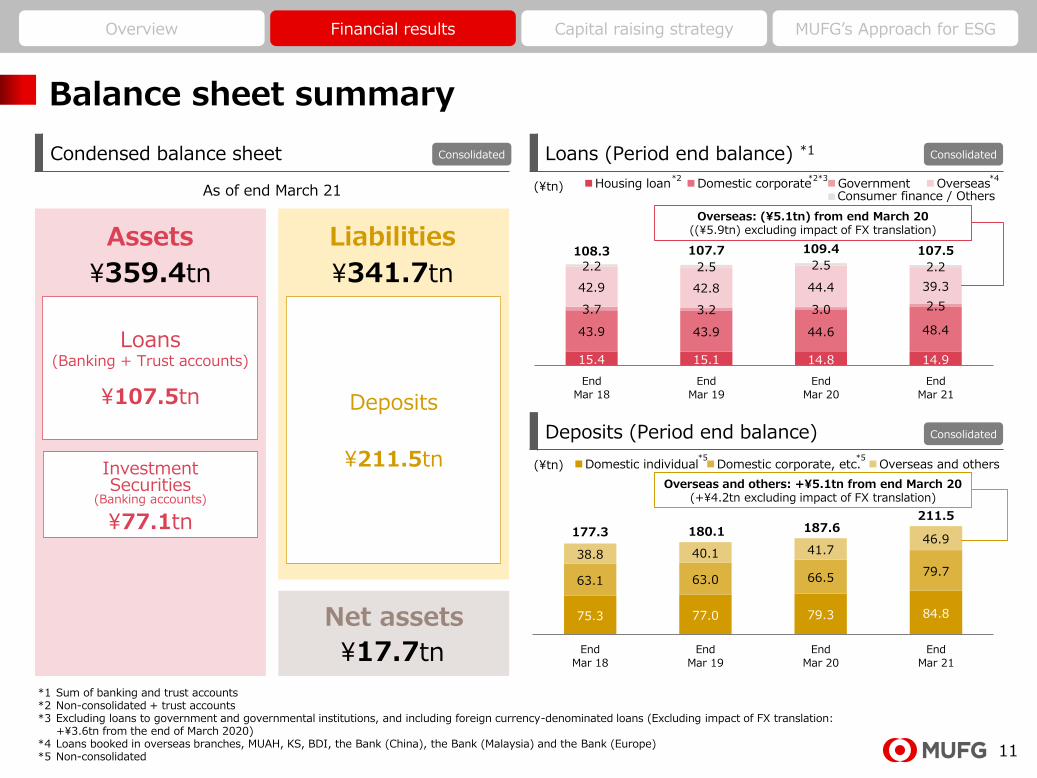
Balance sheet summary
Condensed balance sheet Loans (Period end balance) *1
Deposits (Period end balance)
*1 Sum of banking and trust accounts*2 Non-consolidated + trust accounts*3 Excluding loans to government and governmental institutions, and including foreign currency-denominated loans (Excluding impact of FX translation:
+¥3.6tn from the end of March 2020)*4 Loans booked in overseas branches, MUAH, KS, BDI, the Bank (China), the Bank (Malaysia) and the Bank (Europe) *5 Non-consolidated
15.4 15.1 14.8 14.9
43.9 43.9 44.6 48.4
3.7 3.2 3.0 2.5
42.9 42.8 44.4 39.3
2.2 2.5 2.5 2.2
108.3 107.7 109.4 107.5
End
Mar 18
End
Mar 19
End
Mar 20
End
Mar 21
Housing loan Domestic corporate Government Overseas
75.3 77.0 79.3 84.8
63.1 63.0 66.5 79.7
38.8 40.1 41.7 46.9
177.3 180.1 187.6 211.5
End
Mar 18
End
Mar 19
End
Mar 20
End
Mar 21
Domestic individual Domestic corporate, etc. Overseas and others
(¥tn)
(¥tn)
Assets Liabilities
Net assets
¥17.7tn
¥341.7tn¥359.4tn
As of end March 21
Overseas: (¥5.1tn) from end March 20 ((¥5.9tn) excluding impact of FX translation)
Overseas and others: +¥5.1tn from end March 20 (+¥4.2tn excluding impact of FX translation)
Loans(Banking + Trust accounts)
Deposits
¥211.5tn
¥107.5tn
Investment Securities
(Banking accounts)
¥77.1tn
*4*2*3
*5 *5
*2
Consolidated Consolidated
Consolidated
Consumer finance / Others
12
Overview Financial results Capital raising strategy MUFG’s Approach for ESG
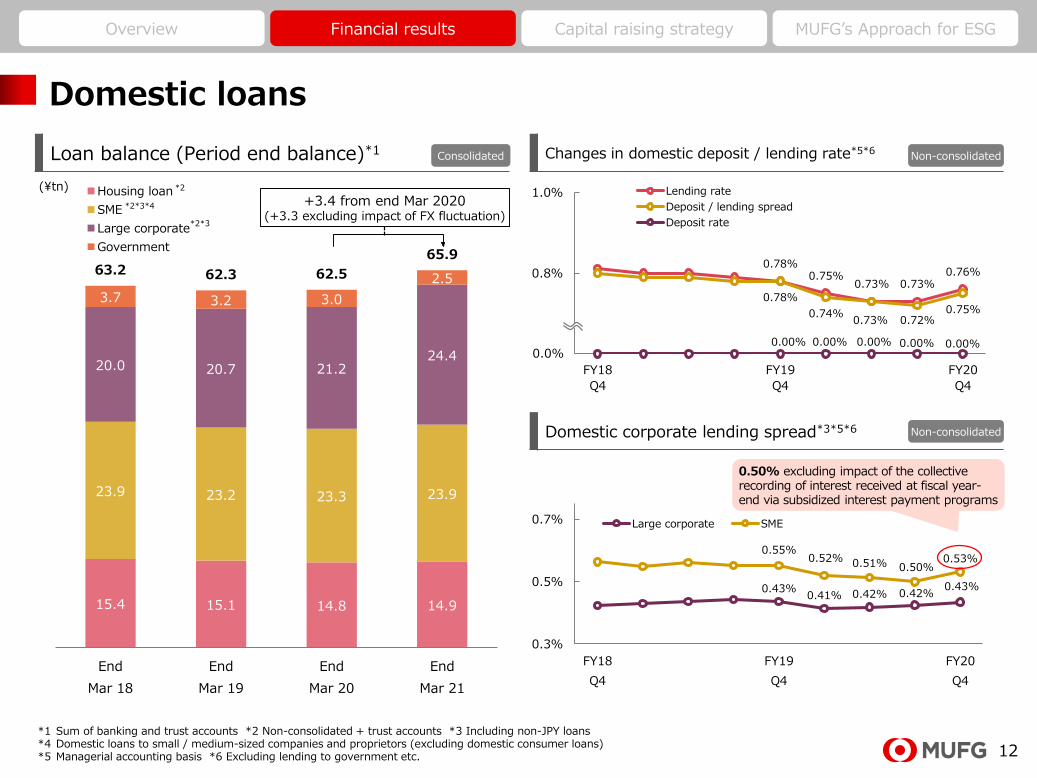
Domestic loans
Loan balance (Period end balance)*1 Changes in domestic deposit / lending rate*5*6
Domestic corporate lending spread*3*5*6
*1 Sum of banking and trust accounts *2 Non-consolidated + trust accounts *3 Including non-JPY loans *4 Domestic loans to small / medium-sized companies and proprietors (excluding domestic consumer loans)*5 Managerial accounting basis *6 Excluding lending to government etc.
15.4 15.1 14.8 14.9
23.9 23.2 23.3 23.9
20.0 20.7 21.224.4
3.7 3.2 3.0
2.563.2 62.3 62.5
65.9
End
Mar 18
End
Mar 19
End
Mar 20
End
Mar 21
Housing loan
SME
Large corporate
Government
0.78%0.75%
0.73% 0.73%0.76%
0.78%
0.74%0.73% 0.72%
0.75%
0.00% 0.00% 0.00% 0.00% 0.00%0.6%
0.8%
1.0%
FY18
Q4
FY19
Q4
FY20
Q4
Lending rate
Deposit / lending spread
Deposit rate
0.43%0.41% 0.42% 0.42%
0.43%
0.55%0.52% 0.51% 0.50%
0.53%
0.3%
0.5%
0.7%
FY18
Q4
FY19
Q4
FY20
Q4
Large corporate SME
0.0%
(¥tn)
*2*3*4 +3.4 from end Mar 2020(+3.3 excluding impact of FX fluctuation)
Consolidated Non-consolidated
Non-consolidated
*2*3
*2
0.50% excluding impact of the collective recording of interest received at fiscal year-end via subsidized interest payment programs
13
Overview Financial results Capital raising strategy MUFG’s Approach for ESG
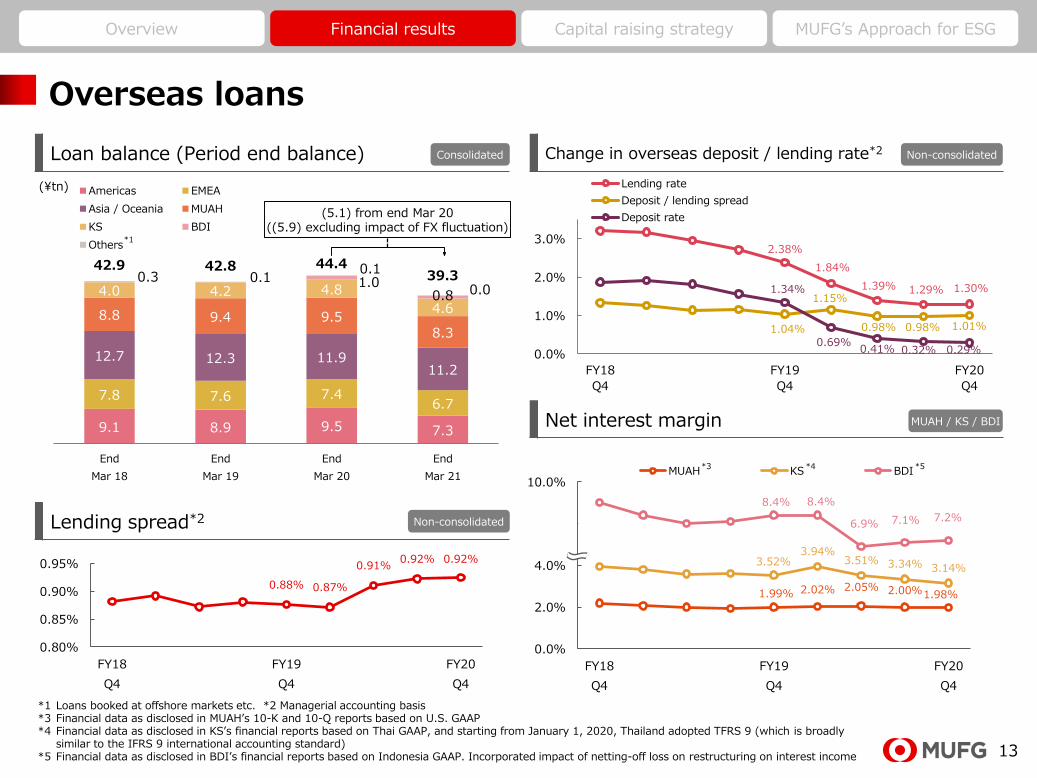
Overseas loans
Loan balance (Period end balance) Change in overseas deposit / lending rate*2
Net interest margin
(¥tn)
*1 Loans booked at offshore markets etc. *2 Managerial accounting basis*3 Financial data as disclosed in MUAH’s 10-K and 10-Q reports based on U.S. GAAP*4 Financial data as disclosed in KS’s financial reports based on Thai GAAP, and starting from January 1, 2020, Thailand adopted TFRS 9 (which is broadly
similar to the IFRS 9 international accounting standard)*5 Financial data as disclosed in BDI’s financial reports based on Indonesia GAAP. Incorporated impact of netting-off loss on restructuring on interest income
9.1 8.9 9.5 7.3
7.8 7.6 7.46.7
12.7 12.3 11.911.2
8.8 9.4 9.58.3
4.0 4.2 4.8
4.6
1.00.8
0.3 0.10.1
0.0
42.9 42.8 44.439.3
End
Mar 18
End
Mar 19
End
Mar 20
End
Mar 21
Americas EMEA
Asia / Oceania MUAH
KS BDI
Others 2.38%
1.84%
1.39% 1.29% 1.30%
1.04%
1.15%
0.98% 0.98% 1.01%
1.34%
0.69%0.41% 0.32% 0.29%0.0%
1.0%
2.0%
3.0%
FY18
Q4
FY19
Q4
FY20
Q4
Lending rate
Deposit / lending spread
Deposit rate
*1
MUAH / KS / BDI
Consolidated Non-consolidated
(5.1) from end Mar 20 ((5.9) excluding impact of FX fluctuation)
0.88% 0.87%
0.91%0.92% 0.92%
0.80%
0.85%
0.90%
0.95%
FY18
Q4
FY19
Q4
FY20
Q4
Lending spread*2 Non-consolidated
1.99% 2.02% 2.05% 2.00%1.98%
3.52%3.94%
3.51% 3.34% 3.14%
0.0%
2.0%
4.0%
6.0%
10.0%
FY18
Q4
FY19
Q4
FY20
Q4
MUAH KS BDI*3 *4 *5
7.1%
8.4% 8.4%
6.9%7.2%
14
Overview Financial results Capital raising strategy MUFG’s Approach for ESG
Average credit cost ratio after FY06
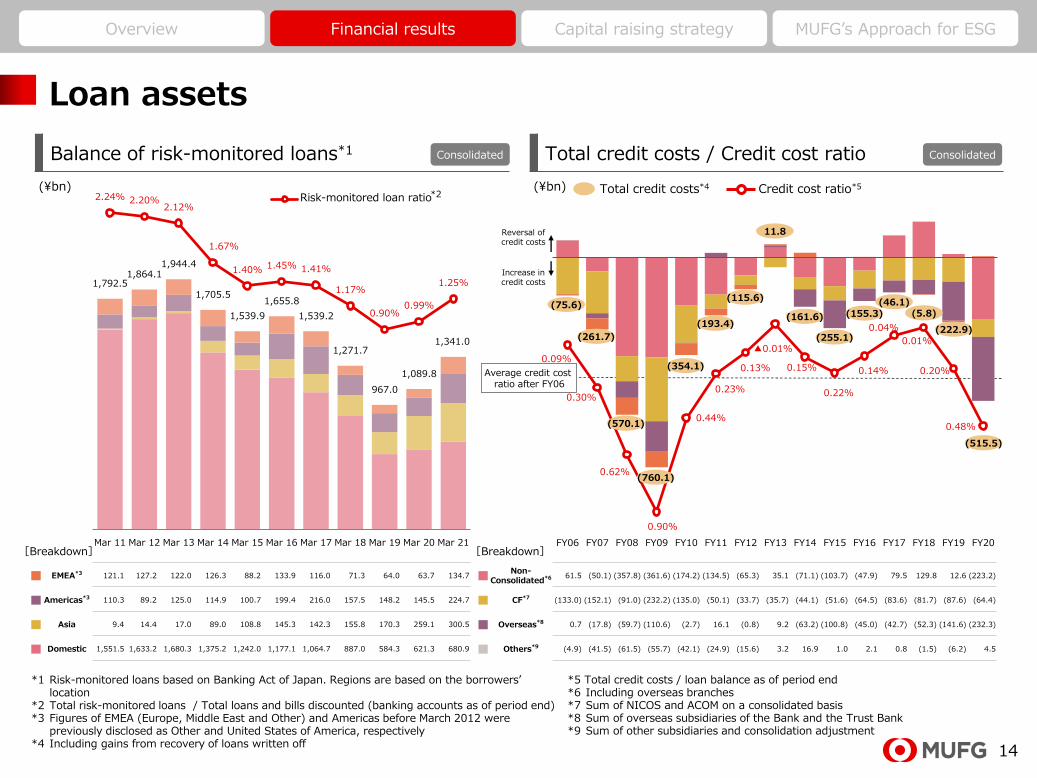
Loan assets
Balance of risk-monitored loans*1 Total credit costs / Credit cost ratio
(¥bn)
*1 Risk-monitored loans based on Banking Act of Japan. Regions are based on the borrowers’ location
*2 Total risk-monitored loans / Total loans and bills discounted (banking accounts as of period end)*3 Figures of EMEA (Europe, Middle East and Other) and Americas before March 2012 were
previously disclosed as Other and United States of America, respectively*4 Including gains from recovery of loans written off
*5 Total credit costs / loan balance as of period end*6 Including overseas branches*7 Sum of NICOS and ACOM on a consolidated basis *8 Sum of overseas subsidiaries of the Bank and the Trust Bank*9 Sum of other subsidiaries and consolidation adjustment
[Breakdown]
EMEA*3 121.1 127.2 122.0 126.3 88.2 133.9 116.0 71.3 64.0 63.7 134.7
Americas*3 110.3 89.2 125.0 114.9 100.7 199.4 216.0 157.5 148.2 145.5 224.7
Asia 9.4 14.4 17.0 89.0 108.8 145.3 142.3 155.8 170.3 259.1 300.5
Domestic 1,551.5 1,633.2 1,680.3 1,375.2 1,242.0 1,177.1 1,064.7 887.0 584.3 621.3 680.9
Non-Consolidated*6 61.5 (50.1) (357.8) (361.6) (174.2) (134.5) (65.3) 35.1 (71.1) (103.7) (47.9) 79.5 129.8 12.6 (223.2)
CF*7 (133.0) (152.1) (91.0) (232.2) (135.0) (50.1) (33.7) (35.7) (44.1) (51.6) (64.5) (83.6) (81.7) (87.6) (64.4)
Overseas*8 0.7 (17.8) (59.7) (110.6) (2.7) 16.1 (0.8) 9.2 (63.2) (100.8) (45.0) (42.7) (52.3) (141.6) (232.3)
Others*9 (4.9) (41.5) (61.5) (55.7) (42.1) (24.9) (15.6) 3.2 16.9 1.0 2.1 0.8 (1.5) (6.2) 4.5
(¥bn)
[Breakdown]
Consolidated Consolidated
Total credit costs*4
Reversal ofcredit costs
Increase incredit costs
Credit cost ratio*5
0.09%
0.30%
0.62%
0.90%
0.44%
0.23%
0.13%
▲0.01%
0.15%
0.22%
0.14%
0.04%
0.01%
0.20%
0.48%
FY06 FY07 FY08 FY09 FY10 FY11 FY12 FY13 FY14 FY15 FY16 FY17 FY18 FY19 FY20
1,792.51,864.1
1,944.4
1,705.5
1,539.9
1,655.8
1,539.2
1,271.7
967.0
1,089.8
1,341.0
2.24% 2.20%2.12%
1.67%
1.40% 1.45% 1.41%
1.17%
0.90%0.99%
1.25%
0
5,000
10,000
15,000
20,000
25,000
Mar 11 Mar 12 Mar 13 Mar 14 Mar 15 Mar 16 Mar 17 Mar 18 Mar 19 Mar 20 Mar 21
Risk-monitored loan ratio*2
(155.3)
(255.1)
(161.6)
(115.6)
(193.4)
(354.1)
(760.1)
(570.1)
(261.7)
(75.6)
11.8
(46.1)(5.8)
(222.9)
(515.5)
15
Overview Financial results Capital raising strategy MUFG’s Approach for ESG
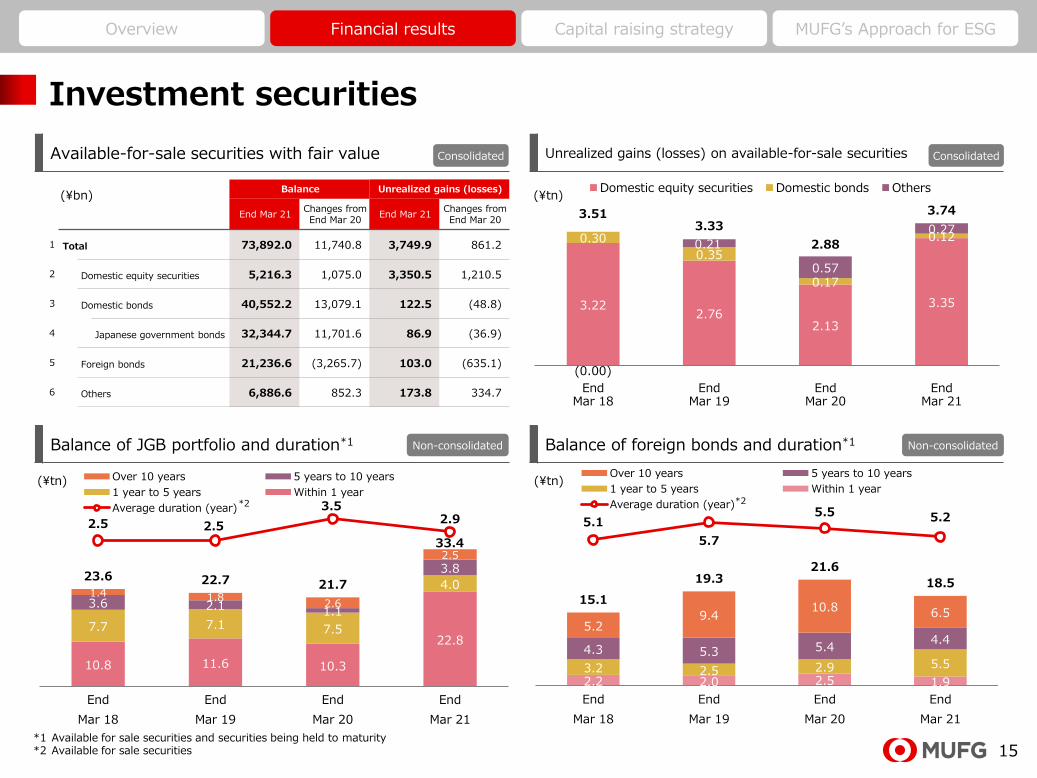
Balance Unrealized gains (losses)
End Mar 21Changes fromEnd Mar 20
End Mar 21Changes fromEnd Mar 20
1 Total 73,892.0 11,740.8 3,749.9 861.2
2 Domestic equity securities 5,216.3 1,075.0 3,350.5 1,210.5
3 Domestic bonds 40,552.2 13,079.1 122.5 (48.8)
4 Japanese government bonds 32,344.7 11,701.6 86.9 (36.9)
5 Foreign bonds 21,236.6 (3,265.7) 103.0 (635.1)
6 Others 6,886.6 852.3 173.8 334.7
Investment securities
Available-for-sale securities with fair value Unrealized gains (losses) on available-for-sale securities
Balance of JGB portfolio and duration*1 Balance of foreign bonds and duration*1
*1 Available for sale securities and securities being held to maturity*2 Available for sale securities
(¥bn)
3.22 2.76
2.13
3.35
0.30
0.35
0.17
0.12
(0.00)
0.21
0.57
0.27
3.513.33
2.88
3.74
EndMar 18
EndMar 19
EndMar 20
EndMar 21
Domestic equity securities Domestic bonds Others(¥tn)
(¥tn)(¥tn)
Consolidated Consolidated
Non-consolidated Non-consolidated
10.8 11.6 10.3
22.87.7 7.1 7.5
4.0
3.6 2.1 1.1
3.8
1.4 1.82.6
2.5
23.6 22.7 21.7
33.4
2.5 2.5
3.52.9
0
10
20
30
40
End
Mar 18
End
Mar 19
End
Mar 20
End
Mar 21
Over 10 years 5 years to 10 years
1 year to 5 years Within 1 year
Average duration (year)*2
2.2 2.0 2.5 1.9 3.2 2.5 2.9 5.5 4.3 5.3 5.4
4.4 5.2
9.4 10.8 6.5
15.1
19.3 21.6
18.5
5.1
5.7
5.5 5.2
0
10
20
30
End
Mar 18
End
Mar 19
End
Mar 20
End
Mar 21
Over 10 years 5 years to 10 years
1 year to 5 years Within 1 year
Average duration (year)*2
16
Overview Financial results Capital raising strategy MUFG’s Approach for ESG
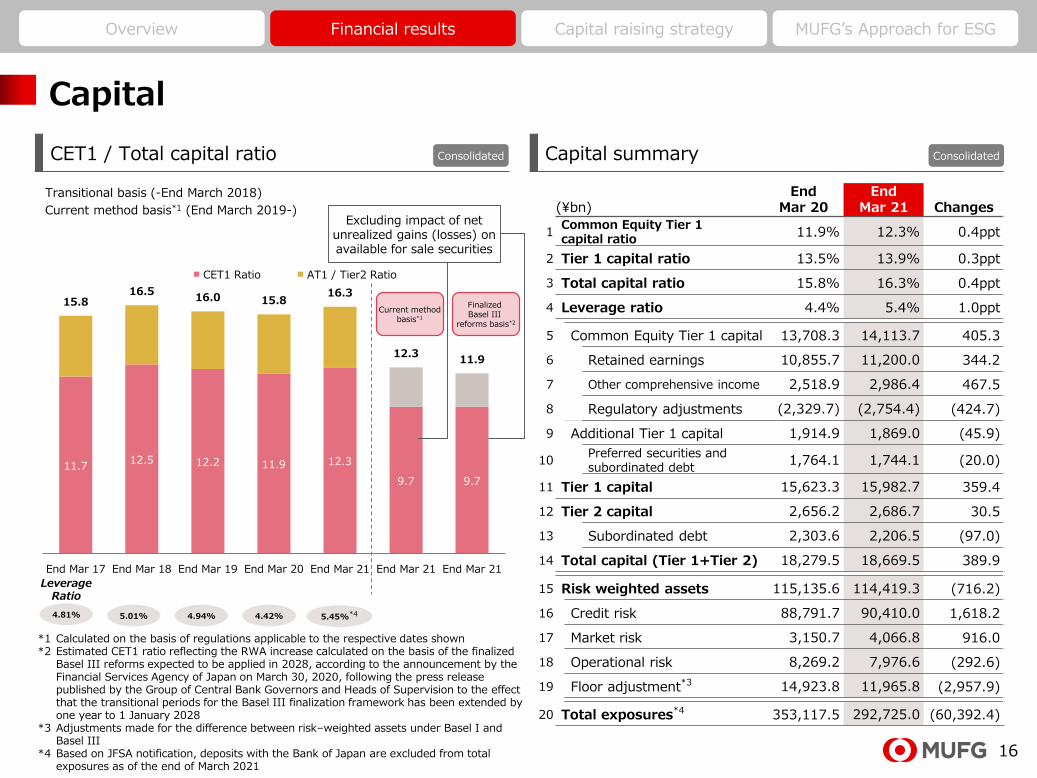
11.7 12.5 12.2 11.9 12.3
9.7 9.7
15.8 16.5
16.0 15.8 16.3
12.3 11.9
End Mar 17 End Mar 18 End Mar 19 End Mar 20 End Mar 21 End Mar 21 End Mar 21
CET1 Ratio AT1 / Tier2 Ratio
Capital
CET1 / Total capital ratio Capital summary
*1 Calculated on the basis of regulations applicable to the respective dates shown*2 Estimated CET1 ratio reflecting the RWA increase calculated on the basis of the finalized
Basel III reforms expected to be applied in 2028, according to the announcement by the Financial Services Agency of Japan on March 30, 2020, following the press release published by the Group of Central Bank Governors and Heads of Supervision to the effect that the transitional periods for the Basel III finalization framework has been extended by one year to 1 January 2028
*3 Adjustments made for the difference between risk–weighted assets under Basel I and Basel III
*4 Based on JFSA notification, deposits with the Bank of Japan are excluded from total exposures as of the end of March 2021
Transitional basis (-End March 2018)
Current method basis*1 (End March 2019-)Excluding impact of net
unrealized gains (losses) on available for sale securities
LeverageRatio
4.81% 5.01% 4.94% 4.42%
(¥bn)End
Mar 20End
Mar 21 Changes
1Common Equity Tier 1 capital ratio
11.9% 12.3% 0.4ppt
2 Tier 1 capital ratio 13.5% 13.9% 0.3ppt
3 Total capital ratio 15.8% 16.3% 0.4ppt
4 Leverage ratio 4.4% 5.4% 1.0ppt
5 Common Equity Tier 1 capital 13,708.3 14,113.7 405.3
6 Retained earnings 10,855.7 11,200.0 344.2
7 Other comprehensive income 2,518.9 2,986.4 467.5
8 Regulatory adjustments (2,329.7) (2,754.4) (424.7)
9 Additional Tier 1 capital 1,914.9 1,869.0 (45.9)
10Preferred securities and subordinated debt
1,764.1 1,744.1 (20.0)
11 Tier 1 capital 15,623.3 15,982.7 359.4
12 Tier 2 capital 2,656.2 2,686.7 30.5
13 Subordinated debt 2,303.6 2,206.5 (97.0)
14 Total capital (Tier 1+Tier 2) 18,279.5 18,669.5 389.9
15 Risk weighted assets 115,135.6 114,419.3 (716.2)
16 Credit risk 88,791.7 90,410.0 1,618.2
17 Market risk 3,150.7 4,066.8 916.0
18 Operational risk 8,269.2 7,976.6 (292.6)
19 Floor adjustment*3 14,923.8 11,965.8 (2,957.9)
20 Total exposures*4 353,117.5 292,725.0 (60,392.4)
Finalized Basel III
reforms basis*2
Consolidated Consolidated
Current methodbasis*1
5.45%*4
17
Overview Financial results Capital raising strategy MUFG’s Approach for ESG
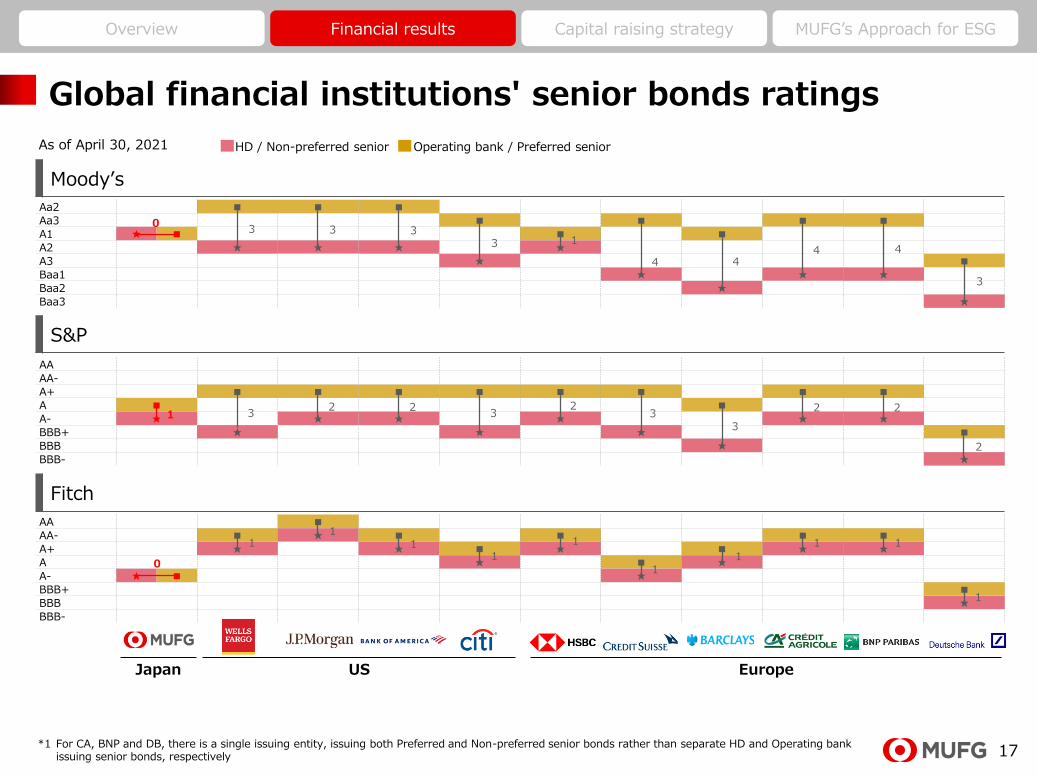
AA ■
AA- ■ ★ ■ ■ ■ ■
A+ ★ ★ ■ ★ ■ ★ ★
A ★ ■ ★
A- ★ ■ ★
BBB+ ■
BBB ★
BBB-
Global financial institutions' senior bonds ratings
Moody’s
As of April 30, 2021 HD / Non-preferred senior Operating bank / Preferred senior
Aa2 ■ ■ ■
Aa3 ■ ■ ■ ■
A1 ★ ■ ■ ■
A2 ★ ★ ★ ★
A3 ★ ■
Baa1 ★ ★ ★
Baa2 ★
Baa3 ★
03 3 3
3 1
4 44 4
3
S&P
AA
AA-
A+ ■ ■ ■ ■ ■ ■ ■ ■
A ■ ■
A- ★ ★ ★ ★ ★ ★
BBB+ ★ ★ ★ ■
BBB ★
BBB- ★
1 32 2
32
33
2 2
2
Fitch
Japan US Europe
01
11
11
1
1
*1 For CA, BNP and DB, there is a single issuing entity, issuing both Preferred and Non-preferred senior bonds rather than separate HD and Operating bank issuing senior bonds, respectively
11 1
18
Section 3 Capital raising strategy
19
Overview Financial results Capital raising strategy MUFG’s Approach for ESG
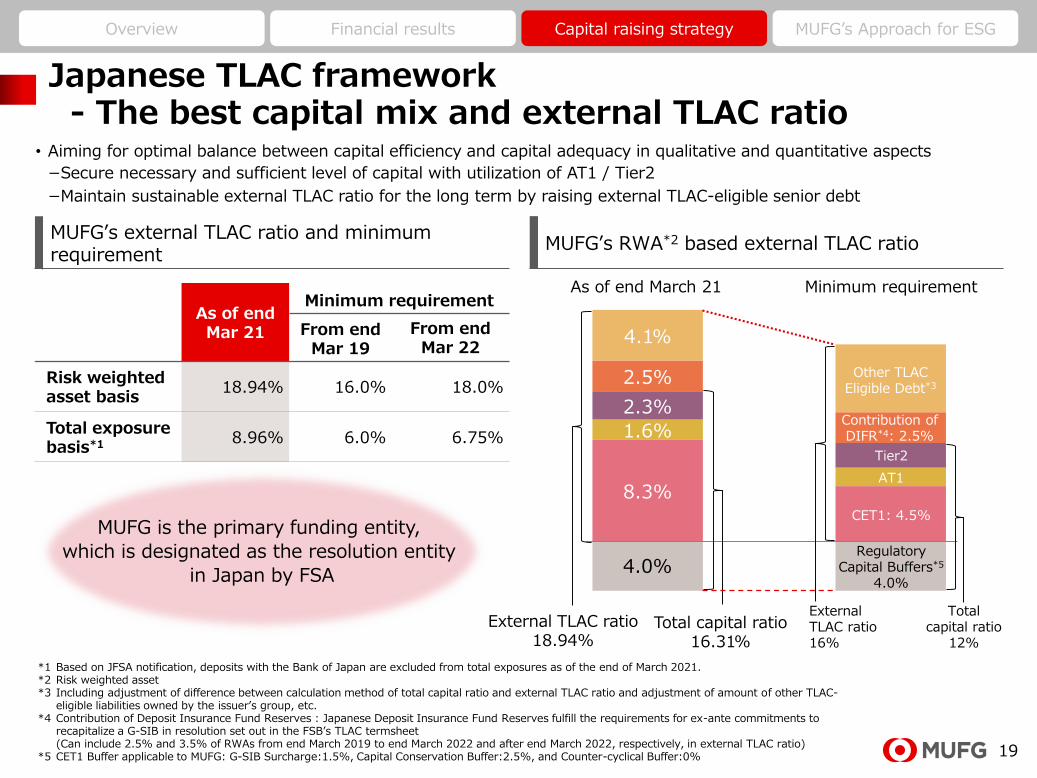
Japanese TLAC framework- The best capital mix and external TLAC ratio
MUFG’s external TLAC ratio and minimum requirement
MUFG’s RWA*2 based external TLAC ratio
MUFG is the primary funding entity,
which is designated as the resolution entity
in Japan by FSA
As of end Mar 21
Minimum requirement
From end Mar 19
From end Mar 22
Risk weighted asset basis
18.94% 16.0% 18.0%
Total exposurebasis*1 8.96% 6.0% 6.75%
*1 Based on JFSA notification, deposits with the Bank of Japan are excluded from total exposures as of the end of March 2021.*2 Risk weighted asset*3 Including adjustment of difference between calculation method of total capital ratio and external TLAC ratio and adjustment of amount of other TLAC-
eligible liabilities owned by the issuer’s group, etc. *4 Contribution of Deposit Insurance Fund Reserves : Japanese Deposit Insurance Fund Reserves fulfill the requirements for ex-ante commitments to
recapitalize a G-SIB in resolution set out in the FSB’s TLAC termsheet(Can include 2.5% and 3.5% of RWAs from end March 2019 to end March 2022 and after end March 2022, respectively, in external TLAC ratio)
*5 CET1 Buffer applicable to MUFG: G-SIB Surcharge:1.5%, Capital Conservation Buffer:2.5%, and Counter-cyclical Buffer:0%
• Aiming for optimal balance between capital efficiency and capital adequacy in qualitative and quantitative aspects
−Secure necessary and sufficient level of capital with utilization of AT1 / Tier2
−Maintain sustainable external TLAC ratio for the long term by raising external TLAC-eligible senior debt
8.3%
1.6%
2.3%
2.5%
4.1%
Regulatory Capital Buffers*5
4.0%
CET1: 4.5%
AT1
Tier2
Contribution of DIFR*4: 2.5%
Other TLAC Eligible Debt*3
As of end March 21 Minimum requirement
Totalcapital ratio
12%
Total capital ratio16.31%
External TLAC ratio18.94%
ExternalTLAC ratio16%
4.0%
20
Overview Financial results Capital raising strategy MUFG’s Approach for ESG
4.1 3.6 2.91.4
2.5
0.52.3 1.5
0.51.4 1.6
2.71.4
2.21.0 0.3
3.1 3.7
2.9
1.2
2.3
1.9
4.54.5
0.9
2.2 2.11.5
1.00.4
0.91.5
7.2 7.3
5.8
2.6
4.7
2.5
6.86.0
1.4
3.6 3.74.2
2.4 2.61.9 1.8
0
5
10
FY15 FY16 FY17 FY18 FY19 FY20 FY21 FY22 FY23 FY24 FY25 FY26 FY27 FY28 FY29 FY30
AT1 Tier2
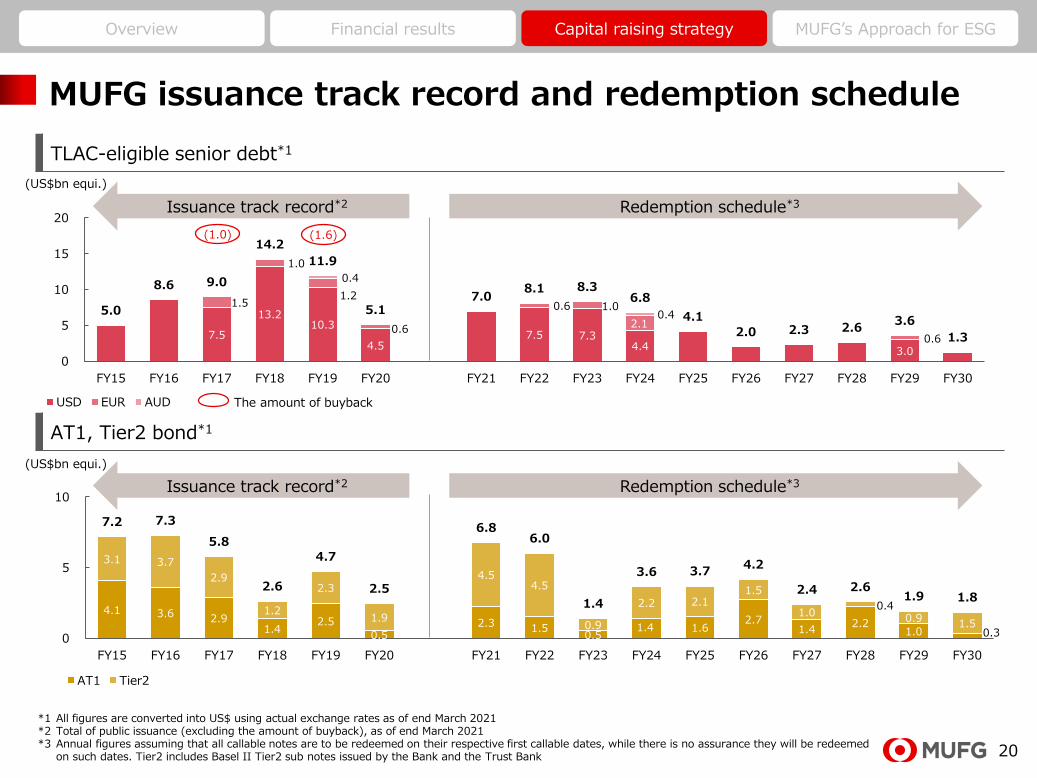
MUFG issuance track record and redemption schedule
TLAC-eligible senior debt*1
*1 All figures are converted into US$ using actual exchange rates as of end March 2021*2 Total of public issuance (excluding the amount of buyback), as of end March 2021 *3 Annual figures assuming that all callable notes are to be redeemed on their respective first callable dates, while there is no assurance they will be redeemed
on such dates. Tier2 includes Basel II Tier2 sub notes issued by the Bank and the Trust Bank
(US$bn equi.)
Redemption schedule*3Issuance track record*2
AT1, Tier2 bond*1
(US$bn equi.)
Redemption schedule*3Issuance track record*2
The amount of buyback
(1.0) (1.6)
7.5
13.210.3
4.57.5 7.3
4.4 3.0
1.5
1.0
1.2
0.6
0.6 1.0
2.1
0.6
0.4
0.45.0
8.6 9.0
14.2
11.9
5.1 7.0
8.1 8.3 6.8
4.1
2.0 2.3 2.6 3.6
1.3
0
5
10
15
20
FY15 FY16 FY17 FY18 FY19 FY20 FY21 FY22 FY23 FY24 FY25 FY26 FY27 FY28 FY29 FY30
USD EUR AUD
21
Overview Financial results Capital raising strategy MUFG’s Approach for ESG
FY20
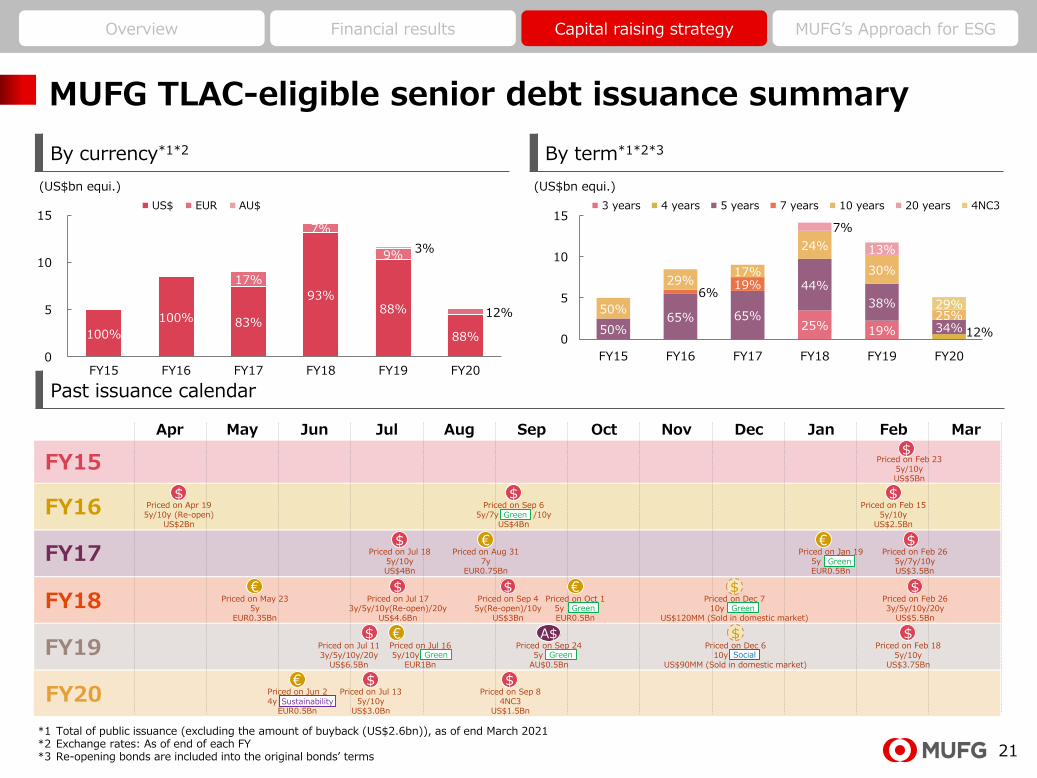
MUFG TLAC-eligible senior debt issuance summary
By currency*1*2 By term*1*2*3
(US$bn equi.)
*1 Total of public issuance (excluding the amount of buyback (US$2.6bn)), as of end March 2021*2 Exchange rates: As of end of each FY*3 Re-opening bonds are included into the original bonds’ terms
25% 19% 12%50%65% 65%
44%
38%
34%
6%19%
50%
29%17%
24%
30%
25%
7%
13%
29%
0
5
10
15
FY15 FY16 FY17 FY18 FY19 FY20
100%
100% 83%
93%88%
88%
17%
7%
9%
12%
3%
0
5
10
15
FY15 FY16 FY17 FY18 FY19 FY20
EUR AU$US$ 3 years 5 years 7 years 10 years 20 years
Past issuance calendar
FY19
FY15
FY16
FY17
FY18
Apr May Jun Jul Aug OctSep Nov Dec Jan Feb Mar
Priced on Feb 235y/10yUS$5Bn
Priced on Apr 195y/10y (Re-open)
US$2Bn
$Priced on Sep 6
5y/7y /10yUS$4Bn
Priced on Feb 155y/10y
US$2.5Bn
Priced on Jul 185y/10yUS$4Bn
Priced on Aug 317y
EUR0.75Bn
Priced on Jan 195y EUR0.5Bn
Priced on Feb 265y/7y/10yUS$3.5Bn
Priced on Jul 173y/5y/10y(Re-open)/20y
US$4.6Bn
Priced on May 235y
EUR0.35Bn
Priced on Sep 45y(Re-open)/10y
US$3Bn
Priced on Oct 15y EUR0.5Bn
Priced on Feb 263y/5y/10y/20y
US$5.5Bn
$Priced on Dec 7
10y US$120MM (Sold in domestic market)
Priced on Jul 113y/5y/10y/20y
US$6.5Bn
Priced on Jul 165y/10y
EUR1Bn
(US$bn equi.)
Priced on Sep 245y
AU$0.5Bn
A$Priced on Dec 6
10y US$90MM (Sold in domestic market)
Priced on Feb 185y/10y
US$3.75Bn
Green
GreenGreen
Green
Green Green Social
$ $
$
$€$ €
$€ $ € $
$$ € $
$€ $Priced on Jun 24y
EUR0.5BnSustainability
Priced on Jul 135y/10y
US$3.0Bn
Priced on Sep 84NC3
US$1.5Bn
4 years 4NC3
22
Overview Financial results Capital raising strategy MUFG’s Approach for ESG
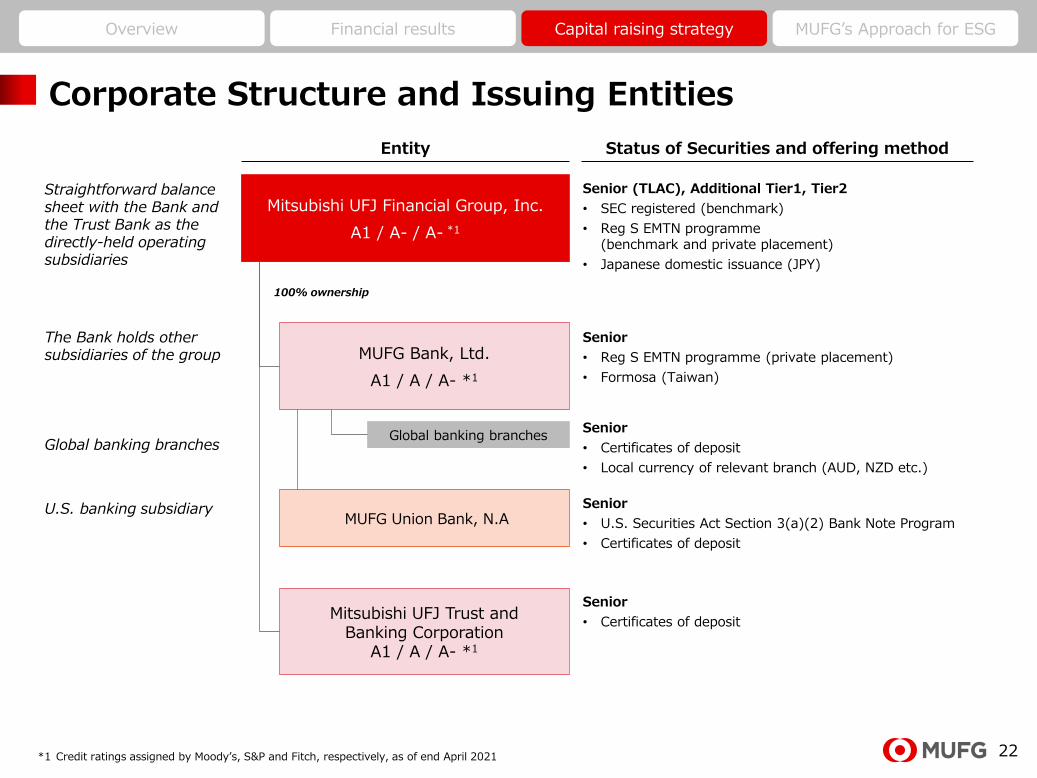
Corporate Structure and Issuing Entities
Mitsubishi UFJ Financial Group, Inc.
A1 / A- / A- *1
Global banking branches
Straightforward balance sheet with the Bank and the Trust Bank as the directly-held operating subsidiaries
The Bank holds other subsidiaries of the group
Global banking branches
MUFG Bank, Ltd.
A1 / A / A- *1
MUFG Union Bank, N.A
Senior (TLAC), Additional Tier1, Tier2
• SEC registered (benchmark)
• Reg S EMTN programme(benchmark and private placement)
• Japanese domestic issuance (JPY)
Senior
• Reg S EMTN programme (private placement)
• Formosa (Taiwan)
100% ownership
U.S. banking subsidiary Senior
• U.S. Securities Act Section 3(a)(2) Bank Note Program
• Certificates of deposit
Mitsubishi UFJ Trust and Banking Corporation
A1 / A / A- *1
Senior
• Certificates of deposit
*1 Credit ratings assigned by Moody’s, S&P and Fitch, respectively, as of end April 2021
Senior
• Certificates of deposit
• Local currency of relevant branch (AUD, NZD etc.)
Entity Status of Securities and offering method
23
Section 4 MUFG’s Approach for ESG
24
Overview Financial results Capital raising strategy MUFG’s Approach for ESG
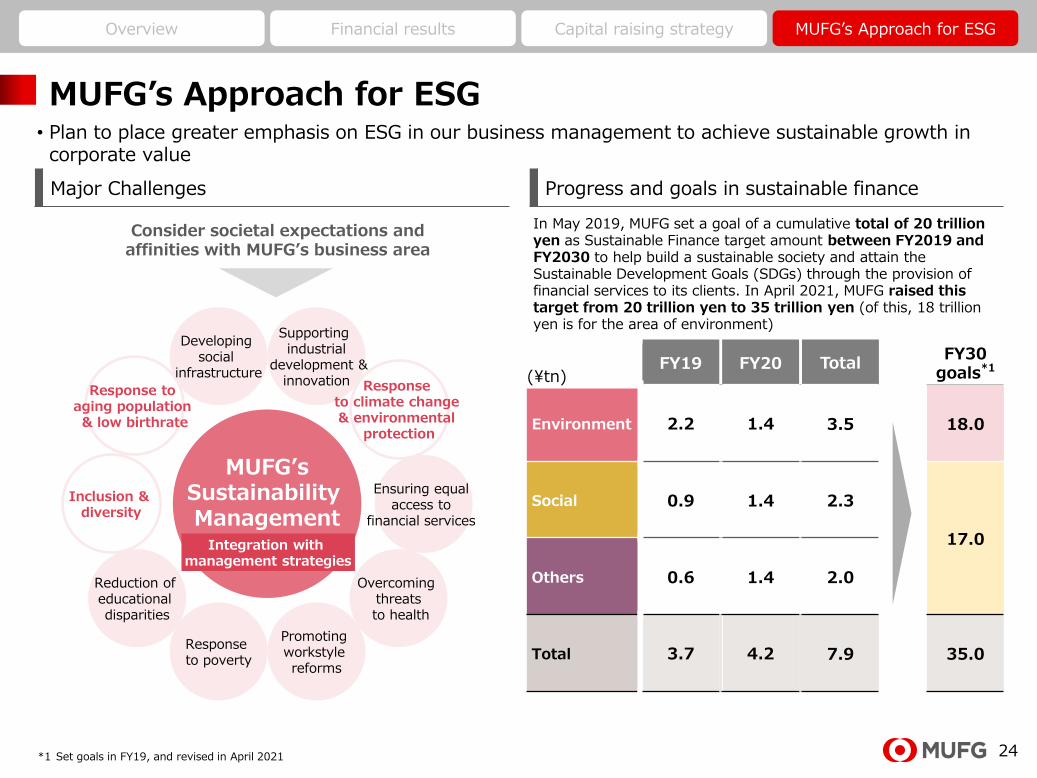
MUFG’s Approach for ESG
Major Challenges Progress and goals in sustainable finance
• Plan to place greater emphasis on ESG in our business management to achieve sustainable growth in corporate value
(¥tn)FY19 FY20 Total
FY30 goals*1
Environment 2.2 1.4 3.5 18.0
Social 0.9 1.4 2.3
17.0
Others 0.6 1.4 2.0
Total 3.7 4.2 7.9 35.0
*1 Set goals in FY19, and revised in April 2021
In May 2019, MUFG set a goal of a cumulative total of 20 trillion yen as Sustainable Finance target amount between FY2019 and FY2030 to help build a sustainable society and attain the Sustainable Development Goals (SDGs) through the provision of financial services to its clients. In April 2021, MUFG raised this target from 20 trillion yen to 35 trillion yen (of this, 18 trillion yen is for the area of environment)
MUFG’sSustainability Management
Ensuring equal access to
financial services
Inclusion & diversity
Overcoming threatsto health
Reduction of educational disparities
Response to aging population & low birthrate
Promoting workstyle reforms
Response to poverty
Developing social
infrastructure
Integration with management strategies
Consider societal expectations and affinities with MUFG’s business area
Supporting industrial
development &innovation Response
to climate change & environmental
protection
25
Overview Financial results Capital raising strategy MUFG’s Approach for ESG
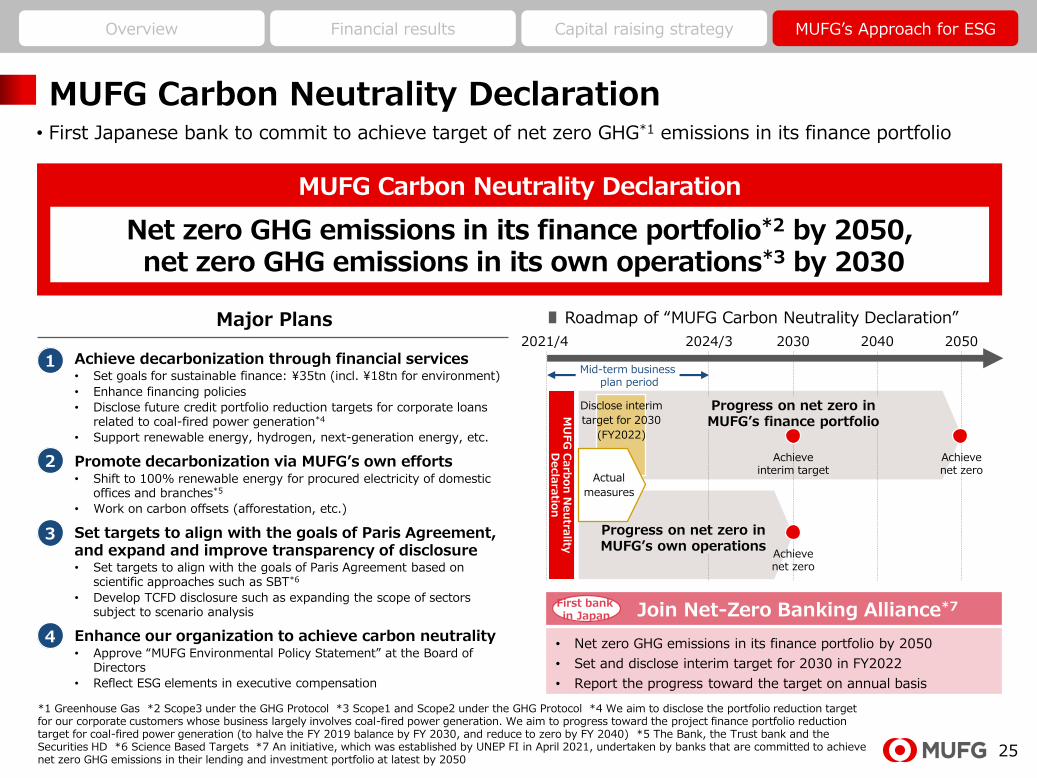
MUFG Carbon Neutrality Declaration• First Japanese bank to commit to achieve target of net zero GHG*1 emissions in its finance portfolio
MUFG Carbon Neutrality Declaration
Net zero GHG emissions in its finance portfolio*2 by 2050,net zero GHG emissions in its own operations*3 by 2030
∎ Roadmap of “MUFG Carbon Neutrality Declaration”
Join Net-Zero Banking Alliance*7
• Net zero GHG emissions in its finance portfolio by 2050
• Set and disclose interim target for 2030 in FY2022
• Report the progress toward the target on annual basis
First bank in Japan
1
2
3
4
Achieve decarbonization through financial services• Set goals for sustainable finance: ¥35tn (incl. ¥18tn for environment)
• Enhance financing policies
• Disclose future credit portfolio reduction targets for corporate loans related to coal-fired power generation*4
• Support renewable energy, hydrogen, next-generation energy, etc.
Promote decarbonization via MUFG’s own efforts• Shift to 100% renewable energy for procured electricity of domestic
offices and branches*5
• Work on carbon offsets (afforestation, etc.)
Set targets to align with the goals of Paris Agreement, and expand and improve transparency of disclosure• Set targets to align with the goals of Paris Agreement based on
scientific approaches such as SBT*6
• Develop TCFD disclosure such as expanding the scope of sectors subject to scenario analysis
Enhance our organization to achieve carbon neutrality• Approve “MUFG Environmental Policy Statement” at the Board of
Directors
• Reflect ESG elements in executive compensation
Major Plans2021/4 20502024/3 2030 2040
Mid-term businessplan period
MU
FG
Carb
on
Neu
trality
Decla
ratio
n
Achieveinterim target
Achievenet zero
Achievenet zero
Progress on net zero inMUFG’s finance portfolio
Progress on net zero inMUFG’s own operations
Disclose interim
target for 2030
(FY2022)
Actual
measures
*1 Greenhouse Gas *2 Scope3 under the GHG Protocol *3 Scope1 and Scope2 under the GHG Protocol *4 We aim to disclose the portfolio reduction target for our corporate customers whose business largely involves coal-fired power generation. We aim to progress toward the project finance portfolio reduction target for coal-fired power generation (to halve the FY 2019 balance by FY 2030, and reduce to zero by FY 2040) *5 The Bank, the Trust bank and the Securities HD *6 Science Based Targets *7 An initiative, which was established by UNEP FI in April 2021, undertaken by banks that are committed to achieve net zero GHG emissions in their lending and investment portfolio at latest by 2050
26
Overview Financial results Capital raising strategy MUFG’s Approach for ESG
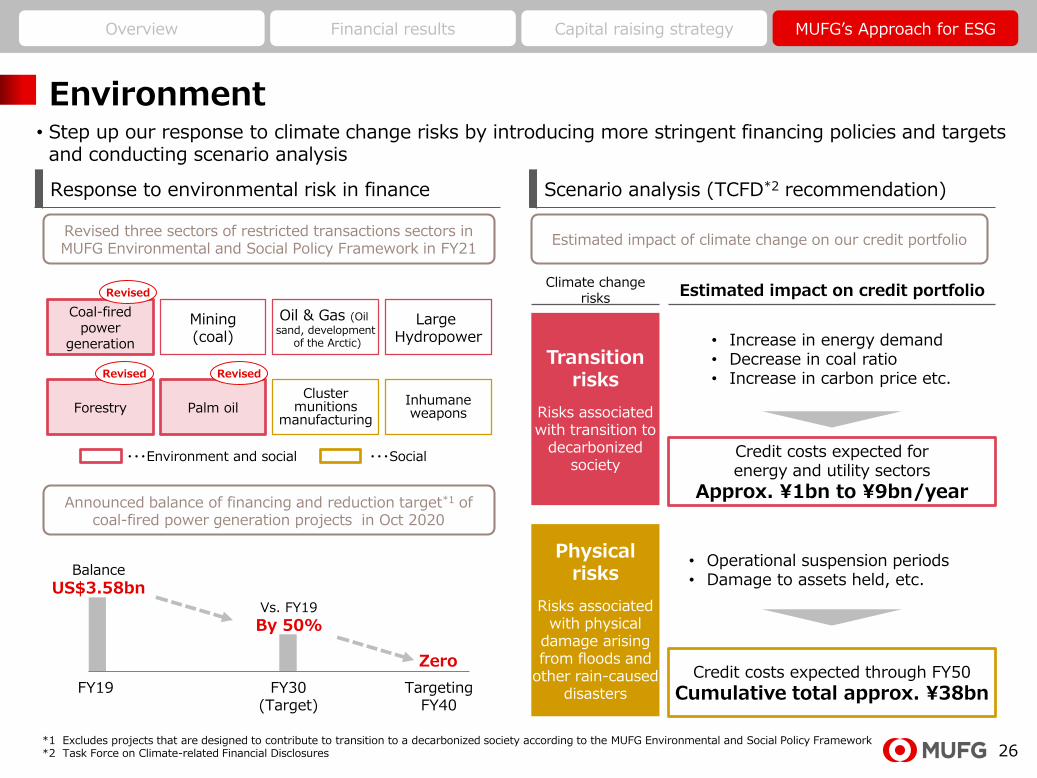
Environment
Estimated impact of climate change on our credit portfolioRevised three sectors of restricted transactions sectors in MUFG Environmental and Social Policy Framework in FY21
Coal-fired power
generation
Forestry
Mining(coal)
Palm oil
Oil & Gas (Oil
sand, developmentof the Arctic)
Cluster munitions
manufacturing
Large Hydropower
Inhumane weapons
Revised Revised
Revised
・・・Environment and social ・・・Social
Response to environmental risk in finance Scenario analysis (TCFD*2 recommendation)
• Step up our response to climate change risks by introducing more stringent financing policies and targets and conducting scenario analysis
FY19 FY30(Target)
TargetingFY40
Balance
US$3.58bnVs. FY19
By 50%
Zero
Announced balance of financing and reduction target*1 of coal-fired power generation projects in Oct 2020
*1 Excludes projects that are designed to contribute to transition to a decarbonized society according to the MUFG Environmental and Social Policy Framework*2 Task Force on Climate-related Financial Disclosures
Estimated impact on credit portfolio
Transition risks
Risks associated with transition to
decarbonized society
Physical risks
Risks associated with physical
damage arising from floods and
other rain-causeddisasters
Credit costs expected for energy and utility sectors
Approx. ¥1bn to ¥9bn/year
Credit costs expected through FY50
Cumulative total approx. ¥38bn
Climate change risks
• Increase in energy demand• Decrease in coal ratio• Increase in carbon price etc.
• Operational suspension periods• Damage to assets held, etc.
27
Overview Financial results Capital raising strategy MUFG’s Approach for ESG
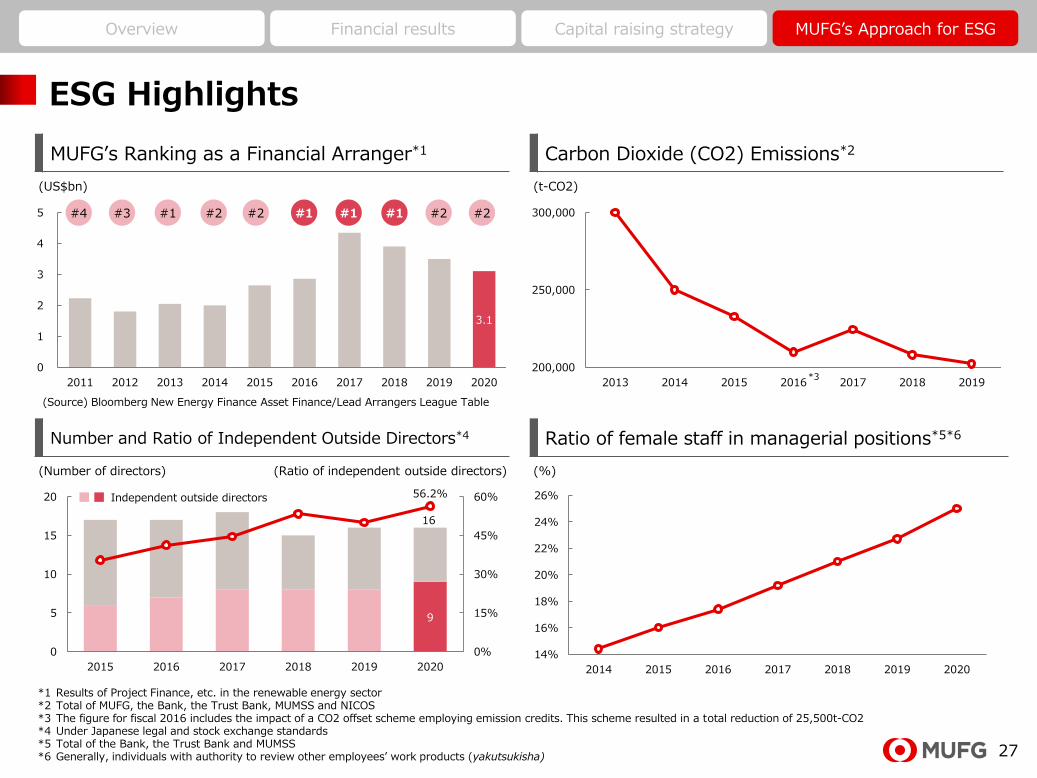
ESG Highlights
MUFG’s Ranking as a Financial Arranger*1 Carbon Dioxide (CO2) Emissions*2
3.1
0
1
2
3
4
5
2011 2012 2013 2014 2015 2016 2017 2018 2019 2020
200,000
250,000
300,000
2013 2014 2015 2016 2017 2018 2019
14%
16%
18%
20%
22%
24%
26%
2014 2015 2016 2017 2018 2019 2020
9
16
56.2%
0%
15%
30%
45%
60%
0
5
10
15
20
2015 2016 2017 2018 2019 2020
(Source) Bloomberg New Energy Finance Asset Finance/Lead Arrangers League Table
(US$bn) (t-CO2)
*3
#4 #3 #1 #2 #2 #1 #1 #2
Number and Ratio of Independent Outside Directors*4 Ratio of female staff in managerial positions*5*6
(Number of directors) (%)
*1 Results of Project Finance, etc. in the renewable energy sector*2 Total of MUFG, the Bank, the Trust Bank, MUMSS and NICOS*3 The figure for fiscal 2016 includes the impact of a CO2 offset scheme employing emission credits. This scheme resulted in a total reduction of 25,500t-CO2*4 Under Japanese legal and stock exchange standards*5 Total of the Bank, the Trust Bank and MUMSS*6 Generally, individuals with authority to review other employees’ work products (yakutsukisha)
#1
(Ratio of independent outside directors)
Independent outside directors
#2
28
Overview Financial results Capital raising strategy MUFG’s Approach for ESG
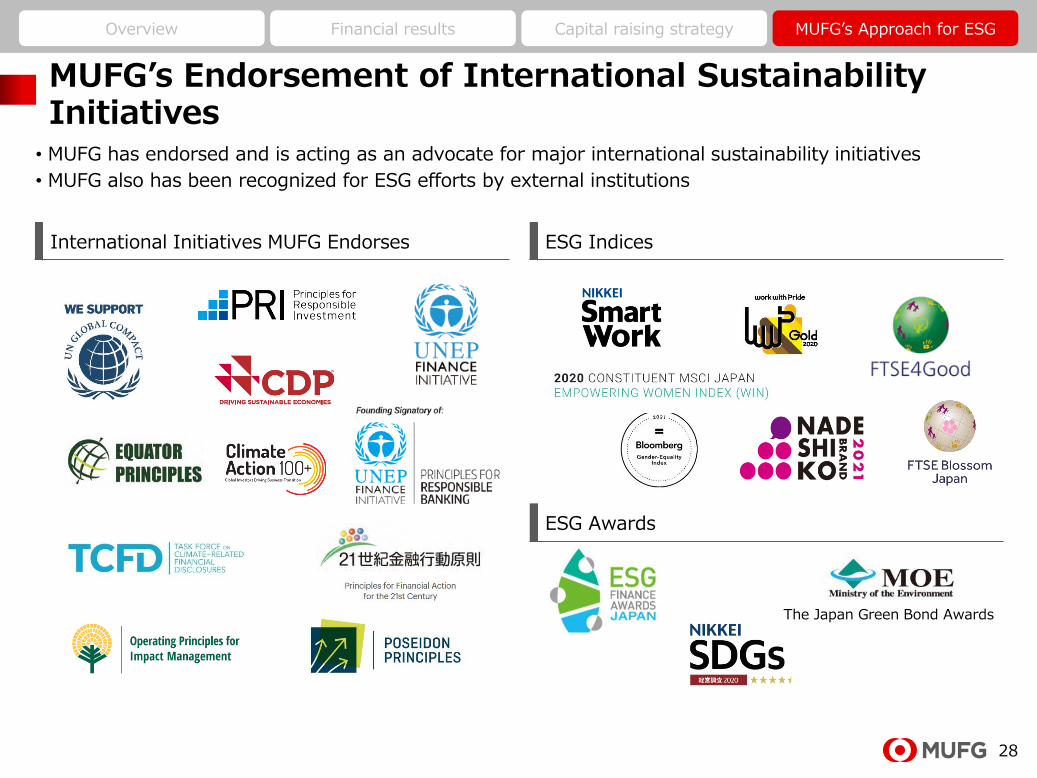
MUFG’s Endorsement of International Sustainability Initiatives
• MUFG has endorsed and is acting as an advocate for major international sustainability initiatives
• MUFG also has been recognized for ESG efforts by external institutions
International Initiatives MUFG Endorses ESG Indices
ESG Awards
The Japan Green Bond Awards
29
Overview Financial results Capital raising strategy MUFG’s Approach for ESG
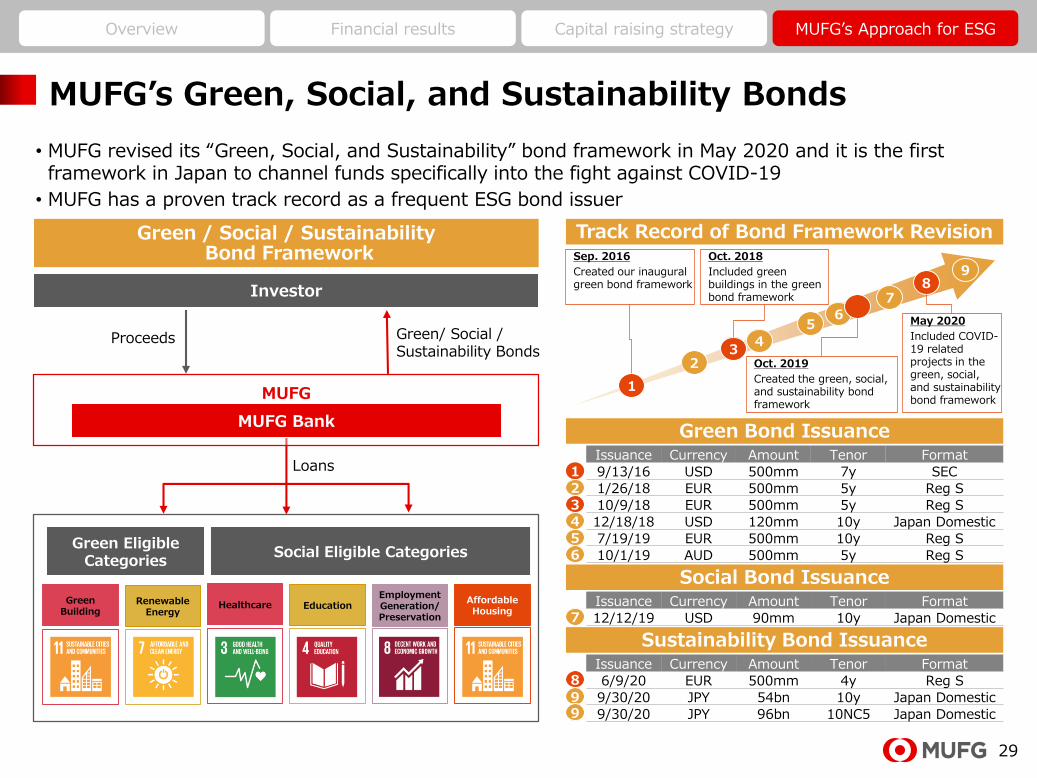
MUFG’s Green, Social, and Sustainability Bonds
• MUFG revised its “Green, Social, and Sustainability” bond framework in May 2020 and it is the first framework in Japan to channel funds specifically into the fight against COVID-19
• MUFG has a proven track record as a frequent ESG bond issuer
Loans
MUFG
MUFG Bank
Investor
Green/ Social / Sustainability Bonds
Proceeds
Green / Social / SustainabilityBond Framework
Green Bond IssuanceIssuance Currency Amount Tenor Format
9/13/16 USD 500mm 7y SEC
1/26/18 EUR 500mm 5y Reg S
10/9/18 EUR 500mm 5y Reg S
12/18/18 USD 120mm 10y Japan Domestic
7/19/19 EUR 500mm 10y Reg S
10/1/19 AUD 500mm 5y Reg S
Social Bond IssuanceIssuance Currency Amount Tenor Format
12/12/19 USD 90mm 10y Japan DomesticHealthcare Education
EmploymentGeneration/Preservation
Affordable Housing
GreenBuilding
Renewable Energy
Green Eligible Categories
Social Eligible Categories
Sustainability Bond IssuanceIssuance Currency Amount Tenor Format
6/9/20 EUR 500mm 4y Reg S
9/30/20 JPY 54bn 10y Japan Domestic
9/30/20 JPY 96bn 10NC5 Japan Domestic
Sep. 2016
Created our inauguralgreen bond framework
Oct. 2019
Created the green, social, and sustainability bond framework
Track Record of Bond Framework Revision
67
5
4
23
1
1
8
6
7
5
4
2
3
Oct. 2018
Included green buildings in the green bond framework
May 2020
Included COVID-19 related projects in the green, social, and sustainability bond framework
8
9
9
9
30
Appendix
31
Japanese TLAC framework summary
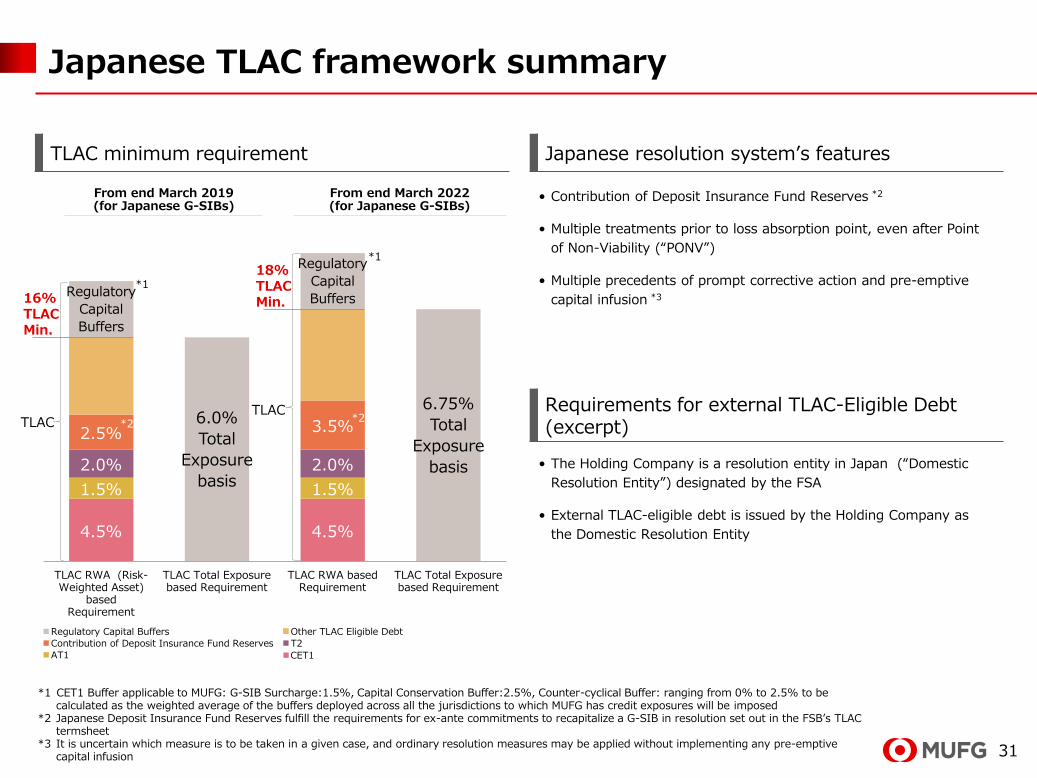
TLAC minimum requirement Japanese resolution system’s features
From end March 2019 (for Japanese G-SIBs)
From end March 2022 (for Japanese G-SIBs)
4.5% 4.5%
1.5% 1.5%
2.0% 2.0%
2.5% 3.5%6.0%
Total
Exposure
basis
6.75%
Total
Exposure
basis
Regulatory
Capital
Buffers
Regulatory
Capital
Buffers
TLAC RWA (Risk-Weighted Asset)
basedRequirement
TLAC Total Exposure based Requirement
TLAC RWA basedRequirement
TLAC Total Exposure based Requirement
Regulatory Capital Buffers Other TLAC Eligible Debt
Contribution of Deposit Insurance Fund Reserves T2
AT1 CET1
*1
*1
*2*2
16% TLAC Min.
TLAC
18% TLAC Min.
TLAC
*1 CET1 Buffer applicable to MUFG: G-SIB Surcharge:1.5%, Capital Conservation Buffer:2.5%, Counter-cyclical Buffer: ranging from 0% to 2.5% to be calculated as the weighted average of the buffers deployed across all the jurisdictions to which MUFG has credit exposures will be imposed
*2 Japanese Deposit Insurance Fund Reserves fulfill the requirements for ex-ante commitments to recapitalize a G-SIB in resolution set out in the FSB’s TLAC termsheet
*3 It is uncertain which measure is to be taken in a given case, and ordinary resolution measures may be applied without implementing any pre-emptive capital infusion
• Contribution of Deposit Insurance Fund Reserves *2
• Multiple treatments prior to loss absorption point, even after Point
of Non-Viability (“PONV”)
• Multiple precedents of prompt corrective action and pre-emptive
capital infusion *3
Requirements for external TLAC-Eligible Debt (excerpt)
• The Holding Company is a resolution entity in Japan (“Domestic
Resolution Entity”) designated by the FSA
• External TLAC-eligible debt is issued by the Holding Company as
the Domestic Resolution Entity
32
Multiple treatments prior to loss absorption point
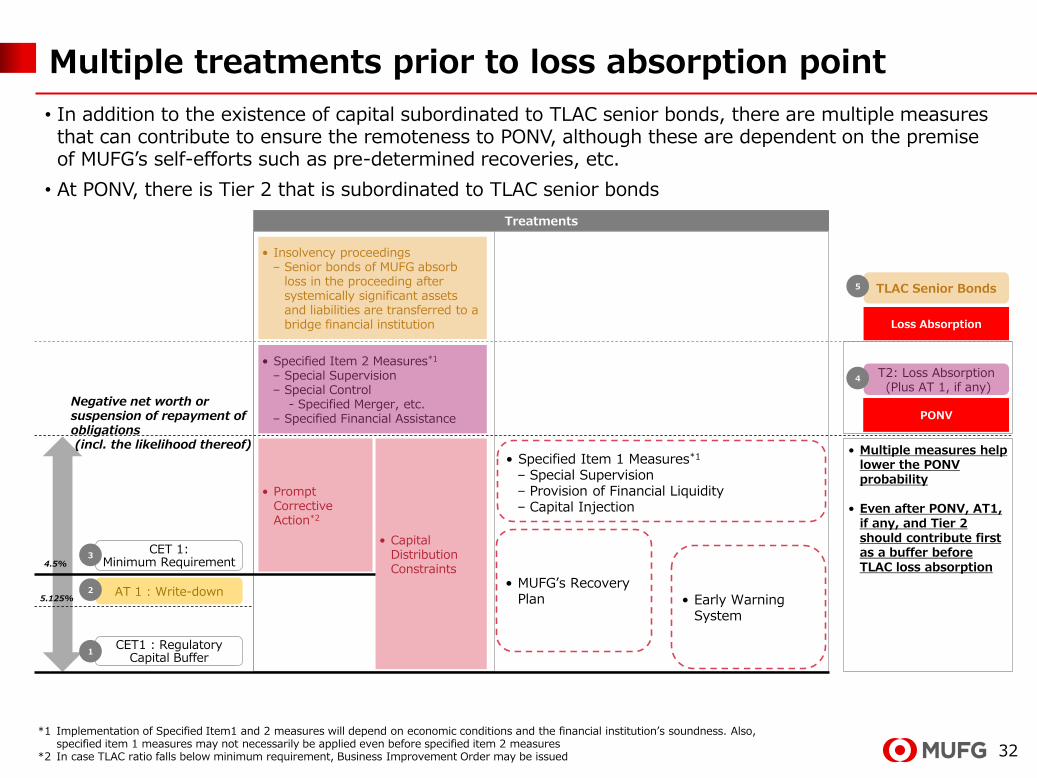
• In addition to the existence of capital subordinated to TLAC senior bonds, there are multiple measures that can contribute to ensure the remoteness to PONV, although these are dependent on the premise of MUFG’s self-efforts such as pre-determined recoveries, etc.
• At PONV, there is Tier 2 that is subordinated to TLAC senior bonds
予防的措置
• Capital Distribution Constraints
• Prompt Corrective Action*2
• Insolvency proceedings– Senior bonds of MUFG absorb
loss in the proceeding after systemically significant assets and liabilities are transferred to a bridge financial institution
5.125%
PONV
Loss Absorption
CET1 : Regulatory Capital Buffer
1
AT 1 : Write-down2
CET 1:Minimum Requirement
3
Negative net worth or suspension of repayment of obligations(incl. the likelihood thereof)
T2: Loss Absorption(Plus AT 1, if any)
TLAC Senior Bonds
4
5
• Multiple measures help lower the PONV probability
• Even after PONV, AT1, if any, and Tier 2 should contribute first as a buffer before TLAC loss absorption
Treatments
• Specified Item 2 Measures*1
– Special Supervision– Special Control
- Specified Merger, etc.– Specified Financial Assistance
4.5%
• Specified Item 1 Measures*1
– Special Supervision– Provision of Financial Liquidity– Capital Injection
• Early Warning System
• MUFG’s Recovery Plan
*1 Implementation of Specified Item1 and 2 measures will depend on economic conditions and the financial institution’s soundness. Also,specified item 1 measures may not necessarily be applied even before specified item 2 measures
*2 In case TLAC ratio falls below minimum requirement, Business Improvement Order may be issued
33
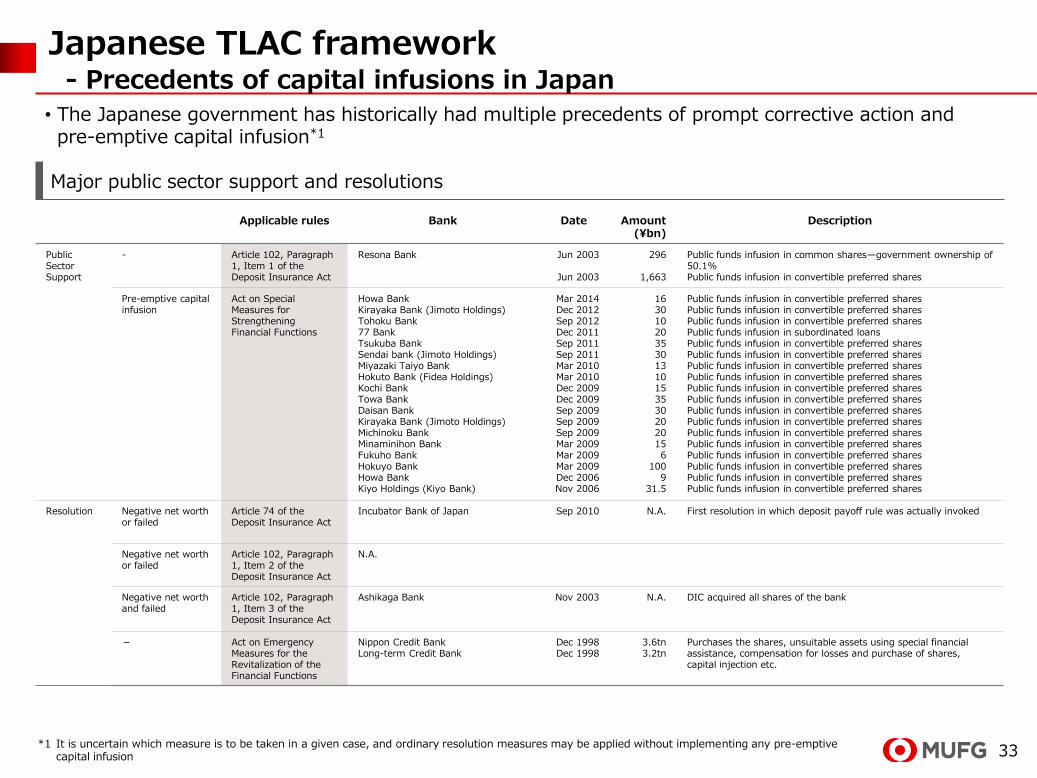
Japanese TLAC framework- Precedents of capital infusions in Japan
• The Japanese government has historically had multiple precedents of prompt corrective action and pre-emptive capital infusion*1
Major public sector support and resolutions
Applicable rules Bank Date Amount(¥bn)
Description
Public SectorSupport
- Article 102, Paragraph 1, Item 1 of the Deposit Insurance Act
Resona Bank Jun 2003
Jun 2003
296
1,663
Public funds infusion in common shares—government ownership of 50.1%Public funds infusion in convertible preferred shares
Pre-emptive capital infusion
Act on Special Measures for Strengthening Financial Functions
Howa BankKirayaka Bank (Jimoto Holdings)Tohoku Bank77 BankTsukuba BankSendai bank (Jimoto Holdings)Miyazaki Taiyo BankHokuto Bank (Fidea Holdings)Kochi BankTowa BankDaisan BankKirayaka Bank (Jimoto Holdings)Michinoku BankMinaminihon BankFukuho BankHokuyo BankHowa BankKiyo Holdings (Kiyo Bank)
Mar 2014Dec 2012Sep 2012Dec 2011Sep 2011Sep 2011Mar 2010Mar 2010Dec 2009Dec 2009Sep 2009Sep 2009Sep 2009Mar 2009Mar 2009Mar 2009Dec 2006Nov 2006
16301020353013101535302020156
1009
31.5
Public funds infusion in convertible preferred sharesPublic funds infusion in convertible preferred sharesPublic funds infusion in convertible preferred sharesPublic funds infusion in subordinated loansPublic funds infusion in convertible preferred sharesPublic funds infusion in convertible preferred sharesPublic funds infusion in convertible preferred sharesPublic funds infusion in convertible preferred sharesPublic funds infusion in convertible preferred sharesPublic funds infusion in convertible preferred sharesPublic funds infusion in convertible preferred sharesPublic funds infusion in convertible preferred sharesPublic funds infusion in convertible preferred sharesPublic funds infusion in convertible preferred sharesPublic funds infusion in convertible preferred sharesPublic funds infusion in convertible preferred sharesPublic funds infusion in convertible preferred sharesPublic funds infusion in convertible preferred shares
Resolution Negative net worth or failed
Article 74 of the Deposit Insurance Act
Incubator Bank of Japan Sep 2010 N.A. First resolution in which deposit payoff rule was actually invoked
Negative net worth or failed
Article 102, Paragraph 1, Item 2 of the Deposit Insurance Act
N.A.
Negative net worth and failed
Article 102, Paragraph 1, Item 3 of the Deposit Insurance Act
Ashikaga Bank Nov 2003 N.A. DIC acquired all shares of the bank
- Act on Emergency Measures for the Revitalization of the Financial Functions
Nippon Credit BankLong-term Credit Bank
Dec 1998Dec 1998
3.6tn3.2tn
Purchases the shares, unsuitable assets using special financial assistance, compensation for losses and purchase of shares, capital injection etc.
*1 It is uncertain which measure is to be taken in a given case, and ordinary resolution measures may be applied without implementing any pre-emptive capital infusion
34
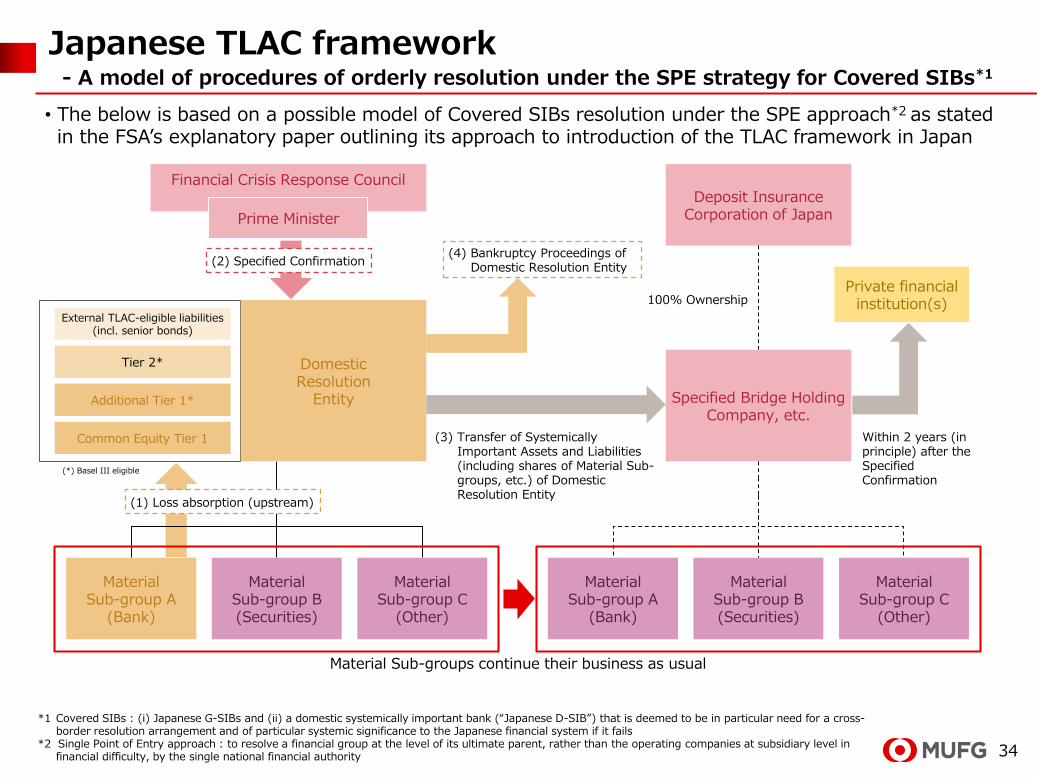
Japanese TLAC framework- A model of procedures of orderly resolution under the SPE strategy for Covered SIBs*1
• The below is based on a possible model of Covered SIBs resolution under the SPE approach*2 as stated in the FSA’s explanatory paper outlining its approach to introduction of the TLAC framework in Japan
*1 Covered SIBs : (i) Japanese G-SIBs and (ii) a domestic systemically important bank (“Japanese D-SIB”) that is deemed to be in particular need for a cross-border resolution arrangement and of particular systemic significance to the Japanese financial system if it fails
*2 Single Point of Entry approach : to resolve a financial group at the level of its ultimate parent, rather than the operating companies at subsidiary level in financial difficulty, by the single national financial authority
Financial Crisis Response Council
Prime Minister
Deposit Insurance Corporation of Japan
Specified Bridge Holding Company, etc.
MaterialSub-group A
(Bank)
MaterialSub-group B(Securities)
MaterialSub-group C
(Other)
External TLAC-eligible liabilities(incl. senior bonds)
Tier 2*
Additional Tier 1*
Common Equity Tier 1
MaterialSub-group B(Securities)
MaterialSub-group C
(Other)
MaterialSub-group A
(Bank)
(*) Basel III eligible
Private financial institution(s)100% Ownership
Within 2 years (in principle) after the SpecifiedConfirmation
Domestic Resolution
Entity
Material Sub-groups continue their business as usual
(4) Bankruptcy Proceedings of Domestic Resolution Entity
(3) Transfer of Systemically Important Assets and Liabilities (including shares of Material Sub-groups, etc.) of Domestic Resolution Entity
(2) Specified Confirmation
(1) Loss absorption (upstream)
35
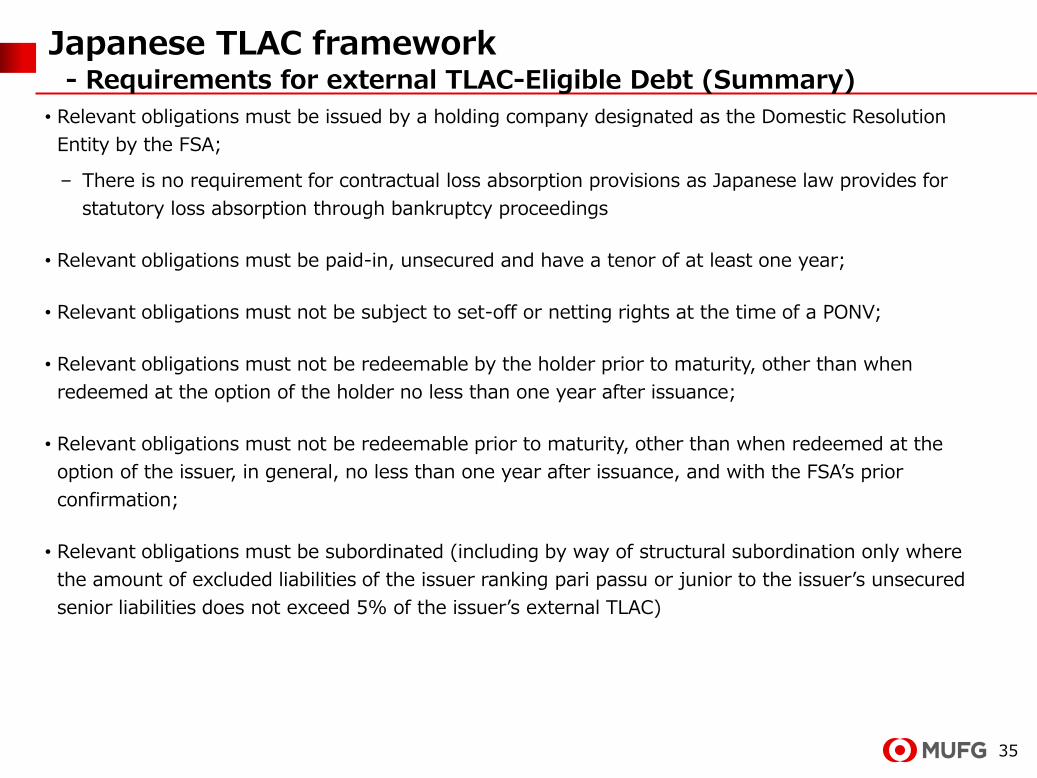
Japanese TLAC framework- Requirements for external TLAC-Eligible Debt (Summary)
• Relevant obligations must be issued by a holding company designated as the Domestic Resolution
Entity by the FSA;
– There is no requirement for contractual loss absorption provisions as Japanese law provides for
statutory loss absorption through bankruptcy proceedings
• Relevant obligations must be paid-in, unsecured and have a tenor of at least one year;
• Relevant obligations must not be subject to set-off or netting rights at the time of a PONV;
• Relevant obligations must not be redeemable by the holder prior to maturity, other than when
redeemed at the option of the holder no less than one year after issuance;
• Relevant obligations must not be redeemable prior to maturity, other than when redeemed at the
option of the issuer, in general, no less than one year after issuance, and with the FSA’s prior
confirmation;
• Relevant obligations must be subordinated (including by way of structural subordination only where
the amount of excluded liabilities of the issuer ranking pari passu or junior to the issuer’s unsecured
senior liabilities does not exceed 5% of the issuer’s external TLAC)
36
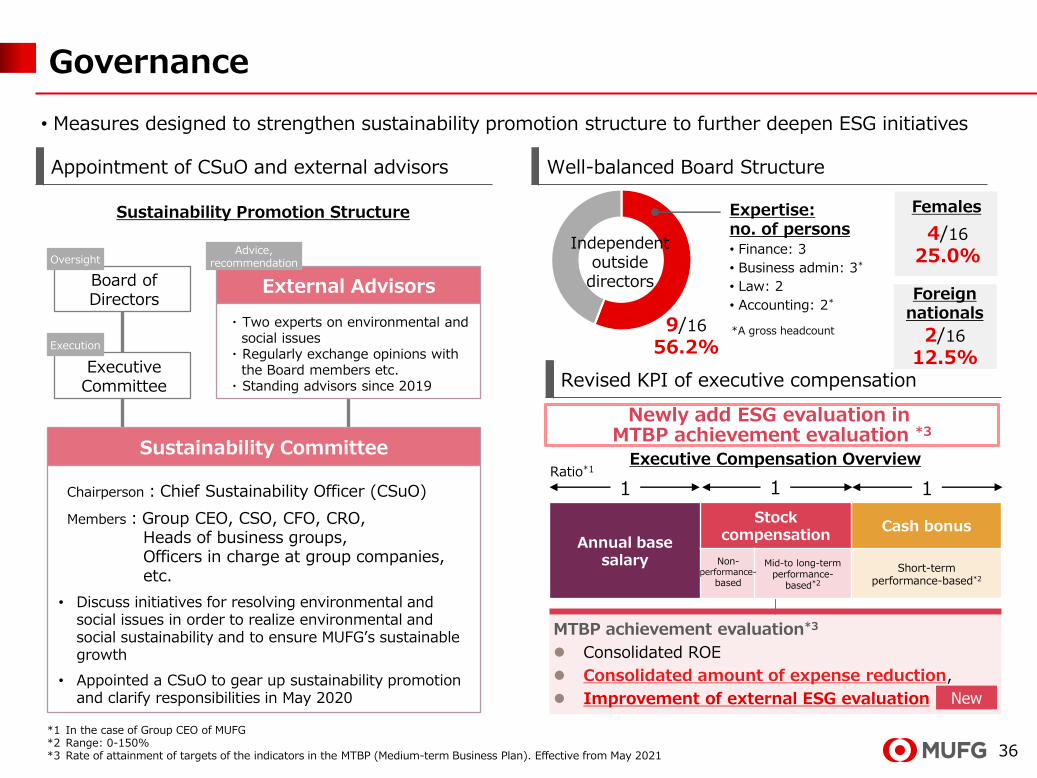
Females
Governance
Revised KPI of executive compensation
Appointment of CSuO and external advisors
Board of Directors
Executive Committee
Chairperson:Chief Sustainability Officer (CSuO)
Members:Group CEO, CSO, CFO, CRO, Heads of business groups, Officers in charge at group companies, etc.
• Discuss initiatives for resolving environmental and social issues in order to realize environmental and social sustainability and to ensure MUFG’s sustainable growth
• Appointed a CSuO to gear up sustainability promotion and clarify responsibilities in May 2020
Sustainability Promotion Structure
Oversight
Execution
External Advisors
Advice,recommendation
・ Two experts on environmental and social issues
・ Regularly exchange opinions with the Board members etc.
・ Standing advisors since 2019
Sustainability Committee
*1 In the case of Group CEO of MUFG *2 Range: 0-150%*3 Rate of attainment of targets of the indicators in the MTBP (Medium-term Business Plan). Effective from May 2021
• Measures designed to strengthen sustainability promotion structure to further deepen ESG initiatives
MTBP achievement evaluation*3
Consolidated ROE
Consolidated amount of expense reduction,
Improvement of external ESG evaluation New
Annual basesalary
Stock compensation
Cash bonus
Mid-to long-term performance-
based*2
Short-term performance-based*2
1 1 1Ratio*1
Non-performance-
based
Newly add ESG evaluation in MTBP achievement evaluation *3
Executive Compensation Overview
Well-balanced Board Structure
Independent outside
directors
9/16
56.2%
4/16
25.0%
2/16
12.5%
Foreignnationals
Expertise: no. of persons• Finance: 3
• Business admin: 3*
• Law: 2
• Accounting: 2*
*A gross headcount
37
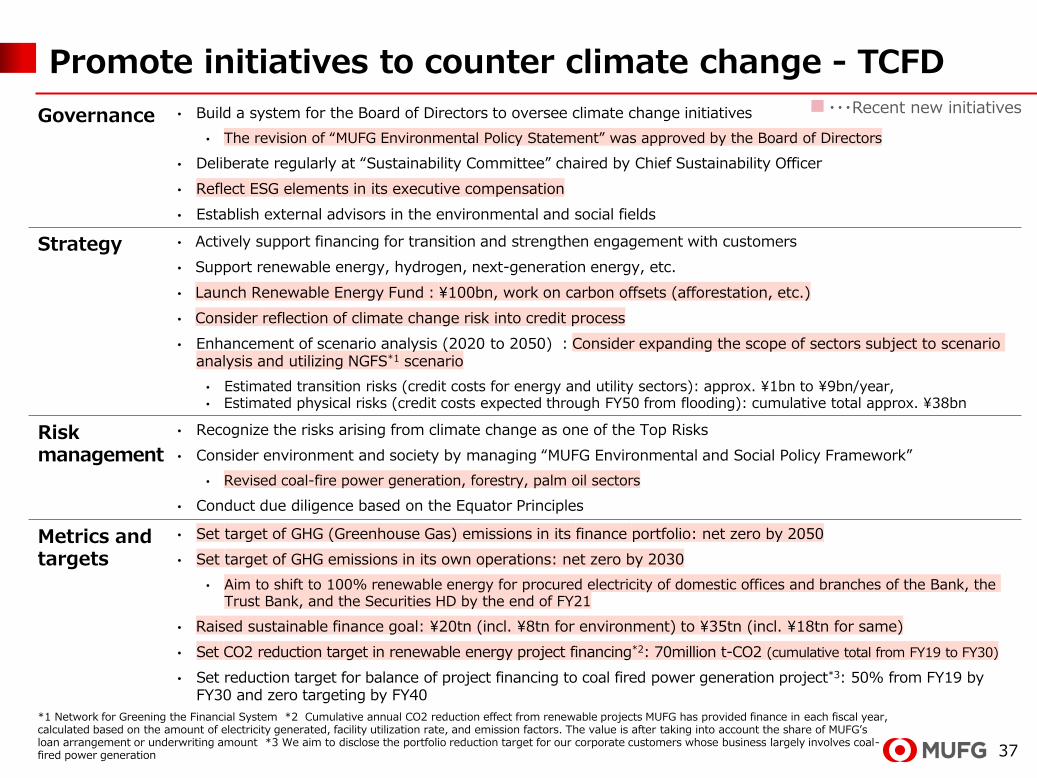
Promote initiatives to counter climate change - TCFD
Governance • Build a system for the Board of Directors to oversee climate change initiatives
• The revision of “MUFG Environmental Policy Statement” was approved by the Board of Directors
• Deliberate regularly at “Sustainability Committee” chaired by Chief Sustainability Officer
• Reflect ESG elements in its executive compensation
• Establish external advisors in the environmental and social fields
Strategy • Actively support financing for transition and strengthen engagement with customers
• Support renewable energy, hydrogen, next-generation energy, etc.
• Launch Renewable Energy Fund:¥100bn, work on carbon offsets (afforestation, etc.)
• Consider reflection of climate change risk into credit process
• Enhancement of scenario analysis (2020 to 2050) :Consider expanding the scope of sectors subject to scenario analysis and utilizing NGFS*1 scenario
• Estimated transition risks (credit costs for energy and utility sectors): approx. ¥1bn to ¥9bn/year, • Estimated physical risks (credit costs expected through FY50 from flooding): cumulative total approx. ¥38bn
Riskmanagement
• Recognize the risks arising from climate change as one of the Top Risks
• Consider environment and society by managing “MUFG Environmental and Social Policy Framework”
• Revised coal-fire power generation, forestry, palm oil sectors
• Conduct due diligence based on the Equator Principles
Metrics andtargets
• Set target of GHG (Greenhouse Gas) emissions in its finance portfolio: net zero by 2050
• Set target of GHG emissions in its own operations: net zero by 2030
• Aim to shift to 100% renewable energy for procured electricity of domestic offices and branches of the Bank, the Trust Bank, and the Securities HD by the end of FY21
• Raised sustainable finance goal: ¥20tn (incl. ¥8tn for environment) to ¥35tn (incl. ¥18tn for same)
• Set CO2 reduction target in renewable energy project financing*2: 70million t-CO2 (cumulative total from FY19 to FY30)
• Set reduction target for balance of project financing to coal fired power generation project*3: 50% from FY19 by FY30 and zero targeting by FY40
■・・・Recent new initiatives
*1 Network for Greening the Financial System *2 Cumulative annual CO2 reduction effect from renewable projects MUFG has provided finance in each fiscal year, calculated based on the amount of electricity generated, facility utilization rate, and emission factors. The value is after taking into account the share of MUFG’s loan arrangement or underwriting amount *3 We aim to disclose the portfolio reduction target for our corporate customers whose business largely involves coal-fired power generation
38
Basic Environmental and Social policies and framework
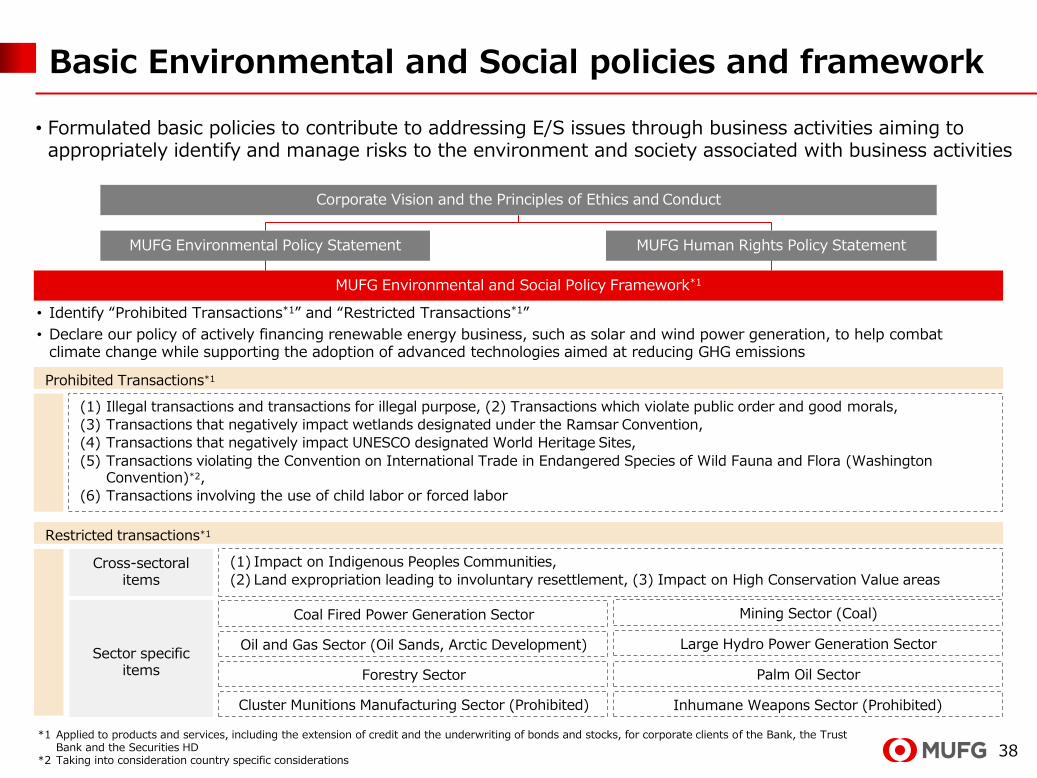
(1) Illegal transactions and transactions for illegal purpose, (2) Transactions which violate public order and good morals,
(3) Transactions that negatively impact wetlands designated under the Ramsar Convention,
(4) Transactions that negatively impact UNESCO designated World Heritage Sites,
(5) Transactions violating the Convention on International Trade in Endangered Species of Wild Fauna and Flora (Washington Convention)*2,
(6) Transactions involving the use of child labor or forced labor
Cross-sectoralitems
(1) Impact on Indigenous Peoples Communities,
(2) Land expropriation leading to involuntary resettlement, (3) Impact on High Conservation Value areas
Sector specificitems
Coal Fired Power Generation Sector
Cluster Munitions Manufacturing Sector (Prohibited)
• Identify “Prohibited Transactions*1” and “Restricted Transactions*1”
• Declare our policy of actively financing renewable energy business, such as solar and wind power generation, to help combat climate change while supporting the adoption of advanced technologies aimed at reducing GHG emissions
Prohibited Transactions*1
MUFG Environmental Policy Statement MUFG Human Rights Policy Statement
Corporate Vision and the Principles of Ethics and Conduct
Restricted transactions*1
MUFG Environmental and Social Policy Framework*1
Forestry Sector Palm Oil Sector
Mining Sector (Coal)
Oil and Gas Sector (Oil Sands, Arctic Development) Large Hydro Power Generation Sector
Inhumane Weapons Sector (Prohibited)
• Formulated basic policies to contribute to addressing E/S issues through business activities aiming to appropriately identify and manage risks to the environment and society associated with business activities
*1 Applied to products and services, including the extension of credit and the underwriting of bonds and stocks, for corporate clients of the Bank, the Trust Bank and the Securities HD
*2 Taking into consideration country specific considerations
39
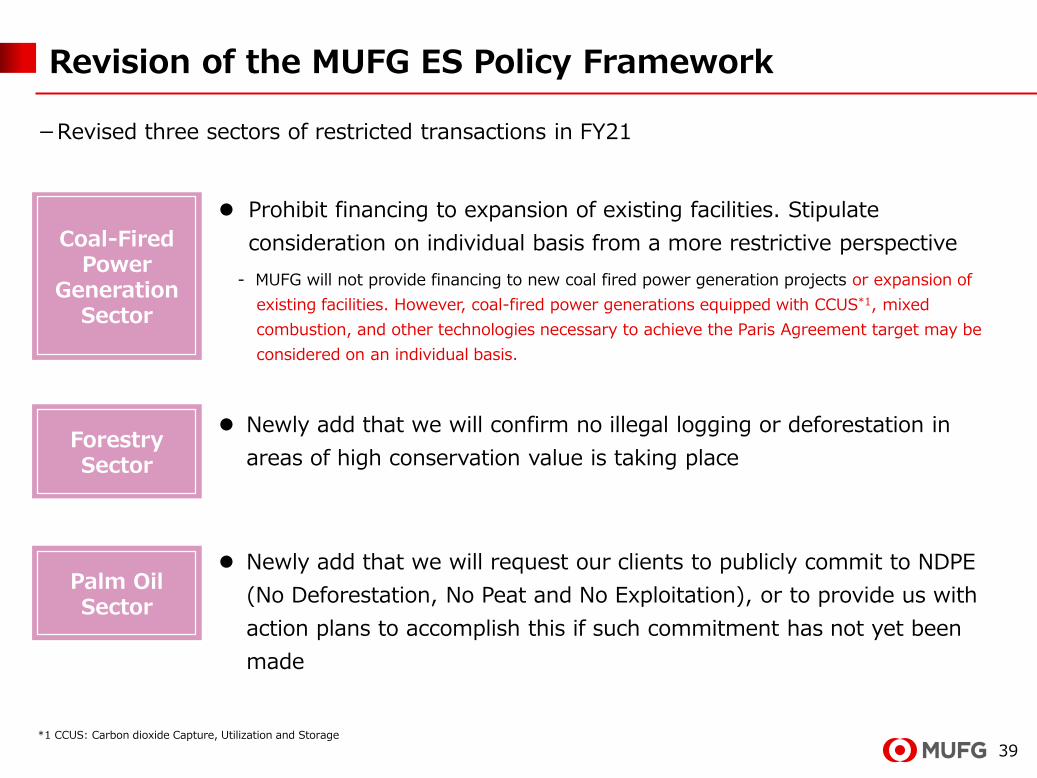
Revision of the MUFG ES Policy Framework
-Revised three sectors of restricted transactions in FY21
*1 CCUS: Carbon dioxide Capture, Utilization and Storage
Coal-Fired Power
Generation Sector
Palm Oil Sector
Prohibit financing to expansion of existing facilities. Stipulate
consideration on individual basis from a more restrictive perspective
- MUFG will not provide financing to new coal fired power generation projects or expansion of
existing facilities. However, coal-fired power generations equipped with CCUS*1, mixed
combustion, and other technologies necessary to achieve the Paris Agreement target may be
considered on an individual basis.
Newly add that we will request our clients to publicly commit to NDPE
(No Deforestation, No Peat and No Exploitation), or to provide us with
action plans to accomplish this if such commitment has not yet been
made
Forestry Sector
Newly add that we will confirm no illegal logging or deforestation in
areas of high conservation value is taking place
40
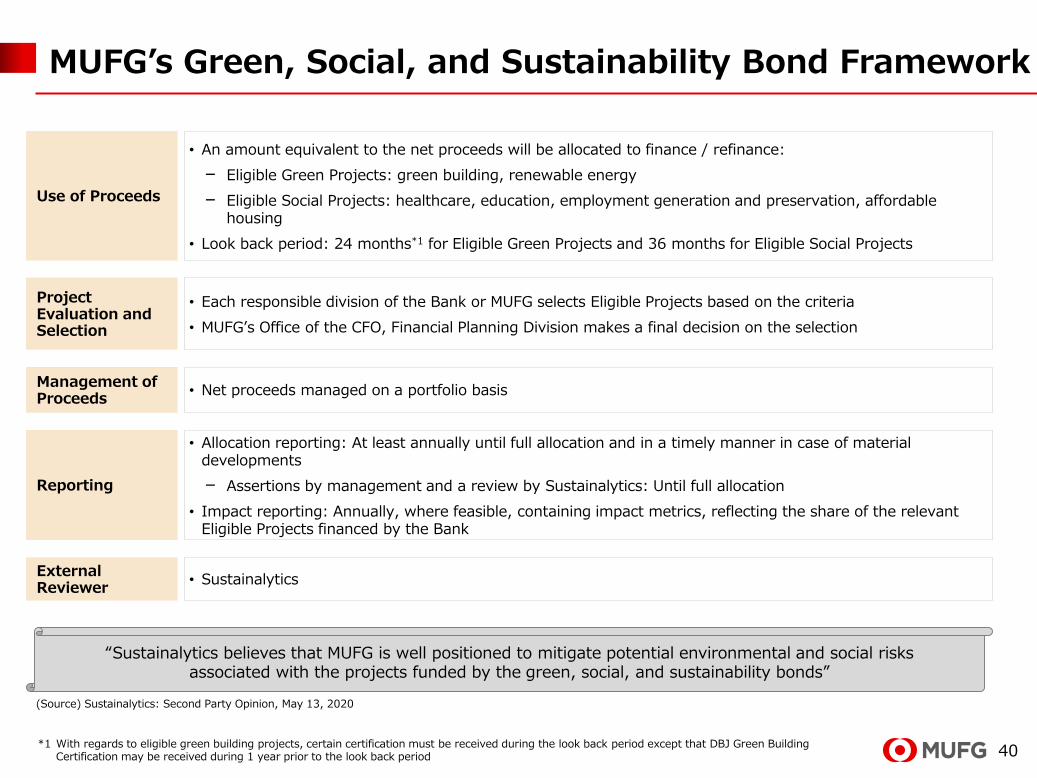
MUFG’s Green, Social, and Sustainability Bond Framework
*1 With regards to eligible green building projects, certain certification must be received during the look back period except that DBJ Green Building Certification may be received during 1 year prior to the look back period
• An amount equivalent to the net proceeds will be allocated to finance / refinance:
– Eligible Green Projects: green building, renewable energy
– Eligible Social Projects: healthcare, education, employment generation and preservation, affordable housing
• Look back period: 24 months*1 for Eligible Green Projects and 36 months for Eligible Social Projects
Use of Proceeds
• Each responsible division of the Bank or MUFG selects Eligible Projects based on the criteria
• MUFG’s Office of the CFO, Financial Planning Division makes a final decision on the selection
Project Evaluation and Selection
• Net proceeds managed on a portfolio basisManagement of Proceeds
• Allocation reporting: At least annually until full allocation and in a timely manner in case of material developments
– Assertions by management and a review by Sustainalytics: Until full allocation
• Impact reporting: Annually, where feasible, containing impact metrics, reflecting the share of the relevant Eligible Projects financed by the Bank
Reporting
External Reviewer
• Sustainalytics
“Sustainalytics believes that MUFG is well positioned to mitigate potential environmental and social risks associated with the projects funded by the green, social, and sustainability bonds”
(Source) Sustainalytics: Second Party Opinion, May 13, 2020
41
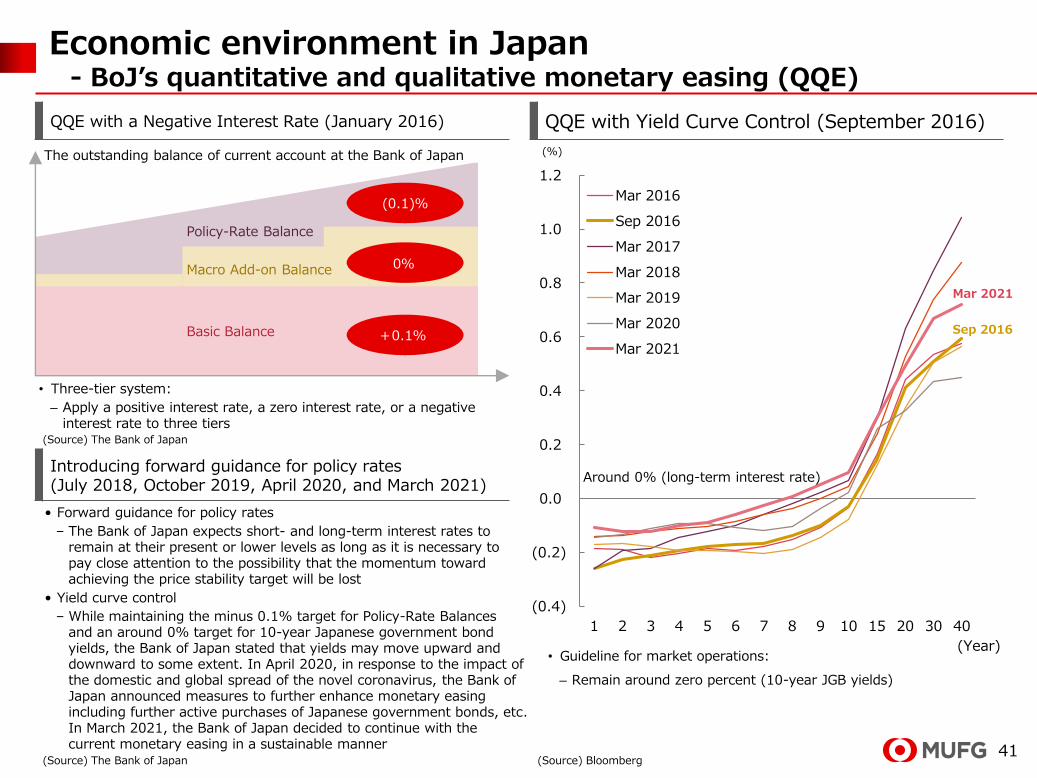
Economic environment in Japan- BoJ’s quantitative and qualitative monetary easing (QQE)
QQE with a Negative Interest Rate (January 2016) QQE with Yield Curve Control (September 2016)
• Three-tier system:
– Apply a positive interest rate, a zero interest rate, or a negative interest rate to three tiers
(Source) The Bank of Japan
Introducing forward guidance for policy rates (July 2018, October 2019, April 2020, and March 2021)
• Forward guidance for policy rates
– The Bank of Japan expects short- and long-term interest rates to remain at their present or lower levels as long as it is necessary to pay close attention to the possibility that the momentum toward achieving the price stability target will be lost
• Yield curve control
– While maintaining the minus 0.1% target for Policy-Rate Balances and an around 0% target for 10-year Japanese government bond yields, the Bank of Japan stated that yields may move upward and downward to some extent. In April 2020, in response to the impact of the domestic and global spread of the novel coronavirus, the Bank of Japan announced measures to further enhance monetary easing including further active purchases of Japanese government bonds, etc. In March 2021, the Bank of Japan decided to continue with the current monetary easing in a sustainable manner
(0.4)
(0.2)
0.0
0.2
0.4
0.6
0.8
1.0
1.2
1 2 3 4 5 6 7 8 9 10 15 20 30 40
Mar 2016
Sep 2016
Mar 2017
Mar 2018
Mar 2019
Mar 2020
Mar 2021
(%)
• Guideline for market operations:
– Remain around zero percent (10-year JGB yields)
(Source) The Bank of Japan (Source) Bloomberg
Around 0% (long-term interest rate)
Policy-Rate Balance
Macro Add-on Balance
Basic Balance
(0.1)%
0%
+0.1%
The outstanding balance of current account at the Bank of Japan
(Year)
Mar 2021
Sep 2016
42
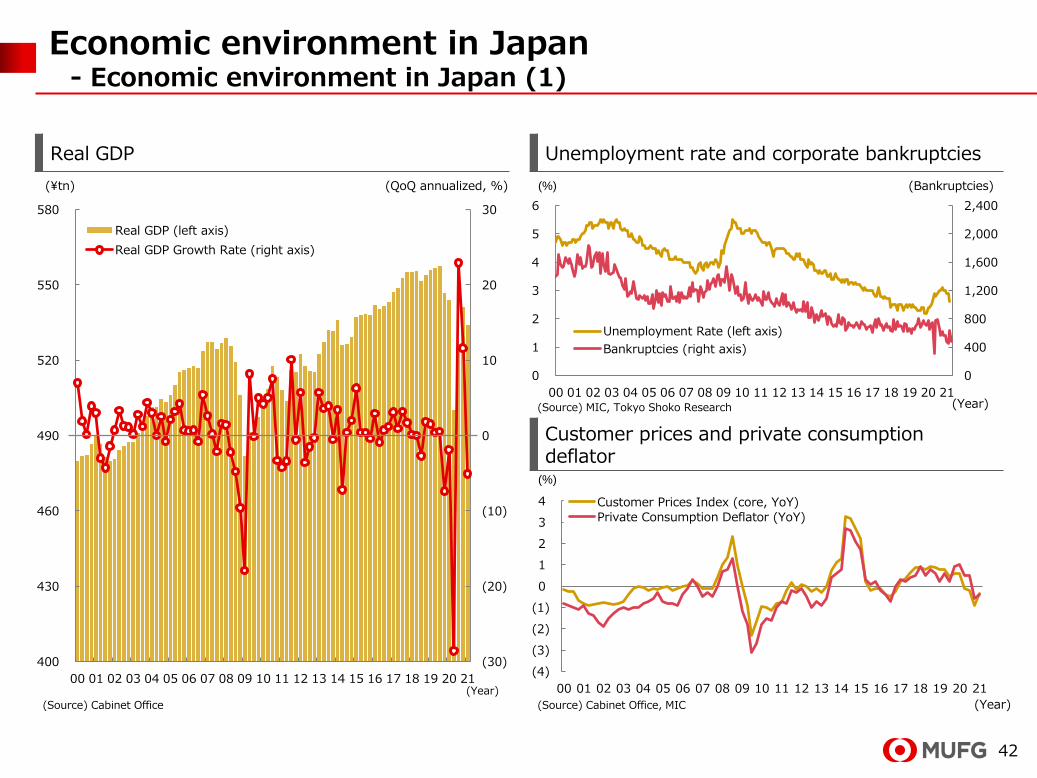
Economic environment in Japan- Economic environment in Japan (1)
Real GDP Unemployment rate and corporate bankruptcies
(¥tn) (QoQ annualized, %)
(30)
(20)
(10)
0
10
20
30
400
430
460
490
520
550
580
00 01 02 03 04 05 06 07 08 09 10 11 12 13 14 15 16 17 18 19 20 21
Real GDP (left axis)
Real GDP Growth Rate (right axis)
(Year)
(Source) Cabinet Office
(%) (Bankruptcies)
0
400
800
1,200
1,600
2,000
2,400
0
1
2
3
4
5
6
00 01 02 03 04 05 06 07 08 09 10 11 12 13 14 15 16 17 18 19 20 21
Unemployment Rate (left axis)
Bankruptcies (right axis)
(Source) MIC, Tokyo Shoko Research
Customer prices and private consumption deflator
(%)
(Source) Cabinet Office, MIC
(4)
(3)
(2)
(1)
0
1
2
3
4
00 01 02 03 04 05 06 07 08 09 10 11 12 13 14 15 16 17 18 19 20 21
Customer Prices Index (core, YoY)Private Consumption Deflator (YoY)
(Year)
(Year)
43
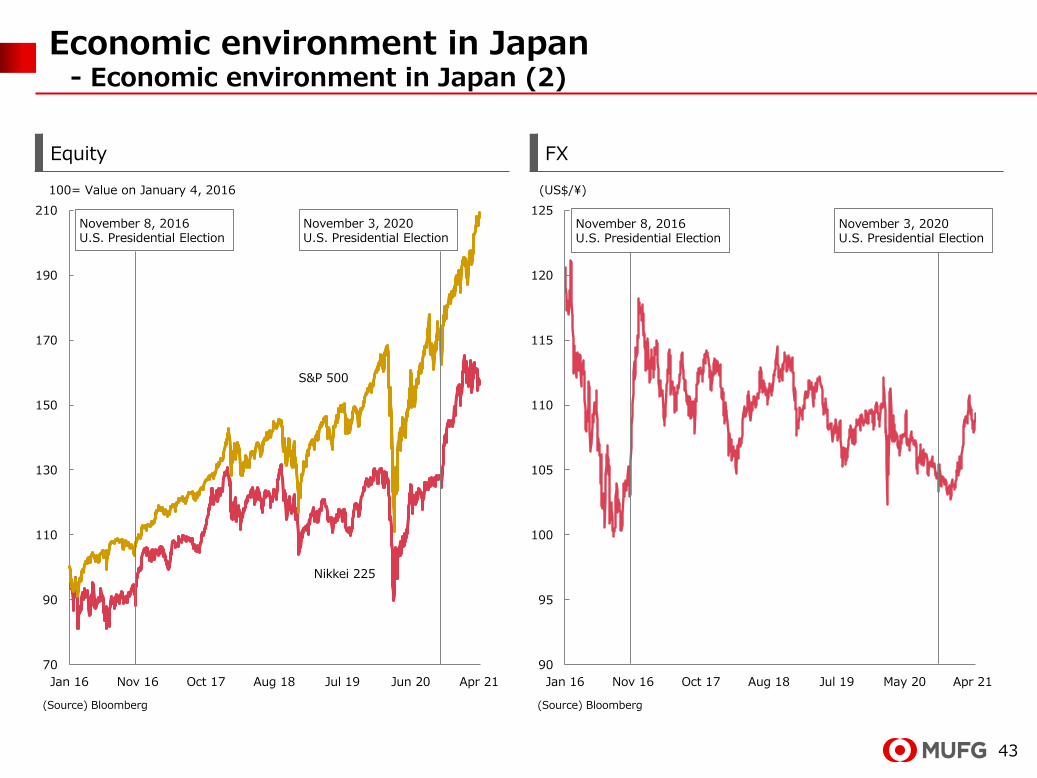
Economic environment in Japan- Economic environment in Japan (2)
Equity FX
100= Value on January 4, 2016 (US$/¥)
(Source) Bloomberg (Source) Bloomberg
70
90
110
130
150
170
190
210
Jan 16 Nov 16 Oct 17 Aug 18 Jul 19 Jun 20 Apr 21
90
95
100
105
110
115
120
125
Jan 16 Nov 16 Oct 17 Aug 18 Jul 19 May 20 Apr 21
November 8, 2016U.S. Presidential Election
November 8, 2016U.S. Presidential Election
Nikkei 225
S&P 500
November 3, 2020U.S. Presidential Election
November 3, 2020U.S. Presidential Election
44
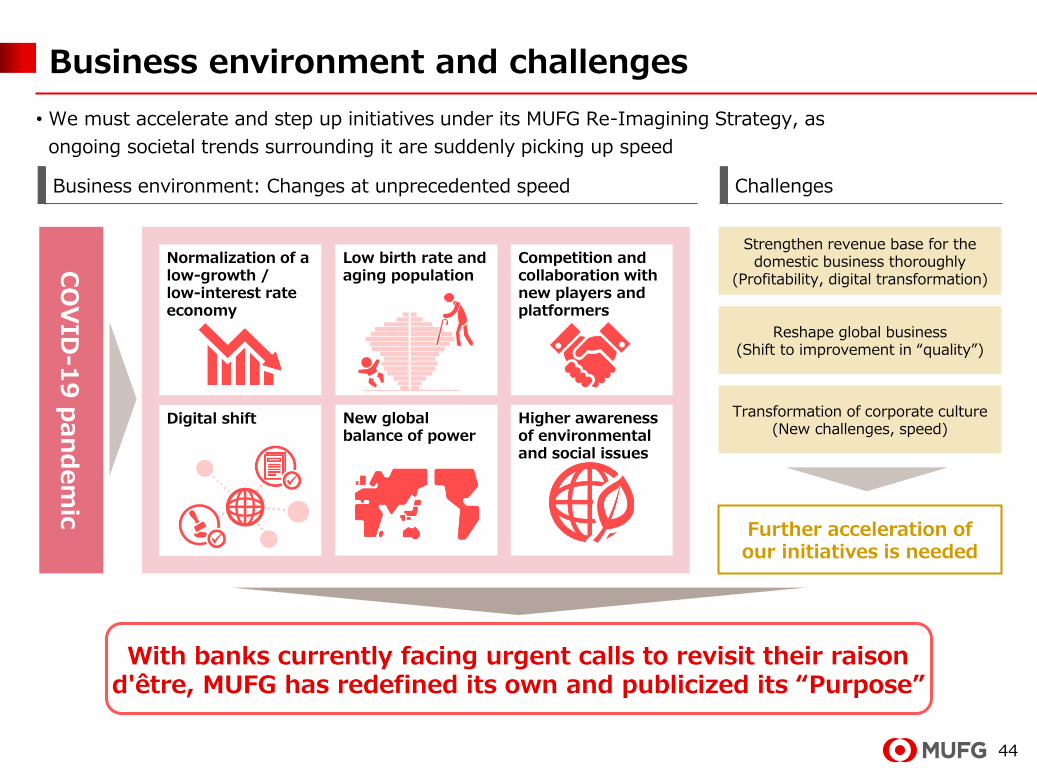
Business environment and challenges
CO
VID
-19
pan
dem
ic
Normalization of a low-growth / low-interest rate economy
Low birth rate and aging population
Digital shift New global balance of power
Higher awareness of environmental and social issues
Competition and collaboration with new players and platformers
Strengthen revenue base for the domestic business thoroughly
(Profitability, digital transformation)
Reshape global business(Shift to improvement in “quality”)
Transformation of corporate culture(New challenges, speed)
Further acceleration ofour initiatives is needed
Business environment: Changes at unprecedented speed
• We must accelerate and step up initiatives under its MUFG Re-Imagining Strategy, as
ongoing societal trends surrounding it are suddenly picking up speed
Challenges
With banks currently facing urgent calls to revisit their raison d'être, MUFG has redefined its own and publicized its “Purpose”
45
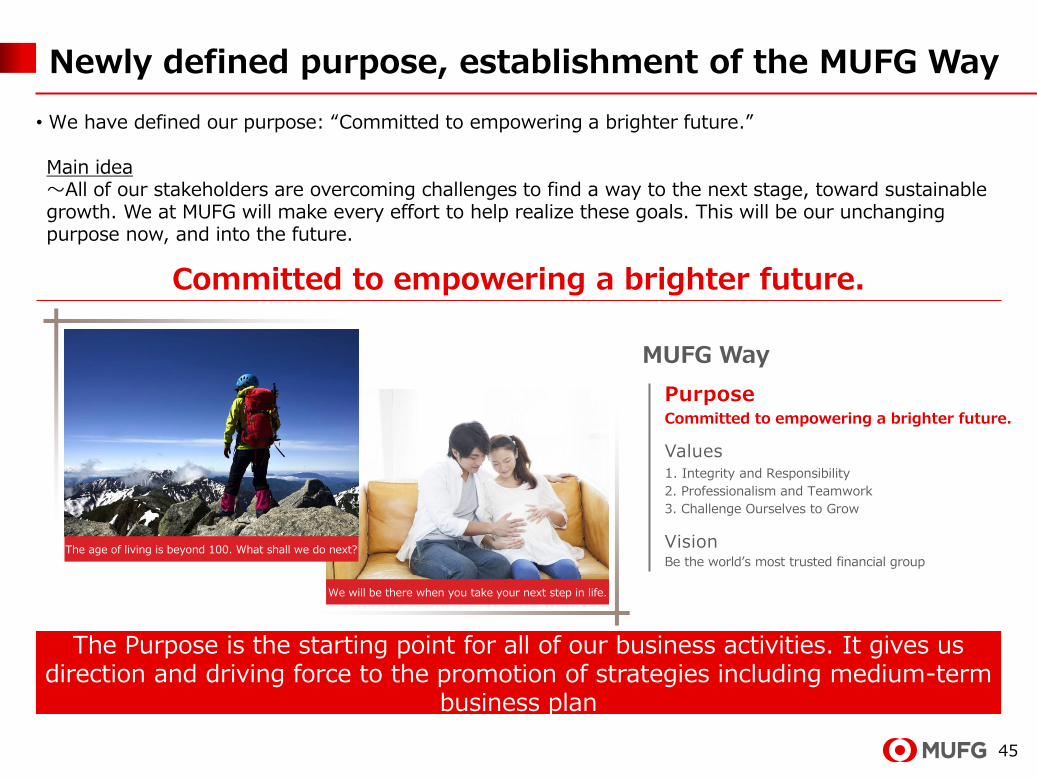
• We have defined our purpose: “Committed to empowering a brighter future.”
Newly defined purpose, establishment of the MUFG Way
Main idea~All of our stakeholders are overcoming challenges to find a way to the next stage, toward sustainable growth. We at MUFG will make every effort to help realize these goals. This will be our unchanging purpose now, and into the future.
The Purpose is the starting point for all of our business activities. It gives us direction and driving force to the promotion of strategies including medium-term
business plan
Committed to empowering a brighter future.
MUFG Way
PurposeCommitted to empowering a brighter future.
Values1. Integrity and Responsibility
2. Professionalism and Teamwork
3. Challenge Ourselves to Grow
VisionBe the world’s most trusted financial group
The age of living is beyond 100. What shall we do next?
We will be there when you take your next step in life.
46
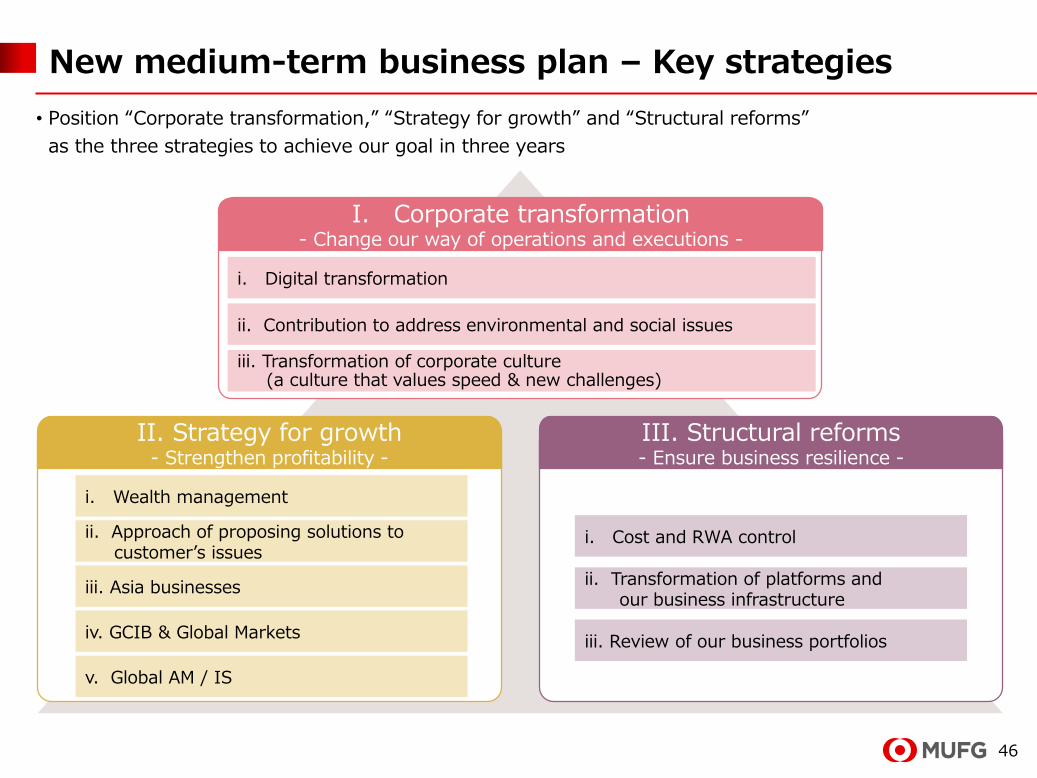
II. Strategy for growth- Strengthen profitability -
I. Corporate transformation- Change our way of operations and executions -
i. Cost and RWA control
ii. Transformation of platforms andour business infrastructure
iii. Review of our business portfolios
III. Structural reforms- Ensure business resilience -
i. Wealth management
ii. Approach of proposing solutions tocustomer’s issues
iii. Asia businesses
iv. GCIB & Global Markets
v. Global AM / IS
i. Digital transformation
ii. Contribution to address environmental and social issues
iii. Transformation of corporate culture(a culture that values speed & new challenges)
• Position “Corporate transformation,” “Strategy for growth” and “Structural reforms”
as the three strategies to achieve our goal in three years
New medium-term business plan – Key strategies
47
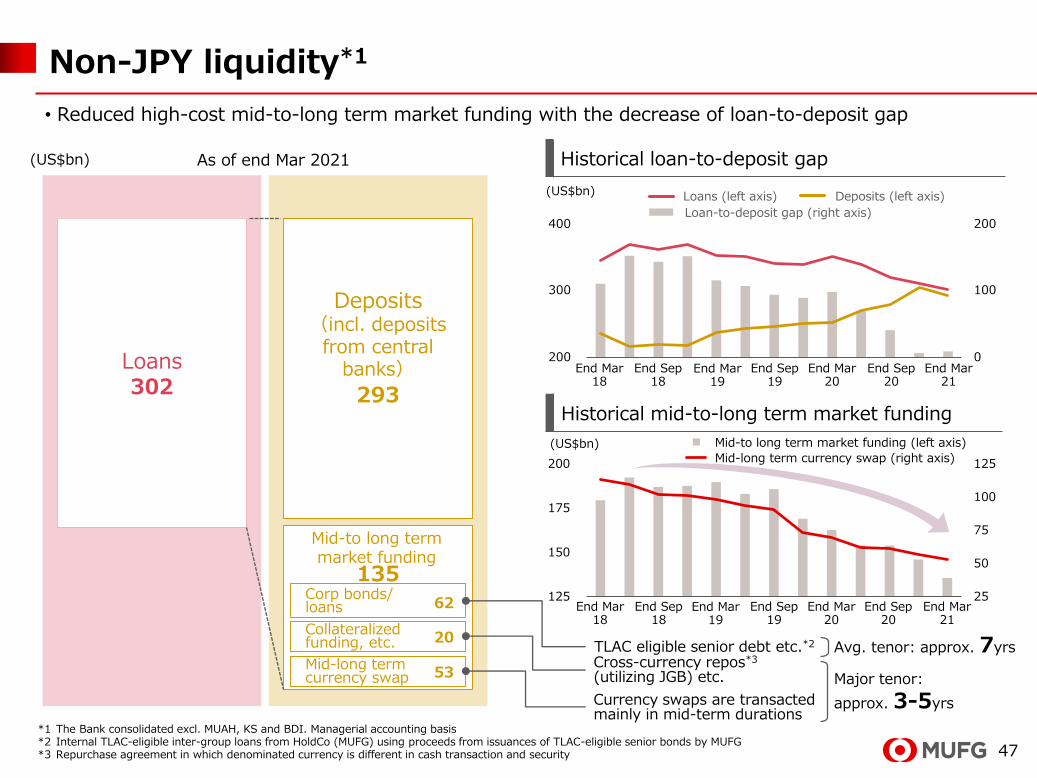
293
135
Collateralizedfunding, etc.
Corp bonds/loans
Mid-long termcurrency swap
25
50
75
100
125
125
150
175
200
Historical mid-to-long term market funding
18/3末 18/9末 19/3末 19/9末 20/3末 20/9末 21/3末
400
300
200
200
100
0Loans302
Non-JPY liquidity*1
(US$bn) As of end Mar 2021
Deposits(incl. deposits
from central banks)
Mid-to long term market funding
20
53
62
Historical loan-to-deposit gap
(US$bn) Loans (left axis) Deposits (left axis)
Loan-to-deposit gap (right axis)
End Mar21
End Mar20
End Sep19
End Mar19
End Mar18
End Sep18
End Sep20
Mid-to long term market funding (left axis)
Mid-long term currency swap (right axis)(US$bn)
End Mar21
End Mar20
End Sep19
End Mar19
End Mar18
End Sep18
End Sep20
TLAC eligible senior debt etc.*2
Cross-currency repos*3
(utilizing JGB) etc.
Currency swaps are transacted mainly in mid-term durations
Avg. tenor: approx. 7yrs
Major tenor:
approx. 3-5yrs
• Reduced high-cost mid-to-long term market funding with the decrease of loan-to-deposit gap
*1 The Bank consolidated excl. MUAH, KS and BDI. Managerial accounting basis*2 Internal TLAC-eligible inter-group loans from HoldCo (MUFG) using proceeds from issuances of TLAC-eligible senior bonds by MUFG*3 Repurchase agreement in which denominated currency is different in cash transaction and security
48
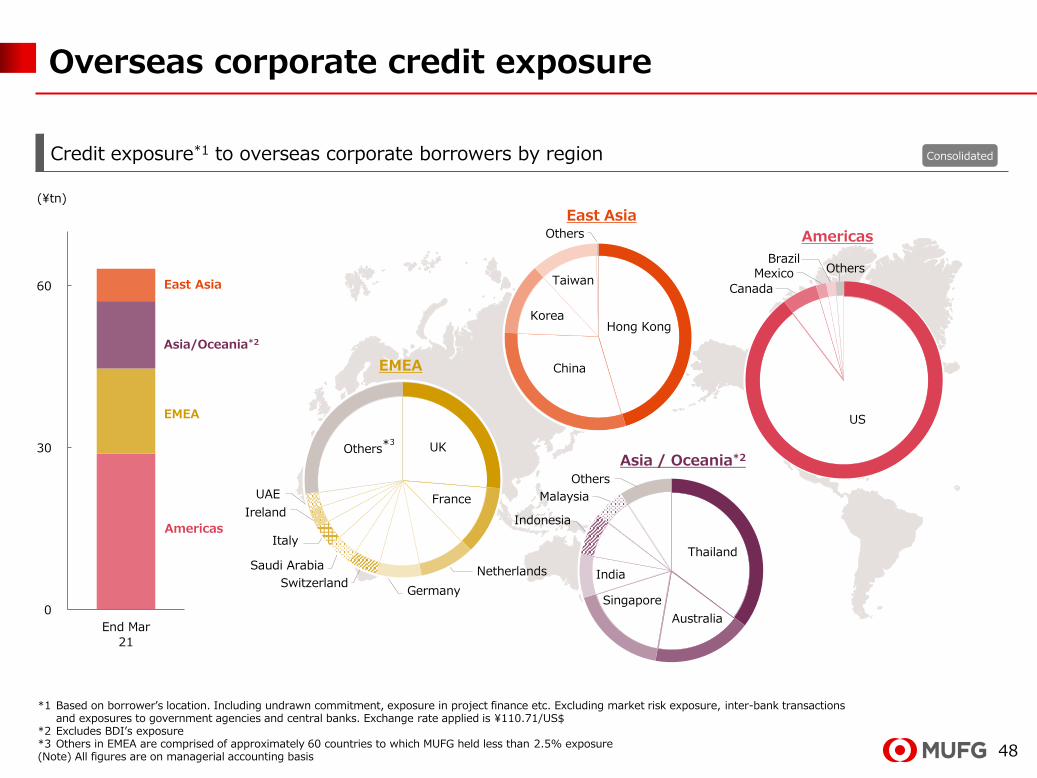
Overseas corporate credit exposure
Credit exposure*1 to overseas corporate borrowers by region
*1 Based on borrower’s location. Including undrawn commitment, exposure in project finance etc. Excluding market risk exposure, inter-bank transactions and exposures to government agencies and central banks. Exchange rate applied is ¥110.71/US$
*2 Excludes BDI’s exposure*3 Others in EMEA are comprised of approximately 60 countries to which MUFG held less than 2.5% exposure(Note) All figures are on managerial accounting basis
0
30
60
End Mar
21
(¥tn)
Hong Kong
China
Korea
Taiwan
Others
AustraliaSingapore
Consolidated
Americas
East Asia
US
Canada
MexicoBrazil
Others
UK
France
Netherlands
GermanySwitzerland
Saudi Arabia
Italy
Ireland
UAE
Others*3
EMEA
Thailand
Australia
Singapore
India
Indonesia
Malaysia
Others
Asia / Oceania*2
East Asia
Asia/Oceania*2
EMEA
Americas
49
3.52.6 2.4
6.9
5.3 5.1
0
5
10
End Mar 16 End Mar 20 End Mar 21
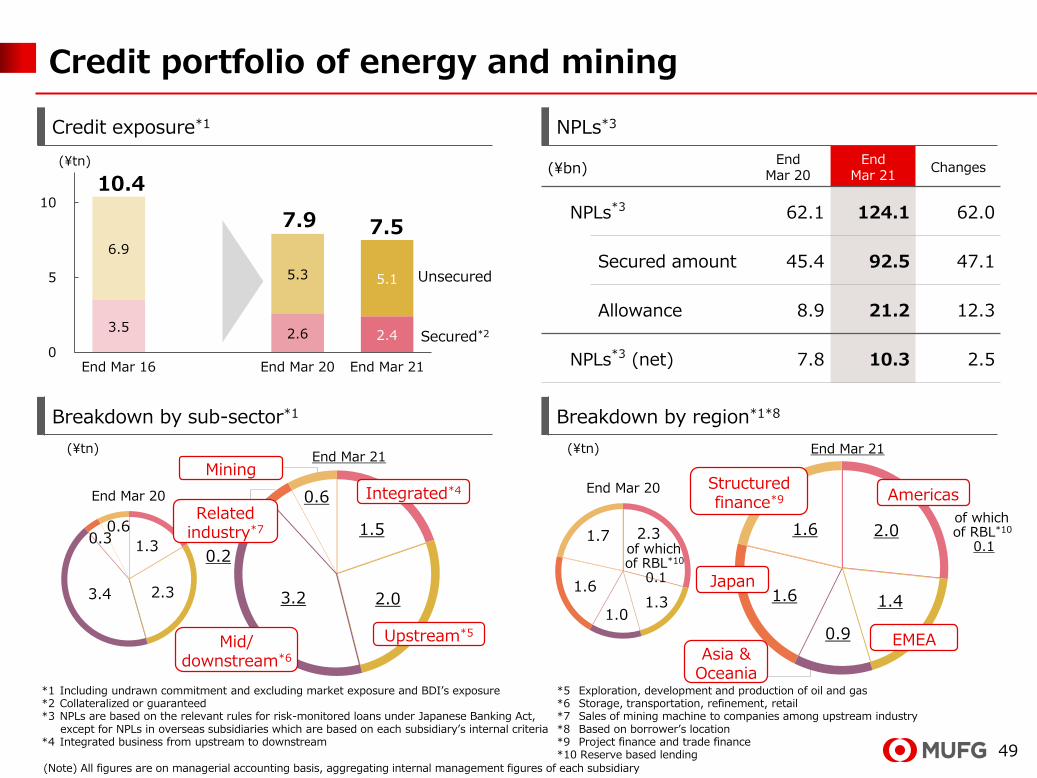
Credit portfolio of energy and mining
(¥tn)
10.4
(¥tn) (¥tn)
Credit exposure*1 NPLs*3
Breakdown by sub-sector*1 Breakdown by region*1*8
Secured*2
Unsecured
(¥bn)End
Mar 20End
Mar 21Changes
NPLs*3 62.1 124.1 62.0
Secured amount 45.4 92.5 47.1
Allowance 8.9 21.2 12.3
NPLs*3 (net) 7.8 10.3 2.5
*1 Including undrawn commitment and excluding market exposure and BDI’s exposure*2 Collateralized or guaranteed *3 NPLs are based on the relevant rules for risk-monitored loans under Japanese Banking Act,
except for NPLs in overseas subsidiaries which are based on each subsidiary’s internal criteria *4 Integrated business from upstream to downstream
*5 Exploration, development and production of oil and gas*6 Storage, transportation, refinement, retail*7 Sales of mining machine to companies among upstream industry *8 Based on borrower’s location*9 Project finance and trade finance*10 Reserve based lending
(Note) All figures are on managerial accounting basis, aggregating internal management figures of each subsidiary
2.0
1.4
0.9
1.6
1.6
Americas
EMEAAsia &
Oceania
Japan
Structured finance*9
2.3
1.31.0
1.6
1.7
End Mar 20
End Mar 21
of which of RBL*10
0.1
of which of RBL*10
0.11.3
2.33.4
0.30.6 1.5
2.03.2
0.2
0.6 Integrated*4
Upstream*5Mid/
downstream*6
Relatedindustry*7
Mining
End Mar 20
End Mar 21
7.9 7.5
50
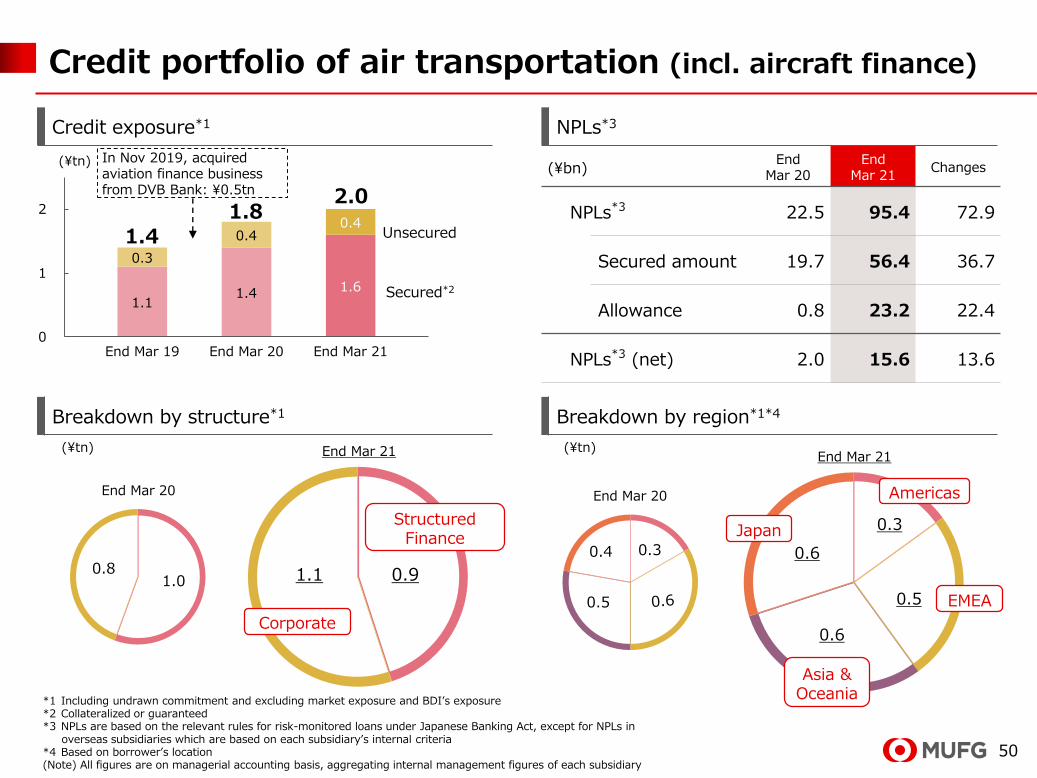
1.11.4 1.6
0.3
0.40.4
0
1
2
End Mar 19 End Mar 20 End Mar 21
Credit portfolio of air transportation (incl. aircraft finance)
Credit exposure*1 NPLs*3
Breakdown by structure*1 Breakdown by region*1*4
(¥tn)
Unsecured
Secured*2
In Nov 2019, acquired aviation finance business from DVB Bank: ¥0.5tn
(¥bn)End
Mar 20End
Mar 21Changes
NPLs*3 22.5 95.4 72.9
Secured amount 19.7 56.4 36.7
Allowance 0.8 23.2 22.4
NPLs*3 (net) 2.0 15.6 13.6
1.81.4
(¥tn) (¥tn)
*1 Including undrawn commitment and excluding market exposure and BDI’s exposure*2 Collateralized or guaranteed *3 NPLs are based on the relevant rules for risk-monitored loans under Japanese Banking Act, except for NPLs in
overseas subsidiaries which are based on each subsidiary’s internal criteria*4 Based on borrower’s location(Note) All figures are on managerial accounting basis, aggregating internal management figures of each subsidiary
2.0
0.91.1
StructuredFinance
Corporate
1.00.8
End Mar 20
End Mar 21
0.3
0.5
0.6
0.6
Americas
Asia &Oceania
EMEA
Japan0.3
0.5
0.4
End Mar 20
End Mar 21
51
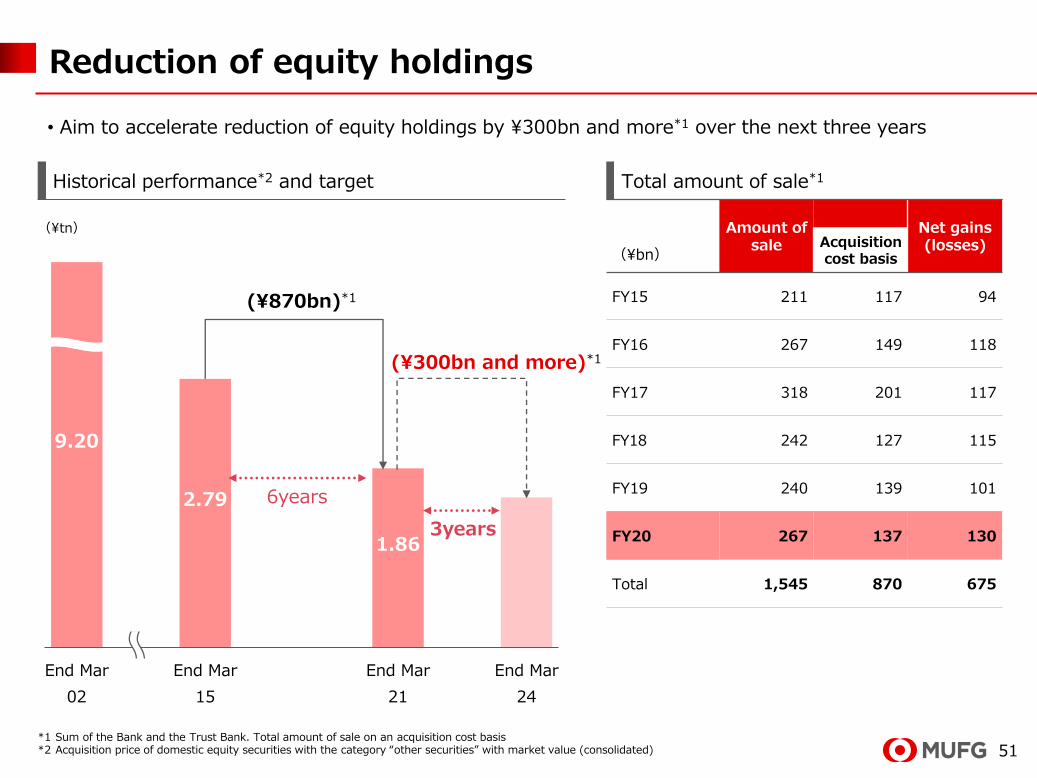
9.20
2.79
1.86
End Mar
02
End Mar
15
End Mar
21
End Mar
24
(¥tn)
Reduction of equity holdings
• Aim to accelerate reduction of equity holdings by ¥300bn and more*1 over the next three years
Total amount of sale*1Historical performance*2 and target
6years
3years
(¥300bn and more)*1
(¥870bn)*1
Amount of sale
Net gains (losses)Acquisition
cost basis(¥bn)
FY15 211 117 94
FY16 267 149 118
FY17 318 201 117
FY18 242 127 115
FY19 240 139 101
FY20 267 137 130
Total 1,545 870 675
*1 Sum of the Bank and the Trust Bank. Total amount of sale on an acquisition cost basis *2 Acquisition price of domestic equity securities with the category “other securities” with market value (consolidated)
52
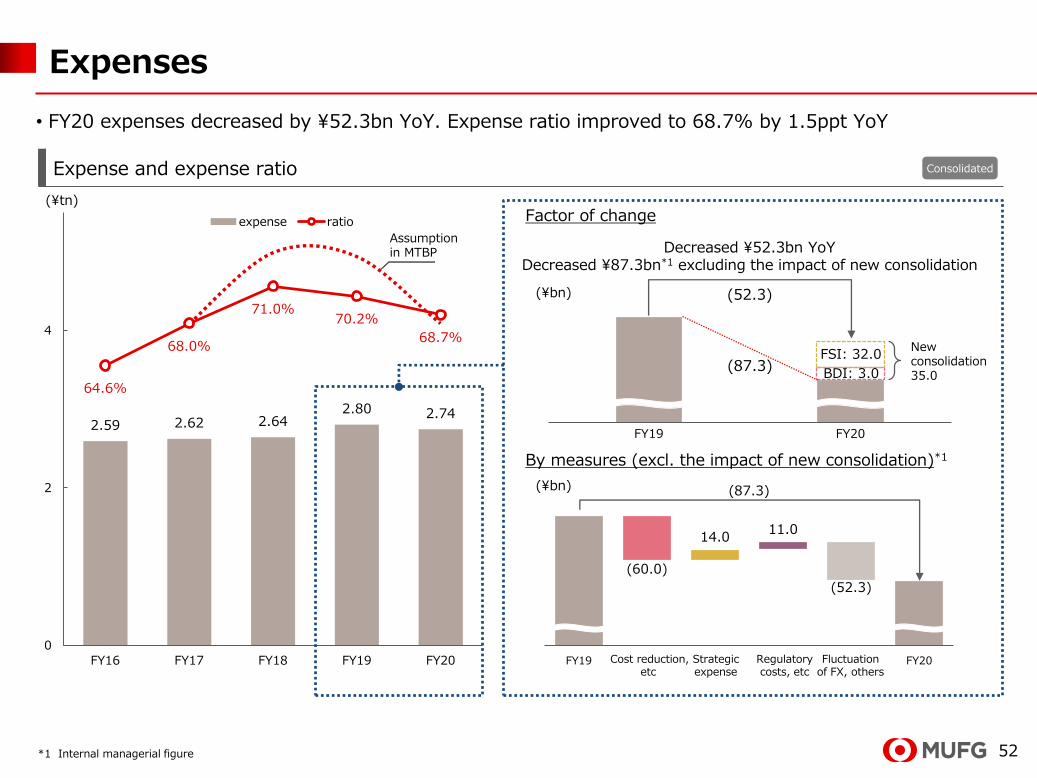
FY19 FY20
Expenses
• FY20 expenses decreased by ¥52.3bn YoY. Expense ratio improved to 68.7% by 1.5ppt YoY
2.59 2.62 2.64 2.80 2.74
64.6%
68.0%
71.0%70.2%
68.7%
0
2
4
FY16 FY17 FY18 FY19 FY20
expense ratio
(60.0)
14.011.0
(52.3)
FY19 費用抑制等 戦略的
経費
規制対応
費用等
為替影響
その他
FY20
(¥bn) (87.3)
(¥bn) (52.3)
FSI: 32.0Newconsolidation35.0
Decreased ¥52.3bn YoYDecreased ¥87.3bn*1 excluding the impact of new consolidation
Factor of change
BDI: 3.0
(¥tn)
*1 Internal managerial figure
(87.3)
Expense and expense ratio
Assumptionin MTBP
By measures (excl. the impact of new consolidation)*1
Cost reduction,etc
Strategicexpense
Regulatorycosts, etc
Fluctuationof FX, others
Consolidated
53
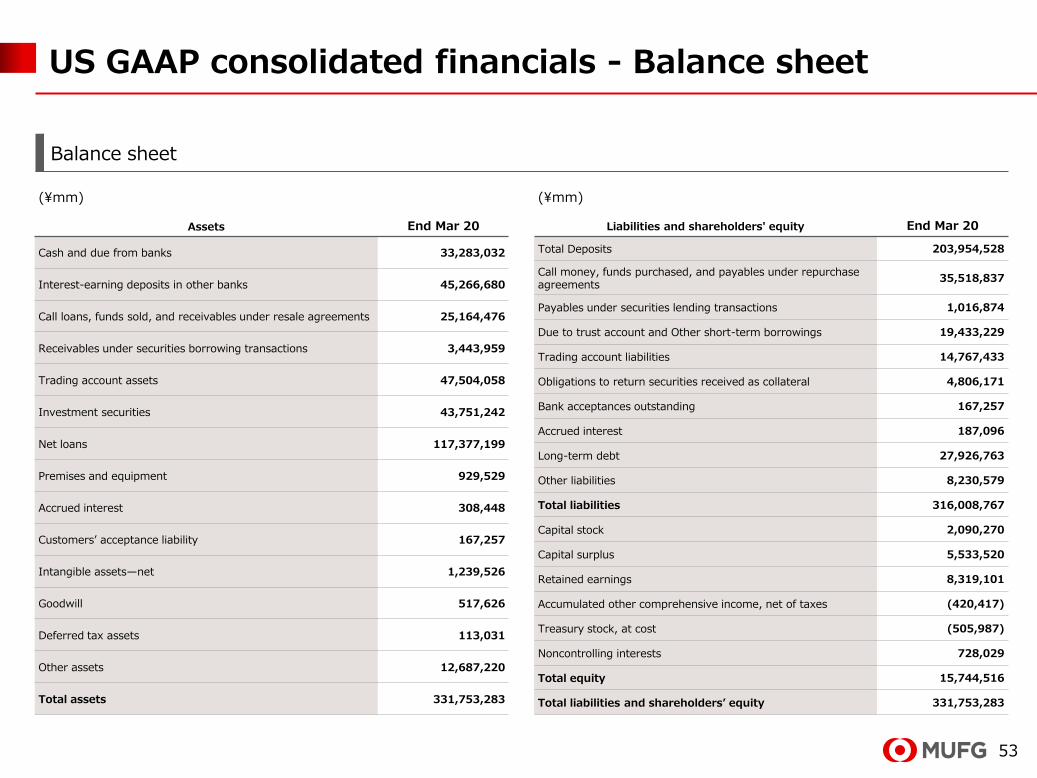
US GAAP consolidated financials - Balance sheet
Balance sheet
(¥mm)
Assets End Mar 20
Cash and due from banks 33,283,032
Interest-earning deposits in other banks 45,266,680
Call loans, funds sold, and receivables under resale agreements 25,164,476
Receivables under securities borrowing transactions 3,443,959
Trading account assets 47,504,058
Investment securities 43,751,242
Net loans 117,377,199
Premises and equipment 929,529
Accrued interest 308,448
Customers’ acceptance liability 167,257
Intangible assets—net 1,239,526
Goodwill 517,626
Deferred tax assets 113,031
Other assets 12,687,220
Total assets 331,753,283
(¥mm)
Liabilities and shareholders' equity End Mar 20
Total Deposits 203,954,528
Call money, funds purchased, and payables under repurchase agreements
35,518,837
Payables under securities lending transactions 1,016,874
Due to trust account and Other short-term borrowings 19,433,229
Trading account liabilities 14,767,433
Obligations to return securities received as collateral 4,806,171
Bank acceptances outstanding 167,257
Accrued interest 187,096
Long-term debt 27,926,763
Other liabilities 8,230,579
Total liabilities 316,008,767
Capital stock 2,090,270
Capital surplus 5,533,520
Retained earnings 8,319,101
Accumulated other comprehensive income, net of taxes (420,417)
Treasury stock, at cost (505,987)
Noncontrolling interests 728,029
Total equity 15,744,516
Total liabilities and shareholders’ equity 331,753,283

54
US GAAP consolidated financials - Statement of operations
Statement of operations
(¥mm)
Statement of Operations Data Fiscal year ended Mar 20
Interest income 3,927,143
Interest expense 1,684,344
Net interest income 2,242,799
Provision for (reversal of) credit losses 321,713
Net interest income after provision for (reversal of) credit losses 1,921,086
Non-interest income 1,875,695
Non-interest expense 3,363,561
Income (loss) before income tax expense 433,220
Income tax expense (benefit) 114,505
Net income before attribution of noncontrolling interests 318,715
Net income (loss) attributable to noncontrolling Interests 12,760
Net income attributable to Mitsubishi UFJ Financial Group 305,955
(¥)
Earnings (loss) per share Fiscal year ended Mar 20
Basic earnings
Earnings applicable to common shareholders of Mitsubishi UFJ Financial Group 23.69
Diluted earnings
Earnings applicable to common shareholders of Mitsubishi UFJ Financial Group 23.47
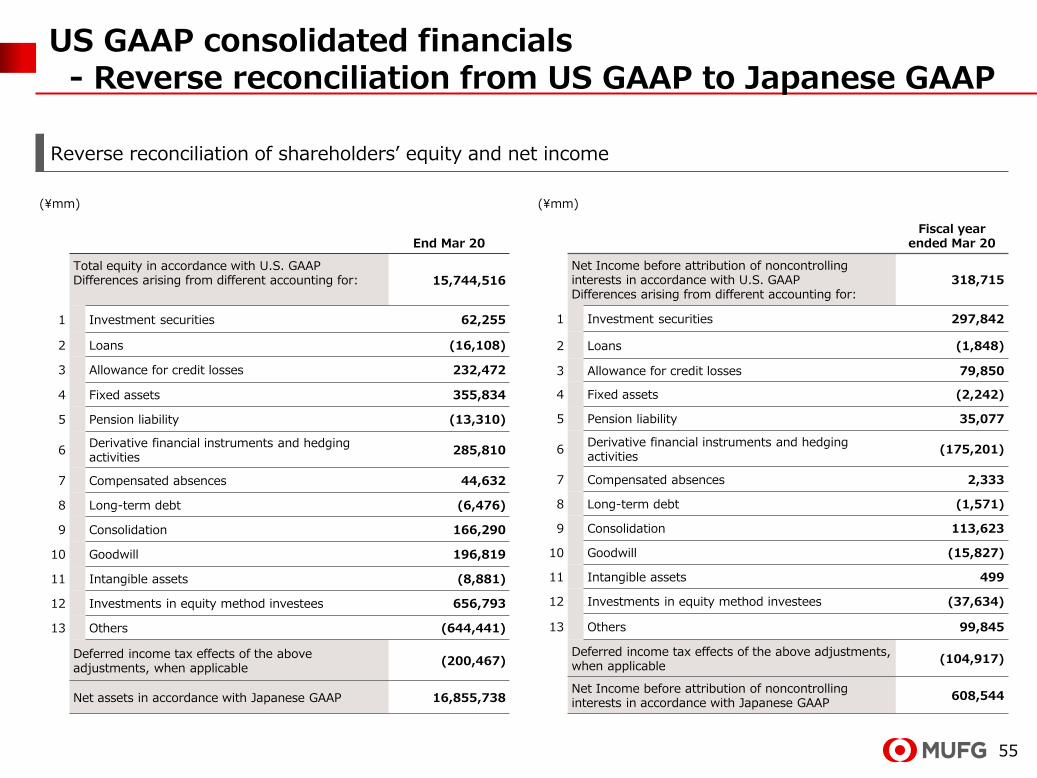
55
US GAAP consolidated financials- Reverse reconciliation from US GAAP to Japanese GAAP
(¥mm)
Fiscal year ended Mar 20
Net Income before attribution of noncontrollinginterests in accordance with U.S. GAAPDifferences arising from different accounting for:
318,715
1 Investment securities 297,842
2 Loans (1,848)
3 Allowance for credit losses 79,850
4 Fixed assets (2,242)
5 Pension liability 35,077
6Derivative financial instruments and hedging activities
(175,201)
7 Compensated absences 2,333
8 Long-term debt (1,571)
9 Consolidation 113,623
10 Goodwill (15,827)
11 Intangible assets 499
12 Investments in equity method investees (37,634)
13 Others 99,845
Deferred income tax effects of the above adjustments, when applicable
(104,917)
Net Income before attribution of noncontrollinginterests in accordance with Japanese GAAP
608,544
(¥mm)
End Mar 20
Total equity in accordance with U.S. GAAPDifferences arising from different accounting for: 15,744,516
1 Investment securities 62,255
2 Loans (16,108)
3 Allowance for credit losses 232,472
4 Fixed assets 355,834
5 Pension liability (13,310)
6Derivative financial instruments and hedging activities
285,810
7 Compensated absences 44,632
8 Long-term debt (6,476)
9 Consolidation 166,290
10 Goodwill 196,819
11 Intangible assets (8,881)
12 Investments in equity method investees 656,793
13 Others (644,441)
Deferred income tax effects of the above adjustments, when applicable
(200,467)
Net assets in accordance with Japanese GAAP 16,855,738
Reverse reconciliation of shareholders’ equity and net income


![Fiscal 2020 Second Quarter Financial Results...Fiscal 2020 Second Quarter Financial Results 9 Note: Grouping of Businesses whose sales are disclosed [Automotive Solutions] Automotive](https://img.pdfslide.us/doc/110x75/5e2f2ffdb7f892297f00c11d/fiscal-2020-second-quarter-financial-results-fiscal-2020-second-quarter-financial.jpg)


![Financial Results for the Fiscal Year Ended March …...2020/05/26 · May 22, 2020 Meiji Yasuda Life Insurance Company [Unofficial translation] Financial Results for the Fiscal Year](https://img.pdfslide.us/doc/110x75/5f410d73e64e0f2d092c3755/financial-results-for-the-fiscal-year-ended-march-20200526-may-22-2020.jpg)