Embed Size (px)
Citation preview

The future, designed and delivered.The future, designed and delivered®.Stuart Bradie – President and Chief Executive OfficerMark Sopp – Executive Vice President and Chief Financial Officer Alison Vasquez – Vice President, Investor Relations
Fiscal 2020 and 4th QuarterFinancial ResultsFebruary 22, 2021
©202 KBR Inc. All Rights Reserved.

This presentation contains forward-looking statements regarding our plans, objectives, goals, strategies, future events, future financial performance and backlog information and other information that is not historical. When used in this presentation, the words “estimates,” “expects,” “anticipates,” “projects,” “plans,” “intends,” “believes,” “forecasts” or future or conditional verbs such as “will,” “should,” “could,” or “may,” and variations of such words or similar expressions are intended to identify forward-looking statements. Suchstatements are based upon our current expectations and various assumptions, which are made in good faith, and we believe there is a reasonable basis for them. However, because forward-looking statements relate to the future, they are subject to inherent risks,uncertainties and other factors that are difficult to predict and which could cause actual results to differ materially from the forward-looking statements contained in this presentation.
These risks and uncertainties include, but are not limited to:
• U.S. government regulatory changes or changes to funding related to our lines of business that could be less favorable. Because we generate a substantial portion of our revenues from contracts with U.S. government agencies, our operating results could be adversely affected by spending caps or changes in budgetary priorities, as well as by delays in the government budget process, program starts or the award of contracts or task orders under contracts. Changes in spending authorizations and budgetary priorities may occur as a result of the shifts in spending priorities from defense-related and other programs as a result of competing demands for federal funds and the number and intensity of military conflicts and other factors;
• operational challenges relating to the COVID-19 pandemic and efforts to mitigate the spread of the virus, including logistical challenges, protecting the health and well-being of our employees, remote work arrangements, performance of contracts and supplychain disruptions;
• the COVID-19 pandemic has increased the severity and duration of world health events, including volatility in the capital markets, deteriorating financial conditions or bankruptcy, and related economic repercussions resulting from severe disruption in multiple industries, which may negatively impact our clients' ability to meet their payment obligations to us in a timely manner; and
• the level of capital spending and access to capital markets by industrial companies, including significant reductions and potential additional reductions in capital expenditures in response to commodity prices and dramatically reduced demand.
Additional information about potential risk factors that could affect our business and financial results is included in our Form 10-K filed on February 24, 2020 and any subsequent Forms 10-Q and 8-K. We caution you not to place undue reliance on the forward-looking statements included in this presentation, which speak only as of the date hereof.
We disclaim any intent or obligation, except as required by law, to revise or update this information to reflect new information or future events or circumstances. This presentation contains the financial measures “EBITDA,” “Adjusted EBITDA,” “Adjusted EPS” and “Adjusted Operating Cash Flow,” which are not calculated in accordance with U.S. GAAP. A reconciliation of the non-GAAP financial measures EBITDA, Adjusted EBITDA, Adjusted EPS and Adjusted Operating Cash Flow to the most directly comparable GAAP financial measure has been provided in the Appendix to this presentation.
Forward-Looking Statements

President and Chief Executive Officer
Stuart Bradie

Proud history, bright future. 4
©2020 KBR Inc. All Rights Reserved.
KBR’s Road to Net-Zero Carbon Emissions
We commissioned an independent provider to calculate our 2019 scope 1 and 2 emissions and business travel emissions.
We used our footprint to inform our carbon offset program and achieved carbon neutrality in 2019.
Step 1 – Achieving Carbon Neutrality
We will continue reducing scope 1 and 2 emissions across the company and expand scope 3 categories.
We will use science-based targets to establish longer-term climate action and net-zero commitments over the next decade.
Step 2 – Reaching Net Zero by 2030
CL I M AT E CHA N GE
To align compensation to our corporate strategy, we have linked environmental, social and governance goals to executive compensation.

Proud history, bright future. 5
©2020 KBR Inc. All Rights Reserved.©2020 KBR Inc. All Rights Reserved.
FY 2020 | Advancing our Strategy
▪ KBR strategy in action
▪ Completed strategic acquisition of Centauri; integration progressing nicely
▪ Focused Sustainable Technology toward high-growth areas
▪ Opportunistically repurchased shares
▪ Delivered strong fiscal 2020 results
▪ $5.8 billion of revenue, $478 million of Adj. EBITDA, $1.73 Adj. EPS, and $290 million of Adj. Operating Cash Flow
▪ Double-digit revenue growth in Defense & Intel and Science & Space businesses
▪ Book-to-bill1 of 1.2x in Government Solutions and 1.4x in Technology Solutions
▪ Initiating 2021 guidance with over 70% work under contract and 20% embedded Adj. EPS growth
1 Excluding the work-off of the long-term PFIs and other adjustments

Proud history, bright future. 6
©2020 KBR Inc. All Rights Reserved.
Market Outlook | Defense & Intel
MARKET DRIVERS AND OUTLOOK
▪ Shifting threat environment and national security and defense priorities opposite near peer threats
▪ Strong support for investment to advance critical national security interests across military space, intelligence, cyber and missile defense
▪ Investment in next-gen, emerging technology (e.g., AI/ML, autonomous systems, cyber warfare, trusted microelectronics, directed energy and hypersonics)
▪ Elevated global threat environment
RECENT TRENDS AND WINS
▪ Achieved 1.3x overall book-to-bill in the year; increasing average contract value and tenor
▪ Awarded over $900 million in IAC-MAC IDIQ tasks to perform strategic, technical and advanced R&D, prototyping and analysis, balanced nicely across the Army, Air Force and Navy
▪ Awarded R&D and prototyping contract for the U.S. Air Force high energy laser program
▪ Awarded a new 5-year $539 million task order to support rapid prototyping and fielding of systems for the U.S. Air Force to take national space capabilities and apply them at the tactical level to support operational requirements
DEFENSE & INTEL23%REVENUE GROWTH
FY 2020
$4.2BBACKLOG AND
OPTIONS
F o rm er ly D efen s e S ys tem s E n g in eer in g a n d C en ta u r i

Proud history, bright future. 7
©2020 KBR Inc. All Rights Reserved.
Market Outlook | Science & Space
MARKET DRIVERS AND OUTLOOK
▪ Expanded collaboration across NASA, Department of Defense and intelligence communities in areas such as space domain awareness, launch support, interoperable comms networks and scientific R&D
▪ New administration signaling continued support of the Artemis program and space exploration, albeit on a more conservative program schedule
▪ Greater domestic emphasis on climate change, benefitting agencies like NOAA and USGS
▪ Investment in the space industrial base as a foundation for U.S. space superiority, spanning scientific, military and commercial, and as an engine for broader economic recovery
RECENT TRENDS AND WINS
▪ Progressive engagement and expansion on existing NASA and DOD programs driving consistent growth
▪ Awarded a 5-year, $300 million contract to provide scientific support, advanced data processing and analysis, high-performance computing and networking, and systems engineering support to U.S. Geological Survey Earth Resources Observation and Science Center
SCIENCE & SPACE12%REVENUE GROWTH
FY 2020
$2.5BBACKLOG AND
OPTIONS
F o rm er ly S p a ce & M is s io n S o lu t io n s

Proud history, bright future. 8
©2020 KBR Inc. All Rights Reserved.
Market Outlook | Readiness & Sustainment
MARKET DRIVERS AND OUTLOOK
▪ Expanding O&M-funded sustaining operations while supporting contingency as needed; reducing proportional OCO mix
▪ Drive toward digitalization, modernization, automation and energy efficiency
▪ New agile supply chains emerging with global reset driven by COVID-19 and China decoupling
▪ Shifting threat environment and national security and defense priorities opposite near-peer threats
RECENT TRENDS AND WINS
▪ Awarded multi-year contract for management of automated fuel systems to plan and perform preventative and corrective maintenance; support documentation maintenance site support for supervisory control and data acquisition systems; and provide site support for equipment and material
▪ Beginning transition on an 8-year $974 million sustaining base operations contract for the U.S. Air Force in Europe
▪ Won numerous contracts to support domestic needs and priorities under Northcom
READINESS & SUSTAINMENT
1.3XBOOK-TO-BILL
FY 2020
$2.3BBACKLOG AND
OPTIONS
F o rm er ly L o g i s t i c s
Proud history, bright future. 9
©2020 KBR Inc. All Rights Reserved.
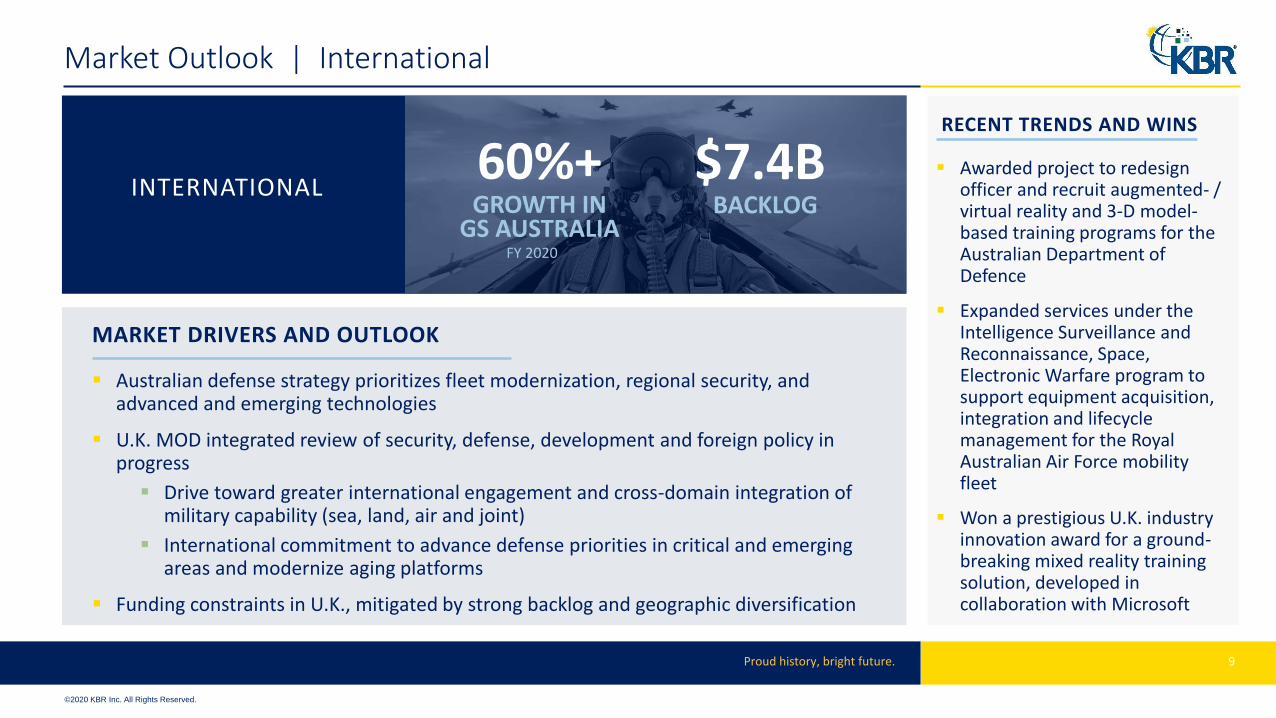
Market Outlook | International
MARKET DRIVERS AND OUTLOOK
▪ Australian defense strategy prioritizes fleet modernization, regional security, and advanced and emerging technologies
▪ U.K. MOD integrated review of security, defense, development and foreign policy in progress
▪ Drive toward greater international engagement and cross-domain integration of military capability (sea, land, air and joint)
▪ International commitment to advance defense priorities in critical and emerging areas and modernize aging platforms
▪ Funding constraints in U.K., mitigated by strong backlog and geographic diversification
RECENT TRENDS AND WINS
▪ Awarded project to redesign officer and recruit augmented- / virtual reality and 3-D model-based training programs for the Australian Department of Defence
▪ Expanded services under the Intelligence Surveillance and Reconnaissance, Space, Electronic Warfare program to support equipment acquisition, integration and lifecycle management for the Royal Australian Air Force mobility fleet
▪ Won a prestigious U.K. industry innovation award for a ground-breaking mixed reality training solution, developed in collaboration with Microsoft
INTERNATIONAL60%+GROWTH IN
GS AUSTRALIA
$7.4BBACKLOG
FY 2020

Proud history, bright future. 10
©2020 KBR Inc. All Rights Reserved.
Market Outlook | Sustainable Technology Solutions
MARKET DRIVERS AND OUTLOOK
▪ Growing number of countries and companies targeting reduction in carbon footprint driving demand for energy transition advisory and sustainable technology
▪ Global population growth and expanding middle class increase demand for fertilizers for food production, non-single-use plastics for commercial development, and other specialty chemicals
▪ Investment to improve product diversification, reduce emissions and improve cost efficiency
▪ Aging industrial asset base driving demand for smarter maintenance
RECENT TRENDS AND WINS
▪ Entered exclusive alliance with Mura Technology to offer Cat-HTRTM, a sustainability-focused, innovative technology that recycles end-of-life, mixed-use plastic, contributing to the growth of the plastics circular economy
▪ Awarded second phase for domestic K-SAAT™ revamp to replace an existing hydrofluoric acid alkylation unit
▪ Awarded numerous hydrogen energy and development studies
▪ Awarded a contract to provide an ammonia technology license, basic engineering design package, PEQ, and catalyst for an innovative, zero-CO2-emission plant
SUSTAINABLE TECHNOLOGY
SOLUTIONS
1.4XBOOK-TO-BILLHERITAGE TS
FY 2020
$2.6BBACKLOG
(TS AND ES)
F o rm er ly T ech n o lo g y a n d E n erg y S o lu t io n s

Proud history, bright future. 11
©2020 KBR Inc. All Rights Reserved.©2020 KBR Inc. All Rights Reserved.
Market Outlook | In Summary
Lead
Positioning & Pursuit
Proposal & Negotiation
$66B
$51B
$14B
$131 Billion
KBR Pursuit Pipeline
150+ Pursuits > $100M10+ Pursuits > $1B
Pipeline as of December 31, 2020; award announcements expected through December 2024; includes CentauriBacklog; Centauri added $1.4 billion of backlog in the 4th quarter 2020; 9% GS growth in 2020 excluding Centauri.
95%RECOMPETE
WIN RATE IN 2020
20%2020 GROWTH IN GS BACKLOG AND OPTION
22%2020 GROWTH IN
TECHNOLOGY BACKLOG
LOWRECOMPETE RISK
IN 2021
Expanding backlog, strong win rates and attractive pipeline position KBR well for growth into the future!
EVP & Chief Financial Officer
Mark Sopp

Proud history, bright future. 13
©2020 KBR Inc. All Rights Reserved.
1See Appendix for reconciliation of Adjusted EBITDA , Adjusted EPS and Adjusted Operating Cash Flow
13
FY 2020 | Financial Snapshot
REVENUE ADJUSTED EBITDA1ADJUSTED EBITDA MARGIN1
ADJUSTED EPS1 ADJ. OPERATING CASH FLOW1 BACKLOG
OPTIONS
BACKLOG
$ in millions, except EPS and Backlog
$5,639 $5,767
2019 2020
$471 $478
2019 2020
8% 8%
2019 2020
$1.69 $1.73
2019 2020
$256 $290
2019 2020
$15B $15B
$3B$4B
4Q19 4Q20

Proud history, bright future. 14
©2020 KBR Inc. All Rights Reserved.
1See Appendix for reconciliation of Adjusted EBITDA , Adjusted EPS and Adjusted Operating Cash Flow
14
4Q 2020 | Financial Snapshot
REVENUE ADJUSTED EBITDA1ADJUSTED EBITDA MARGIN1
ADJUSTED EPS1 ADJ. OPERATING CASH FLOW1 BACKLOG
OPTIONS
BACKLOG
$ in millions, except EPS and Backlog
$1,452 $1,466
4Q19 4Q20
$117
$135
4Q19 4Q20
8%9%
4Q19 4Q20
$0.46 $0.51
4Q19 4Q20
$57
$21
4Q19 4Q20
$15B $15B
$3B$4B
4Q19 4Q20

Proud history, bright future. 15
©2020 KBR Inc. All Rights Reserved.
FY 2020 | Segment Results
▪ 12% growth in Science & Space▪ 23% growth in Defense & Intel, 7%
organic▪ Growth in sustaining O&M within
Readiness & Sustainment; offset by ~$300M reduction in contingency revenue (Middle East OCO and 2019 Tyndall disaster recovery work)
▪ Increased mix of license revenue in 2020 driving excellent profitability
▪ Strong execution and proactive cost measures taken in 2020 to enhance and preserve profitability
▪ Net negative working capital
▪ Revenue and EBITDA as expected
▪ Cost efficiency initiatives progressing on plan
Note: See Appendix for reconciliation of Adjusted EBITDA
3,925 3,934
404 415
FY19 FY20 FY19 FY20
Government Solutions
10% 11%374
303 94
86
FY19 FY20 FY19 FY20
Technology Solutions
25% 29%
Revenue Adj. EBITDA
1,339
1,526
75
44
FY19 FY20 FY19 FY20
Energy Solutions
6%
3%
Revenue Adj. EBITDARevenue Adj. EBITDA

Proud history, bright future. 16
©2020 KBR Inc. All Rights Reserved.
`
CAPITALDEPLOYMENT PRIORITIES
Fund Organic Growth
Maintain Attractive Dividend
Maintain Responsible Leverage
Strategic M&A or Share Repurchase
©2020 KBR Inc. All Rights Reserved.
Capital Deployment and Liquidity Profile
HEALTHY LIQUIDITY PROFILE
Attractive Dividend
▪ $0.10 per share quarterly dividend▪ 25% increase from 2019
Net Leverage Target
▪ Target net leverage set at 2.5x-3.0x▪ Reflects shift in portfolio toward
sustaining, differentiated, cash-generative portfolio
NETLEVERAGE
TARGET
2.5x to 3.0xTARGET RANGE
NETLEVERAGE
2.4xAS OF DECEMBER 31, 2020
Near-Term Deployable Capital
▪ Deployed $51 million to repurchase shares▪ Healthy balance sheet capacity▪ Attractive free cash flow with low capital
intensity business model
NOTE: Net Leverage represents total debt minus cash divided by adjusted pro forma EBITDA

Proud history, bright future. 17
©2020 KBR Inc. All Rights Reserved.©2020 KBR Inc. All Rights Reserved.
Initiating FY 2021 Guidance
FY 2021 Guidance
Consolidated Revenue4% growth from 2020 at the midpoint
$5.8 - $6.2 billion
Adjusted EBITDA Margin~70 bps expansion from 2020
~9%
Adjusted EPS1
>20% growth from 2020 at the midpoint$2.00 - $2.20
Effective tax rate 25% - 26%
Adjusted operating cash flow1 $280 - $320 million
(1) See Appendix for reconciliation of Adjusted EPS and Adjusted Operating Cash Flow

KEY TAKEAWAYS
▪ Disciplined strategic execution, excellent resilience, and strong financial performance in 2020
▪ Attractive growth in highly differentiated, technology-enabled businesses, increasing visibility, expanding margins and reducing volatility risk
▪ Strong market fundamentals combined with robust bookings and healthy pipeline support continued momentum
▪ 2021 guidance reflects above-market earnings growth of ~20% and excellent cash conversion


AppendicesDOING THE RIGHT THING FOR THE PLANET, OUR PEOPLE AND OUR COMMUNITIES WHILE PURSUING BUSINESS GROWTH
Appendices

Proud history, bright future. 21
©2020 KBR Inc. All Rights Reserved.
Non-GAAP Reconciliations: Adjusted EPS & Adjusted Cash Flow
Adjusted EPS ReconciliationQuarter Ending
4Q19 4Q20 FY19 FY20
EPS (Diluted) $0.40 $0.13 $1.41 $(0.51)
Add Back:
Restructuring and impairment charges 0.00 0.20 0.00 1.87
Ichthys interest and commercial dispute cost 0.01 0.03 0.07 0.12
Non-cash imputed interest on conversion option 0.02 0.02 0.06 0.06
Amortization related to acquisitions 0.02 0.08 0.08 0.14
Legacy legal fees 0.01 0.01 0.05 0.04
Acquisition and integration cost 0.00 0.04 0.02 0.05
Non-cash gain on legal entity rationalization1 0.00 0.00 0.00 (0.04)
Adjusted EPS $0.46 $0.51 $1.69 $1.73
Adjusted Operating Cash Flow Reconciliation
4Q19 4Q20 FY19 FY20
Cash flows provided by operating activities $57 $122 $256 $367
Adjustments:
Add back: Major project advance work-off 0 17 0 81
Remove: CARES act temporary tax payment relief 0 (18) 0 (58)
Remove: Receivable monetization related to acquisition 0 (100) 0 (100)
Adjusted Cash flows provided by operating activities $57 $21 $256 $290
Adjusted EPS Guidance
2021 Guidance
EPS (Diluted) $1.39 $1.59
Add Back:
Amortization related to acquisitions 0.25
Ichthys interest and commercial dispute cost 0.17
Acquisition, integration and restructuring 0.09
Non-cash imputed interest on conversion option2 0.06
Legacy legal fees 0.04
Non-cash gain on legal entity rationalization1 TBD
Adjusted EPS $2.00 $2.20
Adjusted Operating Cash Flow Guidance
2021 Guidance Lower Upper
Cash flows provided by operating activities $250 $290
Adjustments:
Add back: Major project advance work-off 0
Remove: CARES act temporary tax payment relief 30
Remove: Receivable monetization related to acquisition 0
Adjusted Cash flows provided by operating activities $280 $320
1Gain (loss) on close-out of legal entities will vary based on actual entities closed during the year; 2Conversion hedge will be calculated and adjusted quarterly based on KBR trading price

Proud history, bright future. 22
©2020 KBR Inc. All Rights Reserved.
EBITDA is defined as earnings before interest income / expense, income taxes, other non-operating income / expense (including FX) and depreciation & amortization.
Non-GAAP Reconciliation: Consolidated & Adjusted EBITDA
1Pro Forma EBITDA includes full-year impact of Centauri acquisition and is used for net debt leverage ratio
Adjusted EBITDA ReconciliationMar 31, 2019 Jun 30, 2019 Sep 30, 2019 Dec 31, 2019 FY 19 Mar 31, 2020 Jun 30, 2020 Sep 30, 2020 Dec 31, 2020 FY 20
Net Income (Loss) Attributable to KBR $40 $48 $56 $58 $202 ($104) ($39) $52 $19 ($72)
Add Back:
Interest Expense $25 $26 $25 $23 $99 $23 $19 $18 $23 $83
Provision (benefit) for Income Taxes $16 $18 $24 $1 $59 ($1) $6 $19 $2 $26
Other non-operating (income) expense ($5) ($2) ($3) $5 ($5) ($7) $2 $4 $0 ($1)
Depreciation & Amortization $25 $23 $28 $28 $104 $27 $21 $26 $41 $115
Consolidated EBITDA $101 $113 $130 $115 $459 ($62) $9 $119 $85 $151 $0 $0
Add Back:
Restructuring and impairment charge, net of NCI $0 $0 $0 $0 $0 $173 $96 $1 $38 $308
Non-cash gain on legal entity rationalization $0 $0 $0 $0 $0 ($8) $1 $0 $0 ($7)
Ichthys commercial dispute costs $0 $0 $0 $0 $0 $7 ($2) $1 $3 $9
Legacylegal fees $4 $3 $1 $2 $10 $2 $2 $2 $2 $8
Acquisition & integration related expenses $1 $1 $0 $0 $2 $0 $0 $2 $7 $9
Adjusted EBITDA $106 $117 $131 $117 $471 $112 $106 $125 $135 $478
Centauri Pro Forma EBITDA $9 $12 $14 $35
Pro Forma Adjusted EBITDA1 $106 $117 $131 $117 $471 $121 $118 $139 $135 $513
Quarter Ending Quarter Ending

Proud history, bright future. 23
©2020 KBR Inc. All Rights Reserved.
EBITDA is defined as earnings before interest income / expense, income taxes, other non-operating income / expense (including FX) and depreciation & amortization.
Non-GAAP Reconciliation: Segment EBITDA and Segment Adjusted EBITDA
Mar 31, 2019 Jun 30, 2019 Sep 30, 2019 Dec 31, 2019 FY19 Mar 31, 2020 Jun 30, 2020 Sep 30, 2020 Dec 31, 2020 FY20
Net Income Attributable To Government Solutions $ 69 $ 91 $ 87 $ 88 $ 335 $ 92 $ 91 $ 94 $ 69 $ 346
Add Back:
Interest expense $ 1 $ 1 $ 1 $ 0 $ 3 $ 0 $ 0 $ 0 $ 1 $ 1
Other non-operating (income) expense $ 0 ($1) $ 0 ($1) ($2) $ 0 $ 0 ($1) $ 1 $ 0
Depreciation & amortization $ 15 $ 13 $ 17 $ 13 $ 58 $ 12 $ 10 $ 11 $ 25 $ 58- -
EBITDA - GS $ 85 $ 104 $ 105 $ 100 $ 394 $ 104 $ 101 $ 104 $ 96 $ 405
Add Back:
Legacy legal fees $ 4 $ 3 $ 1 $ 2 $ 10 $ 2 $ 2 $ 2 $ 2 $ 8
Restructuring and impairment charge $ 0 $ 0 $ 0 $ 0 $ 0 $ 0 $ 0 $ 0 $ 2 $ 2
Adjusted EBITDA - GS $ 89 $ 107 $ 106 $ 102 $ 404 $ 106 $ 103 $ 106 $ 100 $ 415
Net Income Attributable To Technology Solutions $ 20 $ 18 $ 24 $ 26 $ 89 $ 22 $ 18 $ 22 $ 17 79
Add Back:
Interest expense $ 0 $ 0 $ 0 $ 0 $ 1 $ 0 $ 0 $ 0 $ 1 $ 1
Other non-operating (income) expense ($0) ($0) ($1) $ 1 ($0) $ 0 $ 0 $ 1 ($0) $ 1
Depreciation & amortization $ 2 $ 1 $ 1 $ 2 $ 6 $ 1 $ 1 $ 2 $ 1 $ 5- -
EBITDA - TS $ 22 $ 19 $ 24 $ 29 $ 94 $ 23 $ 19 $ 25 $ 19 $ 86
Net Income (Loss) Attributable To Energy Solutions $ 24 $ 16 $ 10 $ 6 $ 56 ($104) ($90) $ 3 $ 15 ($177)
Add Back:
Interest expense $ 0 $ 0 $ 0 $ 0 $ 0 $ 0 $ 0 $ 0 $ 0 $ 0
Other non-operating (income) expense ($1) ($0) ($1) $ 1 ($2) $ 1 $ 1 $ 1 ($0) $ 3
Depreciation & amortization $ 5 $ 5 $ 5 $ 6 $ 21 $ 6 $ 6 $ 6 $ 5 $ 24- -
EBITDA - ES $ 28 $ 21 $ 13 $ 13 $ 75 ($97) ($83) $ 10 $ 20 ($150)
Add Back:
Ichthys interest and commercial dispute costs $ 0 $ 0 $ 0 $ 0 $ 0 $ 7 ($2) $ 1 $ 3 $ 9
Restructuring and impairment charge, net of NCI $ 0 $ 0 $ 0 $ 0 $ 0 $ 109 $ 88 $ 1 ($6) $ 192
Non-cash gain on legal entity rationalization $ 0 $ 0 $ 0 $ 0 $ 0 ($8) $ 1 $ 0 $ 0 ($7)
Adjusted EBITDA - ES $ 28 $ 21 $ 13 $ 13 $ 75 $ 11 $ 4 $ 12 $ 17 $ 44
Quarter Ending Quarter Ending

Proud history, bright future. 24
©2020 KBR Inc. All Rights Reserved.
Operating Income by Segment
($ in millions, except EPS) GS TS ES NSB Other Total KBR
Revenues $ 3,934 $ 303 $ 1,526 $ 4 $ 0 $ 5,767
Gross Profit $ 483 $ 105 $ 86 ($8) $ 0 $ 666
Equity in Earnings 25 - 5 - - 30
SG&A (158) (23) (65) - (89) (335)
Acquisition & Integration - - - - (9) (9)
Goodwill Impairment - - (99) - - (99)
Restructuring and Impairments (2) - (99) (8) (105) (214)
Gain on Disposition of Assets 1 - 16 - 1 18
Operating Income (Loss) $ 349 $ 81 ($154) ($16) ($203) $ 57
($ in millions, except EPS) GS TS ES NSB Other Total KBR
Revenues $ 3,925 $ 374 $ 1,339 $ 1 $ 0 $ 5,639
Gross Profit $ 430 $ 118 $ 100 $ 5 $ 0 $ 653
Equity in Earnings 29 - 19 (13) - 35
SG&A (134) (28) (63) - (116) (341)
Acquisition & Integration - - - - (2) (2)
Gain on Disposition of Assets 12 - - - 5 17
Operating Income (Loss) $ 337 $ 90 $ 56 ($8) ($113) $ 362
FY 2020
FY 2019