Embed Size (px)
Citation preview
FISCAL 2016 RESULTS
November 17, 2016
FORWARD-LOOKING INFORMATION
2 –
This presentation contains statements that may be considered as forward-looking statements and as such may not relate strictly to historical or current facts. These statements represent management's views as of the date they are made and Sodexo assumes no obligation to update them.
Alternative Performance Measures have been marked with an * please refer to section 7 for definitions (from slide 56).
Fiscal 2016 Results - November 17, 2016

1. FISCAL 2016 HIGHLIGHTS
2. FISCAL 2016 PERFORMANCE
3. ON-SITE SERVICES
4. BENEFITS AND REWARDS SERVICES
5. NEW SEGMENT REPORTING
6. OUTLOOK
7. ALTERNATIVE PERFORMANCE MEASURE DEFINITIONS
APPENDICES
CONTENTS
3 – Fiscal 2016 Results - November 17, 2016
4 –
FISCAL 2016 HIGHLIGHTS
Fiscal 2016 Results - November 17, 2016

Yet another year of solid performance:
HIGHLIGHTS OF FISCAL 2016
5 – Fiscal 2016 Results - November 17, 2016
Consumer focus driving innovative digital solutions
Developing M&A pipeline
Recognized Corporate
Responsibility
Segmentationenhancing business
opportunities
Operating profit1growth objective
achieved
+8.2%
Further Operating profit margin1
improvement
+ 30 BPS
Strong balance sheet
11%Gearing*
Revenue organic growth*
+2.5%
1 Before Fiscal 2016 exceptional expenses and currency effect
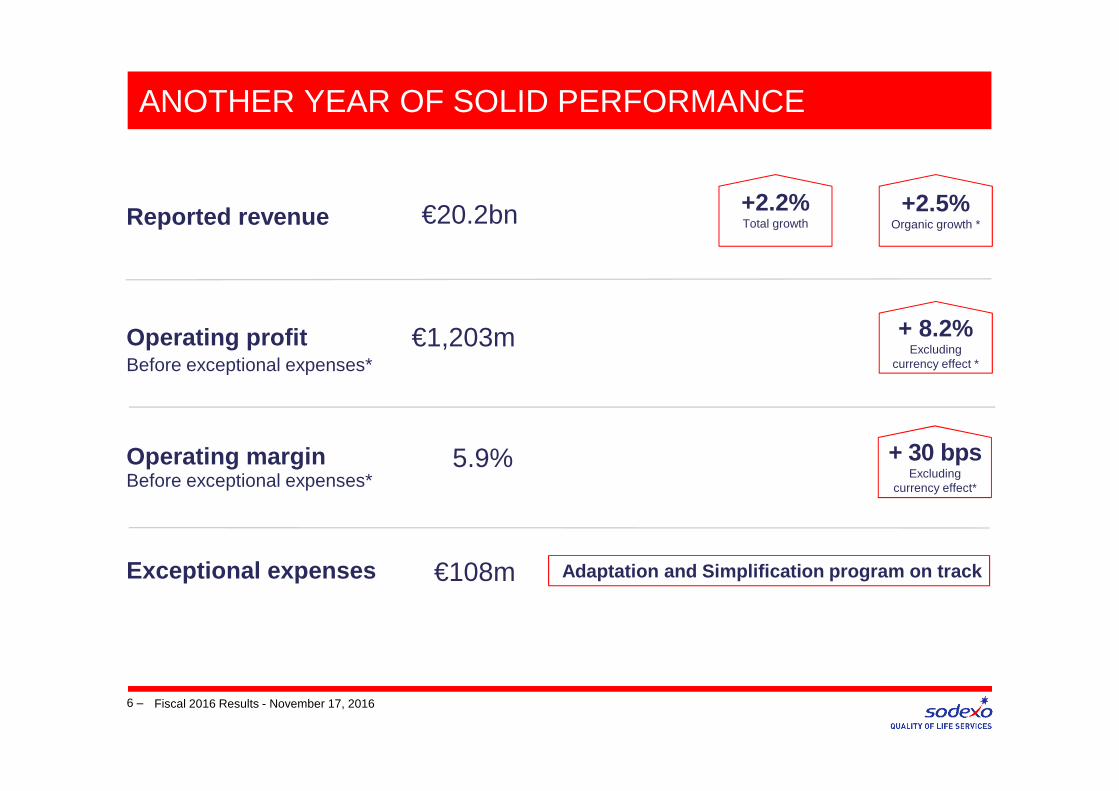
ANOTHER YEAR OF SOLID PERFORMANCE
6 –
Operating profit
Operating margin
€1,203m + 8.2%Excluding
currency effect *
5.9% + 30 bpsExcluding
currency effect*
Exceptional expenses €108m
Reported revenue €20.2bn +2.5%Organic growth *
+2.2%Total growth
Fiscal 2016 Results - November 17, 2016
Before exceptional expenses*
Before exceptional expenses*
Adaptation and Simplification program on track

ANOTHER YEAR OF SOLID PERFORMANCE
7 – Fiscal 2016 Results - November 17, 2016
Group net profit€721mBefore non-recurring items*
+ 5.2%Excluding
currency effect*
EPS€4.77Before non-recurring items*
+ 5.8%Excluding
currency effect*
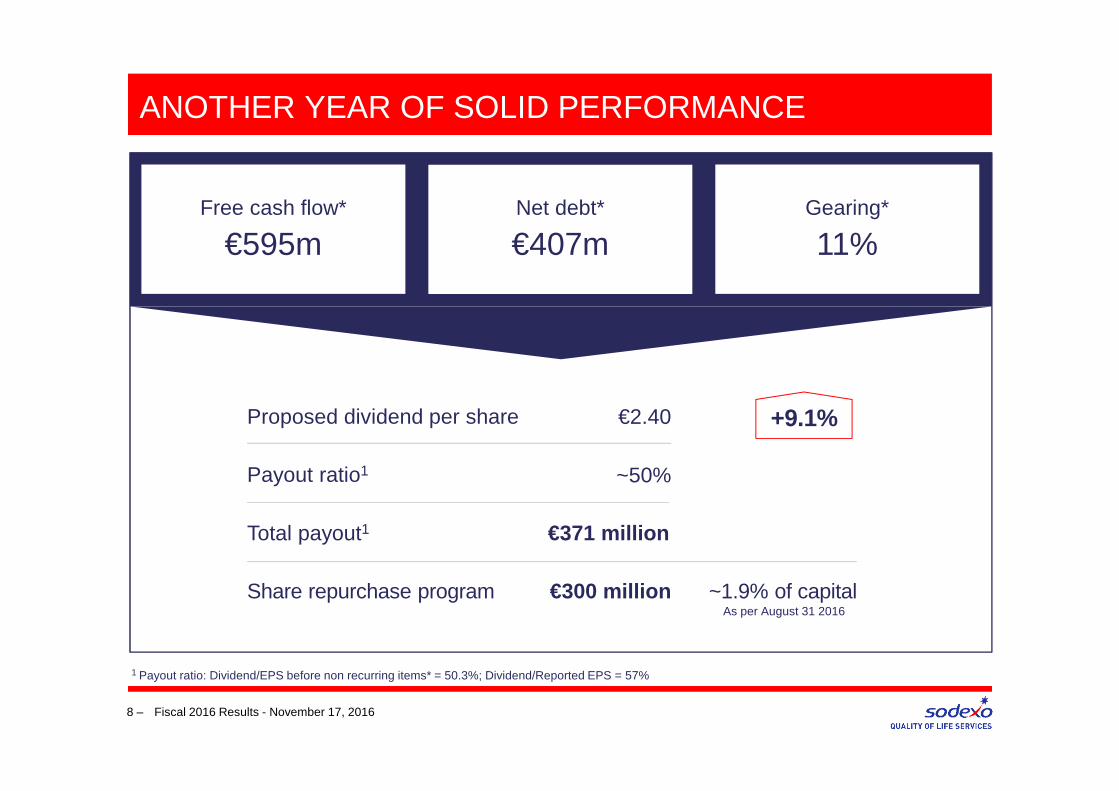
ANOTHER YEAR OF SOLID PERFORMANCE
Proposed dividend per share €2.40
Payout ratio1 ~50%
Share repurchase program €300 million ~1.9% of capital
Total payout1 €371 million
+9.1%
1 Payout ratio: Dividend/EPS before non recurring items* = 50.3%; Dividend/Reported EPS = 57%
Net debt*
€407mGearing*
11%Free cash flow*
€595m
8 – Fiscal 2016 Results - November 17, 2016
As per August 31 2016

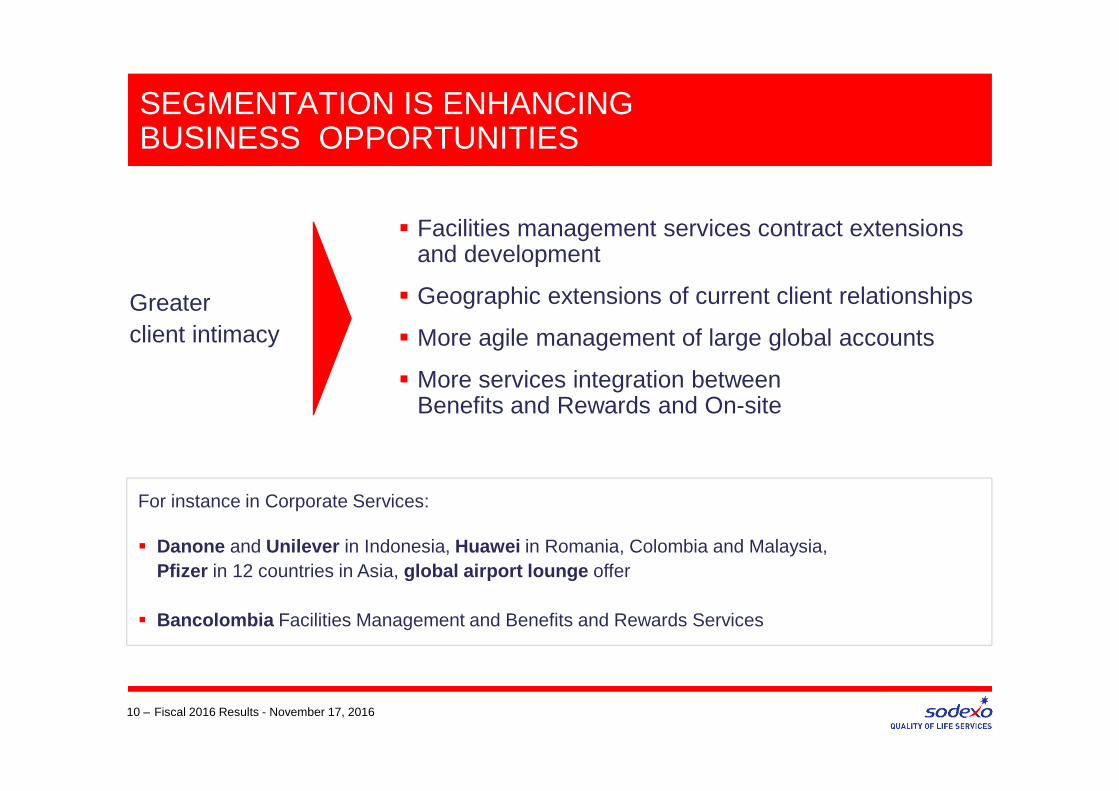
SEGMENTATION IS ENHANCING BUSINESS OPPORTUNITIES
9 – Fiscal 2016 Results - November 17, 2016
Melaleuca Women’s prison in Australia
� Driving segment development in white spaces
� Clients seeking productivity and global footprint
SEGMENTATION IS ENHANCING BUSINESS OPPORTUNITIES
10 – Fiscal 2016 Results - November 17, 2016
Greater client intimacy
For instance in Corporate Services:
� Danone and Unilever in Indonesia, Huawei in Romania, Colombia and Malaysia, Pfizer in 12 countries in Asia, global airport lounge offer
� Bancolombia Facilities Management and Benefits and Rewards Services
� Facilities management services contract extensions and development
� Geographic extensions of current client relationships
� More agile management of large global accounts
� More services integration between Benefits and Rewards and On-site

INCREASE THE VALUE WE BRING THROUGH INNOVATION
LEVERAGE INNOVATION CULTURE
11 –
A web platform allowing everyone to share, like, support
and enrich ideas withinnovative communities
ENGAGE THE COLLECTIVE INTELLIGENCE OF SODEXO’S ECOS YSTEM TO TRANSFORM IDEAS INTO VALUE
Share your ideas
eNOVhub
The eNOVchallenge was only the first of many internal and/or external innovation contests
that will come
Innovate continuously and transform your ideas into
prototypes
Think out of the boxwith our network of partners:
start-ups, incubators and suppliers
Take part in a contest
Develop your ideas
Innovate with partners
eNOVcontest eNOVprogram Open Innovation
Fiscal 2016 Results - November 17, 2016
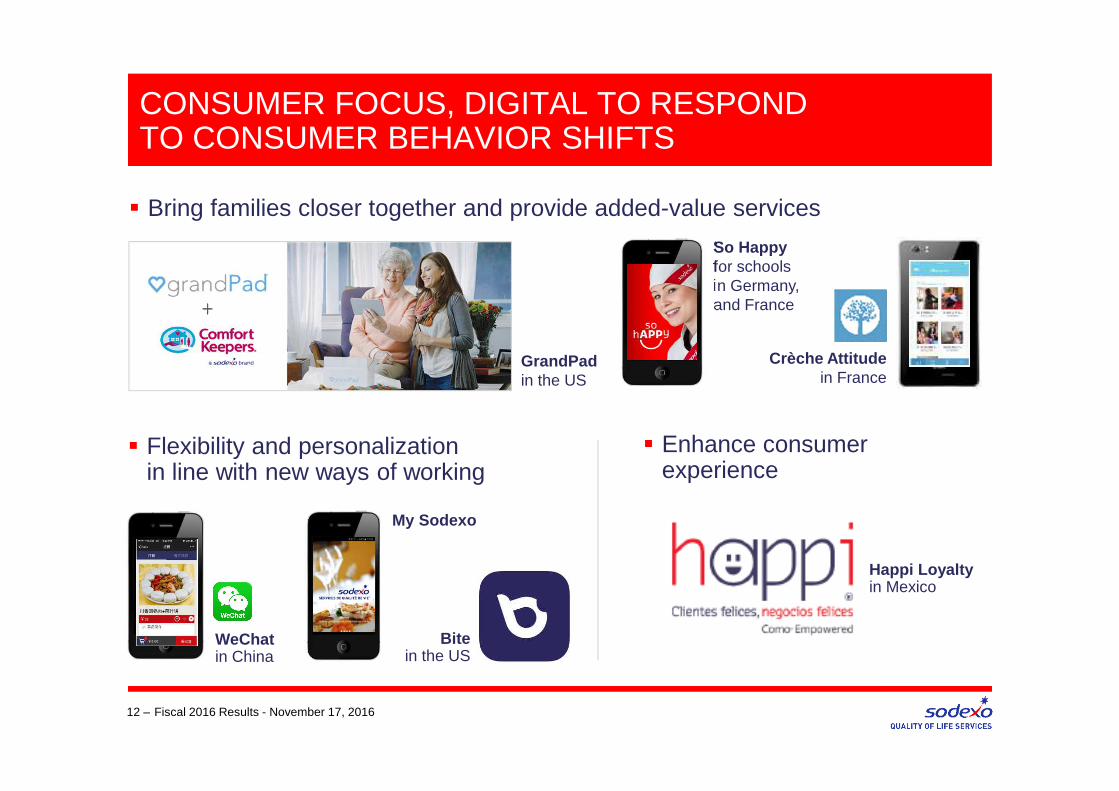
CONSUMER FOCUS, DIGITAL TO RESPOND TO CONSUMER BEHAVIOR SHIFTS
12 – Fiscal 2016 Results - November 17, 2016
So Happy for schoolsin Germany, and France
GrandPadin the US
� Bring families closer together and provide added-value services
Crèche Attitude in France
WeChatin China
� Flexibility and personalization in line with new ways of working
Bite in the US
� Enhance consumer experience
Happi Loyaltyin Mexico
My Sodexo
13 – Fiscal 2016 Results - November 17, 2016
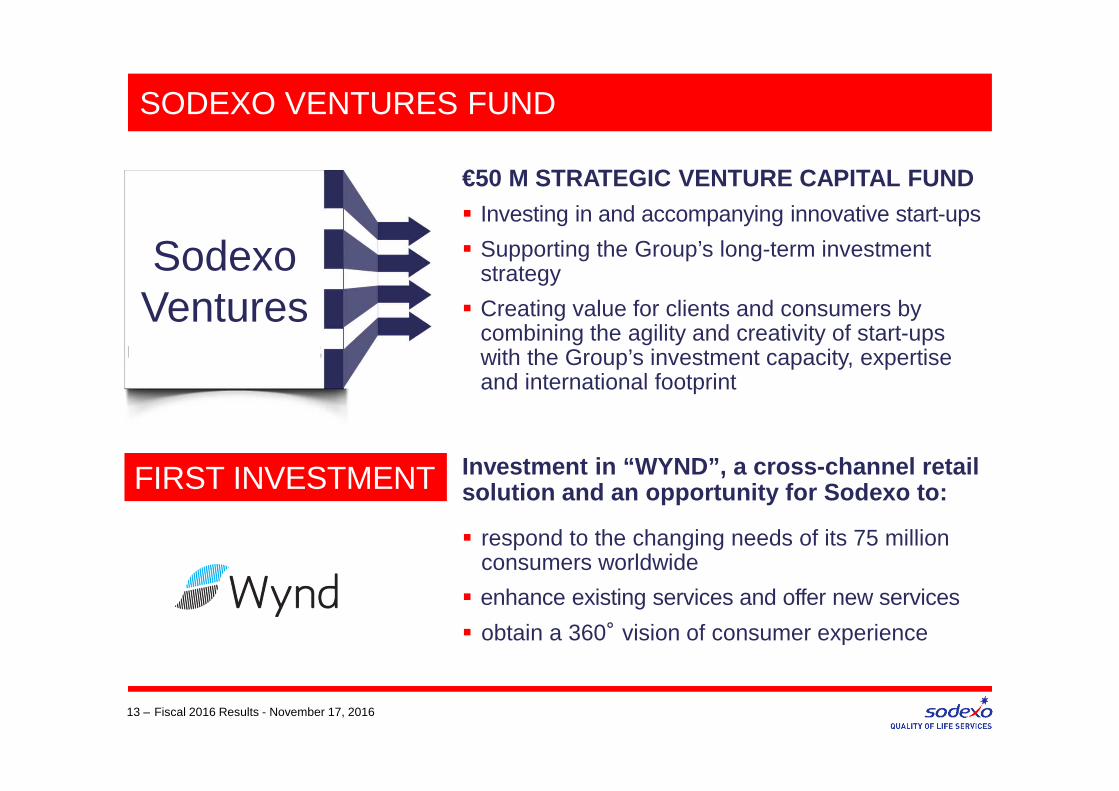
SODEXO VENTURES FUND
SodexoVentures
Investment in “WYND”, a cross-channel retail solution and an opportunity for Sodexo to:FIRST INVESTMENT
� respond to the changing needs of its 75 million consumers worldwide
� enhance existing services and offer new services
� obtain a 360°vision of consumer experience
€50 M STRATEGIC VENTURE CAPITAL FUND � Investing in and accompanying innovative start-ups
� Supporting the Group’s long-term investment strategy
� Creating value for clients and consumers by combining the agility and creativity of start-ups with the Group’s investment capacity, expertise and international footprint
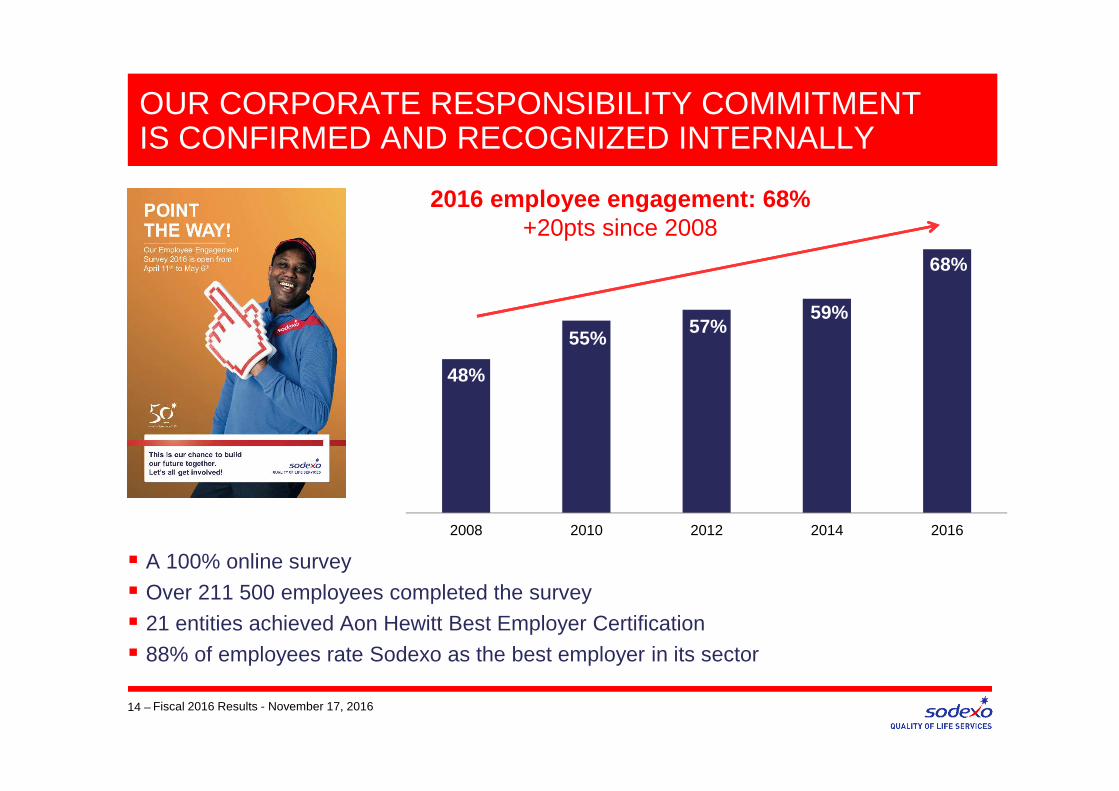
OUR CORPORATE RESPONSIBILITY COMMITMENTIS CONFIRMED AND RECOGNIZED INTERNALLY
Fiscal 2016 Results - November 17, 201614 –
� A 100% online survey
� Over 211 500 employees completed the survey
� 21 entities achieved Aon Hewitt Best Employer Certification
� 88% of employees rate Sodexo as the best employer in its sector
48%
55%57%
59%
68%
2008 2010 2012 2014 2016
2016 employee engagement: 68% +20pts since 2008
OUR CORPORATE RESPONSIBILITY COMMITMENTIS CONFIRMED AND RECOGNIZED EXTERNALLY
Fiscal 2016 Results - November 17, 201615 –
Awarded CEO Leadership award by
United Nations Women Empowerment Principles
Industry Leader of the
Dow Jones Sustainability Index for the 12th consecutive year
Carbon emissionsreduction by 34% between 2011 and 2020
Clinton Global Initiative
OUR CORPORATE RESPONSIBILITY COMMITMENTIS ACTIVE IN DAILY LIFE
Fiscal 2016 Results - November 17, 201616 –
Founding Member of the
International Food Waste Coalition
Partnership for a Healthier America
SustainableSea Food
Sodexo Awarded Maximum Score on World Wildlife Fund Palm
Oil Buyers Scorecard
FISCAL 2016 PERFORMANCE
17 – Fiscal 2016 Results - November 17, 2016
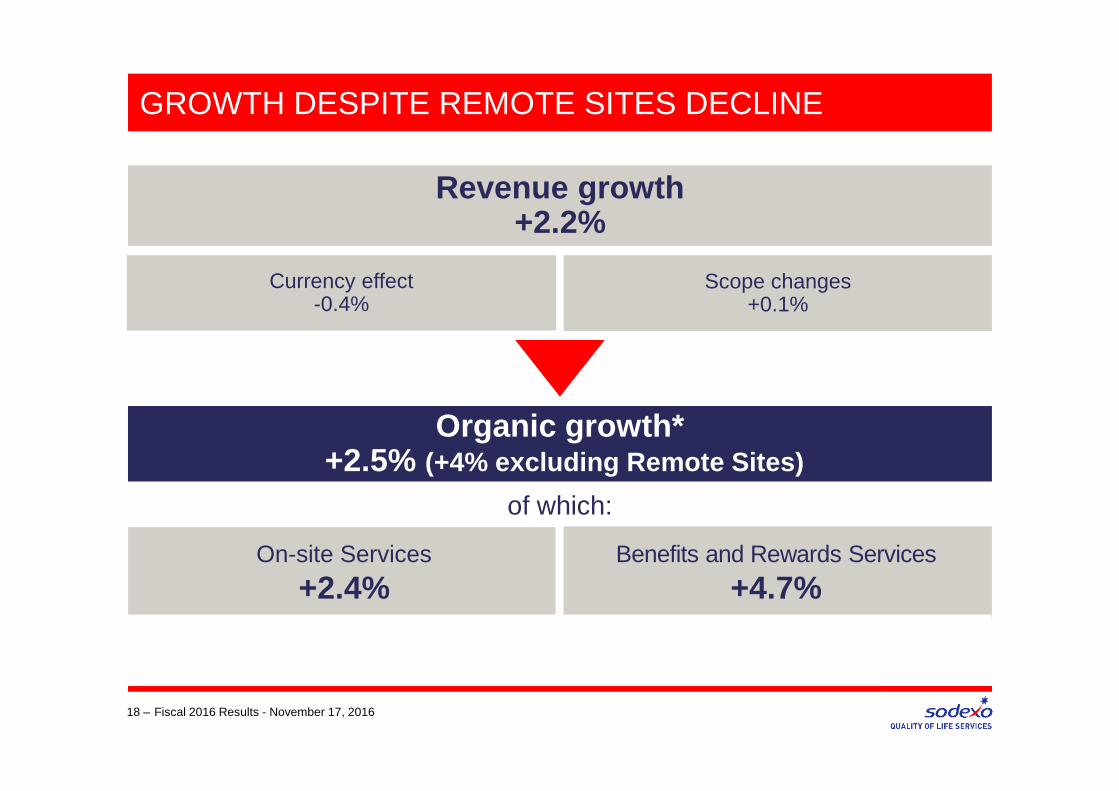
GROWTH DESPITE REMOTE SITES DECLINE
18 –
On-site Services
+2.4%Benefits and Rewards Services
+4.7%
Organic growth* +2.5% (+4% excluding Remote Sites)
of which:
Revenue growth +2.2%
Currency effect-0.4%
Scope changes+0.1%
Fiscal 2016 Results - November 17, 2016

At constant exchange rates*
19 –
SOLID IMPROVEMENT IN OPERATING PERFORMANCE
€ millions
Fiscal 2016Fiscal 2015
1,143+8.2%
EXCLUDING CURRENCY
EFFECT*
Operating margin5.9%
5.8%
+30 bpsEXCLUDING CURRENCY
EFFECT*
Operating profit
Fiscal 2016 Results - November 17, 2016
1,203
At current exchange rates
6.1%
Before exceptional expenses*
Before exceptional expenses*

POSITIVE MOMENTUM IN OPERATING PERFORMANCE OVER PAST 2 YEARS
20 – Fiscal 2016 Results - November 17, 2016
€ millions
Fiscal 2016Fiscal 2014
966+24.5%IN 2 YEARS
Operating margin
5.4%
+70 bpsEXCLUDING CURRENCY EFFECT *
Operating profit
1,203
5.9%
+50 bpsAT CURRENT
RATESBefore exceptionalexpenses*
Before exceptionalexpenses*
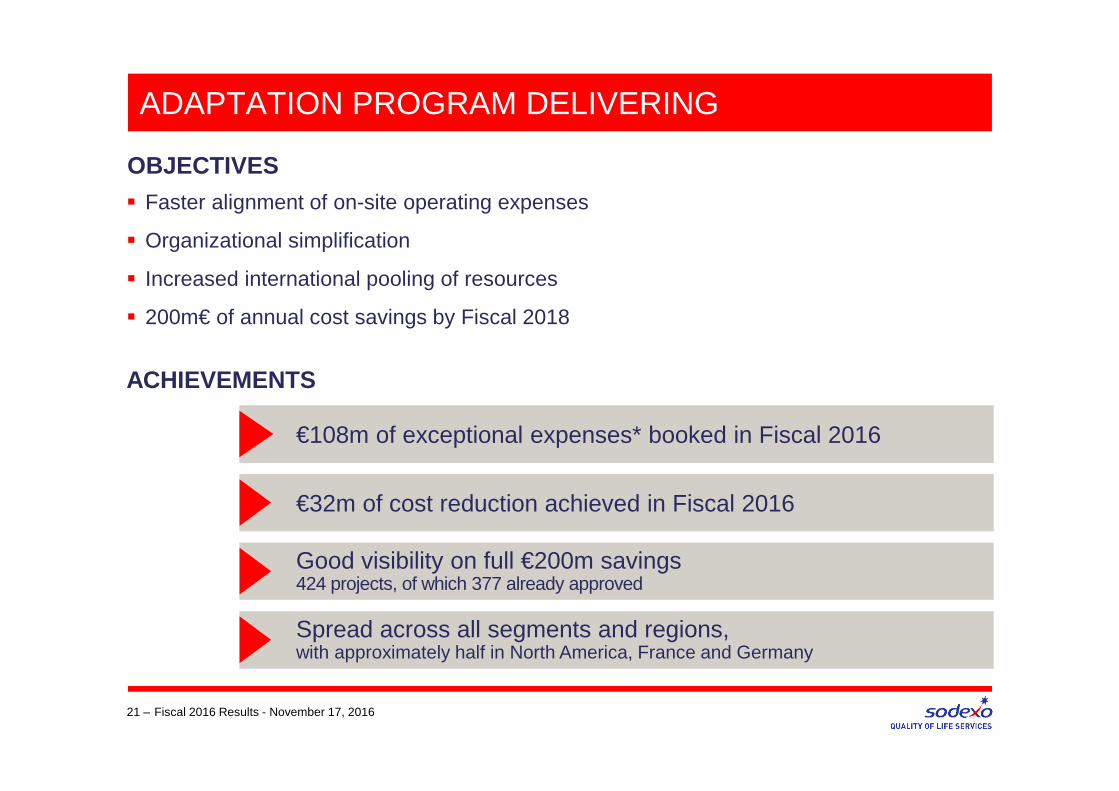
ADAPTATION PROGRAM DELIVERING
ACHIEVEMENTS
21 – Fiscal 2016 Results - November 17, 2016
€108m of exceptional expenses* booked in Fiscal 2016
� Faster alignment of on-site operating expenses
� Organizational simplification
� Increased international pooling of resources
� 200m€ of annual cost savings by Fiscal 2018
OBJECTIVES
€32m of cost reduction achieved in Fiscal 2016
Good visibility on full €200m savings424 projects, of which 377 already approved
Spread across all segments and regions,with approximately half in North America, France and Germany
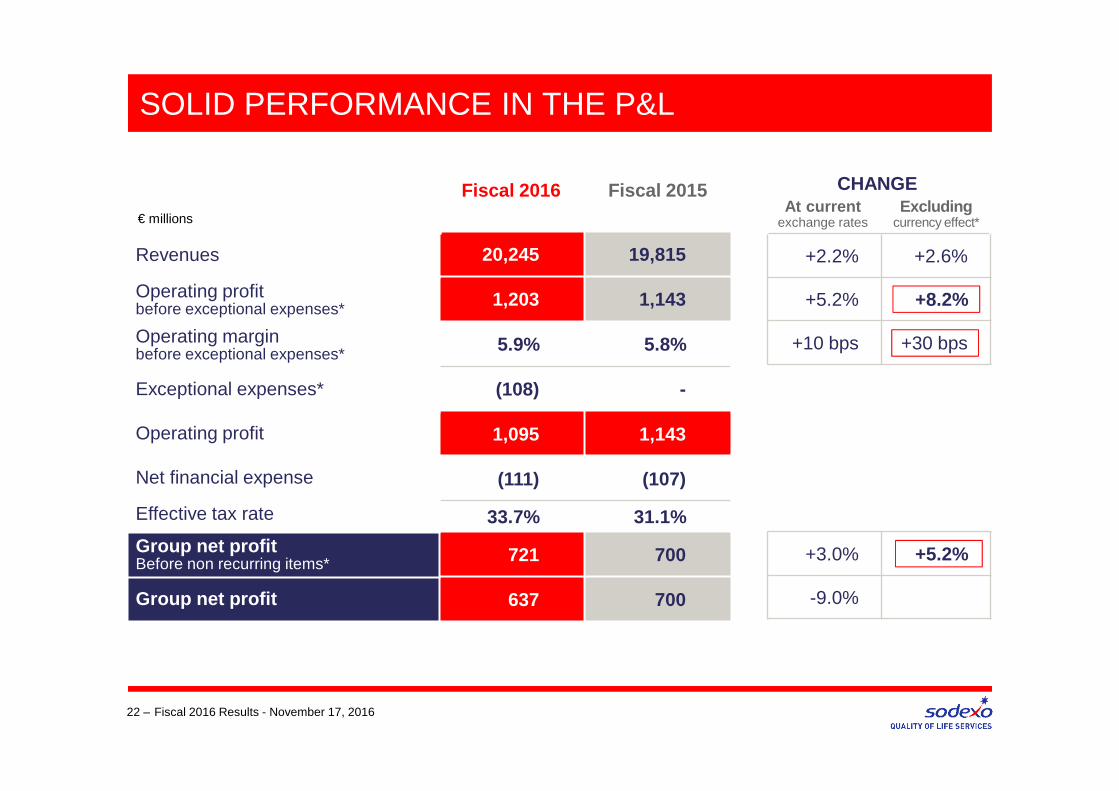
22 –
Fiscal 2016 Fiscal 2015
20,245 19,815
1,203 1,143
5.9% 5.8%
(108) -
1,095 1,143
(111) (107)
33.7% 31.1%
721 700
637 700
CHANGEAt current
exchange ratesExcluding
currency effect*
+2.2% +2.6%
+5.2% +8.2%
+10 bps +30 bps
+3.0% +5.2%
-9.0%
€ millions
Revenues
Operating profitbefore exceptional expenses*
Operating marginbefore exceptional expenses*
Exceptional expenses*
Operating profit
Net financial expense
Effective tax rate
Group net profitBefore non recurring items*
Group net profit
Fiscal 2016 Results - November 17, 2016
SOLID PERFORMANCE IN THE P&L
23 –
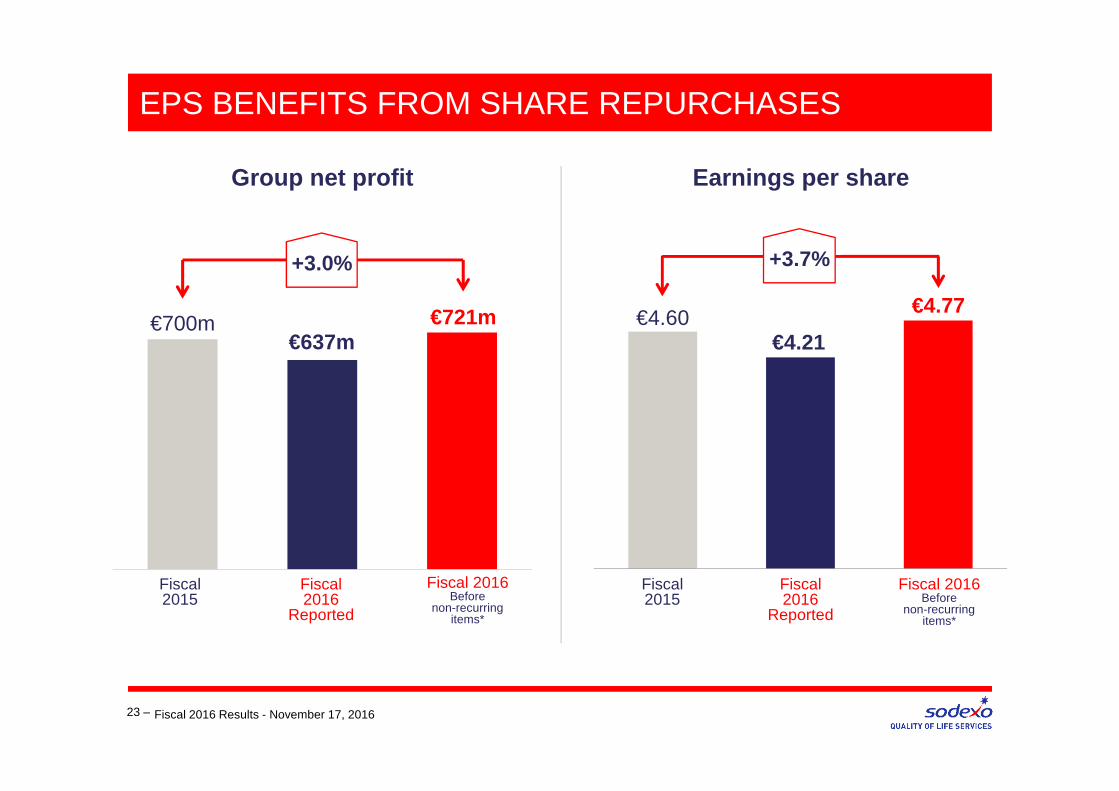
Group net profit
EPS BENEFITS FROM SHARE REPURCHASES
€4.77€4.60
Earnings per share
€700m€637m
Fiscal 2016 Results - November 17, 2016
€721m€4.21
Fiscal 2016
Reported
Fiscal 2015
Fiscal 2016
Reported
Fiscal 2015
Fiscal 2016Before
non-recurring items*
+3.7%+3.0%
Fiscal 2016Before
non-recurring items*
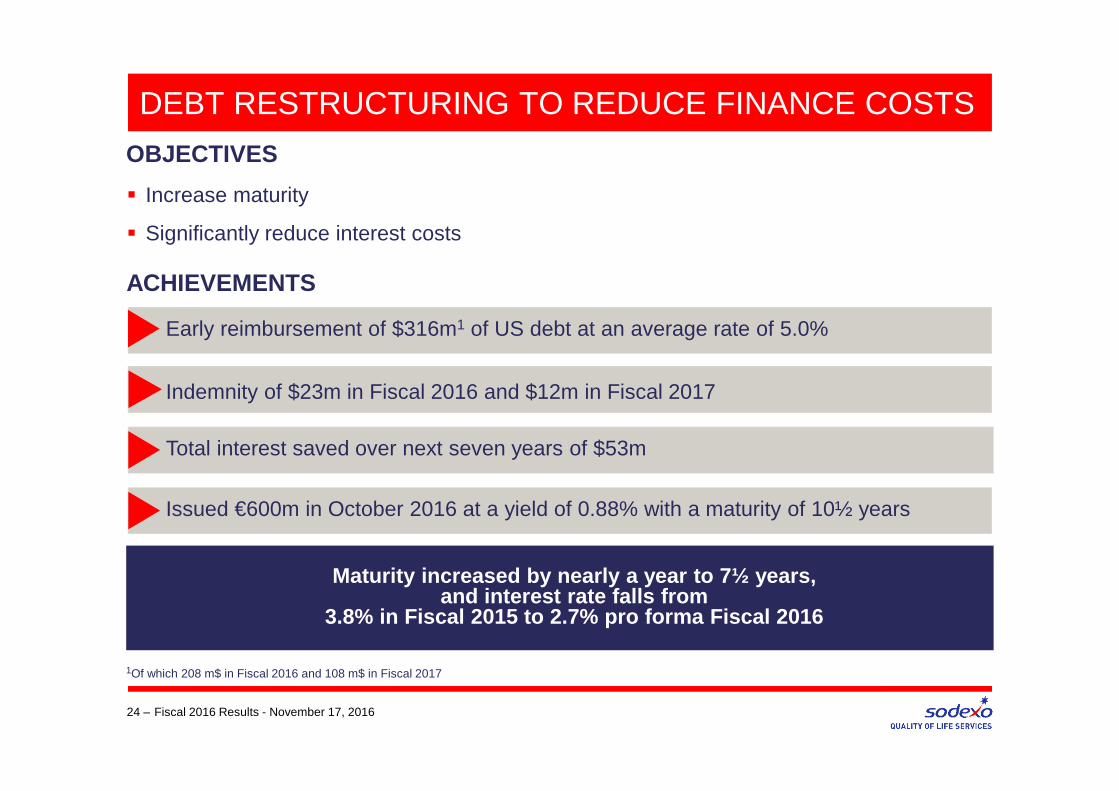
DEBT RESTRUCTURING TO REDUCE FINANCE COSTS
ACHIEVEMENTS
24 – Fiscal 2016 Results - November 17, 2016
Early reimbursement of $316m1 of US debt at an average rate of 5.0%
� Increase maturity
� Significantly reduce interest costs
OBJECTIVES
Indemnity of $23m in Fiscal 2016 and $12m in Fiscal 2017
Total interest saved over next seven years of $53m
Maturity increased by nearly a year to 7½ years,and interest rate falls from
3.8% in Fiscal 2015 to 2.7% pro forma Fiscal 2016
Issued €600m in October 2016 at a yield of 0.88% with a maturity of 10½ years
1Of which 208 m$ in Fiscal 2016 and 108 m$ in Fiscal 2017
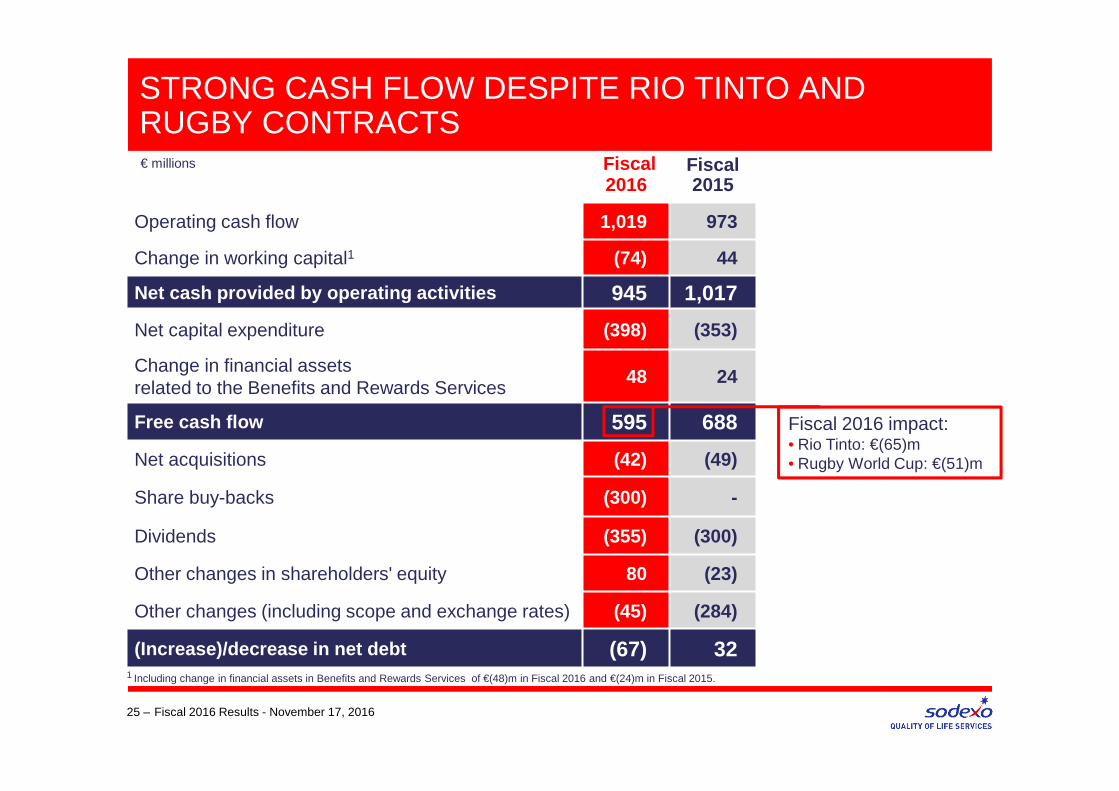
STRONG CASH FLOW DESPITE RIO TINTO AND RUGBY CONTRACTS
25 –
Fiscal 2016
Fiscal 2015
Operating cash flow 1,019 973
Change in working capital1 (74) 44
Net cash provided by operating activities 945 1,017
Net capital expenditure (398) (353)
Change in financial assetsrelated to the Benefits and Rewards Services
48 24
Free cash flow 595 688
Net acquisitions (42) (49)
Share buy-backs (300) -
Dividends (355) (300)
Other changes in shareholders' equity 80 (23)
Other changes (including scope and exchange rates) (45) (284)
(Increase)/decrease in net debt (67) 32
€ millions
Fiscal 2016 Results - November 17, 2016
1 Including change in financial assets in Benefits and Rewards Services of €(48)m in Fiscal 2016 and €(24)m in Fiscal 2015.
Fiscal 2016 impact:• Rio Tinto: €(65)m• Rugby World Cup: €(51)m
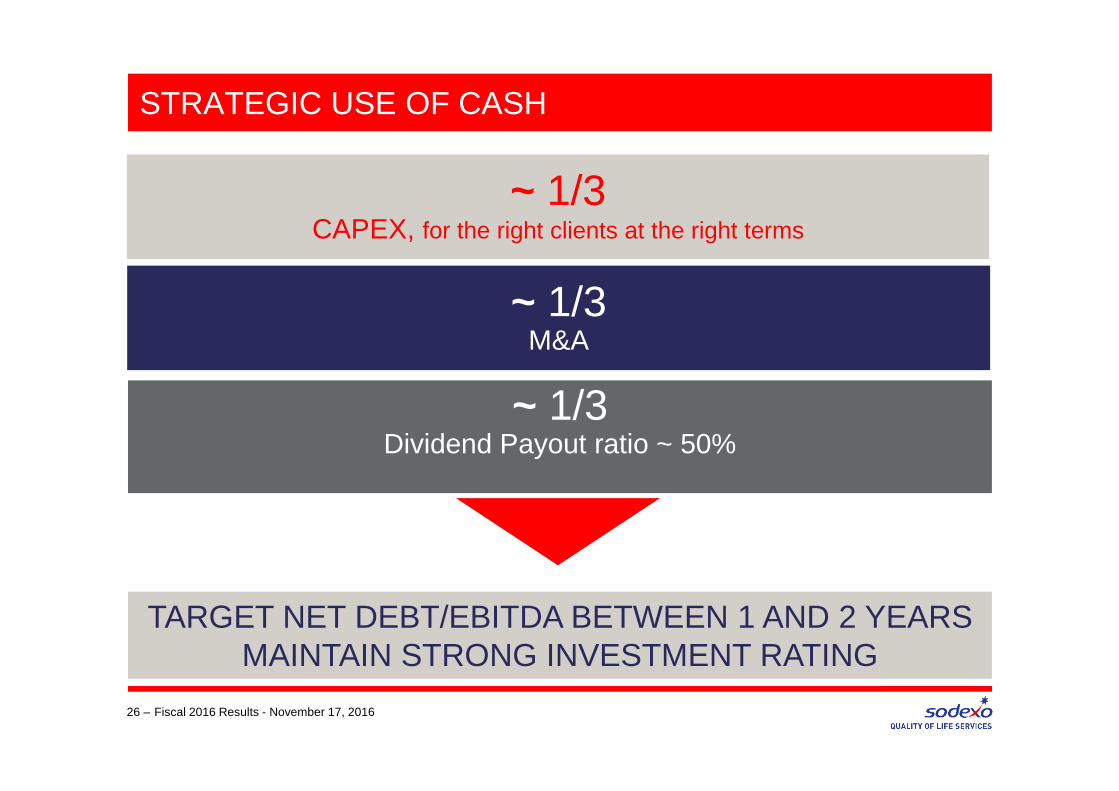
STRATEGIC USE OF CASH
26 – Fiscal 2016 Results - November 17, 2016
~ 1/3CAPEX, for the right clients at the right terms
~ 1/3Dividend Payout ratio ~ 50%
~ 1/3M&A
TARGET NET DEBT/EBITDA BETWEEN 1 AND 2 YEARSMAINTAIN STRONG INVESTMENT RATING
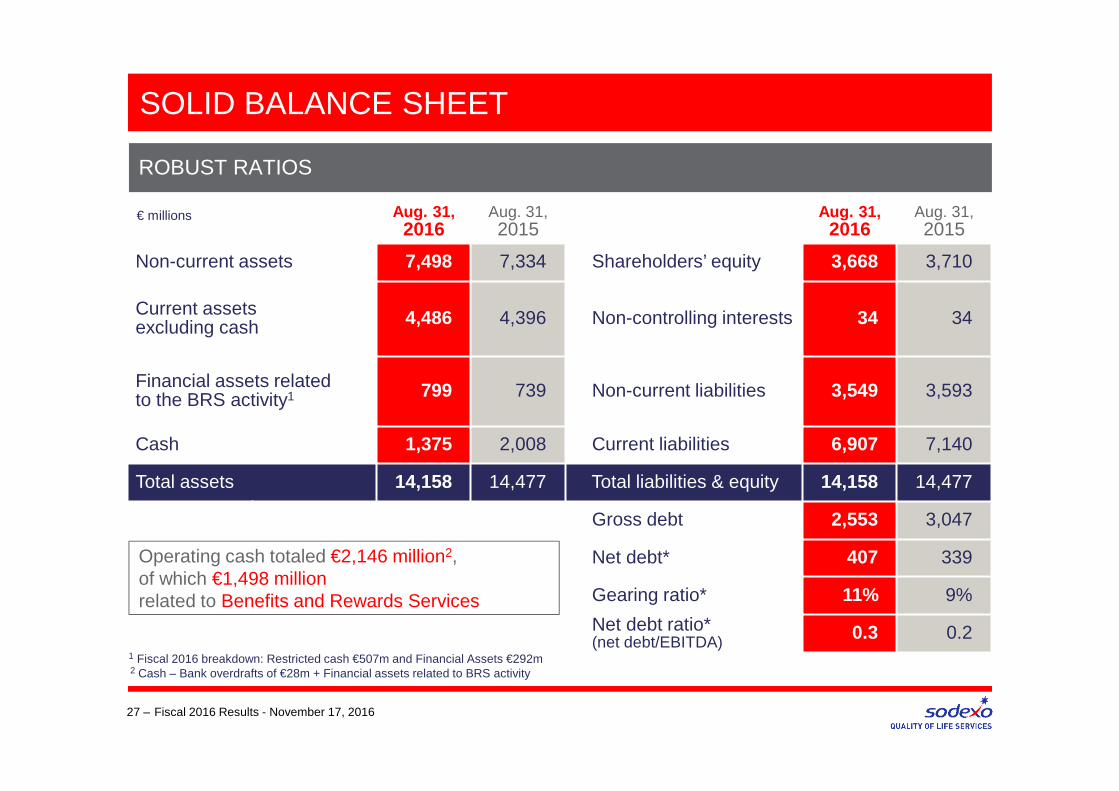
SOLID BALANCE SHEET
27 –
Aug. 31, 2016
Aug. 31, 2015
Aug. 31, 2016
Aug. 31, 2015
Non-current assets 7,498 7,334 Shareholders’ equity 3,668 3,710
Current assets excluding cash 4,486 4,396 Non-controlling interests 34 34
Financial assets related to the BRS activity1 799 739 Non-current liabilities 3,549 3,593
Cash 1,375 2,008 Current liabilities 6,907 7,140
Total assets 14,158 14,477 Total liabilities & equity 14,158 14,477
Gross debt 2,553 3,047
Net debt* 407 339
Gearing ratio* 11% 9%
Net debt ratio* (net debt/EBITDA) 0.3 0.2
€ millions
ROBUST RATIOS
Fiscal 2016 Results - November 17, 2016
Operating cash totaled €2,146 million2, of which €1,498 millionrelated to Benefits and Rewards Services
2 Cash – Bank overdrafts of €28m + Financial assets related to BRS activity
1 Fiscal 2016 breakdown: Restricted cash €507m and Financial Assets €292m
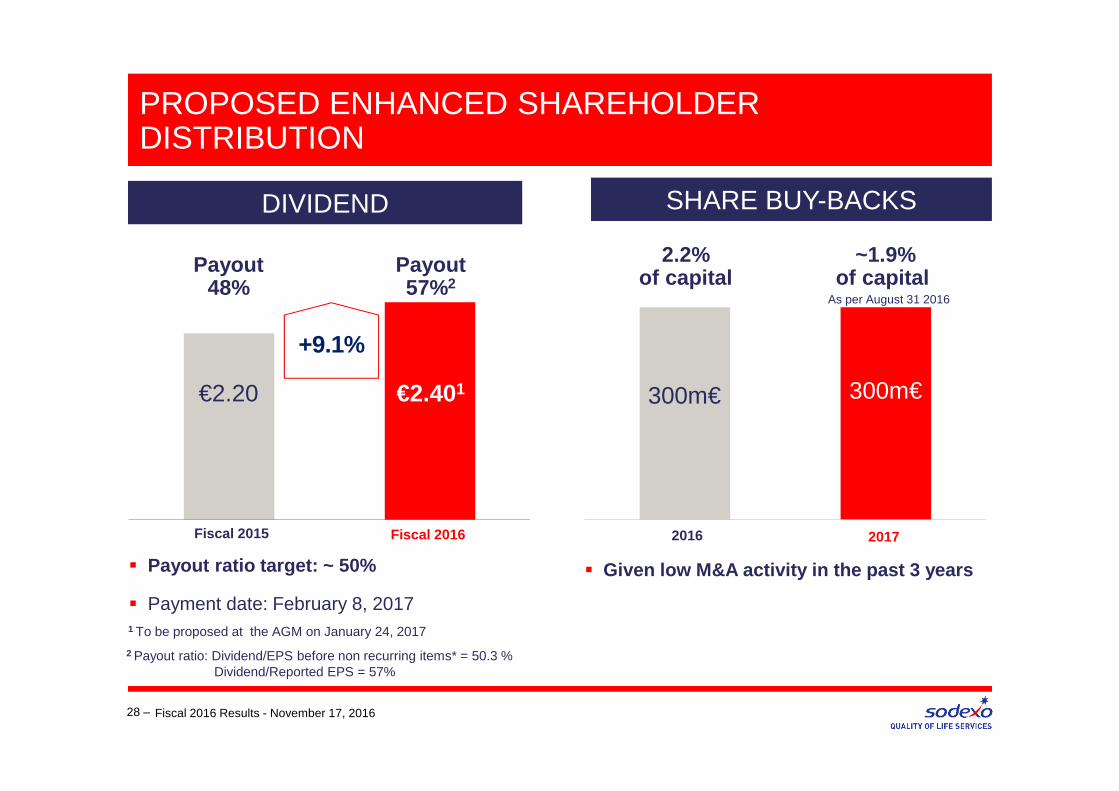
+9.1%
PROPOSED ENHANCED SHAREHOLDER DISTRIBUTION
28 –
€2.401€2.20
Fiscal 2016Fiscal 2015
DIVIDEND
Fiscal 2016 Results - November 17, 2016
� Payout ratio target: ~ 50%
� Payment date: February 8, 20171 To be proposed at the AGM on January 24, 2017
Payout 57%2
Payout 48%
SHARE BUY-BACKS
300m€
20172016
~1.9%of capital
2.2%of capital
� Given low M&A activity in the past 3 years
2 Payout ratio: Dividend/EPS before non recurring items* = 50.3 % Dividend/Reported EPS = 57%
300m€
As per August 31 2016
29 –
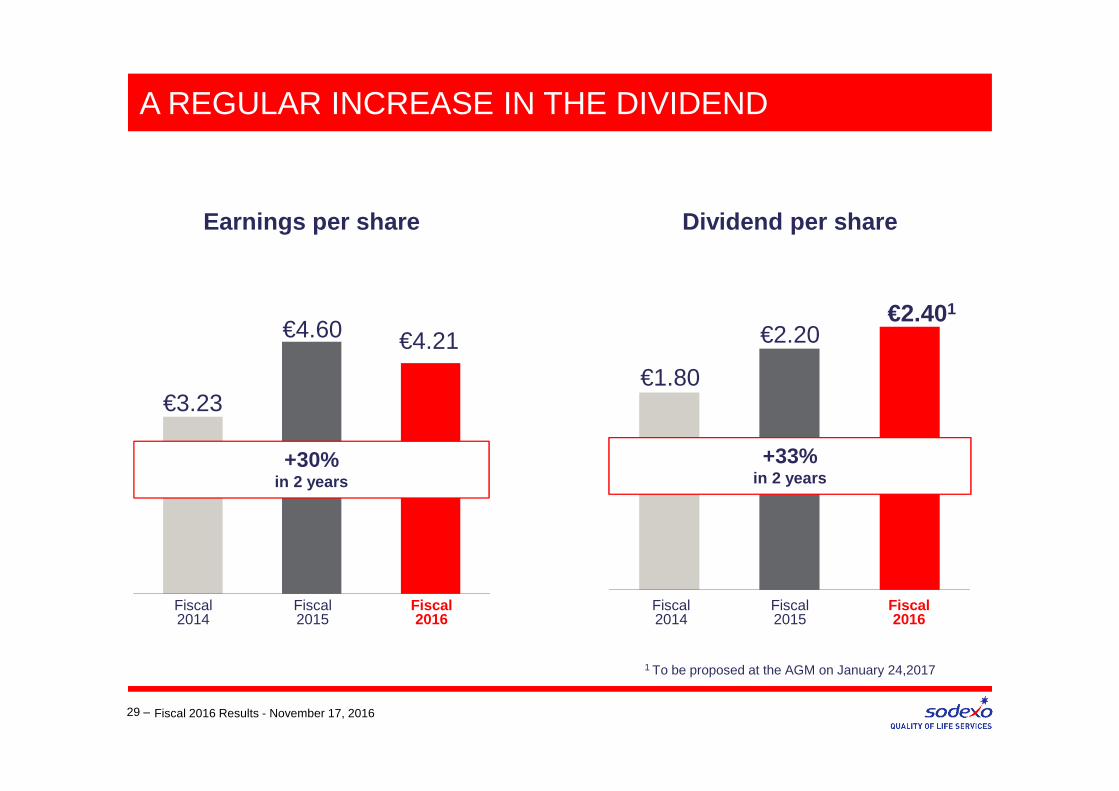
Earnings per share
A REGULAR INCREASE IN THE DIVIDEND
Fiscal 2016
Fiscal 2015
€2.401
€2.20
Fiscal 2016
Fiscal 2014
Dividend per share
€4.60
€3.23
Fiscal 2016 Results - November 17, 2016
€4.21
+30%in 2 years
Fiscal 2014
€1.80
Fiscal 2015
+33%in 2 years
1 To be proposed at the AGM on January 24,2017
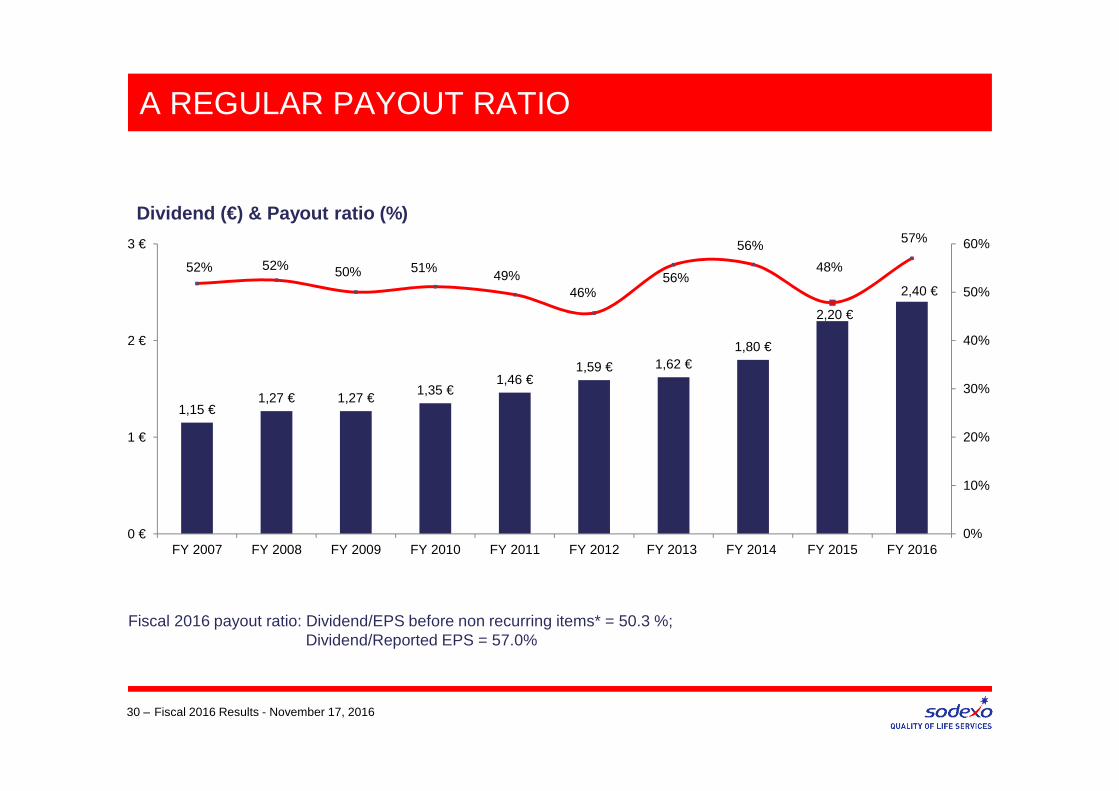
A REGULAR PAYOUT RATIO
30 – Fiscal 2016 Results - November 17, 2016
1,15 €1,27 € 1,27 €
1,35 €1,46 €
1,59 € 1,62 €1,80 €
2,20 €
2,40 €
52% 52% 50% 51%49%
46%56%
56%
48%
57%
0%
10%
20%
30%
40%
50%
60%
0 €
1 €
2 €
3 €
FY 2007 FY 2008 FY 2009 FY 2010 FY 2011 FY 2012 FY 2013 FY 2014 FY 2015 FY 2016
Dividend (€) & Payout ratio (%)
Fiscal 2016 payout ratio: Dividend/EPS before non recurring items* = 50.3 %; Dividend/Reported EPS = 57.0%
ON-SITE SERVICES
31 – Fiscal 2016 Results - November 17, 2016

ON-SITE SERVICES
+2.4% ORGANIC GROWTH*, +4% excluding Remote SitesUnited Kingdom
and Ireland
+11.3%
Rest of the World
-3.2%
+1.0%Continental EuropeNorth
America +3.8%
32 – Fiscal 2016 Results - November 17, 2016
+7.0%excluding
Remote Sites
+5.3%excluding
Rugby
ON-SITE SERVICES
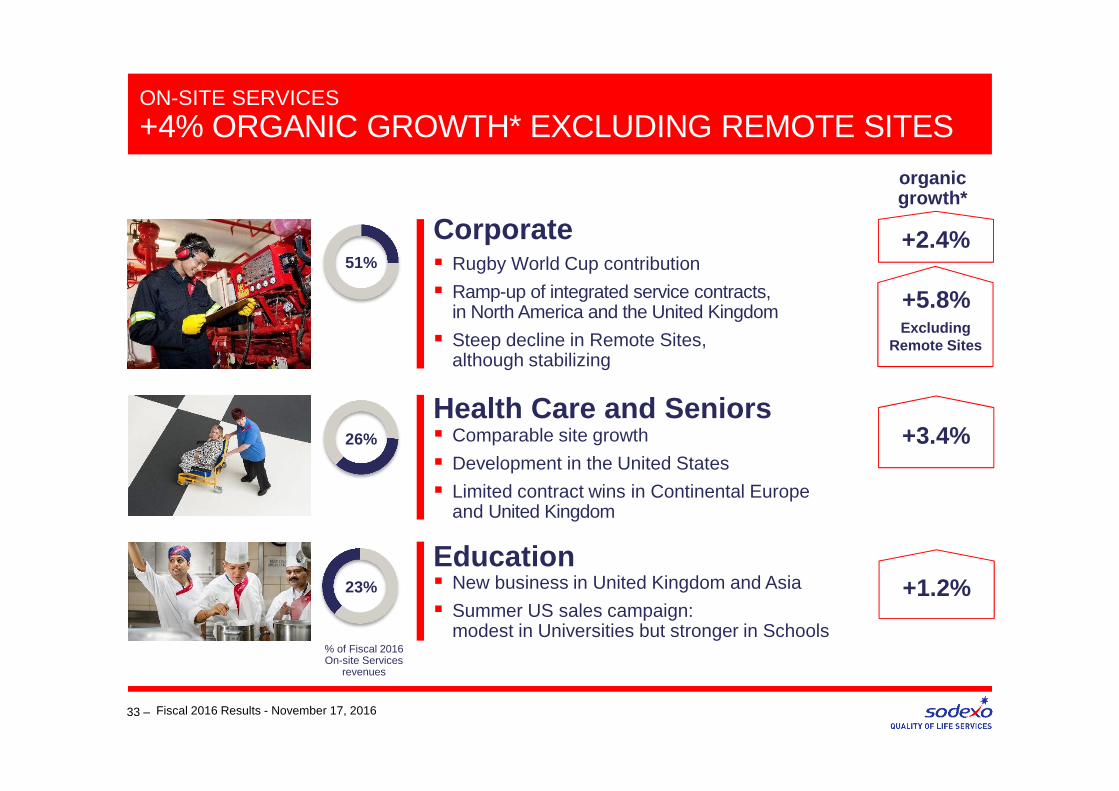
+4% ORGANIC GROWTH* EXCLUDING REMOTE SITES
33 – Fiscal 2016 Results - November 17, 2016
Health Care and Seniors� Comparable site growth
� Development in the United States
� Limited contract wins in Continental Europe and United Kingdom
Education
Corporate
+3.4%
+1.2%
� Rugby World Cup contribution
� Ramp-up of integrated service contracts, in North America and the United Kingdom
� Steep decline in Remote Sites, although stabilizing
� New business in United Kingdom and Asia
� Summer US sales campaign: modest in Universities but stronger in Schools
+2.4%
organic growth*
% of Fiscal 2016 On-site Services
revenues
51%
23%
26%
+5.8%Excluding
Remote Sites
ON-SITE SERVICES
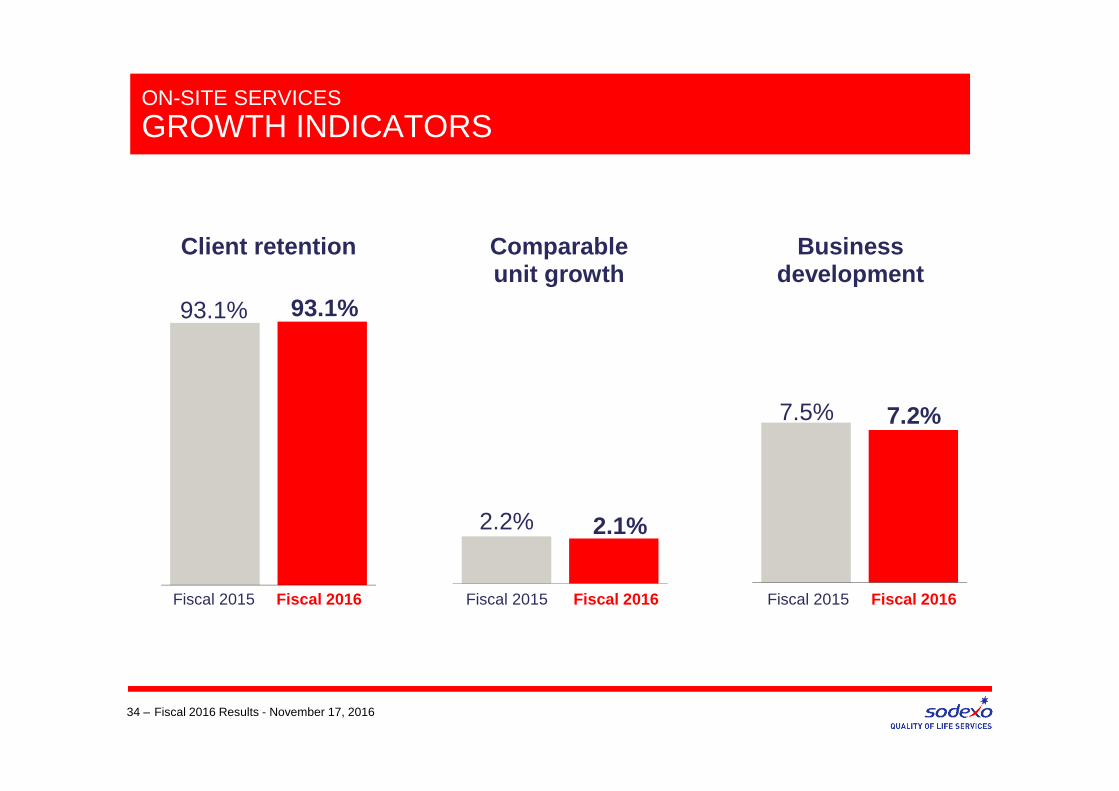
GROWTH INDICATORS
34 –
2.2% 2.1%
93.1% 93.1%
7.5% 7.2%
Fiscal 2015 Fiscal 2016 Fiscal 2015 Fiscal 2016 Fiscal 2015 Fiscal 2016
Comparableunit growth
Client retention Businessdevelopment
Fiscal 2016 Results - November 17, 2016
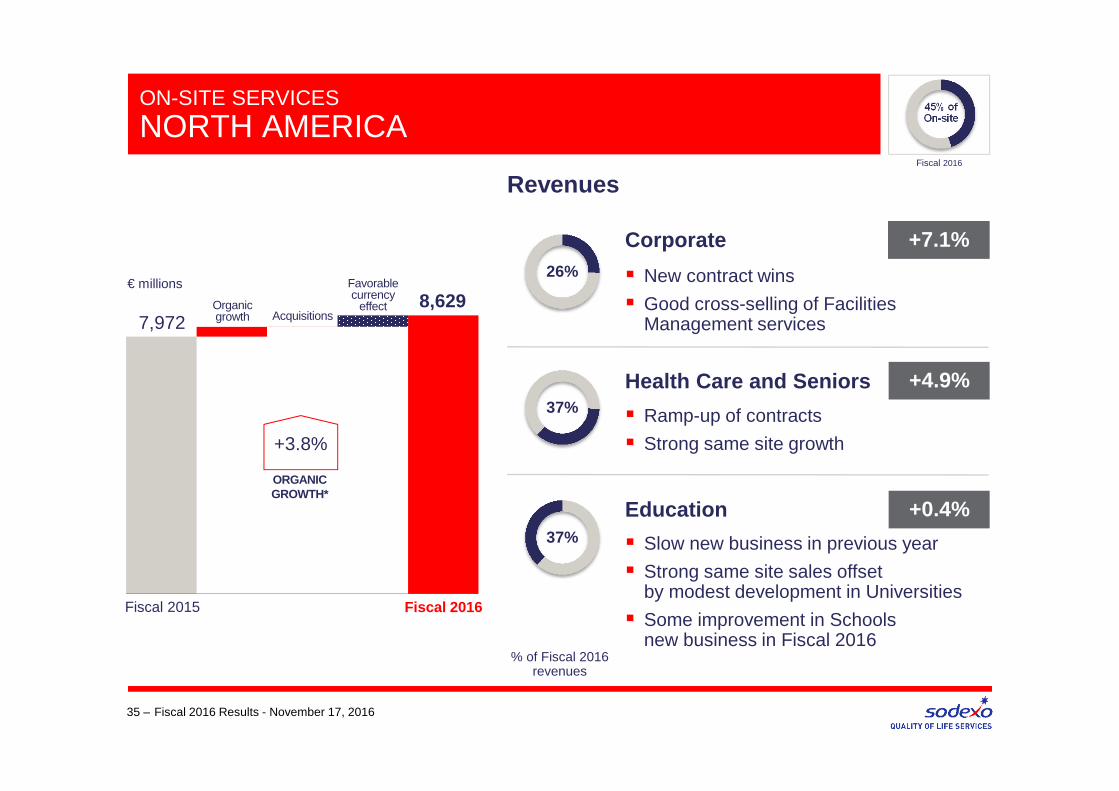
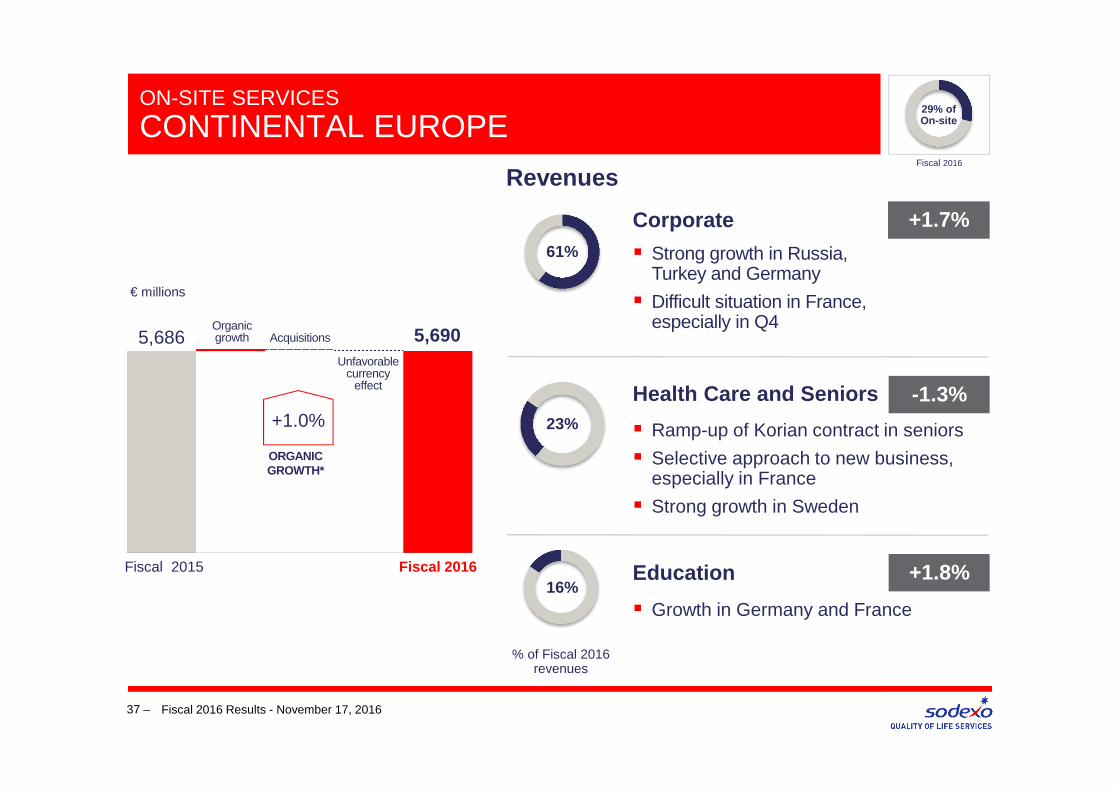
Revenues
ON-SITE SERVICES
NORTH AMERICA
35 – Fiscal 2016 Results - November 17, 2016
€ millions
Corporate
Health Care and Seniors
Education
7,972
+3.8%
ORGANIC GROWTH*
Organic growth
Favorable currency
effect
� New contract wins
� Good cross-selling of Facilities Management services
� Ramp-up of contracts
� Strong same site growth
� Slow new business in previous year
� Strong same site sales offset by modest development in Universities
� Some improvement in Schools new business in Fiscal 2016
Fiscal 2016Fiscal 2015
+7.1%
+4.9%
+0.4%
% of Fiscal 2016 revenues
26%
37%
37%
8,629Acquisitions
45% of On-site
Fiscal 2016

FY 2015 FY 2016
Operating margin *
ON-SITE SERVICES
NORTH AMERICA
36 –
6.6% 6.3%
568
499� Significant reduction of SG&A
� Strong contract management and cost control
+30 bps
Operating profit
+9.3%
CHANGEEXCLUDINGCURRENCY
EFFECT*
€ millions
Fiscal 2016 Results - November 17, 2016
Fiscal 2016Fiscal 2015
Revenues
ON-SITE SERVICES
CONTINENTAL EUROPE
37 –
� Strong growth in Russia, Turkey and Germany
� Difficult situation in France, especially in Q4
� Ramp-up of Korian contract in seniors
� Selective approach to new business, especially in France
� Strong growth in Sweden
� Growth in Germany and France
5,686
+1.0%
ORGANIC GROWTH*
Unfavorable currency
effect
Fiscal 2016Fiscal 2015
Organic growth
Fiscal 2016 Results - November 17, 2016
+1.7%
-1.3%
+1.8%
Corporate
Health Care and Seniors
Education
61%
16%
23%
5,690
% of Fiscal 2016 revenues
Acquisitions
€ millions
29% of On-site
Fiscal 2016
FY 2015 FY 2016
Operating margin*
ON-SITE SERVICES
CONTINENTAL EUROPE
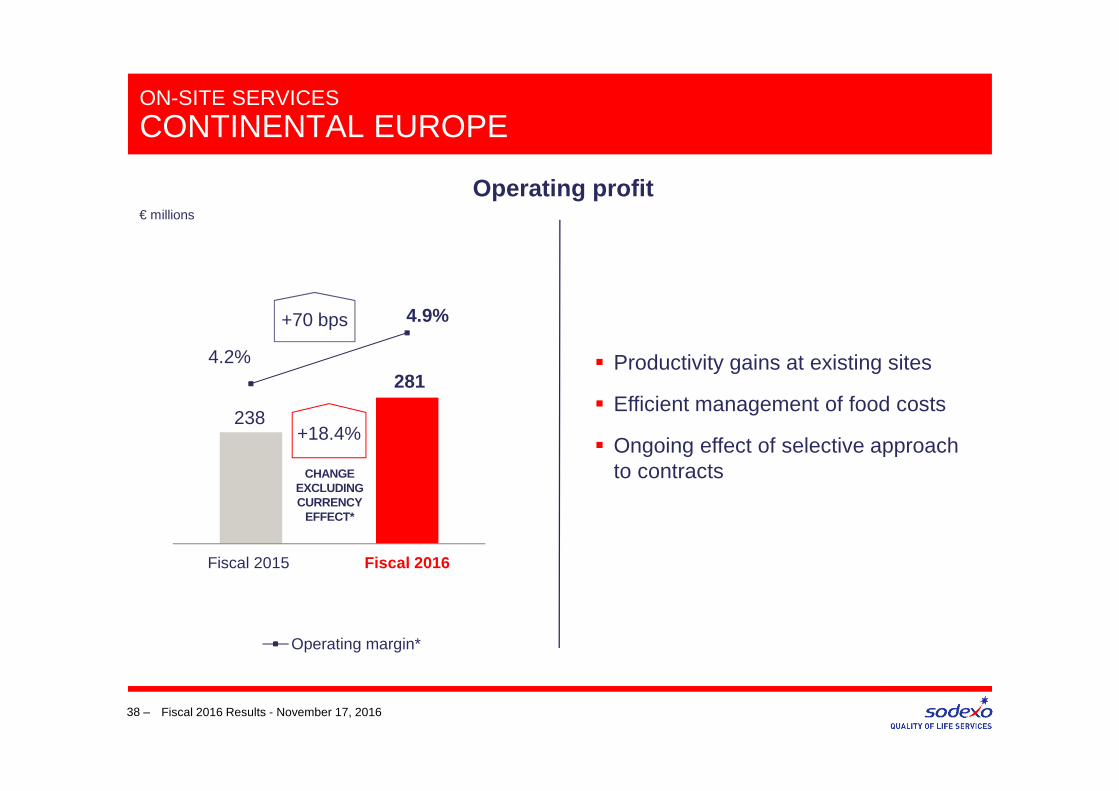
38 –
4.9%
4.2% 281
238
� Productivity gains at existing sites
� Efficient management of food costs
� Ongoing effect of selective approach to contracts
+70 bps
Operating profit
+18.4%
CHANGEEXCLUDINGCURRENCY
EFFECT*
Fiscal 2016 Results - November 17, 2016
Fiscal 2016
€ millions
Fiscal 2015

ON-SITE SERVICES
UNITED KINGDOM AND IRELAND
39 –
� Contribution of Rugby World Cup (€131m in Q1, +8.3% to organic growth)
� Rest of Corporate growing at +5.9% thanks to Fiscal 2015 ramp-ups and contract extensions in facilities management services
� High retention but low development due to market conditions
Revenues
� Strong business development
� Additional volumes on existing sites
Fiscal 2016 Results - November 17, 2016
1,832
+11.3%
ORGANIC GROWTH*
Unfavorable currency
effect
Organic growth
Fiscal 2016Fiscal 2015
Acquisitions
RugbyOther
+5.3%excl. Rugby
Corporate
Health Care and Seniors
Education
+14.2%
-0.9%
+15.1%
74%
8%
18%
2,008
% of Fiscal 2016 revenues
€ millions
10% of On-site
Fiscal 2016
FY 2015 FY 2016
Operating margin *
ON-SITE SERVICES
UNITED KINGDOM AND IRELAND
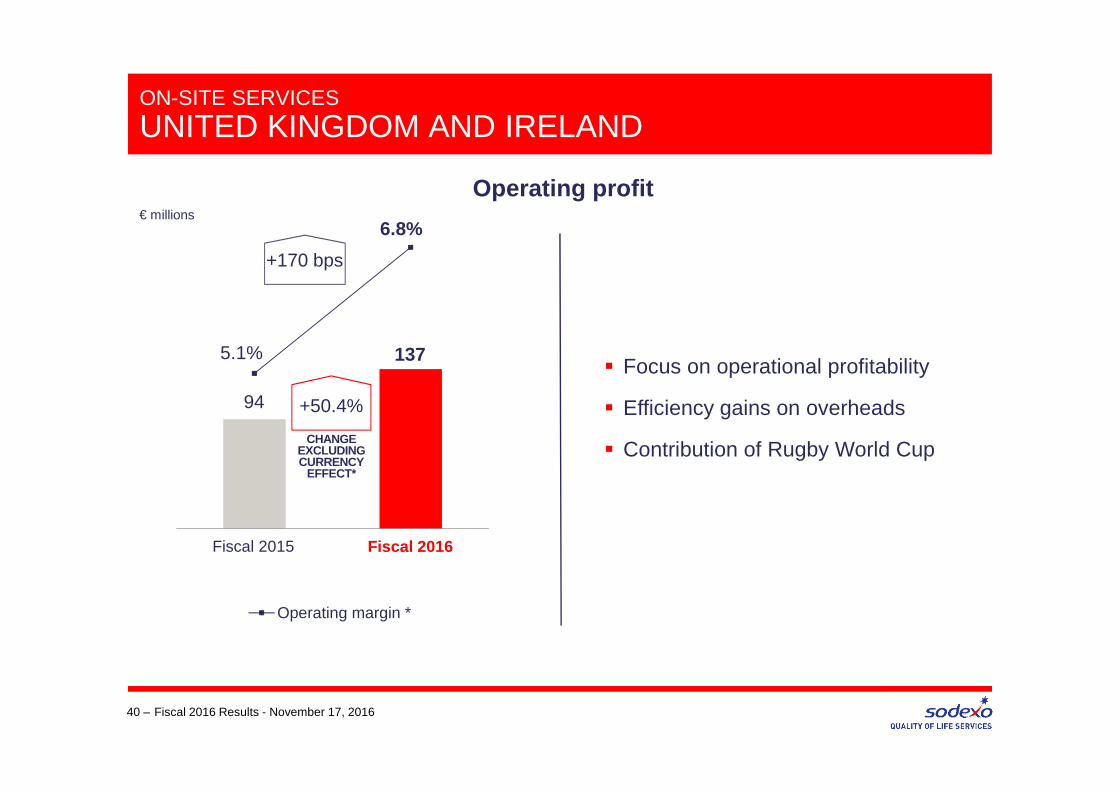
40 –
6.8%
5.1%
94 +50.4%
CHANGE EXCLUDING CURRENCY
EFFECT*
� Focus on operational profitability
� Efficiency gains on overheads
� Contribution of Rugby World Cup
+170 bps
Fiscal 2016 Results - November 17, 2016
Operating profit
137
Fiscal 2016
€ millions
Fiscal 2015
Revenues
ON-SITE SERVICES
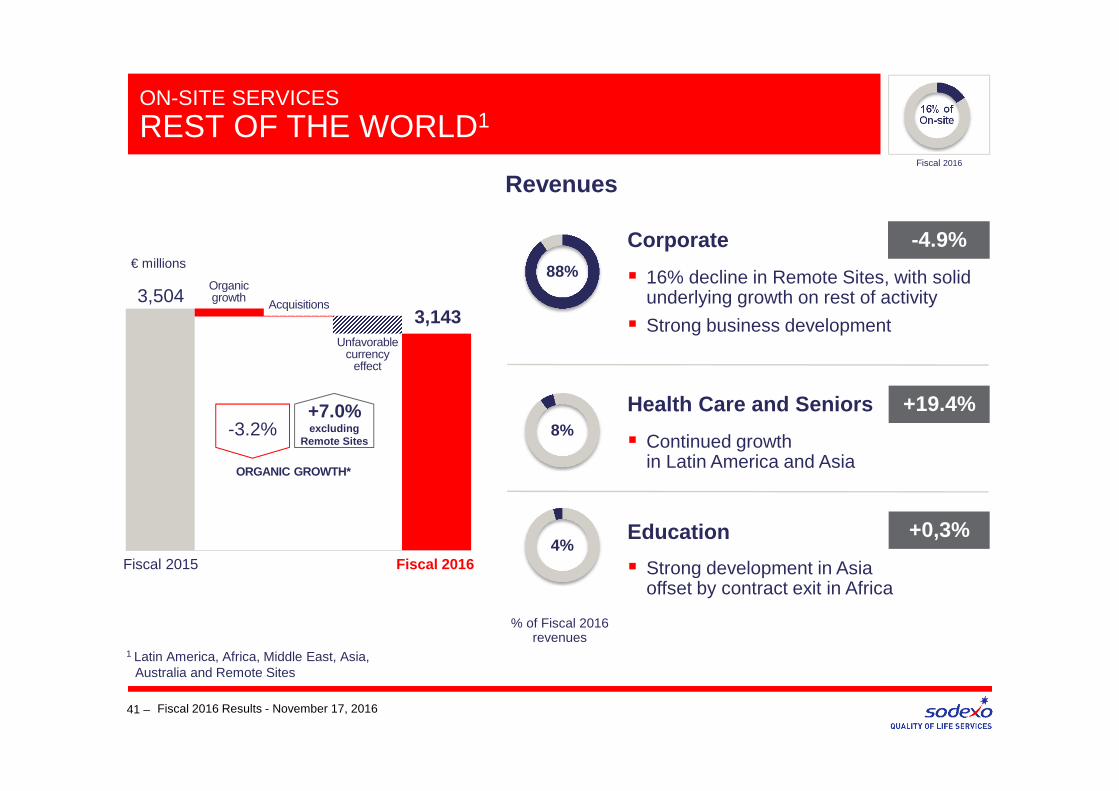
REST OF THE WORLD1
41 –
� 16% decline in Remote Sites, with solid underlying growth on rest of activity
� Strong business development
� Continued growth in Latin America and Asia
1 Latin America, Africa, Middle East, Asia, Australia and Remote Sites
Fiscal 2016 Results - November 17, 2016
-4.9%
+19.4%
+0,3%
Corporate
Health Care and Seniors
Education
88%
4%
8%
3,504
Unfavorable currency
effect
Fiscal 2016Fiscal 2015
Organic growth
Acquisitions3,143
-3.2%
ORGANIC GROWTH*
+7.0%excluding
Remote Sites
% of Fiscal 2016 revenues
€ millions
� Strong development in Asia offset by contract exit in Africa
16% ofOn-site
Fiscal 2016

FY 2015 FY 2016
Operating margin*
ON-SITE SERVICES
REST OF THE WORLD
42 –
3.1%
4.6%
96
-38.6%
CHANGE EXCLUDING CURRENCY
EFFECT*
� Exit costs in South America mining contracts
� Investment in the technical platform in Asia
� Significant operating cost reductions but insufficient to offset Remote Sites volume decline
� Mobilization of Rio Tinto
-150 bps
Fiscal 2016 Results - November 17, 2016
Operating profit€ millions
161
Fiscal 2016Fiscal 2015
BENEFITS AND REWARDS SERVICES
43 – Fiscal 2016 Results - November 17, 2016
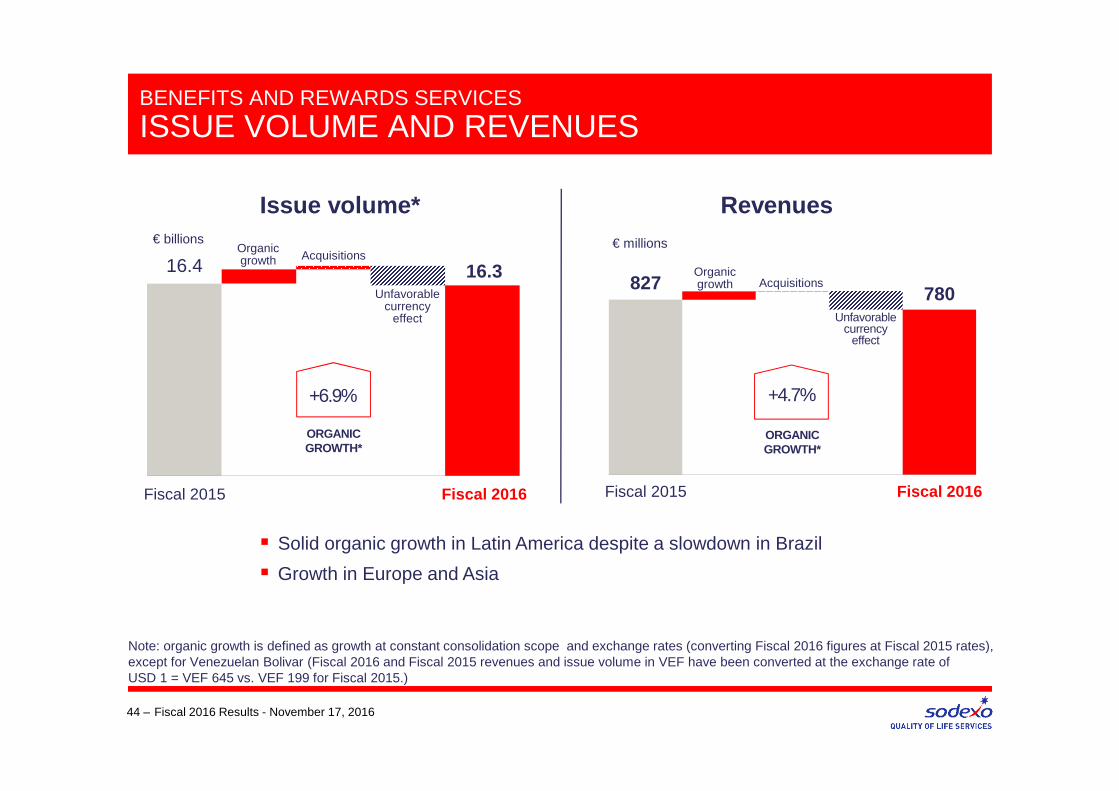
BENEFITS AND REWARDS SERVICES
ISSUE VOLUME AND REVENUES
44 –
€ billions
16.4Acquisitions
Unfavorable currency
effect
Organic growth
+6.9%
ORGANICGROWTH*
Issue volume* Revenues€ millions
827 Acquisitions
Unfavorable currency
effect
Organic growth
+4.7%
ORGANICGROWTH*
� Solid organic growth in Latin America despite a slowdown in Brazil
� Growth in Europe and Asia
Fiscal 2016Fiscal 2015 Fiscal 2016Fiscal 2015
Fiscal 2016 Results - November 17, 2016
16.3780
Note: organic growth is defined as growth at constant consolidation scope and exchange rates (converting Fiscal 2016 figures at Fiscal 2015 rates), except for Venezuelan Bolivar (Fiscal 2016 and Fiscal 2015 revenues and issue volume in VEF have been converted at the exchange rate of USD 1 = VEF 645 vs. VEF 199 for Fiscal 2015.)
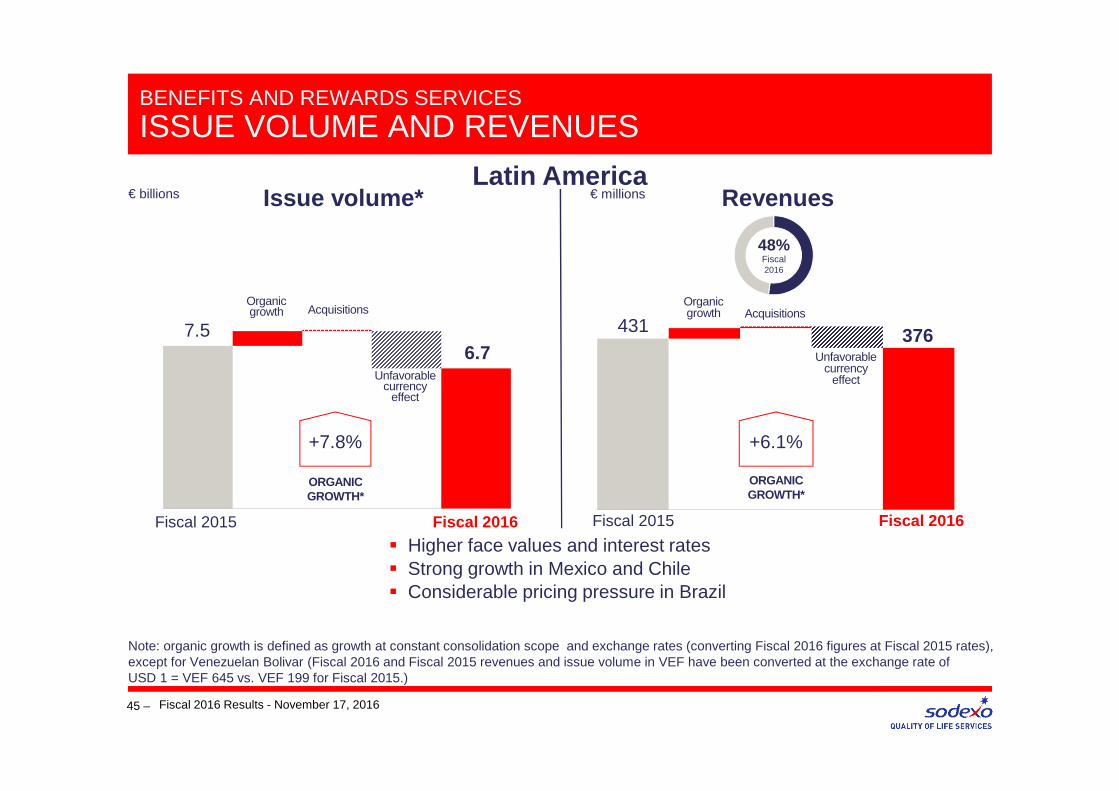
BENEFITS AND REWARDS SERVICES
ISSUE VOLUME AND REVENUES
45 –
7.5
Organic growth
Unfavorable currency
effect
+7.8%
ORGANIC GROWTH*
Revenues
Acquisitions431
+6.1%
ORGANICGROWTH*
Organic growth
Unfavorable currency
effect
Latin America
Fiscal 2016Fiscal 2015 Fiscal 2016Fiscal 2015
� Higher face values and interest rates� Strong growth in Mexico and Chile� Considerable pricing pressure in Brazil
Fiscal 2016 Results - November 17, 2016
Acquisitions
Issue volume*€ billions € millions
48%Fiscal2016
6.7376
Note: organic growth is defined as growth at constant consolidation scope and exchange rates (converting Fiscal 2016 figures at Fiscal 2015 rates), except for Venezuelan Bolivar (Fiscal 2016 and Fiscal 2015 revenues and issue volume in VEF have been converted at the exchange rate of USD 1 = VEF 645 vs. VEF 199 for Fiscal 2015.)
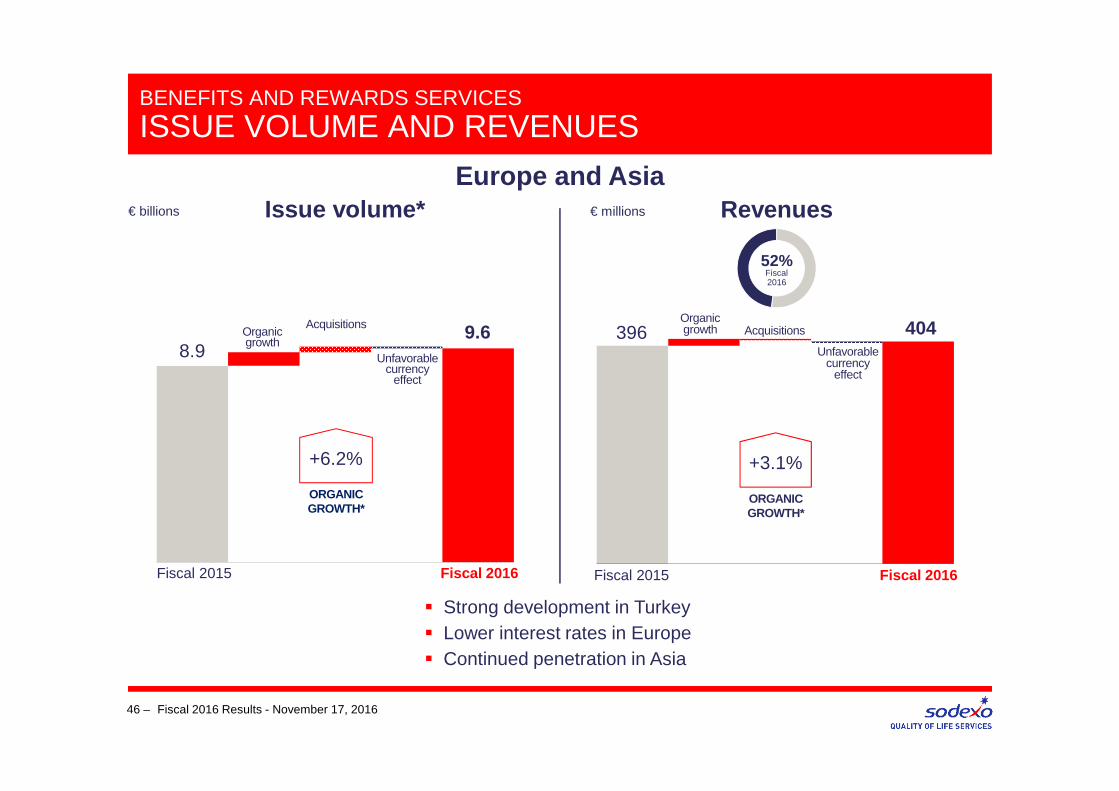
BENEFITS AND REWARDS SERVICES
ISSUE VOLUME AND REVENUES
46 –
Issue volume*
8.9
AcquisitionsOrganic growth
Unfavorable currency
effect
+6.2%
ORGANIC GROWTH*
Revenues
396
+3.1%
ORGANIC GROWTH*
Organic growth
Unfavorable currency
effect
Europe and Asia
� Strong development in Turkey � Lower interest rates in Europe� Continued penetration in Asia
Fiscal 2016Fiscal 2015 Fiscal 2016Fiscal 2015
Fiscal 2016 Results - November 17, 2016
€ billions € millions
52%
9.6 404
Fiscal2016
Acquisitions
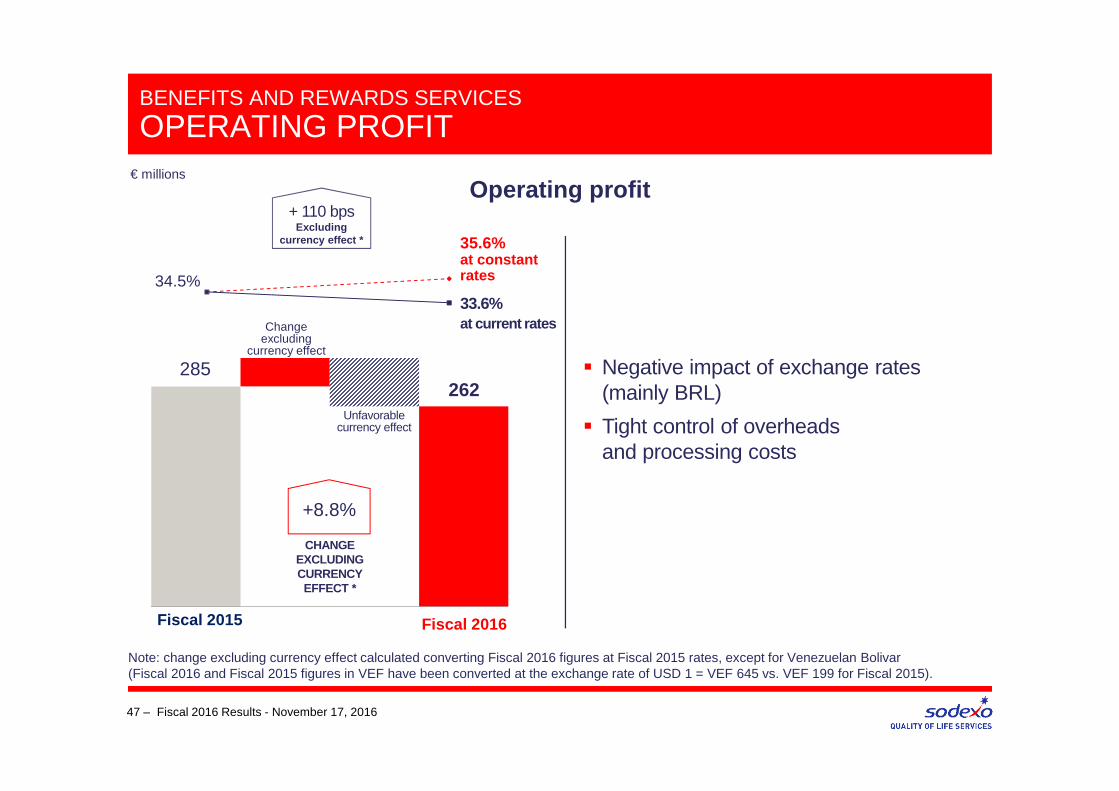
BENEFITS AND REWARDS SERVICES
OPERATING PROFIT
47 –
Operating profit
33.6%at current rates
34.5%
� Negative impact of exchange rates (mainly BRL)
� Tight control of overheads and processing costs
Fiscal 2016
285
+8.8%
CHANGE EXCLUDING CURRENCY EFFECT *
Unfavorable currency effect
Change excluding
currency effect
35.6% at constant rates
Fiscal 2016 Results - November 17, 2016
€ millions
Fiscal 2015
262
+ 110 bpsExcluding
currency effect *
Note: change excluding currency effect calculated converting Fiscal 2016 figures at Fiscal 2015 rates, except for Venezuelan Bolivar (Fiscal 2016 and Fiscal 2015 figures in VEF have been converted at the exchange rate of USD 1 = VEF 645 vs. VEF 199 for Fiscal 2015).
NEW SEGMENT REPORTING
48 – Fiscal 2016 Results - November 17, 2016
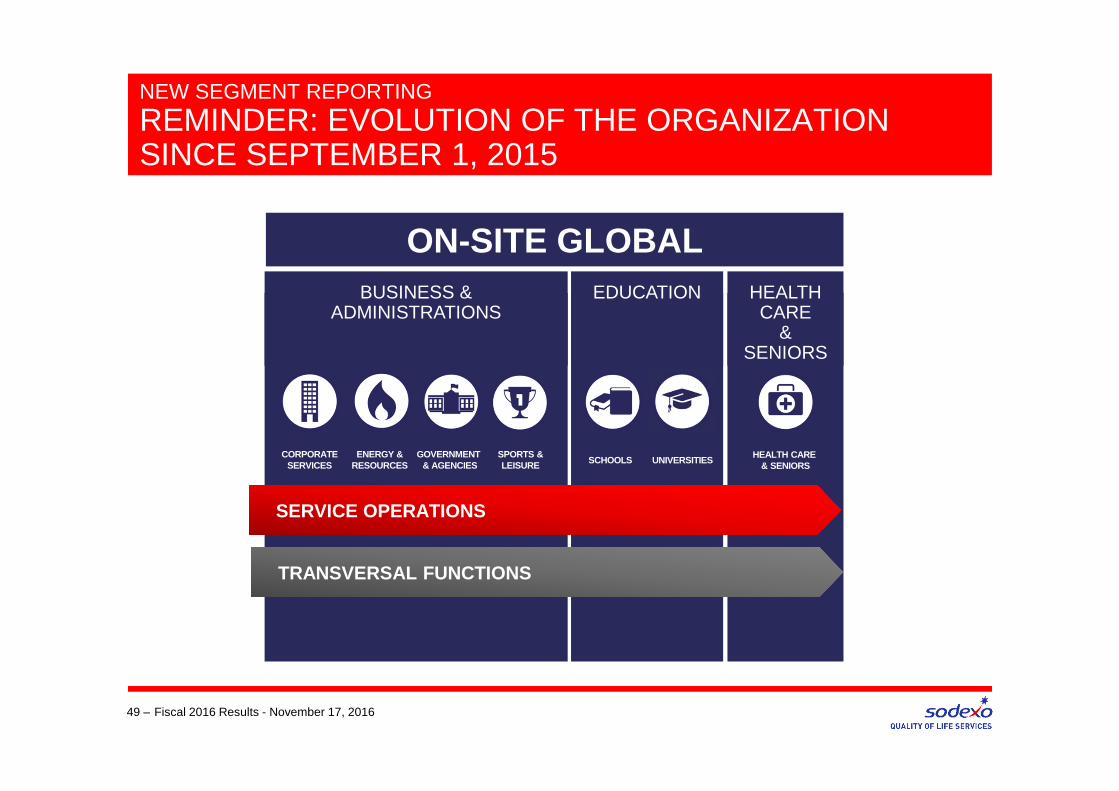
NEW SEGMENT REPORTING
REMINDER: EVOLUTION OF THE ORGANIZATION SINCE SEPTEMBER 1, 2015
49 – Fiscal 2016 Results - November 17, 2016
CORPORATESERVICES
ENERGY &RESOURCES
HEALTH CARE & SENIORS
GOVERNMENT & AGENCIES UNIVERSITIESSCHOOLS
SPORTS &LEISURE
ON-SITE GLOBAL
SERVICE OPERATIONS
TRANSVERSAL FUNCTIONS
BUSINESS & ADMINISTRATIONS
EDUCATION HEALTH CARE
& SENIORS

FISCAL 2016 REVENUES BREAKDOWN BY SEGMENTS
� New format starting Q1 2017
� On-Site revenues split by 3 Segments:
NEW SEGMENT REPORTING
MEETING ON JANUARY 12, IN LONDON (Q1 FISCAL 2017)
50 – Fiscal 2016 Results - November 17, 2016
� Provide Fiscal 2016 comparative quarterly sales and interim results
49%
25%
22%
4% Business & Administrations
Health Care & Seniors
Education
Benefits & Rewards
� These 3 segments will be split by geography:
� Starting from Fiscal 2017, operating margins report ed only by segment
� Transversal functional costs (HR, Finance, Service Operations…) will be allocated to each segment (excluding Group HQ costs)
� No change for Benefits and Rewards
• North America • Europe, including UK and Ireland • Africa, Asia, Australia, Latam, Middle East
• Business & Administrations:
> Corporate, > Energy & Resources, > Government & Agencies > Sports & Leisure > Non segmented activities
• Health Care & Seniors
• Education:
> Schools > Universities
OUTLOOK
51 – Fiscal 2016 Results - November 17, 2016
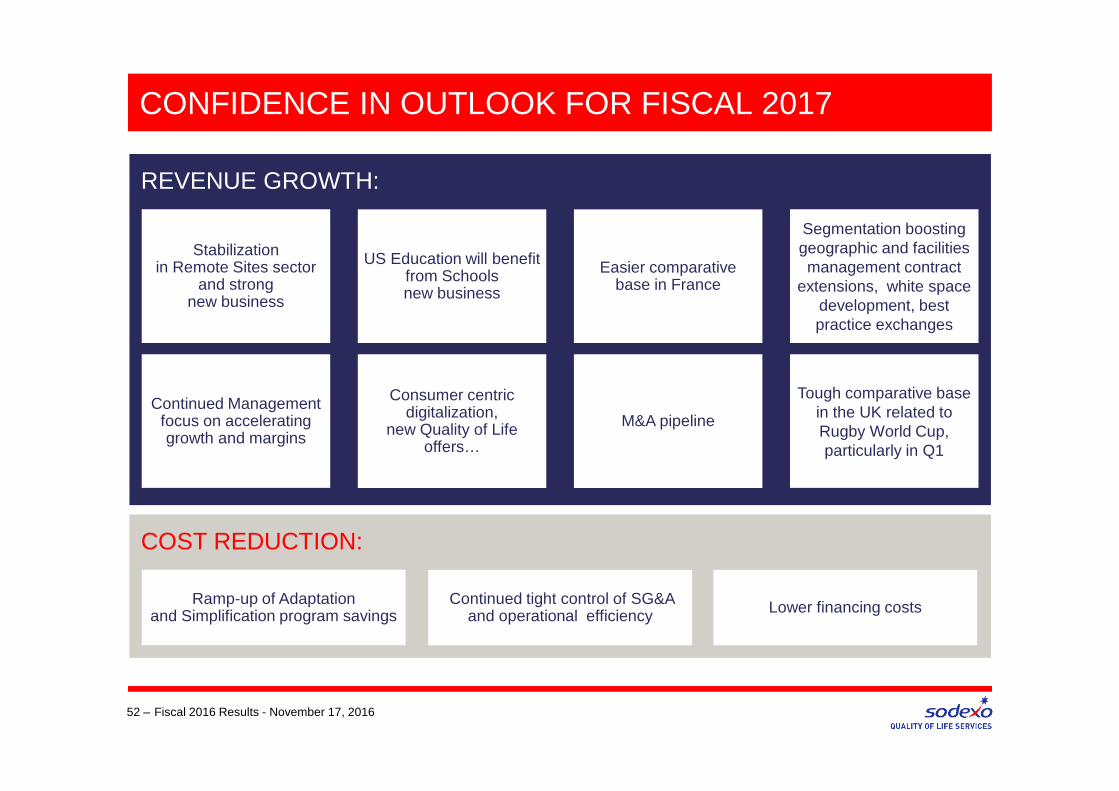
REVENUE GROWTH:
52 – Fiscal 2016 Results - November 17, 2016
US Education will benefit from Schools new business
Easier comparative base in France
Segmentation boosting geographic and facilities management contract
extensions, white space development, best practice exchanges
Stabilization in Remote Sites sector
and strong new business
CONFIDENCE IN OUTLOOK FOR FISCAL 2017
Consumer centric digitalization,
new Quality of Life offers…
M&A pipeline
Tough comparative base in the UK related to Rugby World Cup, particularly in Q1
Continued Management focus on accelerating growth and margins
COST REDUCTION:
Continued tight control of SG&Aand operational efficiency Lower financing costsRamp-up of Adaptation
and Simplification program savings
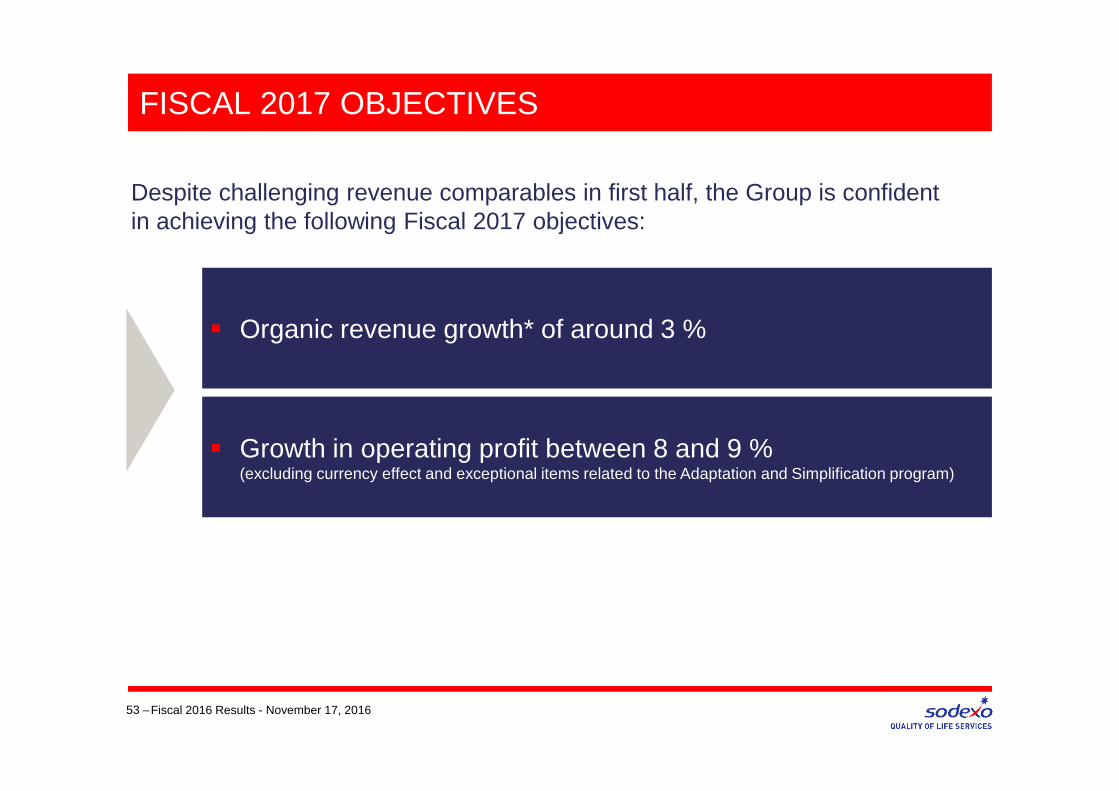
FISCAL 2017 OBJECTIVES
53 –Fiscal 2016 Results - November 17, 2016
� Organic revenue growth* of around 3 %
� Growth in operating profit between 8 and 9 %(excluding currency effect and exceptional items related to the Adaptation and Simplification program)
Despite challenging revenue comparables in first half, the Group is confident in achieving the following Fiscal 2017 objectives:

MEDIUM-TERM OBJECTIVES
54 – Fiscal 2016 Results - November 17, 2016
The Group maintains its medium-term objectives:
average annual growth in revenue between 4% and 7%(excluding currency effect)
average annual growth in operating profit of between 8% and 10% (excluding currency effect)

OUR MAJOR STRENGTHS
55 –
IndependenceSignificant
marketpotential
A unique range of Quality of Life Servicesparticularly well aligned
with evolving client demand
A global network covering
80 countries
Undisputed leadership in developingeconomies
A robust financial modelthat allows Sodexo to self-finance its
development
A strong culture and engaged
teams
Fiscal 2016 Results - November 17, 2016

ALTERNATIVE PERFORMANCE MEASUREDEFINITIONS
56 – Fiscal 2016 Results - November 17, 2016

ALTERNATIVE PERFORMANCE MEASURE DEFINITIONS
57 – Fiscal 2016 Results - November 17, 2016
Fiscal 2016 Fiscal 2015
Gearing ratioBorrowings1 - operating cash2
11% 9%Shareholders’ equity and non-controlling interests
Net debt ratioBorrowings1 - operating cash2
0.3 0.2Earnings before Interest, Taxes,Depreciation and Amortization (EBITDA)3
Debt coverageBorrowings
2.5 years 3.1 yearsOperating cash flow
Financial independenceNon-current borrowings
67.9% 73.8%Shareholders’ equity and non-controlling interests
Return on equityProfit attributable to equity holders of the parent
21% 23.3%Equity attributable to equity holders of the parent (before profit for the period)
Return on capital employed (ROCE)Operating profit after tax4
18.6% 19.7%Capital employed5
Interest coverOperating profit
12.6 9.0Net borrowing cost
Financial Ratios Definitions
1 2 3 4 5 See next slide for reconciliation
ALTERNATIVE PERFORMANCE MEASUREDEFINITIONS
58 – Fiscal 2016 Results - November 17, 2016
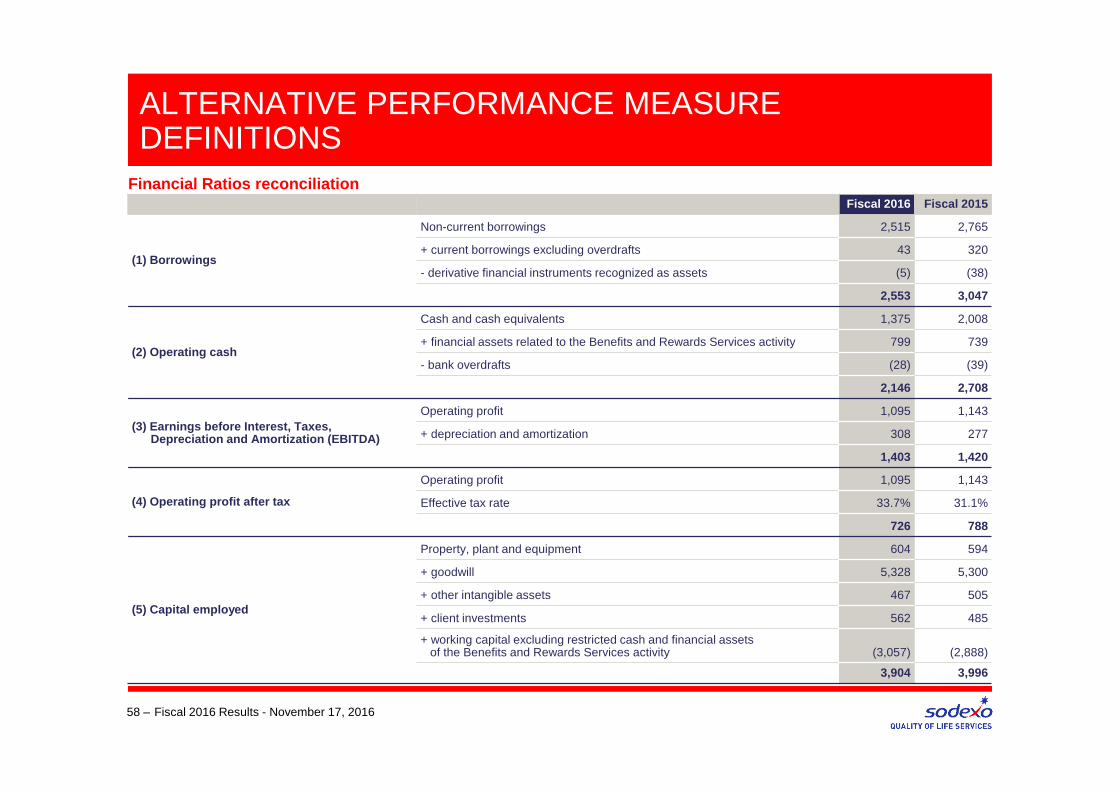
Financial Ratios reconciliationFiscal 2016 Fiscal 2015
(1) Borrowings
Non-current borrowings 2,515 2,765
+ current borrowings excluding overdrafts 43 320
- derivative financial instruments recognized as assets (5) (38)
2,553 3,047
(2) Operating cash
Cash and cash equivalents 1,375 2,008
+ financial assets related to the Benefits and Rewards Services activity 799 739
- bank overdrafts (28) (39)
2,146 2,708
(3) Earnings before Interest, Taxes,Depreciation and Amortization (EBITDA)
Operating profit 1,095 1,143
+ depreciation and amortization 308 277
1,403 1,420
(4) Operating profit after tax
Operating profit 1,095 1,143
Effective tax rate 33.7% 31.1%
726 788
(5) Capital employed
Property, plant and equipment 604 594
+ goodwill 5,328 5,300
+ other intangible assets 467 505
+ client investments 562 485
+ working capital excluding restricted cash and financial assets of the Benefits and Rewards Services activity (3,057) (2,888)
3,904 3,996
ALTERNATIVE PERFORMANCE MEASUREDEFINITIONS
59 – Fiscal 2016 Results - November 17, 2016
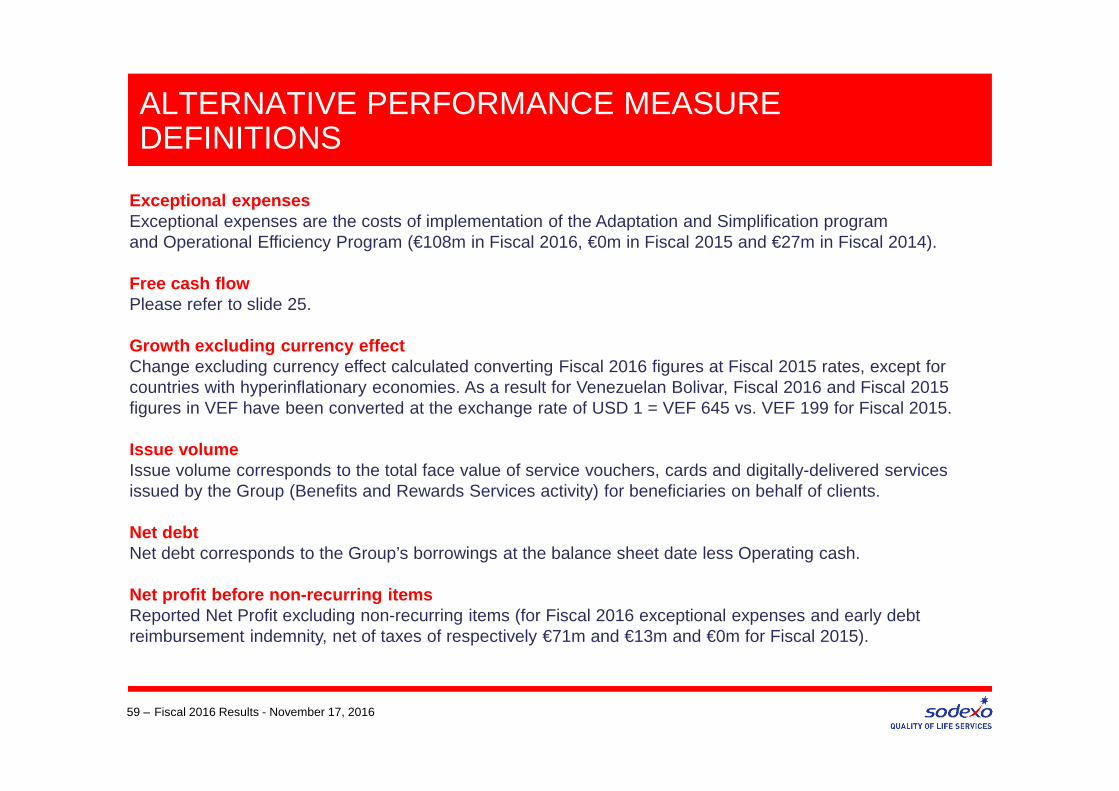
Exceptional expensesExceptional expenses are the costs of implementation of the Adaptation and Simplification program and Operational Efficiency Program (€108m in Fiscal 2016, €0m in Fiscal 2015 and €27m in Fiscal 2014).
Free cash flowPlease refer to slide 25.
Growth excluding currency effectChange excluding currency effect calculated converting Fiscal 2016 figures at Fiscal 2015 rates, except for countries with hyperinflationary economies. As a result for Venezuelan Bolivar, Fiscal 2016 and Fiscal 2015 figures in VEF have been converted at the exchange rate of USD 1 = VEF 645 vs. VEF 199 for Fiscal 2015.
Issue volumeIssue volume corresponds to the total face value of service vouchers, cards and digitally-delivered services issued by the Group (Benefits and Rewards Services activity) for beneficiaries on behalf of clients.
Net debtNet debt corresponds to the Group’s borrowings at the balance sheet date less Operating cash.
Net profit before non-recurring itemsReported Net Profit excluding non-recurring items (for Fiscal 2016 exceptional expenses and early debt reimbursement indemnity, net of taxes of respectively €71m and €13m and €0m for Fiscal 2015).

ALTERNATIVE PERFORMANCE MEASUREDEFINITIONS
60 – Fiscal 2016 Results - November 17, 2016
Non-recurring itemsFiscal 2016 exceptional expenses of €108m related to the Adaptation and Simplification program in operating profit and €21m of early debt reimbursement indemnity in financial expense, both net of taxes (respectively €71m and €13m). There were no items considered as non-recurring for Fiscal 2015.
Operating margin Operating profit divided by Revenues
Operating margin before exceptional expensesOperating profit before exceptional expenses divided by Revenues
Operating margin at constant rateMargin calculated converting Fiscal 2016 figures at Fiscal 2015 rates, except for countries with hyperinflationary economies. As a result for Venezuelan Bolivar, Fiscal 2016 and Fiscal 2015 figures in VEF have been converted at the exchange rate of USD 1 = VEF 645 vs. VEF 199 for Fiscal 2015.
Operating profit before exceptional expensesReported Operating Profit excluding exceptional expenses (€108m in Fiscal 2016, €0m in Fiscal 2015 and €27m in Fiscal 2014).
ALTERNATIVE PERFORMANCE MEASUREDEFINITIONS
61 – Fiscal 2016 Results - November 17, 2016
Organic growthOrganic growth corresponds to the increase in revenue for a given period (the "current period") compared to the revenue reported for the same period of the prior fiscal year, calculated using the exchange rate for the prior fiscal year; and excluding the impact of business acquisitions and divestments, as follows:
� for businesses acquired during the current period, revenue generated since the acquisition date is excluded from the organic growth calculation;
� for businesses acquired during the prior fiscal year, revenue generated during the current period up until the first anniversary date of the acquisition is excluded;
� for businesses divested during the prior fiscal year, revenue generated in the comparative period of the prior fiscal year until the divestment date is excluded;
� for businesses divested during the current fiscal year, revenue generated in the period commencing 12 months before the divestment date up to the end of the comparative period of the prior fiscal year is excluded.
For countries with hyperinflationary economies all figures are converted at the latest closing rate for both periods. As a result, for the calculation of organic growth, Benefits & Rewards figures for Fiscal 2016 and Fiscal 2015 in Venezuelan Bolivar, have been converted at the exchange rate of USD 1 = VEF 645 (vs. VEF 199 for Fiscal 2015).

Q&A
62 – Fiscal 2016 Results - November 17, 2016

1. Regular and Sustained performance
2. Revenue growth
3. Fiscal 2016 revenue split
4. Gross financial debt
5. Refinancing in Sep and October 2016
6. Nov’15 €300M share repurchase program completed
7. Financial ratios
8. Fiscal 2016 exchange rates and sensitivity
9. Fiscal 2016 share performance
10. Fiscal 2017 Financial calendar
11. Sodexo key facts
APPENDICES
63 – Fiscal 2016 Results - November 17, 2016
0
100
200
300
400
500
600
700
800
2007 2008 2009 2010 2011 2012 2013 2014 2015 2016
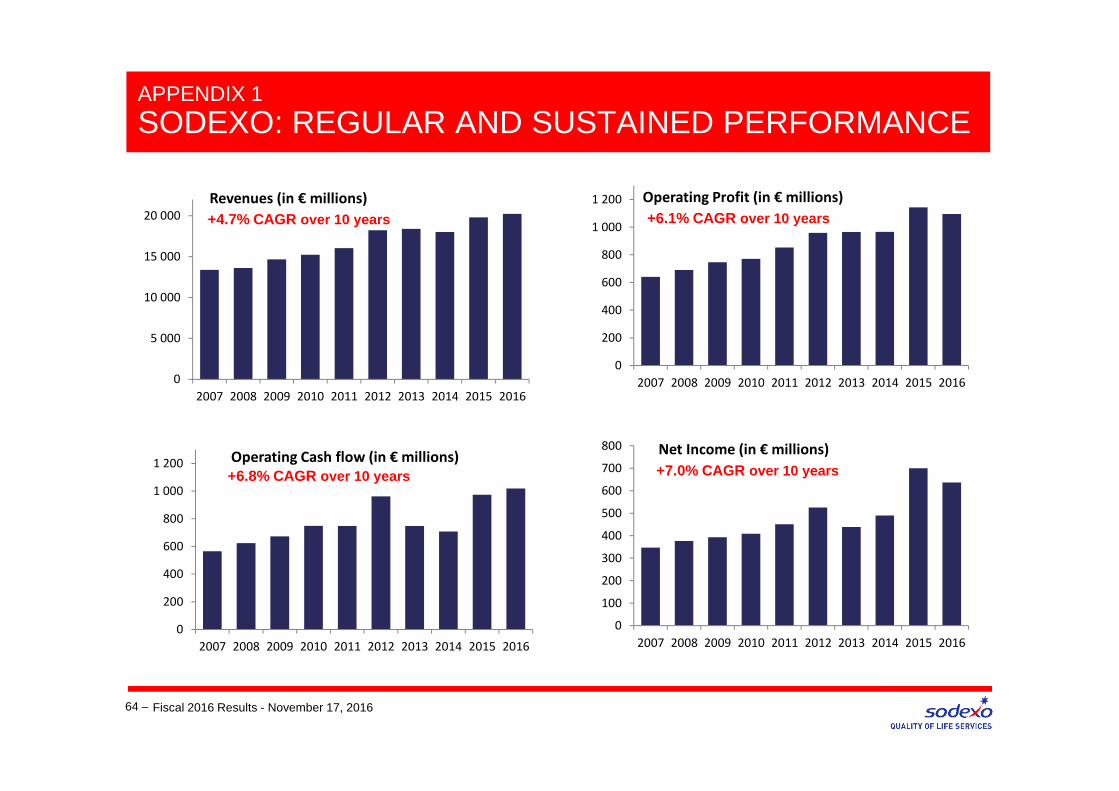
Net Income (in € millions)
0
5 000
10 000
15 000
20 000
2007 2008 2009 2010 2011 2012 2013 2014 2015 2016
APPENDIX 1
SODEXO: REGULAR AND SUSTAINED PERFORMANCE
64 – Fiscal 2016 Results - November 17, 2016
+4.7% CAGR over 10 years +6.1% CAGR over 10 years
+6.8% CAGR over 10 years +7.0% CAGR over 10 years
Revenues (in € millions)
0
200
400
600
800
1 000
1 200
2007 2008 2009 2010 2011 2012 2013 2014 2015 2016
Operating Cash flow (in € millions)
0
200
400
600
800
1 000
1 200
2007 2008 2009 2010 2011 2012 2013 2014 2015 2016
Operating Profit (in € millions)

0
0,5
1
1,5
2
2,5
3
3,5
4
4,5
5
2007 2008 2009 2010 2011 2012 2013 2014 2015 2016
0
0,5
1
1,5
2
2,5
3
3,5
4
4,5
5
2007 2008 2009 2010 2011 2012 2013 2014 2015 2016
APPENDIX 1
SODEXO: REGULAR AND SUSTAINED PERFORMANCE
65 –Fiscal 2016 Results - November 17, 2016
+7.4% CAGR over 10 years +8.5% CAGR over 10 years
EPS (in €) Dividend (in €)
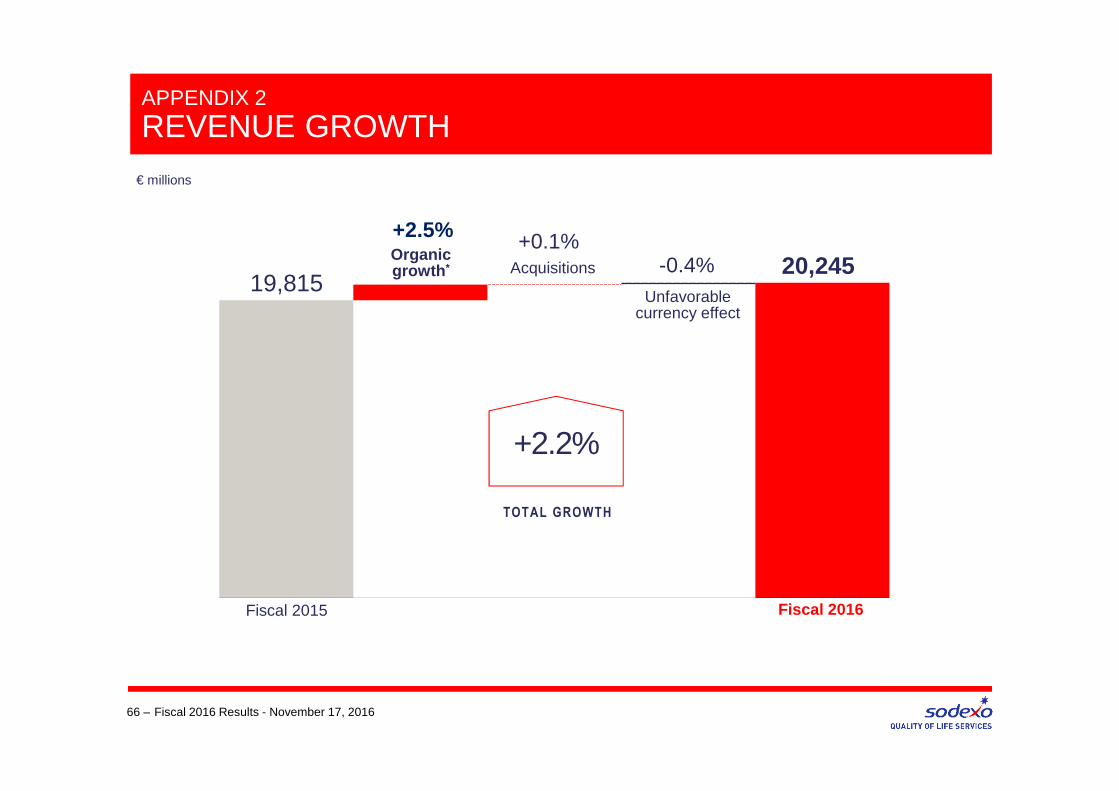
19,815
€ millions
Unfavorablecurrency effect
-0.4%
APPENDIX 2
REVENUE GROWTH
66 – Fiscal 2016 Results - November 17, 2016
Organic growth *
+2.5%
+2.2%
TOTAL GROWTH
20,245Acquisitions
+0.1%
Fiscal 2016Fiscal 2015
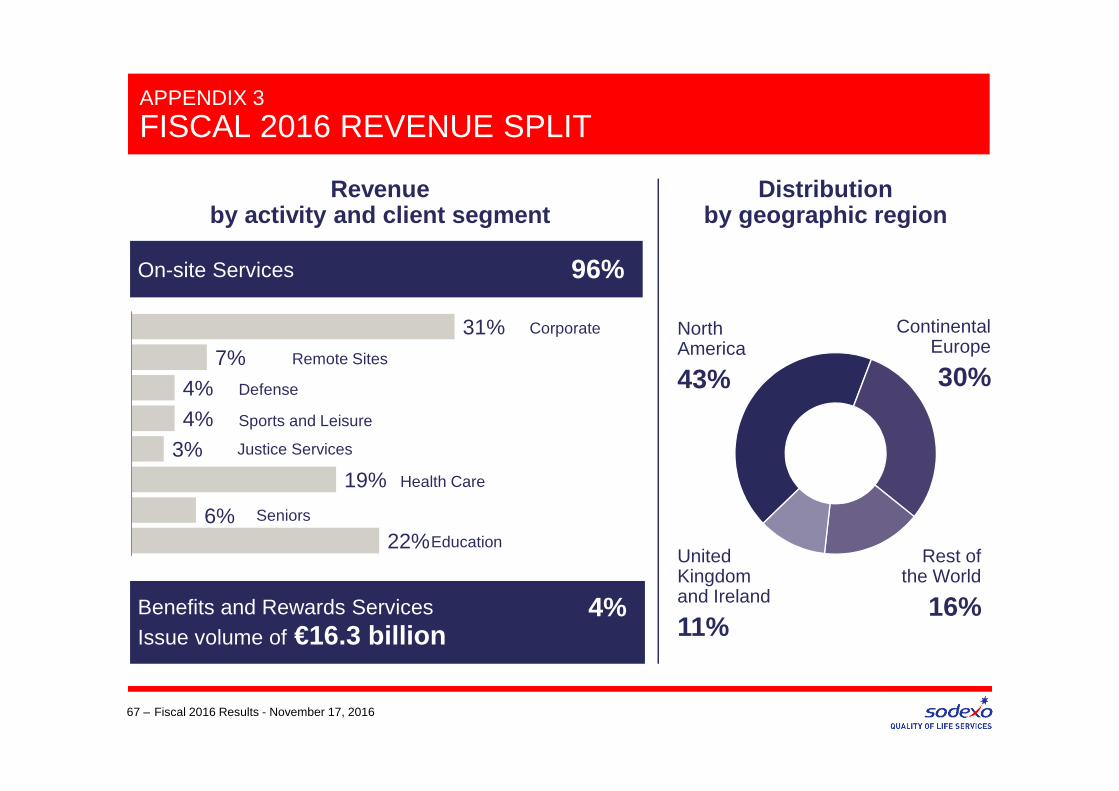
22%6%
19%3%4%4%
7%31%
United Kingdom and Ireland
11%
North America
43%
Continental Europe
30%
APPENDIX 3
FISCAL 2016 REVENUE SPLIT
67 – Fiscal 2016 Results - November 17, 2016
Benefits and Rewards Services Issue volume of €16.3 billion
4%
Rest of the World
16%
Revenue by activity and client segment
Distribution by geographic region
On-site Services 96%
Corporate
Defense
Justice Services
Remote Sites
Health Care
Seniors
Education
Sports and Leisure
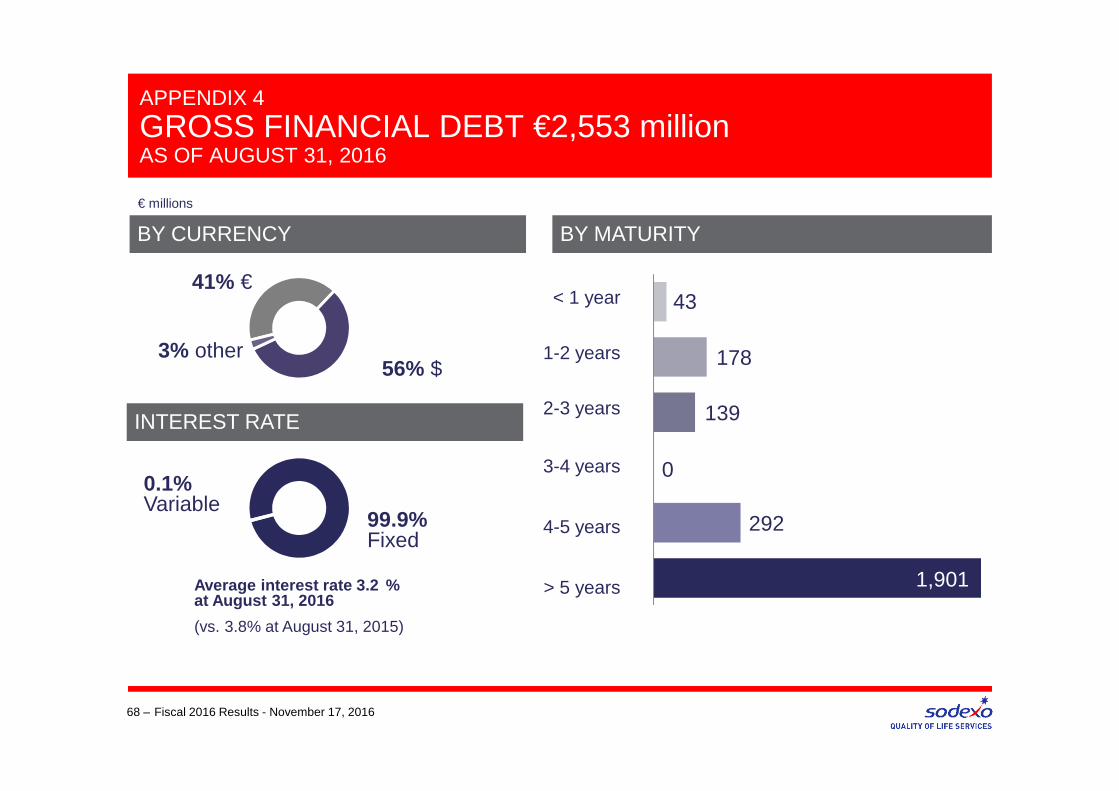
APPENDIX 4
GROSS FINANCIAL DEBT €2,553 million AS OF AUGUST 31, 2016
68 – Fiscal 2016 Results - November 17, 2016
41% €
INTEREST RATE
BY CURRENCY
292
0
139
178
BY MATURITY
< 1 year
1-2 years
2-3 years
3-4 years
4-5 years
> 5 years
€ millions
1,901Average interest rate 3.2 %at August 31, 2016
(vs. 3.8% at August 31, 2015)
43
0.1% Variable
99.9%Fixed
56% $3% other
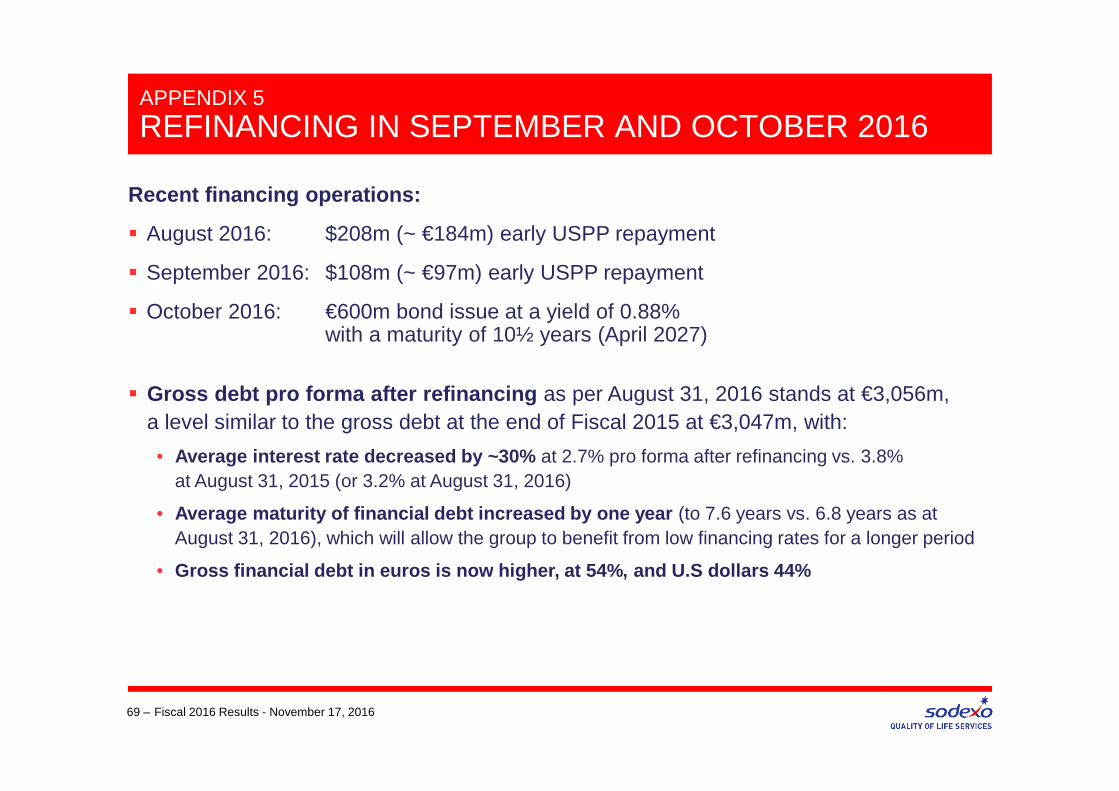
APPENDIX 5
REFINANCING IN SEPTEMBER AND OCTOBER 2016
69 – Fiscal 2016 Results - November 17, 2016
Recent financing operations:
� August 2016: $208m (~ €184m) early USPP repayment
� September 2016: $108m (~ €97m) early USPP repayment
� October 2016: €600m bond issue at a yield of 0.88% with a maturity of 10½ years (April 2027)
� Gross debt pro forma after refinancing as per August 31, 2016 stands at €3,056m, a level similar to the gross debt at the end of Fiscal 2015 at €3,047m, with:
• Average interest rate decreased by ~30% at 2.7% pro forma after refinancing vs. 3.8% at August 31, 2015 (or 3.2% at August 31, 2016)
• Average maturity of financial debt increased by one year (to 7.6 years vs. 6.8 years as at August 31, 2016), which will allow the group to benefit from low financing rates for a longer period
• Gross financial debt in euros is now higher, at 54% , and U.S dollars 44%

APPENDIX 5
GROSS FINANCIAL DEBT €3,056 million PROFORMA AS OF AUGUST 31, 2016 FOLLOWING REFINANCING IN SEP-OCT 16
70 – Fiscal 2016 Results - November 17, 2016
54% €
INTEREST RATE
BY CURRENCY
255
0
139
138
BY MATURITY
< 1 year
1-2 years
2-3 years
3-4 years
4-5 years
> 5 years
€ millions
2,481Pro forma as of August 31, 2016 average interest rate 2.7%
43
0.1% Variable
99.9%Fixed
44% $2% other
(vs. 3.8% at August 31, 2015)
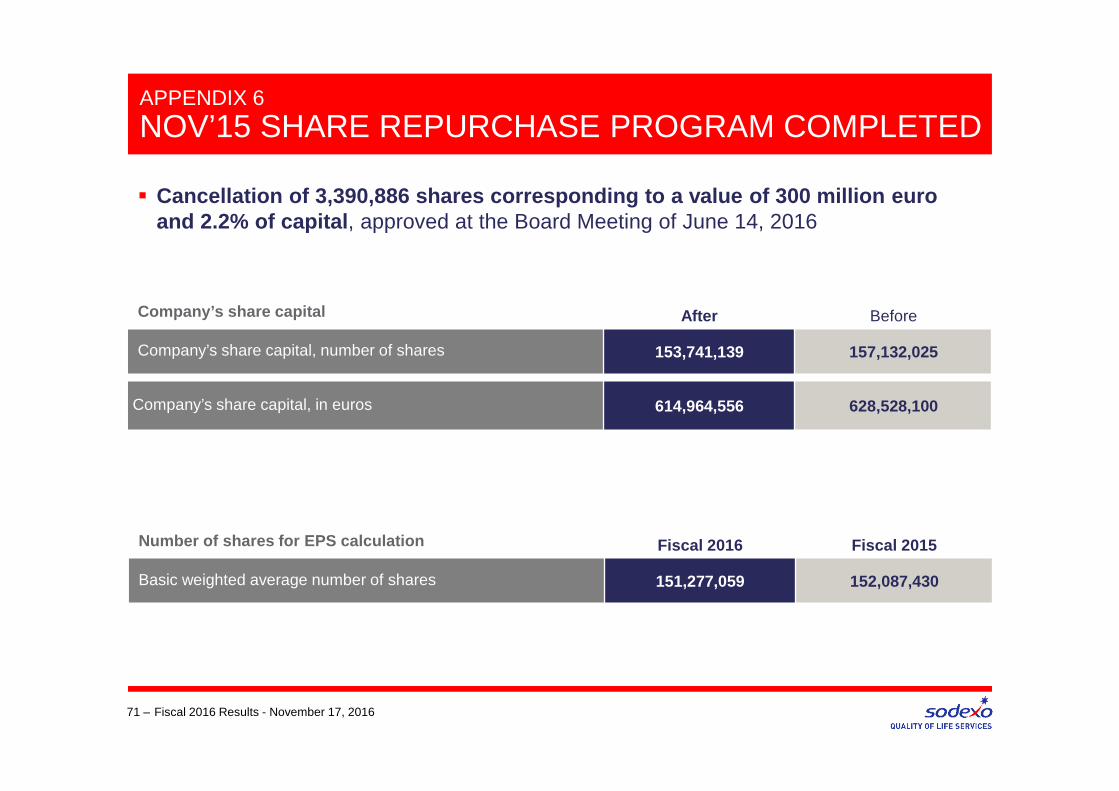
APPENDIX 6
NOV’15 SHARE REPURCHASE PROGRAM COMPLETED
71 – Fiscal 2016 Results - November 17, 2016
After BeforeCompany’s share capital
Company’s share capital, number of shares 153,741,139 157,132,025
Company’s share capital, in euros 614,964,556 628,528,100
� Cancellation of 3,390,886 shares corresponding to a value of 300 million euro and 2.2% of capital , approved at the Board Meeting of June 14, 2016
Fiscal 2016 Fiscal 2015Number of shares for EPS calculation
Basic weighted average number of shares 151,277,059 152,087,430
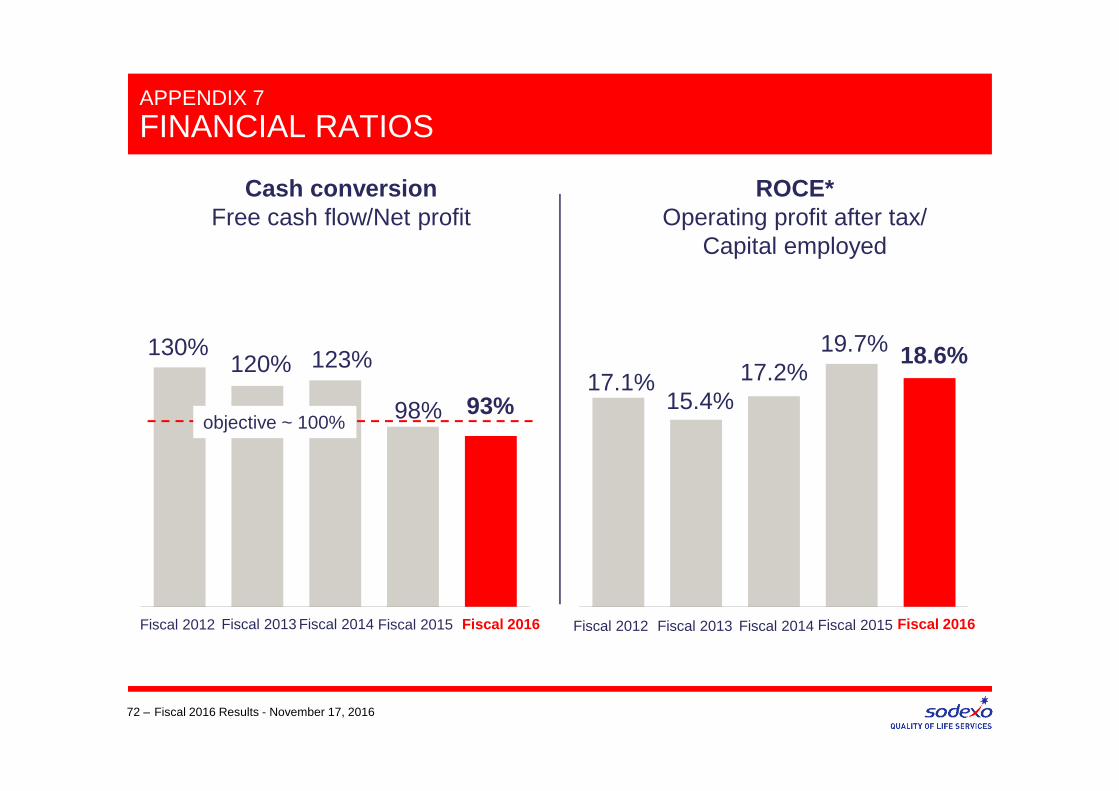
98%
APPENDIX 7
FINANCIAL RATIOS
72 –
93%
130%120% 18.6%
17.1%15.4%
Cash conversion Free cash flow/Net profit
ROCE*Operating profit after tax/
Capital employed
objective ~ 100%
Fiscal 2016Fiscal 2014Fiscal 2013Fiscal 2012
123% 17.2%
Fiscal 2016Fiscal 2014Fiscal 2013Fiscal 2012
Fiscal 2016 Results - November 17, 2016
Fiscal 2015
19.7%
Fiscal 2015
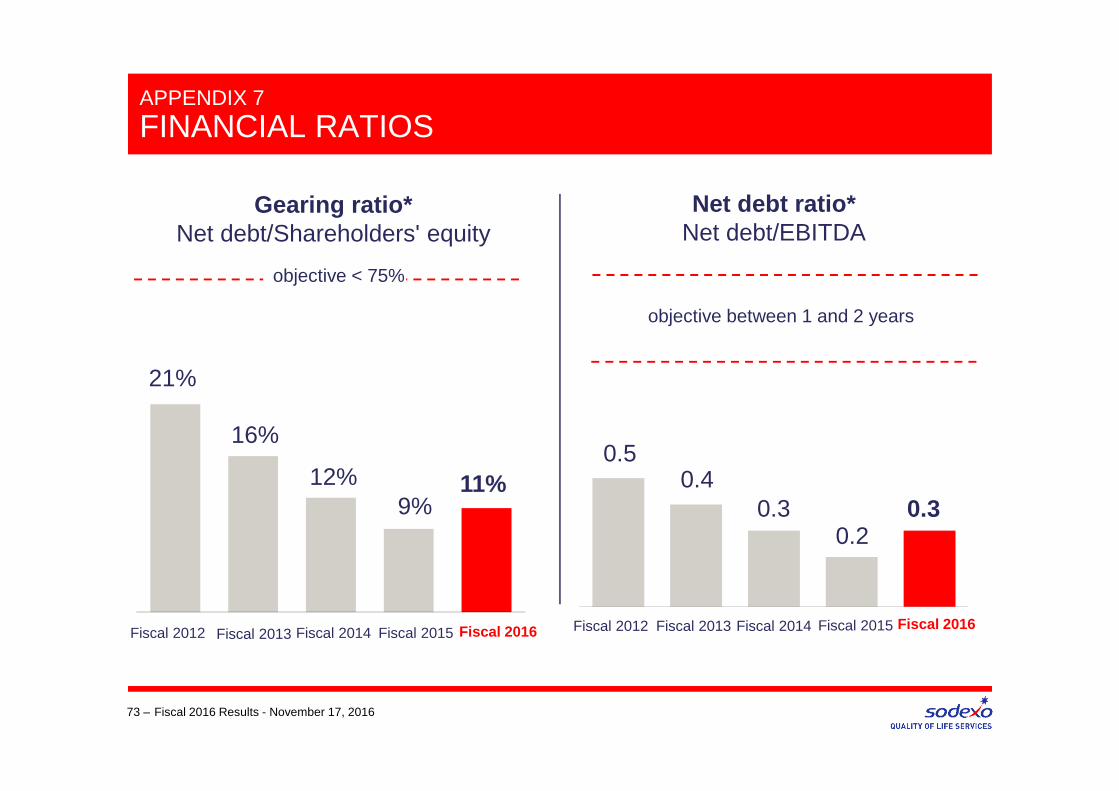
APPENDIX 7
FINANCIAL RATIOS
73 –
Fiscal 2016Fiscal 2014Fiscal 2013Fiscal 2012
Gearing ratio*Net debt/Shareholders' equity
objective < 75%
Fiscal 2016 Results - November 17, 2016
Fiscal 2015
11%
21%
16%
12%9%
0.20.3
0.50.4
Net debt ratio*Net debt/EBITDA
objective between 1 and 2 years
0.3
Fiscal 2016Fiscal 2014Fiscal 2013Fiscal 2012 Fiscal 2015
3,4
2.5
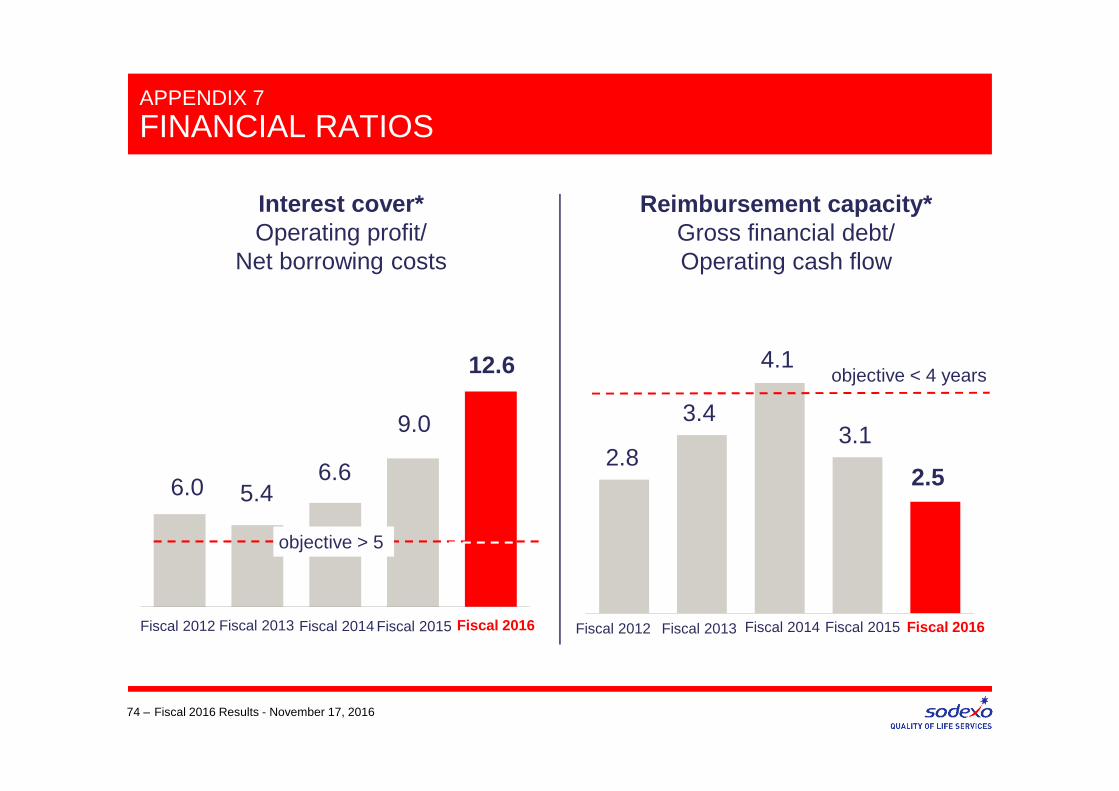
APPENDIX 7
FINANCIAL RATIOS
74 –
3.12.8
Reimbursement capacity*Gross financial debt/Operating cash flow
objective < 4 years
Fiscal 2015Fiscal 2014Fiscal 2013Fiscal 2012
4.1
Fiscal 2016 Results - November 17, 2016
3.4
Fiscal 2016
9.0
12.6
6.0 5.4
Interest cover*Operating profit/
Net borrowing costs
Fiscal 2016Fiscal 2014Fiscal 2013Fiscal 2012
6.6
objective > 5
Fiscal 2015

Average rate
Fiscal 2016 Change
Closing rate Aug. 31,
2016 Change
Impact of a 10% appreciation of the exchange rate of the following
currencies against the euro on
RevenuesOperating
profitShareholders’
equity
U.S. dollar 1,1063 +4.8% 1,1132 +0.7% 831 50 171
Pound Sterling 0,7673 -2.7% 0.8481 -14.2% 201 13 64
Brazilian Real 4,0691 -18.9% 3,6016 +12.9% 91 18 70
APPENDIX 8
FISCAL 2016 - EXCHANGE RATES AND SENSITIVITY
75 –
€1 =
Fiscal 2016 Results - November 17, 2016
€ millions
.
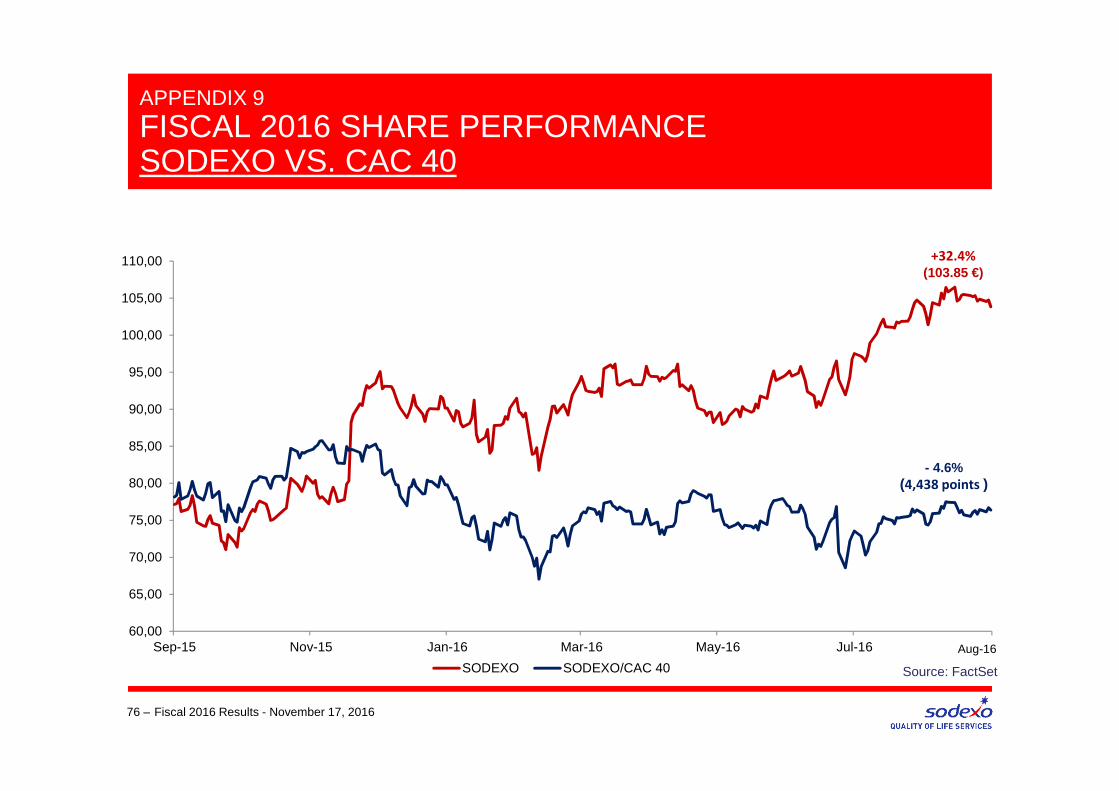
Source: FactSet
60,00
65,00
70,00
75,00
80,00
85,00
90,00
95,00
100,00
105,00
110,00
Sep-15 Nov-15 Jan-16 Mar-16 May-16 Jul-16
Cours de l'action Sodexo en Eurosdu 1er septembre 2015 au 31 août 2016
SODEXO SODEXO/CAC 40
+32.4%
(103.85 €)
- 4.6%(4,438 points )
Aug-16
APPENDIX 9
FISCAL 2016 SHARE PERFORMANCE SODEXO VS. CAC 40
Fiscal 2016 Results - November 17, 201676 –
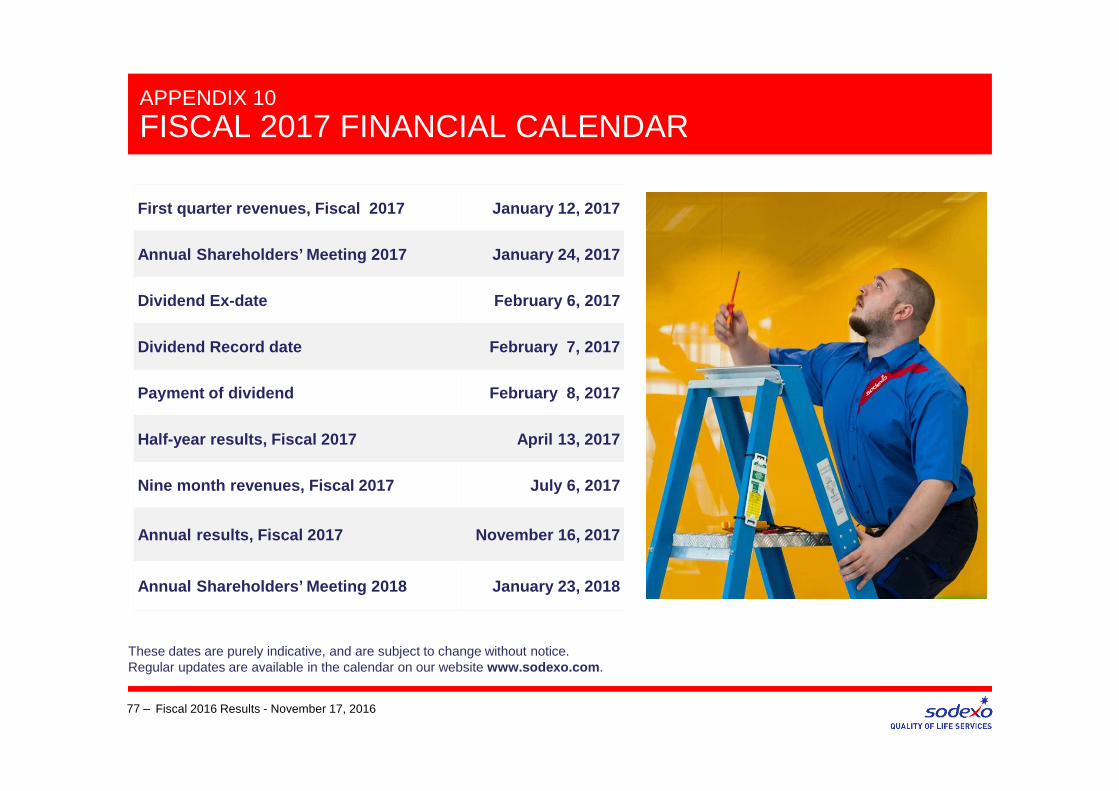
APPENDIX 10
FISCAL 2017 FINANCIAL CALENDAR
These dates are purely indicative, and are subject to change without notice. Regular updates are available in the calendar on our website www.sodexo.com .
77 – Fiscal 2016 Results - November 17, 2016
First quarter revenues, Fiscal 2017 January 12, 201 7
Annual Shareholders’ Meeting 2017 January 24, 2017
Dividend Ex-date February 6, 2017
Dividend Record date February 7, 2017
Payment of dividend February 8, 2017
Half-year results, Fiscal 2017 April 13, 2017
Nine month revenues, Fiscal 2017 July 6, 2017
Annual results, Fiscal 2017 November 16, 2017
Annual Shareholders’ Meeting 2018 January 23, 2018

APPENDIX 11
SODEXO: KEY FACTS
78 – Fiscal 2016 Results - November 17, 2016
€20.2 bn Revenues
Strong Investment Grade Rating
S&P A
� Founded in 1966 by Pierre Bellon
� Main Shareholders as 31/08/2016 :
> Bellon S.A 39.6% of capital (54.8% of voting rights)
> International Institutional investors 38.3%
(August16)
425,000 employees
19th largest employer worldwide
80 countries
€16.0 bnMarket capitalization
75 million consumers served daily