Embed Size (px)
Citation preview

On the Surface
5960 Heisley Road
Mentor, Ohio 44060-1834 USA440-354-2600www.steris.com
ST
ER
IS C
OR
PO
RA
TIO
N FISC
AL 2008 ANN
UAL R
EPO
RT
FISCAL 2008 ANNUAL REPORT

ABOUT THIS ANNUAL REPORT
The sterility of the surgical instrument on the cover symbolizes the mission of STERIS “on
the surface” – to provide a healthier today and a safer tomorrow through knowledgeable
people and innovative infection prevention, decontamination and health science technologies,
products and services.
Beyond the surface, integration among these technologies, products and services and
close connectivity between STERIS and its Customers promote productivity, quality and safety
in a wide range of critical environments – a key differentiator in the marketplace.
Beginning “on the surface,” this annual report offers a glimpse of the breadth of solutions
STERIS provides its valued Customers.
Letter to Shareholders pages 2-5
Advanced Visualization pages 6-7
Behind the Names pages 8-9
CONTENTS
Customer-Centric Commitment pages 10-11
STERIS at a Glance page 12
Corporate Information Inside Back Cover
STERIS has included as Exhibit 31 to its Annual Report on Form 10-K for the fi scal year ended March 31, 2008 fi led with the Securities and Exchange Commission (SEC) certifi cates of STERIS’s Principal Executive Offi cer and Principal Financial Offi cer regarding STERIS’s public disclosure. STERIS’s Chief Executive Offi cer has also submitted to the New York Stock Exchange a certifi cate certifying that he is not aware of any violation by STERIS of the New York Stock Exchange corporate governance listing standards. This Annual Report, other than the Form 10-K, has not been fi led with the SEC.
Product and service descriptions herein are for illustration purposes only and do not modify or alter product warranties, labeling, instructions or other technical literature.
PUBLICATION ID ANNRPT08. COPYRIGHT 2008 BY STERIS CORPORATION. ALL RIGHTS RESERVED. PRINTED IN USA. DESIGN BY DIX & EATON
BOARD OF DIRECTORS
John P. Wareham1
Chairman of the BoardSTERIS Corporation
Retired Chairman of the Board and Chief Executive Offi cer, Beckman Coulter, Inc.
Richard C. Breeden1
Chief Executive Offi cer andChief Investment Offi cer, Breeden Partners and Breeden Capital Management
Cynthia L. Feldmann2
President and Founder, Jetty Lane Associates
Robert H. Fields2
Partner and Managing Director,Breeden Partners and Breeden Capital Management
Jacqueline Kosecoff, Ph.D.3
Chief Executive Offi cer, Prescriptions Solutions, UnitedHealth Group
Raymond A. Lancaster1
Managing Director, South Franklin Street Partners
Kevin M. McMullen1
Chairman of the Board, Chief Executive Offi cer and President, OMNOVA Solutions Inc.
J. B. Richey3
Senior Vice President and Member of the Board of Directors, Invacare Corporation
Walter M Rosebrough
President and Chief Executive Offi cer, STERIS Corporation
Mohsen M. Sohi2
President and Chief Executive Offi cer,Freudenberg-NOK General Partnership
Loyal W. Wilson2
Managing Director, Primus Venture Partners, Inc.
Michael B. Wood, M.D.3
Consultant Physician, Mayo Clinic
EXECUTIVE OFFICERS
Walter M Rosebrough
President and Chief Executive Offi cer
William L. Aamoth
Vice President and Corporate Treasurer
Peter A. Burke
Senior Vice President and Chief Technology Offi cer
Timothy L. Chapman
Senior Vice President and Group President, Healthcare
Mark D. McGinley
Senior Vice President, General Counsel, and Secretary
Robert E. Moss
Senior Vice President andGroup President, STERIS Isomedix Services
Gerard J. Reis
Senior Vice President, Government and Administration
Michael J. Tokich
Senior Vice President and Chief Financial Offi cer
John N. Voyzey
Vice President and General Manager, Life Sciences
EXECUTIVE OFFICES
5960 Heisley RoadMentor, OH 44060-1834 USA440-354-2600
www.steris.com
FORM 10-K
Included in this Annual Report is a copy of STERIS Corporation’s Form 10-K fi led with the Securities and Exchange Commission for the year ended March 31, 2008. Addi-tional copies of the Company’s Form 10-K and other information are available on the Internet at www.steris-ir.com, or upon written request to:
Investor Relations
STERIS Corporation 5960 Heisley Road Mentor, OH 44060-1834 USA
TRANSFER AGENT AND REGISTRAR
National City Bank
Shareholder Services
P.O. Box 92301Cleveland, OH 44101-4301800-622-6757
INDEPENDENT REGISTERED
PUBLIC ACCOUNTING FIRM
Ernst & Young LLP
Suite 1300925 Euclid AvenueCleveland, OH 44115-1476
STOCK EXCHANGE LISTING
STERIS common stock is listed on the New York Stock Exchange under the symbol STE.
ANNUAL MEETING OF SHAREHOLDERS
The Company’s 2008 annual meeting will be held on Thursday, July 24, 2008, at 9:00 a.m. Eastern time at:
Holiday Inn Express Hotel
& Suites LaMalfa
5783 Heisley Road Mentor, OH 44060
Corporate Information
1 COMPENSATION AND CORPORATE GOVERNANCE COMMITTEE MEMBER
2 AUDIT AND FINANCIAL POLICY COMMITTEE MEMBER
3 COMPLIANCE COMMITTEE MEMBER

“ We intend to give Customers more reasons
than ever to turn to us for solutions.”
— Walt Rosebrough President and Chief Executive Offi cer

Dear Fellow Shareholders: It is with great pleasure that I write to you as your new President and CEO.
STERIS CORPORATION PG 2
I am privileged to have the opportunity to lead your company,
a long-established, respected innovator and market
leader in sterilization, infection prevention, contamination
control, and equipment for surgical suites.
During my many years in the healthcare business,
I have been impressed by the STERIS that is apparent on
the surface – great technologies, products and people.
Since coming aboard last October, I’ve become even more
impressed by what isn’t always as apparent or appreciated
– the breadth of the solutions STERIS can deliver to
Customers, the tremendous talent and dedication of our
people, the Company’s underlying financial strength and
the product-development pipeline that offers promise for
the future.
A YEAR OF TRANSITION AND PROGRESS
Fiscal 2008 was a transitional year for STERIS, not only in terms of leadership but in actions that will
drive future results – including completing the transfer of sterilizer manufacturing operations to a
new and more effi cient facility, investing in sales and marketing resources, and introducing several
important new products.
Year-to-year revenues increased 6 percent to a record $1.27 billion. Our Healthcare segment
delivered 5 percent revenue growth as demand from our hospital Customers created a strong order
pattern and backlog level. Life Sciences grew 9 percent on the strength of shipments late in the year.
Our Isomedix Services segment delivered growth of 5 percent for the year as demand from our
medical device Customers continued to grow.
Earnings were $77.1 million, or $1.20 per diluted share, compared with $82.2 million, or $1.25 per
diluted share, in fi scal 2007. Earnings fell behind what was anticipated early in the year, largely due to
signifi cant increases in raw material costs and foreign exchange rates as well as the slower-than-
expected ramp-up of our new manufacturing operations. However, we came back strong late in the
year and, excluding restructuring charges in both years, posted record earnings per share – representing
a 6 percent increase in diluted earnings per share compared with full-year fi scal 20071.
The signifi cant move of production operations from Erie, Pennsylvania, to Monterrey, Mexico,
encountered short-term delays that hampered productivity until the fourth quarter. By year end,
however, the new plant was producing at anticipated annualized run rates, refl ecting the hard work
1 PLEASE SEE THE COMPANY’S FORM 8-K FILED WITH THE SECURITIES AND EXCHANGE COMMISSION ON MAY 7, 2008 FOR SPECIFIC DISCUSSION AND/OR
RECONCILIATION OF THIS ITEM.

and dedication of our people in Monterrey. With the
transition now behind us, we expect to reap the full
benefi t of the $20 million pre-tax annual cost savings
from the move in fi scal year 2009 and beyond. We
have also reallocated resources to place greater
emphasis on developing, building, selling and servicing
products. We will continually look for opportunities to
reduce our non-value-adding operating costs in
order to drive sustainable profi table growth.
Unfortunately, the transition to Mexico coincided
with the broad-based decline of the U.S. dollar,
resulting in a greater negative impact of foreign
currency exchange rates. The weak dollar also com-
pounded the effects of raw material cost increases,
especially for stainless steel. Raw material costs,
especially metals and petroleum-based products,
and the weak dollar are challenges for us going
forward in fi scal 2009.
Cash generated by operations was $143.4
million, compared with $95.7 million in fi scal 2007,
and free cash fl ow2 was $91.6 million, compared with
$49.5 million in fi scal 2007. Through a combination of
available cash and modest balance sheet leverage,
we were able to create value for our shareholders by
purchasing our own stock. During fiscal 2008,
repurchases of common shares totaled $183.2
million, or more than 6.8 million shares at an average
price of $26.84 per share. Reflecting continued
confi dence in the future value of the Company, the
Board recently authorized the purchase of up to $300
million in common shares, replacing an existing
authorization that had approximately $160 million
remaining. During the year, the Board also raised
our quarterly dividend to $0.06 per share.
In summary, fi scal 2008 was a year of transition
and progress. We ended the year strong and are better
positioned for success entering fi scal year 2009.
O N T H E S U R F A C E
PG 3
NET REVENUES
DOLLARS IN MILLIONS
$1,500
1,200
900
600
300
004 05 06 07
CASH FROM OPERATIONS
DOLLARS IN MILLIONS
$200
150
100
50
0
DEBT TO CAPITAL RATIO
25
20
15
10
5
0
PERCENT
08
04 05 06 07 08
04 05 06 07 08
2 PLEASE SEE PAGE 25 OF THE COMPANY’S ANNUAL REPORT ON FORM 10-K FILED WITH THE SECURITIES AND EXCHANGE
COMMISSION ON MAY 30, 2008 FOR SPECIFIC DISCUSSION AND/OR RECONCILIATION OF THIS ITEM.

STERIS CORPORATION PG 4
BEYOND THE SURFACE
The past year saw the introduction of several exciting products that break new ground as well
as complement our existing strengths.
Notable is the Harmony® LED Surgical Lighting and Visualization System, an integral part
of our comprehensive and fl exible solution for the surgical suite. Harmony LED’s pure white,
natural light and one-touch control – the direct result of Customer input – have drawn
enthusiastic response from physicians and nurses. We have seen an encouraging sales trend
since the third-quarter launch. The LED light, when coupled with our other operating room
products, positions STERIS as the operating room partner of choice.
The Amsco® V-PRO™ 1 Low Temperature Sterilization System – which can quickly process
large volumes of heat- and moisture-sensitive devices – became the latest addition to a
product line of sterilizers that healthcare professionals have trusted for more than a century.
Although already launched internationally in fi scal 2008, we recently received FDA clearance
for the system in the United States and will aggressively promote it in fi scal 2009.
We are also encouraged by early positive Customer reaction to our Reliance® Vision™
Single-Chamber Washer/Disinfector, which provides better performance with faster cycles,
more effi cient consumable usage and lower utilities consumption. Customer response to our
Verify® SixCess™ Indicators has also been very strong, allowing Customers a more rapid
release of sterilization cycles.
I am encouraged by these innovations as well as the pipeline of products currently under
development at STERIS. We will continue to make investments in new product development
and launch initiatives and anticipate a stream of products coming to market. Although these
investments may temper earnings growth somewhat in the near term, they represent the
lifeblood of any healthcare technology company.
A GROWTH INDUSTRY
I have spent most of my career in areas related to healthcare. I have always believed this
market offers tremendous opportunity for business success while serving real societal needs.
We are part of an industry that stands to grow significantly over the coming decades,
notwithstanding changing political environments and periodic economic pressures. As the

large population of baby boomers in industrialized nations ages, and as personal wealth expands
around the world, we will collectively spend an increasing portion of our income on health and
well-being, fueling demand for innovative products in areas where STERIS is already strong.
For STERIS, our opportunities begin with executing more effectively the actions we already
have under way. By doing so, we can earn greater market share in our current markets and
improve operating margins. The initiatives of the past year will help us do just that. Looking
ahead, I am confident that successful implementation in our key markets will allow us to
generate stronger top-line growth, and profi tability that grows faster than sales.
CONFIDENCE IN THE FUTURE
We have put in place a new management team with the promotions of Timothy Chapman to manage
Healthcare, John Voyzey to run Life Sciences and Michael Tokich to Chief Financial Offi cer. Tim,
John and Mike have played important roles in shaping and implementing STERIS’s strategy, and
I am confi dent that their skills and experience will be invaluable to our continued success.
I thank my fellow Board members for their confidence in our leadership team and their
ongoing support and am pleased to welcome Richard C. Breeden and Robert H. Fields, who joined
our Board of Directors in April. They bring a unique perspective that complements the skills and
expertise of the Board. The counsel and diverse insights of the entire Board will be invaluable as
we work together to drive sustainable profi table growth and increase STERIS’s market value.
I also thank Les Vinney, former CEO and director, and Steve Hardis, former director, both of
whom retired last year, for their service over the past several years.
After a little more than six months as your CEO, I am impressed by the opportunities in front
of STERIS, grateful for the trust and support of our Customers, and excited about our ability to
take full advantage of opportunities in the markets we pursue. With the continued dedication of
our talented people, we intend to give Customers more reasons than ever to turn to us for
solutions, and to reward our shareholders for investing in STERIS.
I look forward to reporting on our progress and thank you for your continued confi dence
in STERIS.
Walter M Rosebrough
President and Chief Executive Offi cer
June 2008
O N T H E S U R F A C E
PG 5

“ We’re able to see where we couldn’t see
before, and that enhances patient safety
all around.”
— Dr. Neil Finkler, M.D. Surgeon
Florida Hospital, Orlando, Florida
STERIS CORPORATION PG 6
O N T H E S U R F A C E
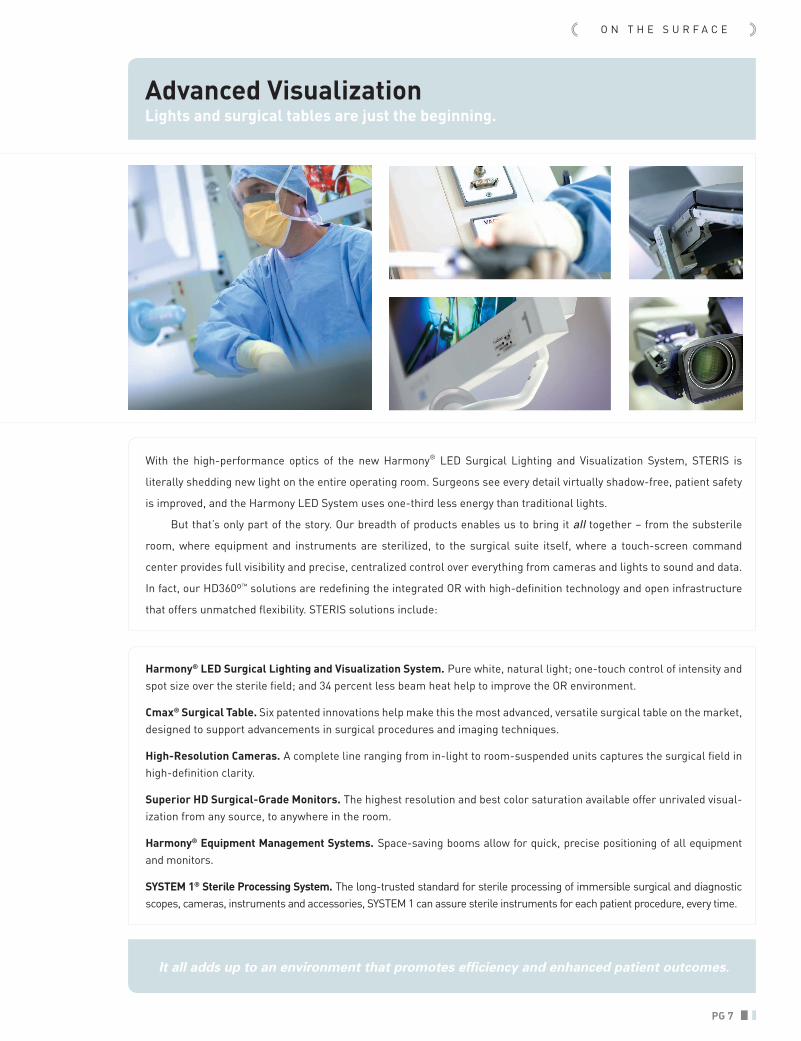
Advanced Visualization Lights and surgical tables are just the beginning.
Harmony® LED Surgical Lighting and Visualization System. Pure white, natural light; one-touch control of intensity and spot size over the sterile fi eld; and 34 percent less beam heat help to improve the OR environment.
Cmax® Surgical Table. Six patented innovations help make this the most advanced, versatile surgical table on the market, designed to support advancements in surgical procedures and imaging techniques.
High-Resolution Cameras. A complete line ranging from in-light to room-suspended units captures the surgical fi eld in high-defi nition clarity.
Superior HD Surgical-Grade Monitors. The highest resolution and best color saturation available offer unrivaled visual-ization from any source, to anywhere in the room.
Harmony® Equipment Management Systems. Space-saving booms allow for quick, precise positioning of all equipment and monitors.
SYSTEM 1® Sterile Processing System. The long-trusted standard for sterile processing of immersible surgical and diagnostic scopes, cameras, instruments and accessories, SYSTEM 1 can assure sterile instruments for each patient procedure, every time.
PG 7
With the high-performance optics of the new Harmony® LED Surgical Lighting and Visualization System, STERIS is
literally shedding new light on the entire operating room. Surgeons see every detail virtually shadow-free, patient safety
is improved, and the Harmony LED System uses one-third less energy than traditional lights.
But that’s only part of the story. Our breadth of products enables us to bring it all together – from the substerile
room, where equipment and instruments are sterilized, to the surgical suite itself, where a touch-screen command
center provides full visibility and precise, centralized control over everything from cameras and lights to sound and data.
In fact, our HD360º™ solutions are redefi ning the integrated OR with high-defi nition technology and open infrastructure
that offers unmatched fl exibility. STERIS solutions include:
It all adds up to an environment that promotes effi ciency and enhanced patient outcomes.

STERIS CORPORATION PG 8
“ We have created a safer and better environment...
patients recover quicker, hospital stays are shorter
and this ultimately reduces cost.”
— Dr. Greg Ribakove, M.D. Chief of Cardiac Surgery
Bellevue Hospital Center and NYU Medical Center, NYC

Reliance® Vision™ Washer/Disinfector. Customer input and innovative engineering came together in this truly new washing system, featuring redesigned spray arms for more thorough cleaning of critical instruments and utensils.
Amsco® V-PRO™ 1 Low Temperature Sterilization System. Utilizing vaporized hydrogen peroxide technology, the V-PRO™ 1 enables effi cient processing of large volumes of heat- and moisture-sensitive devices and ensures patient and staff safety.
Amsco® Evolution™ Steam Sterilizer. A dramatic redesign of Evolution’s controls and displays provides sterile processing departments greater throughput, reduced downtime and improved effi ciency, while its modular design allows for ease of installation, operation and servicing. Amsco® Evolution™ is currently available only in Europe and is targeted for launch in the United States in fi scal 2009.
Prolystica® Cleaning Chemistries. New concentrated formulations provide remarkable cleaning effi cacy, instrument protection, biodegradable ingredients and consistent dilutions at a fraction of the volume of traditional cleaning chemistries.
Verify® SixCess™ Challenge Packs and Indicator Strips. These chemical indicators provide a high level of assurance that surgical instruments have been properly sterilized and are safe to use immediately.
ErgoStat™ Prep and Pack Workstations. Intelligent ergonomic features such as electric height adjustment distinguish this innovative, fl exible instrument reprocessing workstation.
Instrument Management Solutions. STERIS has teamed up with Censis Technologies, Inc., the expert in Web-based surgical instrument management systems, to provide a suite of instrument management solutions.
O N T H E S U R F A C E
Behind the Names Technology and commitment power solutions for Customers.
PG 9
The STERIS and Amsco names have long been synonymous with innovation in sterile processing. A key reason for that is
our fundamental commitment to develop innovative sterilization, decontamination and infection control products for
healthcare, scientifi c, research, industrial, and government Customers throughout the world. In fact, we have greatly
advanced the science of sterility and hold more than 1,000 U.S. and foreign patents.
The result is a steady stream of breakthroughs and new applications. As stand-alone units and as complementary
components of a complete solution, these products help our Customers improve quality, safety and effi ciency. Here are
just a few recent innovations:
The underlying technologies and chemistries are diverse and complex, but the goal is always the same: To enhance Customer productivity and quality, and help make the world a safer place.

STERIS CORPORATION PG 10
“ STERIS specifi cally sat down and asked us our ideas
about what we needed the OR to be able to do for us.”
— Dr. Costas Bizekis, M.D. Chief of Thoracic Surgery Bellevue Hospital Center and NYU Medical Center, NYC

Education and Training. From maintenance and repair training to healthcare operator training programs and from on-site continuing education programs to in-depth seminars on sterile processing and infection control, STERIS programs help Customers meet the challenges they face every day.
Sales and Service Resources. We’re investing in our sales and service channel to put more “feet on the street” and provide more frequent interface with our Customers so we can serve their needs even better.
ProSupport™ Program. We help Customers optimize the performance of STERIS equipment by providing their service technicians with training, priority technical support, and product and service documentation.
ProConnect™ Remote Monitoring. By securely monitoring equipment performance from our remote ProConnect™
Response Center, we help Customers avoid downtime.
Design and Planning Services. STERIS specialists can help Customers maximize productivity literally from the ground up, with services to support operating room design, hospital expansion, pharmaceutical production and research planning, materials handling and more.
Customer Impact Review Program. In-depth interviews by members of our management team reinforce our commitment to our Customers and elicit feedback that shapes our product and service offerings.
Global Account Directors. Dedicated account service professionals provide major pharmaceutical Customers with a direct connection to the total STERIS solution.
Product Development. Tomorrow’s STERIS solutions are being developed today to support our Customers’ future needs, and our product-development pipeline offers promise for the future.
Customer-Centric Commitment Helping Customers do their jobs safely, effectively and effi ciently.
O N T H E S U R F A C E
PG 11
We may be all about protecting people and surfaces. But at STERIS, our commitment to Customers runs deep.
At STERIS, our focus is on meeting the needs of our Customers and enhancing our legacy of product quality and innovation.
That means that we must be relentless in creating value and providing solid solutions that give Customers every reason
to turn to STERIS.
Continuous dialogue helps us anticipate Customer needs – from big-picture planning issues to everyday opera-
tional challenges – and contributes to product and service innovations and enhancements. Operational and educational
support provides Customers with practical skills as well as the latest technologies and standards of practice to ensure
safe patient care. And our breadth of products offers comprehensive solutions for healthcare institutions, life sciences
companies, government agencies, the military and private industry. Our Customer-centric commitment includes:

Healthcare71% of Total Revenue
A leading provider of an
integrated offering of equipment,
consumables and services to
healthcare providers, enabling
them to reduce costs and improve
outcomes in the surgical and
acute care environments.
PRIMARY CUSTOMERS
Hospitals and Surgical Centers
PRIMARY PRODUCTS
Capital Equipment
■ Surgical Tables and Lights
■ Washers and Sterilizers
Consumables
■ Skin Care
■ Instrument Cleaning
■ Sterility Assurance Products
Service
■ Equipment Maintenance, Installation and Parts
Life Sciences18% of Total Revenue
A global provider of
decontamination and
sterilization technologies,
products and services used
by research facilities and
pharmaceutical companies.
PRIMARY CUSTOMERS
Pharmaceutical Manufacturing and Research
PRIMARY PRODUCTS
Capital Equipment
■ Sterilizers, Washers and Water Purifi cation
Consumables
■ Cleaners, Disinfectants and Sterilants
■ Sterility Assurance Products
Service
■ Equipment Maintenance, Installation and Parts
Isomedix11% of Total Revenue
STERIS Isomedix Services is
a leading provider of industrial
sterilization, microbial reduction,
and materials modification
services to medical supply,
pharmaceutical, consumer
and industrial Customers.
PRIMARY CUSTOMERS
Medical Device Manufacturers
PRIMARY SERVICES
Contract Sterilization
■ Gamma Irradiation
■ Ethylene Oxide
Microbial Reduction
Materials Modifi cation
STERIS at a Glance
HEALTHCARE
$887 MILLION
LIFE SCIENCES
$228 MILLION
Ethylene Oxide (40%)
Gamma Irradiation (60%)
ISOMEDIX
$141 MILLION
Capital Equipment (46%)
Consumables (22%)
Service (32%)
REVENUE MIX FY08
STERIS CORPORATION PG 12
NOTE: The Company reports a fourth segment called Corporate and Other.RECURRING REVENUES
Capital Equipment (48%)
Consumables (26%)
Service (26%)

United States Securities and Exchange CommissionWashington, D. C. 20549
F O R M 1 0 - KÈ Annual Report Pursuant to Section 13 OR 15(d) of The Securities Exchange Act of 1934
For the fiscal year ended March 31, 2008OR
‘ Transition Report Pursuant to Section 13 OR 15(d) of The Securities Exchange Act of 1934
For the transition period from to
Commission file number 1-14643
STERIS Corporation(Exact name of registrant as specified in its charter)
Ohio 34-1482024(State or other jurisdiction ofincorporation or organization)
(IRS Employer Identification No.)
5960 Heisley Road,Mentor, Ohio
(Address of principal executive offices)44060-1834
(Zip Code)
440-354-2600(Registrant’s telephone number
including area code)
SECURITIES REGISTERED PURSUANT TO SECTION 12(B) OF THE ACT:Title of each class Name of Exchange on Which Registered
Common Shares, without par value New York Stock Exchange
SECURITIES REGISTERED PURSUANT TO SECTION 12(G) OF THE ACT:None
Indicate by check mark if the Registrant is a well-known seasoned issuer, as defined in Rule 405 of the Securities Act.
Yes È No ‘
Indicate by check mark if the Registrant is not required to file reports pursuant to Section 13 or Section 15(d) of the Act.
Yes ‘ No È
Indicate by check mark whether the Registrant (1) has filed all reports required to be filed by Section 13 or 15(d) of the
Securities Exchange Act of 1934 during the preceding 12 months (or for such shorter period that the Registrant was required to file such
reports), and (2) has been subject to such filing requirements for the past 90 days. Yes È No ‘
Indicate by check mark if disclosure of delinquent filers pursuant to Item 405 of Regulation S-K is not contained herein, and will
not be contained, to the best of the Registrant’s knowledge, in definitive proxy or information statements incorporated by reference in Part
III of this Form 10-K or any amendment to this Form 10-K. È
Indicate by check mark whether the registrant is a large accelerated filer, an accelerated filer, a non-accelerated filer, or a smaller
reporting company. See the definitions of “large accelerated filer,” “accelerated filer,” and “smaller reporting company” in Rule 12b-2 of the
Exchange Act.
Large Accelerated Filer È Accelerated Filer ‘
Non-Accelerated Filer ‘
(Do not check if a smaller reporting company)
Smaller Reporting Company ‘
Indicate by check mark whether the Registrant is a shell company (as defined in Rule 12b-2 of the Exchange Act).
Yes ‘ No È
The aggregate market value of the voting stock held by non-affiliates of the Registrant, computed by reference to the closing price
of such stock as of September 30, 2007: $1,727,445,834
The number of Common Shares outstanding as of May 14, 2008: 58,543,609DOCUMENTS INCORPORATED BY REFERENCE
Portions of the Proxy Statement for the 2008 Annual Meeting – Part III

Table of Contents
Page
Part I
Item 1 Business 3
Introduction 3
Information Related to Business Segments 4
Information with Respect to Our Business in General 6
Item 1A Risk Factors 10
Item 1B Unresolved Staff Comments 16
Item 2 Properties 16
Item 3 Legal Proceedings 18
Item 4 Submission of Matters to a Vote of Security Holders 19
Part II
Item 5 Market for Registrant’s Common Equity, Related Shareholder Matters and Issuer Purchases of Equity Securities 21
Item 6 Selected Financial Data 23
Item 7 Management’s Discussion and Analysis of Financial Condition and Results of Operations 24
Financial Measures 24
Revenues – Defined 25
General Company Overview and Outlook 26
Matters Affecting Comparability 27
Results of Operations 28
Liquidity and Capital Resources 44
Capital Expenditures 48
Contractual and Commercial Commitments 49
Critical Accounting Policies, Estimates, and Assumptions 50
Recently Issued Accounting Standards Impacting the Company 55
Inflation 55
Forward-Looking Statements 56
Item 7A Quantitative and Qualitative Disclosures About Market Risk 57
Interest Rate Risk 57
Foreign Currency Risk 57
Commodity Risk 57
Item 8 Financial Statements and Supplementary Data 58
Item 9 Changes in and Disagreements with Accountants on Accounting and Financial Disclosure 106
Item 9A Controls and Procedures 107
Item 9B Other Information 109
Part III
Item 10 Directors, Executive Officers and Corporate Governance 109
Item 11 Executive Compensation 109
Item 12 Security Ownership of Certain Beneficial Owners and Management and Related Stockholder Matters 109
Item 13 Certain Relationships and Related Transactions, and Director Independence 110
Item 14 Principal Accountant Fees and Services 110
Part IV
Item 15 Exhibits and Financial Statement Schedule 111
Signatures 114

PART IThroughout this Annual Report, STERIS Corporation and its subsidiaries together are called “STERIS,” “the Company,” “we,”
“us,” or “our,” unless otherwise noted. References in this Annual Report to a particular “year” or “year-end” mean our fiscal year, which
ends on March 31. For example, fiscal year 2008 ended on March 31, 2008.
ITEM 1. BUSINESSINTRODUCTION
STERIS Corporation is a leading provider of infection prevention and surgical products and services, focused primarily on the
critical markets of healthcare, pharmaceutical and research. Our mission is to provide a healthier today and a safer tomorrow through
knowledgeable people and innovative infection prevention, decontamination and health science technologies, products and services. We
offer our Customers a unique mix of capital products, such as: sterilizers and surgical tables; consumable products, such as detergents and
skin care products; and services, including equipment installation and maintenance; as well as the bulk sterilization of single-use medical
devices.
We were founded as Innovative Medical Technologies in Ohio in 1985, and renamed STERIS Corporation in 1987. However,
some of our businesses that have been acquired and integrated into STERIS, notably American Sterilizer Company, have much longer
operating histories. With global headquarters in Mentor, Ohio, we have approximately 5,300 employees worldwide and operate in more
than 60 countries. We have a direct sales force of approximately 500 and a service organization of over 1,000 who work diligently to
ensure that we are meeting the increasingly complex needs of our Customers.
As a result of organizational changes within the Life Sciences segment announced in fiscal 2008, we changed our methodology for
reporting segments. The Defense and Industrial business unit, which contains businesses in early development stages, is no longer a
component of the Life Sciences segment. “Corporate and other,” which is presented separately, contains the Defense and Industrial
business unit plus costs that are associated with being a publicly traded company and certain other corporate costs. These costs include
executive office costs, Board of Directors compensation, shareholder services and investor relations, external audit fees, and legacy pension
and post-retirement benefit costs from our former Erie manufacturing operation. Fiscal 2007 and fiscal 2006 amounts have been reclassified
to reflect the fiscal 2008 presentation.
We operate in three reportable business segments: Healthcare, Life Sciences, and STERIS Isomedix Services. Healthcare is the
largest piece of our business, contributing 70.1% of fiscal 2008 revenues and 83.7% of our fiscal 2008 operating income. In this segment, we
serve Customers anywhere surgical procedures take place by providing support directly to the operating room, as well as to the sterile
processing department where instruments are reprocessed in between surgeries. Our products and services enable Customers to reduce
costs and improve outcomes in these critical environments.
Our second largest segment, Life Sciences, contributed 18.1% of fiscal 2008 revenues and 9.3% of our fiscal 2008 operating
income. In this segment, we primarily serve pharmaceutical manufacturers and research organizations by providing decontamination and
sterilization technologies, products and services that help ensure the safety of the products they produce.
STERIS Isomedix Services (“Isomedix”) performs sterilization services on a contract basis through 21 facilities in North America,
where we sterilize single-use medical devices and other products in bulk prior to their delivery to the end user. This segment contributed
11.1% of fiscal 2008 revenues and 23.4% of our fiscal 2008 operating income.
Corporate and other contributed 0.7% of fiscal 2008 revenues and an operating loss of $20.4 million to our fiscal 2008 operating
income.
Many factors are driving an increased awareness of the importance of infection control throughout the world. In the United
States, hospitals in 25 states and in Washington, D.C. are now required to report infection rates, providing patients with information that
can help shape their decisions about where to receive care. On a more global basis, emerging threats such as Avian Bird Flu, Mad Cow
3

Disease, and the rise in drug-resistant strains of bacterial diseases have gained prominence in the news, raising awareness of the need for
enhanced safety on a worldwide basis. We are uniquely positioned to help address these concerns in traditional and non-traditional settings
with our combination of capital equipment, consumables and services.
INFORMATION RELATED TO BUSINESS SEGMENTS
Our chief operating decision maker is our President and Chief Executive Officer (“CEO”). The CEO is responsible for
performance assessment and resource allocation. The CEO regularly receives discrete financial information about each reportable segment.
The CEO uses this information to assess performance and allocate resources. The accounting policies of the reportable segments are the
same as those described in Note 1 to the Consolidated Financial Statements titled, “Nature of Operations and Summary of Significant
Accounting Policies,” of our Annual Report. Segment performance information for fiscal years 2008, 2007, and 2006 is presented in Note
12 to the Consolidated Financial Statements titled, “Business Segment Information” and in Item 7 titled, “Management’s Discussion and
Analysis of Financial Condition and Results of Operations (“MD&A”), of this Annual Report.
HEALTHCARE SEGMENT
Description of Business. Our Healthcare segment manufactures and sells infrastructure capital equipment, accessory, consumable, and
service solutions to healthcare providers, including acute care hospitals and surgery centers. These solutions aid our Customers in improving
the safety, quality, and productivity of their surgical, sterile processing, gastrointestinal, and emergency environments.
Products Offered. These infrastructure and information technology solutions include:
• Sterilizers, including low temperature liquid, vaporized hydrogen peroxide, and Ethylene Oxide (“EO”) technologies, as well as
steam sterilization, that allow Customers to meet rigorous sterility assurance standards and regulations and assist in the safe
and effective re-use of medical equipment and devices.
• Automated washer/disinfector systems that clean and disinfect a wide range of items from rolling instrument carts and other
large healthcare equipment to small surgical instruments.
• General and specialty surgical tables, surgical and examination lights, equipment management systems, operating room storage
cabinets, warming cabinets, scrub sinks, and other complementary products and accessories for use in hospitals and other
ambulatory surgery sites.
• Cleaning chemistries and sterility assurance products used in instrument cleaning and decontamination systems.
• Cleansing products, including hard surface disinfectants and skin care and hand hygiene solutions, for use by caregivers and
patients.
• Connectivity solutions such as operating room (“OR”) integration and instrument management that allow for high quality
transfer of information and images throughout the hospital and between hospitals throughout the world. These solutions aid
in improving the productivity and quality of Customers’ inpatient and outpatient surgical and centralize sterile assets.
Significant brand names for these products include STERIS SYSTEM 1®, Amsco®, Hamo™, Reliance®, Cmax®, Harmony™, Kindest Kare®,
Alcare®, Verify®, and Cal Stat®.
Services Offered. Our Healthcare segment provides various preventive maintenance programs and repair services to support the
effective operation of capital equipment over its lifetime. We offer these corrective and preventive service solutions to both Customers
who have internal clinical/biomedical engineering departments and Customers who rely on us to meet these needs. Field service personnel
install, maintain, upgrade, repair, and troubleshoot equipment throughout the world. We also offer comprehensive sterilization management
consulting services allowing healthcare facilities to achieve safety, quality, and productivity improvements in the end-to-end perioperative
loop that flows between and among surgical suites and the central sterile department. Additionally, our Healthcare segment provides other
4

support services such as construction and facility planning, engineering support, device testing, Customer education, hand hygiene process
excellence, asset management/planning, and the sale of replacement parts.
Customer Concentration. Our Healthcare segment manufactures and sells capital equipment, consumables, and services to Customers
in the United States and throughout the rest of the world. For the year ended March 31, 2008, the segment generated revenues in the
United States and internationally of $679.0 million and $208.1 million, respectively. For the year ended March 31, 2008, no Customer
represented more than 10% of the Healthcare segment’s total revenues and the loss of any single Customer is not expected to have a
material impact on the segment’s results of operations or cash flows.
Competition. Our Healthcare segment manufactures and sells capital equipment, consumables, and services to Customers in the United
States and throughout the rest of the world. We compete with a number of large companies that have significant product portfolios and
global reach, as well as a number of small companies with very limited product offerings and operations in one or a limited number of
countries. Significant competitors include Getinge and Johnson & Johnson. On a product basis, we also compete with 3M, Belimed,
Berchtold, Cantel Medical, Cardinal, Ecolab, Hill-Rom, Kimberly-Clark, Skytron, and Stryker.
LIFE SCIENCES SEGMENT
Description of Business. Our Life Sciences segment manufactures and sells engineered capital products, formulated cleaning chemistries,
and service solutions to pharmaceutical companies and private and public research facilities around the globe.
Products Offered. Our Life Sciences segment manufactures and sells a broad range of engineered capital products and formulated
cleaning chemistries including:
• Sterilizers used in the manufacture of pharmaceuticals and biopharmaceuticals as well as equipment and instruments used in
research studies, mitigating the risk of contamination.
• Washer/disinfectors that decontaminate various large and small materials and components used in pharmaceutical and
industrial manufacturing processes, such as glassware, vessels, equipment parts, drums, and hoses.
• High-purity water equipment, which generates water for injection and pure steam.
• Vaporized Hydrogen Peroxide (“VHP”®) generators used to decontaminate many high value spaces, from small isolators to
large pharmaceutical processing and laboratory animal rooms. This effective technology has recently been extended to
applications in the food and beverage industries.
• Consumables and supplies that are used to prevent the spread of infectious diseases and to monitor sterilization and
decontamination processes, including products used to clean instruments, decontaminate systems, and disinfect hard surfaces.
We also manufacture and sell skin care and hand hygiene solutions for use in high risk and routine applications.
Significant brand names for these products include Amsco®, Hamo®, Reliance®, Finn-Aqua®,, Kindest Kare®, Alcare®, Verify®, and Cal Stat®.
Services Offered. Our Life Sciences segment offers various preventive maintenance programs and repair services to support the effective
operation of capital equipment over its lifetime. Field service personnel install, maintain, upgrade, repair, and troubleshoot equipment
throughout the world. We also offer consulting services and technical support to architecture and engineering firms and laboratory planners.
Our services deliver expertise in decontamination and infection control technologies and processes to end users. Our service personnel
also provide higher-end validation services in support of our pharmaceutical Customers subject to pharmaceutical manufacturing
requirements.
Customer Concentration. Our Life Sciences segment manufactures and sells capital equipment, consumables, and services to
Customers in the United States and throughout the rest of the world. For the year ended March 31, 2008, the segment generated revenues
in the United States and internationally of $150.4 million and $77.9 million, respectively. For the year ended March 31, 2008, no Customer
5

represented more than 10% of the Life Sciences segment’s total revenues and the loss of any single Customer is not expected to have a
material impact on the segment’s results of operations or cash flows.
Competition. Our Life Sciences segment operates in highly regulated environments where the most intense competition results from
technological innovations, product performance, convenience and ease of use, and overall cost-effectiveness. In recent years, our
pharmaceutical Customer base has also undergone consolidation and reduced capital spending, resulting in more intense competition. We
compete for pharmaceutical, research and industrial Customers with a number of large companies that have significant product portfolios
and global reach, as well as a number of small companies with very limited product offerings and operations in one or a limited number of
countries. Competitors in the pharmaceutical market include Belimed, Ecolab, Fedegari, Getinge, MECO, Stilmas, and Techniplast.
STERIS ISOMEDIX SERVICES SEGMENT
Description of Business. Our STERIS Isomedix Services segment operates through a network of 21 facilities located in North America.
We sell a comprehensive array of contract sterilization services using Gamma Irradiation (“Gamma”), EO technologies, and to a lesser
extent, Electron Beam Irradiation (“E-Beam”). We provide sterilization, microbial reduction, and materials modification services to
companies that supply products to the healthcare, industrial, and consumer product industries.
Services Offered. We use Gamma, E-Beam, and EO technologies to sterilize a wide range of products. Gamma, using cobalt-60 isotope,
and E-Beam, using accelerated electrons, are irradiation processes. EO uses a gaseous process to sterilize medical products. Greater than 90
percent of the industrial contract sterilization market uses Gamma or EO, with the remainder using E-Beam technology. Our locations are in
major population centers and core distribution corridors throughout North America, primarily in the Northeast, Midwest, Southwest, and
southern California. We adapt to increasing imports and changes in manufacturing points-of-origin by monitoring trends in supply chain
management. Demographics partially drives this segment’s growth. The aging population and rising life expectancy increase the demand for
medical procedures, which increases the consumption of single use medical devices and surgical kits. Our technical services group supports
Customers in all phases of the sterilization design process, including product development, materials testing, and sterility validation.
Customer Concentration. Our STERIS Isomedix Services segment operates in North America. For the year ended March 31, 2008, the
segment generated revenues in the United States and Canada of $133.3 million and $7.3 million, respectively. The segment’s services are
offered to Customers throughout the footprint of our network. For the year ended March 31, 2008, no Customer represented more than
10% of the segment’s revenues. Because of a largely fixed cost structure, the loss of a single Customer could have a material impact on the
segment’s results of operations or cash flows but would not have a material impact on STERIS.
Competition. STERIS Isomedix Services operates in a highly regulated industry and competes in North America with Sterigenics
International, Inc., other smaller contract sterilization companies and manufacturers that sterilize products in-house.
INFORMATION WITH RESPECT TO OUR BUSINESS IN GENERAL
Recent Events
Restructuring – Fiscal 2008 Expense Reduction Program. During the fourth quarter of fiscal 2008, we adopted a restructuring plan
primarily focused on our North American operations (the “Fiscal 2008 Restructuring Plan”). As part of this plan, we will close two sales
offices and rationalize certain products. We also took steps to reduce the workforce in certain support functions. Across all of our reporting
segments approximately 90 employees, primarily located in North America, have been directly impacted. These restructuring actions are
designed to enhance profitability and improve efficiency by reducing ongoing operating costs.
In fiscal 2008, we recorded pre-tax expenses totaling $15.8 million related to these actions, of which $11.7 million was recorded
as restructuring expenses and $4.1 million was recorded in cost of revenues. We are continuing to evaluate all of our operations for
opportunities to enhance performance, but have not committed to any additional specific actions.
6

Restructuring – European Restructuring Plan. During the third quarter of fiscal 2007, we adopted a restructuring plan related to certain
of our European operations (the “European Restructuring Plan”). As part of this plan, we closed two sales offices. We also took steps to
reduce the workforce in certain European support functions. These actions are intended to improve our cost structure in Europe.
Approximately 40 employees were directly impacted in various European locations. During fiscal 2008 and fiscal 2007, we recorded pre-tax
expenses of $0.1 million and $1.7 million, respectively, related to the European Restructuring Plan.
Restructuring – Fiscal 2006 Restructuring Plan. During fiscal 2008, we completed the transfer of the manufacturing portion of our Erie,
Pennsylvania operations to Monterrey, Mexico. The objective of this plan, as announced in January 2006, was to reduce production costs
and improve our competitive position. At the same time, we also announced plans for other restructuring actions designed to reduce
operating costs within the ongoing operations of both the Healthcare and Life Sciences segments. These plans are referred to together as
the “Fiscal 2006 Restructuring Plan.”
During fiscal 2008, fiscal 2007 and fiscal 2006, we incurred pre-tax restructuring expenses of $3.6 million, $4.9 million and $25.3
million, respectively, primarily for non-cash expenses related to asset write-downs, accelerated recognition of pension and retiree medical
benefits, and severance and termination benefits related to the transfer of our Erie, Pennsylvania manufacturing operations to Monterrey,
Mexico and other restructuring actions.
Collective bargaining agreements with certain employees located at the former Erie, Pennsylvania manufacturing operations
terminated in July 2007 and January 2008.
Dispositions. On October 31, 2005, we sold our lyophilizer (freeze dryer) product line to GEA Group of Germany for 20.8 million euros
(approximately $25.2 million). As a result of the sale, we recorded an after-tax gain of approximately $7.3 million ($1.1 million recorded in
fiscal 2007 and $6.2 million recorded in fiscal 2006). The sale of this product line was a strategic step designed to create greater focus and
further development of core sterilization, washing, and decontamination product offerings to the pharmaceutical, biopharmaceutical,
governmental, and research markets.
Sources and Availability of Raw Materials. We purchase raw materials, sub-assemblies, components, and other supplies needed in
our operations from numerous suppliers in the United States and internationally. The principal raw materials used in our operations include
stainless steel, organic chemicals, and plastic components. These raw materials are available from several suppliers and in enough quantities
that we do not expect any significant sourcing problems in fiscal 2009. We have longer-term supply contracts for certain raw materials, such
as cobalt-60 isotope used by the STERIS Isomedix Services segment, for which there are few suppliers.
We have recently experienced higher prices for raw materials such as stainless steel and other metals, and chemicals, which are
important to our operations. While cost and availability are unpredictable, we have not experienced any difficulty, and do not expect
significant difficulty, in obtaining the raw materials, sub-assemblies, components, or other supplies we need for our operations.
Intellectual Property. We protect our technology and products by, among other means, obtaining United States and foreign patents.
There can be no assurance, however, that any patent will provide adequate protection for the technology, system, product, service, or
process it covers. In addition, the process of obtaining and protecting patents can be long and expensive. We also rely upon trade secrets,
technical know-how, and continuing technological innovation to develop and maintain our competitive position.
As of March 31, 2008, we held 295 United States patents and 907 foreign patents and had 102 United States patents and 502
foreign patents pending. Patents for individual products extend for varying periods according to the date of filing or grant and legal term of
patents in various countries where a patent is obtained. The actual protection a patent provides, which can vary from country to country,
depends upon the type of patent, the scope of its coverage, and the availability of legal remedies in each country.
Our products are sold around the world under various brand names and trademarks. We consider our brand names and
trademarks to be valuable in the marketing of our products. As of March 31, 2008, we had a total of 854 trademark registrations in the
United States and in various foreign countries.
7

Research and Development. Research and development is an important factor in our long-term strategy. For the years ended
March 31, 2008, 2007, and 2006, research and development expenses were $36.9 million, $33.6 million, and $33.6 million, respectively. We
incurred these expenses primarily for the research and development of commercial products.
During fiscal 2008, we announced the launch of our newest surgical solution – the Harmony® LED Lighting and Visualization
System, which brings surgical lighting, high definition images and surgeon comfort to a new level. The Harmony® LED Lighting and
Visualization System is future-ready, designed to accommodate all the most commonly used current integration vendors, as well as
anticipated future signal media. In addition, the LED light source will need to be replaced far less often (about every ten years) and will use
approximately one-third less energy than incandescent bulbs. Also during fiscal 2008, we announced that the Prolystica Enzymatic Presoak
and Cleaner was released for sale in North America and Europe. This new enzymatic cleaner is designed for cleaning surgical instruments
and other medical devices such as endoscopes. It is intended for use in both manual and automated cleaning applications, and was
specifically designed to optimize the cleaning efficacy of our STERIS washers/disinfectors. In addition, we announced the first orders for our
V-PRO™1 low temperature sterilizer and introduced Class 6 indicators.
Quality Assurance. We manufacture, assemble, and package products in the United States and throughout the world. Each of our
production facilities are dedicated to particular processes and products. Our success depends upon Customer confidence in the quality of
our production process and the integrity of the data that supports our product safety and effectiveness. We have implemented quality
assurance procedures to ensure the quality and integrity of scientific information and production processes. All of our manufacturing and
contract sterilization facilities throughout the world are ISO9001:2000 or ISO13485:2003 certified.
Government Regulation. Our business is subject to various degrees of governmental regulation in the countries in which we operate. In
the United States, the United States Food and Drug Administration (“FDA”), the United States Environmental Protection Agency (“EPA”),
the United States Nuclear Regulatory Commission (“NRC”), and other governmental authorities regulate the development, manufacture,
sale, and distribution of our products and services. Our international operations also are subject to a significant amount of government
regulation and country-specific rules and regulations. Government regulations include detailed inspection of, and controls over, research and
development, clinical investigations, product approvals and manufacturing, marketing and promotion, sampling, distribution, record-keeping,
storage, and disposal practices.
Compliance with applicable regulations is a significant expense for us. Past, current, or future regulations, their interpretation, or
their application could have a material adverse impact on our operations. Also, additional governmental regulation may be passed that could
prevent, delay, revoke, or result in the rejection of regulatory clearance of our products. We cannot predict the effect on our operations
resulting from current or future governmental regulation or the interpretation or application of these regulations.
If we fail to comply with any applicable regulatory requirements, sanctions could be imposed on us. For more information about
the risks we face regarding regulatory requirements, see Part I, Item 1A of this Annual Report titled, “Risk Factors, We are subject to
extensive regulatory requirements . . . .”
We have received warning letters, paid civil penalties, conducted product recalls, and been subject to other regulatory sanctions.
For example, we received a warning letter from the FDA on May 16, 2008 concerning our STERIS SYSTEM 1® sterile processing system.
See Part I, Item 1A of this Annual Report titled, “Risk Factors, We may be adversely affected by product liability claims or other legal or
regulatory compliance matters.” See also Part I, Item 3 “Legal Proceedings” for further information on the May 16, 2008 warning letter and
other issues and their potential impact. We believe that we are currently compliant in all material respects with applicable regulatory
requirements. However, we cannot assure you that future or current regulatory, governmental, or private action will not have a material
adverse affect on STERIS or its performance, results, or financial condition.
Environmental Matters. We are subject to various laws and governmental regulations concerning environmental matters and employee
safety and health in the United States and in other countries. We have made, and continue to make, significant investments to comply with
these laws and regulations. We cannot predict the future capital expenditures or operating costs required to comply with environmental
laws and regulations. We believe that we are currently compliant with applicable environmental, health, and safety requirements. However,
8

we cannot assure you that future or current regulatory, governmental, or private action will not have a material adverse affect on STERIS’s
performance, results, or financial condition. You should also read Part I, Item 3, “Legal Proceedings” for further information.
In the future, if a loss contingency related to environmental matters or conditional asset retirement obligations is significantly
greater than the current estimated amount, we would record a liability for the obligation and it may result in a material impact on net
income for the annual or interim period during which the liability is recorded. The investigation and remediation of environmental
obligations generally occur over an extended period of time, and therefore we do not believe that liabilities for these events would have a
material adverse affect on our financial condition, liquidity, or cash flow. However, we cannot assure you that such liabilities would not have
a material adverse affect on STERIS’s performance, results, or financial condition.
Competition. The markets in which we operate are highly competitive and generally highly regulated. Competition is intense in all of our
business segments and includes many large and small competitors. Brand, design, quality, safety, ease of use, serviceability, price, product
features, warranty, delivery, service, and technical support are important competitive factors to us. We expect to face increased competition
in the future as new infection prevention, sterile processing, contamination control, and surgical support products and services enter the
market. We believe many organizations are working with a variety of technologies and sterilizing agents. Also, a number of companies have
developed disposable medical instruments and other devices designed to address the risk of contamination.
We believe that our long-term competitive position depends on our success in discovering, developing, and marketing innovative,
cost-effective products and services. We devote significant resources to research and development efforts and we believe STERIS is
positioned as a global competitor in the search for technological innovations. In addition to research and development, we invest in quality
control, Customer programs, distribution systems, technical services, and other information services.
We cannot assure you that new products or services we provide or develop in the future will be more commercially successful
than those provided or developed by our competitors. In addition, some of our existing or potential competitors may have greater
resources than us. Therefore, a competitor may succeed in developing and commercializing products more rapidly than we do.
Competition, as it relates to our business segments and product categories, is discussed in more detail in the section above titled,
“Information Related to Business Segments.”
Employees. As of March 31, 2008, we had approximately 5,300 employees throughout the world. We believe we have good relations
with our employees.
Methods of Distribution. As of March 31, 2008, we employed over 1,100 direct field sales and service representatives within the United
States and approximately 400 in international locations. Sales and service activities are supported by a staff of regionally based clinical
specialists, system planners, corporate account managers, and in-house Customer service and field support departments. We also contract
with distributors in select markets.
Customer training is important to our business. We provide a variety of courses at Customer locations, at our training and
education centers throughout the world, and over the internet. Our training programs help Customers understand the science, technology,
and operation of our products. Many of our operator training programs are approved by professional certifying organizations and offer
continuing education credits to eligible course participants.
Seasonality. Our financial results have been, from time to time, subject to seasonal patterns. As a result of Customer buying patterns and
other factors, sales of certain product lines have historically been weighted toward the latter part of each fiscal year. We cannot assure you
that these trends will continue.
International Operations. Our objective is to expand internationally, as we currently only serve a small portion of the world that could
benefit from our products. Through our subsidiaries, we operate in various international locations within the same business segments as in
the United States. For the year ended March 31, 2008, international revenues were $294.1 million, or 23.2%, of our total revenues and
international cost of revenues were 33.7% of our total cost of revenues. Revenues from Europe, Canada, and other international locations
were 55.3%, 23.0%, and 21.7%, respectively, of our total international revenues for the year ended March 31, 2008.
9

You should also read Note 12 to our Consolidated Financial Statements titled, “Business Segment Information,” and Item 7,
“MD&A” for a geographic presentation of our revenues for the three years ended March 31, 2008.
We conduct manufacturing in the United States, Canada, Mexico, and various European countries. There are, in varying degrees,
a number of inherent risks to our international operations. We describe these risks in Part I, Item 1A of this Annual Report titled, “Risk
Factors, We conduct manufacturing, sales, and distribution operations on a worldwide basis. . . . .”
Fluctuations in the exchange rate of the U.S. dollar relative to the currencies of foreign countries in which we operate can also
increase or decrease our reported net assets and results of operations. During fiscal 2008, revenues were favorably impacted by $18.5
million, or 1.5%, and income before taxes was unfavorably impacted by $4.5 million, or 3.5%, as a result of foreign currency movements
relative to the U.S. dollar. We cannot predict future changes in foreign currency exchange rates or the effect they will have on our
operations.
Backlog. We define backlog as the amount of unfilled capital equipment purchase orders at a point in time. At March 31, 2008, we had a
backlog of $142.2 million. Of this amount, $98.0 million and $44.2 million related to our Healthcare and Life Sciences segments,
respectively. At March 31, 2007, we had backlog orders of $110.2 million. Of this amount $63.8 million and $46.4 million related to our
Healthcare and Life Sciences segments, respectively. A significant portion of the backlog orders in both years were expected to ship in the
next fiscal year.
Availability of Securities and Exchange Commission Filings. We make available free of charge on or through our website our
Annual Reports on Form 10-K, Quarterly Reports on Form 10-Q, and Current Reports on Form 8-K, and amendments to these reports, as
soon as reasonably practicable after we electronically file such material with, or furnish such material to the Securities and Exchange
Commission (“SEC”). You may access these documents on the Investor Relations page of our website at http://www.steris-ir.com. You may
also obtain copies of these documents by visiting the SEC’s Public Reference Room at 100 F Street, NE, Washington, D.C. 20549 or by
accessing the SEC’s website at http://www.sec.gov. You may obtain information on the Public Reference Room by calling the SEC at
1-800-SEC-0330.
We also make available free of charge on our website our Corporate Governance Guidelines, our Director Code of Ethics, and
our Code of Business Conduct, as well as the Charters of the Audit and Financial Policy Committee, the Compensation and Corporate
Governance Committee, and the Compliance Committee of the Company’s Board of Directors.
ITEM 1A. RISK FACTORS
This item describes certain risk factors that could affect our business, financial condition and results of operations. You should consider
these risk factors when evaluating the forward-looking statements contained in this Annual Report on Form 10-K, because our actual results and
financial condition might differ materially from those projected in the forward-looking statements should these risks occur. We face other risks
besides those highlighted below. These other risks include additional uncertainties not presently known to us or that we currently believe are
immaterial, but may ultimately have a significant impact. Should any of the risks described below actually occur, our business, financial condition,
performance, value, or results of operations could be negatively affected.
Our businesses are highly competitive, and if we fail to compete successfully, our revenues and results of operations may be hurt.
We operate in a highly competitive global environment. Our businesses compete with other broad line manufacturers, as well as
many smaller businesses specializing in particular products or services, primarily on the basis of brand, design, quality, safety, ease of use,
serviceability, price, product features, warranty, delivery, service, and technical support. We face increased competition from new infection
prevention, sterile processing, contamination control, and surgical support, cleaning consumables, contract sterilization, and other products
and services entering the market. Competitors and potential competitors also are attempting to develop alternate technologies and
sterilizing agents, as well as disposable medical instruments and other devices designed to address the risk of contamination. If our products,
services, support, distribution and/or cost structure do not enable us to compete successfully, our business performance, value, financial
condition, and results of operations may be adversely affected.
10

Our success depends, in part, on our ability to design, manufacture, distribute and achieve market acceptance of new products with higher
functionality and lower costs.
Many of our Customers operate businesses characterized by technological change, product innovation and evolving industry
standards. Price is a key consideration in their purchasing decisions. To successfully compete, we must continue to design, develop, and
improve innovative products. We also must achieve market acceptance of and effectively distribute those products, and reduce production
costs. Our business, performance, value, financial condition, and results of operations might be adversely affected if our competitors’
product development capabilities become more effective, if they introduce new or improved products that displace our products or gain
market acceptance before ours, or if they begin to produce and sell products at lower prices.
We are subject to extensive regulatory requirements and must receive and maintain regulatory clearance or approval for many products and
operations. Failure to receive or maintain, or delays in receiving, clearance or approvals may hurt our revenues, profitability, financial condition or
value.
Our operations are subject to extensive regulation in both the United States and in other countries where we do business.
Government regulation applies to nearly all aspects of testing, manufacturing, safety, labeling, storing, recordkeeping, reporting, promoting,
distributing, and importing or exporting of medical devices, products, and services. In general, unless an exemption applies, a sterilization,
decontamination or medical device or other product must receive regulatory approval or clearance before it can be marketed or sold.
Modifications to existing products or the marketing of new uses for existing products also may require regulatory approvals, approval
supplements or clearances. If we are unable to obtain any required approvals, approval supplements or clearances for any modification to a
previously cleared or approved device, we may be required to cease manufacturing or recall such modified device until such time as
appropriate clearance or approval is obtained.
Regulatory agencies may refuse to grant approval or clearance, or review and disagree with our decision that regulatory approval
is not required. Regulatory submissions may require the provision of additional clinical or pre-clinical data and may be time consuming and
costly. Regulatory agencies may also change policies, adopt additional regulations, or revise existing regulations, each of which could prevent
or delay approval or clearance of devices, or could impact our ability to market a previously cleared or approved device. Refer also to the
“Risk Factor” below titled, “We may be adversely affected by product liability claims or other legal or regulatory compliance matters,” and
to Part I, Item 3, “Legal Proceedings” for further information.
Our failure to comply with the regulatory requirements of the FDA or other applicable regulatory requirements in the United
States or elsewhere might subject us to administratively or judicially imposed sanctions. These sanctions include warning letters, fines, civil
penalties, criminal penalties, injunctions, debarment, product seizure or detention, product recalls and total or partial suspension of
production. In many foreign countries, sales of our products are subject to extensive regulations that are comparable to those of the FDA.
In Europe, our products are regulated primarily by country and community regulations of those countries within the European Economic
Area and must conform to the requirements of those authorities.
The failure to receive, or delays in the receipt of, relevant United States or international qualifications could have a material
adverse affect on our business, performance, value, financial condition and results of operations.
Consolidations among our health care and pharmaceutical Customers may result in a loss of Customers or more significant pricing pressures.
A number of our Customers have consolidated. These consolidations are due in part to health care cost reduction measures
initiated by competitive pressures as well as legislators, regulators and third-party payors. In an effort to attract Customers, some of our
competitors have also reduced production costs and lowered prices. This has resulted in greater pricing pressures on us and in some cases
loss of Customers. Additional consolidations could result in a loss of Customers or more significant pricing pressures.
If our cost reduction and restructuring efforts are ineffective, our revenues and profitability may be hurt.
We have undertaken various cost reduction and restructuring activities, including the restructuring activities announced in January
2006 and, in particular, the transfer of our Erie, Pennsylvania manufacturing operations to Mexico. More recently, on March 31, 2008 we
11

announced cost reduction activities intended to generate annualized operating expense savings of approximately $30 million through direct
and indirect overhead expense reductions and other savings. These efforts may not produce the full efficiencies and cost reduction benefits
we expect or efficiencies and benefits might be delayed. Implementation costs also might exceed expectations and further cost reduction
measures might become necessary, resulting in additional future charges. If these cost reduction and restructuring efforts are not properly
implemented or are unsuccessful, we might experience business disruptions or our business otherwise might be adversely affected.
Decreased availability or increased costs of raw materials or energy supplies or other supplies might increase our production costs or limit our
production capabilities.
We purchase raw materials, fabricated and other components and energy supplies from a variety of suppliers. Key materials
include stainless steel, organic chemicals, fuel, and plastic components. The availability and prices of raw materials and energy supplies are
subject to volatility and are influenced by worldwide economic conditions, speculative action, world supply and demand balances, inventory
levels, availability of substitute materials, currency exchange rates, anticipated or perceived shortages, and other factors. In some situations,
we may be able to limit price increases or assure availability through supply agreements. Otherwise, raw material prices and availability are
subject to numerous factors outside of our control, including those described above. Increases in prices or decreases in availability of raw
materials and oil and gas might impair our procurement of necessary materials or our product production, or might increase production
costs. In addition, energy costs impact our transportation and distribution and other supply and sales costs. Also, a number of our key
components are single-sourced. Shortages in supply or increases in the price of raw materials, components and energy supplies may
adversely impact our business, performance, value, financial condition, and results of operations to the extent our increased costs can not
be passed on to our Customers.
Our operations, and those of our suppliers, are subject to a variety of business continuity hazards and risks, any of which could interrupt
production or operations or otherwise adversely affect our performance, results, or value.
Business continuity hazards and other risks include:
• explosions, fires, inclement weather, and other disasters;
• utility or other mechanical failures;
• unscheduled downtime;
• labor difficulties;
• inability to obtain or maintain any required licenses or permits;
• disruption of communications;
• data security, preservation and redundancy disruptions;
• inability to hire or retain key management or employees; and
• disruption of supply or distribution.
The occurrence of any of these events might disrupt or shut down operations, or otherwise adversely impact the production or
profitability of a particular facility, or our operations as a whole. Certain of the described casualties also might cause personal injury and loss
of life, or severe damage to or destruction of property and equipment, and for casualties occurring at our facilities result in liability claims
against us. Although we maintain property and casualty insurance and liability and similar insurance of the types and in the amounts that we
believe are customary for our industries, our insurance coverages have limits and we are not fully insured against all potential hazards and
risks incident to our business. Should any of the hazards or risks occur, our business, performance, value, financial condition, and results of
operations might be adversely affected, both during and after the event.
12

We conduct manufacturing, sales and distribution operations on a worldwide basis and are subject to a variety of risks associated with doing
business outside the United States.
We maintain significant international operations, including operations in Canada, Europe, Asia and Latin America. As a result, we
are subject to a number of risks and complications inherent in international manufacturing, sales, services, and other operations. These
include:
• risks associated with foreign currency exchange rate fluctuations;
• difficulties in enforcing agreements and collecting receivables through some foreign legal systems;
• foreign Customers with longer payment cycles than Customers in the United States;
• tax rates in certain foreign countries that exceed those in the United States, and foreign earnings subject to withholding
requirements;
• tax laws that restrict our ability to use tax credits, offset gains, or repatriate funds;
• tariffs, exchange controls or other trade restrictions including transfer pricing restrictions when products produced in one
country are sold to an affiliated entity in another country;
• general economic and political conditions in countries where we operate or where end users of our products are situated;
• difficulties associated with managing a large organization spread throughout various countries;
• difficulties in enforcing intellectual property rights or weaker intellectual property right protections in some countries; and
• difficulties associated with compliance with a variety of laws and regulations governing international trade.
Implementation and achievement of international growth objectives also may be impeded by political, social, and economic
uncertainties or unrest in countries in which we conduct operations or market or distribute our products. In addition, compliance with
multiple, and potentially conflicting, international laws and regulations, import and export limitations, and exchange controls may be
burdensome or expensive or otherwise limit our growth opportunities.
These complications and occurrences of these risks may adversely affect our business, performance, value, financial condition, and
results of operations.
Changes in government and other third-party payor reimbursement levels to health care providers or failure to meet health care reimbursement
requirements might negatively impact our business.
We sell many of our products to hospitals and other health care providers. Many of these providers receive reimbursement for
services from third-party payors, such as government programs, including Medicare and Medicaid, private insurance plans, and managed care
programs. In the United States, many of these programs set maximum reimbursement levels for these health care services and can have
complex reimbursement requirements. Outside the United States, reimbursement systems vary significantly by country. However,
government-managed health care systems control reimbursement for health care services in many foreign countries. In these countries, like
the United States, public budgetary constraints may significantly impact the ability of hospitals and other providers supported by such
systems to purchase our products. If the third-party payors deny coverage, reduce their current levels of reimbursement for health care
services, or if our costs increase more rapidly than reimbursement level increases or we do not satisfy the standards or requirements for
reimbursement, our revenues or profitability may suffer and our business, performance, value, financial condition and results of operations
may be adversely affected.
Our products are subject to recalls, even after receiving United States or foreign regulatory clearance or approval.
Ongoing medical device reporting regulations require that we report to appropriate governmental authorities in the United States
and/or other countries when our products cause or contribute to a death or serious injury or malfunction in a way that would be
13

reasonably likely to contribute to a death or serious injury if the malfunction were to recur. Governmental authorities can require product
recalls for material deficiencies or defects in product design or manufacturing, including labeling, or component failure. For the same reasons,
we may voluntarily elect to recall a product. Any recall would divert managerial and financial resources and might harm our reputation
among our Customers and other health care professionals who use or recommend the products. Product recalls, suspensions, re-labeling,
or other change might have a material adverse affect on our business, performance, value, financial condition, or results of operations.
Our business and financial condition could be adversely affected by difficulties in acquiring or maintaining a proprietary intellectual ownership
position.
To maintain our competitive position, we need to obtain patent or other proprietary rights for new and improved products and
to maintain and enforce our existing patents and other proprietary rights. We typically apply for patents in the United States and in strategic
foreign countries. We may also acquire patents through acquisitions. A 2007 United States Supreme Court decision increases the difficulty
of obtaining patent protection in the United States. The actual scope and impact of the decision on our existing patent rights or patent
applications and those of others will not be known until other court rulings interpret and apply the decision.
We rely on a combination of patents, trade secrets, know-how and confidentiality agreements to protect the proprietary aspects
of our technology. These measures afford only limited protection, and competitors may gain access to our intellectual property and
proprietary information. Litigation may be necessary to enforce or defend our intellectual property rights, to protect our trade secrets and
to determine the validity and scope of our proprietary rights. Litigation may also be brought against us claiming that we have violated the
intellectual property rights of others. Litigation may be costly and may divert management’s attention from other matters. Additionally, in
some foreign countries with weaker intellectual property rights, it may be difficult to maintain and enforce patents and other proprietary
rights or defend against claims of infringement. If we are unable to obtain necessary patents, our patents and other proprietary rights are
successfully challenged or competitors independently develop substantially equivalent information and technology or otherwise gain access
to our proprietary technology, our business, performance, value, financial condition, and results of operations may be adversely affected.
We may be adversely affected by product liability claims or other legal actions or regulatory or compliance matters.
We face an inherent business risk of exposure to product liability claims and other legal and regulatory actions. A significant
increase in the number, severity, amount or scope of these claims and actions may result in substantial costs and harm our reputation or
otherwise adversely affect product sales and our business. Product liability claims and other legal and regulatory actions may also distract
management from other business responsibilities.
We are also subject to a variety of other types of claims, proceedings, investigations and litigation initiated by government
agencies or third parties and other potential risks and liabilities. These include compliance matters, product regulation and safety, taxes,
employee benefit plans, employment discrimination, health and safety, environmental, antitrust, customs, import/export, government
contract compliance, financial controls or reporting, intellectual property allegations of misrepresentation, false claims or false statements, or
other similar or different matters. Any such claims, proceedings, investigations or litigation, regardless of the merits, might result in substantial
costs restrictions on product use or sales, or otherwise injure our business.
Administratively or judicially imposed sanctions might include warning letters, fines, civil penalties, criminal penalties, loss of tax
benefits, injunctions, product seizure, recalls, re-labeling, detention, and/or debarment. We also might be required to take actions such as
payment of substantial amounts, or revision of financial statements, or to take the following types of actions with respect to our products,
services, or business:
• redesign, re-label, or recall products;
• cease manufacturing and selling products;
• seizure of product inventory;
• court injunction against further marketing and sale of products;
14
• consent decree, which could result in further regulatory constraints;
• dedication of significant internal and external resources to respond to and comply with legal and regulatory issues and
constraints;
• claims, litigation and other proceedings brought by customers, users, governmental agencies and others;
• disruption of product improvements and product launches;
• discontinuation of certain product lines; or
• other restrictions or limitations on product sales, use or operation, or other activities or business practices.
Some product replacements or substitutions may not be possible or may be prohibitively costly or time consuming. As an example of a
type of matter described above is the warning letter we received from the FDA on May 16, 2008 regarding our STERIS SYSTEM 1® sterile
processing system. In summary, that letter outlines the FDA’s assertion that significant changes or modifications have been made in the
design, components, method of manufacture or intended use of the system, beyond the FDA’s 1988 clearance of the device, such that the
FDA asserts a new premarket notification submission should have been made. (For more information regarding this warning letter, see
“Legal Proceedings” below.)
The results of legal, regulatory, or compliance claims, proceedings, investigations or litigation are difficult to predict. An
unfavorable resolution or outcome of the recent FDA warning letter regarding our STERIS SYSTEM 1® sterile processing system or any
other legal, regulatory or compliance claim or matter regarding any other significant product, service, or obligation of ours, could materially
and adversely affect our business, performance, value, financial condition, and results of operations.
We maintain product liability and other insurance with coverages believed to be adequate. However, product liability or other
claims may exceed insurance coverage limits, fines, penalties and regulatory sanctions may not be covered by insurance, or insurance may
not continue to be available or available on commercially reasonable terms. Additionally, our insurers might deny claim coverage for valid or
other reasons or may become insolvent.
We engage in acquisitions and affiliations, divestitures, and other business arrangements. Our growth may be adversely affected if we are unable
to successfully identify, price and integrate strategic business candidates or otherwise optimize our business portfolio.
Our success depends, in part, on strategic acquisitions and joint ventures, which are intended to complement or expand our
businesses, divestiture of non-strategic businesses, and other actions to optimize our portfolio of businesses. This strategy depends upon
our ability to identify, appropriately price, and complete these types of business development transactions or arrangements and to obtain
any necessary financing. Our success will also depend on our ability to integrate the businesses acquired or to develop satisfactory working
arrangements with our strategic partners in joint ventures or other affiliations, or to divest or realign non-strategic businesses. Competition
for strategic business candidates may result in increases in costs and price for acquisition candidates, and market valuation issues may reduce
the value available for non-strategic businesses. These types of transactions are also subject to a number of risks and uncertainties, including:
• delays in realizing the benefits of the transactions;
• diversion of management’s time and attention from other business concerns;
• difficulties in retaining key employees, Customers or suppliers of the acquired or divested businesses;
• difficulties in maintaining uniform standards, controls, procedures and policies, or other integration or divestiture difficulties;
• adverse effects on existing business relationships with suppliers or Customers;
• other events contributing to difficulties in generating future cash flows;
• risks associated with the assumption of contingent or undisclosed liabilities of acquisition targets or retention of liabilities
for divested businesses; and
• difficulties in obtaining or satisfying financing.
15

If we are unable to realize the anticipated operating efficiencies and synergies or other expected transaction benefits, our results
of operations might be adversely impacted by the amortization of transaction expenses and acquired assets or by other corrective actions
that may be necessary to limit resulting problems.
Our business and results of operations may be adversely affected if we are unable to recruit and retain qualified management.
Our continued success depends, in large part, on our ability to hire and retain highly qualified people and if we are unable to do
so, our business and operations may be impaired or disrupted. Competition for highly qualified people is intense and there is no assurance
that we will be successful in attracting or retaining replacements to fill vacant positions, successors to fill retirements or employees moving
to new positions, or other highly qualified personnel.
ITEM 1B. UNRESOLVED STAFF COMMENTS
None.
ITEM 2. PROPERTIES
The following table sets forth the principal plants and other materially important properties of the Company and its subsidiaries as
of March 31, 2008. The Company believes that its facilities are adequate for operations and are maintained in good condition. The
Company is confident that, if needed, it will be able to acquire additional facilities at commercially reasonable rates.
In the table below, “Contract Sterilization” refers to locations of the STERIS Isomedix Services segment and “Sterilization
Services” refers to locations of the Healthcare segment. “Manufacturing,” “Warehousing,” “Operations” or “Sales Offices” refer to locations
serving both the Healthcare and Life Sciences segments.
U.S. Locations (including Puerto Rico)Owned Locations Leased Locations
Montgomery, AL Manufacturing Montgomery, AL Warehousing
Nogales, AZ Contract Sterilization Aliso Viejo, CA Sales Office
Ontario, CA Contract Sterilization San Diego, CA Contract Sterilization
Temecula, CA Contract Sterilization Morton Grove, IL Contract Sterilization
Libertyville, IL (2 locations) Contract Sterilization Waukegan, IL Contract Sterilization
Northborough, MA Contract Sterilization Bel Air, MD Sales Office
St. Louis, MO Manufacturing St. Louis, MO Warehousing/Distribution
Groveport, OH Contract Sterilization Mentor, OH (2 locations) Administrative Offices
South Plainfield, NJ Contract Sterilization Administrative Offices/
Operations
Whippany, NJ Contract Sterilization Minneapolis, MN Contract Sterilization
Chester, NY Contract Sterilization Reno, NV Warehousing
16

U.S. Locations (including Puerto Rico)Owned Locations Leased Locations
Mentor, OH (7 locations) Corporate Headquarters Erie, PA (2 locations) Administrative Offices
Sales/Marketing Offices Warehousing
Administrative Offices Nashville, TN Sterilization Services
Manufacturing/Warehousing Grand Prairie, TX Contract Sterilization
Manufacturing/Operations
Vega Alta, PR Contract Sterilization
Coventry, RI Contract Sterilization
Spartanburg, SC Contract Sterilization
El Paso, TX Contract Sterilization
Sandy, UT Contract Sterilization
International LocationsOwned Locations Leased Locations
Whitby, Canada Contract Sterilization Brussels, Belgium Sales Office
Quebec City, Canada Manufacturing Sao Palo, Brazil Sales Office
Leicester, England (2 locations) Manufacturing/Warehousing Mississauga, Canada Warehousing/Sales Office
Tuusula, Finland Manufacturing/Sales Office St. Laurent, Canada Sales Office
Pieterlen, Switzerland Manufacturing/Sales Office Shanghai, China Representative Office
Basingstoke, England European Corporate
Headquarters/Sales Office
Saran, France Manufacturing/Sales Office
Cologne, Germany Sales Office
Halandri, Greece Sales Office
Calcutta, India Sales Office
Segrate, Italy Sales Office
Kobe, Japan Sales Office
Tokyo, Japan Sales Office
Petaling Jaya, Malaysia Sales Office
17

International LocationsOwned Locations Leased Locations
Guadalupe, Mexico Manufacturing
Singapore Sales Office
Madrid, Spain Sales Office
ITEM 3. LEGAL PROCEEDINGSWe may be involved in a number of legal proceedings and claims, which we believe arise from the ordinary course of our
business, given our size, history, complexity, and the nature of our business and industries in which we participate. These legal proceedings
and claims generally involve a variety of legal theories and allegations, including, without limitation, personal injury (e.g., slip and falls, burns,
vehicle accidents), product liability (e.g., based on product operation or claimed malfunction, failure to warn, or failure to meet
specification), product exposure (e.g., claimed exposure to chemicals, asbestos, contaminants, radiation), property damage (e.g., claimed
damage due to leaking equipment, fire, vehicles, chemicals), economic loss (e.g., breach of contract, other commercial claims), financial (e.g.,
taxes, reporting), employment (e.g., wrongful termination, discrimination, benefits matters), and other claims for damage and relief.
The FDA and the United States Department of Justice have been conducting an investigation to our knowledge since 2003 involving
our SYSTEM 1® sterile processing system. We have received requests for documents, including the subpoena received in January 2005, and
interviews of current and former employees in connection with the investigation. We continue to respond to these requests and cooperate
with the government agencies regarding this matter. There can be no assurance of the ultimate outcome of the investigation, or that any
matter arising out of the investigation will not result in actions by the government agencies or third parties, or that the government agencies
will not initiate administrative proceedings, civil proceedings or criminal proceedings, or any combination thereof, against us.
On May 16, 2008, we received a warning letter from the FDA regarding our STERIS SYSTEM 1® sterile processor and the S-20
sterilant used with the processor (referred to collectively in the FDA letter and in this Item 3 as the “device”). We believe this warning
letter arose from the previously disclosed investigation. In summary, the warning letter includes the FDA’s assertion that significant changes
or modifications have been made in the design, components, method of manufacture or intended use of the device beyond the FDA’s
1988 clearance, such that the FDA believes a new premarket notification submission (known within FDA regulations as a 510(k)
submission) should have been made. The warning letter references a number of changes to the device that the FDA believes should be
evaluated to determine if they significantly affect the safety or effectiveness of the device and, if true, could require a new premarket
notification submission. The warning letter also requests documentation and explanation regarding various corrective actions related to the
device prior to 2003, and whether those actions should be considered corrections or removals within the meaning of FDA regulations.
We continue to believe that the changes described in the warning letter from the FDA do not significantly affect the safety or
effectiveness of the device and, therefore, did not and do not require a new premarket notification submission, and further, that the
corrective actions were compliant with FDA regulations. However, if the FDA’s assertions are ultimately determined to be correct, the
device would be considered adulterated and misbranded under United States law, in which case, we would be required to make a new
premarket notification submission. The FDA could also take enforcement action immediately without providing the opportunity to make a
new premarket certification submission (“510(k) submission”). If we did not make that 510(k) submission, if the FDA rejected that 510(k)
submission, if the FDA took immediate enforcement action, or if governmental agencies and/or third parties otherwise considered the
device to be non-compliant, civil, administrative or criminal proceedings could be initiated. These or other proceedings involving our STERIS
SYSTEM 1® sterile processing system or other significant product, service, or obligation, which could possibly result in judgments requiring
recall, re-labeling or restriction on the manufacturing, sale or distribution of the device, or could require us to take other action, pay fines or
civil damages, or be subject to other governmental or third party claims or remedies, could materially affect our business, performance,
value, financial condition, and results of operations. The STERIS SYSTEM 1® sterile processing system has been in use since its clearance by
the FDA in the late 1980’s. We estimate that the devices currently in operation are used in excess of 30,000 times per day in the aggregate
and that over 250 million medical instruments have been processed using the STERIS SYSTEM 1® sterile processing system. We have
commenced discussions with the FDA regarding this warning letter and the FDA has requested that we respond within 15 working days.
18

We believe we have adequately reserved for our current litigation and that the ultimate outcome of pending lawsuits and claims
will not have a material adverse affect on our consolidated financial position or results of operations taken as a whole. Due to their inherent
uncertainty, however, there can be no assurance of the ultimate outcome of current or future litigation, proceedings, investigations, or
claims or their effect. We presently maintain product liability insurance coverage, and other liability coverages in amounts and with
deductibles that we believe are prudent, but there can be no assurance that these coverages will be applicable or adequate to cover
adverse outcomes of claims against us.
From time to time, STERIS is also involved in legal proceedings as a plaintiff involving contract, patent protection, and other claims
asserted by us. Gains, if any, from these proceedings are recognized when they are realized.
Additional information regarding our commitments and contingencies is included in Item 7, “MD&A,” and in Note 11 to our
consolidated financial statements titled, “Commitments and Contingencies.”
ITEM 4. SUBMISSION OF MATTERS TO A VOTE OF SECURITY HOLDERS
No matters were submitted to a vote of our security holders during the fourth quarter of fiscal year 2008.
Executive Officers of the Registrant. The following table presents certain information regarding our executive officers as of May 14,
2008. All executive officers, other than Mr. Voyzey, serve at the pleasure of the Board of Directors. Mr. Voyzey serves at the pleasure of
the President and Chief Executive Officer.
Name Age Position
Walter M Rosebrough, Jr. 54 President and Chief Executive OfficerWilliam L. Aamoth 54 Vice President and Corporate TreasurerDr. Peter A. Burke 59 Senior Vice President and Chief Technology OfficerTimothy L. Chapman 46 Senior Vice President and Group President, HealthcareMark D. McGinley 51 Senior Vice President, General Counsel, and SecretaryRobert E. Moss 63 Senior Vice President and Group President, STERIS Isomedix ServicesGerard J. Reis 56 Senior Vice President, Government and AdministrationMichael J. Tokich 39 Senior Vice President and Chief Financial OfficerJohn N. Voyzey 41 Vice President and General Manager – Life Sciences
The following discussion provides a summary of each executive officer’s recent business experience:
Walter M Rosebrough, Jr. serves as President and Chief Executive Officer. He assumed this role when he joined STERIS in October 2007.
Mr. Rosebrough also joined our Board of Directors in October 2007. Prior to his employment with STERIS, Mr. Rosebrough served from
February 2005 to September 2007 as President and Chief Executive Officer of Coastal Hydraulics, Inc., a provider of hydraulic and
pneumatic systems, equipment and services used in industrial, marine and mobile equipment applications, a company that he purchased in
2005. From January 2003 until February 2005, Mr. Rosebrough was involved in a variety of personal business matters.
William L. Aamoth serves as Vice President and Corporate Treasurer. He assumed this role in July 2002.
Dr. Peter A. Burke serves as Senior Vice President and Chief Technology Officer. He assumed this role in July 2002.
Timothy L. Chapman serves as Senior Vice President and Group President, Healthcare. He assumed this role in February 2008. He joined
STERIS in January 2006 and served as Senior Vice President, Business Strategy until February 2008. Prior to joining STERIS, Mr. Chapman
was associated with McKinsey & Company, a professional services firm, from June 1985 through January 2006, serving most recently as
Director (Senior Partner) in McKinsey’s Healthcare and Operations practices.
19
Mark D. McGinley serves as Senior Vice President, General Counsel, and Secretary. He assumed this role in April 2005. He joined STERIS in
March 2002 as Vice President, General Counsel, and Secretary.
Robert E. Moss serves as Senior Vice President and Group President, STERIS Isomedix Services. He assumed this role in April 2005. He
served as Vice President and Group President of STERIS Isomedix Services from March 2003 until April 2005.
Gerard J. Reis serves as Senior Vice President, Government and Administration. He assumed this role in March 2008. He served as Senior
Vice President and Group President, Life Sciences from February 2005 until March 2008 and Senior Vice President and Group President,
Defense and Industrial from April 2003 until February 2005.
Michael J. Tokich serves as Senior Vice President and Chief Financial Officer. He assumed this role in March 2008. He served as Vice
President and Corporate Controller from July 2002 until March 2008.
John N. Voyzey serves as Vice President and General Manager – Life Sciences. He assumed this role in March 2008. He joined STERIS in
May 2005 as Vice President and General Manager – Pharmaceuticals and Research. Prior to joining STERIS, Mr. Voyzey was associated with
McKinsey & Company, a professional services firm, from September 1999 through May 2005, serving most recently as Associate Principal.
20
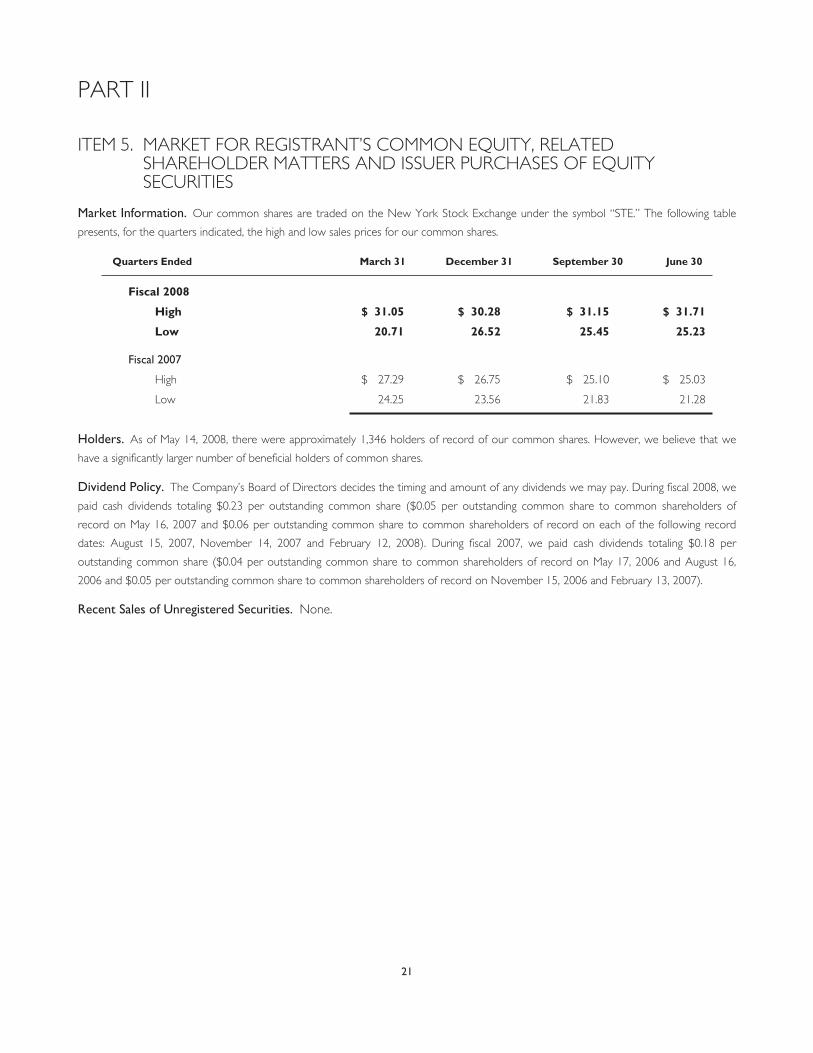
PART II
ITEM 5. MARKET FOR REGISTRANT’S COMMON EQUITY, RELATEDSHAREHOLDER MATTERS AND ISSUER PURCHASES OF EQUITYSECURITIES
Market Information. Our common shares are traded on the New York Stock Exchange under the symbol “STE.” The following table
presents, for the quarters indicated, the high and low sales prices for our common shares.
Quarters Ended March 31 December 31 September 30 June 30
Fiscal 2008
High $ 31.05 $ 30.28 $ 31.15 $ 31.71
Low 20.71 26.52 25.45 25.23
Fiscal 2007
High $ 27.29 $ 26.75 $ 25.10 $ 25.03
Low 24.25 23.56 21.83 21.28
Holders. As of May 14, 2008, there were approximately 1,346 holders of record of our common shares. However, we believe that we
have a significantly larger number of beneficial holders of common shares.
Dividend Policy. The Company’s Board of Directors decides the timing and amount of any dividends we may pay. During fiscal 2008, we
paid cash dividends totaling $0.23 per outstanding common share ($0.05 per outstanding common share to common shareholders of
record on May 16, 2007 and $0.06 per outstanding common share to common shareholders of record on each of the following record
dates: August 15, 2007, November 14, 2007 and February 12, 2008). During fiscal 2007, we paid cash dividends totaling $0.18 per
outstanding common share ($0.04 per outstanding common share to common shareholders of record on May 17, 2006 and August 16,
2006 and $0.05 per outstanding common share to common shareholders of record on November 15, 2006 and February 13, 2007).
Recent Sales of Unregistered Securities. None.
21

Purchases of Equity Securities by the Issuer and Affiliated Purchasers. The following table presents information about stock
repurchases we made during the fourth quarter of fiscal 2008:
(a)Total
Number ofShares
Purchased(1)
(b)Average
Price PaidPer Share
(c)Total
Number of SharesPurchased as Part
of PubliclyAnnounced Plans(2)
(d)Maximum
DollarValue of Shares
That May Yet BePurchased Under
the Plans atPeriod End(2)
January 1 - 31 415,119 $ 27.59 415,119 $ 213,517,345
February 1 - 29 1,378,000(3) 24.22(3) 1,361,000 180,537,178
March 1 - 31(4) 1,642,900 25.87 1,642,900 278,301,295
Total 3,436,019 $ 25.43 3,419,019 $ 278,301,295
(1) Does not include 41 shares purchased during the quarter at an average price of $26.24 per share by the STERIS Corporation
401(k) Plan on behalf of a certain executive officer of the Company who may be deemed to be an affiliated purchaser.
(2) On March 14, 2008, we announced that the Company’s Board of Directors provided authorization to repurchase up to $300
million of our common shares. This common share repurchase authorization replaced the existing authorization to repurchase up
to $300 million of our common shares that was approved on July 26, 2007. At the time of the replacement, $159.7 million in
common shares remained available for repurchase under the prior authorization. As of March 31, 2008, $278.3 million in
common shares remained authorized for repurchase under the current share repurchase authorization. This authorization does
not have a stated maturity date. We provide information about our full year fiscal 2008 share repurchase activity in Note 14 to
our consolidated financial statements titled, “Repurchases of Common Shares.”
(3) Includes 17,000 shares purchased in the open market at an average price of $23.11 per share by the President and CEO of the
Company.
(4) Includes 225,000 shares repurchased at an average price of $26.79 per share that were not settled until April 2008.
22

ITEM 6. SELECTED FINANCIAL DATA
Years Ended March 31, 2008(1) 2007(1) 2006(1)(2)(3) 2005(2)(3) 2004(2)(3)
(in thousands, except per share data)Statements of Income Data:
Revenues $ 1,265,090 $ 1,197,407 $ 1,160,285 $ 1,081,674 $ 1,031,908Gross profit 523,957 504,807 484,185 461,921 443,900Restructuring expenses 15,461 6,584 25,308 — —Income from continuing
operations 123,545 137,701 109,698 141,344 128,760Income taxes 42,693 51,833 45,172 54,620 40,182Income from discontinued
operations, net of tax — — 1,109 2,308 7,937Gain on the sale of discontinued
operations, net of tax — 1,058 6,234 — —Net income 77,106 82,155 70,289 85,980 94,243Basic income per common share:
Income from continuingoperations $ 1.22 $ 1.24 $ 0.92 $ 1.21 $ 1.24
Income from discontinuedoperations — 0.02 0.11 0.03 0.12
Net income $ 1.22 $ 1.26 $ 1.03 $ 1.24 $ 1.36
Shares used in computing netincome per common share –basic 63,300 65,174 68,238 69,254 69,521
Diluted income per commonshare:Income from continuing
operations $ 1.20 $ 1.23 $ 0.91 $ 1.20 $ 1.22Income from discontinued
operations — 0.02 0.11 0.03 0.11
Net income $ 1.20 $ 1.25 $ 1.02 $ 1.23 $ 1.33
Shares used in computing netincome per common share –diluted 64,124 65,731 68,939 70,022 70,742
Dividends per common share $ 0.23 $ 0.18 $ 0.16 $ — $ —Balance Sheets Data:
Working capital $ 283,017 $ 267,321 $ 239,002 $ 198,316 $ 272,250Total assets 1,239,292 1,209,170 1,188,973 1,185,722 1,068,170Long-term indebtedness 179,280 100,800 114,480 104,274 109,090Total liabilities 533,140 434,878 458,146 430,084 387,471Total shareholders’ equity 706,152 774,292 730,827 755,638 680,699
(1) See “Management’s Discussion and Analysis of Financial Condition and Results of Operations.”
(2) Certain balance sheet reclassifications have been made to conform to the fiscal 2007 presentation.
(3) On October 31, 2005, we completed the sale of our lyophilizer (freeze dryer) product line to GEA Group of Germany for
20.8 million euros (approximately $25.2 million). As a result of this transaction, we recorded an after-tax gain of approximately
$7.3 million ($6.2 million in fiscal 2006 and $1.1 million in fiscal 2007). The freeze dryer product line, based in Cologne, Germany,
was part of our Life Sciences segment. This product line is presented as a discontinued operation in our financial statements.
Revenues, cost of revenues, operating expenses and income taxes related to this product line are combined in a single line on the
income statement for all periods presented. Segment results exclude the freeze dryer product line and reflect the reallocation of
corporate overhead charges to all business segments.
23

ITEM 7. MANAGEMENT’S DISCUSSION AND ANALYSIS OF FINANCIALCONDITION AND RESULTS OF OPERATIONS
INTRODUCTION
In Management’s Discussion and Analysis (“MD&A”), we explain the general financial condition and the results of operations for
STERIS and its subsidiaries including:
• what factors affect our business;
• what our earnings and costs were;
• why those earnings and costs were different from the year before;
• where our earnings came from;
• how this affects our overall financial condition;
• what our expenditures for capital projects were; and
• where cash will come from to pay for future capital expenditures.
The MD&A also analyzes and explains the annual changes in specific line items in the Consolidated Statements of Income. As you
read the MD&A, it may be helpful to refer to information in Item 1, “Business,” Item 6, “Selected Financial Data,” and our consolidated
financial statements, which present the results of our operations for fiscal 2008, 2007 and 2006, as well as Part I, Item 1A, “Risk Factors,”
and Part 1, Item 3, “Legal Proceedings” for a discussion of some of the matters that can adversely affect our business and results of
operations. This information, discussion, and disclosure may be important to you in making decisions about your investments in STERIS.
FINANCIAL MEASURES
In the following sections of MD&A and in Item 1, “Business,” we, at times, may refer to financial measures that are not required
to be presented in the consolidated financial statements under accounting principles generally accepted in the United States. We have used
the following financial measures in the context of this report: backlog, debt-to-capital, and days sales outstanding. We define these financial
measures as follows:
• Backlog – We define backlog as the amount of unfilled capital purchase orders at a point in time. We use this figure as a measure to
assist in the projection of short-term financial results and inventory requirements.
• Debt-to-capital – We define debt-to-capital as total debt divided by the sum of debt and shareholders’ equity. We use this figure as a
financial liquidity measure to gauge our ability to borrow, provide strength/protection against creditors, fund growth, and measure the
risk of our financial structure.
• Days sales outstanding – We define days sales outstanding as the average collection period for accounts receivable. It is calculated as
net accounts receivable divided by the trailing four quarters’ revenues, multiplied by 365 days. We use this figure to help gauge the
quality of accounts receivable and expected time to collect.
In the following sections of MD&A and in Item 1, “Business,” we, at times, may also refer to financial measures which are
considered to be “non-GAAP financial measures” under SEC rules. Non-GAAP financial measures we may use are as follows:
• Free cash flow – We define free cash flow as cash flows from operating activities as presented in the Consolidated Statements of Cash
Flows, which are presented in Item 8, “Financial Statements and Supplementary Data,” less purchases of property, plant and equipment,
net, plus proceeds from the sale of property, plant and equipment, which are also presented in the Consolidated Statements of Cash
Flows.
24

We use this measure to gauge our ability to fund future growth outside of core operations, repurchase common shares, and pay cash
dividends. The following table summarizes the calculation of our free cash flow for the years ended March 31, 2008 and 2007:
Years Ended March 31, 2008 2007
(dollars in millions)
Cash flows from operating activities $ 143.4 $ 95.7
Purchases of property, plant and equipment, net (57.0) (49.0)
Proceeds from the sale of property, plant and equipment 5.2 2.8
Free cash flow $ 91.6 $ 49.5
We may, at times, refer to our results of operations excluding certain transactions or amounts that are non-recurring or are not
indicative of future results, in order to provide meaningful comparisons between the years presented. For example, when discussing changes
in revenues, we may, at times, exclude the impact of current or prior year business acquisitions.
We have presented these financial measures because we believe that meaningful analysis of our financial performance is
enhanced by an understanding of certain additional factors underlying that performance. These financial measures should not be considered
an alternative to measures required by accounting principles generally accepted in the United States. Our calculations of these measures
may differ from calculations of similar measures used by other companies and you should be careful when comparing these financial
measures to those of other companies.
REVENUES-DEFINED
As required by Regulation S-X, we separately present revenues generated as either product revenues or service revenues on our
Consolidated Statements of Income for each year presented. When we discuss revenues, we may, at times, refer to revenues summarized
differently than the Regulation S-X requirements. The terminology, definitions, and applications of terms that we use to describe revenues
may be different from terms used by other companies. We use the following terms to describe revenues:
• Revenues – Our revenues are presented net of sales returns and allowances.
• Product Revenues – We define product revenues as revenues generated from sales of capital equipment, which includes steam and low
temperature liquid sterilizers, washing systems, VHP® technology, water stills, and pure steam generators; surgical lights and tables; and
the consumable family of products, which includes STERIS SYSTEM 1® consumables, sterility assurance products, skin care products,
and cleaning consumables.
• Service Revenues – We define service revenues as revenues generated from parts and labor associated with the maintenance, repair,
and installation of our capital equipment, as well as revenues generated from contract sterilization offered through our Isomedix
Services segment.
• Capital Revenues – We define capital revenues as revenues generated from sales of capital equipment, which includes steam and low
temperature liquid sterilizers, washing systems, VHP® technology, water stills, and pure steam generators; and surgical lights and tables.
• Consumable Revenues – We define consumable revenues as revenues generated from sales of the consumable family of products
which includes STERIS SYSTEM 1® consumables, sterility assurance products, skin care products, and cleaning consumables.
• Recurring Revenues – We define recurring revenues as revenues generated from sales of consumable products and service revenues.
• Acquired Revenues – We define acquired revenues as base revenues generated from acquired businesses or assets and additional
volumes driven through acquired businesses or assets. We will use such measure for up to a year after acquisition.
25

GENERAL COMPANY OVERVIEW AND OUTLOOK
Our mission is to provide a healthier today and safer tomorrow through knowledgeable people and innovative infection
prevention, decontamination and health science technologies, products, and services. Our dedicated employees around the world work
together to supply a broad range of solutions by offering a combination of equipment, consumables, and services to healthcare,
pharmaceutical, industrial, and governmental Customers.
We participate in industries that currently benefit from strong underlying demand, with the bulk of our revenues derived from the
healthcare and pharmaceutical industries. As such, much of the growth in our markets is driven by the aging of the population throughout
the world, as an increasing number of individuals are entering their prime healthcare consumption years. In addition, each of our core
industries are also benefiting from specific trends that drive growth. Within the healthcare market, there is increased concern regarding the
level of hospital-acquired infections around the world. The pharmaceutical industry has been impacted by increased FDA scrutiny of
cleaning and validation processes, mandating that manufacturers improve their processes. In the contract sterilization industry, where
Isomedix competes, an increasing trend toward the outsourcing of sterilization services continues to drive growth.
Beyond our core markets, infection-control issues are becoming a global concern, and emerging threats have gained prominence
in the news. We are actively pursuing new opportunities to adapt our proven technologies to meet the changing needs of the global
marketplace.
Fiscal 2008 was, in many ways, a transitional year for us. Transitions in management occurred as new leaders stepped into the
roles of President and Chief Executive Officer, Chief Financial Officer, and group heads for our Healthcare and Life Sciences segments. Fiscal
2008 is also marked by key operational transitions, including the completion of the transfer of manufacturing operations from Erie,
Pennsylvania to Monterrey, Mexico. Recent product introductions such as Class 6 indicators, the V-PRO™ I low temperature sterilizer,
Harmony™ LED lights, and OR integration solutions have generated significant interest from our Customer base.
In the fourth quarter of fiscal 2008, in an effort to improve our overall cost structure, we adopted a restructuring plan primarily
related to certain of our North American operations. As part of this plan, we will close two sales offices, rationalize certain products, and
reduce the workforce in certain support functions across all of our reporting segments. We continue to look for opportunities to improve
our costs, but have not committed to any specific additional reportable actions.
Developments during fiscal 2007 important to the commercialization of recently developed products or applications include
market clearance from the EPA for expanded use of our Vaprox® Hydrogen Peroxide Sterilant technology. This clearance provides an
important advancement for us, which will enable the offering of a broader array of cleaning chemistries, capital equipment and sterilization
services to facilitate and provide complete solutions to combat emerging decontamination needs in both traditional and new markets. In
addition, we received clearance from the FDA to market the Reliance™ EPS in the United States. This innovative technology addresses
significant unmet reprocessing needs within the gastrointestinal departments of hospitals and surgery centers.
In the third quarter of fiscal 2007, in an effort to improve our cost structure in Europe, we adopted a restructuring plan related to
certain of our European operations. As part of this plan, we closed two sales offices and reduced the workforce in certain European
support functions.
Several critical actions were taken in fiscal 2006. The sale of the lyophilizer (freeze dryer) business in the third quarter was an
important step in the Life Sciences renewed strategic focus. In January 2006, we announced the transfer of manufacturing operations from
Erie, Pennsylvania to Mexico as a major element of a plan to reduce the cost structure of operations.
Our financial position and cash flows remain strong. For fiscal 2008, cash flows from operations were $143.4 million and free cash
flow was $91.6 million. We continue to maintain low debt levels with our debt to capital ratio of 20.3% at March 31, 2008. Our strong
financial position and cash flows currently afford us the financial flexibility to return value to shareholders. Value returned to shareholders
may be in various forms, but principally includes potential common share repurchases and cash dividends.
26

A detailed discussion of our fiscal 2008 performance is included in the subsection of MD&A titled, “Results of Operations.”
MATTERS AFFECTING COMPARABILITY
Accounting for Uncertain Tax Positions. On April 1, 2007, we adopted Financial Accounting Standards Board (“FASB”) Interpretation
No. 48 (“FIN No. 48”), “Accounting for Uncertainty in Income Taxes—an Interpretation of FASB Statement No. 109,” which provides
guidance for the recognition threshold and measurement attribute for financial statement recognition and measurement of tax positions
taken or expected to be taken on a tax return. Under FIN No. 48, we cannot recognize a tax benefit in our financial statements unless it is
more-likely-than-not that the benefit will be sustained on audit by the taxing authority based solely on the technical merits of the associated
tax position. FIN No. 48 requires the cumulative effect of adoption to be recorded as an adjustment to the opening balance of retained
earnings. In connection with the adoption of FIN No. 48, we recorded an adjustment of $8.4 million, increasing our liability for unrecognized
tax benefits, interest, and penalties and reducing the April 1, 2007 balance of retained earnings. Prior to April 1, 2007, we regularly assessed
our positions with respect to tax exposures and recorded liabilities for uncertain tax positions according to Statement of Accounting
Standards No. 5 (“SFAS No. 5”), “Accounting for Contingencies.”
Additional information regarding our adoption of FIN No. 48 is included in the subsection of MD&A titled, “Critical Accounting
Policies, Estimates, and Assumptions” and in Note 1 and Note 9 to our consolidated financial statements titled, “Nature of Operations and
Summary of Significant Accounting Policies” and “Income Taxes,” respectively.
Accounting for Share-Based Compensation. On April 1, 2006, we adopted Statement of Financial Accounting Standards No. 123 (revised
2004) (“SFAS No. 123R”), “Share-Based Payment,” using the modified prospective transition method. SFAS No. 123R requires us to
estimate the fair value of share-based awards on the date of the grant using an option pricing model. The value of the portion of the award
that is ultimately expected to vest is recognized as expense over the requisite service periods in our consolidated statements of income.
Our consolidated financial statements as of and for the years ended March 31, 2008 and 2007 reflect the impact of SFAS
No. 123R. In accordance with the modified prospective transition method, we did not restate the consolidated financial statements for prior
periods, and they do not include the impact of SFAS No. 123R. Total share-based compensation expense for fiscal 2008 was $8.6 million
on a pre-tax basis, or $5.4 million ($0.09 per basic share and $0.08 per diluted share), net of tax. Total share-based compensation expense
for fiscal 2007 was $9.9 million on a pre-tax basis, or $6.1 million ($0.09 per basic and diluted share), net of tax.
As of March 31, 2008, there was $9.4 million of total unrecognized compensation cost related to non-vested share-based
compensation granted under our equity incentive compensation plans. The cost is expected to be recognized over a weighted average
period of 1.77 years.
Additional information regarding our adoption of SFAS No. 123R is included in the subsection of MD&A titled, “Critical
Accounting Policies, Estimates, and Assumptions” and in Note 15 to our consolidated financial statements titled, “Share-Based
Compensation.”
Restructuring. During the fourth quarter of fiscal 2008, we adopted a restructuring plan primarily focused on our North American
operations (the “Fiscal 2008 Restructuring Plan”). As part of this plan, we will reduce the workforce in certain support functions, close two
sales offices, and rationalize certain products. These actions are intended to enhance profitability and improve efficiency by reducing ongoing
operating costs. Across all of our reporting segments, approximately 90 employees, primarily located in North America, have been directly
impacted.
In fiscal 2008, we recorded pre-tax expenses totaling approximately $15.8 million related to these actions, including $11.7 million
recorded as restructuring expenses and $4.1 million recorded as cost of revenues. We do not expect to incur any significant additional
restructuring expenses related to this plan.
During the third quarter of fiscal 2007, we adopted a restructuring plan related to certain of our European operations (the
“European Restructuring Plan”). As part of this plan, we closed two sales offices. We also took steps to reduce the workforce in certain
27

European support functions. These actions are intended to improve our cost structure in Europe. Approximately 40 employees were
directly impacted in various European locations.
In fiscal 2008 and fiscal 2007, we recorded pre-tax expenses of $0.1 million and $1.7 million, respectively, for the European
Restructuring Plan, primarily for severance and termination benefits, for lease termination costs, and for non-cash expenses related to asset
write-downs. We do not expect to incur any significant additional restructuring expenses related to this plan.
On January 30, 2006, we announced that the manufacturing portion of our Erie, Pennsylvania operations would be transferred to
Mexico to reduce production costs and improve our competitive position. Plans for other restructuring actions, including the closure of a
sales office, rationalization of operations in Finland, and the elimination of certain management positions were also approved. These actions
were designed to reduce operating costs within the ongoing operations of both the Healthcare and Life Sciences segments, and together
we refer to them as the “Fiscal 2006 Restructuring Plan.”
Operating income for fiscal 2008, fiscal 2007, and fiscal 2006 includes pre-tax restructuring expenses for the Fiscal 2006
Restructuring Plan of approximately $3.6 million, $4.9 million, and $25.3 million, respectively, primarily for non-cash expenses related to
asset write-downs, accelerated recognition of pension and retiree medical benefits, and severance and termination benefits related to the
transfer and other restructuring actions.
We completed the transfer of our Erie, Pennsylvania manufacturing operations during fiscal 2008 and do not expect to incur any
significant additional restructuring expenses related to the Fiscal 2006 Restructuring Plan.
We are continuing to evaluate all of our operations for additional opportunities to improve performance, but we have not
committed to any additional specific actions.
Further information regarding our restructuring actions is included in Note 2 to our consolidated financial statements titled,
“Restructuring.”
Business Dispositions. On October 31, 2005, we sold our lyophilizer (freeze dryer) product line to GEA Group of Germany for
20.8 million euros (approximately $25.2 million). As a result of this sale, we recorded an after-tax gain of approximately $7.3 million ($1.1
million recorded in fiscal 2007 and $6.2 million recorded in fiscal 2006). The freeze dryer product line, based in Cologne, Germany, was
part of our Life Sciences segment. This product line is presented as a discontinued operation in our financial statements. Revenues, cost of
revenues, operating expenses and income taxes attributable to this product line are aggregated in a single line on the income statement for
all periods presented. Segment results for all periods presented exclude the freeze dryer product line and reflect the reallocation of
corporate overhead charges to all business segments.
Further information regarding our discontinued operations is included in Note 16 to our consolidated financial statements titled,
“Business Dispositions.”
International Operations. Since we conduct operations outside of the United States using various foreign currencies, our operating results
are impacted by foreign currency movements relative to the U.S. dollar. During fiscal 2008, our revenues were favorably impacted by $18.5
million, or 1.5%, and income before taxes was unfavorably impacted by $4.5 million, or 3.5%, as a result of foreign currency movements
relative to the U.S. dollar.
RESULTS OF OPERATIONS
In the following subsections, we discuss our earnings and the factors affecting them. We begin with a general overview of the
results of operations of the Company and then separately discuss earnings for our operating segments.
28

FISCAL 2008 AS COMPARED TO FISCAL 2007
Revenues. The following table compares our revenues for the year ended March 31, 2008 to the year ended March 31, 2007:
Years Ended March 31,
ChangePercentChange
Percentage ofTotal Revenues
(dollars in thousands) 2008 2007 2008(1) 2007(1)
Capital Revenues $ 528,082 $ 509,312 $ 18,770 3.7% 41.7% 42.5%
Consumable Revenues 283,976 264,257 19,719 7.5% 22.4% 22.1%
Product Revenues 812,058 773,569 38,489 5.0% 64.2% 64.6%
Service Revenues 453,032 423,838 29,194 6.9% 35.8% 35.4%
Total Revenues $ 1,265,090 $ 1,197,407 $ 67,683 5.7% 100.0% 100.0%
Service Revenues $ 453,032 $ 423,838 $ 29,194 6.9% 35.8% 35.4%
Consumable Revenues 283,976 264,257 19,719 7.5% 22.4% 22.1%
Recurring Revenues 737,008 688,095 48,913 7.1% 58.3% 57.5%
Capital Revenues 528,082 509,312 18,770 3.7% 41.7% 42.5%
Total Revenues $ 1,265,090 $ 1,197,407 $ 67,683 5.7% 100.0% 100.0%
United States $ 971,018 $ 933,546 $ 37,472 4.0% 76.8% 78.0%
International 294,072 263,861 30,211 11.4% 23.2% 22.0%
Total Revenues $ 1,265,090 $ 1,197,407 $ 67,683 5.7% 100.0% 100.0%
(1) Certain percentages may not calculate exactly due to rounding.
Revenues increased $67.7 million, or 5.7%, to $1,265.1 million for the year ended March 31, 2008, as compared to $1,197.4
million for fiscal 2007. For fiscal 2008, recurring revenues increased 7.1% as compared to fiscal 2007. The recurring revenues increase was
generated primarily by a 6.9% increase in service revenues as compared to fiscal 2007. Service revenues, which increased in all segments,
were driven by a $16.3 million, or 7.6%, increase in the Healthcare segment. Within our Life Sciences and Isomedix Services segments,
service revenues for fiscal 2008 increased 9.0% and 5.1%, respectively, as compared to fiscal 2007. Consumable revenues also increased
$19.7 million, or 7.5%, for fiscal 2008 when compared to the prior year, primarily driven by growth of 7.3% in the Healthcare segment.
Capital revenues increased $18.8 million, or 3.7%, during fiscal 2008, as compared to fiscal 2007. The Life Sciences segment experienced a
significant increase in capital equipment shipment levels in the fourth quarter of fiscal 2008 driven by a recovery in the United States
research market compared to the prior year. The Healthcare segment’s capital revenues increased 2.2% when compared to the prior year.
International revenues for fiscal 2008 were $294.1 million, an increase of $30.2 million, or 11.4%, as compared to fiscal 2007. The
increase in year-over-year international revenues was attributable to increases in capital, consumable, and service revenues of 8.5%, 18.0%,
and 12.7%, respectively. Within the European market, key drivers include strong revenues in surgical support capital products and
accessories, consumables, and service. In Asia Pacific and Latin America, surgical support capital products, water systems, sterilizers, and
consumable products drove revenue growth.
United States revenues for fiscal 2008 were $971.0 million, an increase of $37.5 million, or 4.0%, as compared to fiscal 2007.
United States revenues were positively impacted by a 5.5% increase in recurring revenues, which were driven by increases in service
revenues in all segments. Year over year, United States capital revenues increased 1.7%. The increased capital equipment shipments to the
29

United States research market experienced by the Life Sciences segment in the fourth quarter of fiscal 2008 more than offset a small
decline in the Healthcare segment’s capital revenues of 1.2%.
Revenues by segment are further discussed in the section of MD&A titled, “Business Segment Results of Operations.”
Gross Profit. The following table compares our gross profit for the year ended March 31, 2008 to the year ended March 31, 2007:
Years Ended March 31,
ChangePercentChange(dollars in thousands) 2008 2007
Gross Profit:
Product $ 325,117 $ 319,066 $ 6,051 1.9%
Service 198,840 185,741 13,099 7.1%
Total Gross Profit $ 523,957 $ 504,807 $19,150 3.8%
Gross Profit Percentage:
Product 40.0% 41.2%
Service 43.9% 43.8%
Total Gross Profit Percentage 41.4% 42.2%
Our gross profit (margin) is affected by the volume, pricing, and mix of sales of our products and services, as well as the costs
associated with the products and services that are sold. Our gross margin decreased 80 basis points to 41.4% for fiscal 2008. In fiscal 2008,
we benefited from labor savings from the transfer of our manufacturing operations from Erie, Pennsylvania to Monterrey, Mexico and from
price increases. However, these benefits were more than offset by increases in raw material costs, increases in transportation costs, and the
unfavorable impact of foreign exchange rates.
The gross margins related to our operating segments are further discussed in the section of MD&A titled, “Business Segment
Results of Operations.”
Operating Expenses. The following table compares our operating expenses for the year ended March 31, 2008 to the year ended
March 31, 2007:
Years Ended March 31,
ChangePercentChange(dollars in thousands) 2008 2007
Operating Expenses:
Selling, General, and Administrative $ 348,035 $ 326,896 $ 21,139 6.5%
Research and Development 36,916 33,626 3,290 9.8%
Restructuring Expenses 15,461 6,584 8,877 NM
Total Operating Expenses $ 400,412 $ 367,106 $ 33,306 9.1%
NM – Not meaningful.
30
Compensation and benefit costs, fees for professional services, travel and entertainment, facilities costs, and other general and
administrative expenses are significant components of selling, general, and administrative expenses (“SG&A”). SG&A increased $21.1 million,
or 20 basis points, to 27.5% of total revenues for fiscal 2008 as compared to fiscal 2007. The increase in SG&A spending primarily reflects
investments in the development and marketing of new products along with selling expenses associated with growth initiatives.
Research and development expenses as a percentage of total revenues increased 10 basis points to 2.9% for fiscal 2008 as
compared to fiscal 2007. Research and development expenses are influenced by the number and timing of in-process projects and labor
hours and other costs associated with these projects. Our research and development initiatives continually emphasize new product
development, product improvements, and the development of new technological platform innovations. During fiscal 2008, our investments
in research and development focused on, but were not limited to, enhancing capabilities of delivery systems in the defense and industrial
areas, sterile processing combination technologies, surgical tables and accessories, and the area of emerging infectious agents such as Prions
and Nanobacteria.
Restructuring Expenses. We recognize restructuring expenses as they are incurred. We also evaluate the inventory and property, plant
and equipment associated with our restructuring actions for impairment. Asset impairment and accelerated depreciation expenses primarily
relate to inventory write-downs for rationalized products and adjustments in the carrying value of the closed facilities to their estimated fair
value. In addition, the remaining useful lives of other property, plant and equipment associated with the related operations were
re-evaluated based on the respective plan, resulting in the acceleration of depreciation and amortization of certain assets.
During the fourth quarter of fiscal 2008, we adopted the Fiscal 2008 Restructuring Plan, which primarily focused on our North
American operations. As part of this plan, we will close two sales offices and rationalize certain products. We also took steps to reduce the
workforce in certain support functions. Across all of our reporting segments approximately 90 employees, primarily located in North
America, have been directly impacted. These restructuring actions are designed to enhance profitability and improve efficiency by reducing
ongoing operating costs.
In fiscal 2008, we recorded pre-tax expenses totaling $15.8 million related to these actions, of which $11.7 million was recorded
as restructuring expenses and $4.1 million was recorded in cost of revenues, with restructuring expenses of $13.1 million, $1.5 million, $0.4
million, and $0.8 million related to the Healthcare, Life Sciences, and Isomedix reporting segments, and Corporate and other, respectively.
We do not expect to incur any significant additional restructuring expenses related to the Fiscal 2008 Restructuring Plan.
During the third quarter of fiscal 2007, we adopted our European Restructuring Plan. As part of this plan, we closed two sales
offices and took steps to reduce the workforce in certain of our European support functions. These actions are intended to improve our
cost structure in Europe. Approximately 40 employees were directly impacted in various European locations.
In fiscal 2008 and fiscal 2007, we recorded $0.1 million and $1.7 million in pre-tax restructuring expenses, respectively, related to
the European Restructuring Plan actions. The restructuring expenses were predominately for severance and related benefits, with
restructuring expenses of $1.3 million and $0.5 million related to the Healthcare and Life Sciences business segments, respectively. We do
not expect to incur any significant additional restructuring expenses related to the European Restructuring Plan.
On January 30, 2006, we announced our Fiscal 2006 Restructuring Plan. In fiscal 2008 and fiscal 2007, we recorded $3.6 million
and $4.9 million in pre-tax restructuring expenses, respectively, primarily related to the transfer of the Erie, Pennsylvania manufacturing
operations. All such actions are intended to improve our cost structure.
Since the inception of the Fiscal 2006 Restructuring Plan, we have recorded restructuring expenses of $33.8 million, with
restructuring expenses of $33.4 million and $0.4 million related to the Healthcare and Life Sciences business segments, respectively. These
actions directly impacted more than 450 employees beginning in the fourth quarter of fiscal 2006 and continuing through fiscal 2008.
Information regarding the impact of the restructuring actions on our employee benefit plans is included in Note 10 to our consolidated
financial statements titled, “Benefit Plans.”
Collective bargaining agreements with certain employees located at the former Erie, Pennsylvania manufacturing operations
terminated in July 2007 and January 2008.
31

We completed the transfer of the Erie, Pennsylvania manufacturing operations during fiscal 2008 and do not expect to incur any
significant additional restructuring expenses related to the Fiscal 2006 Restructuring Plan. While we continue to evaluate all of our
operations for additional opportunities to improve performance, we have not committed to any additional specific actions.
The following tables summarize our total restructuring charges for fiscal 2008 and fiscal 2007:
Year Ended March 31, 2008
(dollars in thousands)
Fiscal 2008Restructuring
Plan(1)
EuropeanRestructuring
Plan
Fiscal 2006Restructuring
Plan Total
Severance, payroll and other related costs $ 5,213 $ (80) $ 203 $ 5,336
Asset impairment and accelerated
depreciation 5,106 — 2,885 7,991
Product rationalization 3,754 — — 3,754
Lease termination costs 898 165 (13) 1,050
Other 863 — 551 1,414
Total restructuring charges $ 15,834 $ 85 $ 3,626 $ 19,545
(1) Includes $4.1 million in charges recorded in cost of revenues on the Consolidated Statements of Income.
Year Ended March 31, 2007
(dollars in thousands)
EuropeanRestructuring
Plan
Fiscal 2006Restructuring
Plan Total
Severance, payroll and other related costs $ 1,365 $ 2,027 $ 3,392
Asset impairment and accelerated depreciation 105 2,606 2,711
Lease termination obligations 233 150 383
Other — 98 98
Total restructuring charges $ 1,703 $ 4,881 $ 6,584
32

Liabilities related to restructuring activities are recorded as current liabilities on the accompanying Consolidated Balance Sheets
within “Accrued payroll and other related liabilities” and “Accrued expenses and other.” The following tables summarize our liabilities
related to restructuring activities:
Fiscal 2008 Restructuring Plan
March 31,2007
Fiscal 2008
March 31,2008Provision
Payments/Impairments
Severance and termination benefits $ — $ 5,213 $ (969) $ 4,244
Asset impairment — 5,106 (4,614) 492
Product rationalization — 3,754 (3,754) —
Lease termination obligations — 898 — 898
Other — 863 (254) 609
Total $ — $ 15,834 $ (9,591) $ 6,243
European Restructuring Plan
March 31,2007
Fiscal 2008
March 31,2008Provision
Payments/Impairments
Severance and termination benefits $ 638 $ (68) $ (570) $ —
Lease termination obligations 219 160 (132) 247
Fixed asset impairments 105 — (105) —
Total $ 962 $ 92 $ (807) $ 247
Fiscal 2006 Restructuring Plan
March 31,2007
Fiscal 2008March 31,
2008Provision Payments
Severance and termination benefits $ 1,799 $ 132 $ (1,052) $ 879
Lease termination obligation 157 (13) (144) —
Total $ 1,956 $ 119 $ (1,196) $ 879
33

Non-Operating Expenses, Net. Non-operating expense (income), net consists of interest expense on debt, offset by interest earned on
cash, cash equivalents, and short-term investment balances, and other miscellaneous income. The following table compares our
non-operating expense (income), net for the year ended March 31, 2008 to the year ended March 31, 2007:
Years Ended March 31,
(dollars in thousands) 2008 2007 Change
Non-Operating Expenses:
Interest Expense $ 5,979 $ 7,211 $ (1,232)
Interest and Miscellaneous Income (2,233) (2,440) 207
Non-Operating Expenses, Net $ 3,746 $ 4,771 $ (1,025)
During fiscal 2008, we had lower average outstanding debt levels as compared to fiscal 2007. We also incurred lower interest
rates on outstanding debt during fiscal 2008 as compared to fiscal 2007. As a result, interest expense decreased year over year. We used
borrowings from our credit facility to fund stock repurchases and working capital needs. Interest and other miscellaneous income decreased
$0.2 million in fiscal 2008 as compared to the prior year. We had lower average cash balances during fiscal 2008, which resulted in a smaller
amount of interest earnings on those balances.
Additional information regarding our outstanding debt is included in Note 7 to our consolidated financial statements titled,
“Debt,” and in the subsection of MD&A titled, “Liquidity and Capital Resources.”
Income Tax Expense. The following table compares our income tax expense and effective tax rates for the years ended March 31, 2008
and 2007:
Years Ended March 31,
ChangePercentChange(dollars in thousands) 2008 2007
Income Tax Expense $ 42,693 $ 51,833 $ (9,140) (17.6)%
Effective Income Tax Rate 35.6% 39.0%
The effective income tax rate for fiscal 2008 was 35.6% as compared to 39.0% for fiscal 2007. The lower effective income tax
rate for fiscal 2008 resulted principally from the favorable impact of a United States manufacturing deduction, the tax impact of foreign
operations, and adjustments resulting from various international and United States audit matters. Additional information regarding our
income tax expense is included in Note 9 to our consolidated financial statements titled, “Income Taxes.”
Business Segment Results of Operations. As a result of organizational changes within the Life Sciences segment announced in fiscal 2008,
we changed our methodology for reporting segments. The Defense and Industrial business unit, which contains businesses in early
development stages, is no longer a component of the Life Sciences segment. “Corporate and other,” which will be presented separately,
contains the Defense and Industrial business unit plus costs that are associated with being a publicly traded company and certain other
corporate costs. These costs include executive office costs, Board of Directors compensation, shareholder services and investor relations,
external audit fees, and legacy pension and post-retirement benefit costs from our former Erie manufacturing operation. Fiscal 2007
amounts have been reclassified to reflect the fiscal 2008 presentation.
34

We operate in three reportable business segments: Healthcare, Life Sciences, and STERIS Isomedix Services. Note 12 to our
consolidated financial statements titled, “Business Segment Information,” and Item 1, “Business” provide detailed information regarding each
business segment. The following table compares reporting business segment revenues and Corporate and other for the year ended
March 31, 2008 to the year ended March 31, 2007:
Years Ended March 31,
ChangePercentChange(dollars in thousands) 2008 2007
Revenues:
Healthcare $ 887,073 $ 845,674 $ 41,399 4.9%
Life Sciences 228,350 209,658 18,692 8.9%
STERIS Isomedix Services 140,558 133,781 6,777 5.1%
Total reportable segments 1,255,981 1,189,113 66,868 5.6%
Corporate and other 9,109 8,294 815 9.8%
Total Revenues $ 1,265,090 $ 1,197,407 $ 67,683 5.7%
Healthcare segment revenues were 70.1% of total revenues for the year ended March 31, 2008, as compared to 70.6% for the
year ended March 31, 2007. Healthcare segment revenues increased $41.4 million, or 4.9%, to $887.1 million for the year ended March 31,
2008, as compared to $845.7 million for the prior fiscal year. The increase in Healthcare revenues was primarily driven by a 7.4% increase in
recurring revenues. We generated increases in service and consumable revenues of 7.6% and 7.3%, respectively, as a result of strong service
revenues within the United States hospital market and increased demand for our consumable products around the world. Our Healthcare
segment’s fiscal 2008 revenues were also positively impacted by a 2.2% increase in capital revenues driven by strong sales of surgical
support products. At March 31, 2008, our Healthcare segment’s backlog amounted to $98.0 million, as compared to $63.8 million at
March 31, 2007.
Life Sciences segment revenues represented 18.1% of total revenues for the year ended March 31, 2008, as compared to 17.5%
for the year ended March 31, 2007. Life Sciences segment revenues increased $18.7 million, or 8.9%, to $228.4 million for the year ended
March 31, 2008, as compared to $209.7 million for the prior fiscal year. Life Sciences capital revenues grew 9.2%, primarily driven by the
increased shipments of capital equipment to the United States research market in the fourth quarter of fiscal 2008. Recurring revenues also
grew 8.7%, with increases of 9.0% and 8.3% in service revenues and consumable revenues, respectively. At March 31, 2008, our Life
Sciences segment’s backlog amounted to $44.2 million, as compared to $46.4 million at March 31, 2007.
STERIS Isomedix Services segment revenues represented 11.1% of total revenues for the year ended March 31, 2008, as
compared to 11.2% for the year ended March 31, 2007. This segment experienced revenue growth of $6.8 million, or 5.1%, during fiscal
2008, as compared to fiscal 2007. The growth in fiscal 2008 revenues was primarily driven by an increase in demand from our core medical
device Customers and routine price increases.
35

The following table compares our reporting business segment and Corporate and other operating results for the year ended
March 31, 2008 to the year ended March 31, 2007:
Years Ended March 31,
ChangePercentChange(dollars in thousands) 2008 2007
Operating Income:
Healthcare $ 103,447 $ 122,468 $ (19,021) (15.5)%
Life Sciences 11,535 10,953 582 5.3%
STERIS Isomedix Services 28,964 25,127 3,837 15.3%
Total reportable segments 143,946 158,548 (14,602) (9.2)%
Corporate and other (20,401) (20,847) 446 (2.1)%
Total Operating Income $ 123,545 $ 137,701 $ (14,156) (10.3)%
Segment operating income is calculated as the segment’s gross profit less direct expenses and indirect cost allocations, which
results in the full allocation of all distribution and research and development expenses, and the partial allocation of corporate costs. The
Corporate and other segment includes the gross profit and direct expenses of the Defense and Industrial business unit, as well as certain
unallocated corporate costs related to being a publicly traded company and legacy pension and post-retirement benefits, as previously
discussed. Corporate cost allocations are based on each segment’s percentage of revenues, headcount, or other variables in relation to
those of the total Company. In addition, the Healthcare segment is responsible for the management of all but one manufacturing facility and
uses standard cost to sell products to the Life Sciences segment.
In fiscal 2008, restructuring expenses of $16.8 million, $1.5 million, $0.4 million, and $0.8 million were included in the operating
income for Healthcare, Life Sciences, STERIS Isomedix Services, and Corporate and other, respectively. In fiscal 2007, restructuring expenses
of $6.2 million and $0.4 million were included in the operating income for Healthcare and Life Sciences, respectively.
Our Healthcare segment’s operating income decreased $19.0 million, or 15.5%, to $103.4 million for the year ended March 31,
2008 from $122.5 million during the prior fiscal year. Our Healthcare segment’s operating margins were 11.7% and 14.5%, respectively, for
the years ended March 31, 2008 and March 31, 2007. In fiscal 2008, we benefited from labor savings in Mexico and improved pricing, but
these benefits were offset by increases in raw materials and transportation costs. Operating expenses also increased as we continued to
invest in the development and marketing of new products. The Healthcare segment’s fiscal 2008 operating margin includes restructuring
expenses of $16.8 million. Of these restructuring expenses, $13.1 million was associated with the restructuring actions announced in the
fourth quarter of fiscal 2008, $3.6 million was associated with the transfer of manufacturing operations from Erie, Pennsylvania to
Monterrey, Mexico, and $0.1 million was associated with the European restructuring actions. In fiscal 2007, this segment’s operating income
includes restructuring expenses of $6.2 million. Of these restructuring expenses, $4.9 million related to the transfer of the Erie, Pennsylvania
manufacturing operations and $1.3 million related to the European restructuring actions.
Our Life Sciences segment’s operating income increased $0.5 million, or 5.3%, to $11.5 million in fiscal 2008 from $11.0 million in
fiscal 2007. Our Life Sciences segment’s operating margins were 5.1% and 5.2%, respectively, for the years ended March 31, 2008 and
March 31, 2007. This segment’s fiscal 2008 operating results benefited from increased volumes associated with higher margin consumable
products and service offerings. However, these benefits were significantly offset by investments in research and development and the
negative impact of foreign currency exchange rates. In fiscal 2008, our Life Sciences segment’s operating income includes $1.5 million in
restructuring expenses primarily associated with the restructuring actions announced in the fourth quarter of fiscal 2008. In fiscal 2007, our
Life Sciences segment’s operating income includes restructuring expenses of $0.4 million associated with the European restructuring actions.
36

STERIS Isomedix Services segment operating income increased $3.8 million, or 15.3%, to $29.0 million for the year ended
March 31, 2008 as compared to $25.1 million during the prior fiscal year. This segment’s operating margins were 20.6% and 18.8%,
respectively, for the years ended March 31, 2008 and March 31, 2007. Restructuring expenses of $0.4 million associated with the
restructuring actions announced in the fourth quarter of fiscal 2008 are included in this segment’s fiscal 2008 operating income. Fiscal 2008
operating margins improved as a result of increased volumes and contracted price increases. Operating margins of STERIS Isomedix
Services are greatly impacted by volume levels as the facilities operate with relatively high percentages of fixed costs.
FISCAL 2007 AS COMPARED TO FISCAL 2006Revenues. The following table compares our revenues for the year ended March 31, 2007 to the year ended March 31, 2006:
Years Ended March 31,
ChangePercentChange
Percentage ofTotal Revenues
(dollars in thousands) 2007 2006 2007(1) 2006(1)
Capital Revenues $ 509,312 $ 505,235 $ 4,077 0.8% 42.5% 43.5%
Consumable Revenues 264,257 254,604 9,653 3.8% 22.1% 21.9%
Product Revenues 773,569 759,839 13,730 1.8% 64.6% 65.5%
Service Revenues 423,838 400,446 23,392 5.8% 35.4% 34.5%
Total Revenues $ 1,197,407 $ 1,160,285 $ 37,122 3.2% 100.0% 100.0%
Service Revenues $ 423,838 $ 400,446 $ 23,392 5.8% 35.4% 34.5%
Consumable Revenues 264,257 254,604 9,653 3.8% 22.1% 21.9%
Recurring Revenues 688,095 655,050 33,045 5.0% 57.5% 56.5%
Capital Revenues 509,312 505,235 4,077 0.8% 42.5% 43.5%
Total Revenues $ 1,197,407 $ 1,160,285 $ 37,122 3.2% 100.0% 100.0%
United States $ 933,546 $ 925,593 $ 7,953 0.9% 78.0% 79.8%
International 263,861 234,692 29,169 12.4% 22.0% 20.2%
Total Revenues $ 1,197,407 $ 1,160,285 $ 37,122 3.2% 100.0% 100.0%
(1) Certain percentages may not calculate exactly due to rounding.
Revenues increased $37.1 million, or 3.2%, to $1,197.4 million for the year ended March 31, 2007, as compared to $1,160.3
million for fiscal 2006. For fiscal 2007, recurring revenues increased 5.0% as compared to fiscal 2006. The recurring revenues increase was
generated primarily by a 5.8% increase in service revenues as compared to fiscal 2006. Service revenues, which increased in all segments,
were driven by a $14.4 million, or 7.1%, increase in the Healthcare segment. Within our Life Sciences and Isomedix Services segments,
service revenues for fiscal 2007 increased 4.8% and 5.0%, respectively, as compared to fiscal 2006. Consumable revenues also increased
3.8% for fiscal 2007 when compared to the prior year. Capital revenues increased $4.1 million, or 0.8%, during fiscal 2007, as compared to
fiscal 2006. The Healthcare segment continued to experience strong demand for surgical tables both in the United States and
internationally. However, the growth in Healthcare segment’s capital revenues of 2.4% was partially offset by a decline in the Life Sciences
segment’s capital revenues of 5.2%. The decline in Life Sciences capital revenues was a result of strong price competition for capital
equipment being sold into the United States research market.
37

International revenues for fiscal 2007 amounted to $263.9 million, an increase of $29.2 million, or 12.4%, as compared to fiscal
2006. The increase in year-over-year international revenues was attributable to a 14.9% increase in capital revenues primarily within the
European and Canadian marketplaces. Within Europe, fiscal 2007 capital revenues reflect the continued success of surgical tables and
related accessories in the Healthcare segment and increases in the Life Sciences segment’s revenues from VHP technologies and water
systems. This increase was partially offset by a decrease in Asia Pacific and Latin America capital revenues in our Life Sciences segment
during fiscal 2007. The increase in international capital revenues was supplemented by an increase of 9.4% in recurring revenue streams year
over year.
United States revenues for fiscal 2007 amounted to $933.5 million, an increase of $7.9 million, or 0.9%, as compared to fiscal
2006. United States revenues were positively impacted by a 4.1% increase in recurring revenues, which were driven by increases in service
revenues in all segments. Year over year, United States capital revenues decreased 3.9%, reflecting fluctuating demand within the Healthcare
segment for sterile processing capital products generally associated with new construction projects and as a result of the strong price
competition experienced by the Life Sciences segment for capital equipment being sold into the United States research market.
Revenues by segment are further discussed in the section of MD&A titled, “Business Segment Results of Operations.”
Gross Profit. The following table compares our gross profit for the year ended March 31, 2007 to the year ended March 31, 2006:
Years Ended March 31,
ChangePercentChange(dollars in thousands) 2007 2006
Gross Profit:
Product $ 319,066 $ 314,386 $ 4,680 1.5%
Service 185,741 169,799 15,942 9.4%
Total Gross Profit $ 504,807 $ 484,185 $ 20,622 4.3%
Gross Profit Percentage:
Product 41.2% 41.4%
Service 43.8% 42.4%
Total Gross Profit Percentage 42.2% 41.7%
Our gross profit (margin) is affected by the volume, pricing, and mix of sales of our products and services, as well as the costs
associated with the products and services that are sold. Our gross margin increased to 42.2% for fiscal 2007. Overall, our fiscal 2007
margins increased due to improved productivity and pricing, which more than offset increases in labor and raw material costs. Gross
margins also benefited from a shift towards higher margin recurring revenue products within the Life Sciences segment. Gross margins for
fiscal 2007 include $1.1 million in share-based compensation expense as a result of the impact of SFAS No. 123R.
The gross margins related to our operating segments are further discussed in the section of MD&A titled, “Business Segment
Results of Operations.”
38

Operating Expenses. The following table compares our operating expenses for the year ended March 31, 2007 to the year ended
March 31, 2006:
Years Ended March 31,
ChangePercentChange(dollars in thousands) 2007 2006
Operating Expenses:
Selling, General, and Administrative $ 326,896 $ 315,582 $ 11,314 3.6%
Research and Development 33,626 33,597 29 0.1%
Restructuring Expenses 6,584 25,308 (18,724) NM
Total Operating Expenses $ 367,106 $ 374,487 $ (7,381) (2.0)%
NM – Not meaningful.
Compensation and benefit costs, fees for professional services, travel and entertainment, facilities costs, and other general and
administrative expenses are significant components of SG&A. As a percentage of total revenues, SG&A increased 10 basis points to 27.3%
for fiscal 2007 as compared to fiscal 2006. The increase reflects higher compensation and benefit costs net of lower costs associated with
consulting and marketing fees.
Research and development expenses as a percentage of total revenues decreased 10 basis points to 2.8% for fiscal 2007 as
compared to fiscal 2006. During both fiscal 2007 and fiscal 2006, research and development expenses were $33.6 million. Our research and
development initiatives continually emphasize new product development, product improvements, and the development of new
technological platform innovations. During fiscal 2007, our investments in research and development focused on, but were not limited to,
enhancing capabilities of delivery systems in the defense and industrial areas, sterile processing combination technologies, surgical tables and
accessories, and the area of emerging infectious agents such as Prions and Nanobacteria.
SG&A and research and development expenses for fiscal 2007 included $8.0 million and $0.8 million, respectively, in share-based
compensation expense as a result of the impact of the adoption of SFAS No. 123R.
Restructuring Expenses. We recognize restructuring expenses as they are incurred. We also evaluate the property, plant and equipment
associated with our restructuring actions for impairment. Asset impairment and accelerated depreciation expenses primarily relate to an
adjustment in the carrying value of the related facilities to their estimated fair value. In addition, the remaining useful lives of other property,
plant and equipment associated with the related operations were re-evaluated based on the respective plan, resulting in the acceleration of
depreciation and amortization of certain assets.
In fiscal 2007 and fiscal 2006, we recorded $4.9 million and $25.3 million in pre-tax restructuring expenses, respectively, for the
Fiscal 2006 Restructuring Plan. These restructuring expenses primarily related to the previously announced transfer of the Erie, Pennsylvania
manufacturing operations to Monterrey, Mexico and other restructuring actions, including the closure of a sales office, rationalization of
operations in Finland and the elimination of certain management positions. All such actions are intended to improve our cost structure.
These actions directly impacted more than 450 employees. Information regarding the impact of the restructuring actions on our
employee benefit plans is included in Note 10 to our consolidated financial statements titled, “Benefit Plans.”
During the third quarter of fiscal 2007, we adopted the European Restructuring Plan. As part of this plan, we closed two offices.
We also took steps to reduce the workforce in certain of our European support functions. These actions are intended to improve our cost
structure in Europe. Approximately 40 employees were directly impacted in various European locations.
39

In fiscal 2007, we recorded $1.7 million in pre-tax restructuring expenses related to the European Restructuring Plan. The
restructuring expenses were predominately for severance and related benefits, with restructuring expenses of $1.2 million and $0.5 million
related to the Healthcare and Life Sciences business segments, respectively.
The following tables summarize our total restructuring expenses for fiscal 2007 and fiscal 2006:
Year Ended March 31, 2007
(dollars in thousands)
Fiscal 2006Restructuring
Plan
EuropeanRestructuring
Plan Total
Severance, payroll and other related costs $ 2,027 $ 1,365 $ 3,392
Asset impairment and accelerated depreciation 2,606 105 2,711
Lease termination costs 150 233 383
Other 98 — 98
Total restructuring charges $ 4,881 $ 1,703 $ 6,584
Year Ended March 31, 2006
(dollars in thousands)
Fiscal 2006Restructuring
Plan
Asset impairment and accelerated depreciation $ 11,712
Severance, payroll and other related costs 2,038
Lease termination costs 135
Pension curtailment 2,335
OPEB acceleration 8,982
Other 106
Total restructuring charges $ 25,308
Liabilities related to restructuring activities are recorded as current liabilities on the accompanying Consolidated Balance Sheets
within “Accrued payroll and other related liabilities” and “Accrued expenses and other.” The following tables summarize our liabilities
related to restructuring activities:
Fiscal 2006 Restructuring Plan
March 31,2006
Fiscal 2007March 31,
2007Provision Payments
Severance and termination benefits(1) $ 1,941 $ 1,743 $ (1,885) $ 1,799
Lease termination obligations 135 150 (128) 157
Total $ 2,076 $ 1,893 $ (2,013) $ 1,956
(1) Does not include certain items that were paid in the period incurred.
40

European Restructuring Plan
March 31,2006
Fiscal 2007March 31,
2007Provision Payments
Severance and termination benefits $ — $ 1,365 $ (727) $ 638
Lease termination obligations — 233 (14) 219
Asset impairment — 105 — 105
Total $ — $ 1,703 $ (741) $ 962
Non-Operating Expenses, Net. Non-operating expense (income), net consists of interest expense on debt, offset by interest earned on
cash, cash equivalents, and short-term investment balances, and other miscellaneous income. The following table compares our net
non-operating expense for the year ended March 31, 2007 to the year ended March 31, 2006:
Years Ended March 31,
(dollars in thousands) 2007 2006 Change
Non-Operating Expenses:
Interest Expense $ 7,211 $ 4,935 $ 2,276
Interest and Miscellaneous Income (2,440) (3,355) 915
Non-Operating Expenses, Net $ 4,771 $ 1,580 $ 3,191
We had higher average outstanding debt levels and incurred higher interest rates on outstanding debt during fiscal 2007 as
compared to fiscal 2006 and, as a result, interest expense increased year over year. The higher debt levels in fiscal 2007 were used to fund
stock repurchases and working capital needs. Interest and other miscellaneous income decreased $0.9 million in fiscal 2007 as compared to
the prior year. This decrease was primarily due to receiving the final settlement of certain working capital adjustments and the resolution of
certain indemnification claims pursuant to the terms of the share purchase agreement with respect to our acquisition of Hamo Holding AG
(“Hamo”) in the first quarter of fiscal 2006. We completed the acquisition of Hamo during fiscal 2004.
Additional information regarding our outstanding debt is included in Note 7 to our consolidated financial statements titled,
“Debt,” and in the subsection of MD&A titled, “Liquidity and Capital Resources.”
Income Tax Expense. The following table compares our income tax expense and effective tax rates for the years ended March 31, 2007
and 2006:
Years Ended March 31,
ChangePercentChange(dollars in thousands) 2007 2006
Income Tax Expense $ 51,833 $ 45,172 $ 6,661 14.7%
Effective Income Tax Rate 39.0% 41.8%
The effective income tax rate for fiscal 2007 was 39.0% as compared to 41.8% for fiscal 2006. The lower effective income tax
rate for fiscal 2007 was primarily due to adjustments to recognize additional foreign tax credits. Additional information regarding our
income tax expense is included in Note 9 to our consolidated financial statements titled, “Income Taxes.”
Business Segment Results of Operations. As a result of organizational changes within the Life Sciences segment announced in fiscal 2008,
we changed our methodology for reporting segments. The Defense and Industrial business unit, which consists of businesses in early
development stages, is no longer a component of the Life Sciences segment. “Corporate and other,” which is presented separately, contains
41

the Defense and Industrial business unit plus costs that are associated with being a publicly traded company and certain other corporate
costs. These costs include executive office costs, Board of Directors compensation, shareholder services and investor relations, external
audit fees, and legacy pension and post-retirement benefit costs from our former Erie manufacturing operation. Fiscal 2007 and fiscal 2006
amounts have been reclassified to reflect the fiscal 2008 presentation.
We operate in three reportable business segments: Healthcare, Life Sciences, and STERIS Isomedix Services. Note 12 to our
consolidated financial statements titled, “Business Segment Information,” and Item 1, “Business” provide detailed information regarding each
business segment. The following table compares reporting business segment and Corporate and other revenues for the year ended
March 31, 2007 to the year ended March 31, 2006:
Years Ended March 31,
(dollars in thousands) 2007 2006 ChangePercentChange
Revenues:
Healthcare $ 845,674 $ 817,014 $ 28,660 3.5%
Life Sciences 209,658 207,078 2,580 1.2%
STERIS Isomedix Services 133,781 127,444 6,337 5.0%
Total reportable segments 1,189,113 1,151,536 37,577 3.3%
Corporate and other 8,294 8,749 (455) (5.2)%
Total Revenues $ 1,197,407 $ 1,160,285 $ 37,122 3.2%
Healthcare segment revenues were 70.6% of total revenues for the year ended March 31, 2007, as compared to 70.4% for the
year ended March 31, 2006. Healthcare segment revenues increased $28.7 million, or 3.5%, to $845.7 million for the year ended March 31,
2007, as compared to $817.0 million for the prior fiscal year. The increase in Healthcare revenues was primarily driven by a 4.7% increase in
recurring revenues. We generated increases in service and consumable revenues of 7.1% and 2.4%, respectively, as a result of strong service
revenues within the United States hospital market and increased demand for our consumable products in the United States and Canada.
Our Healthcare segment’s fiscal 2007 revenues were also positively impacted by a 2.3% increase in capital revenues driven by continued
strong sales of surgical tables both in the United States and internationally. This increase was partially offset by a decline in the sales of high
temperature sterile processing capital equipment. At March 31, 2007, our Healthcare segment’s backlog amounted to $63.8 million, as
compared to $62.0 million at March 31, 2006.
Life Sciences segment revenues represented 17.5% of total revenues for the year ended March 31, 2007, as compared to 17.8%
for the year ended March 31, 2006. Life Sciences segment revenues increased $2.6 million, or 1.2%, to $209.7 million for the year ended
March 31, 2007, as compared to $207.1 million for the prior fiscal year. The increase in Life Sciences revenues was driven by strong growth
in consumable products and service of 11.0% and 4.8%, respectively, partially offset by a 5.2% decrease in capital revenues. Fiscal 2007 Life
Sciences capital revenues were unfavorably impacted as a result of strong price competition for capital equipment being sold into the
United States research market. At March 31, 2007, our Life Sciences segment’s backlog amounted to $46.4 million, as compared to $42.5
million at March 31, 2006.
STERIS Isomedix Services segment revenues represented 11.2% of total revenues for the year ended March 31, 2007, as
compared to 11.0% for the year ended March 31, 2006. This segment experienced revenue growth of $6.3 million, or 5.0%, during fiscal
2007, as compared to fiscal 2006. This revenue growth was primarily attributable to increased demand from our core medical device
Customers and routine price increases.
42

The following table compares our reporting business segment and Corporate and other operating results for the year ended
March 31, 2007 to the year ended March 31, 2006:
Years Ended March 31,
(dollars in thousands) 2007 2006 ChangePercentChange
Operating Income (Loss):
Healthcare $ 122,468 $ 105,074 $ 17,394 16.6%
Life Sciences 10,953 4,841 6,112 NM
STERIS Isomedix Services 25,127 23,981 1,146 4.8%
Total reportable segments 158,548 133,896 24,652 18.4%
Corporate and other (20,847) (24,198) 3,351 (13.8)%
Total Operating Income $ 137,701 $ 109,698 $ 28,003 25.5%
NM – Not meaningful.
Segment operating income (loss) is calculated as the segment’s gross profit less direct expenses and indirect cost allocations,
which results in the full allocation of all distribution and research and development expenses, and the partial allocation of corporate costs.
The Corporate and other segment includes the gross profit and direct expenses of the Defense and Industrial business unit, as well as
certain unallocated corporate costs related to being a publicly traded company and legacy pension and post-retirement benefits, as
previously discussed. Corporate cost allocations are based on each segment’s percentage of revenues, headcount, or other variables in
relation to those of the total company.
In fiscal 2007, restructuring expenses of $6.2 million and $0.4 million were included in the operating income for Healthcare and
Life Sciences, respectively. In fiscal 2006, restructuring expenses of $24.8 million and $0.5 million were included in the operating income for
Healthcare and Life Sciences, respectively.
Our Healthcare segment’s operating income increased $17.4 million, or 16.6%, to $122.5 million for the year ended March 31,
2007 from $105.1 million during the prior fiscal year. Our Healthcare segment’s operating margins were 14.5% and 12.9%, respectively, for
the years ended March 31, 2007 and March 31, 2006. In fiscal 2007, this segment’s operating income includes restructuring expenses of
$4.9 million and $1.3 million related to the transfer of manufacturing operations from Erie, Pennsylvania to Monterrey, Mexico and the
European restructuring actions, respectively. Share-based compensation expenses of $6.7 million were also included in our Healthcare
segment’s fiscal 2007 operating income. In fiscal 2006, restructuring expenses primarily associated with the transfer of manufacturing
operations from Erie, Pennsylvania to Monterrey, Mexico of $24.8 million were included in the Healthcare segment’s operating income.
Operating income improved as a result of lower restructuring costs and improved leveraging of operating expense.
Our Life Sciences segment’s operating income was $11.0 million in fiscal 2007 as compared to $4.8 million in fiscal 2006. Our Life
Sciences segment’s operating margins were 5.2% and 2.3%, respectively, for the years ended March 31, 2007 and March 31, 2006. This
segment’s operating results benefited from increased volumes associated with higher margin consumable products and service offerings, as
well as productivity improvements and operating expense control. In fiscal 2007, our Life Sciences segment’s operating income includes
restructuring expenses of $0.4 million associated with the European restructuring actions and $2.0 million in share-based compensation
expense. The fiscal 2006 operating income includes approximately $0.5 million in restructuring expenses associated with the rationalization
of operations at the manufacturing facility in Finland.
STERIS Isomedix Services segment operating income increased $1.1 million, or 4.8%, to $25.1 million for the year ended
March 31, 2007 as compared to $24.0 million during the prior fiscal year. This segment’s operating margins were 18.8% for the years ended
43

March 31, 2007 and March 31, 2006. Fiscal 2007 operating margins improved as a result of increased volumes and normal contracted price
increases, but this improvement was offset by share-based compensation expense of $1.2 million. Operating margins of STERIS Isomedix
Services are greatly impacted by volume levels as the facilities operate with relatively high percentages of fixed costs.
LIQUIDITY AND CAPITAL RESOURCESThe following table summarizes significant components of our cash flows for the years ended March 31, 2008 and 2007:
Years Ended March 31,PercentChange(dollars in thousands) 2008 2007 Change
Operating activities:
Net income $ 77,106 $ 82,155 $ (5,049) (6.1)%
Non-cash items 67,540 62,123 5,417 8.7%
Changes in operating assets and liabilities (1,245) (48,538) 47,293 (97.4)%
Net cash provided by operating activities $ 143,401 $ 95,740 $ 47,661 49.8%
Investing activities:
Purchases of property, plant, equipment, and
intangibles, net $ (56,974) $ (49,024) $ (7,950) 16.2%
Proceeds from the sale of property, plant and
equipment 5,154 2,825 2,329 82.4%
Proceeds from the sale of discontinued operations — 2,927 (2,927) (100.0)%
Net cash used in investing activities $ (51,820) $ (43,272) $ (8,548) 19.8%
Financing activities:
Proceeds (payments) on long-term obligations, capital
leases, and credit facility, net $ 78,480 $ (14,667) $ 93,147 NM
Deferred financing fees and debt issuance costs (443) — (443) NM
Repurchases of common shares (177,171) (60,170) (117,001) 194.5%
Cash dividends paid to common shareholders (14,609) (11,766) (2,843) 24.2%
Stock option and other equity transactions, net 17,813 10,924 6,889 63.1%
Net cash used in financing activities $ (95,930) $ (75,679) $ (20,251) 26.8%
Debt-to-capital ratio 20.3% 11.6%
Free cash flow $ 91,581 $ 49,541
NM – Not meaningful.
44

Net Cash Provided by Operating Activities. The net cash provided by our operating activities was $143.4 million for the year ended
March 31, 2008 compared to $95.7 million for the year ended March 31, 2007. The following discussion summarizes the significant changes
in our operating cash flows:
• Non-cash items – Our non-cash items include depreciation, depletion, and amortization, losses on the disposal of property, plant,
equipment and intangibles, share-based compensation expense, changes in deferred income taxes, gains on the sale of discontinued
operations, and other items. Non-cash items were $67.5 million for fiscal 2008 compared to $62.1 million for fiscal 2007.
• Depreciation, depletion, and amortization – Depreciation, depletion, and amortization expense is the most significant
component of non-cash items. This expense totaled $62.8 million and $60.3 million for fiscal 2008 and 2007, respectively.
The $2.5 million increase in this expense was primarily the result of capital purchases in support of our research efforts
and increased material purchases for our STERIS Isomedix Services segment.
• Loss on the disposal of property, plant, equipment, and intangibles, net – We recorded losses of $5.8 million and $0.8
million for the disposal of property, plant, equipment, and intangibles in fiscal 2008 and fiscal 2007, respectively. In fiscal
2008, this expense primarily related to the impairment or disposal of certain assets related to the Fiscal 2008 Restructuring
Plan and the Fiscal 2006 Restructuring Plan. In fiscal 2007, this expense primarily related to the disposal of certain assets
included in the Fiscal 2006 Restructuring Plan.
• Share-based compensation expense – We recorded non-cash share-based compensation expense of $8.6 million and
$9.9 million for fiscal 2008 and fiscal 2007, respectively. The decline of $1.3 million reflects a reduction in the number of
stock options and restricted shares subject to amortization in the current fiscal year.
• Deferred income taxes – Our fiscal 2008 deferred income tax benefit of $10.2 million resulted primarily from share-based
compensation expense and depreciation and amortization of fixed assets and intangibles. Our fiscal 2007 deferred income
tax benefit of $10.1 million primarily resulted from the settlement of the fiscal 1997 and fiscal 1998 IRS audits and from
share-based compensation expense.
• Gain on the sale of discontinued operations – In fiscal 2007, we recorded a gain totaling $1.1 million for the October 31,
2005 sale of our freeze dryer product line.
• Working capital- Significant changes in our working capital for the year ended March 31, 2008 as compared to the prior fiscal year are
summarized below. Our discussion excludes the impact of foreign currency translation adjustments and balances acquired from business
acquisitions. Changes in our working capital used $1.2 million and $48.5 million in fiscal 2008 and fiscal 2007, respectively.
• Accounts receivable, net – Our net accounts receivable balances decreased $9.2 million in fiscal 2008 and increased $4.6
million during fiscal 2007. Our accounts receivable balances may change from period to period due to the timing of
revenues and Customer payments. The decrease in the accounts receivable balance was a result of improved collection
processes, evident in the decrease in days sales outstanding from 77 days at March 31, 2007 to 72 days at March 31,
2008.
• Inventories, net – Our net inventory balances increased $4.9 million and $16.9 million during fiscal 2008 and fiscal 2007,
respectively. Inventory balances in fiscal 2008 increased as a result of the impact of increased raw material costs, new
products, and higher order levels. The inventory increase in fiscal 2007 was primarily associated with the transfer of the
Erie, Pennsylvania manufacturing operations to Monterrey, Mexico. We increased inventory levels at both the Erie and
Monterrey facilities by $8.0 million during fiscal 2007 to ensure product would be consistently available for our Customers
during the transition.
• Other current assets – Our other current assets primarily consist of prepaid expenses for insurance, taxes, and other
general corporate items. Other current assets decreased $0.5 million during fiscal 2008 and increased $16.8 million during
45

fiscal 2007. The increase in fiscal 2007 reflects approximately $17.5 million of the tax payments made during the first
quarter of fiscal 2007 that remains on deposit with the IRS, subject to final resolution of certain matters under audit.
• Accounts payable, net – Our net accounts payable balances decreased $3.1 million and $12.0 million during fiscal 2008
and fiscal 2007, respectively, resulting in a cash flow change of $8.9 million. Cash flows related to accounts payable may
change from period to period due to varying payment due dates and other terms of our accounts payable obligations.
• Accruals and other, net – Our net accruals and other liabilities balances decreased $2.9 million and increased $1.7 million
during fiscal 2008 and fiscal 2007, respectively. In fiscal 2008, the decrease was primarily a result of recording deferred tax
assets for uncertain tax positions under FIN No. 48 and for unfunded pension and post-retirement benefit liabilities under
SFAS No. 158. In fiscal 2007, the increase was primarily due to increases in the accruals for compensation and benefit-
related liabilities, partially offset by a decrease in the accruals for other taxes not related to income.
Net Cash Used in Investing Activities. The net cash we used in investing activities totaled $51.8 million during fiscal 2008 compared
to $43.3 million during fiscal 2007. The following discussion summarizes the significant changes in our investing cash flows for the years
ended March 31, 2008 and 2007:
• Purchases of property, plant, equipment, and intangibles, net – Capital expenditures totaled $57.0 million during fiscal 2008 compared
to $49.0 million during fiscal 2007. Increased capital spending levels in fiscal 2008 resulted primarily from a planned expansion at one of
our STERIS Isomedix Services facilities.
• Proceeds from the sale of property, plant, equipment and intangibles – In fiscal 2008, these proceeds include $4.7 million we received in
the third quarter from the sale of our manufacturing facility located in Erie, Pennsylvania. In fiscal 2007, these proceeds include $2.4
million we received during the third quarter from the sale of a building located in Nogales, Arizona.
• Proceeds from the sale of discontinued operations – In fiscal 2007, we recorded additional proceeds of $2.9 million for the October 31,
2005 sale of the freeze dryer product line. We received these additional proceeds because we reached a final settlement with the
buyer for working capital changes and certain indemnifications.
Net Cash Used in Financing Activities. The net cash we used in financing activities totaled $95.9 million in fiscal 2008 compared to
$75.7 million for the prior fiscal year. The following discussion summarizes the significant changes in our financing cash flows for the years
ended March 31, 2008 and 2007:
• Proceeds (payments) on long-term obligations, capital leases, and credit facility, net – For the year ended March 31, 2008, we borrowed
$79.2 million, net, under our revolving credit facility and made payments of $0.7 million on our other long-term obligations. In fiscal
2007, we made payments of $13.0 million and $1.7 million, net, under our revolving credit facility and our other long-term obligations
and capital leases, respectively. The proceeds borrowed in fiscal 2008 were used to fund share repurchases and working capital changes.
We provide additional information about our debt structure in Note 7 to our consolidated financial statements titled, “Debt,” and in
the section of the MD&A titled, “Liquidity and Capital Resources” in the subsection titled, “Sources of Credit.”
• Deferred financing fees and debt issuance costs – In fiscal 2008, we paid fees of $0.4 million related to the amendment and restatement
of our revolving credit facility. This amount is being amortized over the term of the amended and restated agreement.
• Repurchases of Common Shares – The Company’s Board of Directors has provided authorization to repurchase our common shares.
During fiscal 2008, we paid for the repurchase of 6,600,550 common shares at an average purchase price of $26.84 per common share.
During fiscal 2007, we paid for the repurchase of 2,606,800 of our common shares at an average purchase price of $23.08 per common
share. We provide additional information about our common share repurchases in Note 14 to our consolidated financial statements
titled, “Repurchases of Common Shares.”
• Cash dividends paid to common shareholders – During fiscal year 2008, we paid total cash dividends of $14.6 million, or $0.23 per
outstanding common share. During fiscal year 2007, we paid total cash dividends of $11.8 million, or $0.18 per outstanding common
share.
46
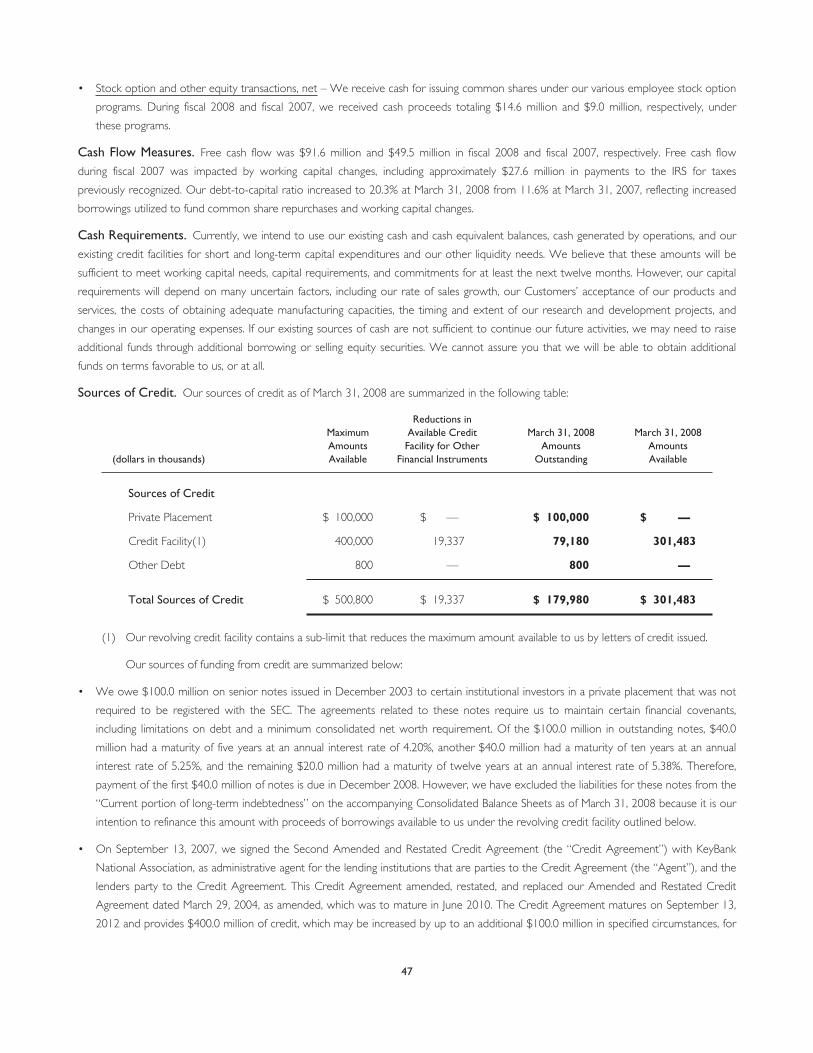
• Stock option and other equity transactions, net – We receive cash for issuing common shares under our various employee stock option
programs. During fiscal 2008 and fiscal 2007, we received cash proceeds totaling $14.6 million and $9.0 million, respectively, under
these programs.
Cash Flow Measures. Free cash flow was $91.6 million and $49.5 million in fiscal 2008 and fiscal 2007, respectively. Free cash flow
during fiscal 2007 was impacted by working capital changes, including approximately $27.6 million in payments to the IRS for taxes
previously recognized. Our debt-to-capital ratio increased to 20.3% at March 31, 2008 from 11.6% at March 31, 2007, reflecting increased
borrowings utilized to fund common share repurchases and working capital changes.
Cash Requirements. Currently, we intend to use our existing cash and cash equivalent balances, cash generated by operations, and our
existing credit facilities for short and long-term capital expenditures and our other liquidity needs. We believe that these amounts will be
sufficient to meet working capital needs, capital requirements, and commitments for at least the next twelve months. However, our capital
requirements will depend on many uncertain factors, including our rate of sales growth, our Customers’ acceptance of our products and
services, the costs of obtaining adequate manufacturing capacities, the timing and extent of our research and development projects, and
changes in our operating expenses. If our existing sources of cash are not sufficient to continue our future activities, we may need to raise
additional funds through additional borrowing or selling equity securities. We cannot assure you that we will be able to obtain additional
funds on terms favorable to us, or at all.
Sources of Credit. Our sources of credit as of March 31, 2008 are summarized in the following table:
(dollars in thousands)
MaximumAmountsAvailable
Reductions inAvailable CreditFacility for Other
Financial Instruments
March 31, 2008Amounts
Outstanding
March 31, 2008AmountsAvailable
Sources of Credit
Private Placement $ 100,000 $ — $ 100,000 $ —
Credit Facility(1) 400,000 19,337 79,180 301,483
Other Debt 800 — 800 —
Total Sources of Credit $ 500,800 $ 19,337 $ 179,980 $ 301,483
(1) Our revolving credit facility contains a sub-limit that reduces the maximum amount available to us by letters of credit issued.
Our sources of funding from credit are summarized below:
• We owe $100.0 million on senior notes issued in December 2003 to certain institutional investors in a private placement that was not
required to be registered with the SEC. The agreements related to these notes require us to maintain certain financial covenants,
including limitations on debt and a minimum consolidated net worth requirement. Of the $100.0 million in outstanding notes, $40.0
million had a maturity of five years at an annual interest rate of 4.20%, another $40.0 million had a maturity of ten years at an annual
interest rate of 5.25%, and the remaining $20.0 million had a maturity of twelve years at an annual interest rate of 5.38%. Therefore,
payment of the first $40.0 million of notes is due in December 2008. However, we have excluded the liabilities for these notes from the
“Current portion of long-term indebtedness” on the accompanying Consolidated Balance Sheets as of March 31, 2008 because it is our
intention to refinance this amount with proceeds of borrowings available to us under the revolving credit facility outlined below.
• On September 13, 2007, we signed the Second Amended and Restated Credit Agreement (the “Credit Agreement”) with KeyBank
National Association, as administrative agent for the lending institutions that are parties to the Credit Agreement (the “Agent”), and the
lenders party to the Credit Agreement. This Credit Agreement amended, restated, and replaced our Amended and Restated Credit
Agreement dated March 29, 2004, as amended, which was to mature in June 2010. The Credit Agreement matures on September 13,
2012 and provides $400.0 million of credit, which may be increased by up to an additional $100.0 million in specified circumstances, for
47

borrowings and letters of credit. The Credit Agreement provides a multi-currency borrowing option and may be used for general
corporate purposes. A floating interest rate is applied to amounts borrowed based on the greater of (1) the Prime Rate established by
the Agent, or (2) the Federal Funds effective rate plus 0.50%, or a fixed rate may be applied based on the Eurodollar Rate or other
defined currency rate, plus, in each case, a margin based on our leverage ratio. Interest is payable quarterly or at the end of the interest
period, if shorter. The Credit Agreement also requires the payment of a facility fee on the total facility commitment amount, which is
determined based on our leverage ratio. We may prepay floating rate loans without paying a penalty, but we may be required to pay a
penalty for prepaying fixed rate loans. The Credit Agreement also allows us to make short term swing loan borrowings not to exceed
$35.0 million, with an interest rate equal to the Agent’s cost of funds plus a margin. The Credit Agreement requires us to maintain
compliance with certain financial covenants, including a maximum leverage ratio and a minimum interest coverage ratio. Our obligations
under the Credit Agreement are unsecured but guaranteed by our material domestic subsidiaries.
At March 31, 2008, we had $301.5 million of funding available from our $400.0 million Credit Agreement. The Credit Agreement
includes a sub-limit that reduces the maximum amount available to us by letters of credit issued.
• At March 31, 2008, our other debt balance includes industrial development revenue bonds with variable interest rates based on the
bank/marketing agent’s demand note index. We issued letters of credit to support these bonds. The letters of credit have
reimbursement agreements with the same financial covenants as our credit facility. At March 31, 2008, we had a balance outstanding of
$0.8 million under the industrial development revenue bonds. These bonds had an interest rate of 2.30%.
At March 31, 2008, we were in compliance with all financial covenants associated with our indebtedness. We provide additional
information regarding our debt structure and payment obligations in the section of the MD&A titled, “Liquidity and Capital Resources” in
the subsection titled, “Contractual and Commercial Commitments” and in Note 7 to our consolidated financial statements titled, “Debt.”
CAPITAL EXPENDITURES
Our capital expenditure program is a component of our long-term strategy. This program includes, among other things,
investments in new and existing facilities, business expansion projects, and information technology enhancements. During fiscal 2008, our
capital expenditures amounted to $57.0 million. We use cash provided by operating activities and our cash and cash equivalent balances to
fund capital expenditures. At March 31, 2008, we expect to incur amounts for future capital expenditures consistent with our historical
trends. However, we cannot assure you that future capital expenditures will remain consistent, as future events can occur which could
cause anticipated capital expenditure levels to change.
48

CONTRACTUAL AND COMMERCIAL COMMITMENTS
We had no material commitments for capital expenditures as of March 31, 2008. At March 31, 2008, we had commitments
under non-cancelable operating leases totaling $57.0 million.
Our contractual obligations and commercial commitments as of March 31, 2008 are presented in the following tables.
Commercial commitments include standby letters of credit, letters of credit required as security under our self-insured risk retention
policies, and other potential cash outflows resulting from an event that requires us to fulfill a commitment.
Payments due by March 31,
(in thousands) 2009 2010 2011 20122013 andthereafter Total
Contractual Obligations:
Debt $ 40,700 $ 100 $ — $ — $ 139,180 $ 179,980
Operating leases 16,755 12,867 9,187 5,177 13,049 57,035
Purchase obligations 12,252 15,328 9,891 — — 37,471
Other obligations 248 382 393 405 1,289 2,717
Total Contractual Obligations $ 69,955 $ 28,677 $ 19,471 $ 5,582 $ 153,518 $ 277,203
The table above includes only the principal amounts of our contractual obligations. We provide information about the interest
component of our long-term debt in the subsection of MD&A titled, “Liquidity and Capital Resources,” and in Note 7 to our consolidated
financial statements titled, “Debt.”
Debt payments due by March 31, 2009 in the table above include the first $40.0 million of senior notes due in December 2008.
However, we have excluded the liabilities for these notes from the “Current portion of long-term indebtedness” on the accompanying
Consolidated Balance Sheets as of March 31, 2008 because it is our intention to refinance this amount with proceeds of borrowings
available to us under the revolving credit facility. We provide additional information regarding our debt obligations in the subsection of
MD&A titled, “Liquidity and Capital Resources,” and in Note 7 to our consolidated financial statements titled, “Debt.”
Purchase obligations shown in the table above relate to minimum purchase commitments with suppliers for raw materials
purchases.
Contractual obligations shown in the table above exclude FIN No. 48 liabilities. We have a $17.5 million tax payment that
remains on deposit with the IRS subject to the determination of final assessments. In the fourth quarter of fiscal 2008, we reached an
agreement with the IRS on all material tax matters for fiscal 1999 through fiscal 2001. We anticipate reaching an agreement with the IRS on
all material tax matters for fiscal 2002 through fiscal 2005 during fiscal 2009. We believe that the amount on deposit with the IRS will be
sufficient to settle all material matters with the IRS for fiscal 1999 through fiscal 2005 and thus no additional future cash payments will be
required related to these tax years. The IRS will begin its audit of fiscal 2006 and fiscal 2007 during fiscal 2009. Because of the high degree
of uncertainty regarding the timing of future cash outflows, we are currently not able to make a reliable estimate of any future cash
payments to respective taxing authorities that may be required as a result of future audits.
Contractual obligations shown in the table above exclude benefit payments to participants under our defined benefit pension
plans and other post-retirement medical benefit plan. We summarize the estimated benefit payments to be made by the plans over the
next ten years in Note 10 to our consolidated financial statements titled, “Benefit Plans.” The table also excludes contributions we make to
our defined benefit pension plans and our defined contribution plan. Our future contributions to these plans depend on many uncertain
49

factors including future returns on the defined benefit plan assets and the amount and timing of employee and discretionary employer
contributions to the defined contribution plan. We provide additional information about our defined benefit pension plans, defined
contribution plan, and other post-retirement medical benefit plan in Note 10 to our consolidated financial statements titled, “Benefit Plans.”
Amount of Commitment Expiring March 31,
(in thousands) 2009 2010 2011 20122013 &Beyond Totals
Commercial Commitments:
Performance and surety bonds $ 11,423 $ 3,889 $ 81 $ — $ 2,387 $ 17,780
Letters of credit as security for self-insured risk
retention policies 8,161 821 — — — 8,982
Total Commercial Commitments $ 19,584 $ 4,710 $ 81 $ — $ 2,387 $ 26,762
CRITICAL ACCOUNTING POLICIES, ESTIMATES, AND ASSUMPTIONS
The following subsections describe our most critical accounting policies, estimates, and assumptions. Our accounting policies are
more fully described in Note 1 to our consolidated financial statements titled, “Nature of Operations and Summary of Significant
Accounting Policies.”
Estimates and Assumptions. Our discussion and analysis of financial condition and results of operations is based on our consolidated
financial statements that were prepared in accordance with United States generally accepted accounting principles. We make certain
estimates and assumptions that we believe to be reasonable when preparing these financial statements. These estimates and assumptions
involve judgments with respect to numerous factors that are difficult to predict and are beyond management’s control. As a result, actual
amounts could be materially different from these estimates. We periodically review these critical accounting policies, estimates, assumptions,
and the related disclosures with the Audit and Financial Policy Committee of the Company’s Board of Directors.
Revenue Recognition. We recognize revenue for products when ownership passes to the Customer, which is based on contract or
shipping terms, and for services when the service is provided to the Customer. We also have individual Customer contracts that offer
extended payment terms and/or discounts.
In transactions that contain multiple elements, such as when products, maintenance, or other services are combined, we
recognize revenues for each element based on its relative fair value. This accounting method does not change the total revenues of a
transaction, but may affect when we recognize revenue.
We offer preventative maintenance agreements to our Customers with contract terms from one to five years, which require us
to maintain and repair our products during this time. Amounts received under these Customer contracts are initially recorded as deferred
service revenues and then recognized as service revenues ratably over the contract term.
We classify shipping and handling amounts billed to Customers in sales transactions as revenues.
Allowance for Doubtful Accounts Receivable. We maintain an allowance for uncollectible accounts receivable for estimated losses in
the collection of amounts owed by Customers. We estimate the allowance based on analyzing a number of factors, including amounts
written off historically, Customer payment practices, and general economic conditions. We also analyze significant Customer accounts on a
regular basis and record a specific allowance when we become aware of a specific Customer’s inability to pay. As a result, the related
accounts receivable are reduced to an amount that we reasonably believe is collectible. These analyses require a considerable amount of
judgment. If the financial condition of our Customers worsens, or economic conditions change, we may be required to make changes to
our allowance for doubtful accounts receivable.
50

Allowance for Sales Returns. We maintain an allowance for sales returns based upon known returns and estimated returns for both
capital equipment and consumables. We estimate returns of capital equipment and consumables based upon recent historical experience
less the estimated inventory value of the returned goods.
Inventories and Reserves. Inventories are stated at the lower of their cost or market value. We determine cost based upon a
combination of the last-in, first-out (“LIFO”) and first-in, first-out (“FIFO”) cost methods. We determine the LIFO inventory value at the end
of the year based on inventory levels and costs at that time. For inventories valued using the LIFO method, we believe that the use of the
LIFO method results in a matching of current costs and revenues. Inventories valued using the LIFO method represented approximately
39.3% and 47.7% of total inventories at March 31, 2008 and 2007, respectively. Inventory costs include material, labor, and overhead. If we
had used only the FIFO method of inventory costing, inventories would have been $16.3 million and $15.6 million higher than those
reported at March 31, 2008 and 2007, respectively.
We review the net realizable value of inventory on an ongoing basis, considering factors such as deterioration, obsolescence, and
other items. We record an allowance for estimated losses when the facts and circumstances indicate that particular inventories will not be
usable. If future market conditions vary from those projected, and our estimates prove to be inaccurate, we may be required to write-down
inventory values and record an adjustment to cost of revenues.
Asset Impairment Losses. Property, plant, equipment, and identifiable intangible assets (except for goodwill and intangible assets with
indefinite lives) are reviewed for impairment when events and circumstances indicate that the carrying value of such assets may not be
recoverable. Impaired assets are recorded at the lower of carrying value or estimated net realizable value. We conduct this review on an
ongoing basis and, if impairment exists, we record the loss in the Consolidated Statements of Income during that period.
When we evaluate assets for impairment, we make certain judgments and estimates, including interpreting current economic
indicators and market valuations, evaluating our strategic plans with regards to operations, historical and anticipated performance of
operations, and other factors. If we incorrectly anticipate these factors, or unexpected events occur, our operating results could be
materially affected.
Restructuring-Related Expenses and Accruals. We have recorded specific accruals in connection with plans for restructuring
elements of our business. These accruals include estimates principally related to employee separation costs, the closure and/or consolidation
of facilities, contractual obligations and the valuation of certain assets including property, plant and equipment. Actual amounts could differ
from the original estimates.
We review our restructuring-related accruals on a quarterly basis and changes to plans are appropriately recognized in the
Consolidated Statements of Income in the period the change is identified. Note 2 to our consolidated financial statements titled,
“Restructuring,” summarizes our restructuring plans.
Purchase Accounting and Goodwill. We account for business acquisitions using the purchase method of accounting. This method
requires us to record the assets and liabilities of the business acquired at their estimated fair values as of the acquisition date. Any excess of
the cost of the acquisition over the fair value of the net tangible and intangible assets acquired is recorded as goodwill. We use valuation
specialists with expertise in performing appraisals to assist us in determining the fair values of assets acquired and liabilities assumed. These
valuations require us to make estimates and assumptions, especially with respect to intangible assets. We generally amortize our intangible
assets over their useful lives. We do not amortize goodwill, but we evaluate it annually for impairment. Therefore, the allocation of
acquisition costs to intangible assets and goodwill has a significant impact on future operating results.
We evaluate the recoverability of recorded goodwill amounts annually, or when evidence of potential impairment exists. This
evaluation requires a valuation of the underlying business. The valuation can be significantly affected by estimates of future performance and
discount rates over a relatively long period of time, market price valuation multiples, allocation of assets, and other factors. Using different
assumptions in our valuation could result in significantly different estimates of the fair value of the reporting units, which could result in the
impairment of goodwill.
51

We performed our annual goodwill impairment evaluation as of October 31, 2007. As a result of this evaluation, we determined
that there was no impairment of the recorded goodwill amounts.
Income Taxes. Our provision for income taxes is based on our current period income, changes in deferred income tax assets and
liabilities, income tax rates, changes in uncertain tax benefits, and tax planning opportunities available to us in the various jurisdictions in
which we operate. Tax laws are complex and subject to different interpretations by the taxpayer and the respective governmental taxing
authorities. We use significant judgment in determining our annual effective income tax rate and evaluating our tax positions. We prepare
and file tax returns based on our interpretation of tax laws and regulations, and we record estimates based on these judgments and
interpretations. We cannot be sure that the tax authorities will agree with all of the tax positions taken by us. The actual income tax liability
for each jurisdiction in any year can, in some instances, be ultimately determined several years after the tax return is filed and the financial
statements are published.
We adopted the provisions of FIN No. 48 effective April 1, 2007. We evaluate our tax positions using the recognition threshold
and measurement attribute in accordance with this interpretation. We determine whether it is more-likely-than-not that a tax position will
be sustained upon examination, including resolution of related appeals or litigation processes, based on the technical merits of the position.
In evaluating whether a tax position has met the more-likely-than-not recognition threshold, we presume that the position will be examined
by the appropriate taxing authority and that the taxing authority will have full knowledge of all relevant information. A tax position that
meets the more-likely-than-not recognition threshold is measured at the largest amount of benefit that is greater than 50 percent likely of
being realized upon ultimate settlement. The appropriate unit of account for determining what constitutes an individual tax position, and
whether the more-likely-than-not recognition threshold is met for a tax position, is a matter of judgment based on the individual facts and
circumstances of that position evaluated in light of all available evidence. We review and adjust our tax estimates periodically because of
ongoing examinations by and settlements with the various taxing authorities, as well as changes in tax laws, regulations and precedent.
We recognize deferred tax assets and liabilities based on the differences between the financial statement carrying amounts and
the tax basis of assets and liabilities. We regularly review our deferred tax assets for recoverability and establish a valuation allowance based
on historical taxable income, projected future taxable income, the expected timing of the reversals of existing temporary differences, and
the implementation of tax planning strategies. If we are unable to generate sufficient future taxable income in certain tax jurisdictions, or if
there is a material change in the effective income tax rates or time period within which the underlying temporary differences become
taxable or deductible, we could be required to increase our valuation allowance, which would increase our effective income tax rate and
could result in an adverse impact on our consolidated financial position, results of operations, or cash flows.
We believe that adequate accruals have been made for income taxes. Differences between the estimated and actual amounts
determined upon ultimate resolution, individually or in the aggregate, are not expected to have a material adverse effect on our
consolidated financial position, but could possibly be material to our consolidated results of operations or cash flow for any one period.
Additional information regarding income taxes is included in Note 9 to our consolidated financial statements titled, “Income
Taxes.”
Self-Insurance Liabilities. We record a liability for self-insured risk retention for general and product liabilities, workers’ compensation,
and automobile liabilities. We maintain a captive insurance company, Global Risk Insurance Company (“GRIC”), to fund losses. We engage
a third-party actuary that uses GRIC’s historical loss experience and actuarial methods to determine the estimated liability. This liability
includes estimated amounts for both loss reserves and incurred but not reported claims. We review the assumptions and the valuations
provided by third-party actuaries annually to determine the adequacy of our estimated self-insurance risk-retention liability. Losses greater
than the limits established by GRIC are covered by third-party insurance policies, which are subject to the terms and conditions of those
policies. Our accrual for the GRIC self-insured risk retention as of March 31, 2008 and 2007 was $16.4 million and $16.6 million,
respectively.
We are also self-insured for employee medical claims. We estimate a liability for incurred but not reported claims based upon
recent claims experience.
52

Our self-insured liabilities contain uncertainties because management and the third-party actuaries must make assumptions and
apply judgments to estimate the ultimate cost to settle reported claims and claims incurred but not reported as of the balance sheet date. If
actual results are not consistent with these assumptions and judgments, we could be exposed to additional costs in subsequent periods.
Warranty Reserves. We generally offer a limited one-year parts and labor warranty on our capital equipment. The specific terms and
conditions of warranties vary depending on the product sold and the country where we conduct business. We record a liability for the
estimated cost of product warranties in the period revenues are recognized. We estimate warranty expenses based primarily on historical
warranty claim experience and the terms of specific Customer contracts. While we have extensive quality programs and processes and
actively monitor and evaluate the quality of suppliers, actual warranty experience could be different from our estimates. If actual product
failure rates, material usage, or service costs are different from our estimates, we may have to record an adjustment to the estimated
warranty liability. As of March 31, 2008 and 2007, we had accrued $7.8 million and $5.9 million, respectively, for warranty exposures.
Contingencies. We are involved in various patent, product liability, consumer, commercial, environmental, tax proceedings and claims,
governmental investigations, and other legal and regulatory proceedings that arise from time to time in the course of our business. We
record a liability for such contingencies to the extent we conclude that their occurrence is both probable and estimable. We consider many
factors in making these assessments, including the professional judgment of experienced members of management and our legal counsel.
We have made estimates as to the likelihood of unfavorable outcomes and the amounts of such potential losses. In our opinion, the
ultimate outcome of these proceedings and claims is not anticipated to have a material adverse affect on our consolidated financial position,
results of operations, or cash flows. However, the ultimate outcome of litigation is unpredictable and actual results could be materially
different from our estimates. We record expected recoveries under applicable insurance contracts when we are assured of recovery. Refer
to Part I, Item 3, “Legal Proceedings” for additional information.
We are subject to taxation from United States federal, state, and local, and foreign jurisdictions. Tax positions are settled primarily
through the completion of audits within each individual tax jurisdiction or the closing of a statute of limitation. Changes in applicable tax law
or other events may also require us to revise past estimates. The IRS routinely conducts audits of our federal income tax returns. In the
fourth quarter of fiscal 2008, we reached a settlement with the IRS on all material tax matters for fiscal 1999 through fiscal 2001. The IRS
began an audit of fiscal 2002 through fiscal 2005 in fiscal 2007. We anticipate reaching a settlement with the IRS for all material tax matters
for fiscal 2002 through fiscal 2005 during fiscal 2009. In addition, the IRS will begin its audit of fiscal 2006 and fiscal 2007 in fiscal 2009. We
remain subject to tax authority audits in various other jurisdictions in which we operate. If we prevail in matters for which accruals have
been recorded, or are required to pay amounts in excess of recorded accruals, our effective income tax rate in a given financial statement
period could be materially impacted.
Additional information regarding our commitments and contingencies is included in Note 11 to our consolidated financial
statements titled, “Commitments and Contingencies.”
Benefit Plans. We provide defined benefit pension plans for certain current and former manufacturing and plant administrative personnel
throughout the world as determined by collective bargaining agreements or employee benefit standards set at the time of acquisition of
certain businesses. As of March 31, 2008, we sponsored defined benefit pension plans for eligible participants in the United States and
Switzerland. In addition, as of March 31, 2008, we sponsored an unfunded post-retirement medical benefit plan for two groups of United
States employees, including the same employees who receive pension benefits under the United States defined benefit pension plans.
Benefits under this plan include retiree life insurance and retiree medical insurance, including prescription drug coverage and Medicare
supplemental coverage.
Employee pension and post-retirement medical benefit plans are a significant cost of conducting business and represent
obligations that will be settled far in the future and therefore, require us to use estimates and make certain assumptions to calculate the
expense and liabilities related to the plans. Changes to these estimates and assumptions can result in different expense and liability amounts.
Future actual experience may be significantly different from our current expectations. We believe that the most critical assumptions used to
determine net periodic benefit costs and projected benefit obligations are the expected long-term rate of return on plan assets and the
53

discount rate. A summary of significant assumptions used to determine the March 31, 2008 projected benefit obligations and the fiscal 2008
net periodic benefit costs is as follows:
Defined Benefit Pension PlansOther Post-
Retirement PlanU.S. Switzerland
Funding Status Funded Funded Unfunded
Assumptions used to determine March 31, 2008
projected benefit obligations:
Discount rate 6.00% 3.75% 6.00%
Expected return on plan assets 8.00% 4.50% NA
Assumptions used to determine fiscal 2008
net periodic benefit costs:
Discount rate 6.00% 3.00% 6.00%
Expected return on plan assets 8.00% 5.00% NA
NA – Not applicable.
We develop our expected long-term rate of return on plan assets assumptions by evaluating input from third-party professional
advisors, taking into consideration the asset allocation of the portfolios and the long-term asset class return expectations. Generally, net
periodic benefit costs and projected benefit obligations both increase as the expected long-term rate of return on plan assets assumption
decreases. Holding all other assumptions constant, lowering the expected long-term rate of return on plan assets assumption for our
funded defined benefit pension plans by 50 basis points would have increased the fiscal 2008 benefit costs by $0.2 million. The projected
benefit obligations at March 31, 2008 would remain about the same.
We develop our discount rate assumptions by evaluating input from third-party professional advisors, taking into consideration
the current yield on country specific investment grade long-term bonds which provide for similar cash flow streams as our projected benefit
obligations. Generally, the projected benefit obligations and the net periodic benefit costs both increase as the discount rate assumption
decreases. Holding all other assumptions constant, lowering the discount rate assumption for our defined benefit pension plans and for the
other post-retirement plan by 50 basis points would have increased the fiscal 2008 net periodic benefit costs by approximately $0.3 million
and would have increased the projected benefit obligations by approximately $7.2 million at March 31, 2008.
We have made assumptions regarding healthcare costs in computing our other post-retirement benefit obligation. The assumed
rates of increase generally decline ratably over a five year-period from the assumed current year healthcare cost trend rate to the assumed
long-term healthcare cost trend rate. A 100 basis point change in the assumed healthcare cost trend rate (including medical, prescription
drug and long-term rates) would have had the following effect at March 31, 2008:
100 Basis Point
(dollars in thousands) Increase Decrease
Effect on total service and interest cost components $ 334 $ (306)
Effect on postretirement benefit obligation 5,984 (5,447)
Effective March 31, 2007, we adopted the recognition and measurement requirements of Statement of Financial Accounting
Standards No. 158 (“SFAS No. 158”), “Employers’ Accounting for Defined Benefit Pension and Other Postretirement Plans, an
54

Amendment of FASB Statements No. 87, 88, 106, and 132(R).” SFAS No. 158 requires us to recognize in our balance sheets an asset for
the overfunded status or a liability for the underfunded status of defined benefit pension and post-retirement benefit plans. This amount is
measured as the difference between the fair value of plan assets and the benefit obligation (the projected benefit obligation for pension
plans and the accumulated post-retirement benefit obligation for other post-retirement benefit plans). Changes in the funded status of the
plans are recorded in other comprehensive income in the year they occur. SFAS No. 158 also requires plan assets and obligations to be
measured as of the employer’s balance sheet date. As a result of adopting SFAS No. 158, we reduced shareholders’ equity by $11.7 million
($3.9 million net of taxes) at March 31, 2007. We already measured the plan assets and obligations as of our fiscal year-end balance sheet
date and, therefore, that provision did not impact our consolidated financial statements. The adoption of SFAS No. 158 had no impact on
our Consolidated Statements of Income for fiscal 2008, fiscal 2007, or fiscal 2006, did not affect our compliance with any financial covenants
contained in debt agreements, and is not expected to affect our operating results in future periods. Note 10 to our consolidated financial
statements titled, “Benefit Plans,” contains additional information about the impact of adopting this new standard.
The Medicare Prescription Drug, Improvement and Modernization Act of 2003 (the “Act”) was signed into law on December 8,
2003. The Act provides a prescription drug benefit for Medicare beneficiaries, a benefit we provide to Medicare eligible retirees covered by
our post-retirement benefits plan. Our actuary concluded that the prescription drug benefit provided in our post-retirement benefit plan is
considered to be actuarially equivalent to the benefit provided under the Act and thus qualifies for the subsidy under the Act. The expected
future subsidies reduced our accumulated post-retirement benefit obligation by approximately $12.0 million at March 31, 2008. We
collected subsidies totaling approximately $0.9 million during fiscal 2008, which reduced our fiscal 2008 post-retirement medical payments.
We did not collect any subsidies in fiscal 2007 or fiscal 2006.
Share-Based Compensation. On April 1, 2006, we adopted the provisions of SFAS No. 123R using the modified prospective method.
Accordingly, we measure the estimated fair value for all share-based compensation awards, including grants of employee stock options at
the grant date and recognize the related compensation expense over the period in which the share-based compensation vests. Prior to
adoption, we accounted for share-based payments in accordance with Accounting Principles Board Opinion No. 25 (“APB No. 25”),
“Accounting for Stock Issued to Employees.” In accordance with the transition method we elected, prior periods were not restated for the
effect of compensation expense calculated under SFAS No. 123R. We selected the Black-Scholes-Merton option pricing model as the most
appropriate method for determining the estimated fair value of our share-based compensation awards. The adoption of SFAS No. 123R
reduced our income before income taxes by $8.6 million and $9.9 million in fiscal 2008 and fiscal 2007, respectively. The adoption of SFAS
No. 123R reduced our net income by $5.4 million and $6.1 million, or approximately $0.09 and $0.08 per basic and diluted share in fiscal
2008, and $0.09 per basic and diluted share in fiscal 2007. SFAS No. 123R also required us to classify the benefits of tax deductions in
excess of recognized compensation costs of $3.2 million and $1.9 million as a financing cash flow in fiscal 2008 and fiscal 2007, respectively,
rather than as an operating cash flow, but did not have an impact on our total cash flows. Note 15 to our consolidated financial statements
titled, “Share-Based Compensation,” contains additional information about the impact of adopting this new standard.
RECENTLY ISSUED ACCOUNTING STANDARDS IMPACTING THE COMPANY
Recently issued accounting standards that are relevant to us are presented in Note 1 to our consolidated financial statements
titled, “Nature of Operations and Summary of Significant Accounting Policies.”
INFLATION
Our business has not been significantly impacted by the overall effects of inflation. We monitor the prices we charge for our
products and services on an ongoing basis and plan to adjust those prices to take into account future changes in the rate of inflation.
However, we may not be able to completely offset the impact of inflation.
55

FORWARD-LOOKING STATEMENTS
This Annual Report on Form 10-K may contain statements concerning certain trends, expectations, forecasts, estimates, or other
forward-looking information affecting or relating to STERIS or our industry that are intended to qualify for the protections afforded
“forward-looking statements” under the Private Securities Litigation Reform Act of 1995 and other laws and regulations. Forward-looking
statements speak only as to the date of this report, and may be identified by the use of forward-looking terms such as “may,” “will,”
“expects,” “believes,” “anticipates,” “plans,” “estimates,” “projects,” “targets,” “forecasts,” “continues,” “seeks,” or the negative of such terms
or other variations on such terms or comparable terminology. Many important factors could cause actual results to be materially different
from those in the forward-looking statements including, without limitation, disruption of production or supplies, changes in market
conditions, political events, pending or future claims or litigation, competitive factors, technology advances, actions of regulatory agencies,
and changes in government regulations or the application or interpretation thereof. Many of these important factors are outside of our
control. No assurances can be provided as to any outcome from litigation, regulatory actions, administrative proceedings, governmental
investigations, warning letters, cost reductions, business strategies, or future financial results. Unless legally required, we do not undertake to
update or revise any forward-looking statements even if events make clear that any projected results, actions, or impact, express or implied,
will not be realized. Other potential risks and uncertainties that could cause actual results to be materially different from those in the
forward-looking statements include, without limitation, (a) the potential for increased pressure on pricing, raw material, and energy costs
that leads to erosion of profit margins, (b) the possibility that market demand will not develop for new technologies, products or
applications, or that our business initiatives will take longer, cost more or produce lower benefits than anticipated, (c) the possibility that
application of or compliance with laws, court rulings, regulations, certifications or other requirements or standards may delay or prevent
new product introductions, affect the production and marketing of existing products, or otherwise affect our performance, results, or value,
(d) the potential of international unrest, or effects of fluctuations in currencies, tax assessments or rates, raw material costs, benefit or
retirement plan costs, or other regulatory compliance costs, (e) the possibility of reduced demand, or reductions in the rate of growth in
demand, for our products and services, (f) the possibility that anticipated growth, alignment, cost savings, or other results may not be
achieved, or that transition, labor, competition, timing, execution, regulatory, governmental, product, service, personnel, or other issues or
risks associated with our business, industry, or other issues, activities, or initiatives may adversely impact our performance, results, or value,
and (g) those risks described in our Annual Report on Form 10-K under Item 1A, “Risk Factors.”
56

Item 7A. Quantitative and Qualitative Disclosures About Market Risk
In the ordinary course of business, we are exposed to various risks, including, but not limited to, interest rate, foreign currency,
and commodity risks. These risks are described in the sections that follow.
INTEREST RATE RISK
We are exposed to changes in interest rates as a result of financing through various fixed and floating rate debt instruments. As of
March 31, 2008, we had $100.0 million in fixed rate senior notes outstanding and $0.8 million outstanding under other debt arrangements.
We also had $79.2 million outstanding on our revolving credit facility. Based on March 31, 2008 floating rate debt levels, a 100 basis point
change in interest rates would impact our interest expense by approximately $0.8 million annually. We monitor our interest rate risk, but
do not engage in any hedging activities using derivative financial instruments. For additional information regarding our debt structure, refer to
Note 7 to our Consolidated Financial Statements titled, “Debt.”
FOREIGN CURRENCY RISK
We are exposed to the impact of foreign currency exchange fluctuations. This foreign currency exchange risk arises when we
conduct business in a currency other than the U.S. dollar. For most international operations, local currencies have been determined to be
the functional currencies. The financial statements of international subsidiaries are translated to their U.S. dollar equivalents at end-of-period
exchange rates for assets and liabilities and at average currency exchange rates for revenues and expenses. Translation adjustments for
international subsidiaries whose local currency is their functional currency are recorded as a component of accumulated other
comprehensive income (loss) within shareholders’ equity. Transaction gains and losses arising from fluctuations in currency exchange rates
on transactions denominated in currencies other than the functional currency are recognized in the Consolidated Statements of Income.
Since we operate internationally and approximately 23.2% of our fiscal 2008 revenues and 33.7% of our fiscal 2008 cost of revenues were
generated outside the United States, foreign currency exchange rate fluctuations can significantly impact our financial position, results of
operations, and competitive position.
We enter into foreign currency forward contracts to hedge assets and liabilities denominated in foreign currencies, including inter-
company transactions. We do not use derivative financial instruments for speculative purposes. At March 31, 2008, we held foreign
currency forward contracts to sell 4.0 million euros and 160.0 million Japanese yen and to buy 4.0 million euros and 3.6 million Canadian
dollars, which matured subsequent to March 31, 2008.
COMMODITY RISK
We are dependent on basic raw materials, sub-assemblies, components, and other supplies used in our operations. Our financial
results could be affected by the availability and changes in prices of these materials. Some of these materials are sourced from a limited
number of suppliers. These materials are also key source materials for our competitors. Therefore, if demand for these materials rises, we
may experience increased costs and/or limited supplies. As a result, we may not be able to acquire key production materials on a timely
basis, which could impact our ability to produce products and satisfy incoming sales orders on a timely basis. In addition, the costs of these
materials can rise suddenly and result in significantly higher costs of production. We believe that we have adequate primary and secondary
sources of supply in each of our key materials and energy sources. Where appropriate, we enter into long-term supply contracts as a basis
to guarantee a reliable supply.
57

Item 8. Financial Statements and Supplementary Data
INDEX TO FINANCIAL STATEMENTS AND FINANCIAL STATEMENT SCHEDULE
Page
Report of Management 59
Report of Independent Registered Public Accounting Firm 60
Consolidated Financial Statements:
Consolidated Balance Sheets 61
Consolidated Statements of Income 62
Consolidated Statements of Cash Flows 63
Consolidated Statements of Shareholders’ Equity 64
Notes to Consolidated Financial Statements 65
Financial Statement Schedule:
Schedule II – Valuation and Qualifying Accounts 106
58

REPORT OF MANAGEMENT
Board of Directors and Shareholders
STERIS Corporation
Management of STERIS Corporation (the “Company”) is responsible for the preparation of the consolidated financial statements
and disclosures included in this Annual Report. Management believes that the consolidated financial statements and disclosures have been
prepared in accordance with accounting principles generally accepted in the United States and that any amounts included herein which are
based on estimates of the expected effects of events and transactions have been made with sound judgment and approved by qualified
personnel. The opinion of Ernst & Young LLP, an independent registered public accounting firm, on the financial statements is included
herein.
Management of the Company is responsible for establishing and maintaining adequate internal control over financial reporting as
defined in Exchange Act Rule 13a-15(f).
Management has used the criteria established in Internal Control-Integrated Framework issued by the Committee of Sponsoring
Organizations of the Treadway Commission (the “COSO criteria”) to evaluate the effectiveness of internal control over financial reporting
as of March 31, 2008.
Based on this evaluation under the COSO criteria, management has concluded that the Company’s internal control over financial
reporting was effective as of March 31, 2008. There were no material weaknesses in internal control over financial reporting identified by
management.
The Audit and Financial Policy Committee of the Board of Directors of the Company is composed of directors who are not
officers of the Company. It meets regularly with members of management, internal auditors, and the representatives of the independent
registered public accounting firm to discuss the adequacy of the Company’s internal control over financial reporting, financial statements,
and the nature, extent, and results of the audit effort. Management reviews with the Audit and Financial Policy Committee all of the
Company’s significant accounting policies and assumptions affecting the results of operations. Both the independent registered public
accounting firm and the internal auditors have direct access to the Audit and Financial Policy Committee without the presence of
management.
/s/ WALTER M ROSEBROUGH, JR.Walter M Rosebrough, Jr.
President and Chief Executive Officer
/s/ MICHAEL J. TOKICH
Michael J. TokichSenior Vice President and Chief Financial Officer
May 30, 2008
59

REPORT OF INDEPENDENT REGISTERED PUBLIC ACCOUNTING FIRM
Board of Directors and Shareholders
STERIS Corporation
We have audited the accompanying consolidated balance sheets of STERIS Corporation and subsidiaries as of March 31, 2008
and 2007, and the related consolidated statements of income, shareholders’ equity, and cash flows for each of the three years in the period
ended March 31, 2008. Our audits also included the financial statement schedule listed in the Index at Item 15(a) (2). These financial
statements and schedule are the responsibility of STERIS Corporation and subsidiaries’ management. Our responsibility is to express an
opinion on these financial statements and schedule based on our audits.
We conducted our audits in accordance with the standards of the Public Company Accounting Oversight Board (United States).
Those standards require that we plan and perform the audit to obtain reasonable assurance about whether the financial statements are free
of material misstatement. An audit includes examining, on a test basis, evidence supporting the amounts and disclosures in the financial
statements. An audit also includes assessing the accounting principles used and significant estimates made by management, as well as
evaluating the overall financial statement presentation. We believe that our audits provide a reasonable basis for our opinion.
In our opinion, the consolidated financial statements referred to above present fairly, in all material respects, the consolidated
financial position of STERIS Corporation and subsidiaries at March 31, 2008 and 2007, and the consolidated results of their operations and
their cash flows for each of the three years in the period ended March 31, 2008, in conformity with U.S. generally accepted accounting
principles. Also, in our opinion, the related financial statement schedule, when considered in relation to the basic financial statements taken
as a whole, presents fairly in all material respects the information set forth therein.
As discussed in Note 9 to the consolidated financial statements, effective April 1, 2007 STERIS Corporation and subsidiaries
changed its method for accounting for uncertain tax positions. As discussed in Note 10, effective March 31, 2007, STERIS Corporation and
subsidiaries changed its method of accounting for pension and other postretirement benefits. Also, as discussed in Note 15, effective
April 1, 2006 STERIS Corporation and subsidiaries changed its method for accounting for share-based compensation.
We have also audited, in accordance with the standards of the Public Company Accounting Oversight Board (United States), the
effectiveness of STERIS Corporation and subsidiaries’ internal control over financial reporting as of March 31, 2008, based on criteria
established in Internal Control-Integrated Framework issued by the Committee of Sponsoring Organizations of the Treadway Commission,
and our report dated May 28, 2008 expressed an unqualified opinion thereon.
/s/ ERNST & YOUNG LLP
Cleveland, Ohio
May 28, 2008
60

STERIS CORPORATION AND SUBSIDIARIES
CONSOLIDATED BALANCE SHEETS(in thousands)
March 31, 2008 2007
Assets
Current assets:
Cash and cash equivalents $ 51,868 $ 52,296
Accounts receivable (net of allowances of $9,396 and $9,911, respectively) 249,814 251,207
Inventories, net 147,210 131,997
Deferred income taxes 29,033 14,560
Prepaid expenses and other current assets 35,451 34,660
Total current assets 513,376 484,720
Property, plant and equipment, net 384,642 388,899
Goodwill and intangibles, net 337,980 332,947
Other assets 3,294 2,604
Total assets $ 1,239,292 $ 1,209,170
Liabilities and shareholders’ equity
Current liabilities:
Current portion of long-term indebtedness $ 700 $ 777
Accounts payable 75,532 76,184
Accrued income taxes 23,039 18,761
Accrued payroll and other related liabilities 59,243 59,003
Accrued expenses and other 71,845 62,674
Total current liabilities 230,359 217,399
Long-term indebtedness 179,280 100,800
Deferred income taxes, net 5,902 17,826
Other liabilities 117,599 98,853
Total liabilities $ 533,140 $ 434,878
Commitments and contingencies (see note 11)
Serial preferred shares, without par value, 3,000 shares authorized; no shares
issued or outstanding — —
Common shares, without par value, 300,000 shares authorized;
70,040 shares issued; 59,263 and 64,982 shares outstanding, respectively 231,566 224,974
Common shares held in treasury, 10,777 and 5,058 shares, respectively (279,841) (122,508)
Retained earnings 721,331 667,267
Accumulated other comprehensive income 33,096 4,559
Total shareholders’ equity 706,152 774,292
Total liabilities and shareholders’ equity $ 1,239,292 $ 1,209,170
See notes to consolidated financial statements.
61

STERIS CORPORATION AND SUBSIDIARIES
CONSOLIDATED STATEMENTS OF INCOME(in thousands, except per share amounts)
Years Ended March 31, 2008 2007 2006
Revenues:Product $ 812,058 $ 773,569 $ 759,839Service 453,032 423,838 400,446
Total revenues 1,265,090 1,197,407 1,160,285Cost of revenues:Product 486,941 454,503 445,453Service 254,192 238,097 230,647
Total cost of revenues 741,133 692,600 676,100
Gross profit 523,957 504,807 484,185Operating expenses:Selling, general, and administrative 348,035 326,896 315,582Research and development 36,916 33,626 33,597Restructuring expenses 15,461 6,584 25,308
Total operating expenses 400,412 367,106 374,487
Income from continuing operations 123,545 137,701 109,698Non-operating expenses:Interest expense 5,979 7,211 4,935Interest and miscellaneous income (2,233) (2,440) (3,355)
Total non-operating expenses, net 3,746 4,771 1,580
Income from continuing operations before income taxexpense 119,799 132,930 108,118
Income tax expense 42,693 51,833 45,172
Net income from continuing operations 77,106 81,097 62,946Discontinued operations:Income from discontinued operations, net of tax — — 1,109Gain on the sale of discontinued operations, net of tax — 1,058 6,234
Net income $ 77,106 $ 82,155 $ 70,289
Basic earnings per common share:Income from continuing operations $ 1.22 $ 1.24 $ 0.92Income from discontinued operations $ — $ 0.02 $ 0.11
Net income $ 1.22 $ 1.26 $ 1.03
Diluted earnings per common share:Income from continuing operations $ 1.20 $ 1.23 $ 0.91Income from discontinued operations $ — $ 0.02 $ 0.11
Net income $ 1.20 $ 1.25 $ 1.02
Cash dividends declared per common share outstanding $ 0.23 $ 0.18 $ 0.16
See notes to consolidated financial statements.
62

STERIS CORPORATION AND SUBSIDIARIES
CONSOLIDATED STATEMENTS OF CASH FLOWS(in thousands)
Years Ended March 31, 2008 2007 2006
Operating activities:Net income $ 77,106 $ 82,155 $ 70,289Adjustments to reconcile net income to net cash provided by operating
activities:Depreciation, depletion, and amortization 62,778 60,257 57,919Deferred and other noncurrent income taxes (10,160) (10,114) (7,552)Share-based compensation expense 8,617 9,937 —Tax benefit from stock options exercised — — 2,455Loss on the disposal of property, plant, equipment, and
intangibles, net 5,793 841 —Gain on the sale of discontinued operations, net of tax — (1,058) (6,234)Other items 512 2,260 615
Changes in operating assets and liabilities, excluding the effects ofbusiness acquisitions:Accounts receivable, net 9,173 (4,571) 2,819Inventories, net (4,903) (16,905) (9,943)Other current assets 539 (16,777) (6,953)Accounts payable (3,120) (12,031) 20,303Accruals and other, net (2,934) 1,746 27,796Assets of discontinued operations — — 39,047Liabilities of discontinued operations — — (28,606)
Net cash provided by operating activities 143,401 95,740 161,955Investing activities:Purchases of property, plant, equipment, and intangibles, net (56,974) (49,024) (51,010)Purchases of property, plant, equipment, and intangibles, net for
discontinued operations — — (160)Proceeds from the sale of property, plant, equipment, and intangibles 5,154 2,825 —Proceeds from the sale of discontinued operations — 2,927 22,111Investments in businesses, net of cash acquired — — (7,165)
Net cash used in investing activities (51,820) (43,272) (36,224)Financing activities:Proceeds (payments) under credit facility, net 79,180 (12,980) 11,780Payments on long-term obligations and capital leases (700) (1,687) (4,708)Repurchases of common shares (177,171) (60,170) (84,153)Cash dividends paid to common shareholders (14,609) (11,766) (10,937)Deferred financing fees and debt issuance costs (443) — (217)Tax benefit from stock options exercised 3,194 1,927 —Stock option and other equity transactions, net 14,619 8,997 11,834
Net cash used in financing activities (95,930) (75,679) (76,401)Effect of exchange rate changes on cash and cash equivalents 3,921 2,775 (145)
(Decrease) increase in cash and cash equivalents (428) (20,436) 49,185Cash and cash equivalents at beginning of year 52,296 72,732 23,547
Cash and cash equivalents at end of year $ 51,868 $ 52,296 $ 72,732
See notes to consolidated financial statements.
63

STERIS CORPORATION AND SUBSIDIARIES
CONSOLIDATED STATEMENTS OF SHAREHOLDERS’ EQUITY(in thousands)
Common Shares Treasury SharesRetainedEarnings
AccumulatedOther
ComprehensiveIncome (Loss)
TotalShareholders’
EquityNumber Amount Number Amount
Balance at March 31, 2005 69,627 $ 219,638 413 $ (7,981) $ 537,526 $ 6,455 $ 755,638Comprehensive income:
Net income — — — — 70,289 — 70,289Minimum pension liability, net
of taxes of $480 — — — — — (240) (240)Foreign currency translation
adjustment — — — — — (13,989) (13,989)Total comprehensive income — — — — — — 56,060
Repurchases of common shares (3,364) — 3,364 (84,153) — — (84,153)Issued under equity compensation
programs 713 (3,278) (713) 15,042 — — 11,764Tax benefit of stock options
exercised — 2,455 — — — — 2,455Cash dividends – $0.16 per common
share — — — — (10,937) — (10,937)Balance at March 31, 2006 66,976 218,815 3,064 (77,092) 596,878 (7,774) 730,827Comprehensive income:
Net income — — — — 82,155 — 82,155Minimum pension liability
adjustment prior toadopting SFAS No. 158,net of taxes of $113 — — — — — (556) (556)
Unrealized loss on investments — — — — — (4) (4)Foreign currency translation
adjustment — — — — — 16,808 16,808Total comprehensive income — — — — — — 98,403
Repurchases of common shares (2,607) — 2,607 (60,170) — — (60,170)Issued under equity compensation
programs 613 4,232 (613) 14,754 — — 18,986Tax benefit of stock options
exercised — 1,927 — — — — 1,927Cash dividends – $0.18 per common
share — — — — (11,766) — (11,766)Adjustment recognized upon
adoption of SFAS No. 158, netof taxes of $7,767 — — — — — (3,915) (3,915)
Balance at March 31, 2007 64,982 224,974 5,058 (122,508) 667,267 4,559 774,292Adjustment recognized upon
adoption of FIN No. 48 — — — — (8,433) — (8,433)Comprehensive income:
Net income — — — — 77,106 — 77,106SFAS No. 158 net actuarial
losses and transitionobligation, net of taxes of$2,169 — — — — — (3,601) (3,601)
Unrealized loss on investments — — — — — (189) (189)Foreign currency translation
adjustment — — — — — 32,327 32,327Total comprehensive income — — — — — — 105,643
Repurchases of common shares (6,600) — 6,600 (177,171) — — (177,171)Issued under equity compensation
programs 881 3,398 (881) 19,838 — — 23,236Tax benefit of stock options
exercised — 3,194 — — — — 3,194Cash dividends – $0.23 per common
share — — — — (14,609) — (14,609)Balance at March 31, 2008 59,263 $231,566 10,777 $ (279,841) $721,331 $ 33,096 $706,152
See notes to consolidated financial statements.
64

STERIS CORPORATION AND SUBSIDIARIES
NOTES TO CONSOLIDATED FINANCIAL STATEMENTS(dollars in thousands, except per share amounts)
1. NATURE OF OPERATIONS AND SUMMARY OF SIGNIFICANT ACCOUNTING POLICIES
Nature of Operations. STERIS Corporation, an Ohio corporation, together with its subsidiaries, develops, manufactures, and markets
infection prevention, contamination control, microbial reduction, and surgical support products and services for healthcare, pharmaceutical,
scientific, research, industrial, and governmental Customers throughout the world. As used in this Annual Report, STERIS Corporation and
its subsidiaries together are called “STERIS,” the “Company,” “we,” “us,” or “our,” unless otherwise noted.
As a result of organizational changes within the Life Sciences segment announced in fiscal 2008, we changed our methodology for
reporting segments. The Defense and Industrial business unit, which contains businesses in early development stages, will no longer be a
component of the Life Sciences segment. “Corporate and other,” which is presented separately, contains the Defense and Industrial
business unit plus costs that are associated with being a publicly traded company and certain other corporate costs. These costs include
executive office costs, Board of Directors compensation, shareholder services and investor relations, external audit fees, and legacy pension
and post-retirement benefit costs from our former Erie manufacturing operation. Fiscal 2007 and fiscal 2006 amounts have been reclassified
to reflect the fiscal 2008 presentation.
We operate in three reportable business segments: Healthcare, Life Sciences, and STERIS Isomedix Services (“Isomedix”). We
describe our operating segments in Note 12. Our fiscal year ends on March 31. References in this Annual Report to a particular “year” or
“year-end” mean our fiscal year. The significant accounting policies applied in preparing the accompanying consolidated financial statements
of the Company are summarized below:
Principles of Consolidation. We use the consolidation method to report our investment in our subsidiaries. Consolidation means that
we combine the accounts of our wholly-owned subsidiaries with our accounts. Therefore, the accompanying consolidated financial
statements include the accounts of the Company and its wholly-owned subsidiaries. We eliminate inter-company accounts and transactions
when we consolidate these accounts.
Use of Estimates. We make certain estimates and assumptions when preparing financial statements according to accounting principals
generally accepted in the United States that affect the reported amounts of assets and liabilities at the financial statement dates and the
reported amounts of revenues and expenses for the years presented. These estimates and assumptions involve judgments with respect to
many factors that are difficult to predict and are beyond our control. Actual results could be materially different from these estimates. We
revise the estimates and assumptions as new information becomes available.
Reclassifications. We have reclassified certain prior year amounts for comparative purposes. These reclassifications primarily relate to
operations that have been classified as discontinued operations and did not affect consolidated net income for the years presented. We
provide additional information regarding these reclassifications in Note 12, “Business Segment Information” and Note 16, “Business
Dispositions.” We have also presented “Common shares held in treasury” separately as a reduction to “Total shareholders’ equity” in the
accompanying Consolidated Balance Sheets, and separately as “Treasury Shares” in the accompanying Consolidated Statements of
Shareholders’ Equity.
Cash Equivalents and Supplemental Cash Flow Information. Cash equivalents are all highly liquid investments with a maturity of
three months or less when purchased.
65

STERIS CORPORATION AND SUBSIDIARIES
NOTES TO CONSOLIDATED FINANCIAL STATEMENTS(dollars in thousands, except per share amounts)
Information supplementing our Consolidated Statements of Cash Flows is as follows:
Years Ended March 31, 2008 2007 2006
Cash paid during the year for:
Interest $ 6,020 $ 7,462 $ 5,320
Income taxes 54,164 78,338 48,695
Cash received during the year for income tax refunds 967 1,028 947
Revenue Recognition. We recognize revenue for products when ownership passes to the Customer, which is based on contract or
shipping terms, and for services when the service is provided to the Customer. We also have individual Customer contracts that offer
extended payment terms, and/or discounts.
In transactions that contain multiple elements, such as when products, maintenance, or other services are combined, we
recognize revenues for each element based on its relative fair value. This accounting method does not change the total revenues of a
transaction, but may affect when we recognize revenue.
We offer preventative maintenance agreements to our Customers with contract terms of one to five years which require us to
maintain and repair our products during this time. Amounts received under these Customer contracts are initially recorded as deferred
service revenues and then recognized as service revenues ratably over the contract term.
Accounts Receivable. Accounts receivable are presented at their face amount, less allowances for sales returns and uncollectible
accounts. Accounts receivable consist of amounts billed and currently due from Customers and amounts earned but unbilled. We generally
do not require collateral on sales.
We maintain an allowance for uncollectible accounts receivable for estimated losses in the collection of amounts owed by
Customers. We estimate the allowance based on analyzing a number of factors, including amounts written off historically, Customer
payment practices, and general economic conditions. We also analyze significant Customer accounts on a regular basis and record a specific
allowance when we become aware of a specific Customer’s inability to pay. As a result, the related accounts receivable are reduced to an
amount that we reasonably believe is collectible.
We maintain an allowance for sales returns based upon known returns and estimated returns for both capital equipment and
consumables. We estimate returns of capital equipment and consumables based upon recent historical experience less the estimated
inventory value of the returned goods.
Inventories, net. Inventories are stated at the lower of their cost or market value. We determine cost based upon a combination of the
last-in, first-out (“LIFO”) and first-in, first-out (“FIFO”) cost methods. For inventories valued using the LIFO method, we believe that the use
of the LIFO method results in a matching of current costs and revenues. Inventories valued using the LIFO method represented
approximately 39.3% and 47.4% of total inventories at March 31, 2008 and 2007, respectively. Inventory costs include material, labor, and
overhead. If we had used only the FIFO method of inventory costing, inventories would have been $16,318 and $15,636 higher than those
reported at March 31, 2008 and 2007, respectively.
We review the net realizable value of inventory on an ongoing basis, considering factors such as deterioration, obsolescence, and
other items. We record an allowance for estimated losses when the facts and circumstances indicate that particular inventories will not be
66

STERIS CORPORATION AND SUBSIDIARIES
NOTES TO CONSOLIDATED FINANCIAL STATEMENTS(dollars in thousands, except per share amounts)
usable. If future market conditions vary from those projected, and our estimates prove to be inaccurate, we may be required to write-down
inventory values and record an adjustment to cost of revenues.
Property, Plant, and Equipment. Our property, plant, and equipment consists of land and land improvements, buildings and leasehold
improvements, machinery and equipment, information systems, radioisotope (cobalt-60), and construction in progress. Property, plant, and
equipment is presented at cost less accumulated depreciation and depletion. We capitalize additions and improvements. Repairs and
maintenance are charged to expense as they are incurred.
Land is not depreciated and construction in progress is not depreciated until placed in service. Depreciation of most assets is
computed on the cost less the estimated salvage value by using the straight-line method over the estimated remaining useful lives.
Depletion of radioisotope is computed using the annual decay factor of the material, which is similar to the sum-of-the-years-digits method.
We generally depreciate or deplete property, plant, and equipment over the useful lives presented in the following table:
Asset TypeUseful Life
(years)
Land improvements 3-40
Buildings and leasehold improvements 2-50
Machinery and equipment 3-35
Information Systems 2-17
Radioisotope 20
When we sell, retire, or dispose of property, plant, and equipment, we remove the asset’s cost and accumulated depreciation
from our Consolidated Balance Sheets. We recognize the net gain or loss on the sale or disposition in the Consolidated Statements of
Income in the period when the transaction occurs.
Interest. We capitalize interest costs incurred during the construction of long-lived assets. We capitalized interest costs of $380 and $393
for the years ended March 31, 2008 and 2007, respectively.
Total interest expense for the years ended March 31, 2008, 2007, and 2006 was $5,979, $7,211, and $4,935, respectively.
Identifiable Intangible Assets. Our identifiable intangible assets include product technology rights, trademarks, licenses, and Customer
relationships. We record these assets at cost, or when acquired as part of a business acquisition, at estimated fair value. We generally
amortize identifiable intangible assets over periods ranging from 5 to 20 years using the straight-line method.
Asset Impairment Losses. Property, plant, equipment, and identifiable intangible assets (except for goodwill and intangible assets with
indefinite lives) are reviewed for impairment when events and circumstances indicate that the carrying value of such assets may not be
recoverable. Impaired assets are recorded at the lower of carrying value or estimated net realizable value. We conduct this review on an
ongoing basis and, if an impairment exists, we record the loss in the Consolidated Statements of Income during that period.
Business Acquisitions. We account for business acquisitions using the purchase method of accounting. This method requires us to
record the assets and liabilities of the business acquired at their estimated fair values as of the acquisition date. Any excess of the cost of the
acquisition over the fair value of the net tangible and intangible assets acquired is recorded as goodwill. We include certain transaction costs
in determining the total cost of an acquisition. Operating results of the acquired businesses are included in the Consolidated Statements of
Income from the acquisition date.
67

STERIS CORPORATION AND SUBSIDIARIES
NOTES TO CONSOLIDATED FINANCIAL STATEMENTS(dollars in thousands, except per share amounts)
Business Dispositions. We summarize business dispositions in Note 16 to the consolidated financial statements. During fiscal 2006, we
sold our lyophilizer (freeze dryer) product line located in Cologne, Germany and accounted for this product line as a discontinued
operation in the consolidated financial statements. We have classified all historical financial information for this product line as a
discontinued operation. The disclosures presented in the accompanying consolidated financial statements refer to our continuing operations,
unless we state otherwise.
Goodwill. The goodwill presented in our Consolidated Balance Sheets represents the excess of the purchase price and related costs of
businesses or assets we acquired over the fair value assigned to the identifiable net assets acquired. We review goodwill and indefinite-lived
intangible assets at least annually for impairment. We use a two-step process to test goodwill for impairment. First, we compare the fair
value of a reporting unit with its carrying amount, including goodwill. If the fair value of a reporting unit exceeds its carrying amount, we do
not consider goodwill to be impaired. If the carrying amount of the reporting unit exceeds its fair value, the second step of the test is
performed to measure the amount of any impairment loss. We compare the implied fair value of the reporting unit’s goodwill to the
carrying amount of the goodwill. If the carrying amount of the reporting unit’s goodwill exceeds the fair value of that goodwill, we record an
impairment loss in the Consolidated Statements of Income for an amount equal to that excess, but not more than the carrying amount of
the goodwill.
Self-Insurance Liabilities. We record a liability for self-insured risks that we retain for general and product liabilities, workers’
compensation, and automobile liabilities based on actuarial calculations. We use a third-party actuary that uses our historical loss experience
and actuarial methods to calculate the liability. This liability includes estimates for both losses and incurred but not reported claims.
We are also self-insured for employee medical claims. We estimate a liability for incurred but not reported claims based upon
recent claims experience.
Benefit Plans. We maintain defined benefit pension and other post-retirement benefit plans for certain current and former employees.
We summarize our benefit plans in Note 10. We use actuaries to determine our costs and obligations related to these plans. These costs
and obligations are affected by assumptions including the discount rate, expected long-term rate of return on plan assets, the annual rate of
change in compensation for eligible employees, estimated changes in costs of healthcare benefits, and other factors. We evaluate the
assumptions used on an annual basis.
In September 2006, the Financial Accounting Standards Board (“FASB”) issued Statement of Financial Accounting Standards
No. 158 (“SFAS No. 158”), “Employers’ Accounting for Defined Benefit Pension and Other Postretirement Plans, an Amendment of FASB
Statements No. 87, 88, 106, and 132(R).” SFAS No. 158 requires us to recognize in our balance sheets an asset for the overfunded status
or a liability for the underfunded status of defined benefit pension and post-retirement benefit plans. This amount is measured as the
difference between the fair value of plan assets and the benefit obligation (the projected benefit obligation for pension plans and the
accumulated post-retirement benefit obligation for other post-retirement benefit plans). Changes in the funded status of the plans are
recorded in other comprehensive income in the year they occur. SFAS No. 158 also requires plan assets and obligations to be measured as
of the employer’s balance sheet date. We adopted the recognition and measurement requirements of SFAS No. 158 effective March 31,
2007. Prior to adopting SFAS No. 158, we accounted for our defined benefit pension and other post-retirement plans according to the
provisions of Statement of Financial Accounting Standards No. 87 (“SFAS No. 87”), “Employers’ Accounting for Pensions,” and Statement
of Financial Accounting Standards No. 106 (“SFAS No. 106”), “Employers’ Accounting for Postretirement Benefits Other Than Pensions.”
As a result of adopting SFAS No. 158, we reduced shareholders’ equity by $11,682, ($3,915 net of taxes) at March 31, 2007. We
already measure the plan assets and obligations as of our fiscal year-end balance sheet date and, therefore, that provision did not impact
our consolidated financial statements. The adoption of SFAS No. 158 had no impact on our Consolidated Statements of Income for fiscal
68

STERIS CORPORATION AND SUBSIDIARIES
NOTES TO CONSOLIDATED FINANCIAL STATEMENTS(dollars in thousands, except per share amounts)
2007 or for any prior period presented, did not affect our compliance with any financial covenants contained in debt agreements, and is not
expected to affect our operating results in future periods. Note 10 to our consolidated financial statements titled, “Benefit Plans,” contains
additional information about the impact of adopting this new standard.
Litigation and Contingencies. When we determine that it is probable that we have incurred a liability, and the amount of the liability
can be reasonably estimated, we record a charge to earnings. We consider the facts and circumstances, including any settlement offers,
associated with litigation and contingencies in making the determination.
Fair Value of Financial Instruments. Except for long-term debt, our financial instruments are highly liquid or have short-term maturities.
Therefore, the recorded value is approximately equal to the fair value. We estimate the fair value of our long-term debt using discounted
cash flow analyses, based on our current incremental borrowing rates for similar types of borrowing arrangements. We determined that the
recorded value of our long-term debt is approximately equal to the fair value at March 31, 2008 and 2007. The financial instruments we
hold could potentially expose us to a concentration of credit risk. We invest our excess cash in high-quality securities placed with major
banks and financial institutions and short-term United States government securities. We have established guidelines related to diversification
and maturities to maintain safety and liquidity.
Foreign Currency Translation. Most of our international operations use their local currency as their functional currency. The financial
statements of international subsidiaries are translated to their U.S. dollar equivalents at end-of-period currency exchange rates for assets and
liabilities and at average currency exchange rates for revenues and expenses. Translation adjustments for international subsidiaries whose
local currency is their functional currency are recorded as a component of accumulated other comprehensive income (loss) within
shareholders’ equity. Transaction gains and losses resulting from fluctuations in currency exchange rates on transactions denominated in
currencies other than the functional currency are recognized as incurred in the accompanying Consolidated Statements of Income, except
for certain inter-company balances designated as long-term investments.
Foreign Currency Forward Contracts. We enter into foreign currency forward contracts to hedge assets and liabilities denominated
in foreign currencies, including inter-company transactions. We do not use derivative financial instruments for speculative purposes. These
contracts are marked to market, with gains and losses recognized within “Selling, general, and administrative expenses” in the accompanying
Consolidated Statements of Income. At March 31, 2008, we held foreign currency forward contracts to sell 4.0 million euros and
160.0 million Japanese yen and to buy 4.0 million euros and 3.6 million Canadian dollars. At March 31, 2007, we held foreign currency
forward contracts to sell 15.7 million euros and to buy 2.0 million British pounds sterling.
Warranty. We accrue a liability for estimated product warranty expense at the time the related sale is recognized. We estimate warranty
expense based primarily on historical warranty claim experience and the terms of specific Customer contracts.
Shipping and Handling. We record shipping and handling costs in costs of revenues. Shipping and handling costs charged to Customers
are recorded as revenues in the period the product revenues are recognized.
Advertising Expenses. We expense advertising costs as incurred. We incurred $11,740, $13,170, and $15,301 of advertising costs during
the years ended March 31, 2008, 2007, and 2006, respectively.
Research and Development. We incur research and development costs associated with commercial products. We expense these costs
in the Consolidated Statements of Income as incurred. If a Customer reimburses us for research and development costs, the costs are
charged to the related contracts as costs of revenues.
69

STERIS CORPORATION AND SUBSIDIARIES
NOTES TO CONSOLIDATED FINANCIAL STATEMENTS(dollars in thousands, except per share amounts)
Income Taxes. Our income tax expense includes United States federal, state, and local, and foreign income taxes, and is based on
reported pre-tax income. We defer income taxes for all temporary differences between pre-tax financial and taxable income and between
the book and tax basis of assets and liabilities. We record valuation allowances to reduce net deferred tax assets to an amount that we
expect will more-likely-than-not be realized. In making such determination, we consider all available information, including scheduled
reversals of deferred tax liabilities, projected future taxable income, tax planning strategies, and recent financial operations. In the event we
were to determine that we would be able to realize our deferred income tax assets in the future in excess of their net recorded amount,
we would make an adjustment to the valuation allowance which would reduce the provision for income taxes and the effective tax rate.
In July 2006, the FASB issued Interpretation No. 48 (“FIN No. 48”), “Accounting for Uncertainty in Income Taxes—an
Interpretation of FASB Statement No. 109,” (“SFAS No. 109”). This interpretation provides guidance for the accounting for uncertainty in
income taxes recognized in our financial statements in accordance with SFAS No. 109. FIN No. 48 prescribes a recognition threshold and
measurement attribute for the financial statement recognition and measurement of a tax position taken or expected to be taken in a tax
return. FIN No. 48 also provides guidance on derecognition, classification, interest and penalties, accounting in interim periods, disclosure,
and transition. The evaluation of a tax position in accordance with FIN No. 48 is a two-step process. The first step is recognition: The
determination of whether or not it is more-likely-than-not that a tax position will be sustained upon examination, including resolution of any
related appeals or litigation processes, based on the technical merits of the position. In evaluating whether a tax position has met the more-
likely-than-not recognition threshold, we presume that the position will be examined by the appropriate tax authority and that the tax
authority will have full knowledge of all relevant information. The second step is measurement: A tax position that meets the more-likely-
than-not threshold is measured to determine the amount of benefit to recognize in the financial statements. The measurement process
requires the determination of the range of possible settlement amounts and the probability of achieving each of the possible settlements.
The tax position is measured at the largest amount of benefit that is greater than fifty percent likely of being realized upon ultimate
settlement. No tax benefits are recognized for positions that do not meet the more-likely-than-not threshold. Tax positions that previously
failed to meet the more-likely-than-not threshold should be recognized in the first subsequent financial reporting period in which that
threshold is met. Previously recognized tax positions that no longer meet the more-likely-than-not recognition threshold should be
derecognized in the first subsequent financial reporting period in which the threshold is no longer met. In addition, FIN No. 48 requires the
cumulative effect of adoption to be recorded as an adjustment to the opening balance of retained earnings. FIN No. 48 is effective for fiscal
years beginning after December 15, 2006. We adopted FIN No. 48 effective April 1, 2007, as required.
We describe income taxes and the impact of adopting FIN No. 48 further in Note 9 to our consolidated financial statements
titled, “Income Taxes.”
Share-Based Compensation. We summarize share-based compensation in Note 15. On April 1, 2006, we adopted the provisions of
Statement of Financial Accounting Standards No. 123 (revised 2004) (“SFAS No. 123R”), “Share-Based Payment,” and elected to use the
modified prospective transition method. As a result, we began recognizing compensation expense for share-based compensation in fiscal 2007.
Recently Issued Accounting Standards Impacting the Company. In December 2007, the FASB issued Statement of Financial
Accounting Standards No. 141 (revised 2007) (“SFAS No. 141R”), “Business Combinations.” SFAS No. 141R retains the purchase method
of accounting for acquisitions, but requires a number of changes, including changes in the way assets and liabilities are recognized in
purchase accounting. It also changes the recognition of assets acquired and liabilities assumed arising from contingencies, requires the
capitalization of in-process research and development at fair value, and requires the expensing of acquisition-related costs as incurred. SFAS
No. 141R will impact financial statements on the acquisition date and in subsequent periods, as well as prior to the acquisition date because
of the accounting treatment for acquisition-related costs. The provisions of SFAS No. 141R are to be applied prospectively to business
combinations completed in fiscal years beginning after December 15, 2008.
70

STERIS CORPORATION AND SUBSIDIARIES
NOTES TO CONSOLIDATED FINANCIAL STATEMENTS(dollars in thousands, except per share amounts)
In December 2007, the FASB issued Statement of Financial Accounting Standards No. 160 (“SFAS No. 160”), “Noncontrolling
Interests in Consolidated Financial Statements—Including an Amendment of ARB No. 51.” SFAS No. 160 recharacterizes minority interests
as noncontrolling interests and requires these interests to be classified as a separate component of equity in our consolidated financial
statements. Purchases or sales of equity interests that do not result in a change in control will be accounted for as equity transactions. In
addition, net income related to the noncontrolling interests will be included in our consolidated net income and, upon a loss of control, the
interest sold, as well as any interest retained, will be recorded at fair value with any gain or loss recognized in earnings. The provisions of
SFAS No. 160 will be applied prospectively, except for the presentation and disclosure requirements, which will apply retrospectively, and
are effective for the first annual reporting period beginning after December 15, 2008. We are currently evaluating the impact of adopting
SFAS No. 160 on our consolidated financial statements.
In February 2007, the FASB issued Statement of Financial Accounting Standards No. 159 (“SFAS No. 159”), “The Fair Value
Option for Financial Assets and Financial Liabilities—Including an Amendment of FASB Statement No. 115,” which permits entities to
choose to measure many financial instruments and certain other items at fair value that are not currently required to be measured at fair
value. Unrealized gains and losses arising after adoption are reported in earnings. SFAS No. 159 is effective for fiscal years beginning after
November 15, 2007. We are currently evaluating the impact of adopting SFAS No. 159 on our consolidated financial statements.
In September 2006, the FASB issued Statement of Financial Accounting Standards No. 157 (“SFAS No. 157”), “Fair Value
Measurements.” SFAS No. 157 defines fair value, establishes a framework for measuring fair value in generally accepted accounting
principles, and expands disclosures about fair value measurements. SFAS No. 157 does not require new fair value measurements, rather it
applies under existing accounting pronouncements that require or permit fair value measurements. SFAS No. 157 is effective for fiscal years
beginning after November 15, 2007. In November 2007, the FASB agreed to defer the effective date of SFAS No. 157 for non-financial
assets and liabilities until fiscal years and interim periods beginning after November 15, 2008. SFAS No. 157 is still effective for us beginning
April 1, 2008 for financial assets and liabilities. The provisions of SFAS No. 157 will be applied prospectively. We are currently evaluating the
impact of adopting SFAS No. 157 on our consolidated financial statements.
2. RESTRUCTURING
The following summarizes our restructuring plans announced in fiscal 2008, 2007, and 2006. We have recognized restructuring
expenses as incurred as required under the provisions of SFAS No. 146, “Accounting for Costs Associated with Exit or Disposal Activities.”
In addition, the property, plant and equipment associated with the related facilities were assessed for impairment under Statement of
Financial Accounting Standards No. 144 (“SFAS No. 144”), “Accounting for the Impairment or Disposal of Long-Lived Assets.” Asset
impairment and accelerated depreciation expenses primarily relate to inventory write-downs for rationalized products and adjustments in
the carrying value of the closed facilities to their estimated fair value. In addition, the remaining useful lives of other property, plant and
equipment associated with the related operations were reevaluated based on the respective plan, resulting in the acceleration of
depreciation and amortization of certain assets.
Fiscal 2008 Restructuring Plan. During the fourth quarter of fiscal 2008, we adopted a restructuring plan primarily focused on our
North American operations (the “Fiscal 2008 Restructuring Plan”). As part of this plan, we will close two sales offices and rationalize certain
products. We also took steps to reduce the workforce in certain support functions. Across all of our reporting segments approximately 90
employees, primarily located in North America, have been directly impacted. These restructuring actions are designed to enhance
profitability and improve efficiency by reducing ongoing operating costs.
In fiscal 2008, we recorded pre-tax expenses totaling $15,834 related to these actions, of which $11,750 was recorded as
restructuring expenses and $4,084 was recorded in cost of revenues, with restructuring expenses of $13,187, $1,505, $389, and $753 related
71

STERIS CORPORATION AND SUBSIDIARIES
NOTES TO CONSOLIDATED FINANCIAL STATEMENTS(dollars in thousands, except per share amounts)
to the Healthcare, Life Sciences, and Isomedix reporting segments, and Corporate and other, respectively. We do not expect to incur any
significant additional restructuring expenses related to this plan. However, we are continuing to evaluate all of our operations for additional
opportunities to improve performance, but we have not committed to any additional specific actions.
European Restructuring Plan. During the third quarter of fiscal 2007, we adopted a restructuring plan related to certain of our
European operations (the “European Restructuring Plan”). As part of this plan, we closed two sales offices. We also took steps to reduce
the workforce in certain of our European support functions. These actions are intended to improve our cost structure in Europe.
Approximately 40 employees were directly impacted in various European locations.
In fiscal 2008 and fiscal 2007, we recorded $85 and $1,703, respectively, in pre-tax restructuring expenses related to these
actions. The restructuring expenses are predominately for severance and related benefits and lease termination costs. Since the inception of
the plan we recorded expenses of $1,788, with restructuring expenses of $1,272 and $516 related to the Healthcare and Life Sciences
reporting segments, respectively.
We do not expect to incur any significant additional restructuring expenses related to this plan.
Fiscal 2006 Restructuring Plan. In fiscal 2008, fiscal 2007 and fiscal 2006, we recorded $3,626, $4,881 and $25,308 in pre-tax
restructuring expenses, respectively, primarily related to the previously announced transfer of the Erie, Pennsylvania manufacturing
operations to Monterrey, Mexico and other restructuring actions, including the closure of a sales office, rationalization of operations in
Finland and the elimination of certain management positions (the “Fiscal 2006 Restructuring Plan”). All such actions are intended to improve
our cost structure.
Since the inception of the plan, we recorded restructuring expenses of $33,815, with restructuring expenses of $33,401 and $414
related to the Healthcare and Life Sciences reporting segments, respectively.
These actions directly impacted more than 450 employees beginning in the fourth quarter of fiscal 2006 and continuing through
fiscal 2008. Additional information regarding the impact of the restructuring actions on the Company’s employee benefit plans is included in
Note 10, “Benefit Plans.”
We completed the transfer of manufacturing operations to Monterrey, Mexico during fiscal 2008 and do not expect to incur any
significant additional restructuring expenses related to this plan.
The following tables summarize our total restructuring charges for fiscal 2008, fiscal 2007, and fiscal 2006:
Fiscal Year Ended March 31, 2008
Fiscal 2008Restructuring
Plan (1)
EuropeanRestructuring
Plan
Fiscal 2006Restructuring
Plan Total
Severance, payroll and other related costs $ 5,213 $ (80) $ 203 $ 5,336
Asset impairment and accelerated
depreciation 5,106 — 2,885 7,991
Product rationalization 3,754 — — 3,754
Lease termination obligations 898 165 (13) 1,050
Other 863 — 551 1,414
Total restructuring charges $ 15,834 $ 85 $ 3,626 $ 19,545
(1) Includes $4,084 in charges recorded in cost of revenues on the accompanying Consolidated Statements of Income.
72

STERIS CORPORATION AND SUBSIDIARIES
NOTES TO CONSOLIDATED FINANCIAL STATEMENTS(dollars in thousands, except per share amounts)
Fiscal Year Ended March 31, 2007
EuropeanRestructuring
Plan
Fiscal 2006Restructuring
Plan Total
Severance, payroll and other related costs $ 1,365 $ 2,027 $ 3,392
Asset impairment and accelerated depreciation 105 2,606 2,711
Lease termination obligations 233 150 383
Other — 98 98
Total restructuring charges $ 1,703 $ 4,881 $ 6,584
Fiscal Year Ended March 31, 2006
Fiscal 2006Restructuring
Plan
Severance, payroll and other related costs $ 2,038
Asset impairment and accelerated depreciation 11,712
Lease termination obligation 135
Pension curtailment 2,335
OPEB acceleration 8,982
Other 106
Total restructuring charges $ 25,308
Liabilities related to restructuring activities are recorded as current liabilities on the accompanying Consolidated Balance Sheets
within “Accrued payroll and other related liabilities” and “Accrued expenses and other.” The following tables summarize the liabilities
related to our restructuring activities:
Fiscal 2008 Restructuring Plan
March 31,2007
Fiscal 2008
March 31,2008Provision
Payments/Impairments
Severance and termination benefits $ — $ 5,213 $ (969) $ 4,244
Asset impairments — 5,106 (4,614) 492
Product rationalization — 3,754 (3,754) —
Lease termination obligations — 898 — 898
Other — 863 (254) 609
Total $ — $ 15,834 $ (9,591) $ 6,243
73

STERIS CORPORATION AND SUBSIDIARIES
NOTES TO CONSOLIDATED FINANCIAL STATEMENTS(dollars in thousands, except per share amounts)
European Restructuring Plan
Fiscal 2008
March 31,2007 Provision
Payments/Impairments
March 31,2008
Severance and termination benefits $ 638 $ (68) $ (570) $ —
Lease termination obligations 219 160 (132) 247
Fixed asset impairments 105 — (105) —
Total $ 962 $ 92 $ (807) $ 247
European Restructuring Plan
March 31,2006
Fiscal 2007
March 31,2007Provision Payments
Severance and termination benefits $ — $ 1,365 $ (727) $ 638
Lease termination obligations — 233 (14) 219
Fixed asset impairments — 105 — 105
Total $ — $ 1,703 $ (741) $ 962
Fiscal 2006 Restructuring Plan
March 31,2007
Fiscal 2008
March 31,2008Provision Payments
Severance and termination benefits $ 1,799 $ 132 $(1,052) $ 879
Lease termination obligation 157 (13) (144) —
Total $ 1,956 $ 119 $(1,196) $ 879
Fiscal 2006 Restructuring Plan
March 31,2006
Fiscal 2007
March 31,2007Provision Payments
Severance and termination benefits (1) $ 1,941 $ 1,743 $ (1,885) $ 1,799
Lease termination obligation 135 150 (128) 157
Total $ 2,076 $ 1,893 $ (2,013) $ 1,956
(1) Does not include certain items that were paid in the period incurred.
74

STERIS CORPORATION AND SUBSIDIARIES
NOTES TO CONSOLIDATED FINANCIAL STATEMENTS(dollars in thousands, except per share amounts)
3. ACCUMULATED OTHER COMPREHENSIVE INCOME (LOSS)
Accumulated other comprehensive income (loss) shown in our Consolidated Statements of Shareholders’ Equity consists of the
following:
Years Ended March 31,
(in thousands) 2008 2007 2006
Unrecognized pension and post-retirement benefits costs, net of tax $ (14,286) $ (10,685) $ (6,214)
Unrealized loss on investments (193) (4) —
Cumulative foreign currency translation adjustment 47,575 15,248 (1,560)
$ 33,096 $ 4,559 $ (7,774)
4. GOODWILL AND INTANGIBLE ASSETS
In June 2001, the FASB issued Statement of Financial Accounting Standards No. 142 (“SFAS No. 142”), “Goodwill and Other
Intangible Assets.” Under this standard, goodwill and indefinite-lived intangible assets are not amortized, but are subject to annual
impairment testing. Other finite-lived intangible assets are amortized over their estimated useful lives. We performed our annual goodwill
impairment testing during the third quarter of fiscal 2008. This analysis resulted in the conclusion that there had been no impairment of the
recorded goodwill amounts.
Changes to the carrying amount of goodwill for the years ended March 31, 2008 and 2007 were as follows:
HealthcareSegment
Life SciencesSegment
STERISIsomedix Services
Segment Total
Balance at March 31, 2006 $ 169,639 $ 26,757 $ 81,659 $ 278,055
Goodwill acquired or allocated (3,451) — — (3,451)
Foreign currency translation adjustments 5,349 1,266 — 6,615
Balance at March 31, 2007 171,537 28,023 81,659 281,219
Foreign currency translation adjustments 5,797 3,920 — 9,717
Balance at March 31, 2008 $177,334 $ 31,943 $ 81,659 $290,936
Goodwill amounts created as a result of the fiscal 2005 acquisition of FHSurgical were subject to further adjustment as we
finalized the allocation of purchase price to the net assets acquired. The adjustments are reflected in the table above as goodwill acquired
or allocated. Further information regarding business acquisitions is presented in Note 17, “Business Acquisitions.”
75

STERIS CORPORATION AND SUBSIDIARIES
NOTES TO CONSOLIDATED FINANCIAL STATEMENTS(dollars in thousands, except per share amounts)
Information regarding our intangible assets is as follows:
March 31, 2008 March 31, 2007
Gross CarryingAmount
AccumulatedAmortization
Gross CarryingAmount
AccumulatedAmortization
Customer relationships $ 26,044 $ 10,115 $ 25,901 $ 6,605
Non-compete agreements 3,165 2,683 3,161 2,330
Patents and technology 41,428 21,160 39,578 18,514
Trademarks and tradenames 20,351 10,001 18,974 8,451
Other 25 10 21 6
Total $ 91,013 $ 43,969 $ 87,635 $ 35,906
We did not hold any indefinite-lived intangible assets in fiscal 2008 or fiscal 2007. Total amortization expense for finite-lived
intangible assets was $7,613, $7,548, and $7,484 for the years ended March 31, 2008, 2007, and 2006, respectively. Based upon the current
amount of intangible assets subject to amortization, the amortization expense for each of the five succeeding fiscal years is estimated to be
as follows:
2009 2010 2011 2012 2013
Estimated amortization expense $ 7,569 $ 7,557 $ 7,137 $ 5,978 $ 4,979
The estimated annual amortization expense presented in the preceding table has been calculated based upon March 31, 2008
foreign currency exchange rates.
5. INVENTORIES, NET
Inventories, net consisted of the following:
March 31, 2008 2007
Raw materials $ 44,195 $ 42,672
Work in process 28,158 30,443
Finished goods 74,857 58,882
Total inventories, net $ 147,210 $ 131,997
76

STERIS CORPORATION AND SUBSIDIARIES
NOTES TO CONSOLIDATED FINANCIAL STATEMENTS(dollars in thousands, except per share amounts)
6. PROPERTY, PLANT, AND EQUIPMENT
Information related to the major categories of our depreciable assets is as follows:
March 31, 2008 2007
Land and land improvements (1) $ 26,696 $ 25,553
Buildings and leasehold improvements 184,921 180,672
Machinery and equipment 271,646 268,852
Information systems 126,741 115,137
Radioisotope 148,738 133,723
Construction in progress (1) 38,065 40,098
Total property, plant, and equipment 796,807 764,035
Less: accumulated depreciation and depletion (412,165) (375,136)
Property, plant, and equipment, net $ 384,642 $ 388,899
(1) Land is not depreciated. Construction in progress is not depreciated until placed in service.
Depreciation and depletion expense was $55,165, $52,708, and $49,867, for the years ended March 31, 2008, 2007, and 2006,
respectively.
Rental expense for leases was $18,205, $18,164, and $15,713, for the years ended March 31, 2008, 2007, and 2006, respectively.
Operating leases relate to manufacturing, warehouse and office space, service facilities, vehicles, equipment, and communication systems.
Certain lease agreements grant us varying renewal and purchase options.
Future minimum annual rentals payable under noncancelable operating lease agreements at March 31, 2008 were as follows:
OperatingLeases
2009 $ 16,755
2010 12,867
2011 9,187
2012 5,177
2013 and Thereafter 13,049
Total minimum lease payments $ 57,035
In the preceding table, the future minimum annual rentals payable under noncancelable leases denominated in foreign currencies
have been calculated based upon March 31, 2008 foreign currency exchange rates.
77
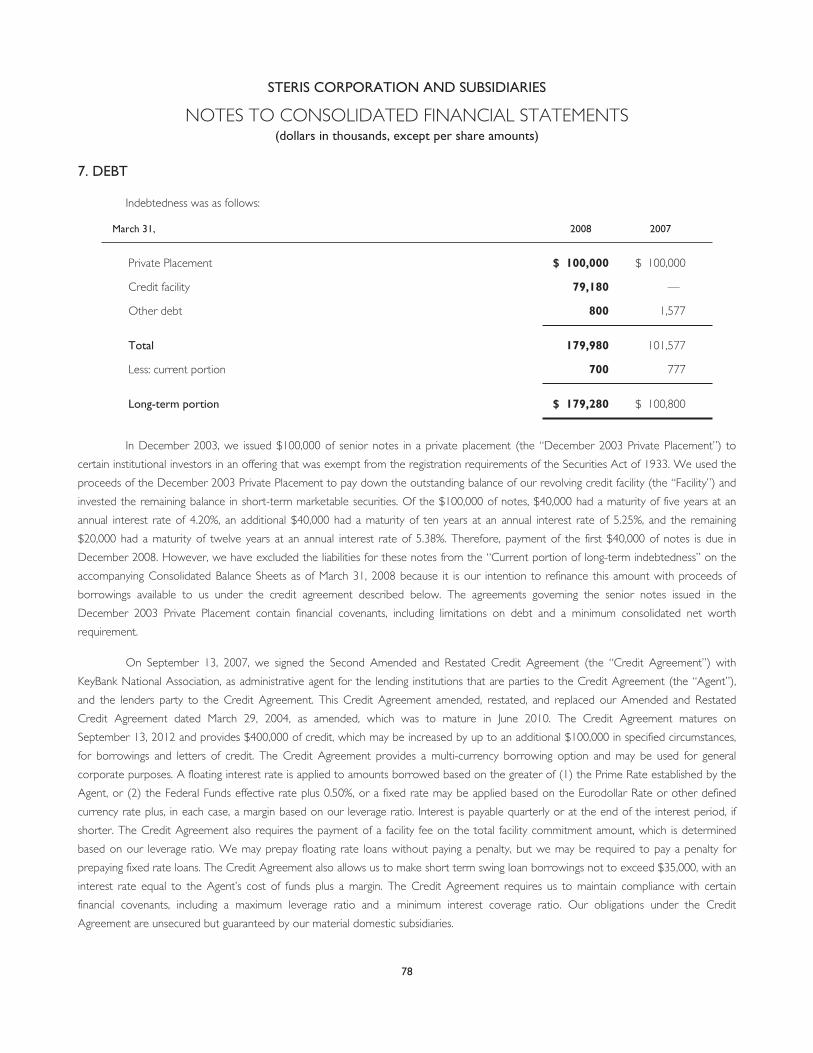
STERIS CORPORATION AND SUBSIDIARIES
NOTES TO CONSOLIDATED FINANCIAL STATEMENTS(dollars in thousands, except per share amounts)
7. DEBT
Indebtedness was as follows:
March 31, 2008 2007
Private Placement $ 100,000 $ 100,000
Credit facility 79,180 —
Other debt 800 1,577
Total 179,980 101,577
Less: current portion 700 777
Long-term portion $ 179,280 $ 100,800
In December 2003, we issued $100,000 of senior notes in a private placement (the “December 2003 Private Placement”) to
certain institutional investors in an offering that was exempt from the registration requirements of the Securities Act of 1933. We used the
proceeds of the December 2003 Private Placement to pay down the outstanding balance of our revolving credit facility (the “Facility”) and
invested the remaining balance in short-term marketable securities. Of the $100,000 of notes, $40,000 had a maturity of five years at an
annual interest rate of 4.20%, an additional $40,000 had a maturity of ten years at an annual interest rate of 5.25%, and the remaining
$20,000 had a maturity of twelve years at an annual interest rate of 5.38%. Therefore, payment of the first $40,000 of notes is due in
December 2008. However, we have excluded the liabilities for these notes from the “Current portion of long-term indebtedness” on the
accompanying Consolidated Balance Sheets as of March 31, 2008 because it is our intention to refinance this amount with proceeds of
borrowings available to us under the credit agreement described below. The agreements governing the senior notes issued in the
December 2003 Private Placement contain financial covenants, including limitations on debt and a minimum consolidated net worth
requirement.
On September 13, 2007, we signed the Second Amended and Restated Credit Agreement (the “Credit Agreement”) with
KeyBank National Association, as administrative agent for the lending institutions that are parties to the Credit Agreement (the “Agent”),
and the lenders party to the Credit Agreement. This Credit Agreement amended, restated, and replaced our Amended and Restated
Credit Agreement dated March 29, 2004, as amended, which was to mature in June 2010. The Credit Agreement matures on
September 13, 2012 and provides $400,000 of credit, which may be increased by up to an additional $100,000 in specified circumstances,
for borrowings and letters of credit. The Credit Agreement provides a multi-currency borrowing option and may be used for general
corporate purposes. A floating interest rate is applied to amounts borrowed based on the greater of (1) the Prime Rate established by the
Agent, or (2) the Federal Funds effective rate plus 0.50%, or a fixed rate may be applied based on the Eurodollar Rate or other defined
currency rate plus, in each case, a margin based on our leverage ratio. Interest is payable quarterly or at the end of the interest period, if
shorter. The Credit Agreement also requires the payment of a facility fee on the total facility commitment amount, which is determined
based on our leverage ratio. We may prepay floating rate loans without paying a penalty, but we may be required to pay a penalty for
prepaying fixed rate loans. The Credit Agreement also allows us to make short term swing loan borrowings not to exceed $35,000, with an
interest rate equal to the Agent’s cost of funds plus a margin. The Credit Agreement requires us to maintain compliance with certain
financial covenants, including a maximum leverage ratio and a minimum interest coverage ratio. Our obligations under the Credit
Agreement are unsecured but guaranteed by our material domestic subsidiaries.
78

STERIS CORPORATION AND SUBSIDIARIES
NOTES TO CONSOLIDATED FINANCIAL STATEMENTS(dollars in thousands, except per share amounts)
Other debt includes industrial development revenue bonds that bear interest at a variable rate based on the bank/marketing
agent’s demand note index. Reimbursement agreements related to letters of credit that support the industrial development revenue bonds
follow the same financial covenants as the Credit Agreement. At March 31, 2008 and 2007, outstanding obligations under the industrial
development revenue bonds were $800 and $1,500, respectively, with an interest rate of 2.30% and 3.81%, respectively. Other debt also
includes capital lease obligations of $77 at March 31, 2007.
At March 31, 2008, we were in compliance with all financial covenants associated with our indebtedness.
The combined annual aggregate amount of maturities of our outstanding debt is as follows:
2009 $ 40,700
2010 100
2011 —
2012 —
2013 and thereafter 139,180
Total $ 179,980
79

STERIS CORPORATION AND SUBSIDIARIES
NOTES TO CONSOLIDATED FINANCIAL STATEMENTS(dollars in thousands, except per share amounts)
8. ADDITIONAL BALANCE SHEET INFORMATION
Additional information related to our Consolidated Balance Sheets is as follows:
March 31, 2008 2007
Accrued payroll and other related liabilities:
Compensation and related items $ 17,500 $ 19,617
Accrued vacation 14,085 13,265
Accrued bonuses 8,658 8,436
Accrued employee commissions 11,263 9,989
Other post-retirement benefit obligation – current portion 6,824 6,789
Other employee benefit plans’ obligations – current portion 913 907
Total accrued payroll and other related liabilities $ 59,243 $ 59,003
Accrued expences and other:
Deferred revenues $ 24,833 $ 22,919
Self-insured risk retention – GRIC – current portion 4,586 4,096
Other self-insured risks 850 541
Accrued dealer commissions 6,398 6,474
Accrued warranty 7,825 5,893
Other 27,353 22,751
Total accrued expenses and other $ 71,845 $ 62,674
Other liabilities:
Self-insured risk retention – GRIC – long-term portion $ 11,814 $ 12,506
Other post-retirement benefit obligation – long-term portion 75,889 74,275
Defined benefit pension plans’ obligations – long-term portion 14,058 11,466
Other employee benefit plans’ obligations – long-term portion 1,314 606
Minority interest in joint venture 323 —
Accrued long-term income taxes 14,201 —
Total other liabilities $ 117,599 $ 98,853
80

STERIS CORPORATION AND SUBSIDIARIES
NOTES TO CONSOLIDATED FINANCIAL STATEMENTS(dollars in thousands, except per share amounts)
9. INCOME TAXES
Income from continuing operations before income taxes was as follows:
Years Ended March 31, 2008 2007 2006
United States operations $ 86,758 $ 118,130 $ 102,667
Non-United States operations 33,041 14,800 5,451
$ 119,799 $ 132,930 $ 108,118
The components of the provision for income taxes related to income from continuing operations consisted of the following:
Years Ended March 31, 2008 2007 2006
Current:
United States federal $ 35,273 $ 47,492 $ 43,845
United States state and local 4,164 4,722 4,807
Non-United States 13,416 9,733 4,072
52,853 61,947 52,724
Deferred:
United States federal (7,243) (8,674) (7,200)
United States state and local (517) (845) (297)
Non-United States (2,400) (595) (55)
(10,160) (10,114) (7,552)
Total provision for income taxes $ 42,693 $ 51,833 $ 45,172
81
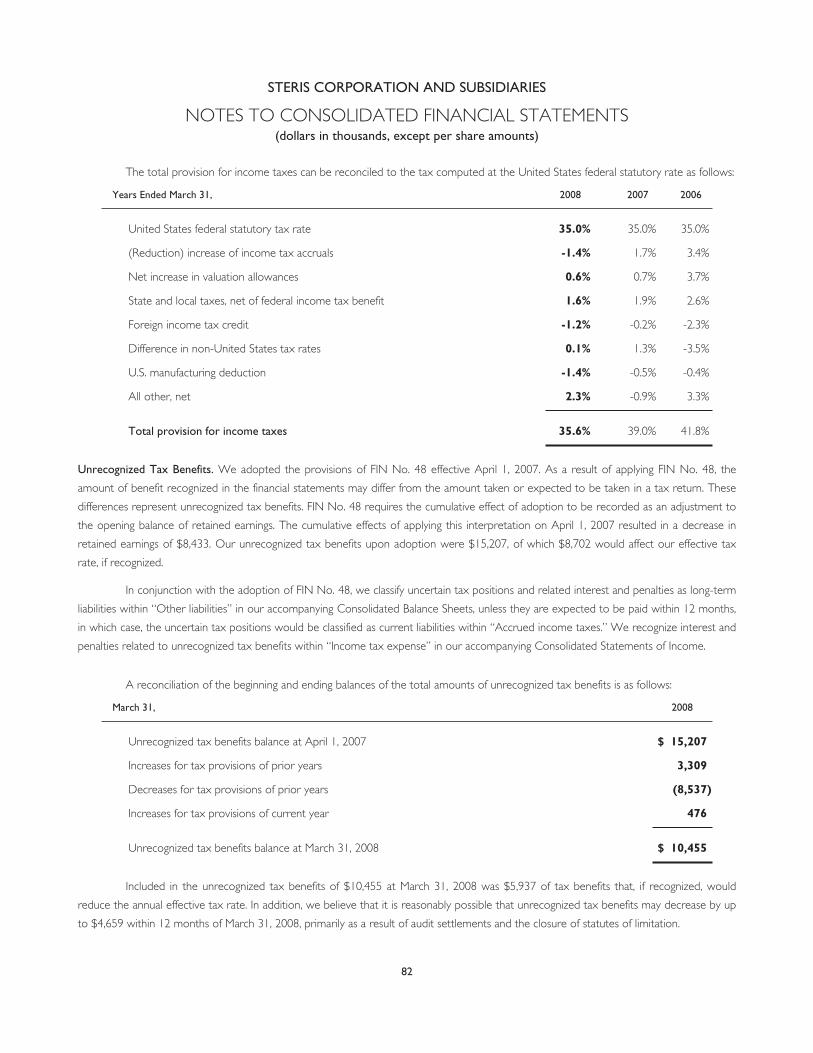
STERIS CORPORATION AND SUBSIDIARIES
NOTES TO CONSOLIDATED FINANCIAL STATEMENTS(dollars in thousands, except per share amounts)
The total provision for income taxes can be reconciled to the tax computed at the United States federal statutory rate as follows:
Years Ended March 31, 2008 2007 2006
United States federal statutory tax rate 35.0% 35.0% 35.0%
(Reduction) increase of income tax accruals -1.4% 1.7% 3.4%
Net increase in valuation allowances 0.6% 0.7% 3.7%
State and local taxes, net of federal income tax benefit 1.6% 1.9% 2.6%
Foreign income tax credit -1.2% -0.2% -2.3%
Difference in non-United States tax rates 0.1% 1.3% -3.5%
U.S. manufacturing deduction -1.4% -0.5% -0.4%
All other, net 2.3% -0.9% 3.3%
Total provision for income taxes 35.6% 39.0% 41.8%
Unrecognized Tax Benefits. We adopted the provisions of FIN No. 48 effective April 1, 2007. As a result of applying FIN No. 48, the
amount of benefit recognized in the financial statements may differ from the amount taken or expected to be taken in a tax return. These
differences represent unrecognized tax benefits. FIN No. 48 requires the cumulative effect of adoption to be recorded as an adjustment to
the opening balance of retained earnings. The cumulative effects of applying this interpretation on April 1, 2007 resulted in a decrease in
retained earnings of $8,433. Our unrecognized tax benefits upon adoption were $15,207, of which $8,702 would affect our effective tax
rate, if recognized.
In conjunction with the adoption of FIN No. 48, we classify uncertain tax positions and related interest and penalties as long-term
liabilities within “Other liabilities” in our accompanying Consolidated Balance Sheets, unless they are expected to be paid within 12 months,
in which case, the uncertain tax positions would be classified as current liabilities within “Accrued income taxes.” We recognize interest and
penalties related to unrecognized tax benefits within “Income tax expense” in our accompanying Consolidated Statements of Income.
A reconciliation of the beginning and ending balances of the total amounts of unrecognized tax benefits is as follows:
March 31, 2008
Unrecognized tax benefits balance at April 1, 2007 $ 15,207
Increases for tax provisions of prior years 3,309
Decreases for tax provisions of prior years (8,537)
Increases for tax provisions of current year 476
Unrecognized tax benefits balance at March 31, 2008 $ 10,455
Included in the unrecognized tax benefits of $10,455 at March 31, 2008 was $5,937 of tax benefits that, if recognized, would
reduce the annual effective tax rate. In addition, we believe that it is reasonably possible that unrecognized tax benefits may decrease by up
to $4,659 within 12 months of March 31, 2008, primarily as a result of audit settlements and the closure of statutes of limitation.
82

STERIS CORPORATION AND SUBSIDIARIES
NOTES TO CONSOLIDATED FINANCIAL STATEMENTS(dollars in thousands, except per share amounts)
During fiscal 2008, current income tax expense includes $377 for interest and a benefit of $378 for penalties related to
unrecognized tax benefits, and in total, as of March 31, 2008, we have recognized a liability for interest of $2,184 and penalties of $2,485.
We operate in numerous taxing jurisdictions and are subject to regular examinations by various United States federal, state, and
local, as well as foreign, jurisdictions. We are no longer subject to United States federal examinations for years before fiscal 2002 and, with
limited exceptions, we are no longer subject to United States state and local, or non-United States, income tax examinations by tax
authorities for years before fiscal 2003. We remain subject to tax authority audits in various jurisdictions wherever we do business. We do
not expect the results of these examinations to have a material adverse affect on our consolidated financial statements.
Deferred Taxes. The significant components of the deferred tax assets and liabilities recorded in our accompanying balance sheets at
March 31, 2008 and 2007 were as follows:
March 31, 2008 2007
Deferred tax assets:
Post-retirement benefit accrual $ 36,262 $ 35,769
Compensation 15,753 8,642
Net operating loss carryforwards 11,011 9,661
Accrued expenses 8,278 6,340
Insurance 6,303 2,129
Deferred income 5,897 2,927
Bad debt 4,732 4,991
Pension 4,372 2,969
Other 1,809 55
Deferred tax assets 94,417 73,483
Less: Valuation allowance 8,998 6,308
Total deferred tax assets 85,419 67,175
Deferred tax liabilities:
Depreciation and depletion 39,789 48,254
Intangibles 18,817 17,206
Inventory 1,813 4,534
Other 1,869 447
Total deferred tax liabilities 62,288 70,441
Net deferred tax assets (liabilities) $ 23,131 $ (3,266)
83

STERIS CORPORATION AND SUBSIDIARIES
NOTES TO CONSOLIDATED FINANCIAL STATEMENTS(dollars in thousands, except per share amounts)
At March 31, 2008, we had federal operating loss carryforwards of $851, which can be utilized subject to certain limitations, and
foreign operating loss carry forwards of $37,375. Substantially all of the carryforwards are available for at least three years or have an
indefinite carryforward period. In addition, we have recorded tax benefits of $767 related to state operating loss carryforwards. At
March 31, 2008, we had $952 of tax credit carryforwards. These credit carryforwards expire between fiscal 2015 and fiscal 2023.
We periodically review the need for a valuation allowance against our deferred tax assets. A valuation allowance of $8,998 has
been applied to a portion of the net deferred tax assets because we do not believe it is more-likely-than-not that we will receive future
benefit. The valuation allowance increased during fiscal 2008 by $2,690.
At March 31, 2008, cumulative undistributed earnings of international operations amounted to approximately $129,799. These
earnings are indefinitely reinvested in international operations. Accordingly, no provision has been made for deferred taxes related to the
future repatriation of such earnings, nor is it practicable to determine the amount of this liability.
10. BENEFIT PLANS
We provide defined benefit pension plans for certain current and former manufacturing and plant administrative personnel
throughout the world as determined by collective bargaining agreements or employee benefit standards set at the time of acquisition of
certain businesses. In addition to providing pension benefits to certain employees, we sponsor an unfunded post-retirement medical benefit
plan for two groups of United States employees, including the same employees who receive pension benefits under the Unites States
defined benefit pension plans. Benefits under this plan include retiree life insurance and retiree medical insurance, including prescription drug
coverage and Medicare supplemental coverage.
On March 31, 2007, we adopted the provisions of SFAS No. 158. SFAS No. 158 required us to recognize the funded status of
our defined benefit pension and post-retirement benefit plans in our Consolidated Balance Sheets, with a corresponding adjustment to
accumulated other comprehensive income, net of tax. The funded status is measured as the difference between the fair value of plan assets
and the benefit obligation (which is the projected benefit obligation for pension plans and the accumulated post-retirement benefit
obligation for post-retirement benefit plans). The adjustment to accumulated comprehensive income at adoption represents the net
unrecognized actuarial losses and unrecognized transition obligation remaining from the initial adoption of SFAS No. 87 and SFAS No. 106,
which were previously netted against the plans’ funded status. These amounts will be recognized in net periodic benefit cost as they are
amortized. We will recognize future changes to the funded status of these plans in the year the change occurs, through other
comprehensive income. In accordance with SFAS No. 158, the consolidated financial statements for prior periods have not been restated to
reflect, and do not include, the impact of SFAS No. 158.
SFAS No. 158 also required plan assets and obligations to be measured as of the employer’s balance sheet date. This provision is
effective for fiscal years beginning after December 15, 2008. We already use a March 31 measurement date for all plans, so this provision
had no affect on our consolidated financial statements.
84

STERIS CORPORATION AND SUBSIDIARIES
NOTES TO CONSOLIDATED FINANCIAL STATEMENTS(dollars in thousands, except per share amounts)
The effects of adopting SFAS No. 158 on our Consolidated Balance Sheet as of March 31, 2007 are presented in the following
table:
Prior to Adopting SFAS No. 158
Pension Plans OtherPost-retirement
Benefit PlanU.S. Qualified International Total
Liabilities and Shareholders’ Equity:
Current pension and post-retirement
benefit liabilities $ 4,808 $ 656 $ 6,789 $12,253
Long-term liabilities:
Deferred income taxes, net (4,257) — — (4,257)
Long-term pension and post-
retirement benefit liabilities 4,693 2,202 61,700 68,595
Total liabilities 5,244 2,858 68,489 76,591
Accumulated other comprehensive
income (loss) (6,770) — — (6,770)
Total shareholders’ equity (6,770) — — (6,770)
Total liabilities and shareholders’ equity $(1,526) $2,858 $68,489 $69,821
85

STERIS CORPORATION AND SUBSIDIARIES
NOTES TO CONSOLIDATED FINANCIAL STATEMENTS(dollars in thousands, except per share amounts)
Effect of Adopting SFAS No. 158
Pension Plans OtherPost-retirement
Benefit PlanU.S. Qualified International Total
Liabilities and Shareholders’ Equity:
Current pension and post-retirement
benefit liabilities $ (4,808) $ (656) $ — $ (5,464)
Long-term liabilities:
Deferred income taxes, net 17 182 (7,966) (7,767)
Long-term pension and post-
retirement benefit liabilities 4,767 (196) 12,575 17,146
Total liabilities (24) (670) 4,609 3,915
Accumulated other comprehensive
income (loss) 24 670 (4,609) (3,915)
Total shareholders’ equity 24 670 (4,609) (3,915)
Total liabilities and shareholders’ equity $ — $ — $ — $ —
86

STERIS CORPORATION AND SUBSIDIARIES
NOTES TO CONSOLIDATED FINANCIAL STATEMENTS(dollars in thousands, except per share amounts)
As Reported at March 31, 2007
Pension Plans OtherPost-retirement
Benefit PlanU.S. Qualified International Total
Liabilities and Shareholders’ Equity:
Current pension and post-retirement
benefit liabilities $ — $ — $ 6,789 $ 6,789
Long-term liabilities:
Deferred income taxes, net (4,240) 182 (7,966) (12,024)
Long-term pension and post-
retirement benefit liabilities 9,460 2,006 74,275 85,741
Total liabilities 5,220 2,188 73,098 80,506
Accumulated other comprehensive
income (loss) (6,746) 670 (4,609) (10,685)
Total shareholders’ equity (6,746) 670 (4,609) (10,685)
Total liabilities and shareholders’ equity $ (1,526) $ 2,858 $ 68,489 $ 69,821
Deferred income taxes shown above represent the current and non-current deferred income tax assets recorded at March 31,
2007 on our accompanying Consolidated Balance Sheets. The current portion of the post-retirement benefit liability is recorded within
“Accrued payroll and other related liabilities” on our accompanying Consolidated Balance Sheets. The long-term portion of the pension and
post-retirement liabilities are recorded within “Other liabilities” on our accompanying Consolidated Balance Sheets.
The pre-tax amount of unrecognized actuarial net loss and unamortized transition obligation included in accumulated other
comprehensive loss at March 31, 2008 was $30,873 and $181, respectively. During fiscal 2009, we will amortize the following pre-tax
amounts from accumulated other comprehensive income:
U.S. QualifiedPlans
InternationalPlan
Other Post-retirementBenefit Plan
Actuarial Loss $ 412 $— $ 1,101
Transition Obligation 110 — —
87

STERIS CORPORATION AND SUBSIDIARIES
NOTES TO CONSOLIDATED FINANCIAL STATEMENTS(dollars in thousands, except per share amounts)
Obligations and Funded Status. The following table reconciles the funded status of the defined benefit pension plans and the other post-
retirement medical benefit plan to the amounts recorded on our Consolidated Balance Sheets at March 31, 2008 and 2007, respectively.
Benefit obligation balances presented in the following table reflect the projected benefit obligations for our defined benefit pension plans and
the accumulated other post-retirement benefit obligation for our other post-retirement medical benefit plan. The measurement date of our
defined benefit pension plans and the other post-retirement medical benefit plan is March 31 for both periods presented.
Pension Plans OtherPost-retirement PlanU.S. Qualified International
2008 2007 2008 2007 2008 2007
Change in Benefit Obligations:
Benefit obligations at beginning of year $ 48,431 $ 47,793 $ 10,952 $ 10,323 $ 81,064 $ 81,005
Service cost 105 76 513 454 — —
Interest cost 2,796 2,769 337 331 4,643 4,673
Actuarial loss (gain) 875 1,076 1,128 (42) 1,982 1,379
Benefits paid (4,343) (3,283) (1,370) (1,514) (4,976) (5,993)
Employee contributions — — 649 620 — —
Impact of foreign currency
exchange rate changes — — 2,494 780 — —
Benefit obligations at end of year 47,864 48,431 14,703 10,952 82,713 81,064
Change in Plan Assets:
Fair value of plan assets at beginning of
year 38,971 35,715 8,946 7,587 — —
Actual (loss) return on plan assets (1,248) 3,414 1,750 1,031 — —
Employer contributions 2,404 3,125 649 620 4,976 5,993
Employee contributions — — 649 620 — —
Benefits and expenses paid (4,343) (3,283) (1,370) (1,514) (4,976) (5,993)
Impact of foreign currency
exchange rate changes — — 2,101 602 — —
Fair value of plan assets at end of year 35,784 38,971 12,725 8,946 — —
Funded Status of the Plans (1) $ (12,080) $ (9,460) $ (1,978) $ (2,006) $ (82,713) $ (81,064)
88
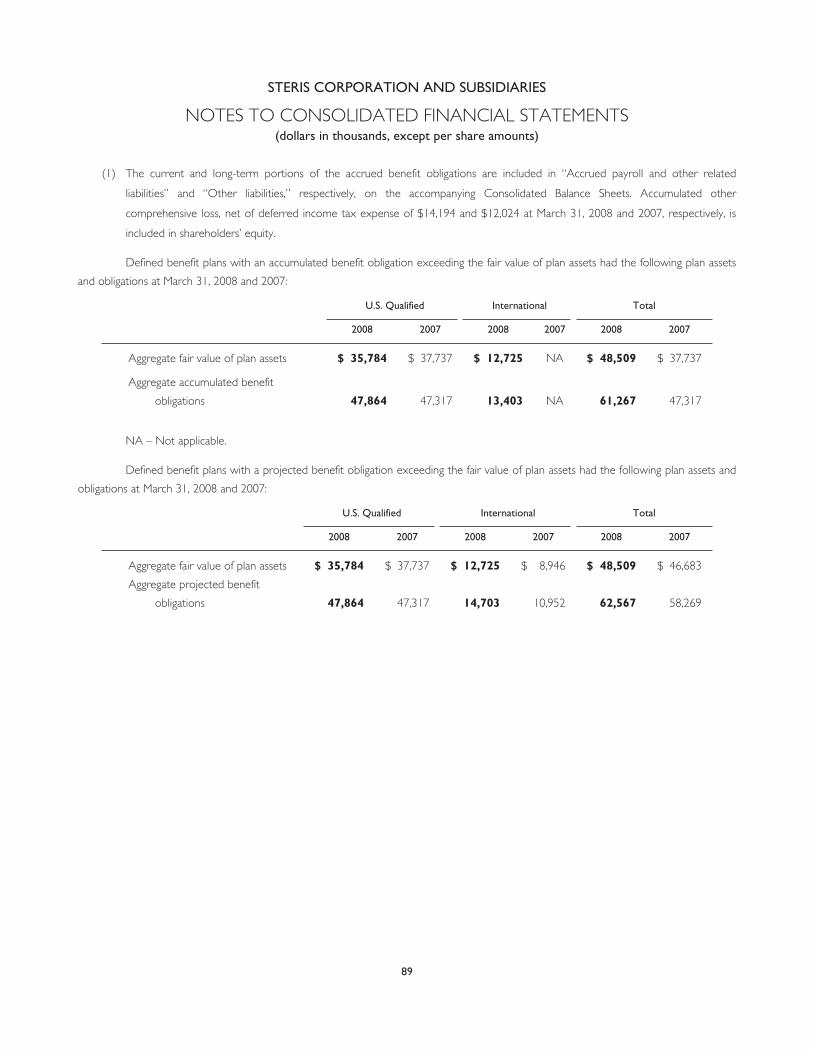
STERIS CORPORATION AND SUBSIDIARIES
NOTES TO CONSOLIDATED FINANCIAL STATEMENTS(dollars in thousands, except per share amounts)
(1) The current and long-term portions of the accrued benefit obligations are included in “Accrued payroll and other related
liabilities” and “Other liabilities,” respectively, on the accompanying Consolidated Balance Sheets. Accumulated other
comprehensive loss, net of deferred income tax expense of $14,194 and $12,024 at March 31, 2008 and 2007, respectively, is
included in shareholders’ equity.
Defined benefit plans with an accumulated benefit obligation exceeding the fair value of plan assets had the following plan assets
and obligations at March 31, 2008 and 2007:
U.S. Qualified International Total
2008 2007 2008 2007 2008 2007
Aggregate fair value of plan assets $ 35,784 $ 37,737 $ 12,725 NA $ 48,509 $ 37,737
Aggregate accumulated benefit
obligations 47,864 47,317 13,403 NA 61,267 47,317
NA – Not applicable.
Defined benefit plans with a projected benefit obligation exceeding the fair value of plan assets had the following plan assets and
obligations at March 31, 2008 and 2007:
U.S. Qualified International Total
2008 2007 2008 2007 2008 2007
Aggregate fair value of plan assets $ 35,784 $ 37,737 $ 12,725 $ 8,946 $ 48,509 $ 46,683
Aggregate projected benefit
obligations 47,864 47,317 14,703 10,952 62,567 58,269
89

STERIS CORPORATION AND SUBSIDIARIES
NOTES TO CONSOLIDATED FINANCIAL STATEMENTS(dollars in thousands, except per share amounts)
Components of Net Periodic Benefit Cost. Components of the annual net periodic benefit cost of our defined benefit pension plans
and our other post-retirement medical benefit plan were as follows:
Pension Plans
U.S. Qualified International Other Post-retirement Plan
2008 2007 2006 2008 2007 2006 2008 2007 2006
Service cost $ 105 $ 76 $ 850 $ 513 $ 454 $608 $ — $ — $ 1,090
Interest cost 2,796 2,769 2,722 337 331 322 4,643 4,673 4,535
Expected return
on plan
assets (3,127) (2,858) (2,764) (487) (402) (336) — — —
Special
termination
benefits — — — — — — — — 8,982
Curtailment loss — — 1,326 — — — — — —
Prior service
cost
recognition — — 1,009 — — — — — —
Net amortization
and
deferral 301 265 1,061 — — — 988 922 1,753
Net periodic
benefit
cost $ 75 $ 252 $ 4,204 $ 363 $ 383 $594 $5,631 $5,595 $16,360
Assumptions Used in Calculating Benefit Obligations and Net Periodic Benefit Cost. The following table provides the
applicable actuarial assumptions used to determine the benefit obligations at March 31:
2008 2007
Discount rate:
U.S. qualified pension plans 6.00% 6.00%
Switzerland pension plan 3.75% 3.00%
Other post-retirement plan 6.00% 6.00%
Expected return on plan assets:
U.S. qualified pension plans 8.00% 8.00%
Switzerland pension plan 4.50% 5.00%
Rate of compensation increase:
Switzerland pension plan 2.50% 3.00%
90

STERIS CORPORATION AND SUBSIDIARIES
NOTES TO CONSOLIDATED FINANCIAL STATEMENTS(dollars in thousands, except per share amounts)
The following table provides the applicable actuarial assumptions used to determine the net periodic benefit cost for the years
ended March 31:
2008 2007 2006
Discount rate:
U.S. qualified pension plans 6.00% 6.00% 6.00%
Switzerland pension plan 3.00% 3.25% 3.50%
Other post-retirement plan 6.00% 6.00% 6.00%
Expected return on plan assets:
U.S. qualified pension plans 8.00% 8.00% 8.00%
Switzerland pension plan 5.00% 5.00% 5.00%
Rate of compensation increase:
Switzerland pension plan 2.50% 3.00% 3.00%
The net periodic benefit cost and the actuarial present value of projected benefit obligations are based upon assumptions that we
review on an annual basis. These assumptions may be revised annually based upon an evaluation of long-term trends, as well as market
conditions that may have an impact on the cost of providing benefits.
We develop our expected long-term rate of return on plan assets assumptions by evaluating input from third-party professional
advisors, taking into consideration the asset allocation of the portfolios and the long-term asset class return expectations.
We develop our discount rate assumptions by evaluating input from third-party professional advisors, taking into consideration
the current yield on country specific investment grade long-term bonds which provide for similar cash flow streams as our projected
obligations.
We have made assumptions regarding healthcare costs in computing our other post-retirement benefit obligation. The assumed
rates of increase generally decline ratably over a five-year period from the assumed current year healthcare cost trend rate to the assumed
long-term healthcare cost trend rate noted below.
2008 2007 2006
Healthcare cost trend rate – medical 10.0% 10.0% 10.0%
Healthcare cost trend rate – prescription drug 10.0% 15.0% 15.0%
Long-term healthcare cost trend rate 5.0% 5.0% 5.0%
To determine the healthcare cost trend rates, we evaluate a combination of information, including ongoing claims cost monitoring,
annual statistical analyses of claims data, reconciliation of forecasted claims against actual claims, review of trend assumptions of other plan
sponsors and national health trends, and adjustments for plan design changes, workforce changes, and changes in plan participant behavior.
91

STERIS CORPORATION AND SUBSIDIARIES
NOTES TO CONSOLIDATED FINANCIAL STATEMENTS(dollars in thousands, except per share amounts)
A one-percentage point change in assumed healthcare cost trend rates (including medical, prescription drug and long-term rates)
would have had the following effect at March 31, 2008:
One-PercentagePoint
Increase Decrease
Effect on total service and interest cost components $ 334 $ (306)
Effect on other post-retirement benefit obligation 5,984 (5,447)
Plan Assets. Our United States and Switzerland defined benefit pension plans are funded. The following table presents the targeted asset
allocation of plan assets at March 31, 2008 and the actual allocation of plan assets at March 31, 2008 and 2007 for these plans:
Long-TermTarget
AllocationPercentage
Percentage ofPlan Assets
2008 2007
U.S. qualified plans:
Equity securities 60% 59.5% 60.6%
Debt securities 40% 40.5% 39.4%
Cash 0% 0.0% 0.0%
Total 100% 100.0% 100.0%
Switzerland plan:
Equity securities 15%-35% 19.5% 27.6%
Debt securities 45%-75% 46.8% 60.5%
Real estate 0%-10% 8.5% 8.4%
Cash 0%-20% 3.0% 3.5%
Insurance contracts 0%-25% 22.2% 0.0%
Total 100% 100.0% 100.0%
The long-term target allocations in the preceding table reflect our asset class return expectations and tolerance for investment
risk within the context of the pension plans’ long-term benefit obligations. Investment policies, strategies, and long-term target allocations
are developed on a plan specific and country specific basis. We continually challenge the long-term target asset allocations and support the
allocations by an analysis that incorporates historical and expected returns by asset class as well as volatilities across asset classes and our
liability profile. Due to market conditions and other factors, actual asset allocations may vary from the long-term target allocations presented
in the preceding table. Plan assets are managed by outside investment managers. If asset allocations move outside of the target ranges, the
portfolios are rebalanced. For the purpose of the above analysis, debt and equity securities include fixed income and equity security mutual
funds, respectively. At March 31, 2008 and 2007, the plans’ assets did not include investments in STERIS common shares.
Cash Flows. We contribute amounts to our defined benefit pension plans at least equal to the minimum amounts required by applicable
employee benefit laws and local tax laws. We have recorded liabilities for amounts greater than the required funding levels on our
92
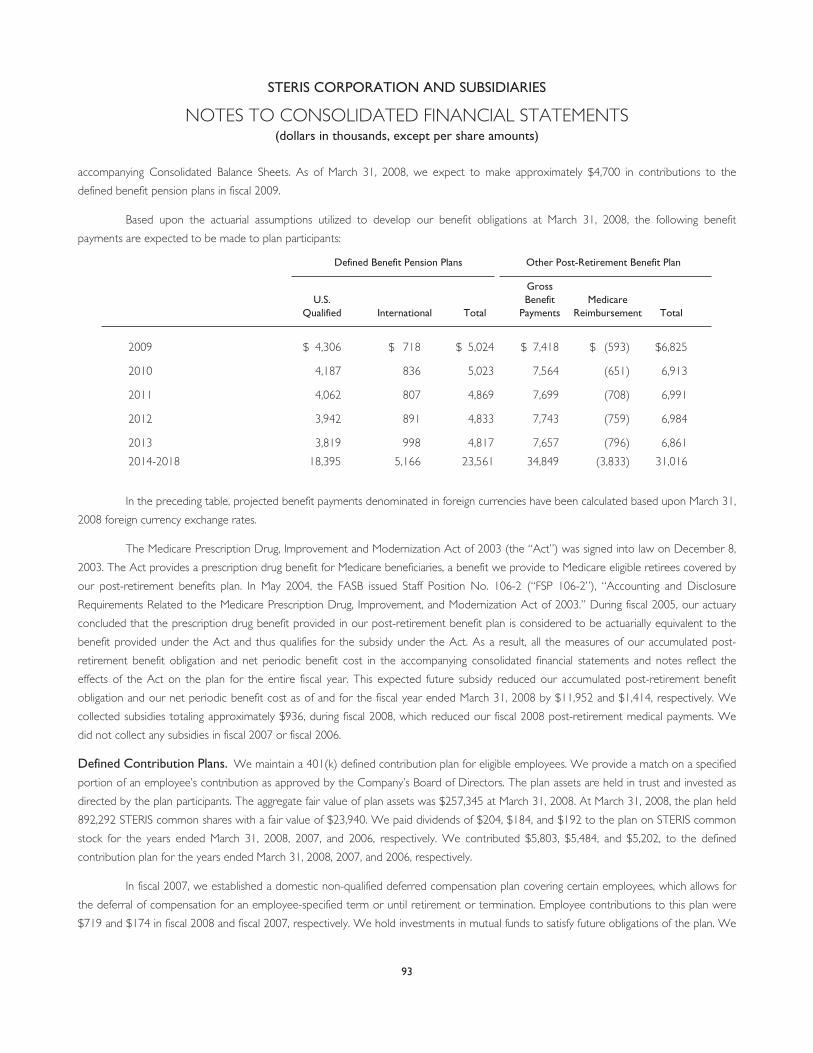
STERIS CORPORATION AND SUBSIDIARIES
NOTES TO CONSOLIDATED FINANCIAL STATEMENTS(dollars in thousands, except per share amounts)
accompanying Consolidated Balance Sheets. As of March 31, 2008, we expect to make approximately $4,700 in contributions to the
defined benefit pension plans in fiscal 2009.
Based upon the actuarial assumptions utilized to develop our benefit obligations at March 31, 2008, the following benefit
payments are expected to be made to plan participants:
Defined Benefit Pension Plans Other Post-Retirement Benefit Plan
U.S.Qualified International Total
GrossBenefit
PaymentsMedicare
Reimbursement Total
2009 $ 4,306 $ 718 $ 5,024 $ 7,418 $ (593) $6,825
2010 4,187 836 5,023 7,564 (651) 6,913
2011 4,062 807 4,869 7,699 (708) 6,991
2012 3,942 891 4,833 7,743 (759) 6,984
2013 3,819 998 4,817 7,657 (796) 6,861
2014-2018 18,395 5,166 23,561 34,849 (3,833) 31,016
In the preceding table, projected benefit payments denominated in foreign currencies have been calculated based upon March 31,
2008 foreign currency exchange rates.
The Medicare Prescription Drug, Improvement and Modernization Act of 2003 (the “Act”) was signed into law on December 8,
2003. The Act provides a prescription drug benefit for Medicare beneficiaries, a benefit we provide to Medicare eligible retirees covered by
our post-retirement benefits plan. In May 2004, the FASB issued Staff Position No. 106-2 (“FSP 106-2”), “Accounting and Disclosure
Requirements Related to the Medicare Prescription Drug, Improvement, and Modernization Act of 2003.” During fiscal 2005, our actuary
concluded that the prescription drug benefit provided in our post-retirement benefit plan is considered to be actuarially equivalent to the
benefit provided under the Act and thus qualifies for the subsidy under the Act. As a result, all the measures of our accumulated post-
retirement benefit obligation and net periodic benefit cost in the accompanying consolidated financial statements and notes reflect the
effects of the Act on the plan for the entire fiscal year. This expected future subsidy reduced our accumulated post-retirement benefit
obligation and our net periodic benefit cost as of and for the fiscal year ended March 31, 2008 by $11,952 and $1,414, respectively. We
collected subsidies totaling approximately $936, during fiscal 2008, which reduced our fiscal 2008 post-retirement medical payments. We
did not collect any subsidies in fiscal 2007 or fiscal 2006.
Defined Contribution Plans. We maintain a 401(k) defined contribution plan for eligible employees. We provide a match on a specified
portion of an employee’s contribution as approved by the Company’s Board of Directors. The plan assets are held in trust and invested as
directed by the plan participants. The aggregate fair value of plan assets was $257,345 at March 31, 2008. At March 31, 2008, the plan held
892,292 STERIS common shares with a fair value of $23,940. We paid dividends of $204, $184, and $192 to the plan on STERIS common
stock for the years ended March 31, 2008, 2007, and 2006, respectively. We contributed $5,803, $5,484, and $5,202, to the defined
contribution plan for the years ended March 31, 2008, 2007, and 2006, respectively.
In fiscal 2007, we established a domestic non-qualified deferred compensation plan covering certain employees, which allows for
the deferral of compensation for an employee-specified term or until retirement or termination. Employee contributions to this plan were
$719 and $174 in fiscal 2008 and fiscal 2007, respectively. We hold investments in mutual funds to satisfy future obligations of the plan. We
93

STERIS CORPORATION AND SUBSIDIARIES
NOTES TO CONSOLIDATED FINANCIAL STATEMENTS(dollars in thousands, except per share amounts)
account for these assets as available-for-sale securities and they are included in “Other assets” on our accompanying Consolidated Balance
Sheets, with a corresponding liability for the plan’s obligation recorded in “Accrued expenses and other.” The aggregate value of the plan
assets was $686 at March 31, 2008. Realized gains and losses on these investments are recorded in “Interest and miscellaneous income”
within “Non-operating expenses” on our accompanying Consolidated Statements of Income. Changes in the fair value of the plan assets are
recorded in other comprehensive income on our accompanying balance sheets.
11. COMMITMENTS AND CONTINGENCIES
We are involved in various patent, product liability, consumer, environmental, and tax proceedings and claims, governmental
investigations, and other legal and regulatory proceedings that arise from time to time in the ordinary course of business. In accordance with
SFAS No. 5, we record accruals for these contingencies to the extent that we conclude their occurrence is both probable and estimable. We
consider many factors in making these assessments, including the professional judgment of experienced members of management and our
legal counsel. We have estimated the likelihood of unfavorable outcomes and the amounts of such potential losses. In management’s opinion,
the ultimate outcome of these proceedings and claims is not expected to have a material adverse affect on our consolidated financial position,
results of operations, or cash flows. However, the ultimate outcome of litigation is unpredictable and actual results could be materially
different from our estimates. We record expected recoveries under applicable insurance contracts when we are assured of recovery.
The United States Food and Drug Administration (“FDA”) and the United States Department of Justice have been conducting an
investigation to our knowledge since 2003 involving our SYSTEM 1® sterile processing system. We received requests for documents,
including the subpoena received in January 2005, and interviews of current and former employees in connection with the investigation. We
continue to respond to these requests and cooperate with the government agencies regarding this matter. There can be no assurance of
the ultimate outcome of the investigation, or that any matter arising out of the investigation will not result in actions by the government
agencies or third parties, or that the government agencies will not initiate administrative proceedings, civil proceedings or criminal
proceedings, or any combination thereof, against us.
On May 16, 2008, we received a warning letter (the “warning letter”) from the FDA regarding our SYSTEM 1® sterile processor
and the S-20 sterilant used with the processor (referred to collectively in the FDA letter and in this note as the “device”). We believe this
warning letter arose from the previously disclosed investigation. In summary, the letter includes the FDA’s assertion that significant changes
or modifications have been made in the design, components, method of manufacture or intended use of the device beyond the FDA’s
1988 clearance, such that the FDA believes a new premarket notification submission (known within FDA regulations as a 510(k)
submission) should have been made. The warning letter references a number of changes to the device that the FDA believes should be
evaluated to determine if they significantly affect the safety or effectiveness of the device and, if true, would require a new premarket
notification submission. The warning letter also requests documentation and explanation regarding various corrective actions related to the
device prior to 2003 and whether those actions should be considered corrections or removals within the meaning of FDA regulations.
We continue to believe that the changes described in the warning letter from the FDA do not significantly affect the safety or
effectiveness of the device and, therefore, did not and do not require a new premarket notification submission, and further, that the
corrective actions were compliant with FDA regulations. However, if the FDA’s assertions are ultimately determined to be correct, the
device would be considered adulterated and misbranded under United States law, in which case, we would be required to make a new
premarket notification submission. The FDA could also take enforcement action immediately without providing the opportunity to make a
new premarket notification submission (“510(k) submission”). If we did not make that 510(k) submission, if the FDA rejected that 510(k)
submission, if the FDA took immediate enforcement action, or if governmental agencies and/or third parties otherwise considered the
device to be non-compliant, civil, administrative or criminal proceedings could be initiated. These or other proceedings involving our STERIS
SYSTEM 1® sterile processing system or other significant product, service, or obligation, which could possibly result in judgments requiring
94

STERIS CORPORATION AND SUBSIDIARIES
NOTES TO CONSOLIDATED FINANCIAL STATEMENTS(dollars in thousands, except per share amounts)
recall, re-labeling or restriction on the manufacturing, sale or distribution of the device, or could require us to take other action, pay fines or
civil damages, or be subject to other governmental or third party claims or remedies, could materially affect our business, performance,
value, financial condition, and results of operations. The STERIS SYSTEM 1® sterile processing system has been in use since its clearance by
the FDA in the late 1980’s. We estimate that the devices currently in operation are used in excess of 30,000 times per day in the aggregate
and that over 250 million medical instruments have been processed using the STERIS SYSTEM 1® sterile processing system. We have
commenced discussions with the FDA regarding this warning letter and the FDA has requested that we respond within 15 working days.
We are subject to taxation from United States federal, state, and local, and foreign jurisdictions. Tax positions are settled primarily
through the completion of audits within each individual jurisdiction or the closing of a statute of limitation. Changes in applicable tax law or
other events may also require us to revise past estimates. We describe income taxes further in Note 9 to our consolidated financial
statements titled, “Income Taxes.”
As of March 31, 2008 and 2007, our commercial commitments totaled $26,762 and $25,871, respectively. Commercial
commitments include standby letters of credit, letters of credit required as security under our self-insured risk retention policies, and other
potential cash outflows resulting from an event that requires payment by us. Approximately $8,982 and $10,271, respectively, of the totals
at March 31, 2008 and 2007 relate to letters of credit required as security under our self-insured risk retention policies.
As of March 31, 2008 and 2007, we had minimum purchase commitments with suppliers for raw material purchases totaling
$37,471 and $28,148 respectively.
12. BUSINESS SEGMENT INFORMATION
As a result of organizational changes within the Life Sciences segment announced in fiscal 2008, we changed our methodology for
reporting segments. The Defense and Industrial business unit, which consists of businesses in early development stages, is no longer a
component of the Life Sciences segment. “Corporate and other,” which is presented separately, contains the Defense and Industrial
business unit plus costs that are associated with being a publicly traded company and certain other corporate costs. These costs include
executive office costs, Board of Directors compensation, shareholder services and investor relations, external audit fees, and legacy pension
and post-retirement benefit costs from our former Erie manufacturing operation. Fiscal 2007 and fiscal 2006 amounts have been revised to
reflect the fiscal 2008 presentation.
We operate in three reportable business segments: Healthcare, Life Sciences, and STERIS Isomedix Services.
Our Healthcare segment manufactures and sells capital equipment, accessory, consumable, and service solutions to healthcare
providers, including acute care hospitals and surgery centers. These solutions aid our Customers in improving the safety, quality, and
productivity of their surgical, sterile processing, gastrointestinal, and emergency environments.
Our Life Sciences segment manufactures and sells engineered capital products, formulated cleaning chemistries, and service
solutions to pharmaceutical companies, and private and public research facilities around the globe.
Our Isomedix Services segment operates through a network of 21 facilities located in North America. We sell a comprehensive
array of contract sterilization services using Gamma Irradiation, Electron Beam Irradiation, and ethylene oxide (“EO”) technologies. We
provide sterilization, microbial reduction, and materials modification services to companies that supply products to the healthcare, industrial,
and consumer products industries.
Financial information for each of our segments is presented in the following table. Operating income (loss) for each segment is
calculated as the segment’s gross profit less direct expenses and indirect cost allocations, which results in the full allocation of all distribution
and research and development expenses, and the partial allocation of corporate costs. The Corporate and other segment includes the gross
95

STERIS CORPORATION AND SUBSIDIARIES
NOTES TO CONSOLIDATED FINANCIAL STATEMENTS(dollars in thousands, except per share amounts)
profit and direct expenses of the Defense and Industrial business unit, as well as certain unallocated corporate costs related to being a
publicly traded company and legacy pension and post-retirement benefits, as previously discussed. These allocations are based upon
variables such as segment headcount and revenues. In addition, the Healthcare segment is responsible for the management of all but one
manufacturing facility and uses standard cost to sell products to the Life Sciences segment.
The accounting policies for segments are the same as those for the consolidated Company. Individual facilities, equipment and
intellectual properties are utilized for production for multiple segments at varying levels over time. As a result, an allocation of depreciable
assets is not meaningful to segment performance. Segment results for fiscal 2006 exclude the freeze dryer product line, which was sold on
October 31, 2005, and reflect the reallocation of corporate overhead charges to all segments. For the year ended March 31, 2008,
revenues from a single Customer did not equal ten percent or more of any segment’s revenues.
Years Ended March 31, 2008 2007 2006
Revenues:
Healthcare $ 887,073 $ 845,674 $ 817,014
Life Sciences 228,350 209,658 207,078
STERIS Isomedix Services 140,558 133,781 127,444
Total reportable segments 1,255,981 1,189,113 1,151,536
Corporate and other 9,109 8,294 8,749
Total revenues $ 1,265,090 $ 1,197,407 $ 1,160,285
Operating income (loss):
Healthcare $ 103,447 $ 122,468 $ 105,074
Life Sciences 11,535 10,953 4,841
STERIS Isomedix Services 28,964 25,127 23,981
Total reportable segments 143,946 158,548 133,896
Corporate and other (20,401) (20,847) (24,198)
Total operating income $ 123,545 $ 137,701 $ 109,698
For the year ended March 31, 2008, restructuring expenses of $16,868, $1,536, $389, and $752 are included in the operating
results of the Healthcare, Life Sciences, and Isomedix segments, and in Corporate and other, respectively. For the year ended March 31,
2007, restructuring expenses of $6,166 and $418 are included in the operating results of the Healthcare and Life Sciences segments,
respectively. For the year ended March 31, 2006, restructuring expenses of $24,826 and $482 are included in the operating results of the
Healthcare and Life Sciences segments, respectively.
96

STERIS CORPORATION AND SUBSIDIARIES
NOTES TO CONSOLIDATED FINANCIAL STATEMENTS(dollars in thousands, except per share amounts)
Financial information for each of our United States and international geographic areas is presented in the following table.
Revenues are based on the location of these operations and their Customers. Long-lived assets are those assets that are identified within
the operations in each geographic area, including property, plant, equipment, goodwill, intangible assets, and other assets.
Years Ended March 31, 2008 2007 2006
Revenues:
United States $ 971,018 $ 933,546 $ 925,593
International 294,072 263,861 234,692
Total revenues $ 1,265,090 $ 1,197,407 $ 1,160,285
March 31, 2008 2007
Long-lived assets:
United States $ 559,305 $ 570,851
International 166,611 153,599
Total long-lived assets $ 725,916 $ 724,450
13. COMMON SHARES
We calculate basic earnings per common share based upon the weighted average number of common shares outstanding. We
calculate diluted earnings per share based upon the weighted average number of common shares outstanding plus the dilutive effect of
common share equivalents calculated using the treasury stock method. The following is a summary of common shares and common share
equivalents outstanding used in the calculations of basic and diluted earnings per share:
Years Ended March 31, 2008 2007 2006
(in thousands)
Weighted average common shares outstanding – basic 63,300 65,174 68,238
Dilutive effect of common share equivalents 824 557 701
Weighted average common shares and equivalents – diluted 64,124 65,731 68,939
Options to purchase the following number of common shares at the following weighted average exercise prices were outstanding
but excluded from the computation of diluted earnings per share because the combined exercise prices, unamortized fair values, and
assumed tax benefits upon exercise were greater than the average market price for the common shares during the periods, so including
these options would be anti-dilutive:
Years Ended March 31, 2008 2007 2006
(shares in thousands)
Number of common share options 1,332 2,495 1,341
Weighted average exercise price $ 27.77 $ 25.94 $ 28.22
97

STERIS CORPORATION AND SUBSIDIARIES
NOTES TO CONSOLIDATED FINANCIAL STATEMENTS(dollars in thousands, except per share amounts)
14. REPURCHASES OF COMMON SHARES
On March 14, 2008, we announced that the Company’s Board of Directors provided authorization to repurchase up to $300,000
STERIS common shares. This authorization replaced the prior authorization of July 26, 2007 to repurchase up to $300,000 STERIS common
shares under which $159,736 remained available for repurchase. This new common share repurchase authorization does not have a stated
maturity date. Under this new authorization, we may purchase shares from time to time through open market purchases, including
transactions pursuant to Rule 10b5-1 plans, or privately negotiated transactions.
During fiscal 2008, we repurchased 6,825,550 of our common shares for $183,199, representing an average price of $26.84 per
common share, including repurchases of 225,000 of our common shares for $6,028 that were not settled until April 2008.
At March 31, 2008, $278,301 common shares remained authorized for repurchase under the March 14, 2008 authorization and
10,776,921 common shares were held in treasury.
15. SHARE-BASED COMPENSATION
STERIS currently maintains a long-term incentive plan that makes available up to 6,600,000 common shares for grants, at the
discretion of the Compensation Committee of the Board of Directors, to officers, directors, and key employees in the form of stock
options, restricted shares, restricted share units, and stock appreciation rights. Stock options provide the right to purchase our common
shares at the market price on the date of grant, subject to the terms of the option plans and agreements. Generally, one-fourth of the stock
options granted become exercisable for each full year of employment following the date of grant. Stock options granted generally expire 10
years after the date of grant, or earlier if an option holder is no longer employed by us. Certain option agreements have provisions that
provide for an adjustment to the normal vesting schedule allowing the options to vest on a prorated basis, as defined by the agreement, in
the event of employment termination. Restricted shares and restricted share units generally cliff vest over an approximately three-year
period. We generally use the common shares held in treasury for restricted share and share unit grants and for stock option exercises on a
first-in first-out basis. As of March 31, 2008, 5,384,840 shares remain available for grant under the long-term incentive plan.
Prior to April 1, 2006, we accounted for share-based compensation under the provisions of Accounting Principles Board Opinion
No. 25 (“APB No. 25”), “Accounting for Stock Issued to Employees,” as permitted by Statement of Financial Accounting Standards No. 123
(“SFAS No. 123”), “Accounting for Stock-Based Compensation,” as amended by Statement of Financial Accounting Standards No. 148,
“Accounting for Stock-Based Compensation—Transition and Disclosure.” Prior to April 1, 2006, we recognized no compensation expense
when the exercise price equaled the market price of the stock on the date of grant.
On April 1, 2006, we adopted SFAS No. 123R using the modified prospective transition method. We estimate the fair value of
share-based awards on the date of the grant using an option pricing model. The value of the portion of the award that is ultimately
expected to vest is recognized as expense over the requisite service periods in our Consolidated Statements of Income. The expense is
classified as cost of goods sold or selling, general and administrative expenses in a manner consistent with the employee’s compensation
and benefits.
Under the modified prospective transition method, compensation cost recognized in fiscal 2007 includes (a) compensation cost
for all share-based compensation granted, but not yet vested, as of April 1, 2006, based on the grant date fair value estimated in accordance
with the original provisions of SFAS No. 123, and (b) compensation cost for all share-based compensation granted on or subsequent to
April 1, 2006, based on the grant date fair value estimated in accordance with the provisions of SFAS No. 123R. Our consolidated financial
statements as of and for the year ended March 31, 2007 reflect the impact of SFAS No. 123R. In accordance with the modified prospective
transition method, the consolidated financial statements for prior periods have not been restated to reflect, and do not include, the impact
of SFAS No. 123R.
98

STERIS CORPORATION AND SUBSIDIARIES
NOTES TO CONSOLIDATED FINANCIAL STATEMENTS(dollars in thousands, except per share amounts)
The adoption of SFAS No. 123R on April 1, 2006 reduced our income from continuing operations before income taxes for the
years ended March 31, 2008 and March 31, 2007 by $8,617 and $9,937, respectively, and reduced net income for the same period by
$5,386 ($0.09 per basic share and $0.08 per diluted share) and $6,101 ($0.09 per basic and diluted share), respectively. The adoption of
SFAS No. 123R also required us to classify the tax benefit from the exercise of stock options for the years ended March 31, 2008 and
March 31, 2007 of $3,194 and $1,927, respectively, as a financing activity in the cash flow statement, rather than as an operating activity, as
previously required. For the year ended March 31, 2006 the tax benefit from the exercise of stock options recorded as an operating activity
in the cash flow statement was $2,455.
The following table contains pro forma disclosures regarding the effect on our net income, earnings per basic common share, and
earnings per diluted common share for the year ended March 31, 2006 had we applied a fair value method of accounting for share-based
compensation in accordance with SFAS No. 123:
Year Ended March 31, 2006
Net income:
As reported $ 70,289
Less: Stock-based compensation expense, net of income taxes, assuming the fair value method 5,879
Pro forma $ 64,410
Earnings per common share:
Basic:
As reported $ 1.03
Pro forma $ 0.94
Diluted:
As reported $ 1.02
Pro forma $ 0.93
For the purpose of computing pro forma net income, the fair value of option grants was estimated at their grant date using the
Black-Scholes-Merton option pricing model. This model was developed for use in estimating the fair value of traded options that have no
vesting restrictions and are fully transferable, characteristics that are not present in our option grants. If the model permitted consideration
of the unique characteristics of employee stock options, the resulting estimate of the fair value of the stock options could be different.
The following weighted average assumptions were used for all options granted during fiscal 2008, fiscal 2007, and fiscal 2006:
SFAS No. 123RSFAS No. 123
Pro formaFiscal 2006
ExpenseFiscal 2008
ExpenseFiscal 2007
Risk-free interest rate 5.04% 4.73% 3.95% - 4.40%
Expected life of options 5.5 years 6 years 5 years
Expected dividend yield of stock 0.93% 0.65% 0.58% - 0.66%
Expected volatility of stock 29.61% 34.29% 45.00%
99

STERIS CORPORATION AND SUBSIDIARIES
NOTES TO CONSOLIDATED FINANCIAL STATEMENTS(dollars in thousands, except per share amounts)
The risk-free interest rate is based upon the U.S. Treasury yield curve at the time of grant. The expected life of options is
reflective of our historical experience, vesting schedules and contractual terms. The expected dividend yield of stock represents our best
estimate of expected future dividend yield. The expected volatility of stock is derived by referring to our historical stock prices over a
timeframe similar to that of the expected life of the grant. We applied an estimated forfeiture rate of 2.2 percent for fiscal 2007 through the
first quarter of fiscal 2008, then 2.49 percent beginning in the second quarter of fiscal 2008. This rate is calculated based upon historical
activity and represents an estimate of the granted options not expected to vest. If actual forfeitures differ from the expected rate, we may
be required to make additional adjustments to compensation expense in future periods. The expected life and expected forfeiture rate
used for options granted in fiscal 2007 to our former Chief Executive Officer (“CEO”) were adjusted based on the terms of the
employment agreement between the Company and the former CEO entered into in September 2006.
A summary of share option activity is as follows:
Shares
WeightedAverageExercise
Price
WeightedAverage
RemainingContractual
Term
AggregateIntrinsicValue
March 31, 2005 Options Outstanding 5,739,013 20.16
Granted 986,625 24.78
Exercised (708,036) 16.71
Canceled (310,728) 26.57
March 31, 2006 Options Outstanding 5,706,874 21.02
Granted 528,225 24.44
Exercised (548,556) 16.32
Canceled (223,546) 25.82
March 31, 2007 Options Outstanding 5,462,997 21.60
Granted 576,788 27.67
Exercised (812,679) 17.91
Canceled (124,194) 26.55
March 31, 2008 Options Outstanding 5,102,912 $ 22.76 5.40 $ 23,009
Exercisable at March 31, 2008 3,849,875 $ 21.63 4.46 $ 21,679
We estimate that 1,246,351 of the non-vested stock options outstanding at March 31, 2008 will ultimately vest.
The aggregate intrinsic value in the table above represents the total pre-tax difference between the $26.83 closing price of our
common shares on March 31, 2008 over the exercise price of the stock option, multiplied by the number of options outstanding and
exercisable. Under SFAS No. 123R, the aggregate intrinsic value is not recorded for financial accounting purposes and the value changes
daily based on the daily changes in the fair market value of our common shares.
100
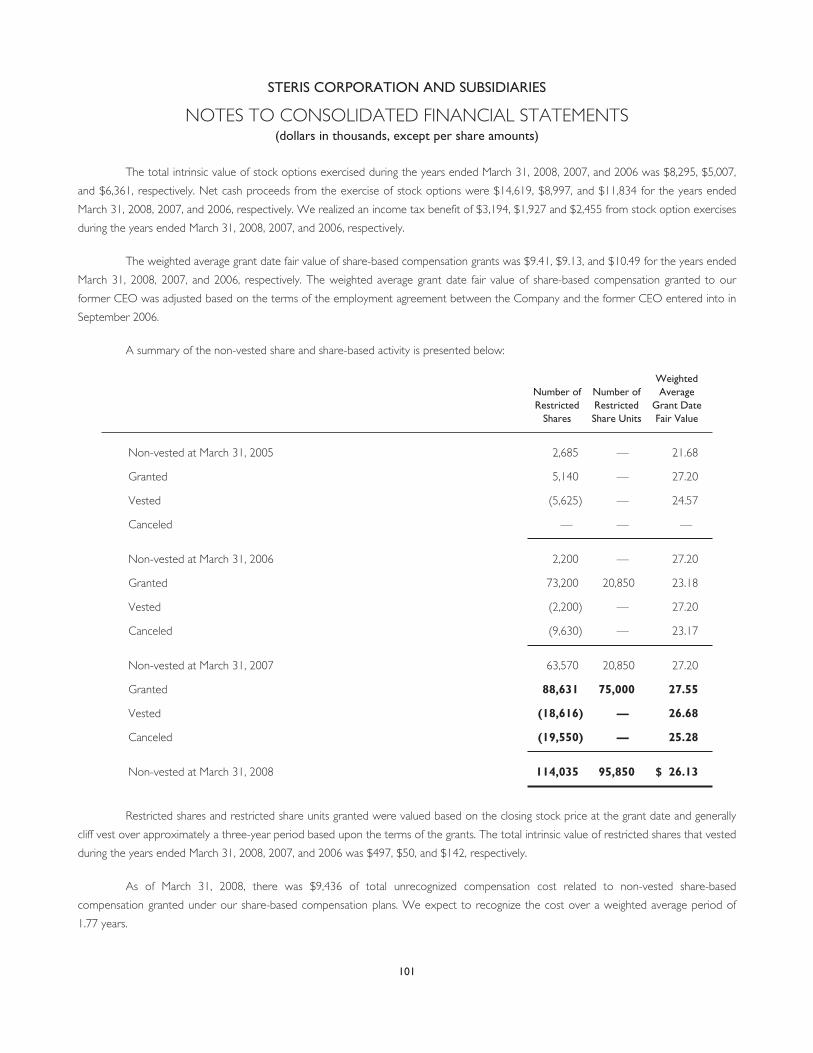
STERIS CORPORATION AND SUBSIDIARIES
NOTES TO CONSOLIDATED FINANCIAL STATEMENTS(dollars in thousands, except per share amounts)
The total intrinsic value of stock options exercised during the years ended March 31, 2008, 2007, and 2006 was $8,295, $5,007,
and $6,361, respectively. Net cash proceeds from the exercise of stock options were $14,619, $8,997, and $11,834 for the years ended
March 31, 2008, 2007, and 2006, respectively. We realized an income tax benefit of $3,194, $1,927 and $2,455 from stock option exercises
during the years ended March 31, 2008, 2007, and 2006, respectively.
The weighted average grant date fair value of share-based compensation grants was $9.41, $9.13, and $10.49 for the years ended
March 31, 2008, 2007, and 2006, respectively. The weighted average grant date fair value of share-based compensation granted to our
former CEO was adjusted based on the terms of the employment agreement between the Company and the former CEO entered into in
September 2006.
A summary of the non-vested share and share-based activity is presented below:
Number ofRestricted
Shares
Number ofRestrictedShare Units
WeightedAverage
Grant DateFair Value
Non-vested at March 31, 2005 2,685 — 21.68
Granted 5,140 — 27.20
Vested (5,625) — 24.57
Canceled — — —
Non-vested at March 31, 2006 2,200 — 27.20
Granted 73,200 20,850 23.18
Vested (2,200) — 27.20
Canceled (9,630) — 23.17
Non-vested at March 31, 2007 63,570 20,850 27.20
Granted 88,631 75,000 27.55
Vested (18,616) — 26.68
Canceled (19,550) — 25.28
Non-vested at March 31, 2008 114,035 95,850 $ 26.13
Restricted shares and restricted share units granted were valued based on the closing stock price at the grant date and generally
cliff vest over approximately a three-year period based upon the terms of the grants. The total intrinsic value of restricted shares that vested
during the years ended March 31, 2008, 2007, and 2006 was $497, $50, and $142, respectively.
As of March 31, 2008, there was $9,436 of total unrecognized compensation cost related to non-vested share-based
compensation granted under our share-based compensation plans. We expect to recognize the cost over a weighted average period of
1.77 years.
101
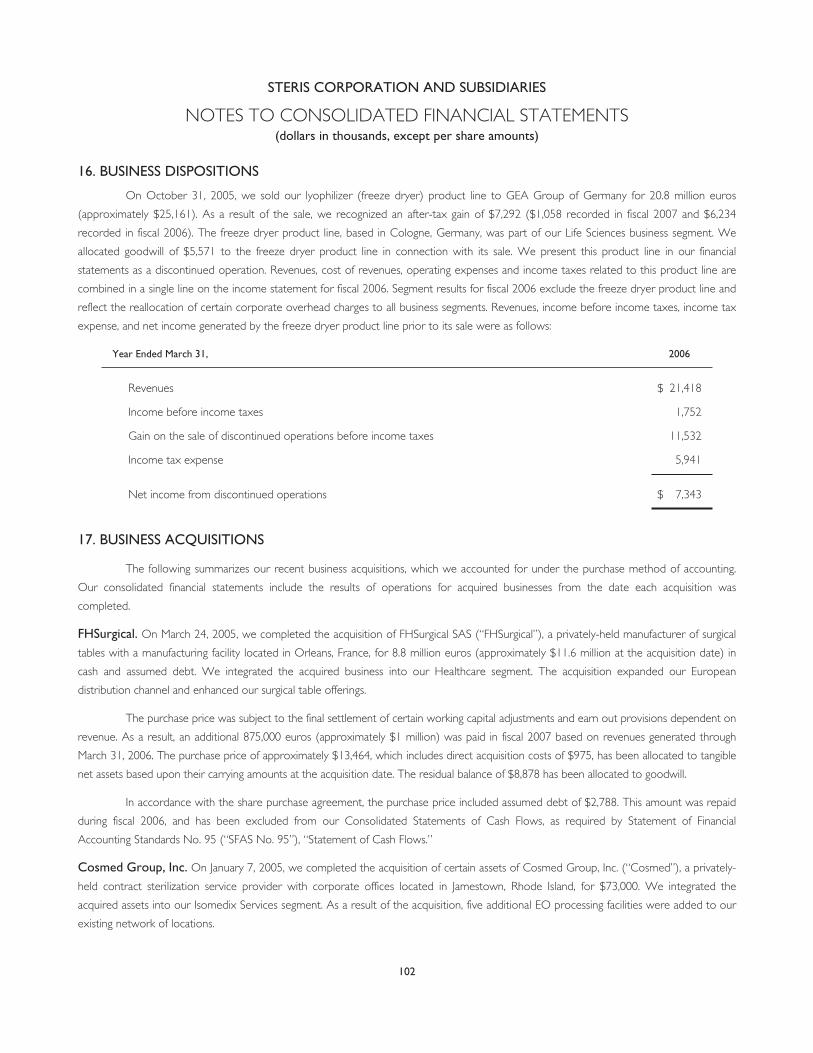
STERIS CORPORATION AND SUBSIDIARIES
NOTES TO CONSOLIDATED FINANCIAL STATEMENTS(dollars in thousands, except per share amounts)
16. BUSINESS DISPOSITIONS
On October 31, 2005, we sold our lyophilizer (freeze dryer) product line to GEA Group of Germany for 20.8 million euros
(approximately $25,161). As a result of the sale, we recognized an after-tax gain of $7,292 ($1,058 recorded in fiscal 2007 and $6,234
recorded in fiscal 2006). The freeze dryer product line, based in Cologne, Germany, was part of our Life Sciences business segment. We
allocated goodwill of $5,571 to the freeze dryer product line in connection with its sale. We present this product line in our financial
statements as a discontinued operation. Revenues, cost of revenues, operating expenses and income taxes related to this product line are
combined in a single line on the income statement for fiscal 2006. Segment results for fiscal 2006 exclude the freeze dryer product line and
reflect the reallocation of certain corporate overhead charges to all business segments. Revenues, income before income taxes, income tax
expense, and net income generated by the freeze dryer product line prior to its sale were as follows:
Year Ended March 31, 2006
Revenues $ 21,418
Income before income taxes 1,752
Gain on the sale of discontinued operations before income taxes 11,532
Income tax expense 5,941
Net income from discontinued operations $ 7,343
17. BUSINESS ACQUISITIONS
The following summarizes our recent business acquisitions, which we accounted for under the purchase method of accounting.
Our consolidated financial statements include the results of operations for acquired businesses from the date each acquisition was
completed.
FHSurgical. On March 24, 2005, we completed the acquisition of FHSurgical SAS (“FHSurgical”), a privately-held manufacturer of surgical
tables with a manufacturing facility located in Orleans, France, for 8.8 million euros (approximately $11.6 million at the acquisition date) in
cash and assumed debt. We integrated the acquired business into our Healthcare segment. The acquisition expanded our European
distribution channel and enhanced our surgical table offerings.
The purchase price was subject to the final settlement of certain working capital adjustments and earn out provisions dependent on
revenue. As a result, an additional 875,000 euros (approximately $1 million) was paid in fiscal 2007 based on revenues generated through
March 31, 2006. The purchase price of approximately $13,464, which includes direct acquisition costs of $975, has been allocated to tangible
net assets based upon their carrying amounts at the acquisition date. The residual balance of $8,878 has been allocated to goodwill.
In accordance with the share purchase agreement, the purchase price included assumed debt of $2,788. This amount was repaid
during fiscal 2006, and has been excluded from our Consolidated Statements of Cash Flows, as required by Statement of Financial
Accounting Standards No. 95 (“SFAS No. 95”), “Statement of Cash Flows.”
Cosmed Group, Inc. On January 7, 2005, we completed the acquisition of certain assets of Cosmed Group, Inc. (“Cosmed”), a privately-
held contract sterilization service provider with corporate offices located in Jamestown, Rhode Island, for $73,000. We integrated the
acquired assets into our Isomedix Services segment. As a result of the acquisition, five additional EO processing facilities were added to our
existing network of locations.
102

STERIS CORPORATION AND SUBSIDIARIES
NOTES TO CONSOLIDATED FINANCIAL STATEMENTS(dollars in thousands, except per share amounts)
The purchase price of $75,048, which includes direct acquisition costs of $2,048, has been allocated to net assets and goodwill
based on the valuation of net assets acquired. As of March 31, 2006, $29,736 was allocated to goodwill within our Isomedix Services
segment and $20,275 was allocated to identifiable intangible assets, such as Customer relationships, trademarks, intellectual property, and
non-competition agreements. Based upon the allocation, these amounts are expected to be amortized over periods ranging from 5 to 19
years, with annual amortization amounts expected to be approximately $1,900 through fiscal 2010, approximately $1,400 in fiscal 2011
through 2015, and approximately $160 thereafter through the end of the amortization period.
In accordance with the terms of the asset purchase agreement, the purchase price was paid in multiple installments with $65,700
being paid in fiscal 2005. As of March 31, 2008 and 2007, the holdback amount of $1,263 is included in “Accrued expenses and other” on
the accompanying Consolidated Balance Sheets. The holdback amount is excluded from our Consolidated Statements of Cash Flows until
paid, as required by SFAS No. 95.
Hamo Holding AG. We acquired Hamo Holding AG (“Hamo”), a privately-owned manufacturer of washing and decontamination
systems, with corporate offices located in Pieterlen, Switzerland during fiscal 2004. Pursuant to the terms of the share purchase agreement
with respect to the acquisition of Hamo, the final settlement of certain working capital adjustments and the resolution of certain
indemnification claims were made during the first quarter of fiscal 2006. We received 2.2 million Swiss francs (approximately $1,700) and
this amount is included in “Interest and miscellaneous income” within “Non-operating expenses” on our accompanying Consolidated
Statements of Income.
18. FINANCIAL AND OTHER GUARANTEES
We generally offer a limited one-year parts and labor warranty on our capital equipment. The specific terms and conditions of
those warranties vary depending on the product sold and the country where we conduct business. We record a liability for the estimated
cost of product warranties at the time product revenue is recognized. The amounts we expect to incur on behalf of our Customers for the
future estimated cost of these warranties are recorded as a current liability on the accompanying Consolidated Balance Sheets. Factors that
affect the amount of our warranty liability include the number and type of installed units, historical and anticipated rates of product failures,
and material and service costs per claim. We periodically assess the adequacy of our recorded warranty liabilities and adjust the recorded
amounts as necessary.
Changes in our warranty liability during the periods presented are as follows:
Years Ended March 31, 2008 2007 2006
Balance, beginning of year $ 5,893 $ 7,226 $ 5,299
Warranties issued during the period 13,557 9,931 10,468
Settlements made during the period (11,625) (11,264) (8,541)
Balance, end of year $ 7,825 $ 5,893 $ 7,226
We also sell product maintenance contracts to our Customers. These contracts range in terms from 1 to 5 years and require us
to maintain and repair the product over the maintenance contract term. We initially record amounts due from Customers under these
contracts as a liability for deferred service contract revenue on the accompanying Consolidated Balance Sheets. The liability recorded for
deferred service revenue was $16,829 and $16,751 as of March 31, 2008 and 2007, respectively. Such deferred revenue is then amortized
on a straight-line basis over the contract term and recognized as service revenue on the accompanying Consolidated Statements of Income.
The activity related to the liability for deferred service revenue has been excluded from the table presented above.
103

STERIS CORPORATION AND SUBSIDIARIES
NOTES TO CONSOLIDATED FINANCIAL STATEMENTS(dollars in thousands, except per share amounts)
19. SUBSEQUENT EVENTS
Subsequent to March 31, 2008, foreign currency contracts to sell 4.0 million euros and 160.0 million Japanese yen and to buy
4.0 million euros and 3.6 million Canadian dollars matured. Subsequent to March 31, 2008 we entered into foreign currency contracts to
sell 100.0 million Japanese yen and to buy 4.9 million euros and 4.0 million Canadian dollars.
On April 23, 2008, we announced that the Company’s Board of Directors had declared a quarterly cash dividend in the amount
of $0.06 per common share, payable on June 11, 2008, to shareholders of record as of the closing of the stock transfer books on May 14,
2008.
Subsequent to March 31, 2008 and through May 16, 2008, we repurchased 920,900 of our common shares for an aggregate of
$25,556, representing an average price of $27.75 per common share.
Pursuant to the authorization of the Compensation and Corporate Governance Committee of the Company’s Board of
Directors the following awards were made to directors, officers, and certain key employees of the Company on May 21, 2008: a total of
511,120 stock options at an exercise price of $30.84 per share, and 76,665, 3,300, and 23,580 restricted shares, restricted share units and
stock appreciation rights, respectively, each with a grant date fair value of $30.84 per share.
104

STERIS CORPORATION AND SUBSIDIARIES
NOTES TO CONSOLIDATED FINANCIAL STATEMENTS(dollars in thousands, except per share amounts)
20. QUARTERLY RESULTS (UNAUDITED)
Quarters Ended March 31 December 31 September 30 June 30
Fiscal 2008Revenues:
Product $255,495 $201,743 $182,451 $172,369Service 119,675 112,231 112,551 108,575
Total Revenues 375,170 313,974 295,002 280,944Cost of revenues:Product 156,898 119,922 108,246 101,875Service 66,896 63,853 63,086 60,357
Total cost of revenues 223,794 183,775 171,332 162,232
Gross profit 151,376 130,199 123,670 118,712Percentage of revenues 40.3% 41.5% 41.9% 42.3%Restructuring expenses (2) 12,420 952 698 1,391
Net income $ 26,109 $ 21,776 $ 16,018 $ 13,203
Basic income per common share (1):Net income $ 0.43 $ 0.35 $ 0.25 $ 0.20
Diluted income per common share (1):Net income $ 0.42 $ 0.34 $ 0.25 $ 0.20
Fiscal 2007Revenues:
Product $ 235,490 $ 192,945 $ 179,375 $ 165,759Service 114,347 106,022 104,161 99,308
Total Revenues 349,837 298,967 283,536 265,067Cost of revenues:Product 140,791 112,072 106,347 95,293Service 64,076 59,194 58,428 56,399
Total cost of revenues 204,867 171,266 164,775 151,692
Gross profit 144,970 127,701 118,761 113,375Percentage of revenues 41.4% 42.7% 41.9% 42.8%Restructuring expenses 1,142 3,179 1,158 1,105Income from continuing operations, net of tax 29,812 20,868 16,360 14,057Gain on sale of discontinued operations, net of tax — 431 — 627
Net income $ 29,812 $ 21,299 $ 16,360 $ 14,684
Basic income per common share (1):Income from continuing operations $ 0.46 $ 0.32 $ 0.25 $ 0.21Net income $ 0.46 $ 0.33 $ 0.25 $ 0.22
Diluted income per common share (1):Income from continuing operations $ 0.45 $ 0.32 $ 0.25 $ 0.21Net income $ 0.45 $ 0.33 $ 0.25 $ 0.22
(1) Per share amounts for the quarters and the full year have been computed separately. Accordingly, quarterly amounts may not add tothe annual amounts because of differences in the average shares outstanding during each quarter due to the effect of potentiallydilutive securities only in the periods in which such effect would be dilutive and the effect of quarterly share repurchases.
(2) Does not include charges of $4,084 incurred in the fourth quarter of fiscal 2008 that were recorded within “Cost of revenues” in theaccompanying Consolidated Statements of Income.
105

SCHEDULE II – VALUATION AND QUALIFYING ACCOUNTS
Description
Balance atBeginningof Period
Chargesto Costs
andExpenses
Chargesto OtherAccounts Deductions
Balance atEnd ofPeriod
(in thousands)
Year ended March 31, 2008
Deducted from asset accounts:
Allowance for trade accounts
receivable (1) $ 9,911 $2,308 $ 109(3) $(2,932)(5) $ 9,396
Inventory valuation reserve 10,892 1,202(2) 846(3) — 12,940
Recorded within liabilities:
Self insured risk retention – GRIC
reserve $16,602 $3,105 $ — $(3,307) $16,400
Year ended March 31, 2007
Deducted from asset accounts:
Allowance for trade accounts
receivable (1) $ 9,037 $ 3,247 $ 66(3) $ (2,439)(5) $ 9,911
Inventory valuation reserve 11,573 (917)(2) 236(3) — 10,892
Recorded within liabilities:
Self insured risk retention – GRIC
reserve $ 16,090 $ 3,273 $ 496(4) $ (3,257) $ 16,602
Year ended March 31, 2006
Deducted from asset accounts:
Allowance for trade accounts
receivable (1) $ 9,725 $ 2,248 $ (18)(3) $ (2,918)(5) $ 9,037
Inventory valuation reserve 9,942 2,394(2) (313)(3) — 11,573
Recorded within liabilities:
Self insured risk retention – GRIC
reserve $ 16,042 $ 4,256 $ — $ (4,208) $ 16,090
(1) Net allowance for doubtful accounts and allowance for sales and returns.
(2) Provision for excess and obsolete inventory, net of inventory written off.
(3) Change in foreign currency exchange, international subsidiaries.
(4) Transfer of reserves from a state-sponsored workers’ compensation program to our GRIC reserves.
(5) Uncollectible accounts written off, net of recoveries.
ITEM 9. CHANGES IN AND DISAGREEMENTS WITH ACCOUNTANTS ONACCOUNTING AND FINANCIAL DISCLOSURE
None.
106

ITEM 9A. CONTROLS AND PROCEDURES
EVALUATION OF DISCLOSURE CONTROLS AND PROCEDURES
Our management, including the Principal Executive Officer (“PEO”) and Principal Financial Officer (“PFO”), has evaluated the
effectiveness of our disclosure controls and procedures, as defined in Exchange Act Rules 13a-15(e) and 15d-15(e), as of March 31, 2008.
Based on this evaluation, the PEO and PFO have determined that, as of March 31, 2008, our disclosure controls and procedures were
effective.
MANAGEMENT’S REPORT ON INTERNAL CONTROL OVER FINANCIAL REPORTING
Management is responsible for establishing and maintaining adequate internal control over financial reporting, as such term is
defined in the Exchange Act Rules 13a-15(f) and 15(d)-15(f). Under the supervision and with the participation of management, including the
PEO and PFO, we conducted an evaluation of the effectiveness of internal control over financial reporting as of March 31, 2008 based on
the framework in Internal Control-Integrated Framework issued by the Committee of Sponsoring Organizations of the Treadway
Commission (“COSO”). Based on this evaluation under this framework, management concluded that the internal control over financial
reporting was effective as of March 31, 2008.
CHANGES IN INTERNAL CONTROLS
During the quarter ended March 31, 2008, there were no changes in our internal control over financial reporting that have
materially affected, or are reasonably likely to materially affect, our internal control over financial reporting.
107

REPORT OF INDEPENDENT REGISTERED PUBLIC ACCOUNTING FIRM
Board of Directors and Shareholders
STERIS Corporation
We have audited STERIS Corporation and subsidiaries’ internal control over financial reporting as of March 31, 2008, based on
criteria established in Internal Control-Integrated Framework issued by the Committee of Sponsoring Organizations of the Treadway
Commission (the “COSO criteria”). STERIS Corporation and subsidiaries’ management is responsible for maintaining effective internal
control over financial reporting, and for its assessment of the effectiveness of internal control over financial reporting included in the
accompanying Management’s Report on Internal Control Over Financial Reporting. Our responsibility is to express an opinion on STERIS
Corporation and subsidiaries’ internal control over financial reporting based on our audit.
We conducted our audit in accordance with the standards of the Public Company Accounting Oversight Board (United States).
Those standards require that we plan and perform the audit to obtain reasonable assurance about whether effective internal control over
financial reporting was maintained in all material respects. Our audit included obtaining an understanding of internal control over financial
reporting, assessing the risk that a material weakness exists, testing and evaluating the design and operating effectiveness of internal control
based on the assessed risk, and performing such other procedures as we considered necessary in the circumstances. We believe that our
audit provides a reasonable basis for our opinion.
A company’s internal control over financial reporting is a process designed to provide reasonable assurance regarding the
reliability of financial reporting and the preparation of financial statements for external purposes in accordance with generally accepted
accounting principles. A company’s internal control over financial reporting includes those policies and procedures that (1) pertain to the
maintenance of records that, in reasonable detail, accurately and fairly reflect the transactions and dispositions of the assets of the company;
(2) provide reasonable assurance that transactions are recorded as necessary to permit preparation of financial statements in accordance
with generally accepted accounting principles, and that receipts and expenditures of the company are being made only in accordance with
authorizations of management and directors of the company; and (3) provide reasonable assurance regarding prevention or timely
detection of unauthorized acquisition, use, or disposition of the company’s assets that could have a material effect on the financial
statements.
Because of its inherent limitations, internal control over financial reporting may not prevent or detect misstatements. Also,
projections of any evaluation of effectiveness to future periods are subject to the risk that controls may become inadequate because of
changes in conditions, or that the degree of compliance with the policies or procedures may deteriorate.
In our opinion, STERIS Corporation and subsidiaries maintained, in all material respects, effective internal control over financial
reporting as of March 31, 2008, based on the COSO criteria.
We also have audited, in accordance with the standards of the Public Company Accounting Oversight Board (United States), the
consolidated balance sheets of STERIS Corporation and subsidiaries as of March 31, 2008 and 2007, and the related consolidated
statements of income, shareholders’ equity, and cash flows for each of the three years in the period ended March 31, 2008, and our report
dated May 28, 2008 expressed an unqualified opinion thereon.
/s/ ERNST & YOUNG LLP
Cleveland, Ohio
May 28, 2008
108

ITEM 9B. OTHER INFORMATION
None.
PART III
ITEM 10. DIRECTORS, EXECUTIVE OFFICERS AND CORPORATE GOVERNANCE
Our Annual Report on Form 10-K incorporates by reference the information appearing under the caption “Nominees for
Election as Directors,” “Section 16(a) Beneficial Ownership Reporting Compliance,” “Board Meetings and Committees” and “Shareholder
Nominations of Directors and Nominee Criteria” of our definitive proxy statement to be filed with the SEC in connection with our 2008
Annual Meeting of Shareholders (the “Proxy Statement”).
Our executive officers (other than Mr. Voyzey, who serves at the pleasure of the President and CEO) serve for a term of one
year from the date of election to the next organizational meeting of the Board of Directors and until their respective successors are elected
and qualified, except in the case of death, resignation, or removal. Information concerning our executive officers is contained in Part I,
following Item 4 of this Annual Report. We have adopted a code of ethics, our Code of Business Conduct for Employees, that applies to
our PEO and PFO and Principal Accounting Officer as well as all our other employees. We have also adopted a code of ethics, our
Director Code of Ethics, that applies to the members of the Company’s Board of Directors, including our PEO. Our Code of Business
Conduct for Employees and the Director Code of Ethics can be found on our Investor Relations website at www.steris-ir.com. Any
amendments or waivers of either of these codes will be made available on this website.
ITEM 11. EXECUTIVE COMPENSATION
Our Annual Report on Form 10-K incorporates by reference the information appearing beginning under the captions “Executive
Compensation,” “Non-Employee Director Compensation” and “Miscellaneous Matters” of the Proxy Statement.
ITEM 12. SECURITY OWNERSHIP OF CERTAIN BENEFICIAL OWNERS ANDMANAGEMENT AND RELATED STOCKHOLDER MATTERS
Our Annual Report on Form 10-K incorporates by reference the information appearing under the caption “Ownership of Voting
Securities” of the Proxy Statement.
109
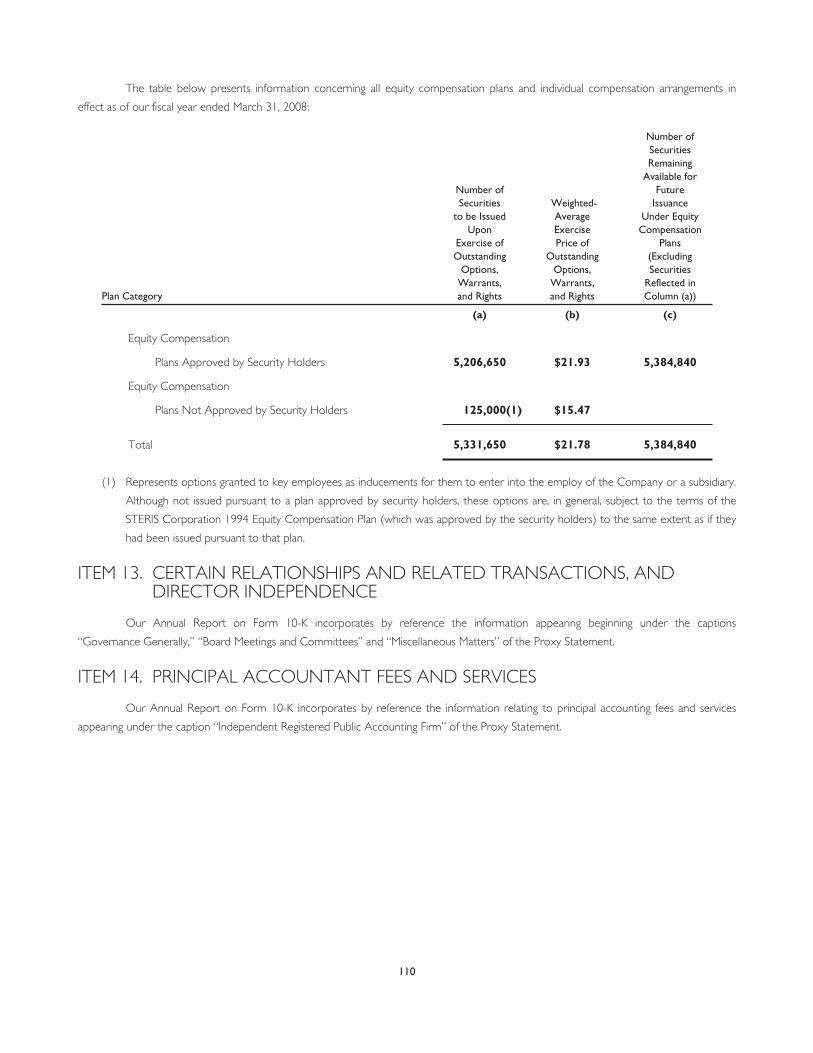
The table below presents information concerning all equity compensation plans and individual compensation arrangements in
effect as of our fiscal year ended March 31, 2008:
Plan Category
Number ofSecurities
to be IssuedUpon
Exercise ofOutstanding
Options,Warrants,and Rights
Weighted-AverageExercisePrice of
OutstandingOptions,
Warrants,and Rights
Number ofSecuritiesRemaining
Available forFuture
IssuanceUnder Equity
CompensationPlans
(ExcludingSecurities
Reflected inColumn (a))
(a) (b) (c)
Equity Compensation
Plans Approved by Security Holders 5,206,650 $21.93 5,384,840
Equity Compensation
Plans Not Approved by Security Holders 125,000(1) $15.47
Total 5,331,650 $21.78 5,384,840
(1) Represents options granted to key employees as inducements for them to enter into the employ of the Company or a subsidiary.
Although not issued pursuant to a plan approved by security holders, these options are, in general, subject to the terms of the
STERIS Corporation 1994 Equity Compensation Plan (which was approved by the security holders) to the same extent as if they
had been issued pursuant to that plan.
ITEM 13. CERTAIN RELATIONSHIPS AND RELATED TRANSACTIONS, ANDDIRECTOR INDEPENDENCE
Our Annual Report on Form 10-K incorporates by reference the information appearing beginning under the captions
“Governance Generally,” “Board Meetings and Committees” and “Miscellaneous Matters” of the Proxy Statement.
ITEM 14. PRINCIPAL ACCOUNTANT FEES AND SERVICES
Our Annual Report on Form 10-K incorporates by reference the information relating to principal accounting fees and services
appearing under the caption “Independent Registered Public Accounting Firm” of the Proxy Statement.
110

PART IV
ITEM 15. EXHIBITS AND FINANCIAL STATEMENT SCHEDULE
LIST OF CONSOLIDATED FINANCIAL STATEMENTS AND FINANCIAL STATEMENT SCHEDULE(a) (1) The following consolidated financial statements of STERIS Corporation and subsidiaries are included in Item 8:
Consolidated Balance Sheets – March 31, 2008 and 2007.
Consolidated Statements of Income – Years ended March 31, 2008, 2007, and 2006.
Consolidated Statements of Cash Flows – Years ended March 31, 2008, 2007, and 2006.
Consolidated Statements of Shareholders’ Equity – Years ended March 31, 2008, 2007, and 2006.
Notes to Consolidated Financial Statements.
(a) (2) The following consolidated financial statement schedule of STERIS Corporation and subsidiaries is included in Item 8:
Schedule II – Valuation and Qualifying Accounts
All other schedules for which provision is made in the applicable accounting regulation of the SEC are not required under the
related instructions or are inapplicable and, therefore, have been omitted.
(a) (3) Exhibits
ExhibitNumber Exhibit Description
3.1 1992 Amended Articles of Incorporation of STERIS Corporation, as amended on May 14, 1996, November 6, 1996, and
August 6, 1998 (filed as Exhibit 3.1 to Form 10-K filed for the fiscal year ended March 31, 2000 (Commission File
No. 1-14643), and incorporated herein by reference).
3.2 Amended and Restated Regulations of STERIS Corporation, as amended on July 26, 2007 (filed as Exhibit 3.2 to Form 10-Q
for the fiscal quarter ended June 30, 2007 (Commission File No. 1-14643), and incorporated herein by reference).
4.1 Specimen Form of Common Stock Certificate (filed as Exhibit 4.1 to Form 10-K filed for the fiscal year ended March 31, 2002
(Commission File No. 1-14643), and incorporated herein by reference).
10.1 Amended and Restated Non-Qualified Stock Option Plan (filed as Exhibit 10.1 to Form 10-K filed for the fiscal year ended
March 31, 2005 (Commission File No. 1-14643) and incorporated herein by reference).*
10.2 STERIS Corporation 1994 Equity Compensation Plan (filed as Exhibit 10.2 to Form 10-K filed for the fiscal year ended
March 31, 2005 (Commission File No. 1-14643) and incorporated herein by reference).*
10.3 STERIS Corporation 1994 Nonemployee Directors Equity Compensation Plan (filed as Exhibit 10.3 to Form 10-K filed for the
fiscal year ended March 31, 2002 (Commission File No. 1-14643), and incorporated herein by reference).*
10.4 STERIS Corporation Form of Nonqualified Stock Option Grant Agreement for Directors (filed as Exhibit 10.4 to Form 10-Q
for the fiscal quarter ended December 31, 2004 (Commission File No. 1-14643), and incorporated herein by reference).*
10.5 STERIS Corporation Form of Nonqualified Stock Option Agreement for Employees (filed as Exhibit 10.2 to Form 10-Q for
the fiscal quarter ended December 31, 2004 (Commission File No. 1-14643), and incorporated herein by reference).*
10.6 STERIS Corporation 1997 Stock Option Plan (filed as Exhibit 10.5 to Form 10-K for the fiscal year ended March 31, 2003
(Commission File No. 1-14643), and incorporated herein by reference).*
10.7 STERIS Corporation 1998 Long-Term Incentive Stock Plan (filed as Exhibit 10.8 to Form 10-K for fiscal year ended March 31,
1999 (Commission File No. 1-14643), and incorporated herein by reference).*
111

ExhibitNumber Exhibit Description
10.8 STERIS Corporation 2002 Stock Option Plan (filed as Exhibit 10.7 to Form 10-K for the fiscal year ended March 31, 2003
(Commission File No. 1-14643), and incorporated herein by reference).*
10.9 STERIS Corporation 2006 Long-Term Equity Incentive Plan (filed as Exhibit 10.1 to Form 8-K filed July 28, 2006 (Commission
File No. 1-14643) and incorporated herein by reference).*
10.10 Amendment No. 1 to STERIS Corporation 2006 Long-Term Equity Incentive Plan (filed as Exhibit 10.11 to Form 10-K for the
fiscal year ended March 31, 2007 (Commission File No. 1-14643), and incorporated herein by reference).*
10.11 STERIS Corporation Form of Restricted Stock Agreement for Employees (filed as Exhibit 10.3 to Form 8-K filed July 28, 2006
(Commission File No. 1-14643) and incorporated herein by reference).*
10.12 STERIS Corporation Form of Restricted Stock Agreement for Directors (filed as Exhibit 10.5 to Form 8-K filed July 28, 2006
(Commission File No. 1-14643) and incorporated herein by reference).*
10.13 STERIS Corporation Form of Restricted Stock Unit Agreement for Employees (filed as Exhibit 10.5 to Form 10-Q filed for the
fiscal quarter ended September 30, 2007 (Commission File No. 1-14643) and incorporated herein by reference).*
10.14 STERIS Corporation Form of Nonqualified Stock Option Agreement for Employees (filed as Exhibit 10.7 to Form 10-Q filed
for the fiscal quarter ended September 30, 2006 (Commission File No. 1-14643) and incorporated herein by reference).*
10.15 STERIS Corporation Form of Nonqualified Stock Option Agreement for Nonemployee Directors (filed as Exhibit 10.8 to
Form 10-Q filed for the fiscal quarter ended September 30, 2006 (Commission File No. 1-14643) and incorporated herein by
reference).*
10.16 STERIS Corporation Deferred Compensation Plan Document (filed as Exhibit 10.1 to Form 8-K filed September 1, 2006
(Commission File No. 1-14643) and incorporated herein by reference).*
10.17 Adoption Agreement related to STERIS Corporation Deferred Compensation Plan Document (filed as Exhibit 10.2 to Form
8-K filed September 1, 2006 (Commission File No. 1-14643) and incorporated herein by reference).*
10.18 STERIS Corporation Management Incentive Compensation Plan (as amended) (filed as Exhibit 10.2 to Form 8-K filed August
3, 2005 (Commission File No. 1-14643) and incorporated herein by reference).*
10.19 STERIS Corporation Senior Executive Management Incentive Compensation Plan (filed as Exhibit 10.1 to Form 8-K filed
August 3, 2005 (Commission File No. 1-14643), and incorporated herein by reference).*
10.20 Form of Change of Control Agreement between STERIS Corporation and the executive officers of STERIS Corporation other
than Mr. Walter M Rosebrough, Jr. (filed as Exhibit 10.2 to Form 10-Q filed for the quarter ended June 30, 1999 (Commission
File No. 1-14643), and incorporated herein by reference).*
10.21 Employment Agreement dated September 7, 2006 between STERIS Corporation and Mr. Les Vinney (filed as Exhibit 10.1 to
Form 8-K filed September 11, 2006 (Commission File No. 1-14643), and incorporated herein by reference).*
10.22 Employment Agreement dated May 7, 2007 between STERIS Corporation and Mr. Vinney (filed as Exhibit 10.1 to Form 8-K
filed May 8, 2007 (Commission File No. 1-14643), and incorporated herein by reference).*
10.23 Employment Agreement dated September 7, 2007 between STERIS Corporation and Mr. Rosebrough (filed as Exhibit 10.3 to
Form 10-Q for the fiscal quarter ended September 30, 2007 (Commission File No. 1-14643), and incorporated herein by
reference).*
10.24 Agreement dated September 7, 2007 between STERIS Corporation and Mr. Rosebrough (filed as Exhibit 10.4 to Form 10-Q
for the fiscal quarter ended September 30, 2007 (Commission File No. 1-14643), and incorporated herein by reference).*
10.25 Executive Retention Agreement dated May 29, 2007 between STERIS Corporation and Dr. Peter Burke (filed as Exhibit 10.24
to Form 10-K for the fiscal year ended March 31, 2007 (Commission File No. 1-14643) and incorporated herein by
reference).*
112

ExhibitNumber Exhibit Description
10.26 Letter Agreement dated November 27, 2006 between STERIS Corporation and Michael Tokich (filed as Exhibit 10.25 to
Form 10-K for the fiscal year ended March 31, 2007 (Commission File No. 1-14643), and incorporated herein by reference).*
10.27 Agreement dated as of April 23, 2008 by and among STERIS Corporation, Richard C. Breeden, Robert H. Fields, and the
Breeden Investors identified therein (filed as Exhibit 10.1 to Form 8-K filed April 24, 2008 (Commission File No. 1-14643), and
incorporated herein by reference).
10.28 Second Amended and Restated Credit Agreement, dated September 13, 2007, among STERIS Corporation, KeyBank National
Association, as agent for the lenders from time to time party thereto, and such lenders (filed as Exhibit 10.1 to Form 10-Q for
the fiscal quarter ended September 30, 2007 (Commission File No. 1-14643), and incorporated herein by reference).
10.29 Note Purchase Agreement, dated December 17, 2003, between STERIS Corporation and certain institutional investors (filed
as Exhibit 10.3 to Form 10-Q filed for the third quarter ended December 31, 2003 (Commission File No. 1-14643), and
incorporated herein by reference).
10.30 Subsidiary Guaranty, dated December 17, 2003, by certain subsidiaries of STERIS Corporation (filed as Exhibit 10.4 to Form
10-Q filed for the third quarter ended December 31, 2003 (Commission File No. 1-14643), and incorporated herein by
reference).
10.31 Guaranty Supplement dated March 29, 2004, by SterilTek Holdings, Inc. and STERIS Corporation (filed as Exhibit 10.16 to
Form 10-K for the fiscal year ended March 31, 2004 (Commission File No. 1-14643), and incorporated herein by reference).
10.32 Guaranty Supplement dated January 7, 2005, by STERIS Isomedix Services, Inc. and STERIS Corporation (filed as Exhibit 10.20
to Form 10-K for the fiscal year ended March 31, 2005 (Commission File No. 1-14643), and incorporated herein by
reference).
10.33 Guaranty Supplement dated September 25, 2007 by HSTD LLC and STERIS Corporation (filed as Exhibit 10.2 to Form 10-Q
for the fiscal quarter ended September 30, 2007 (Commission File No. 1-14643), and incorporated herein by reference).
10.34 Asset Purchase Agreement dated as of November 15, 2004, between Cosmed Group, Inc. and STERIS Corporation (filed as
Exhibit 10.1 to Form 10-Q for the third quarter ended December 31, 2004 (Commission File No. 1-14643), and incorporated
herein by reference).
21.1 Subsidiaries of STERIS Corporation
23.1 Consent of Independent Registered Public Accounting Firm
24.1 Power of Attorney
31.1 Certification of the Principal Executive Officer Pursuant to Exchange Act Rule 13a-14(a)/15d-14(a)
31.2 Certification of the Principal Financial Officer Pursuant to Exchange Act Rule 13a-14(a)/15d-14(a)
32.1 Certification of the Principal Executive Officer and the Principal Financial Officer Pursuant to Section 906 of the Sarbanes-
Oxley Act of 2002
* A management contract or compensatory plan or arrangement required to be filed as an exhibit hereto.
STERIS or its subsidiaries are parties to several indentures relating to long-term debt instruments, which, individually or in the
aggregate, do not exceed 10% of the total assets of STERIS and its subsidiaries on a consolidated basis. STERIS will furnish a copy of any
such indenture to the SEC upon request.
(b) Exhibits
The response to this portion of Item 15 is included under (a) (3) of this Item 15.
(c) Financial Statement Schedules
Not applicable.
113

SIGNATURESPursuant to the requirements of Sections 13 or 15(d) of the Securities Exchange Act of 1934, the Registrant has duly caused this
report to be signed on its behalf by the undersigned, thereunto duly authorized, on the date indicated.
STERIS CORPORATION
(Registrant)
Date May 30, 2008 By: /S/ MICHAEL J. TOKICH
Michael J. TokichSenior Vice President and Chief Financial Officer
Pursuant to the requirements of the Securities Exchange Act of 1934, this report has been signed below by the following persons
on behalf of the Registrant and in the capacities and on the date indicated.
SIGNATURE TITLE DATE
/S/ WALTER M ROSEBROUGH, JR.
Walter M Rosebrough, Jr.
President, Chief Executive Officer and Director May 30, 2008
/S/ MICHAEL J. TOKICH
Michael J. Tokich
Senior Vice President and Chief Financial Officer May 30, 2008
*
John P. Wareham
Chairman and Director May 30, 2008
*
Richard C. Breeden
Director May 30, 2008
*
Cynthia L. Feldmann
Director May 30, 2008
*
Robert H. Fields
Director May 30, 2008
*
Jacqueline B. Kosecoff
Director May 30, 2008
*
Raymond A. Lancaster
Director May 30, 2008
*
Kevin M. McMullen
Director May 30, 2008
*
J. B. Richey
Director May 30, 2008
*
Mohsen J. Sohi
Director May 30, 2008
*
Loyal W. Wilson
Director May 30, 2008
*
Michael B. Wood
Director May 30, 2008
* The undersigned, by signing his name hereto, does sign and execute this Annual Report on Form 10-K pursuant to the Powers of
Attorney executed by the above-named directors of the Registrant and filed with the Securities and Exchange Commission on behalf
of such directors.
By: /S/ MARK D. MCGINLEY
Date: May 30, 2008 Mark D. McGinley,Attorney-in-Fact for Directors
114

EXHIBIT INDEXExhibitNumber Exhibit Description
3.1 1992 Amended Articles of Incorporation of STERIS Corporation, as amended on May 14, 1996, November 6, 1996, and
August 6, 1998 (filed as Exhibit 3.1 to Form 10-K filed for the fiscal year ended March 31, 2000 (Commission File
No. 1-14643), and incorporated herein by reference).
3.2 Amended and Restated Regulations of STERIS Corporation, as amended on July 26, 2007 (filed as Exhibit 3.2 to Form 10-Q
for the fiscal quarter ended June 30, 2007 (Commission File No. 1-14643), and incorporated herein by reference).
4.1 Specimen Form of Common Stock Certificate (filed as Exhibit 4.1 to Form 10-K filed for the fiscal year ended March 31, 2002
(Commission File No. 1-14643), and incorporated herein by reference).
10.1 Amended and Restated Non-Qualified Stock Option Plan (filed as Exhibit 10.1 to Form 10-K filed for the fiscal year ended
March 31, 2005 (Commission File No. 1-14643) and incorporated herein by reference).
10.2 STERIS Corporation 1994 Equity Compensation Plan (filed as Exhibit 10.2 to Form 10-K filed for the fiscal year ended
March 31, 2005 (Commission File No. 1-14643) and incorporated herein by reference).
10.3 STERIS Corporation 1994 Nonemployee Directors Equity Compensation Plan (filed as Exhibit 10.3 to Form 10-K filed for the
fiscal year ended March 31, 2002 (Commission File No. 1-14643), and incorporated herein by reference).
10.4 STERIS Corporation Form of Nonqualified Stock Option Grant Agreement for Directors (filed as Exhibit 10.4 to Form 10-Q
for the fiscal quarter ended December 31, 2004 (Commission File No. 1-14643), and incorporated herein by reference).
10.5 STERIS Corporation Form of Nonqualified Stock Option Agreement for Employees (filed as Exhibit 10.2 to Form 10-Q for
the fiscal quarter ended December 31, 2004 (Commission File No. 1-14643), and incorporated herein by reference).
10.6 STERIS Corporation 1997 Stock Option Plan (filed as Exhibit 10.5 to Form 10-K for the fiscal year ended March 31, 2003
(Commission File No. 1-14643), and incorporated herein by reference).
10.7 STERIS Corporation 1998 Long-Term Incentive Stock Plan (filed as Exhibit 10.8 to Form 10-K for fiscal year ended March 31,
1999 (Commission File No. 1-14643), and incorporated herein by reference).
10.8 STERIS Corporation 2002 Stock Option Plan (filed as Exhibit 10.7 to Form 10-K for the fiscal year ended March 31, 2003
(Commission File No. 1-14643), and incorporated herein by reference).
10.9 STERIS Corporation 2006 Long-Term Equity Incentive Plan (filed as Exhibit 10.1 to Form 8-K filed July 28, 2006 (Commission
File No. 1-14643) and incorporated herein by reference).
10.10 Amendment No. 1 to STERIS Corporation 2006 Long-Term Equity Incentive Plan (filed as Exhibit 10.11 to Form 10-K for
fiscal year ended March 31, 2007 (Commission File No. 1-14643), and incorporated herein by reference).
10.11 STERIS Corporation Form of Restricted Stock Agreement for Employees (filed as Exhibit 10.3 to Form 8-K filed July 28, 2006
(Commission File No. 1-14643) and incorporated herein by reference).
10.12 STERIS Corporation Form of Restricted Stock Agreement for Directors (filed as Exhibit 10.5 to Form 8-K filed July 28, 2006
(Commission File No. 1-14643) and incorporated herein by reference).
10.13 STERIS Corporation Form of Restricted Stock Unit Agreement for Employees (filed as Exhibit 10.5 to Form 10-Q filed for the
fiscal quarter ended September 30, 2007 (Commission File No. 1-14643) and incorporated herein by reference).
10.14 STERIS Corporation Form of Nonqualified Stock Option Agreement for Employees (filed as Exhibit 10.7 to Form 10-Q filed
for the fiscal quarter ended September 30, 2006 (Commission File No. 1-14643) and incorporated herein by reference).
10.15 STERIS Corporation Form of Nonqualified Stock Option Agreement for Nonemployee Directors (filed as Exhibit 10.8 to
Form 10-Q filed for the fiscal quarter ended September 30, 2006 (Commission File No. 1-14643) and incorporated herein by
reference).
115

ExhibitNumber Exhibit Description
10.16 STERIS Corporation Deferred Compensation Plan Document (filed as Exhibit 10.1 to Form 8-K filed September 1, 2006
(Commission File No. 1-14643) and incorporated herein by reference).
10.17 Adoption Agreement related to STERIS Corporation Deferred Compensation Plan Document (filed as Exhibit 10.2 to Form
8-K filed September 1, 2006 (Commission File No. 1-14643) and incorporated herein by reference).
10.18 STERIS Corporation Management Incentive Compensation Plan (as amended) (filed as Exhibit 10.2 to Form 8-K filed August
3, 2005 (Commission File No. 1-14643) and incorporated herein by reference).
10.19 STERIS Corporation Senior Executive Management Incentive Compensation Plan (filed as Exhibit 10.1 to Form 8-K filed
August 3, 2005 (Commission File No. 1-14643), and incorporated herein by reference).
10.20 Form of Change of Control Agreement between STERIS Corporation and the executive officers of STERIS Corporation other
than Mr. Walter M Rosebrough, Jr. (filed as Exhibit 10.2 to Form 10-Q filed for the quarter ended June 30, 1999 (Commission
File No. 1-14643), and incorporated herein by reference).
10.21 Employment Agreement dated September 7, 2006 between STERIS Corporation and Mr. Les Vinney (filed as Exhibit 10.1 to
Form 8-K filed September 11, 2006 (Commission File No. 1-14643), and incorporated herein by reference).
10.22 Employment Agreement dated May 7, 2007 between STERIS Corporation and Mr. Vinney (filed as Exhibit 10.1 to Form 8-K
filed May 8, 2007 (Commission File No. 1-14643), and incorporated herein by reference).
10.23 Employment Agreement dated September 7, 2007 between STERIS Corporation and Mr. Rosebrough (filed as Exhibit 10.3 to
Form 10-Q for the fiscal quarter ended September 30, 2007 (Commission File No. 1-14643), and incorporated herein by
reference).
10.24 Agreement dated September 7, 2007 between STERIS Corporation and Mr. Rosebrough (filed as Exhibit 10.4 to Form 10-Q
for the fiscal quarter ended September 30, 2007 (Commission File No. 1-14643), and incorporated herein by reference).
10.25 Executive Retention Agreement dated May 29, 2007 between STERIS Corporation and Dr. Peter Burke (filed as Exhibit 10.24
to Form 10-K for the fiscal year ended March 31, 2007 (Commission File No. 1-14643) and incorporated herein by
reference).
10.26 Letter Agreement dated November 27, 2006 between STERIS Corporation and Michael Tokich (filed as Exhibit 10.25 to
Form 10-K for the fiscal year ended March 31, 2007 (Commission File No. 1-14643), and incorporated herein by reference).
10.27 Agreement dated as of April 23, 2008 by and among STERIS Corporation, Richard C. Breeden, Robert H. Fields, and the
Breeden Investors identified therein (filed as Exhibit 10.1 to Form 8-K filed April 24, 2008 (Commission File No. 1-14643), and
incorporated herein by reference).
10.28 Second Amended and Restated Credit Agreement, dated September 13, 2007, among STERIS Corporation, KeyBank National
Association, as agent for the lenders from time to time party thereto, and such lenders (filed as Exhibit 10.1 to Form 10-Q
filed for the fiscal quarter ended September 30, 2007 (Commission File No. 1-14643), and incorporated herein by reference).
10.29 Note Purchase Agreement, dated December 17, 2003, between STERIS Corporation and certain institutional investors (filed
as Exhibit 10.3 to Form 10-Q filed for the third quarter ended December 31, 2003 (Commission File No. 1-14643), and
incorporated herein by reference).
10.30 Subsidiary Guaranty, dated December 17, 2003, by certain subsidiaries of STERIS Corporation (filed as Exhibit 10.4 to Form
10-Q filed for the third quarter ended December 31, 2003 (Commission File No. 1-14643), and incorporated herein by
reference).
116

ExhibitNumber Exhibit Description
10.31 Guaranty Supplement dated March 29, 2004, by SterilTek Holdings, Inc. and STERIS Corporation (filed as Exhibit 10.16 to
Form 10-K for the fiscal year ended March 31, 2004 (Commission File No. 1-14643), and incorporated herein by reference).
10.32 Guaranty Supplement dated January 7, 2005, by STERIS Isomedix Services, Inc. and STERIS Corporation (filed as Exhibit 10.20
to Form 10-K for the fiscal year ended March 31, 2005 (Commission File No. 1-14643), and incorporated herein by
reference).
10.33 Guaranty Supplement dated September 25, 2007 by HSTD LLC and STERIS Corporation (filed as Exhibit 10.2 to Form 10-Q
dated September 30, 2007 (Commission File No. 1-14643), and incorporated herein by reference).
10.34 Asset Purchase Agreement dated as of November 15, 2004, between Cosmed Group, Inc. and STERIS Corporation (filed as
Exhibit 10.1 to Form 10-Q for the third quarter ended December 31, 2004 (Commission File No. 1-14643), and incorporated
herein by reference).
21.1 Subsidiaries of STERIS Corporation
23.1 Consent of Independent Registered Public Accounting Firm
24.1 Power of Attorney
31.1 Certification of the Principal Executive Officer Pursuant to Exchange Act Rule 13a-14(a)/15d-14(a)
31.2 Certification of the Principal Financial Officer Pursuant to Exchange Act Rule 13a-14(a)/15d-14(a)
32.1 Certification of the Principal Executive Officer and the Principal Financial Officer Pursuant to Section 906 of the Sarbanes-
Oxley Act of 2002
117

EXHIBIT 21.1SUBSIDIARIES OF STERIS CORPORATION
STERIS Corporation has no parent company. As of March 31, 2008, its direct and indirect subsidiaries(1) were as follows:
Albert Browne International Limited United KingdomAlbert Browne Limited United KingdomAmerican Sterilizer Company PennsylvaniaBrowne Health Care Limited United KingdomCLBV Limited United KingdomFamily Practitioner Supplies Limited United KingdomGlobal Risk Insurance Company VermontHamo UK Limited United KingdomHausted, Inc. DelawareHSTD LLC DelawareHTD Holding Corp. DelawareIsomedix Corporation CanadaIsomedix Inc. DelawareIsomedix Operations Inc. DelawareSB Servicos Administrativos Ltda. BrazilSterilTek Holdings, Inc. DelawareSterilTek, Inc. NevadaSTERIS FranceSTERIS AB SwedenSTERIS AG SwitzerlandSTERIS Asia Pacific, Inc. DelawareSTERIS-Austar Pharmaceutical Systems Hong Kong Limited ChinaSTERIS-Austar Pharmaceutical Systems (Shanghai) Limited ChinaSTERIS (Barbados) Corp. BarbadosSTERIS Brasil Servicos Administrativos Ltda. BrazilSTERIS (BVI) I Limited British Virgin IslandsSTERIS Canada Corporation CanadaSTERIS Canada Inc. CanadaSTERIS CH Limited United KingdomSTERIS Corporation de Costa Rica, S.A. Costa RicaSTERIS Deutschland GmbH GermanySTERIS Enterprises LLC RussiaSTERIS Europe, Inc. DelawareSTERIS Group GmbH SwitzerlandSTERIS Holdings B.V. NetherlandsSTERIS Hong Kong Limited Hong KongSTERIS Iberia, S.A. SpainSTERIS Inc. DelawareSTERIS (India) Private Limited IndiaSTERIS Isomedix Services, Inc. DelawareSTERIS Japan Inc. JapanSTERIS Latin America, Inc. DelawareSTERIS Limited United KingdomSTERIS Mauritius Limited Republic of MauritiusSTERIS Mexico, S. de R.L. de C.V. MexicoSTERIS Online Inc. OhioSTERIS Personnel Services, Inc. DelawareSTERIS Personnel Services Mexico, S. de R.L. de C.V. MexicoSTERIS Russia LLC DelawareSTERIS SA BelgiumSTERIS SEA Sdn. Bhd. (Malaysia) MalaysiaSTERIS Singapore Pte. Ltd. SingaporeSTERIS S.r.l. ItalySTERIS Surgical Technologies FranceSTERIS Surgical Technologies Holdings FranceStrategic Technology Enterprises, Inc. Delaware
(1) The names of one or more subsidiaries which, considered in the aggregate as a single subsidiary, would not constitute at the end of
fiscal 2008 a “significant subsidiary” within the meaning of Rule 1-02(w) of Regulation S-X have been excluded.
118

EXHIBIT 23.1
CONSENT OF INDEPENDENT REGISTERED PUBLIC ACCOUNTING FIRM
We consent to the incorporation by reference of our reports dated May 28, 2008, with respect to the consolidated financial
statements and schedule of STERIS Corporation and subsidiaries, and the effectiveness of internal control over financial reporting of STERIS
Corporation and subsidiaries included in this Annual Report (Form 10-K) for the year ended March 31, 2008 in the following Registration
Statements and in the related Prospectuses:
RegistrationNumber Description
333-40058 Form S-8 Registration Statement – Nonqualified Stock Option Agreement between STERIS Corporationand Les C. Vinney
333-65155 Form S-8 Registration Statement – STERIS Corporation 1998 Long-Term Incentive Compensation Plan
333-32005 Form S-8 Registration Statement – STERIS Corporation 1997 Stock Option Plan
333-06529 Form S-3 Registration Statement – STERIS Corporation
333-01610 Post-effective Amendment to Form S-4 on Form S-8 – STERIS Corporation
33-91444 Form S-8 Registration Statement – STERIS Corporation 1994 Equity Compensation Plan
33-91442 Form S-8 Registration Statement – STERIS Corporation 1994 Nonemployee Directors EquityCompensation Plan
33-55976 Form S-8 Registration Statement – STERIS Corporation 401(k) Plan
33-55258 Form S-8 Registration Statement – STERIS Corporation Amended and Restated Non-Qualified StockOption Plan
333-63774 Form S-8 Registration Statement – Nonqualified Stock Option Agreement between STERIS Corporationand Peter A. Burke
333-09733 Form S-8 Registration Statement – STERIS Corporation 401(k) Plan
333-101308 Form S-8 Registration Statement – STERIS Corporation 2002 Stock Option Plan
333-91302 Form S-8 Registration Statement – Nonqualified Stock Option Agreement between STERIS Corporationand Mark D. McGinley
333-137167 Form S-8 Registration Statement – STERIS Corporation Deferred Compensation Plan
333-136239 Form S-8 Registration Statement – STERIS Corporation 2006 Long-Term Equity Incentive Plan
/s/ ERNST & YOUNG LLP
Cleveland, Ohio
May 28, 2008
119

EXHIBIT 24.1
STERIS CORPORATIONPOWER OF ATTORNEY
FORM 10-K
Each of the undersigned hereby makes, constitutes, and appoints Walter M Rosebrough, Jr., Michael J. Tokich, Mark D. McGinley,
J. Adam Zangerle, Dennis P. Patton, and each of them, his or her true and lawful attorney, with full power of substitution, for and in his or
her name, place, and stead, to affix, as attorney-in-fact, his or her signature in any and all capacities, to the Annual Report on Form 10-K of
STERIS Corporation for its fiscal year ended March 31, 2008, and any and all amendments thereto to be filed with the Securities and
Exchange Commission, Washington, D.C., under the provisions of the Securities Exchange Act of 1934, as amended, with power to file said
Form 10-K and such amendments, and any and all other documents that may be required in connection therewith, with the Securities and
Exchange Commission, hereby granting unto said attorneys-in-fact, and each of them, full power and authority to do and perform any and
all acts and things requisite or appropriate in connection therewith, as fully to all intents and purposes as he or she might or could do in
person, hereby ratifying and confirming all that said attorneys-in-fact or any of them may lawfully do or cause to be done by virtue hereof.
IN WITNESS WHEREOF, the undersigned have executed this Power of Attorney as of the 23rd day of April 2008.
/S/ CYNTHIA L. FELDMANN /S/ JACQUELINE B. KOSECOFF
Cynthia L. FeldmannDirector
Jacqueline B. KosecoffDirector
/S/ RAYMOND A. LANCASTER /S/ KEVIN M. MCMULLEN
Raymond A. LancasterDirector
Kevin M. McMullenDirector
/S/ J. B. RICHEY /S/ MOHSEN M. SOHI
J. B. RicheyDirector
Mohsen M. SohiDirector
/S/ LOYAL W. WILSON /S/ JOHN P. WAREHAM
Loyal W. WilsonDirector
John P. WarehamChairman of the Board
/S/ MICHAEL B. WOOD /S/ RICHARD C. BREEDEN
Michael B. WoodDirector
Richard C. BreedenDirector
/S/ WALTER M ROSEBROUGH, JR. /S/ ROBERT H. FIELDS
President and Chief Executive Officer(Principal Executive Officer), Director
Robert H. FieldsDirector
/S/ MICHAEL J. TOKICH
Senior Vice President andChief Financial Officer
(Principal Financial and Accounting Officer)
120

EXHIBIT 31.1
CERTIFICATION OF THE PRINCIPAL EXECUTIVE OFFICER
I, Walter M Rosebrough, Jr., certify that:
1. I have reviewed this annual report on Form 10-K of STERIS Corporation;
2. Based on my knowledge, this report does not contain any untrue statement of a material fact or omit to state a material fact
necessary to make the statements made, in light of the circumstances under which such statements were made, not misleading
with respect to the period covered by this report;
3. Based on my knowledge, the financial statements, and other financial information included in this report, fairly present in all
material respects the financial condition, results of operations and cash flows of the registrant as of, and for, the periods presented
in this report;
4. The registrant’s other certifying officer and I are responsible for establishing and maintaining disclosure controls and procedures
(as defined in Exchange Act Rules 13a-15(e) and 15d-15(e)) and internal control over financial reporting (as defined in Exchange
Act Rules 13a-15(f) and 15d-15(f)) for the registrant and have:
a. designed such disclosure controls and procedures, or caused such disclosure controls and procedures to be designed under
our supervision, to ensure that material information relating to the registrant, including its consolidated subsidiaries, is made
known to us by others within those entities, particularly during the period in which this report is being prepared;
b. designed such internal control over financial reporting, or caused such internal control over financial reporting to be designed
under our supervision, to provide reasonable assurance regarding the reliability of financial reporting and the preparation of
the financial statements for external purposes in accordance with generally accepted accounting principles;
c. evaluated the effectiveness of the registrant’s disclosure controls and procedures and presented in this report our
conclusions about the effectiveness of the disclosure controls and procedures, as of the end of the period covered by this
report based on such evaluation; and
d. disclosed in this report any change in the registrant’s internal control over financial reporting that occurred during the
registrant’s most recent fiscal quarter (the registrant’s fourth fiscal quarter in the case of an annual report) that has materially
affected, or is reasonably likely to materially affect, the registrant’s internal control over financial reporting; and
5. The registrant’s other certifying officer and I have disclosed, based on our most recent evaluation of internal control over financial
reporting, to the registrant’s auditors and the audit committee of the registrant’s board of directors (or persons performing the
equivalent functions):
a. all significant deficiencies and material weaknesses in the design or operation of internal control over financial reporting
which are reasonably likely to adversely affect the registrant’s ability to record, process, summarize and report financial
information; and
b. any fraud, whether or not material, that involves management or other employees who have a significant role in the
registrant’s internal control over financial reporting.
Date: May 30, 2008
/S/ WALTER M ROSEBROUGH, JR.
Walter M Rosebrough, Jr.President and Chief Executive Officer
121
EXHIBIT 31.2
CERTIFICATION OF THE PRINCIPAL FINANCIAL OFFICER
I, Michael J. Tokich, certify that:
1. I have reviewed this annual report on Form 10-K of STERIS Corporation;
2. Based on my knowledge, this report does not contain any untrue statement of a material fact or omit to state a material fact
necessary to make the statements made, in light of the circumstances under which such statements were made, not misleading
with respect to the period covered by this report;
3. Based on my knowledge, the financial statements, and other financial information included in this report, fairly present in all
material respects the financial condition, results of operations and cash flows of the registrant as of, and for, the periods presented
in this report;
4. The registrant’s other certifying officer and I are responsible for establishing and maintaining disclosure controls and procedures
(as defined in Exchange Act Rules 13a-15(e) and 15d-15(e)) and internal control over financial reporting (as defined in Exchange
Act Rules 13a-15(f) and 15d-15(f)) for the registrant and have:
a. designed such disclosure controls and procedures, or caused such disclosure controls and procedures to be designed under
our supervision, to ensure that material information relating to the registrant, including its consolidated subsidiaries, is made
known to us by others within those entities, particularly during the period in which this report is being prepared;
b. Designed such internal control over financial reporting, or caused such internal control over financial reporting to be
designed under our supervision, to provide reasonable assurance regarding the reliability of financial reporting and the
preparation of financial statements for external purposes in accordance with generally accepted accounting principles;
c. evaluated the effectiveness of the registrant’s disclosure controls and procedures and presented in this report our
conclusions about the effectiveness of the disclosure controls and procedures, as of the end of the period covered by this
report based on such evaluation; and
d. disclosed in this report any change in the registrant’s internal control over financial reporting that occurred during the
registrant’s most recent fiscal quarter (the registrant’s fourth fiscal quarter in the case of an annual report) that has materially
affected, or is reasonably likely to materially affect, the registrant’s internal control over financial reporting; and
5. The registrant’s other certifying officer and I have disclosed, based on our most recent evaluation of internal control over financial
reporting, to the registrant’s auditors and the audit committee of the registrant’s board of directors (or persons performing the
equivalent functions):
a. all significant deficiencies and material weaknesses in the design or operation of internal control over financial reporting
which are reasonably likely to adversely affect the registrant’s ability to record, process, summarize and report financial
information; and
b. any fraud, whether or not material, that involves management or other employees who have a significant role in the
registrant’s internal control over financial reporting.
Date: May 30, 2008
/S/ MICHAEL J. TOKICH
Michael J. TokichSenior Vice President and
Chief Financial Officer
122

EXHIBIT 32.1
CERTIFICATION PURSUANT TO § 906 OF THE SARBANES-OXLEY ACT OF 2002
Pursuant to 18 U.S.C. § 1350, as adopted pursuant to § 906 of the Sarbanes-Oxley Act of 2002, in connection with the filing of
the Form 10-K of STERIS Corporation (the “Company”) for the fiscal year ended March 31, 2008, as filed with the Securities and Exchange
Commission on the date hereof (the “Report”), each of the undersigned officers of the Company certifies, that, to such officer’s knowledge:
(1) The Report fully complies with the requirements of Section 13(a) or 15(d) of the Securities Exchange Act of 1934; and
(2) The information contained in the Report fairly presents, in all material respects, the financial condition and results of operations of
the Company as of the dates and for the periods expressed in the Report.
/S/ WALTER M ROSEBROUGH, JR.
Name:Title:
Walter M Rosebrough, Jr.President and Chief Executive Officer
/S/ MICHAEL J. TOKICH
Name:Title:
Michael J. TokichSenior Vice President and Chief Financial Officer
Date: May 30, 2008
123

THIS PAGE IS NOT PART OF STERIS’S FORM 10-K FILING
Performance Graph. The following graph shows the cumulative performance for our common shares over the last five years as of
March 31 of each year compared with the performance of the Standard & Poor’s 500 Index and the Dow Jones U.S. Medical Supplies Index
as of the same date. The graph assumes $100 invested as of March 31, 2003 in our common shares and in each of the named indices. The
past performance shown in this graph does not necessarily guarantee future performance.
COMPARISON OF 5 YEAR CUMULATIVE TOTAL RETURN*
$0
$50
$100
$150
$200
$250
3/03 3/04 3/05 3/06 3/07 3/08
STERIS Corporation S & P 500 Dow Jones US Medical Supplies
* $100 invested on 3/31/03 in stock or index-including reinvestment of dividends. Fiscal year ending March 31.
Copyright © 2008, Standard & Poor’s, a division of The McGraw-Hill Companies, Inc. All rights reserved.www.researchdatagroup.com/S&P.htm
Among STERIS Corporation, The S & P 500 IndexAnd The Dow Jones US Medical Supplies Index

ABOUT THIS ANNUAL REPORT
The sterility of the surgical instrument on the cover symbolizes the mission of STERIS “on
the surface” – to provide a healthier today and a safer tomorrow through knowledgeable
people and innovative infection prevention, decontamination and health science technologies,
products and services.
Beyond the surface, integration among these technologies, products and services and
close connectivity between STERIS and its Customers promote productivity, quality and safety
in a wide range of critical environments – a key differentiator in the marketplace.
Beginning “on the surface,” this annual report offers a glimpse of the breadth of solutions
STERIS provides its valued Customers.
Letter to Shareholders pages 2-5
Advanced Visualization pages 6-7
Behind the Names pages 8-9
CONTENTS
Customer-Centric Commitment pages 10-11
STERIS at a Glance page 12
Corporate Information Inside Back Cover
STERIS has included as Exhibit 31 to its Annual Report on Form 10-K for the fi scal year ended March 31, 2008 fi led with the Securities and Exchange Commission (SEC) certifi cates of STERIS’s Principal Executive Offi cer and Principal Financial Offi cer regarding STERIS’s public disclosure. STERIS’s Chief Executive Offi cer has also submitted to the New York Stock Exchange a certifi cate certifying that he is not aware of any violation by STERIS of the New York Stock Exchange corporate governance listing standards. This Annual Report, other than the Form 10-K, has not been fi led with the SEC.
Product and service descriptions herein are for illustration purposes only and do not modify or alter product warranties, labeling, instructions or other technical literature.
PUBLICATION ID ANNRPT08. COPYRIGHT 2008 BY STERIS CORPORATION. ALL RIGHTS RESERVED. PRINTED IN USA. DESIGN BY DIX & EATON
BOARD OF DIRECTORS
John P. Wareham1
Chairman of the BoardSTERIS Corporation
Retired Chairman of the Board and Chief Executive Offi cer, Beckman Coulter, Inc.
Richard C. Breeden1
Chief Executive Offi cer andChief Investment Offi cer, Breeden Partners and Breeden Capital Management
Cynthia L. Feldmann2
President and Founder, Jetty Lane Associates
Robert H. Fields2
Partner and Managing Director,Breeden Partners and Breeden Capital Management
Jacqueline Kosecoff, Ph.D.3
Chief Executive Offi cer, Prescriptions Solutions, UnitedHealth Group
Raymond A. Lancaster1
Managing Director, South Franklin Street Partners
Kevin M. McMullen1
Chairman of the Board, Chief Executive Offi cer and President, OMNOVA Solutions Inc.
J. B. Richey3
Senior Vice President and Member of the Board of Directors, Invacare Corporation
Walter M Rosebrough
President and Chief Executive Offi cer, STERIS Corporation
Mohsen M. Sohi2
President and Chief Executive Offi cer,Freudenberg-NOK General Partnership
Loyal W. Wilson2
Managing Director, Primus Venture Partners, Inc.
Michael B. Wood, M.D.3
Consultant Physician, Mayo Clinic
EXECUTIVE OFFICERS
Walter M Rosebrough
President and Chief Executive Offi cer
William L. Aamoth
Vice President and Corporate Treasurer
Peter A. Burke
Senior Vice President and Chief Technology Offi cer
Timothy L. Chapman
Senior Vice President and Group President, Healthcare
Mark D. McGinley
Senior Vice President, General Counsel, and Secretary
Robert E. Moss
Senior Vice President andGroup President, STERIS Isomedix Services
Gerard J. Reis
Senior Vice President, Government and Administration
Michael J. Tokich
Senior Vice President and Chief Financial Offi cer
John N. Voyzey
Vice President and General Manager, Life Sciences
EXECUTIVE OFFICES
5960 Heisley RoadMentor, OH 44060-1834 USA440-354-2600
www.steris.com
FORM 10-K
Included in this Annual Report is a copy of STERIS Corporation’s Form 10-K fi led with the Securities and Exchange Commission for the year ended March 31, 2008. Addi-tional copies of the Company’s Form 10-K and other information are available on the Internet at www.steris-ir.com, or upon written request to:
Investor Relations
STERIS Corporation 5960 Heisley Road Mentor, OH 44060-1834 USA
TRANSFER AGENT AND REGISTRAR
National City Bank
Shareholder Services
P.O. Box 92301Cleveland, OH 44101-4301800-622-6757
INDEPENDENT REGISTERED
PUBLIC ACCOUNTING FIRM
Ernst & Young LLP
Suite 1300925 Euclid AvenueCleveland, OH 44115-1476
STOCK EXCHANGE LISTING
STERIS common stock is listed on the New York Stock Exchange under the symbol STE.
ANNUAL MEETING OF SHAREHOLDERS
The Company’s 2008 annual meeting will be held on Thursday, July 24, 2008, at 9:00 a.m. Eastern time at:
Holiday Inn Express Hotel
& Suites LaMalfa
5783 Heisley Road Mentor, OH 44060
Corporate Information
1 COMPENSATION AND CORPORATE GOVERNANCE COMMITTEE MEMBER
2 AUDIT AND FINANCIAL POLICY COMMITTEE MEMBER
3 COMPLIANCE COMMITTEE MEMBER

On the Surface
5960 Heisley Road
Mentor, Ohio 44060-1834 USA440-354-2600www.steris.com
ST
ER
IS C
OR
PO
RA
TIO
N FISC
AL 2008 ANN
UAL R
EPO
RT
FISCAL 2008 ANNUAL REPORT