Embed Size (px)
Citation preview
C E N T R A L F A L L S H I G H S C H O O L
Report
First Year
ABOUT THE EDUCATION ALL IANCE
Since 1975, The Education Alliance (TEA) at Brown University has helped the education community
improve America’s schools. TEA provides applied research, technical assistance, and informational
resources to connect research and practice, build knowledge and skills, and meet critical needs in the
field. With a dedicated team of skilled professionals, collaborators, and partners, TEA provides service
and resources to K–12 schools and districts across the country and beyond.
TEA engages a wide range of qualitative and quantitative strategies to provide educators with infor-
mation they can use to improve programs, inform school reform activities, and facilitate change. TEA’s
approach considers multiple perspectives and local contexts to ensure that educators can apply the rec-
ommendations to their specific concerns. TEA has conducted assessments of school change models,
online professional development offerings, school support organizations, and ESL and bilingual pro-
grams. We also evaluate how assessment strategies inform professional development and classroom
practice in terms of national standards.
www.alliance.brown.edu
ABOUT THE ANNENBERG INSTITUTE FOR SCHOOL REFORM
The Annenberg Institute for School Reform (AISR) is a national policy-research and reform-
support organization, affiliated with Brown University, that focuses on improving conditions and out-
comes for all students in urban public schools, especially those attended by traditionally underserved
children. AISR’s vision is the transformation of traditional school systems into “smart education sys-
tems” that develop and integrate high-quality learning opportunities in all areas of students’ lives – at
school, at home, and in the community. AISR conducts research; works with a variety of partners
committed to educational improvement to build capacity in school districts and communities; and
shares its work through print and Web publications.
Rather than providing a specific reform design or model to be implemented, AISR’s approach is to
offer an array of tools and strategies to help districts and communities strengthen their local capacity
to provide and sustain high-quality education for all students.
http://annenberginstitute.org
C E N T R A L F A L L S H I G H S C H O O L
Report
First Year
The Education Alliance at Brown University
Annenberg Institute for School Reform at Brown University
November 2011
AUTHORS
� The Education Alliance: Amy Burns, Joye Whitney, and Hardeek Shah
� Annenberg Institute: Ellen Foley and Elsa Duré
ACKNOWLEDGMENTS
The Annenberg Institute and The Education Alliance gratefully acknowledge the support
of the Central Falls School District and its partners. The report would not have been possible without
the support and participation of the leadership team, teachers, staff, students, and community mem-
bers. Their openness and honesty were critical to our understanding of the successes and challenges
of the high school transformation. Juan Cano, Central Falls High School data analyst, was especially
helpful in providing this report with databases and data analysis. We would like to particularly thank
Young Voices, TALL University, and the Brown University Education Department for helping to
make the student focus groups a success. We are also grateful for the time, contributions, and ana-
lytical, writing, and editing skills provided by our colleagues Margaret Balch-Gonzalez, Tracie
Potochnik, and O’rya Hyde-Keller, and for the design and layout by Haewon Kim.
SUGGESTED CITATION
The Education Alliance and the Annenberg Institute for School Reform, Brown University. 2011.
Central Falls High School: First Year Transformation Report. Providence, RI: Brown University.
� The Education Alliance at Brown University, Research & Evaluation Division 4 Richmond Square, Fourth FloorProvidence, Rhode Island 02906
401.274.9548
www.alliance.brown.edu
� Annenberg Institute for School Reform at Brown University, Research & PolicyBox 1985Providence, RI 02912
401.863.7990
www.annenberginstitute.org
Twitter: @AnnenbergInst
A PDF version of this report is available at http://annenberginstitute.org/Publications/CentralFalls
© 2011 Brown University, The Education Alliance at Brown University and the Annenberg Institute for School Reform at Brown University
Table of Contents
Figures
Introduction .................................................................................................................................................................................... 1
Overview of the Transformation Evaluation: Year 1 ........................................................................................ 3
I. Participants and Methods .............................................................................................................................................. 4
II. Strategic Goal 1...................................................................................................................................................................... 7Increase the Graduation Rate and Decrease the Dropout Rate
III. Strategic Goal 2 ................................................................................................................................................................ 18Improve Student Proficiency in Mathematics and Maintain Improvement in English Language Arts Proficiency
IV. Strategic Goal 3 ................................................................................................................................................................ 31 Improve the Culture and Climate of the School
V. Summary .................................................................................................................................................................................. 44
VI. Recommendations ......................................................................................................................................................... 48
Conclusion .................................................................................................................................................................................... 51
Appendix A ................................................................................................................................................................................... 53 Protocol for Interventions: Persistently Lowest-Achieving Schools
Appendix B ................................................................................................................................................................................... 69 Central Falls High School Staff Survey Protocol
Appendix C ................................................................................................................................................................................... 73 Student Attendance before and after Guide 2 Success
Appendix D ................................................................................................................................................................................... 74 Complete Listing of Open-Ended Responses on Advisory
Appendix E ................................................................................................................................................................................... 77 Teacher and Staff Absences Rates, School Year 2010-2011
Appendix F .................................................................................................................................................................................... 78 Complete Listing of Open-Ended Responses on Performance Management
Appendix G ................................................................................................................................................................................... 81 Complete Listing of Open-Ended Responses on Transformation Progress
Appendix H .................................................................................................................................. 83 Complete Listing of Open-Ended Responses on Suggested Improvements
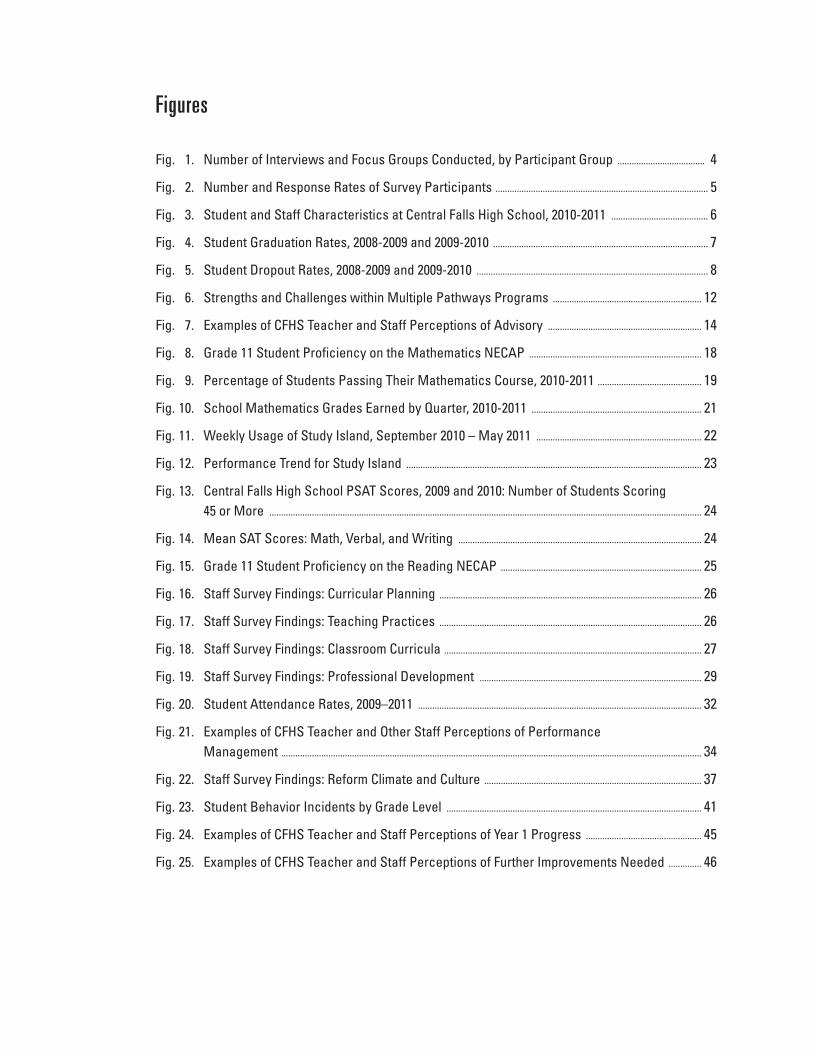
Figures
Fig. 1. Number of Interviews and Focus Groups Conducted, by Participant Group ..................................... 4
Fig. 2. Number and Response Rates of Survey Participants .......................................................................................... 5
Fig. 3. Student and Staff Characteristics at Central Falls High School, 2010-2011 ......................................... 6
Fig. 4. Student Graduation Rates, 2008-2009 and 2009-2010 ........................................................................................... 7
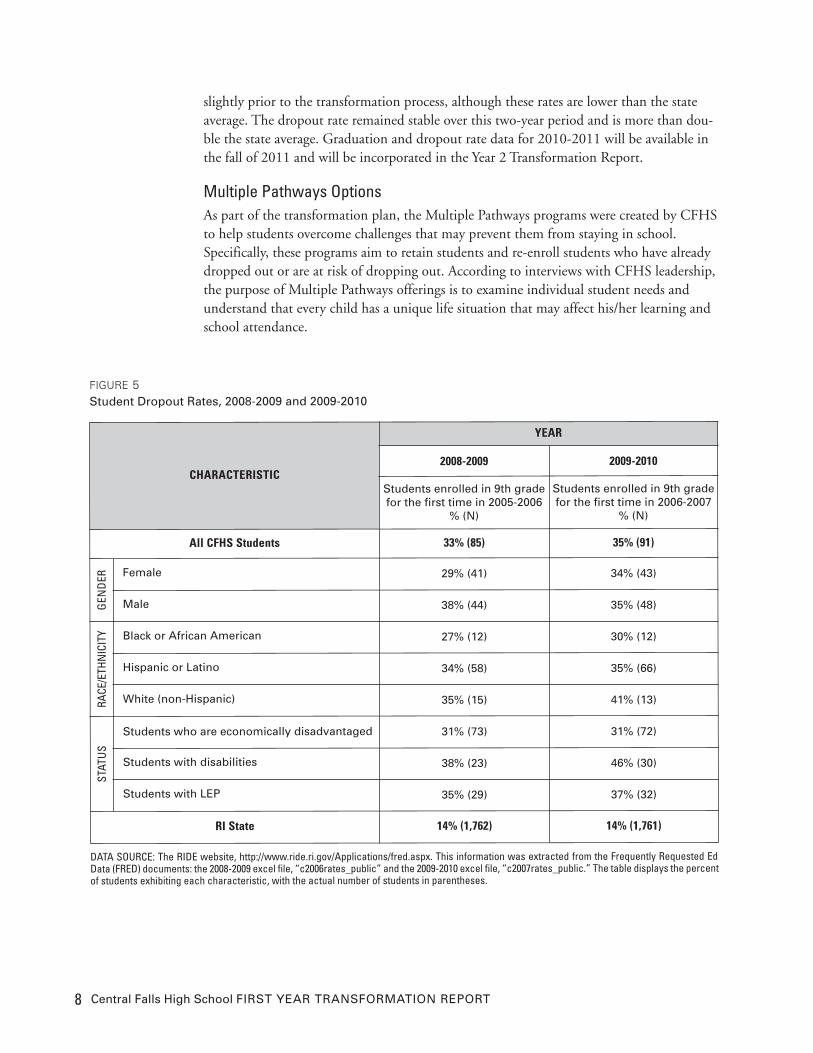
Fig. 5. Student Dropout Rates, 2008-2009 and 2009-2010 .................................................................................................. 8
Fig. 6. Strengths and Challenges within Multiple Pathways Programs ............................................................... 12
Fig. 7. Examples of CFHS Teacher and Staff Perceptions of Advisory ................................................................. 14
Fig. 8. Grade 11 Student Proficiency on the Mathematics NECAP ......................................................................... 18
Fig. 9. Percentage of Students Passing Their Mathematics Course, 2010-2011 ............................................ 19
Fig. 10. School Mathematics Grades Earned by Quarter, 2010-2011 ........................................................................ 21
Fig. 11. Weekly Usage of Study Island, September 2010 – May 2011 ...................................................................... 22
Fig. 12. Performance Trend for Study Island ............................................................................................................................. 23
Fig. 13. Central Falls High School PSAT Scores, 2009 and 2010: Number of Students Scoring45 or More ....................................................................................................................................................................................... 24
Fig. 14. Mean SAT Scores: Math, Verbal, and Writing ....................................................................................................... 24
Fig. 15. Grade 11 Student Proficiency on the Reading NECAP ..................................................................................... 25
Fig. 16. Staff Survey Findings: Curricular Planning ............................................................................................................... 26
Fig. 17. Staff Survey Findings: Teaching Practices ............................................................................................................... 26
Fig. 18. Staff Survey Findings: Classroom Curricula ............................................................................................................. 27
Fig. 19. Staff Survey Findings: Professional Development .............................................................................................. 29
Fig. 20. Student Attendance Rates, 2009–2011 ........................................................................................................................ 32
Fig. 21. Examples of CFHS Teacher and Other Staff Perceptions of Performance Management .................................................................................................................................................................................. 34
Fig. 22. Staff Survey Findings: Reform Climate and Culture ............................................................................................ 37
Fig. 23. Student Behavior Incidents by Grade Level ............................................................................................................ 41
Fig. 24. Examples of CFHS Teacher and Staff Perceptions of Year 1 Progress ................................................. 45
Fig. 25. Examples of CFHS Teacher and Staff Perceptions of Further Improvements Needed .............. 46
1
IntroductionIn January 2010, the Rhode Island Department of Education (RIDE) identified CentralFalls High School (CFHS) as one of the state’s persistently lowest-achieving schools.Though Central Falls School District has been in state-administered corrective action since2002, CFHS achievement has remained among the lowest in the state. Some of the Octo-ber 2009 results from the New England Common Assessment Program (NECAP) achieve-ment data, which the state used to make its decision, included:
• 7 percent of 11th graders are proficient in mathematics
• 55 percent of 11th graders are proficient in reading
• The school has a graduation rate of 48 percent
According to RIDE’s Protocol for Interventions: Persistently Lowest-Achieving Schools, localeducation agencies (LEAs) with one or more persistently lowest-achieving schools mustchoose from one of four “turnaround” models that are designed to radically alter status quoconditions in the school and provide students with enhanced opportunities for an excellenteducation. The four possible models available to LEAs are:
• Closure
• Restart
• Transformation
• Turnaround1
Closure shuts down a school, and restart requires the hiring of an external provider – acharter or educational management organization. Transformation and turnaround are actu-ally very similar models. Staffing is the primary difference between them; while both requirereplacing the principal, transformation works with existing staff. Turnaround, on the otherhand, requires that all teachers resign and limits the proportion rehired to 50 percent.
The Central Falls School District (CFSD) and the Central Falls Teachers Union (CFTU)considered the transformation model but could not come to an agreement initially around“assurances” designed to lengthen the school day, increase professional development, anddeepen teacher-student relationships. Citing a lack of resources, as well as a Rhode Islandlaw requiring employee notification of termination for the following school year by March1, the superintendent recommended the turnaround model. When the Central Falls Boardof Trustees approved the adoption of the turnaround model in February 2010 and teachersreceived their termination notices, the decision became national news and drew the atten-tion of President Barack Obama, Education Secretary Arne Duncan, and American Federa-tion of Teachers President Randi Weingarten, among many others. Depending on theobserver’s perspective, this one high school district became symbolic of the citizenry’s ten-dency to disrespect and blame teachers for the country’s education woes, union-busting, aschool district wrenching power from an entrenched labor union, or all that was wrong orright with federal education policy.
1 Please see RIDE’s Protocol for Interventions: Persistently Lowest-Achieving Schools in Appendix A for completedefinitions of these four models.
2 Central Falls High School FIRST YEAR TRANSFORMATION REPORT
It was a difficult time for all involved. Under intense media scrutiny, the CFSD and CFTUparticipated in more than forty hours of mediation and agreed to rescind the teachers’ ter-mination letters and work together to improve Central Falls High School using the trans-formation model. Specifically, this model calls for:
• Replacement of the school leader
• Rigorous, transparent, and equitable evaluation systems for teachers
• A commitment to consistent use of data to drive decision making, revisions to reformstrategies, and approaches to instruction
• Operational flexibility for administrators, allowing for extended learning time, unfet-tered use of school/district resources, creative use of instructional time available withinthe school day with the ability to revise that use based on results, etc.
• Appointment of a turnaround officer or turnaround office to oversee the LEA’s reformefforts
Central Falls administration hired a leadership team, including two co-principals and atransformation officer, during the summer of 2010. The leadership team immediatelydrafted the transformation action plan required by RIDE.
This report summarizes progress toward the goals outlined in the action plan and summa-rizes stakeholders’ perceptions of the first year of implementation, including challenges,opportunities, and areas for improvement.
3
Overview of the Transformation Evaluation: Year 1The Annenberg Institute for School Reform (AISR) and The Education Alliance (TEA) atBrown University have collaborated to evaluate the transformation process at CFHS. TEAconducted leadership team interviews, classroom observations, and the analysis of surveyand school performance data, while AISR focused on an in-depth, qualitative study of keyparticipants. The overarching focus of the study is the progress CFHS has made toward thethree strategic goals created in the action plan:
1. Increase the graduation rate and decrease the dropout rate.
2. Improve student proficiency in mathematics and maintain improvement in Englishlanguage arts (ELA) proficiency.
3. Improve the culture and climate of the school.
Given the complexity of the transformation process, a multifaceted evaluation approachwas employed. The design incorporated both qualitative and quantitative methods includ-ing stakeholder interviews, focus groups, observations, survey analysis, and analysis of sev-eral student, teacher, and school-level indicators. Evaluators have synthesized data from themultiple sources to examine the context, practices, and progress of the reform efforts.
This initial report highlights the successes and challenges of the first transformation year atCFHS. An interim report detailing Year 2 of the transformation will be written in the sum-mer of 2012, and a final report will be compiled in the summer of 2013. Together, thesethree reports will provide a comprehensive overview of the collective lessons learned in thetransformation of this persistently lowest-achieving school.
In the current report, Section I provides an overview of the various participants and meth-ods utilized in the evaluation. The next three sections describe the progress CFHS hasmade toward each of the three strategic goals in the first year of transformation. Finally,Sections V and VI offer a summary of the evaluation and recommendations for continuedimprovement.
I. Participants and Methods
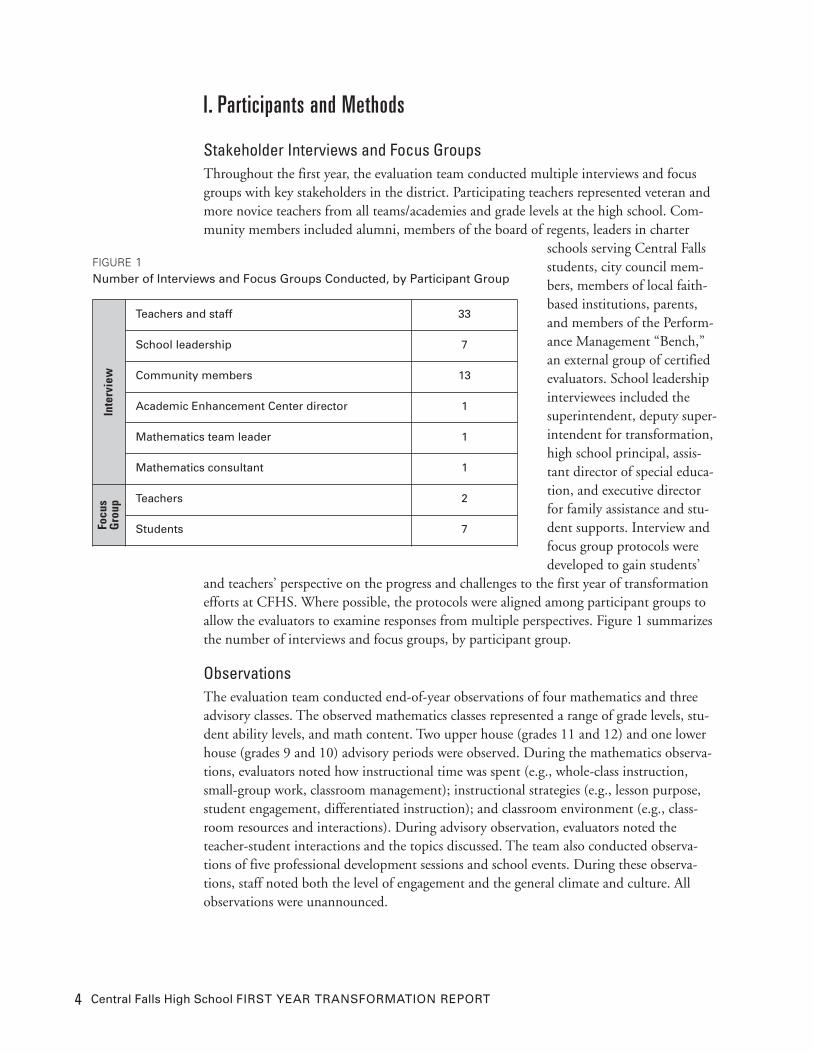
Stakeholder Interviews and Focus GroupsThroughout the first year, the evaluation team conducted multiple interviews and focusgroups with key stakeholders in the district. Participating teachers represented veteran andmore novice teachers from all teams/academies and grade levels at the high school. Com-munity members included alumni, members of the board of regents, leaders in charter
schools serving Central Fallsstudents, city council mem-bers, members of local faith-based institutions, parents,and members of the Perform-ance Management “Bench,”an external group of certifiedevaluators. School leadershipinterviewees included thesuperintendent, deputy super-intendent for transformation,high school principal, assis-tant director of special educa-tion, and executive directorfor family assistance and stu-dent supports. Interview andfocus group protocols weredeveloped to gain students’
and teachers’ perspective on the progress and challenges to the first year of transformationefforts at CFHS. Where possible, the protocols were aligned among participant groups toallow the evaluators to examine responses from multiple perspectives. Figure 1 summarizesthe number of interviews and focus groups, by participant group.
ObservationsThe evaluation team conducted end-of-year observations of four mathematics and threeadvisory classes. The observed mathematics classes represented a range of grade levels, stu-dent ability levels, and math content. Two upper house (grades 11 and 12) and one lowerhouse (grades 9 and 10) advisory periods were observed. During the mathematics observa-tions, evaluators noted how instructional time was spent (e.g., whole-class instruction,small-group work, classroom management); instructional strategies (e.g., lesson purpose,student engagement, differentiated instruction); and classroom environment (e.g., class-room resources and interactions). During advisory observation, evaluators noted theteacher-student interactions and the topics discussed. The team also conducted observa-tions of five professional development sessions and school events. During these observa-tions, staff noted both the level of engagement and the general climate and culture. Allobservations were unannounced.
4 Central Falls High School FIRST YEAR TRANSFORMATION REPORT
Interview
Teachers and staff 33
School leadership 7
Community members 13
Academic Enhancement Center director 1
Mathematics team leader 1
Mathematics consultant 1
Focu
sGroup
Teachers 2
Students 7
FIGURE 1Number of Interviews and Focus Groups Conducted, by Participant Group
5
In Year 1, these observations were informal and used only to gain a brief overview of advi-sory periods, mathematics classrooms, and climate at CFHS. The evaluation team will col-laborate with CFHS leadership to determine the frequency and structure of observations inYears 2 and 3.
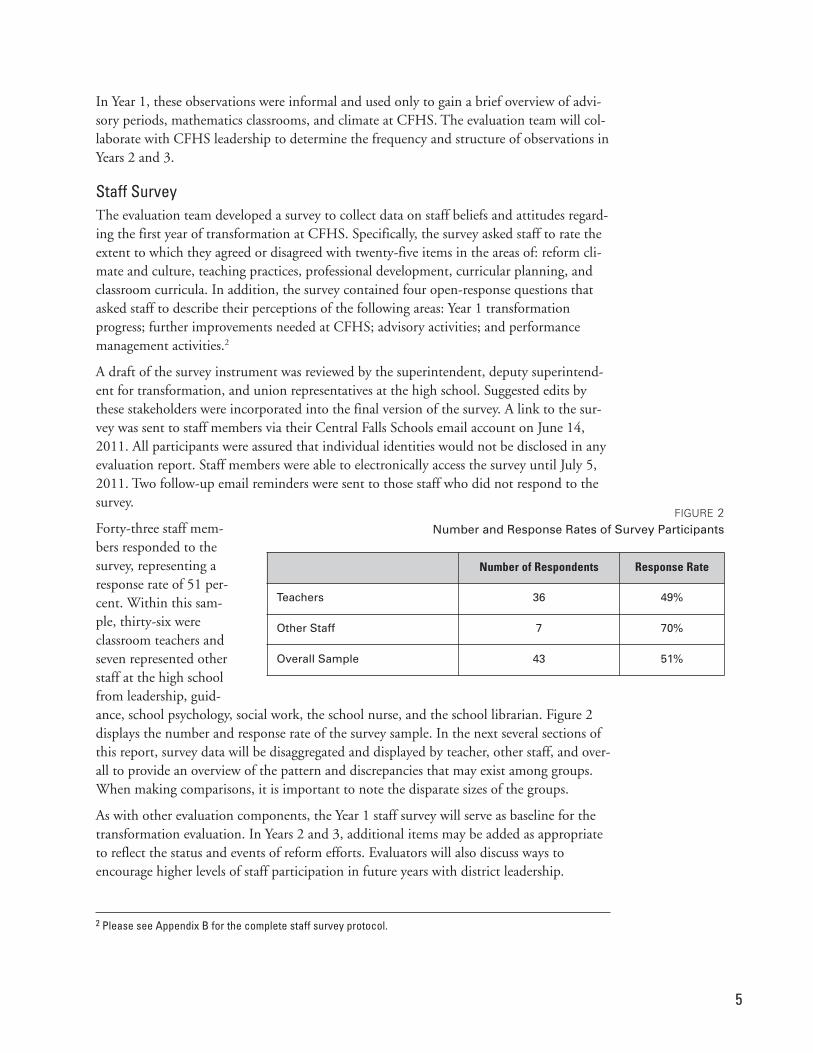
Staff SurveyThe evaluation team developed a survey to collect data on staff beliefs and attitudes regard-ing the first year of transformation at CFHS. Specifically, the survey asked staff to rate theextent to which they agreed or disagreed with twenty-five items in the areas of: reform cli-mate and culture, teaching practices, professional development, curricular planning, andclassroom curricula. In addition, the survey contained four open-response questions thatasked staff to describe their perceptions of the following areas: Year 1 transformationprogress; further improvements needed at CFHS; advisory activities; and performancemanagement activities.2
A draft of the survey instrument was reviewed by the superintendent, deputy superintend-ent for transformation, and union representatives at the high school. Suggested edits bythese stakeholders were incorporated into the final version of the survey. A link to the sur-vey was sent to staff members via their Central Falls Schools email account on June 14,2011. All participants were assured that individual identities would not be disclosed in anyevaluation report. Staff members were able to electronically access the survey until July 5,2011. Two follow-up email reminders were sent to those staff who did not respond to thesurvey.
Forty-three staff mem-bers responded to thesurvey, representing aresponse rate of 51 per-cent. Within this sam-ple, thirty-six wereclassroom teachers andseven represented otherstaff at the high schoolfrom leadership, guid-ance, school psychology, social work, the school nurse, and the school librarian. Figure 2displays the number and response rate of the survey sample. In the next several sections ofthis report, survey data will be disaggregated and displayed by teacher, other staff, and over-all to provide an overview of the pattern and discrepancies that may exist among groups.When making comparisons, it is important to note the disparate sizes of the groups.
As with other evaluation components, the Year 1 staff survey will serve as baseline for thetransformation evaluation. In Years 2 and 3, additional items may be added as appropriateto reflect the status and events of reform efforts. Evaluators will also discuss ways toencourage higher levels of staff participation in future years with district leadership.
Number of Respondents Response Rate
Teachers 36 49%
Other Staff 7 70%
Overall Sample 43 51%
FIGURE 2Number and Response Rates of Survey Participants
2 Please see Appendix B for the complete staff survey protocol.
6 Central Falls High School FIRST YEAR TRANSFORMATION REPORT
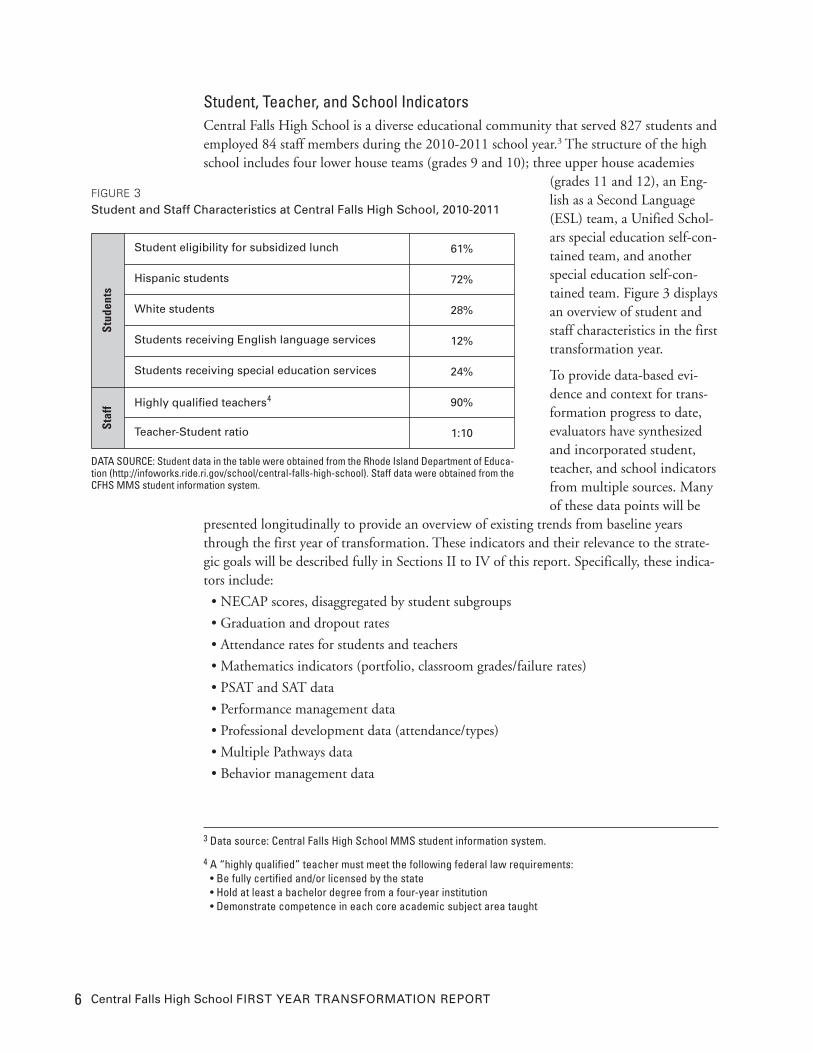
Student, Teacher, and School IndicatorsCentral Falls High School is a diverse educational community that served 827 students andemployed 84 staff members during the 2010-2011 school year.3 The structure of the highschool includes four lower house teams (grades 9 and 10); three upper house academies
(grades 11 and 12), an Eng-lish as a Second Language(ESL) team, a Unified Schol-ars special education self-con-tained team, and anotherspecial education self-con-tained team. Figure 3 displaysan overview of student andstaff characteristics in the firsttransformation year.
To provide data-based evi-dence and context for trans-formation progress to date,evaluators have synthesizedand incorporated student,teacher, and school indicatorsfrom multiple sources. Manyof these data points will be
presented longitudinally to provide an overview of existing trends from baseline yearsthrough the first year of transformation. These indicators and their relevance to the strate-gic goals will be described fully in Sections II to IV of this report. Specifically, these indica-tors include:
• NECAP scores, disaggregated by student subgroups
• Graduation and dropout rates
• Attendance rates for students and teachers
• Mathematics indicators (portfolio, classroom grades/failure rates)
• PSAT and SAT data
• Performance management data
• Professional development data (attendance/types)
• Multiple Pathways data
• Behavior management data
Stud
ents
Student eligibility for subsidized lunch 61%
Hispanic students 72%
White students 28%
Students receiving English language services 12%
Students receiving special education services 24%
Staff Highly qualified teachers4 90%
Teacher-Student ratio 1:10
FIGURE 3Student and Staff Characteristics at Central Falls High School, 2010-2011
DATA SOURCE: Student data in the table were obtained from the Rhode Island Department of Educa-tion (http://infoworks.ride.ri.gov/school/central-falls-high-school). Staff data were obtained from theCFHS MMS student information system.
3 Data source: Central Falls High School MMS student information system.
4 A “highly qualified” teacher must meet the following federal law requirements: • Be fully certified and/or licensed by the state• Hold at least a bachelor degree from a four-year institution• Demonstrate competence in each core academic subject area taught
7
II. Strategic Goal 1
Increase the Graduation Rate and Decrease the Dropout RateThe first strategic goal in the transformation plan is to increase the graduation rate anddecrease the dropout rate at CFHS. During the first transformation year, CFHS imple-mented several strategies to address this goal, including:
• Creating multiple pathways for high school completion
• Strengthening the advisory program
• Streamlining student support services, such as counseling and the Academic Enhance-ment Center
Together, these strategies are intended to provide added academic and socio-emotional sup-port tailored to the individual needs of each student. In this section, we provide an overviewof graduation and dropout rate data and then address each of the strategies in turn.
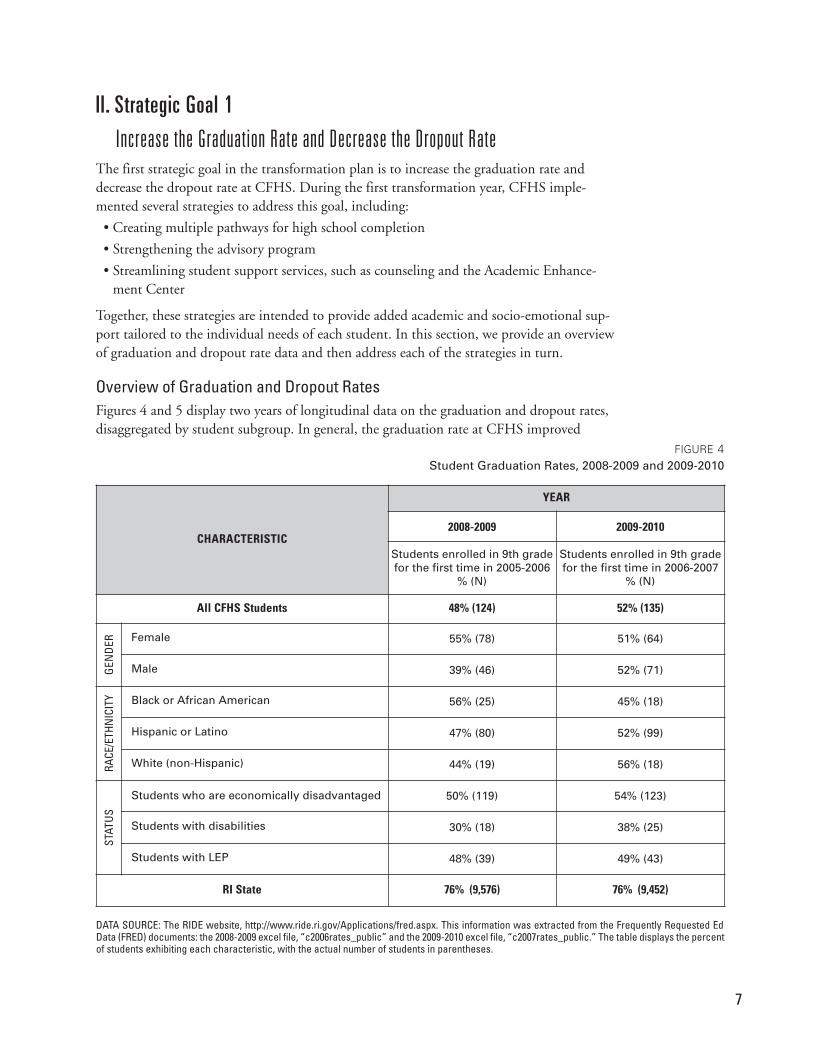
Overview of Graduation and Dropout RatesFigures 4 and 5 display two years of longitudinal data on the graduation and dropout rates,disaggregated by student subgroup. In general, the graduation rate at CFHS improved
CHARACTERISTIC
YEAR
2008-2009 2009-2010
Students enrolled in 9th gradefor the first time in 2005-2006
% (N)
Students enrolled in 9th gradefor the first time in 2006-2007
% (N)
All CFHS Students 48% (124) 52% (135)
GEN
DER Female 55% (78) 51% (64)
Male 39% (46) 52% (71)
RACE
/ETH
NIC
ITY Black or African American 56% (25) 45% (18)
Hispanic or Latino 47% (80) 52% (99)
White (non-Hispanic) 44% (19) 56% (18)
STAT
US
Students who are economically disadvantaged 50% (119) 54% (123)
Students with disabilities 30% (18) 38% (25)
Students with LEP 48% (39) 49% (43)
RI State 76% (9,576) 76% (9,452)
FIGURE 4Student Graduation Rates, 2008-2009 and 2009-2010
DATA SOURCE: The RIDE website, http://www.ride.ri.gov/Applications/fred.aspx. This information was extracted from the Frequently Requested EdData (FRED) documents: the 2008-2009 excel file, “c2006rates_public” and the 2009-2010 excel file, “c2007rates_public.” The table displays the percentof students exhibiting each characteristic, with the actual number of students in parentheses.
8 Central Falls High School FIRST YEAR TRANSFORMATION REPORT
slightly prior to the transformation process, although these rates are lower than the stateaverage. The dropout rate remained stable over this two-year period and is more than dou-ble the state average. Graduation and dropout rate data for 2010-2011 will be available inthe fall of 2011 and will be incorporated in the Year 2 Transformation Report.
Multiple Pathways OptionsAs part of the transformation plan, the Multiple Pathways programs were created by CFHSto help students overcome challenges that may prevent them from staying in school.Specifically, these programs aim to retain students and re-enroll students who have alreadydropped out or are at risk of dropping out. According to interviews with CFHS leadership,the purpose of Multiple Pathways offerings is to examine individual student needs andunderstand that every child has a unique life situation that may affect his/her learning andschool attendance.
CHARACTERISTIC
YEAR
2008-2009 2009-2010
Students enrolled in 9th grade for the first time in 2005-2006
% (N)
Students enrolled in 9th grade for the first time in 2006-2007
% (N)
All CFHS Students 33% (85) 35% (91)
GEN
DER Female 29% (41) 34% (43)
Male 38% (44) 35% (48)
RACE
/ETH
NIC
ITY Black or African American 27% (12) 30% (12)
Hispanic or Latino 34% (58) 35% (66)
White (non-Hispanic) 35% (15) 41% (13)
STAT
US
Students who are economically disadvantaged 31% (73) 31% (72)
Students with disabilities 38% (23) 46% (30)
Students with LEP 35% (29) 37% (32)
RI State 14% (1,762) 14% (1,761)
FIGURE 5Student Dropout Rates, 2008-2009 and 2009-2010
DATA SOURCE: The RIDE website, http://www.ride.ri.gov/Applications/fred.aspx. This information was extracted from the Frequently Requested EdData (FRED) documents: the 2008-2009 excel file, “c2006rates_public” and the 2009-2010 excel file, “c2007rates_public.” The table displays the percentof students exhibiting each characteristic, with the actual number of students in parentheses.
9
The Multiple Pathways programs include:
• Day Program: Guide to Success (G2S)
• P.M. School
• Saturday School
• Early College/College Crusaders
The P.M. and Saturday school programs are based at the high school, and the G2S dayprogram is housed at the Feinstein School building in Central Falls. Within each of theseprograms, childcare services were provided to students who had children of their own.
Day Program: Guide to SuccessInterviewees described the G2S day program as a system of support that offers flexiblescheduling as an opportunity for students to make up credits and accelerate their learning.The program also enables families to leverage resources that they may be unaware of, suchas social and community services. Oftentimes these systems of support can be difficult tonavigate and the G2S program staff helps families steer through the process.
School leaders told us that the day program has been associated with two major successes:
• Helping students stay in school due to facilitated conversations between school staff andparents about family financial constraints
• Creating an understanding that students will be more valuable in the workforce oncethey earn a high school diploma
G2S classes were described as similar academically to the classes offered at the high school,only in a smaller setting and with a more diverse group of teachers. A smaller programwithin the G2S model – Square Mile – serves special education students.
In the 2010-2011 school year, the recruitment target for the G2S program were fifteenover-aged and under-credited students who had already dropped out of school and anadditional fifteen to twenty students who were at risk of dropping out. Actual enrollmentwas higher, with a total of sixty students identified to participate in the program. Of thesixty students, forty-seven enrolled and completed the program over the school year. Fifteen of the students who completed the G2S program had already dropped out ofschool and re-enrolled and graduated through the G2S program. One leadership teammember described the impact G2S has had in the district:
Seeing these fifteen kids so excited about school was amazing. Kids will tell you thatnobody believed in them a year ago. I think it’s probably the greatest accomplish-ment for anyone in this city. These were kids who were not productive citizens a yearago. Now there are fifteen kids who have a high school diploma, who also haveapplied to CCRI [Community College of Rhode Island] and are thinking, “What ismy next goal?” It’s a huge positive impact for everyone in the community and thestate.
Most of the thirteen students who did not complete the G2S program pursued otherendeavors including:
• Three students dropped out of CFHS to accept full time employment.
• Three students enrolled in a dual GED/certificate program.
10 Central Falls High School FIRST YEAR TRANSFORMATION REPORT
• Two students enrolled in a GED/CNA program (Certified Nursing Assistance Programwith a GED component).
• One student enrolled in a GED and clerical program.
• Two students relocated outside of the district.
• Two students no longer attended school and were unaccounted for.
In general, G2S has had a positive impact on the attendance of students in the program.The average rate of attendance for the forty-seven G2S students while at the high schoolwas 72.6 percent. After enrolling in the program, the average attendance rate for these stu-dents increased to 79.6 percent (See Appendix C).
Saturday SchoolSaturday School was another effort to provide students with an alternate means of earninghigh school credits. In interviews, respondents described the Saturday School program as aneeds-based credit recovery program for students who failed a course or did not have anopportunity to take a course. Students completed thirty hours of class time, completedindependent work, and were given required tasks for their portfolios. Two sessions wereoffered in the 2010-2011 school year with the following variations per session:
� Saturday School Session 1• Operated from November 2010 to January 2011
• Included English, mathematics, art, and physical education
• Teachers taught one block each Saturday from 9 a.m. to noon
• Eighteen students attended
� Saturday School Session 2• Operated from January 2011 to May 2011
• Included English, mathematics, art, art history, physical education, and science
• Teachers taught two blocks each Saturday from 9 a.m. to 1 p.m.
• Fifty-two students attended
Four students participating in the Saturday School program were seniors. Three out of thefour seniors completed the program and graduated successfully. Overall, sixty-eight stu-dents successfully earned credits through the program.
Students learned about the Saturday Program from guidance counselors and school-basedannouncements. Student “word of mouth” helped promote knowledge about the secondsession and attendance increased greatly. One of the involved teachers was appointed as theSaturday School administrator and helped facilitate the logistics of each session. Duringinterviews, school leaders stated that student behavior during these sessions was positive, “anon-issue.”(Behavior issues are discussed fully later in the report.)
During Saturday School sessions, teachers had access to Study Island, a computerized soft-ware package to help differentiate mathematics instruction for students. Based on positivefeedback, Study Island will continue to be provided in 2011-2012. Further information onStudy Island, including student usage data, is provided in Section III of this report.
11
P.M. SchoolAnother Multiple Pathways program option, P.M. School, was created to provide studentswith an opportunity to earn credits outside of the typical school day. This option appealedto several students who were young parents or held daytime jobs. CFHS administrationalso required that some students with low attendance records participate in this program.
P.M. School was described by school leaders as a school-to-work program that ensures stu-dents have a commensurate number of hours of academic and work experience. A personaleducation plan (PEP) is created for students, and work-study assignments are matchedwith student strengths, interests, and skills. The program consists of a six-hour day – Mon-day through Friday – which includes paid employment through Progresso Latino or othercommunity organizations. The hours of school and work are customized to the individualneeds of students. A popular example of this work experience is employment at area daycare centers. These opportunities enable students to earn an income while still being academically responsible for their studies. On a final note, eleven of nineteen studentsenrolled in the program had higher P.M. School attendance rates than their day schoolattendance rates.5
Early College/College Crusaders In the Early College and College Crusaders programs, high school students can completenecessary secondary coursework at a community college campus while simultaneouslyearning credit for college. Thirty students participated in the dual enrollment program dur-ing the spring semester at CCRI. Twenty-five students completed the program and gradu-ated in June 2011. Student commitment to this program was evident in participants’willingness and dedication to taking the public bus to the CCRI campus every Saturday at8 a.m. Program challenges included childcare coverage and students’ unfamiliarity withnavigating the public transportation system.
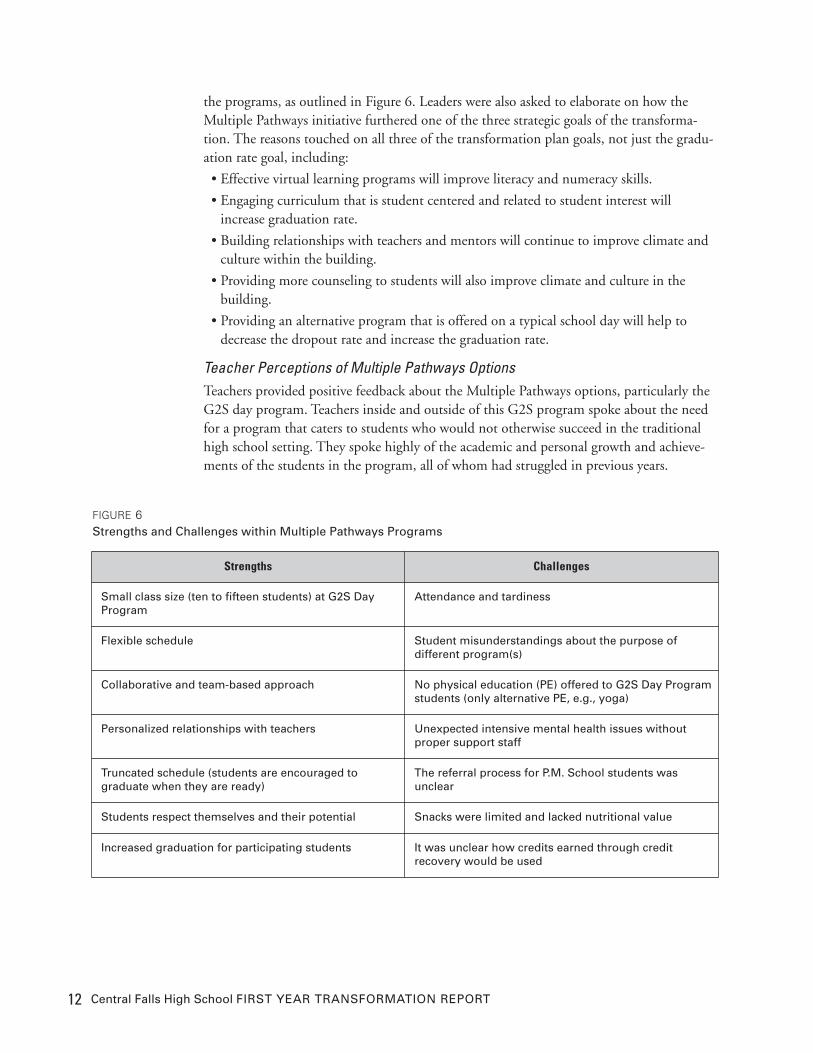
Leadership Perceptions of Multiple Pathways OptionsFollowing a CFHS planning meeting related to multiple pathways programming, nineleadership staff members answered open-ended questions about their overarching perspec-tives about the programs. Responses were analyzed for themes and commonalities as part of this evaluation report. Leaders were first asked to describe what worked well and did not work well about the initiatives. They agreed on similar strengths and challenges across
5 Data source: Central Falls High School MMS student information system.
12 Central Falls High School FIRST YEAR TRANSFORMATION REPORT
the programs, as outlined in Figure 6. Leaders were also asked to elaborate on how theMultiple Pathways initiative furthered one of the three strategic goals of the transforma-tion. The reasons touched on all three of the transformation plan goals, not just the gradu-ation rate goal, including:
• Effective virtual learning programs will improve literacy and numeracy skills.
• Engaging curriculum that is student centered and related to student interest willincrease graduation rate.
• Building relationships with teachers and mentors will continue to improve climate andculture within the building.
• Providing more counseling to students will also improve climate and culture in thebuilding.
• Providing an alternative program that is offered on a typical school day will help todecrease the dropout rate and increase the graduation rate.
Teacher Perceptions of Multiple Pathways Options Teachers provided positive feedback about the Multiple Pathways options, particularly theG2S day program. Teachers inside and outside of this G2S program spoke about the needfor a program that caters to students who would not otherwise succeed in the traditionalhigh school setting. They spoke highly of the academic and personal growth and achieve-ments of the students in the program, all of whom had struggled in previous years.
Strengths Challenges
Small class size (ten to fifteen students) at G2S Day Program
Attendance and tardiness
Flexible schedule Student misunderstandings about the purpose of different program(s)
Collaborative and team-based approach No physical education (PE) offered to G2S Day Programstudents (only alternative PE, e.g., yoga)
Personalized relationships with teachers Unexpected intensive mental health issues withoutproper support staff
Truncated schedule (students are encouraged to graduate when they are ready)
The referral process for P.M. School students wasunclear
Students respect themselves and their potential Snacks were limited and lacked nutritional value
Increased graduation for participating students It was unclear how credits earned through credit recovery would be used
FIGURE 6Strengths and Challenges within Multiple Pathways Programs
13
Strengthening the Advisory ProgramThe advisory program (one half-hour period per day) was reviewed by the leadership teamand restructured in an attempt to help build better relationships between school staff andstudents. The fundamental purpose of the advisory program is to support academic successfor all CFHS students by focusing on three overarching areas:
� Promoting Personal Development and Responsibility• Helping students develop goals for the future and making realistic plans to achievethem
• Teaching students to take responsibility for their own education
• Fostering students’ ability to become articulate self-advocates
� Building Relationships• Providing a connection to an adult (the advisor) who will know the student well andserve as a mentor and advocate
• Creating a safe environment in which students can interact with each other on thebasis of mutual respect and trust
• Developing meaningful ties among the school, the family, and the community
� Supporting the Portfolio Process• Providing students with an overview of portfolio process and tasks
• Explaining that the portfolio is a graduation requirement
• Supporting student efforts to complete tasks and requirements at every grade level
• Monitoring the portfolio checklist
• Administering quarterly Individual Learning Plans (ILPs) goal-setting sessions
• Reviewing students’ selection of work for their portfolios and offering advice in theselection process
Advisory ActivitiesA weekly schedule of activities was devised by grade level and began on September 9, 2010,and ended on June 16, 2011, for grades 9 to 11. A teacher representative, an advisory facil-itator, for each house was appointed to coordinate and communicate these weekly sched-ules. The twelfth-grade class activities began on September 9 and ended on May 26.Common activities across grade levels included orientations, community meetings, guestspeaker engagements, and portfolio-related topics. Restorative Circles6 were also plannedto occur twice weekly in all grades.
Planned activities for advisory for ninth and tenth grades emphasized relationship buildingand problem solving. Specifically, ninth-grade advisory themes included orientation, com-munity, self and peers, and ILP’s. Tenth-grade advisory themes focused on career explo-ration, team building, leadership, relationships, and ILPs.
6 Restorative Circles are a group activity designed to resolve behavior issues by using open communication andproblem-solving strategies. The concept of Restorative Circles is part of the Youth Restoration Project (YRP),which is redesigning school discipline systems to seamlessly connect kids with resources outside of schooland to strengthen the in-school community so kids learn to take better charge of their own lives.
14 Central Falls High School FIRST YEAR TRANSFORMATION REPORT
Planned activities for advisory in grades eleven and twelve focused on decision making,resume writing, public speaking, college preparation, and job applications. The themes foreleventh grade featured planning for life, community service, college-related guidance, andSAT preparation. In twelfth grade, advisory focused on post-graduate plans, proficiency-based graduation requirement (PBGR) guidance, and oral presentation skills.
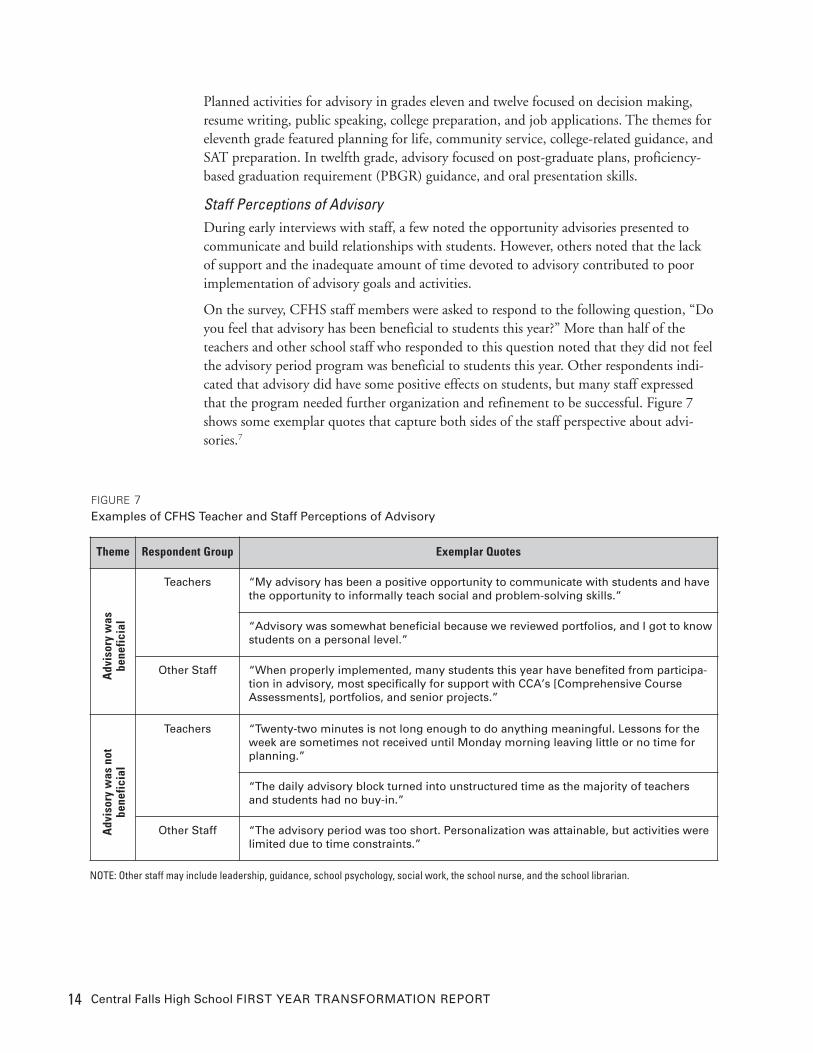
Staff Perceptions of AdvisoryDuring early interviews with staff, a few noted the opportunity advisories presented tocommunicate and build relationships with students. However, others noted that the lack of support and the inadequate amount of time devoted to advisory contributed to poorimplementation of advisory goals and activities.
On the survey, CFHS staff members were asked to respond to the following question, “Doyou feel that advisory has been beneficial to students this year?” More than half of theteachers and other school staff who responded to this question noted that they did not feelthe advisory period program was beneficial to students this year. Other respondents indi-cated that advisory did have some positive effects on students, but many staff expressedthat the program needed further organization and refinement to be successful. Figure 7shows some exemplar quotes that capture both sides of the staff perspective about advi-sories.7
Theme Respondent Group Exemplar Quotes
Adv
isory was
be
nefic
ial
Teachers “My advisory has been a positive opportunity to communicate with students and havethe opportunity to informally teach social and problem-solving skills.”
“Advisory was somewhat beneficial because we reviewed portfolios, and I got to knowstudents on a personal level.”
Other Staff “When properly implemented, many students this year have benefited from participa-tion in advisory, most specifically for support with CCA’s [Comprehensive CourseAssessments], portfolios, and senior projects.”
Adv
isory was
not
bene
ficial
Teachers “Twenty-two minutes is not long enough to do anything meaningful. Lessons for theweek are sometimes not received until Monday morning leaving little or no time forplanning.”
“The daily advisory block turned into unstructured time as the majority of teachersand students had no buy-in.”
Other Staff “The advisory period was too short. Personalization was attainable, but activities werelimited due to time constraints.”
FIGURE 7Examples of CFHS Teacher and Staff Perceptions of Advisory
NOTE: Other staff may include leadership, guidance, school psychology, social work, the school nurse, and the school librarian.
15
When asked about how advisory could be improved, a CFHS leadership team memberindicated that changes to the structure of advisory are planned for next year. First, theschedule will eliminate advisory from taking place during lunch periods. Next, the lengthof advisory periods will be extended from twenty-two minutes to “close to an hour.” Thesescheduling changes will enable advisory to be better monitored for fidelity to the objec-tives. The leadership team member elaborated on future plans for the advisory program:
It’s something structured and built into the schedule, but the concept behind advi-sory is that personalization can happen in different ways. I would like to the see thefuture of advisories become more small group-oriented and more inclusive of staffthroughout the building so that all staff from the custodians to the secretaries arebeing advisors to students.
Student Perceptions of AdvisoryStudents described advisory as a school-wide, non-graded requirement for all pupilsenrolled at CFHS. Students explained that teacher-advisors changed each year. Theyexpressed an interest in maintaining the same advisor throughout the four years of highschool. Advisory activities varied, according to students. For example, one student com-pared it to study hall sessions while another student spoke about engaging in open discus-sions and playing games about school-related topics.
Positive aspects of advisory included the sense that “everyone got along,” which created a space for open discussions. Students also spoke positively about their advisors anddescribed their personalities as “friendly,” “understanding,” and “nice.” Negative aspects ofthe program included criticisms that there were too many rules and it created too strict anenvironment. Another student said they liked very little about advisory other than thesnacks that were provided and wished they had more time to work on their portfolios dur-ing the school year.
When asked about suggestions that would make advisory better in the years to come, stu-dents mentioned two specific recommendations: “I think we should have the same advi-sory teacher throughout our high school experience,” and “Ask us what we want to talkabout; make us pick the topic.”
7 Please see Appendix D for a complete listing of all responses to this staff survey question on advisory.
16 Central Falls High School FIRST YEAR TRANSFORMATION REPORT
Streamlining Student SupportsAnother part of the plan to address the graduation rate was to streamline existing academicand behavioral supports for students at CFHS, including the Academic Enhancement Cen-ter and other student supports.
Academic Enhancement CenterEstablished in 2008, the Academic Enhancement Center (AEC) is a resource setting forstudents to engage in academic work during the school day or after school. According tothe AEC director, there are approximately 1,500 student visits to the AEC per month. Inan interview, AEC leadership stated that the center promotes a self-directed, student-cen-tered culture of learning, which is academically focused and personalized. In addition, col-laborative relationships with the high school’s faculty, guidance counselors, staff,administration, and its students have been developed. Many teachers now conduct classesin the AEC, utilizing technology to improve research and produce class projects, portfolio-related tasks, Comprehensive Course Assessments, and other major projects. Currently theAEC has twenty-one laptops and one color printer available to students.
The primary responsibilities of the AEC director for the 2010-2011 school year were:developing partnerships with Rhode Island-based universities; recruiting tutors who werequalified to meet the unique needs of Central Falls students; and developing and planningsummer programs such as Early College. AEC leadership described several successes of theAEC during the 2010-2011 school year, highlighted below:
• Tutors were utilized in multiple pathways programs, and resources were shared betweenthe AEC and Multiple Pathways programs.
• If necessary, tutors talked with parents to communicate project or assignment details.
• Eight ESL students were given a senior research project as an alternative assignment totheir portfolios when the portfolios were determined to be inadequate according tograduation requirements.
• All students fulfilled their new assignments with the support of tutors at the AEC andwere able to graduate when expected.
Improvements planned for the AEC next year include: expanding the space to includetwenty-five new computers, chairs, a new countertop, and a printer; hiring an assistant torun the basics of the AEC while the director focuses more on program development;implementing a monitoring system that tracks failing students; using data to identify theneeds of the students and programs offered within the AEC; using teacher referrals toquickly identify students in need of additional academic support; and continuing to makethe AEC an academically safe, welcoming, and nurturing environment by adding color,posters, and decorations to the space.
Several teachers mentioned the AEC, unprompted, during staff interviews. These teachersviewed the AEC as a valuable academic and technology resource for both teachers and stu-dents. For example, when asked about resources students receive to be successful, one staffmember noted:
I believe the AEC is a good thing. Kids go in there and get help and get tutored byother college students and other people. I think that’s [a] good thing that [is] goingon and [is] beneficial.
17
Other Student SupportsLike most high schools, CFHS employs guidance counselors to address a wide range of stu-dent needs. However, some respondents cited the student-to-counselor ratio as an obstacleto providing the level of assistance students needed. An executive director for family assis-tance and student supports was hired in early 2011 to improve services by creating aroadmap and assessment tool of various agencies and support systems that exist within theCentral Falls community. CFHS leadership hopes this resource will provide assistance tofamilies and students facing social and economic issues that may prevent them from effec-tively engaging with the school community.
A leadership team member commented on how the school works with parents when stu-dents are falling behind or having other difficulties. A school team, which may includesocial workers, the school psychologist, a speech pathologist, and community social serviceagencies, meets with the student and his/her family. At the meeting, the team discusses andwrites a plan addressing academics as well as social services the student/family may need.This provides both individualized attention to students and builds a partnership with fami-lies to ensure their continued support.
Despite these supports, several teachers and staff commented on the challenges faced bystudents in Central Falls that negatively impact student achievement, including living inpoverty, low English language proficiency, parenting responsibilities, and various otherhome challenges. Among the teachers we spoke to, there was little doubt that such chal-lenges made both teaching and learning more difficult. However, there did seem to be dif-fering perspectives among teachers about whether CFHS – through good instruction anduseful supports – could help students achieve, despite the challenges. As one teacher com-mented:
There are those that blame the environmental contingencies, and there are some of uswho feel that it’s a combination of both things, but certainly here’s an opportunity tohave an intervention that is successful in helping the students succeed.
Summary of Strategic Goal 1CFHS has implemented several new programs and attended to existing student supports toincrease the graduation rate and decrease the dropout rate. All of the Multiple Pathwaysoptions programs (Guide to Success, Saturday School, P.M. school, and College Crusaders)successfully enrolled students, many of whom graduated or recovered necessary credits as aresult of their involvement with these programs. Increased tutoring efforts and studentaccessibility to computers provided through the AEC helped students meet portfolio andgraduation requirements. Changes made to strengthen the advisory program showed mixedresults according to teacher, staff, and student data, indicating that further improvementsare needed to meet program objectives.
18 Central Falls High School FIRST YEAR TRANSFORMATION REPORT
III. Strategic Goal 2
Improve Student Proficiency in Mathematics and Maintain Improvement in English Language Arts Proficiency
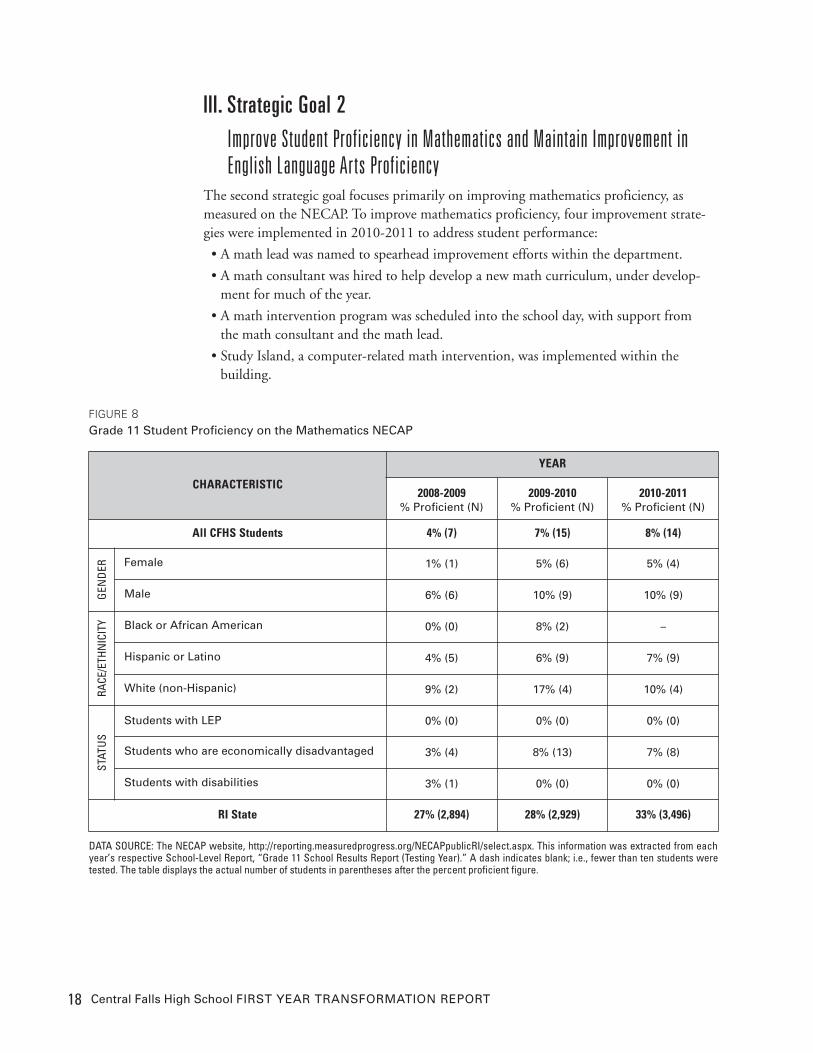
The second strategic goal focuses primarily on improving mathematics proficiency, asmeasured on the NECAP. To improve mathematics proficiency, four improvement strate-gies were implemented in 2010-2011 to address student performance:
• A math lead was named to spearhead improvement efforts within the department.
• A math consultant was hired to help develop a new math curriculum, under develop-ment for much of the year.
• A math intervention program was scheduled into the school day, with support from the math consultant and the math lead.
• Study Island, a computer-related math intervention, was implemented within the building.
CHARACTERISTIC
YEAR
2008-2009% Proficient (N)
2009-2010% Proficient (N)
2010-2011% Proficient (N)
All CFHS Students 4% (7) 7% (15) 8% (14)
GEN
DER Female 1% (1) 5% (6) 5% (4)
Male 6% (6) 10% (9) 10% (9)
RACE
/ETH
NIC
ITY Black or African American 0% (0) 8% (2) –
Hispanic or Latino 4% (5) 6% (9) 7% (9)
White (non-Hispanic) 9% (2) 17% (4) 10% (4)
STAT
US
Students with LEP 0% (0) 0% (0) 0% (0)
Students who are economically disadvantaged 3% (4) 8% (13) 7% (8)
Students with disabilities 3% (1) 0% (0) 0% (0)
RI State 27% (2,894) 28% (2,929) 33% (3,496)
FIGURE 8Grade 11 Student Proficiency on the Mathematics NECAP
DATA SOURCE: The NECAP website, http://reporting.measuredprogress.org/NECAPpublicRI/select.aspx. This information was extracted from eachyear’s respective School-Level Report, “Grade 11 School Results Report (Testing Year).” A dash indicates blank; i.e., fewer than ten students weretested. The table displays the actual number of students in parentheses after the percent proficient figure.
19
Improving Mathematics Proficiency Figure 8 displays NECAP mathematics scores at CFHS over the past three years. NECAPmathematics scores show small improvement gains over a three-year period. In 2010-2011,8 percent of tested students met proficiency on this examination. Although NECAP scoresshow slight longitudinal growth, the percentage of students meeting proficiency is wellbelow the Rhode Island state average. It should be noted that NECAP tests were adminis-tered in October 2010, just one month into the 2010-2011 school year, which is before theimplementation of many new mathematics initiatives in Central Falls. The fall 2011NECAP administration will represent student performance after the first year of transfor-mative efforts; the Year 2 Transformation Evaluation will detail these findings.
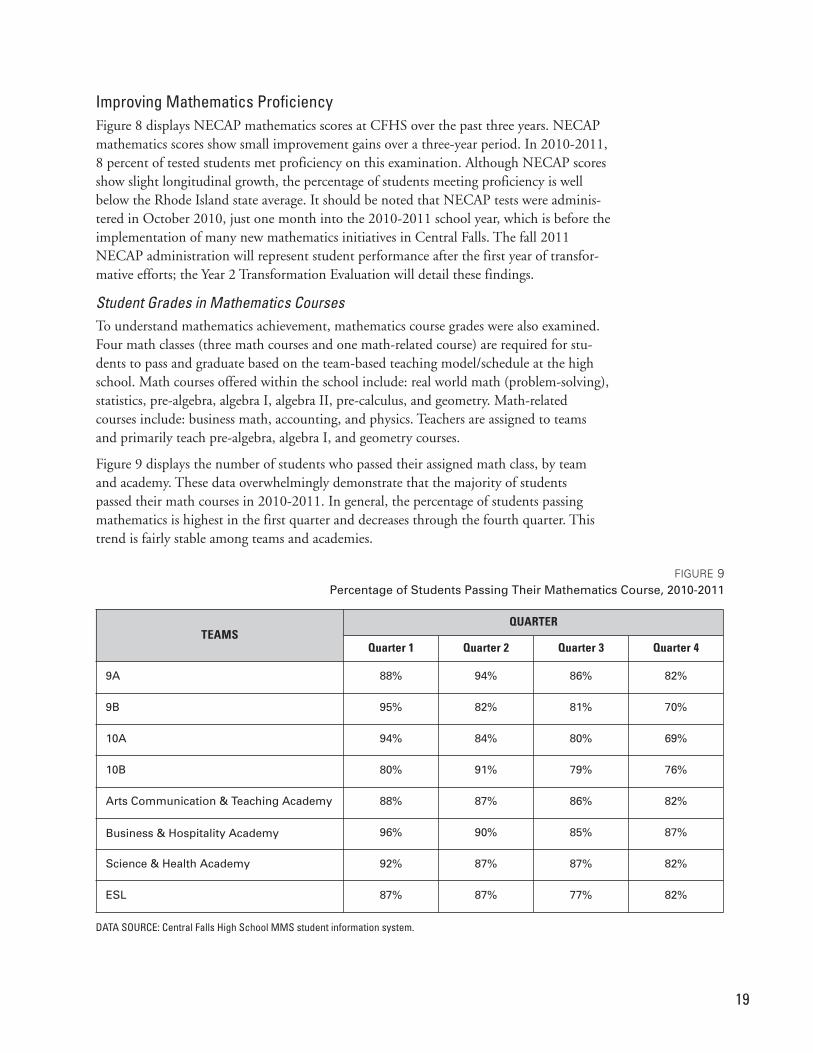
Student Grades in Mathematics CoursesTo understand mathematics achievement, mathematics course grades were also examined.Four math classes (three math courses and one math-related course) are required for stu-dents to pass and graduate based on the team-based teaching model/schedule at the highschool. Math courses offered within the school include: real world math (problem-solving),statistics, pre-algebra, algebra I, algebra II, pre-calculus, and geometry. Math-relatedcourses include: business math, accounting, and physics. Teachers are assigned to teamsand primarily teach pre-algebra, algebra I, and geometry courses.
Figure 9 displays the number of students who passed their assigned math class, by teamand academy. These data overwhelmingly demonstrate that the majority of students passed their math courses in 2010-2011. In general, the percentage of students passingmathematics is highest in the first quarter and decreases through the fourth quarter. Thistrend is fairly stable among teams and academies.
TEAMSQUARTER
Quarter 1 Quarter 2 Quarter 3 Quarter 4
9A 88% 94% 86% 82%
9B 95% 82% 81% 70%
10A 94% 84% 80% 69%
10B 80% 91% 79% 76%
Arts Communication & Teaching Academy 88% 87% 86% 82%
Business & Hospitality Academy 96% 90% 85% 87%
Science & Health Academy 92% 87% 87% 82%
ESL 87% 87% 77% 82%
FIGURE 9Percentage of Students Passing Their Mathematics Course, 2010-2011
DATA SOURCE: Central Falls High School MMS student information system.
20 Central Falls High School FIRST YEAR TRANSFORMATION REPORT
Figure 10 displays the distribution of grades earned in mathematics classes by quarter in2010-2011. Interestingly, these data show that across quarters, A’s and F’s were the mostfrequently earned grades.
Overall, approximately 20 percent of students are failing math, according to schoolrecords. These classroom data demonstrate an inconsistency with NECAP data, whichshow far lower levels of student proficiency.8
Mathematics InterventionThe math consultant and the math lead were involved in integrating and supporting theintervention program that was newly scheduled into the 2010-2011 school year day. Theintervention block went from being a standalone program housed within the AcademicEnhancement Center to a class within the overall school schedule.
The intervention program for ninth- and tenth-grade students consisted of the followingcomponents:
• During the first half of the school year, two days of math, two days of reading, and oneday of digital portfolio were scheduled for students.
• In the second half of the year, the intervention focused on the skills students neededmost and emphasized reading as a priority for PSAT and SAT preparation. Three levelsof math were offered depending on student ability level:
- Remedial level math (seventh- and eighth-grade content)
- Mid-level math (Math Keystones curriculum implemented by a new staff member)
- Math enrichment (building up to the NECAP)
Mathematics CurriculumIt’s expected that the new math curriculum will be presented during professional develop-ment days for mathematics teachers in August 2011. According to the mathematics con-sultant, the curriculum has been reorganized to standardize all courses to the Rhode IslandGrade Level Expectations (GLEs) and align with the Common Core. The professionaldevelopment will identify resources that will be used to deliver and assess the curriculumand will build a timeline for implementation. The mathematics consultant commented onthe process by saying, “The goal is to have one set of objectives for each course that will befollowed by staff teaching the course. We started this work in the spring with the idea of finishing it in August.”
8 It should be noted that the Fall 2010 NECAP scores best represent the teaching year of 2009-2010. Fall 2011NECAP scores will be examined to in relationship to the 2010-2011 teaching year. In addition, NECAP is admin-istered only to students in grade 11.
21
GRADES
QUARTER
Quarter 1% (N)
Quarter 2% (N)
Quarter 3% (N)
Quarter 4% (N)
A+ 10% (494) 7% (390) 7% (390) 7% (343)
A 23% (1,110) 20% (1,076) 23% (1,215) 20% (1,035)
B+ 9% (466) 9% (462) 8% (430) 8% (395)
B 14% (706) 16% (852) 17% (934) 16% (836)
C+ 6% (276) 5% (273) 4% (225) 5% (265)
C 10% (483) 10% (547) 12% (626) 12% (629)
D 8% (392) 9% (476) 9% (491) 11% (583)
F 20% (980) 23% (1,192) 19% (1,030) 20% (1,024)
FIGURE 10School Mathematics Grades Earned by Quarter, 2010-2011
DATA SOURCE: Central Falls High School MMS student information system. The table displays the percent of students for each letter grade, with theactual number of students in parentheses.
22 Central Falls High School FIRST YEAR TRANSFORMATION REPORT
Mathematics ResourcesThe reform plan for improving mathematics included the implementation of a math diag-nostics assessment tool. Study Island, mentioned earlier in this report, is the diagnostic toolused this year; however, it should be noted that the tool was not fully implemented prior tothe NECAP assessment in October 2010. Additionally, a concern regarding limited com-puter availability surfaced in interviews.
Figure 11 displays the Study Island weekly usage data September 2010 through May2011.9 These data show a downward trend in the usage of Study Island over the year. Theprogram was widely used in the first semester of the school year during grade nine and teninterventions. Figure 12 displays the overall school performance in all of the Study Islandprograms. The trend shows CFHS students averaging approximately 65 percent perform-ance in the program.
13,070
11,763
10,456
9,149
7,842
6,535
5,228
3,921
2,614
1,307
0
2010 2011
Sept
5Se
pt 19
Oct 0
3Oc
t 17
Oct 3
1Nov
14Nov
28De
c 12
Dec 2
6Ja
n 9Ja
n 23
Feb 6
Feb 2
0M
ar 6
Mar
20Ap
ril 3
April
17M
ay 1
May
15
Wee
kly Usa
ge(# of Q
uestions
Ans
wered
)
Week Start
FIGURE 11Weekly Usage of Study Island, September 2010 – May 2011
DATA SOURCE: The internal report, “CFHS Math Programs Overview.” This figure was extracted from a Microsoft Word document, “CFHS StudyIsland.”
9 In Figure 11, the number of questions answered is a proxy for the usage of the Study Island program.
23
Other mathematics resources and strategies that were intended to provide student mathsupport in 2010-2011:
• Two new math teachers were hired, one in grade nine and one in grade ten, to helpdeliver the curriculum.
• The Academic Enhancement Center provided differentiated instruction in math tomeet the various needs of students on a one-on-one basis.
FIGURE 12Performance Trend for Study Island
DATA SOURCE: The internal report, “CFHS Math Programs Overview.” This figure was extracted from a Microsoft Word document, “CFHS StudyIsland.”
100
90
80
70
60
50
40
30
20
10
0
2010 2011
Sept
5Se
pt 19
Oct 0
3Oc
t 17
Oct 3
1Nov
14Nov
28De
c 12
Dec 2
6Ja
n 9Ja
n 23
Feb 6
Feb 2
0M
ar 6
Mar
20Ap
ril 3
April
17M
ay 1
May
15
% Correct
Week Start
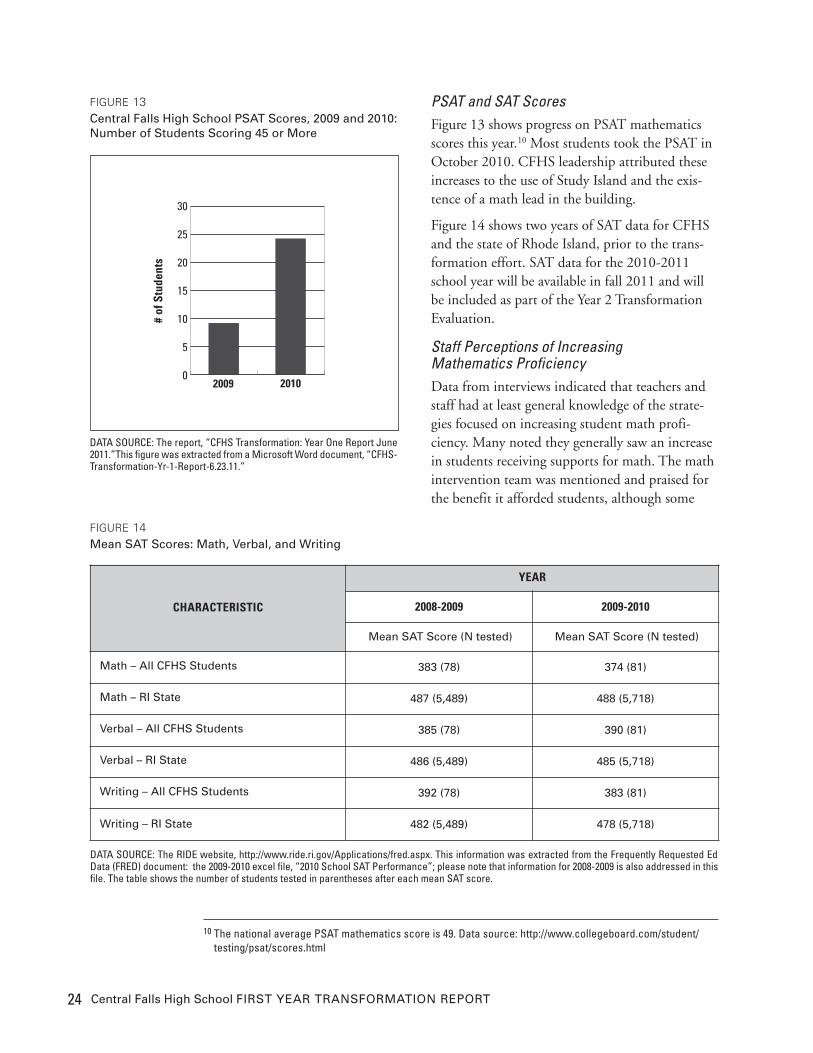
PSAT and SAT ScoresFigure 13 shows progress on PSAT mathematicsscores this year.10 Most students took the PSAT inOctober 2010. CFHS leadership attributed theseincreases to the use of Study Island and the exis-tence of a math lead in the building.
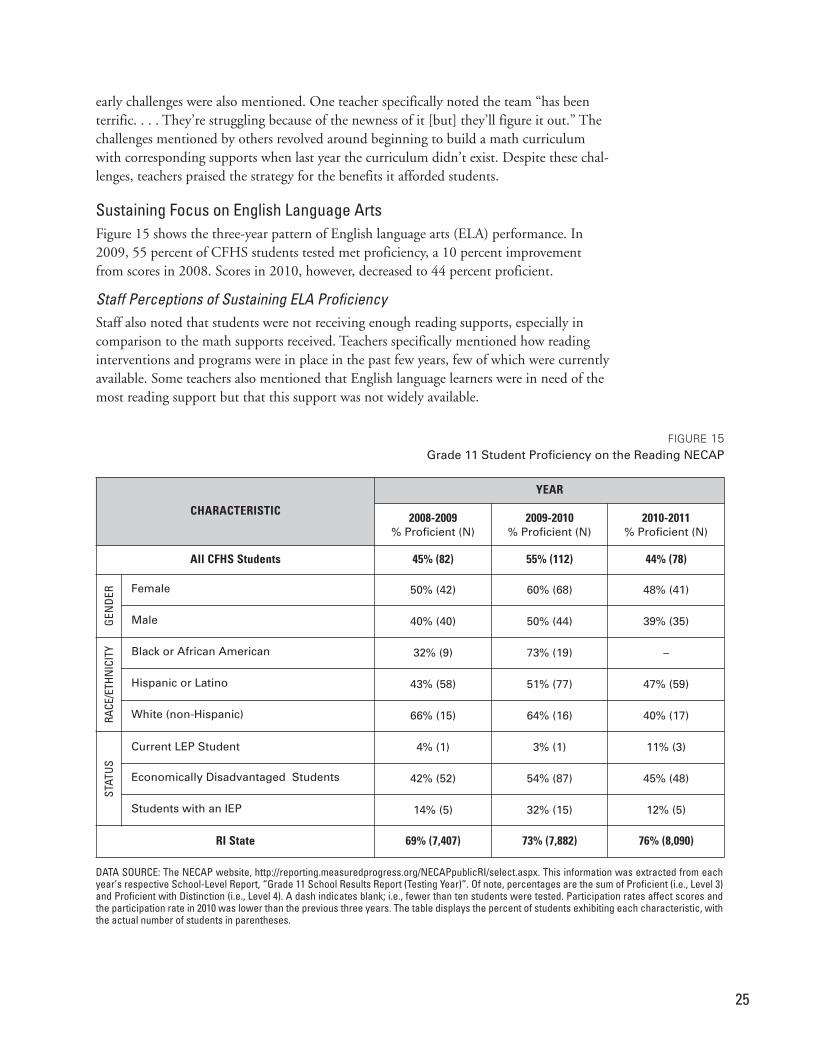
Figure 14 shows two years of SAT data for CFHSand the state of Rhode Island, prior to the trans-formation effort. SAT data for the 2010-2011school year will be available in fall 2011 and willbe included as part of the Year 2 TransformationEvaluation.
Staff Perceptions of Increasing Mathematics ProficiencyData from interviews indicated that teachers andstaff had at least general knowledge of the strate-gies focused on increasing student math profi-ciency. Many noted they generally saw an increasein students receiving supports for math. The mathintervention team was mentioned and praised forthe benefit it afforded students, although some
24 Central Falls High School FIRST YEAR TRANSFORMATION REPORT
30
25
20
15
10
5
020102009
# of Stude
nts
FIGURE 13Central Falls High School PSAT Scores, 2009 and 2010:Number of Students Scoring 45 or More
DATA SOURCE: The report, “CFHS Transformation: Year One Report June2011.”This figure was extracted from a Microsoft Word document, “CFHS-Transformation-Yr-1-Report-6.23.11.”
CHARACTERISTIC
YEAR
2008-2009 2009-2010
Mean SAT Score (N tested) Mean SAT Score (N tested)
Math – All CFHS Students 383 (78) 374 (81)
Math – RI State 487 (5,489) 488 (5,718)
Verbal – All CFHS Students 385 (78) 390 (81)
Verbal – RI State 486 (5,489) 485 (5,718)
Writing – All CFHS Students 392 (78) 383 (81)
Writing – RI State 482 (5,489) 478 (5,718)
FIGURE 14Mean SAT Scores: Math, Verbal, and Writing
DATA SOURCE: The RIDE website, http://www.ride.ri.gov/Applications/fred.aspx. This information was extracted from the Frequently Requested EdData (FRED) document: the 2009-2010 excel file, “2010 School SAT Performance”; please note that information for 2008-2009 is also addressed in thisfile. The table shows the number of students tested in parentheses after each mean SAT score.
10 The national average PSAT mathematics score is 49. Data source: http://www.collegeboard.com/student/testing/psat/scores.html
25
early challenges were also mentioned. One teacher specifically noted the team “has beenterrific. . . . They’re struggling because of the newness of it [but] they’ll figure it out.” Thechallenges mentioned by others revolved around beginning to build a math curriculumwith corresponding supports when last year the curriculum didn’t exist. Despite these chal-lenges, teachers praised the strategy for the benefits it afforded students.
Sustaining Focus on English Language Arts Figure 15 shows the three-year pattern of English language arts (ELA) performance. In2009, 55 percent of CFHS students tested met proficiency, a 10 percent improvementfrom scores in 2008. Scores in 2010, however, decreased to 44 percent proficient.
Staff Perceptions of Sustaining ELA ProficiencyStaff also noted that students were not receiving enough reading supports, especially incomparison to the math supports received. Teachers specifically mentioned how readinginterventions and programs were in place in the past few years, few of which were currentlyavailable. Some teachers also mentioned that English language learners were in need of themost reading support but that this support was not widely available.
CHARACTERISTIC
YEAR
2008-2009% Proficient (N)
2009-2010% Proficient (N)
2010-2011% Proficient (N)
All CFHS Students 45% (82) 55% (112) 44% (78)
GEN
DER Female 50% (42) 60% (68) 48% (41)
Male 40% (40) 50% (44) 39% (35)
RACE
/ETH
NIC
ITY Black or African American 32% (9) 73% (19) –
Hispanic or Latino 43% (58) 51% (77) 47% (59)
White (non-Hispanic) 66% (15) 64% (16) 40% (17)
STAT
US
Current LEP Student 4% (1) 3% (1) 11% (3)
Economically Disadvantaged Students 42% (52) 54% (87) 45% (48)
Students with an IEP 14% (5) 32% (15) 12% (5)
RI State 69% (7,407) 73% (7,882) 76% (8,090)
FIGURE 15Grade 11 Student Proficiency on the Reading NECAP
DATA SOURCE: The NECAP website, http://reporting.measuredprogress.org/NECAPpublicRI/select.aspx. This information was extracted from eachyear’s respective School-Level Report, “Grade 11 School Results Report (Testing Year)”. Of note, percentages are the sum of Proficient (i.e., Level 3)and Proficient with Distinction (i.e., Level 4). A dash indicates blank; i.e., fewer than ten students were tested. Participation rates affect scores andthe participation rate in 2010 was lower than the previous three years. The table displays the percent of students exhibiting each characteristic, withthe actual number of students in parentheses.
26 Central Falls High School FIRST YEAR TRANSFORMATION REPORT
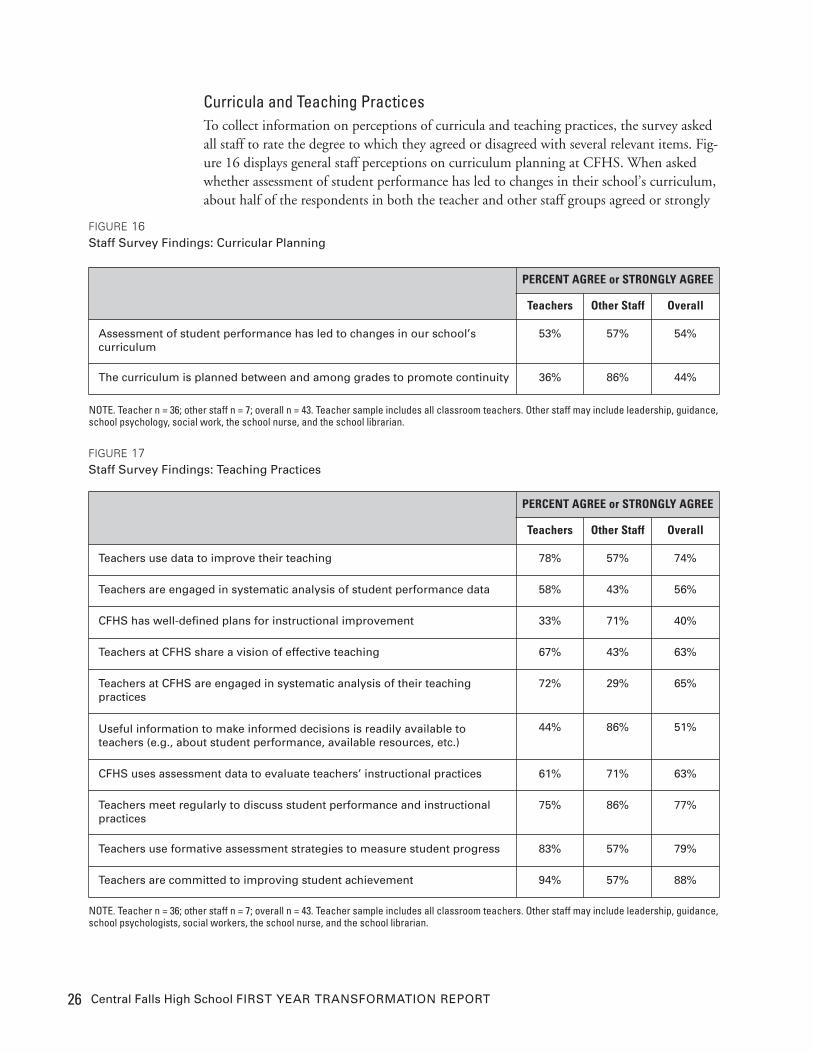
Curricula and Teaching PracticesTo collect information on perceptions of curricula and teaching practices, the survey askedall staff to rate the degree to which they agreed or disagreed with several relevant items. Fig-ure 16 displays general staff perceptions on curriculum planning at CFHS. When askedwhether assessment of student performance has led to changes in their school’s curriculum,about half of the respondents in both the teacher and other staff groups agreed or strongly
PERCENT AGREE or STRONGLY AGREE
Teachers Other Staff Overall
Teachers use data to improve their teaching 78% 57% 74%
Teachers are engaged in systematic analysis of student performance data 58% 43% 56%
CFHS has well-defined plans for instructional improvement 33% 71% 40%
Teachers at CFHS share a vision of effective teaching 67% 43% 63%
Teachers at CFHS are engaged in systematic analysis of their teaching practices
72% 29% 65%
Useful information to make informed decisions is readily available to teachers (e.g., about student performance, available resources, etc.)
44% 86% 51%
CFHS uses assessment data to evaluate teachers’ instructional practices 61% 71% 63%
Teachers meet regularly to discuss student performance and instructionalpractices
75% 86% 77%
Teachers use formative assessment strategies to measure student progress 83% 57% 79%
Teachers are committed to improving student achievement 94% 57% 88%
FIGURE 17Staff Survey Findings: Teaching Practices
NOTE. Teacher n = 36; other staff n = 7; overall n = 43. Teacher sample includes all classroom teachers. Other staff may include leadership, guidance,school psychologists, social workers, the school nurse, and the school librarian.
PERCENT AGREE or STRONGLY AGREE
Teachers Other Staff Overall
Assessment of student performance has led to changes in our school’s curriculum
53% 57% 54%
The curriculum is planned between and among grades to promote continuity 36% 86% 44%
FIGURE 16Staff Survey Findings: Curricular Planning
NOTE. Teacher n = 36; other staff n = 7; overall n = 43. Teacher sample includes all classroom teachers. Other staff may include leadership, guidance,school psychology, social work, the school nurse, and the school librarian.
27
agreed. In contrast, when queried on the statement that curriculum is planned betweenand among grades to promote continuity, a minority of teachers (36 percent) and a major-ity of the other staff (86 percent) agreed or strongly agreed.
The staff survey results for teaching practices are reported in Figure 17. With the exceptionof a few items (e.g., CFHS has well-defined plans for instructional improvement; usefulinformation to make informed decisions is readily available to teachers) teachers agreed orstrongly agreed with these items more frequently than did other staff. Notably:
• 94 percent of the teachers, but 57 percent of other staff, agreed or strongly agreed thatteachers are committed to improving student achievement
• 72 percent of teachers, but only 29 percent, of other staff agreed or strongly agreed thatteachers at CFHS are engaged in systematic analysis of their teaching practices
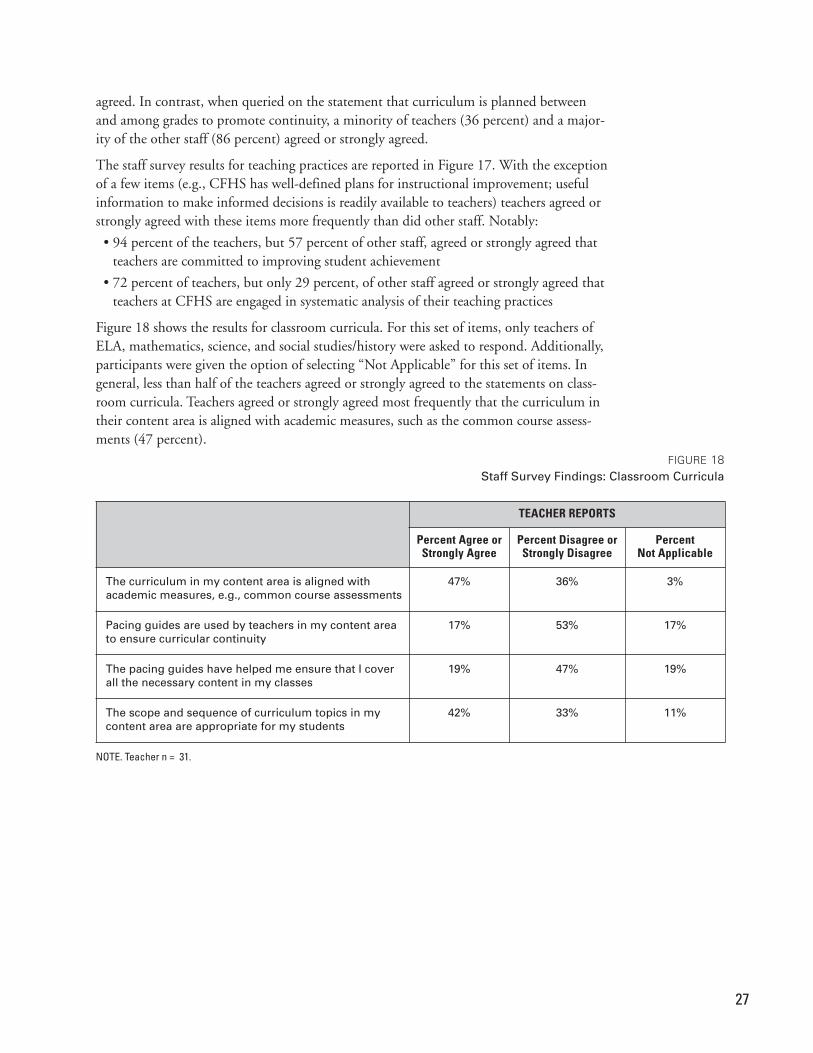
Figure 18 shows the results for classroom curricula. For this set of items, only teachers ofELA, mathematics, science, and social studies/history were asked to respond. Additionally,participants were given the option of selecting “Not Applicable” for this set of items. Ingeneral, less than half of the teachers agreed or strongly agreed to the statements on class-room curricula. Teachers agreed or strongly agreed most frequently that the curriculum intheir content area is aligned with academic measures, such as the common course assess-ments (47 percent).
TEACHER REPORTS
Percent Agree orStrongly Agree
Percent Disagree orStrongly Disagree
Percent Not Applicable
The curriculum in my content area is aligned with academic measures, e.g., common course assessments
47% 36% 3%
Pacing guides are used by teachers in my content areato ensure curricular continuity
17% 53% 17%
The pacing guides have helped me ensure that I coverall the necessary content in my classes
19% 47% 19%
The scope and sequence of curriculum topics in my content area are appropriate for my students
42% 33% 11%
FIGURE 18Staff Survey Findings: Classroom Curricula
NOTE. Teacher n = 31.
28 Central Falls High School FIRST YEAR TRANSFORMATION REPORT
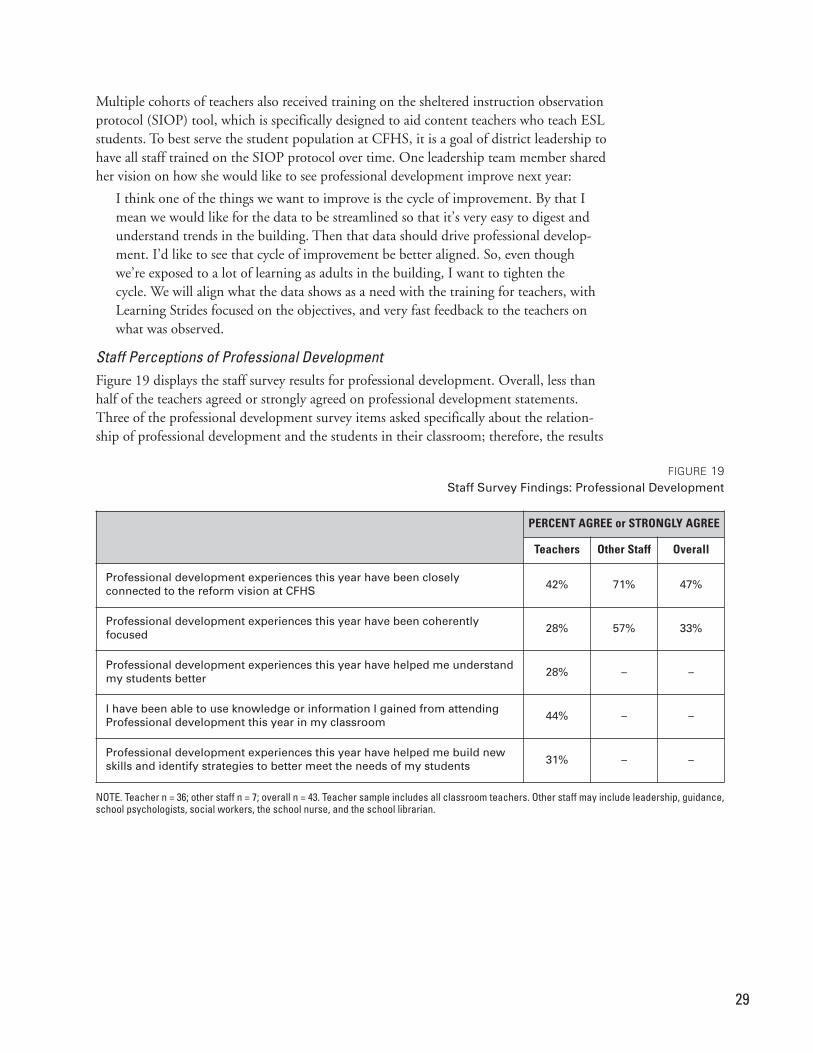
The survey also contained two items relating to the use of pacing guides, which areintended to provide teachers a step-by-step approach to addressing the key content in thetime allotted for each course. The items were included in this first evaluation year to pro-vide a baseline for subsequent years, since the implementation of pacing guides is plannedacross content areas to ascertain curricular continuity. In the current year, the pacing guideitems garnered the least amount of agreement: only 17 percent of the teachers agreed thatthe pacing guides are used by teachers in their content area to ensure curricular continuity,and 19 percent of the teachers agreed that the pacing guides have helped them ensure thatthey cover all the necessary content in their classes.
Professional DevelopmentTen days of professional development were mandated for all teachers in the 2010-2011school year.11 Weekly professional development and/or planning time by content teams wasoffered every Wednesday and Thursday during ninety-minute sessions. A calendar andschedule of all offerings were provided to teachers periodically throughout the year aschanges and adjustments took place. More specifically, professional development at thehigh school included the following structure and topics:
• Wednesday professional development sessions were literacy focused and targetedtowards English, social studies, art, and foreign language teachers. Lead team teachers ordesignees were involved in delivering the professional development.
• Thursday professional development sessions were more numeracy-focused for math, sci-ence, physical education, and business teachers. Lead team teachers were involved indelivering the professional development.
• Special education teachers worked with their content areas colleagues in the areas theytaught during planning times.
• A literacy consultant conducted monthly workshops on Wednesdays that coveredvocabulary building, a continuation of reading comprehension literacy strategies, writ-ing skills, and NECAP preparation.
• A math consultant conducted monthly workshops on Thursdays.
Professional Development Focal Areas In response to the student needs at CFHS, some professional development also combinedcontent in teaching practices and socio-emotional topics. These topics included: crisis prevention intervention, restorative practice, and the Danielson Model framework forteaching.
11 In this section we focus on the Wednesday and Thursday professional development workshops. Performancemanagement activities can also be considered a form of professional development. We address performancemanagement later in the report.
29
Multiple cohorts of teachers also received training on the sheltered instruction observationprotocol (SIOP) tool, which is specifically designed to aid content teachers who teach ESLstudents. To best serve the student population at CFHS, it is a goal of district leadership tohave all staff trained on the SIOP protocol over time. One leadership team member sharedher vision on how she would like to see professional development improve next year:
I think one of the things we want to improve is the cycle of improvement. By that Imean we would like for the data to be streamlined so that it’s very easy to digest andunderstand trends in the building. Then that data should drive professional develop-ment. I’d like to see that cycle of improvement be better aligned. So, even thoughwe’re exposed to a lot of learning as adults in the building, I want to tighten thecycle. We will align what the data shows as a need with the training for teachers, withLearning Strides focused on the objectives, and very fast feedback to the teachers onwhat was observed.
Staff Perceptions of Professional DevelopmentFigure 19 displays the staff survey results for professional development. Overall, less thanhalf of the teachers agreed or strongly agreed on professional development statements.Three of the professional development survey items asked specifically about the relation-ship of professional development and the students in their classroom; therefore, the results
PERCENT AGREE or STRONGLY AGREE
Teachers Other Staff Overall
Professional development experiences this year have been closely connected to the reform vision at CFHS 42% 71% 47%
Professional development experiences this year have been coherentlyfocused 28% 57% 33%
Professional development experiences this year have helped me understandmy students better 28% – –
I have been able to use knowledge or information I gained from attendingProfessional development this year in my classroom 44% – –
Professional development experiences this year have helped me build newskills and identify strategies to better meet the needs of my students 31% – –
FIGURE 19Staff Survey Findings: Professional Development
NOTE. Teacher n = 36; other staff n = 7; overall n = 43. Teacher sample includes all classroom teachers. Other staff may include leadership, guidance,school psychologists, social workers, the school nurse, and the school librarian.
30 Central Falls High School FIRST YEAR TRANSFORMATION REPORT
of these items are presented for teachers only. Forty-two percent of the teachers, but 71percent of the other staff, agreed or strongly agreed that professional development experi-ences this year have been closely connected to the reform vision at CFHS. Twenty-eightpercent of the teachers, though 57 percent of the other staff, agreed or strongly agreed thatprofessional development experiences this year have been coherently focused.
Considerable differences between teacher and other staff perceptions of professional devel-opment exist, and interviews in this area confirmed these survey results. Several teachersnoted during interviews that they did not find the professional development useful. Therewas a widely held sentiment that professional development was not an effective use of time.Specifically, several interviewees said small group discussions at the end of professionaldevelopment lacked the direction to make them effective. One teacher did mention, how-ever, that small-group time required teachers in the same subject matter area to worktogether, a practice they may not have been otherwise willing and/or have the opportunityto do.
Several staff mentioned the need to better tailor professional development topics to differ-ent teacher groups. Veteran teachers claimed the sessions were similar to many they hadexperienced in the past. Special education teachers specifically did not feel that most ses-sions were relevant to their needs.
Summary of Strategic Goal 2Improving student proficiency in mathematics and sustaining ELA proficiency has been acritical focus for the staff at CFHS. Math expertise and personnel were secured to spear-head improvement efforts and develop a new math curriculum within the school. Addi-tionally, a new computer-based diagnostic tool, Study Island, was implemented to supportstudents in mathematics. Professional development opportunities were focused on literacyand numeracy instruction and best practices, as well as socio-emotional topics. Less thanhalf of the teachers who responded to the survey felt that their professional developmentexperiences were closely connected to reform efforts. Survey data also showed that 94 per-cent of teachers agreed or strongly agreed that they are committed to improving studentachievement.
31
IV. Strategic Goal 3
Improve the Culture and Climate of the SchoolDistrict leadership identified the high school’s climate and culture as areas in need of trans-formation, even before the process of adopting a turnaround model occurred. During the2010-2011 school year, four areas were targeted to construct a better environment forteaching and learning:
• Facilities and technology
• Parent and community engagement
• Behavior management and discipline policies
• Teacher-administration communication
Through interviews, focus groups, and surveys, we also identified two other areas thatstrongly impacted the school climate this year:
• Student and staff attendance
• Performance management system
The sections below address each of these topics (with the exception of school facilities,which were beyond the scope of this evaluation). However, it should be noted that all ofthe efforts at addressing school climate issues were affected by the struggle to select a turn-around model. Some teachers in interviews mentioned how they felt that “low morale,”“mistrust,” or “fear” permeated the school.
Student and Staff AttendanceAn examination of staff and student attendance, as well as the performance managementsystem, was conducted as part of this report. Appendix E shows a summary of teacher/staffabsence rates by month, which ranged from ten to twenty-two percent. It is important tonote that the calculated rates, as provided by the high school, do not include someinstances in which a substitute was improperly documented in the system and includesabsences ranging from one hour to a full day. The top graph shows absence rates includingapproved professional time, funerals, and personal days, however the bottom graph showsonly the remaining absences. There has been speculation about the remaining absences.Whether the rate of teacher absences was due to a concerted effort on the part of the teach-ers to protest or undermine reform efforts, or whether this high rate of absences was thecumulative effect of working in a tense environment, or some combination of the two, isnot clear.
Regardless of the source of teacher absenteeism, absences further stressed an already chal-lenged school climate. Teachers noted that teacher absences were highly disruptive. Teach-ers commented that needing to cover for their colleagues cut into individual unassignedplanning time as well as common planning time. While the majority of teachers recognizethe potential value of common planning time, many noted how emergency coverage madeit difficult for whole teams to regularly get together. Daily announcements asking for vol-unteers to cover absent-teacher classrooms caused disruptions during class time.
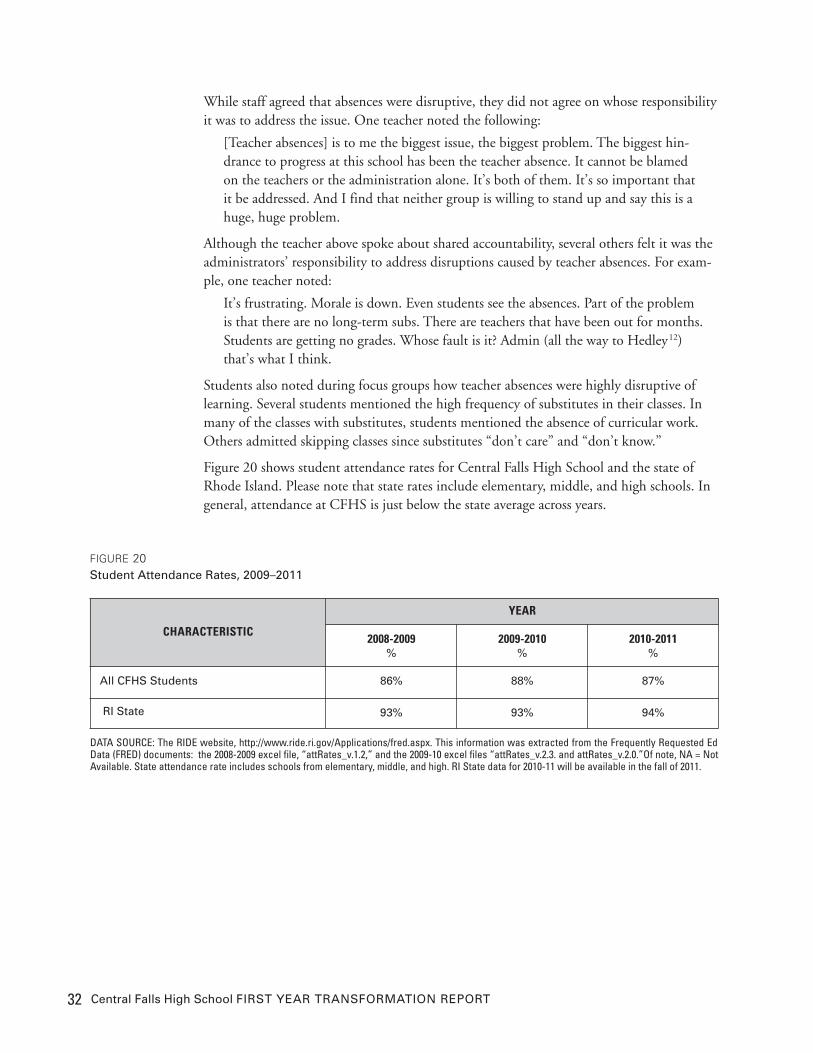
32 Central Falls High School FIRST YEAR TRANSFORMATION REPORT
While staff agreed that absences were disruptive, they did not agree on whose responsibilityit was to address the issue. One teacher noted the following:
[Teacher absences] is to me the biggest issue, the biggest problem. The biggest hin-drance to progress at this school has been the teacher absence. It cannot be blamedon the teachers or the administration alone. It’s both of them. It’s so important thatit be addressed. And I find that neither group is willing to stand up and say this is ahuge, huge problem.
Although the teacher above spoke about shared accountability, several others felt it was theadministrators’ responsibility to address disruptions caused by teacher absences. For exam-ple, one teacher noted:
It’s frustrating. Morale is down. Even students see the absences. Part of the problemis that there are no long-term subs. There are teachers that have been out for months.Students are getting no grades. Whose fault is it? Admin (all the way to Hedley12)that’s what I think.
Students also noted during focus groups how teacher absences were highly disruptive oflearning. Several students mentioned the high frequency of substitutes in their classes. Inmany of the classes with substitutes, students mentioned the absence of curricular work.Others admitted skipping classes since substitutes “don’t care” and “don’t know.”
Figure 20 shows student attendance rates for Central Falls High School and the state ofRhode Island. Please note that state rates include elementary, middle, and high schools. Ingeneral, attendance at CFHS is just below the state average across years.
CHARACTERISTIC
YEAR
2008-2009%
2009-2010%
2010-2011%
All CFHS Students 86% 88% 87%
RI State 93% 93% 94%
FIGURE 20Student Attendance Rates, 2009–2011
DATA SOURCE: The RIDE website, http://www.ride.ri.gov/Applications/fred.aspx. This information was extracted from the Frequently Requested EdData (FRED) documents: the 2008-2009 excel file, “attRates_v.1.2,” and the 2009-10 excel files “attRates_v.2.3. and attRates_v.2.0.”Of note, NA = NotAvailable. State attendance rate includes schools from elementary, middle, and high. RI State data for 2010-11 will be available in the fall of 2011.

33
Performance ManagementThe RIDE Protocol for Persistently Lowest Achieving schools requires schools in transfor-mation to “use rigorous, transparent, and equitable evaluation systems for teachers andprincipals” (see Appendix A). With the support of Mass Insight, a Boston-based organiza-tion that helps districts redesign how they support their lowest performing schools, and incollaboration with the Central Falls Teachers Union, Central Falls School District devel-oped a performance management system based on the Charlotte Danielson Framework forTeaching.13 The framework includes four domains:
1. Planning and Preparation
2. Classroom Environment
3. Instruction
4. Professional Responsibilities
To implement the performance management system, Mass Insight recruited a PerformanceManagement “Bench,” six experienced educators who were asked to assess teachers onthree of these four domains, and provide suggestions for improvement. Each member ofthe “Bench” had a caseload of twelve to fifteen teachers and conducted one to two formal(announced) and one to three informal (unannounced) observations. Members of the lead-ership team were responsible for assessing the fourth domain, professional responsibilities.This combined narrative was intended to be shared with each teacher to identify areas ofstrength and where they could improve their practice.
As shown in Figure 21 on the next page, comments about performance managementsolicited in the staff survey were a mix of positive and negative. Overall, more than half ofall teachers had less positive comments to share, and the other staff had more positive asso-ciations with the activities.14
In interviews, teachers expressed differing opinions about the performance managementsystem depending largely on the respective experience level of the teacher. Newer teachersseemed to be accustomed to this form of evaluation, having had prior experiences withsimilar systems. A few of these newer teachers specifically noted that they welcomed obser-vations as an opportunity to grow. In fact, they suggested that teachers should be observedmore often, both informally and formally, and that observations should be scheduled withfewer advance notices to offer a “truer” sense of a teacher’s ability. In contrast to juniorteachers, some veterans seemed to find adapting to the performance management systemmore difficult. In general, senior teachers viewed the performance management system as a“gotcha” scheme intended to punish staff.
12 The central office for the Central Falls School District is located at 21 Hedley Avenue.
13 http://www.danielsongroup.org/
14 Please see Appendix F for a complete listing of all responses to this staff survey question on performance management.
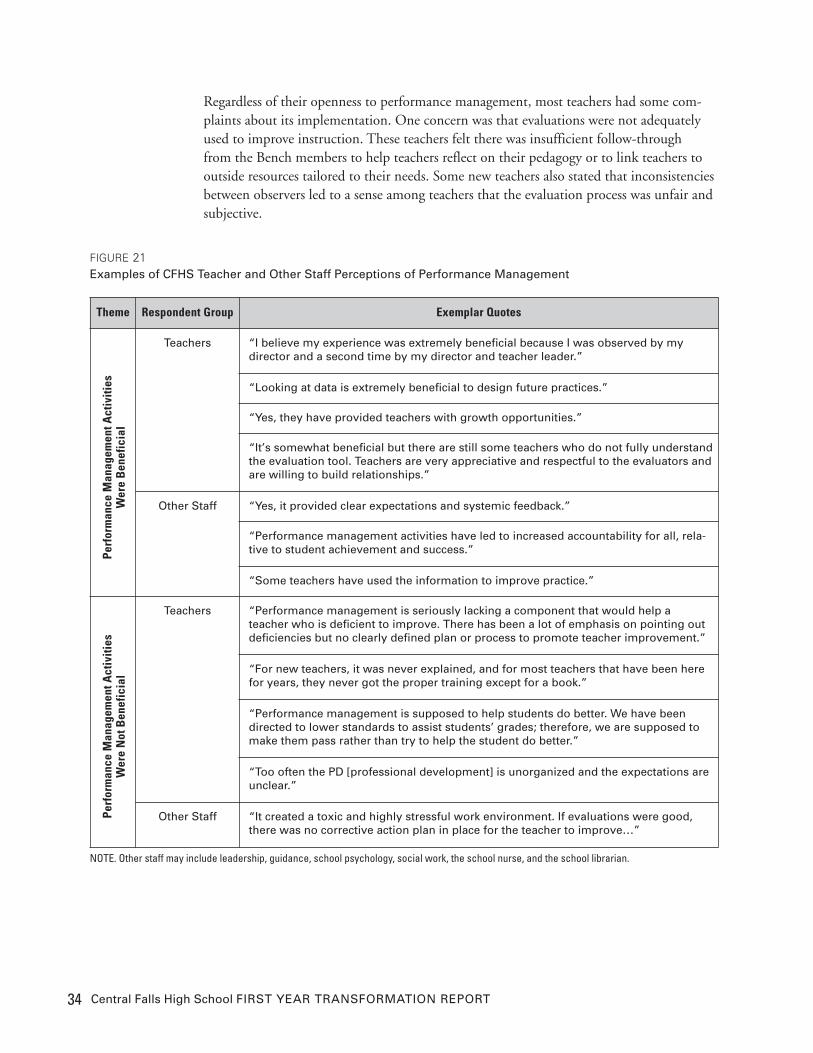
34 Central Falls High School FIRST YEAR TRANSFORMATION REPORT
Regardless of their openness to performance management, most teachers had some com-plaints about its implementation. One concern was that evaluations were not adequatelyused to improve instruction. These teachers felt there was insufficient follow-through from the Bench members to help teachers reflect on their pedagogy or to link teachers tooutside resources tailored to their needs. Some new teachers also stated that inconsistenciesbetween observers led to a sense among teachers that the evaluation process was unfair andsubjective.
Theme Respondent Group Exemplar Quotes
Performan
ce M
anag
emen
t Activities
Were Ben
eficial
Teachers “I believe my experience was extremely beneficial because I was observed by mydirector and a second time by my director and teacher leader.”
“Looking at data is extremely beneficial to design future practices.”
“Yes, they have provided teachers with growth opportunities.”
“It’s somewhat beneficial but there are still some teachers who do not fully understandthe evaluation tool. Teachers are very appreciative and respectful to the evaluators andare willing to build relationships.”
Other Staff “Yes, it provided clear expectations and systemic feedback.”
“Performance management activities have led to increased accountability for all, rela-tive to student achievement and success.”
“Some teachers have used the information to improve practice.”
Performan
ce M
anag
emen
t Activities
Were Not Ben
eficial
Teachers “Performance management is seriously lacking a component that would help ateacher who is deficient to improve. There has been a lot of emphasis on pointing outdeficiencies but no clearly defined plan or process to promote teacher improvement.”
“For new teachers, it was never explained, and for most teachers that have been herefor years, they never got the proper training except for a book.”
“Performance management is supposed to help students do better. We have beendirected to lower standards to assist students’ grades; therefore, we are supposed tomake them pass rather than try to help the student do better.”
“Too often the PD [professional development] is unorganized and the expectations areunclear.”
Other Staff “It created a toxic and highly stressful work environment. If evaluations were good,there was no corrective action plan in place for the teacher to improve…”
FIGURE 21Examples of CFHS Teacher and Other Staff Perceptions of Performance Management
NOTE. Other staff may include leadership, guidance, school psychology, social work, the school nurse, and the school librarian.
35
Bench members interviewed seemed genuinely engaged in the work of the school andshared stories about how they had intervened with teachers and saw improvements in theirpractice. Both teachers and “Bench” members used the term “gotcha” to describe how theprocess was perceived by teachers, and “Bench” members knew they had to send the mes-sage that the system was intended to be a support. One “Bench” member noted that“Some Bench members carried that [message] well; others not so much.” Anotherdescribed how, when asked by a teacher who was initially hostile to the process, “Who thehell are you?” and she responded:
I said, “To be honest with you, we [the Bench] offer a unique viewpoint. We don’thave the history. I don’t know you. I come in with a clear vision. I write it as I see it.There is nothing else clouding it. I come with total objectivity. I am here to helpyou.” He toned down. It made sense to him.
Bench members also agreed on the importance of making sure that they were all assessingteachers similarly, or “calibrating” their assessments. As one member related,
I’ve been part of a couple of calibration trainings. . . . They were very valuable. Weneed to be more aware of whether we have that inter-rater reliability. If teachers per-ceive that “Oh, [Bench member name] is an easy grader.” Then it is all over. We allhave to be very consistent.
In addition to the calibration trainings, Bench members participated in weekly (at first) tomonthly (by the end of the school year) conference calls with the CFHS leadership team,district leadership, and Mass Insight to discuss issues that had come up in the performancemanagement process. This provided them opportunities to observe and, in some cases,mentor leadership team members. These interactions were positive. One Bench membercommented, “That’s been great. I love the fact that the Bench includes the administration,superintendent, Bench members, all of that feels very positive.” However, Bench membersexpressed concern about Domain 4, the professional responsibilities domain, whichincludes teacher behavior throughout the school, not just teaching observed in the class-room. Leadership team members did not always follow through on their responsibility forcompleting this section of the evaluation. For example, a Bench member told us:
I would get [the evaluation narrative] written up and try to turn it around as soon as possible. . . . But it was not easy to get domain 4 written by the principal. I wouldsit and do the post-conference [to discuss the evaluation with the teacher] and Iwouldn’t have the data on Domain 4. Or it [Domain 4] wouldn’t be great, and Iwould be in the middle, trying to explain something I didn’t know about. . . . I putobservations on file with no Domain 4.
Another Bench member said:
Initially [the leadership team] did not have a system in place for assessing [Domain4]. It was mainly about attendance and committee work – all things that [the Bench]would have no access to. [For example], I don’t know if someone is chairing theschool improvement team. The leadership team would complete that section. Inmany cases, especially at the beginning of the year, it didn’t happen. . . . I found thatit would get teachers’ focus away from what they should be on.
36 Central Falls High School FIRST YEAR TRANSFORMATION REPORT
Teachers interviewed pointed to the professional responsibilities domain in their critiquesof the system as unfair and inconsistent. As one teacher noted:
[W]hen it comes to the teacher evaluations, there are things outside of that [class-room observation] snapshot that are included . . . and it’s misconstrued. [I’ve learnedthat] Not from my own experience, but from the grapevine, I think, and that’s partof the culture. So I think that there’s mistrust. I think that that is an issue that needsto be addressed.
Leadership team members saw the potential for the performance management system asone of the strategies for building buy-in to the efforts involved in transforming the highschool. They talked about providing teachers with the materials, skills, and supports theyneed to be successful. But in the first year, there also seemed to be some pressure to identifyteachers as either transformative or not. As one leader stated:
I think part of the reform is building the buy-in. How do we get people to come onboard with the transformation? It’s a lot of communication, trust building, equippingteachers with what they need, whether it’s textbooks or calculators. . . . Part of it isthrough our performance management system, really seeing who is performing andwho is not. And then some people deciding for themselves that they don’t want any-thing to do with the transformation, so “It’s time for me to move on.”
These questions about the purpose of the performance management system affected theculture at the high school and, in particular, the relationship between teachers and schooladministrators. The perceived lack of clarity about what was included in Domain 4 and aperception that the performance management system was being used to identify teacherswho were “in” or “out” stressed an already challenging environment. Several teachers notedthat the mistrust created a “culture of fear” where teachers were afraid of being reviewedpoorly and losing their jobs.
Teacher Supports, Collaboration, and CommunicationThe staff survey results for reform climate and culture are shown in Figure 22. For allitems, teachers report lower levels of agreement than other staff. Additionally, half or lessthan half of participating teachers agree to these climate-related items. For example, 50percent of the teachers, but 86 percent of the other staff, agreed that CFHS has a clearvision of reform that is linked to standards for student learning and development. Thirty-six percent of the teachers, though 71 percent of the other staff, agreed that staff and lead-ership openly discuss efforts to improve CFHS. Interestingly, half of the teachers agreedthat CFHS has made changes designed to better meet the needs of its diverse student body;however, other staff unanimously agreed to this same statement. Finally, 33 percent of theteachers, but 71 percent of the other staff, agreed that communication between high schoolleadership and teachers has improved over the course of this school year.
The differences in teacher and leadership/other staff perceptions about the reform climateand culture point to a division that was reflected in interviews, focus groups, and observa-tions. The relationships and communication between administrators and teachers has beenstrained and difficult this year; and only one-third of teachers feel that it has improved.
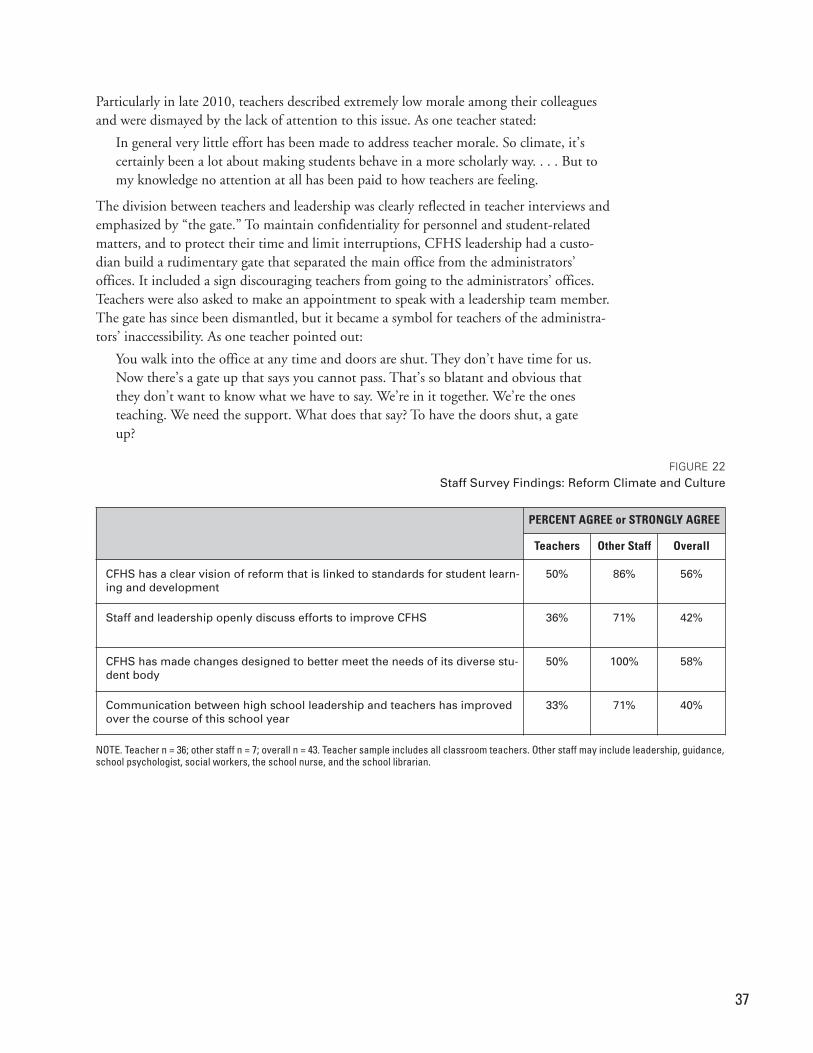
37
Particularly in late 2010, teachers described extremely low morale among their colleaguesand were dismayed by the lack of attention to this issue. As one teacher stated:
In general very little effort has been made to address teacher morale. So climate, it’scertainly been a lot about making students behave in a more scholarly way. . . . But tomy knowledge no attention at all has been paid to how teachers are feeling.
The division between teachers and leadership was clearly reflected in teacher interviews andemphasized by “the gate.” To maintain confidentiality for personnel and student-relatedmatters, and to protect their time and limit interruptions, CFHS leadership had a custo-dian build a rudimentary gate that separated the main office from the administrators’offices. It included a sign discouraging teachers from going to the administrators’ offices.Teachers were also asked to make an appointment to speak with a leadership team member.The gate has since been dismantled, but it became a symbol for teachers of the administra-tors’ inaccessibility. As one teacher pointed out:
You walk into the office at any time and doors are shut. They don’t have time for us.Now there’s a gate up that says you cannot pass. That’s so blatant and obvious thatthey don’t want to know what we have to say. We’re in it together. We’re the onesteaching. We need the support. What does that say? To have the doors shut, a gateup?
PERCENT AGREE or STRONGLY AGREE
Teachers Other Staff Overall
CFHS has a clear vision of reform that is linked to standards for student learn-ing and development
50% 86% 56%
Staff and leadership openly discuss efforts to improve CFHS 36% 71% 42%
CFHS has made changes designed to better meet the needs of its diverse stu-dent body
50% 100% 58%
Communication between high school leadership and teachers has improvedover the course of this school year
33% 71% 40%
FIGURE 22Staff Survey Findings: Reform Climate and Culture
NOTE. Teacher n = 36; other staff n = 7; overall n = 43. Teacher sample includes all classroom teachers. Other staff may include leadership, guidance,school psychologist, social workers, the school nurse, and the school librarian.
38 Central Falls High School FIRST YEAR TRANSFORMATION REPORT
Many felt that stark lines had been drawn about who was “on board” and who was not. Asa community member shared:
People have chosen sides up there. There is no redemption. If you were a union gun,there is no way for you to say, “I’m going to support this effort.” The opinions havebeen firmed up that this person is not to be trusted.
Even those teachers who expressed confidence in the level of communication with the lead-ership team noted that receptivity to communications depended on each individual’s rela-tionship with leadership team members:
Personally, I can stop them [the leadership team] in the hallway and talk to them.They take time to hear what I have to say. But for other teachers, if they have spokenout [criticizing reform efforts], the LT [leadership team] is not as receptive.
Many teachers claimed that the leadership team heard their concerns but were unable tosuccessfully respond to them. Some teachers did not feel included in decision making,specifically noting that the leadership team did not make an effort to reach out to them fortheir thoughts or recommendations. Others felt that there were not ample avenues for dis-cussing challenges with the leadership team without the fear of being reprimanded or dis-missed in some way, as discussed previously in the performance management section.These feelings were somewhat more prevalent among more senior teachers. As a couple ofsenior teachers mentioned:
In my opinion, the administration doesn’t place any value on anything that teachersthat have been here need to say. They don’t want to hear our opinions; they just wantto push their model forward, right or wrong.
If it doesn’t go along with what they want it doesn’t matter. They’re not going tovalue teachers’ opinions if it’s not what they want. . . . They don’t mean what theysay. They lock their doors; we have to check and see if we can speak to our principals.We never see them in hallways. We only get reprimands. We get talked at.
Leadership, on the other hand, was working extremely hard to fulfill the many roles theyhad to play. A community member observed, “They are working around the clock. Theyare working like crazy.” Leadership team members consistently expressed the desire forteacher input and teacher leadership, but faced with the many demands on their time, theystruggled to implement it in a way that felt meaningful to the majority of teachers outsidethe small group of teacher leaders. As a community member stated, “It’s more like com-mand and control, not we’re all in this together. The relationship piece is really missing.”
Leaders were aware that there was room for improvement in communication with teachers.One of them shared:
[Communication] could always be improved. I think for the past month or so we[the leadership team] have made more of a concerted effort to be more present whereteachers are by visiting CPT [common planning time], going to teachers who aremeeting. We started by saying we’re always available to you, come meet with us, andwhat we’re also doing now is going to them. That’s made a difference. We also needto build other mechanisms that are more systemic. Like with weekly newsletters,sending them more information before it hits the media. This is all in the works.
39
Common Planning TimeThe primary mechanism for staff to collaborate with others was during common planningtime. All teachers met with their house or academy team for one period every day. Thisspace was created so instructional staff could plan interventions for specific students,receive feedback and assistance from colleagues when developing lesson plans, and poten-tially develop interdisciplinary instruction. Several teachers indicated there was a widerange in ability/willingness to work collaboratively across individual teachers and differentteams. The math department was described as a particularly collaborative unit. Members ofthe math department reported that common planning time was valuable to them. Eventeachers who were not a part of the math department recognized that team’s successful useof common planning time. The self-contained special education team also described them-selves as a group who worked well together.
For other teams, the use of common planning time varied. Some teams reported difficultycollaborating, and members described meetings that were unproductive complaint sessionsor unstructured, free-form discussions that varied in utility from week to week. As previ-ously noted above, classroom coverage due to teacher absences made it difficult for teachersto participate during regularly scheduled common planning time. One team noted nothaving been able to meet as a group “for weeks.” Another teacher mentioned that coveringclasses was “threatening” common planning time, with a different team member being outevery day in a week. Finally, a few teachers also mentioned the lack of a necessary structurefor teachers to collaborate within subject areas, not just across teams.
Behavior ManagementBehavior management was frequently cited as a challenge that negatively affected the cul-ture and climate at CFHS. In interviews and focus groups, especially those conducted inlate 2010, teachers, staff, and students reported a lack of consistent rules regarding behav-ior management. In particular, they felt that using “restorative practices” as a behaviormanagement model was the major contributing factor for poor student behavior becausethe model lacked firm consequences for students. Both staff and students felt that the in-school support (ISS)/restoration room did not help in deterring behavior incidents. In fact,students noted how some of their peers “use [ISS] as a way to get out of class. People go inthere and do nothing the whole period.” Students and staff noted, however, that the behav-ior issues and classroom disruptions could be attributed to a “small percentage” of stu-dents, specifically lowerclassmen. A leadership team member added, “Inconsistent rulescurrently exist within the high school; more grounded policies and procedures need to becommunicated and enforced.”
Changes to Behavior Management ProcessesDue to the concerns about student behavior, some mid-year changes were made to thebehavior management process. Four restorative specialists were hired to work with studentsoutside of the classroom to resolve behavior issues by using open communication andproblem-solving strategies that involve student participation and input. These specialists
40 Central Falls High School FIRST YEAR TRANSFORMATION REPORT
are the first point of contact if a student misbehaves in class.15 When an incident occurs, the specified protocol is that the classroom teacher presses a buzzer to signal a specialist.Teachers write a referral of the incident, which is reviewed by the discipline team lead andentered into MMS, a new student information system that was developed in fall 2010. Anystaff member who submits a referral receives an email from the discipline lead detailing theincident and the recommended solution. In addition, a behavior committee was establishedto address issues pertaining to period attendance, after-school restoration, and the creationof a handbook. This committee met through May 2011 and consisted of teachers, leader-ship team members, parents, and community members.
In 2011, new effort has been expended to evaluate each behavioral referral on a case-by-casebasis and to develop a support plan to address the individual needs of each student. Withsome behavior incidents, a designated staff person (e.g., school psychologist, social worker,or outreach worker) supports the case. Depending upon the student needs, other profes-sionals, such as health care professionals and community-based agency workers, might alsobecome involved. CFHS leadership is hopeful that this new approach will decrease thenumber of behavior referrals and ultimately improve the climate and culture within thebuilding.
Greater levels of documentation of behavior management strategies are also now requiredwhen a student misbehaves. Currently, all discipline referrals are tracked on MMS. Basedon data entered into MMS, there are better understandings of how many student behaviorincidents take place within a given school year. Figure 23 shows the number and types ofbehavior incidents documented in the past year. The evaluation team will use these num-bers as a baseline to examine the levels and patterns of behavior incidents over the next twoyears of the transformation study.
Teachers and staff noted in interviews conducted in spring 2011 how student behaviorissues, while still an issue, began to improve after having the full discipline team of restora-tive specialists and the MMS tracking system in place. The specialists allowed for behaviorissues to be addressed more quickly and efficiently. Some restorative specialists did sharewith us concerns that teachers over-rely on the specialists, referring to minor incidents thatcould be addressed in the classroom.
15 Next year a new position, lead restoration specialist, will become the first point of contact to respond to thereferrals.
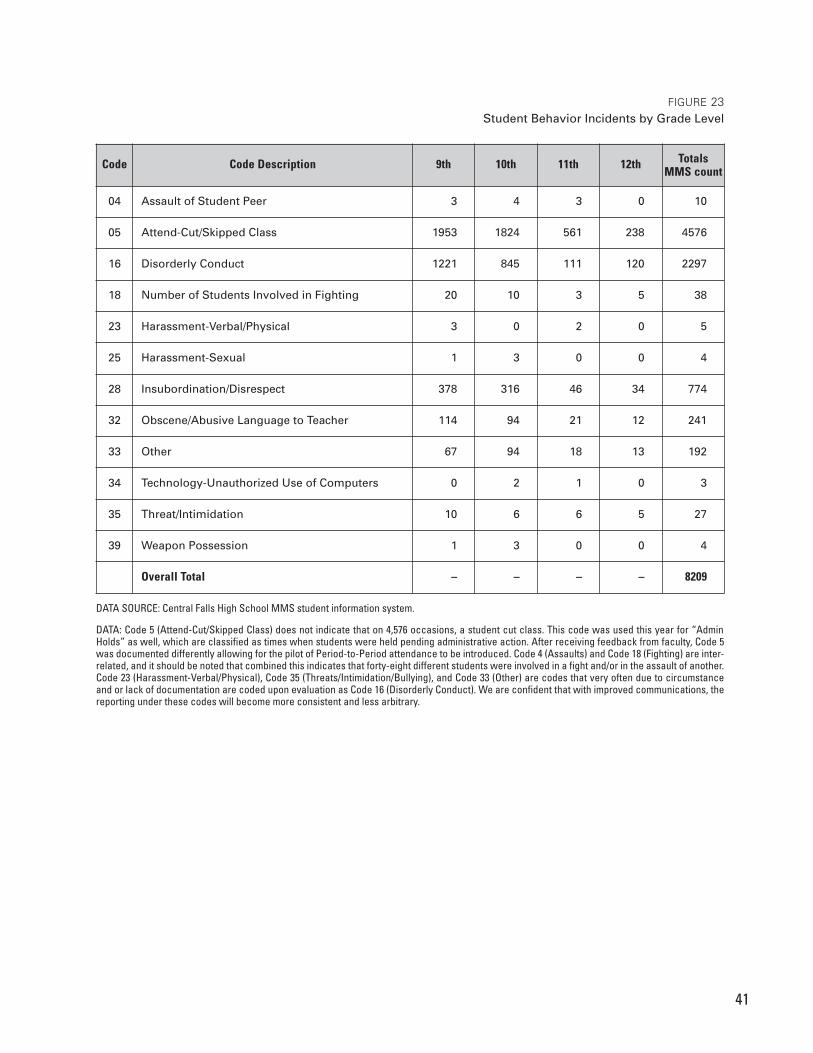
41
Code Code Description 9th 10th 11th 12th Totals MMS count
04 Assault of Student Peer 3 4 3 0 10
05 Attend-Cut/Skipped Class 1953 1824 561 238 4576
16 Disorderly Conduct 1221 845 111 120 2297
18 Number of Students Involved in Fighting 20 10 3 5 38
23 Harassment-Verbal/Physical 3 0 2 0 5
25 Harassment-Sexual 1 3 0 0 4
28 Insubordination/Disrespect 378 316 46 34 774
32 Obscene/Abusive Language to Teacher 114 94 21 12 241
33 Other 67 94 18 13 192
34 Technology-Unauthorized Use of Computers 0 2 1 0 3
35 Threat/Intimidation 10 6 6 5 27
39 Weapon Possession 1 3 0 0 4
Overall Total – – – – 8209
FIGURE 23Student Behavior Incidents by Grade Level
DATA SOURCE: Central Falls High School MMS student information system.
DATA: Code 5 (Attend-Cut/Skipped Class) does not indicate that on 4,576 occasions, a student cut class. This code was used this year for “AdminHolds” as well, which are classified as times when students were held pending administrative action. After receiving feedback from faculty, Code 5was documented differently allowing for the pilot of Period-to-Period attendance to be introduced. Code 4 (Assaults) and Code 18 (Fighting) are inter-related, and it should be noted that combined this indicates that forty-eight different students were involved in a fight and/or in the assault of another.Code 23 (Harassment-Verbal/Physical), Code 35 (Threats/Intimidation/Bullying), and Code 33 (Other) are codes that very often due to circumstanceand or lack of documentation are coded upon evaluation as Code 16 (Disorderly Conduct). We are confident that with improved communications, thereporting under these codes will become more consistent and less arbitrary.
42 Central Falls High School FIRST YEAR TRANSFORMATION REPORT
Student and Community Perceptions of School Climate
Students were asked within focus groups if they believed their teachers cared about howwell they did in school; they expressed that the majority of teachers did care about theirachievement. Some teachers offered to work with students outside of class and “gaveadvice” when asked. Students reported that some teachers kept their classes interesting byadding “hands-on stuff” and “relating computer time to an assignment.” Students alsoshared that they’ve observed other students being disrespectful to teachers, especially newteachers early in the school year. Students reported that levels of respect changed over timeand improved by the end of the year.
Students have voiced frustration about the overall transformation process. In mid-Decem-ber a small group of students gathered outside the high school. Students at the rally statedthat they had gathered in support of their teachers, whom they said had been treated“unfairly” and with “disrespect” by the school’s administration. A couple of students pres-ent at the rally specifically mentioned being frustrated with teacher absences, which theyattributed to the administration’s treatment of teachers. During the rally, students alsoexpressed frustration with the lack of communication about the transformation effort andexpressed a desire to be included in decision-making processes. Students suggested that astudent assembly organized the same morning as the protest was an event that should haveoccurred much earlier.
Young Voices, a Rhode Island-based youth organizing nonprofit, has been working with agroup of students to increase and improve student engagement at the high school. Studentshave administered and analyzed a schoolwide student survey specifically examining theCFHS transformation. They hope to increase the importance of student opinion and toachieve greater influence with the administrations moving forward. Beyond the YoungVoices survey, student government was established and students voted for their class repre-sentatives.
Looking across the data, it was clear that in the absence of timely, clear communication,students were getting inaccurate or distorted information about many of the most salientcomponents of the overall reform effort, such as performance management and transfor-mation. When students were asked follow-up questions, they were frequently unable toelaborate. For example, students who reported that the administration was disrespectful ofteachers were unable to present examples. Some even admitted that they had simply heardthis stated by teachers and were repeating what they heard. Other students were stressedabout the possibility that the high school would be reconstituted. When asked what thatwould mean for their school, it became clear they did not know what “reconstituted”meant and that they had simply heard the word used in a negative way.
Community Perspectives Parents and school staff commented on the increased involvement of families as part of thetransformation effort. They noted that the school’s parent-teacher-student organization hasgreater involvement, and parents have had a more visible presence in the school as volun-teers. The administration considered increasing communication with and involvement offamilies a central part of the effort to decrease student absences. School leadership has also
43
worked to increase communication on the transformation efforts and goals to build aware-ness, garner support, counteract negative portrayals in the media, and build a common lan-guage.
Community members, including those in faith-based organizations and nonprofits, as wellas political officials, were interviewed about their perspective on the CFHS Transforma-tion. Most of the respondents expressed hope that the reforms would take hold and out-comes for students would improve, but they were worried that the damage done to theschool culture was so great it might not be able to be overcome. As one community mem-ber stated when asked how confident he was about whether CFHS would improve:
I’m not confident at all. . . . It needs the cooperation of all, and I’m not sure we havethat yet. Most importantly, the teachers and administrators have to be singing fromthe same page. If they are not, that is a problem. So I’m not confident that this isgoing to happen. I’m hopeful that it will be better, but I’m not confident.
Several interviewees specified that they wanted to keep their involvement minimal giventensions among the district, the union, and the teachers, especially because they had exist-ing good relationships with some or all sides.
Students and community members also were concerned about the media’s portrayal of thehigh school and particularly the transformation effort. Nearly all felt the vast majority ofmedia commentary focused on the negative aspects of the transformation and rarely high-lighted the progress and achievements of the community and its high school. They believethat the constant negative coverage further lowered morale.
Summary of Strategic Goal 3School climate was affected by the behavior of teachers, students, and other staff, as well aselements of the transformation plan itself. Excessive teacher absences within the first twoquarters of the school year stressed the school and classroom environment. Some teachersfound the performance management system, initiated to assess teacher effectivenessthrough evaluation, useful, but many questioned its objectivity and fairness, particularlyconnected with Domain 4, professional responsibilities, which incorporated assessments ofteacher attendance and professional behavior outside the classroom. After initial concerns,student behavior issues within the building began to improve with the hiring of restorativespecialists and the implementation of a tracking system that enabled behavior incidents tobe addressed more quickly and efficiently. Interview and survey data show that school lead-ership and teachers have divergent views about the progress of the reform and suggest thatcommunication between them needs significant attention.
44 Central Falls High School FIRST YEAR TRANSFORMATION REPORT
V. SummaryReform efforts in the first year of transformation have shown initials signs of progress, aswell as areas that require further improvement. Improving school climate seems to be thestrategic goal that garnered the least amount of positive feedback from CFHS staff.
Staff Perceptions of ProgressThere was general consistency among responses to the following survey question: “In whatareas has CFHS made the most progress this year?” Several teachers and other staff refer-enced credit recovery programs and/or Multiple Pathways programs specifically whenanswering this question.
Other areas cited as needing improvement included higher levels of graduation rates, moresuccess with mainstreaming special education students, as well as increased academic gainsthat were related to changes in instructional practices. Teachers also commented on chal-lenges related to a lack of leadership and feelings of alienation and intimidation that wereclimate-related. Other teachers responded that no progress had taken place at CFHS thisyear, while a few teacher and other staff comments characterized “other” categories that arerepresented in Figure 24.16
Asked about her perceptions of progress, the superintendent adds, “Everything needsimprovement: climate, culture, everything. It will take continuous planning, PD [profes-sional development], course offerings, teacher leaders, etc. Each step is a movement tomake transformation real to everybody.”
16 Please see Appendix G for a complete listing of all responses to this staff survey question on progress CFHShas made this year.
45
Theme Respondent Group Exemplar Quotes
Multip
le Pathw
ays Pr
ograms Teachers “The alternative program at Guide to Success for under credited, over aged students
was a great success!”
“I believe administration and some teachers have made great efforts to assist stu-dents with academic success (especially with PM School and the G2S efforts).”
Other Staff “Creating Multiple Pathways programs for students to graduate. Credit recovery pro-grams made a big difference this year.”
“Credit recovery programs allowed students who were lacking credits to catch up withtheir classmates.”
Aca
demics &
Instructiona
l Pr
actic
es
Teachers “The most progress has been made in instructional strategies, classroom assessment,and curriculum exploration.”
“Basic-level intervention in lower house classes.”
“Instructional needs for individual students were addressed.”
Other Progres
s at CFH
S Teachers “Having a plan for the future.”
“Weekly leadership cohort meetings.”
Other Staff “Accountability for all staff.”
“Improved and accurate systems of documentation.”
“PD [professional development] and community and family engagement successes.”
No Pr
ogress Teachers “There has been no progress to speak of. Morale is low, attendance is low, and scores
are stagnant.”
“I cannot say that I have seen any significant improvements.”
FIGURE 24Examples of CFHS Teacher and Staff Perceptions of Year 1 Progress
NOTE. Other staff may include leadership, guidance, school psychology, social work, the school nurse, and the school librarian.
46 Central Falls High School FIRST YEAR TRANSFORMATION REPORT
Areas in Need of Further ImprovementOn the survey, CFHS staff members were asked to respond to the following question, “Inwhat areas does CFHS need further improvement?” Responses indicate that many teachersand other staff identified student discipline as an area that is in need of further improve-ment within CFHS. Comments across respondent groups also suggest that a more systemicapproach to classroom management and student attendance is needed. Staff suggestedimplementing buildingwide policies and procedures as a solution that would address theseconcerns. Figure 25 displays a sample of these responses from the three most frequentlyreported themes.17
Seven teachers also wrote about a need for further curriculum development and curriculumalignment across content areas. One teacher reported that additional planning was neededto “solidify the math curriculum,” in particular. Other suggestions for improvements wereincreased parent engagement, designation of exemplar teachers as mentors to peers toimprove performance, and alternative placements for special needs and ESL students.
Theme Respondent Group Exemplar Quotes
Discipline &
Beh
avior M
anag
emen
t
Teachers “We need discipline policies that address the attendance and tardiness problems thatcreate the greatest barrier to student achievement.”
“A functional behavior management system that supports the teachers and estab-lishes norms and expectations with the students that communicate and support success.”
Other Staff “There was absolutely no discipline toward students especially concerning hats,phones, iPods, cutting class, acting out in class, coming in tardy. These issues preventall students from learning, and we need a policy to enforce consistent rules.”
Commun
ication Teachers “Communication between faculty and administration needs to be strengthened.”
Other Staff “The leadership team does not communicate their vision to the faculty, so no oneunderstands where we are going, and it makes it difficult to help the students achievetheir goals.”
Clim
ate & Culture
Teachers “I believe we need to improve the school culture specifically among the faculty. Manyfaculty members have a negative attitude toward students and administration andeven their fellow teachers.”
“The consistent turnover in leadership has completely handcuffed the teachers when itcomes to being effective. Teachers need support in every aspect of their jobs, and ithas not been given either by local admin or central office.”
Other Staff “We need teachers to adopt a commitment to high standards.”
FIGURE 25Examples of CFHS Teacher and Staff Perceptions of Further Improvements Needed
NOTE. Other staff may include leadership, guidance, school psychologist, social workers, the school nurse, and the school librarian.
47
Future of CFHSIndividuals who commented on the chance for the transformation’s success had mixedopinions. While some stakeholders were skeptical about meeting graduation rate goals,individuals directly involved in the Multiple Pathways Options expressed high confidencein reaching their goals. Similarly, individuals directly involved in math instruction alsoexpressed high confidence in increasing performance.
However, many teachers expressed little or no confidence that the climate and culture ofthe school could be transformed. They mentioned several obstacles facing improvement,including a perceived lack of power by the school leadership team to make changes due tobureaucratic obstacles. There was a perceived lack of consistency amplified by the need forfaculty and staff to address too many problems simultaneously. As one teacher noted:
[T]hey have to entertain so many customers right now that I think they’re missingsome valuable opportunities to develop the kind of culture among teachers that cantruly make teachers feel that they’re a part of something great.
Several teachers and staff agreed that the transformation should be a shared effort. Theynoted that more faculty members should be involved in the process and that the leadershipteam should make a concerted effort to include them. More specifically, they noted that toimprove the climate and culture there needed to be more consistency and transparency.
17 Please see Appendix H for a complete listing of all responses to this staff survey question on further improve-ments needed at CFHS.
48 Central Falls High School FIRST YEAR TRANSFORMATION REPORT
VI. RecommendationsThe first year of transformation at CFHS has been a challenging one for everyoneinvolved. The literature on school turnaround is clear: transformation is hard work. Below,recommendations are offered for the CFHS school community to help address some of thechallenges of transformation.
1. Actively engage teachers in reform planning, leadership, and implementation. Designation as a persistently lowest-achieving school comes with a host of requirements:the hiring of new leadership, the evaluation of all staff, the creation of action plans andbudgets, and the development of new programs and interventions. In order to success-fully address these requirements, CFHS teachers, staff, and leadership must worktogether. This is an enormous challenge, as survey and interview data suggest thatalthough circumstances have improved since late 2010, the CFHS community is stillfractured. The teacher interview data suggests that school leadership should considernew approaches to soliciting teacher feedback, specifically to improve the quality andtimeliness of teacher input and to increase participation. Creating effective structures,processes, and policies that include teachers in decision making will strengthen a culturethat embraces shared responsibility for student learning.
Building this sense of shared responsibility needs to be an ongoing process. We recom-mend better utilization of existing resources, such as greater input from the PerformanceManagement “Bench” and teachers, to support these efforts. The “Bench,” for example,can help identify potential teacher leaders to improve the following areas: developmentopportunities; the quality, acceptance, and use of teacher supports; and the effectivenessof communication with teachers.
2. Develop regular opportunities to discuss/address the progress and challenges of the transformation effort and its distinct initiatives with staff,students, and the wider school community.An ongoing, open dialogue among leadership, staff, and students is critical to generatingbroader ownership of the overall transformation effort. Publicly sharing up-to-dateschool data will reinforce the goals and vision of the transformation efforts. Group data,by team and/or grade level for example, should be collected and shared in addition toschoolwide data. Presenting these data will provide reflective opportunities for all stake-holders to recognize and celebrate successes. This will also provide an opportunity tocollectively address challenges to continued academic improvements. Widespread report-ing of progress on a shorter timeframe will increase the opportunities for collaborationand the responsiveness of the reform effort to emerging needs. Progress monitoringinvolving the school community will also improve staff understanding of the transfor-mation effort, provide an opportunity to disseminate a consistent message schoolwide,and maintain an awareness of the reform efforts.
49
3. Comprehensively examine mathematics classroom data in conjunctionwith student performance on NECAP testing. According to school records, approximately 80 percent of students passed their mathe-matics courses each quarter in 2010-2011. These classroom data demonstrate an incon-sistency with NECAP data, which show less than ten percent of tested students reachingproficiency in math. This inconsistency suggests a need to examine what gaps exist inmathematics courses and why. Key focus areas may include which mathematics classesstudents are taking. Three questions may help illustrate this point:
1) Are students taking key subjects including algebra I, algebra II, and geometry priorto NECAP testing?
2) Is mathematics content being consistently delivered across classes and teachers?
3) Are grading practices consistent across classes and teachers?
The staff survey shows that 65 percent of staff overall agree or strongly agree that teach-ers at CFHS are engaged in systematic analysis of their teaching practices. Staff shouldbuild on these efforts – drawing on formative, teacher-developed assessments andstatewide tests – to guide mathematics instruction. The initial implementation of thenew mathematics curriculum in the 2011-2012 school year provides CFHS the oppor-tunity to examine the sequencing and delivery of appropriate and rigorous mathematicscontent across grade levels.
4. Maintain investments in Multiple Pathways Programs, the AcademicEnhancement Center, and behavior management and collaborate toimprove the consistency and effectiveness of advisories. CFHS students face many obstacles, but with flexibility and support, they can succeedin school. One of the highlights of the transformation effort was the Multiple PathwaysPrograms, which offered students alternate ways to earn credit and re-engage in school.The Academic Enhancement Center also continues to be a well-used resource. Whilebehavior issues challenged the transformation effort from the onset of the school year,investments in restorative/behavior specialists and a behavior monitoring system havebegun to address the problem. Documenting and communicating behavior managementprotocols and expectations is essential to building on these initial successes. Continuedmonitoring and investment in these strategies is crucial to sustaining the pace ofimprovement.
Advisories, however, did not live up to their promise during the first transformation yearfor many teacher and students. Teachers, leadership, and students need to work togetherto improve the utility of advisories. Specific recommendations supported by our datacollection include developing clear expectations for the use of advisories, providing addi-tional supports for teachers, and drawing on the experience of those who report advi-sories as useful.
50 Central Falls High School FIRST YEAR TRANSFORMATION REPORT
5. Develop clear expectations for the use of common planning time and a widely understood rationale for it as a key instructional support. One of the most important steps to improve supports for teachers is the development ofa set of clearer expectations for the use of common planning time. Currently, the qualityand acceptance of common planning time varies dramatically. Teachers report that effec-tive use of common planning time is the exception, not the norm. We recommendselecting, training, and supporting team leaders/facilitators for common planning time.This can provide additional quality control required to increase the utility and supportof common planning time. Ensuring that common planning time is effective is centralto immediate improvement goals and establishing a positive staff culture focused on stu-dent achievement. This should be a top priority.
6. Establish the performance management process as a key driver of instruc-tional support and individual growth.The performance management system does have a dual purpose: for the majority ofteachers it is intended to be a support for improving practice, but it is also supposed toidentify teachers who have not made progress. Our data suggests that teachers internal-ized the latter, punitive purpose, but not the former, more supportive aspect of the per-formance management system. Teachers need to hear stronger messages about thebenefits of the process. The Bench should play an active role in consistent communica-tion of the goals of the performance management system by highlighting teachers whohave benefited from the process. The Bench should also consider improvements that willmake the process more supportive to teachers, such as expanding the Bench to addressall content areas; matching Bench members’ content expertise with the teachers’ contentareas; and providing opportunities for teachers to observe strong instructional practices.
Leadership must also be transparent about the criteria they use to assess the professionalresponsibilities domain. Our data demonstrated that this portion of the review was par-ticularly contentious. It must be clear that this domain, and therefore the performancemanagement process at large, is understood as a fair, objective process, even when itresults in negative consequences for some teachers. Without this assurance, teachers willcontinue to see the process as a “gotcha” scheme and question the supports the processcan provide to the majority of staff. The full implementation of a robust performancemanagement system requires substantial integration between teachers’ instructionalimprovement needs and the supports and professional development they receive. Tyingthe performance management system more closely to professional development deliveryand examining how common planning time is used will simultaneously increase teachersupport for both processes.
51
ConclusionThis report has utilized quantitative and qualitative research methods to highlight the suc-cesses and challenges faced by Central Falls High School in its first year of TransformationPlan implementation. One of the greatest successes of the reform effort centers on Goal 1,the multifaceted approach to increasing the graduation rates and decreasing dropout rates.The school rapidly developed and implemented multiple programs to target the needs ofstruggling students. Both tutoring and alternative graduation pathways are now available tostudents. Related to Goal 2, CFHS has also begun to make several fundamental improve-ments in math by implementing a math intervention program and developing a mathe-matics curriculum. This should provide a solid foundation for improving proficiency levelsas outlined in the Transformation Plan.
The biggest challenge to Transformation efforts is Goal 3, improving climate and culture.Tensions between leadership and staff at the onset of the transformation process have per-sisted throughout the first year of implementation. As such, improving the climate and cul-ture of the school has proven to be the most difficult of the three transformation goals.Teacher absenteeism, ineffective communication between leadership and staff, and a per-ceived lack of authentic engagement have contributed to the struggle to develop a positiveschool culture at Central Falls High School. It should be noted that school culture can bedifficult to change because it is set in deep-rooted beliefs and practices; thus, it is not sur-prising that after just one year challenges continue to exist.
Despite these challenges, encouraging signs for improving culture are evident for the nearfuture of CFHS. Stakeholders agree that the culture needs to change. The challenge fornext year will be to engage everyone – teachers, students, administrators, and the commu-nity – in changing the culture. Focusing on building relationships, engagement, and sharedaccountability will be critical during the 2011-2012 school year and is a key step towardbuilding a school community with the positive culture necessary to break the persistentcycle of low achievement at Central Falls High School.


53
APPENDIX A

54 Central Falls High School FIRST YEAR TRANSFORMATION REPORT

55

56 Central Falls High School FIRST YEAR TRANSFORMATION REPORT

57

58 Central Falls High School FIRST YEAR TRANSFORMATION REPORT

59

60 Central Falls High School FIRST YEAR TRANSFORMATION REPORT

61

62 Central Falls High School FIRST YEAR TRANSFORMATION REPORT

63

64 Central Falls High School FIRST YEAR TRANSFORMATION REPORT

65

66 Central Falls High School FIRST YEAR TRANSFORMATION REPORT

67

68 Central Falls High School FIRST YEAR TRANSFORMATION REPORT
69
APPENDIX BCentral Falls High School Staff Survey Protocol
70 Central Falls High School FIRST YEAR TRANSFORMATION REPORT
71
72 Central Falls High School FIRST YEAR TRANSFORMATION REPORT
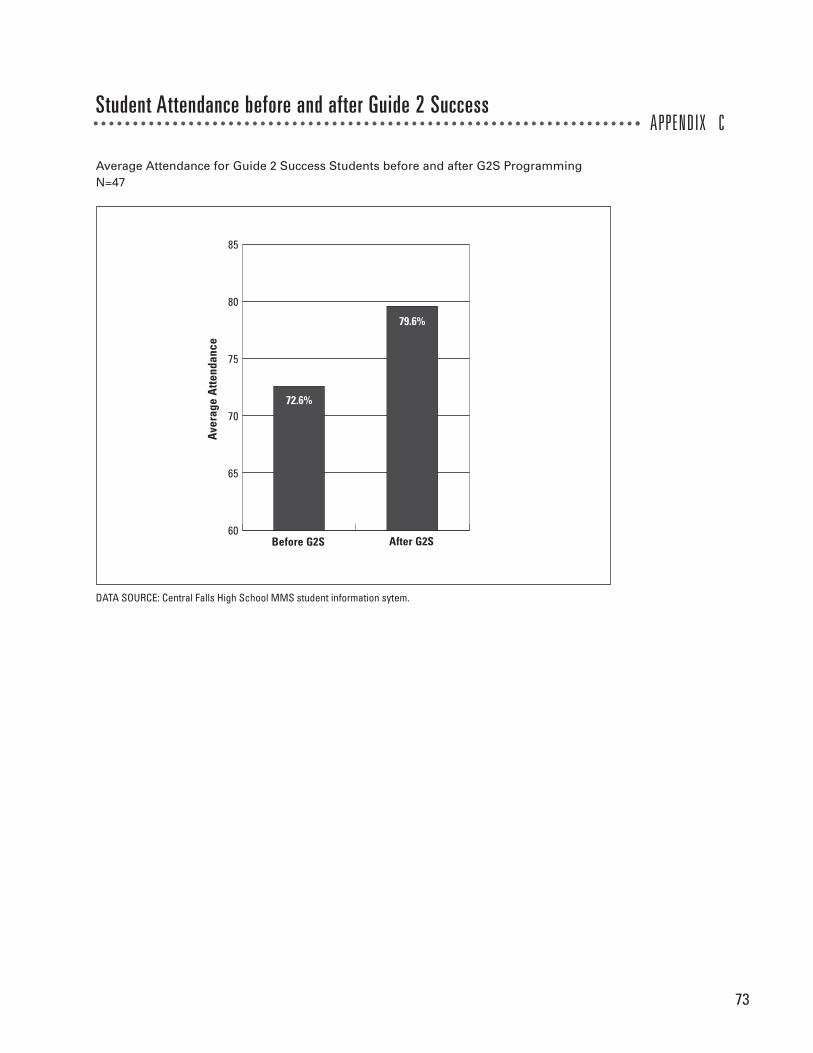
73
APPENDIX CStudent Attendance before and after Guide 2 Success
85
80
75
70
65
60After G2SBefore G2S
Averag
e Atte
ndan
ce
Average Attendance for Guide 2 Success Students before and after G2S ProgrammingN=47
72.6%
79.6%
DATA SOURCE: Central Falls High School MMS student information sytem.
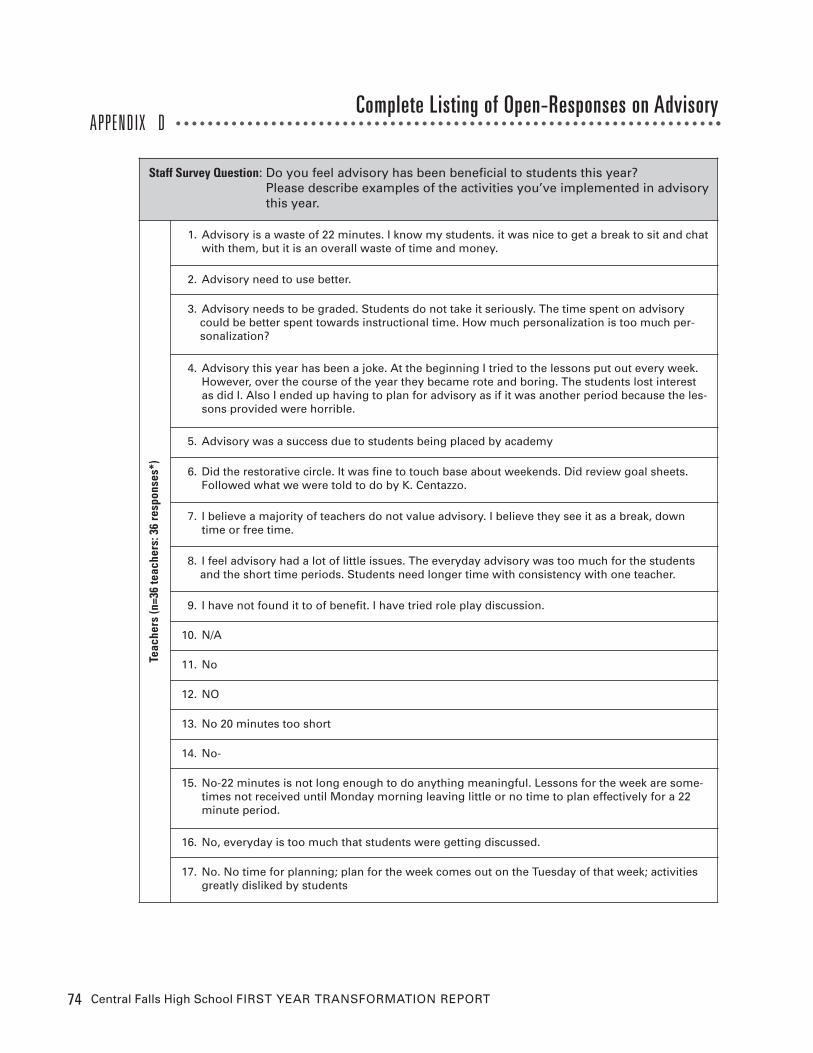
74 Central Falls High School FIRST YEAR TRANSFORMATION REPORT
APPENDIX DComplete Listing of Open-Responses on Advisory
Staff Survey Question: Do you feel advisory has been beneficial to students this year? Please describe examples of the activities you’ve implemented in advisorythis year.
Teac
hers (n
=36 teac
hers: 3
6 resp
onse
s*)
1. Advisory is a waste of 22 minutes. I know my students. it was nice to get a break to sit and chatwith them, but it is an overall waste of time and money.
2. Advisory need to use better.
3. Advisory needs to be graded. Students do not take it seriously. The time spent on advisorycould be better spent towards instructional time. How much personalization is too much per-sonalization?
4. Advisory this year has been a joke. At the beginning I tried to the lessons put out every week.However, over the course of the year they became rote and boring. The students lost interestas did I. Also I ended up having to plan for advisory as if it was another period because the les-sons provided were horrible.
5. Advisory was a success due to students being placed by academy
6. Did the restorative circle. It was fine to touch base about weekends. Did review goal sheets.Followed what we were told to do by K. Centazzo.
7. I believe a majority of teachers do not value advisory. I believe they see it as a break, downtime or free time.
8. I feel advisory had a lot of little issues. The everyday advisory was too much for the studentsand the short time periods. Students need longer time with consistency with one teacher.
9. I have not found it to of benefit. I have tried role play discussion.
10. N/A
11. No
12. NO
13. No 20 minutes too short
14. No-
15. No-22 minutes is not long enough to do anything meaningful. Lessons for the week are some-times not received until Monday morning leaving little or no time to plan effectively for a 22minute period.
16. No, everyday is too much that students were getting discussed.
17. No. No time for planning; plan for the week comes out on the Tuesday of that week; activitiesgreatly disliked by students
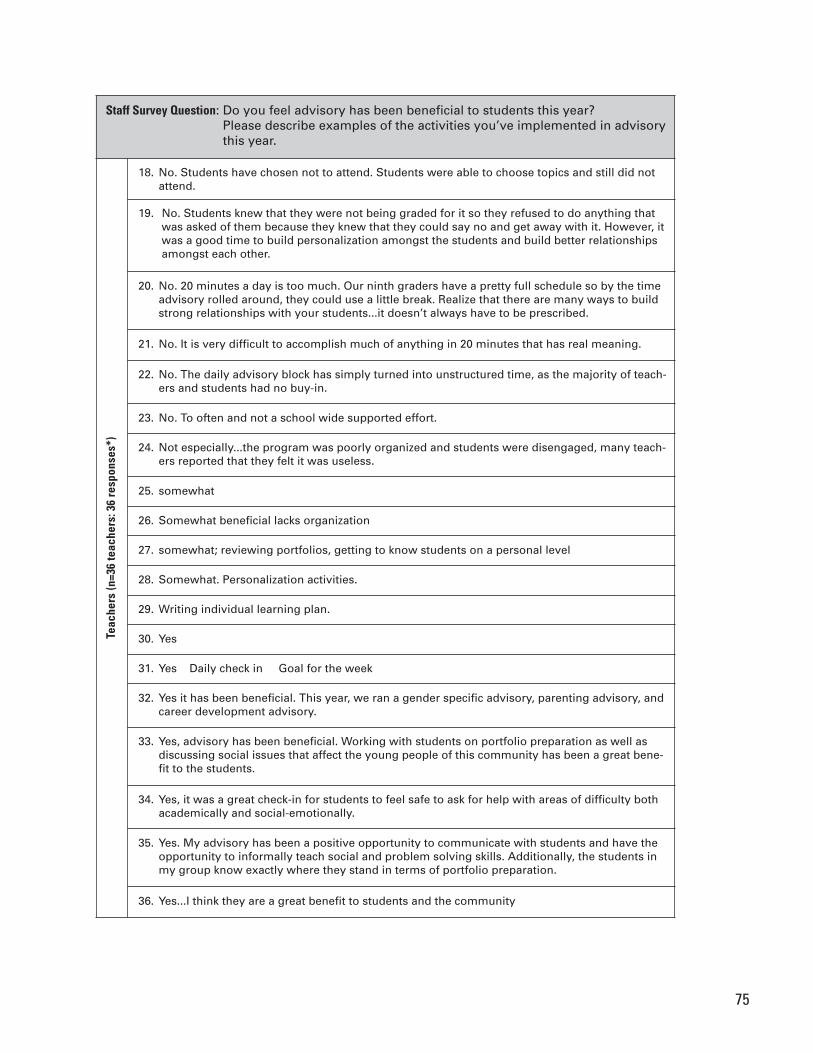
75
Staff Survey Question: Do you feel advisory has been beneficial to students this year? Please describe examples of the activities you’ve implemented in advisorythis year.
Teac
hers (n
=36 teac
hers: 3
6 resp
onse
s*)
18. No. Students have chosen not to attend. Students were able to choose topics and still did notattend.
19. No. Students knew that they were not being graded for it so they refused to do anything thatwas asked of them because they knew that they could say no and get away with it. However, itwas a good time to build personalization amongst the students and build better relationshipsamongst each other.
20. No. 20 minutes a day is too much. Our ninth graders have a pretty full schedule so by the timeadvisory rolled around, they could use a little break. Realize that there are many ways to buildstrong relationships with your students...it doesn’t always have to be prescribed.
21. No. It is very difficult to accomplish much of anything in 20 minutes that has real meaning.
22. No. The daily advisory block has simply turned into unstructured time, as the majority of teach-ers and students had no buy-in.
23. No. To often and not a school wide supported effort.
24. Not especially...the program was poorly organized and students were disengaged, many teach-ers reported that they felt it was useless.
25. somewhat
26. Somewhat beneficial lacks organization
27. somewhat; reviewing portfolios, getting to know students on a personal level
28. Somewhat. Personalization activities.
29. Writing individual learning plan.
30. Yes
31. Yes Daily check in Goal for the week
32. Yes it has been beneficial. This year, we ran a gender specific advisory, parenting advisory, andcareer development advisory.
33. Yes, advisory has been beneficial. Working with students on portfolio preparation as well asdiscussing social issues that affect the young people of this community has been a great bene-fit to the students.
34. Yes, it was a great check-in for students to feel safe to ask for help with areas of difficulty bothacademically and social-emotionally.
35. Yes. My advisory has been a positive opportunity to communicate with students and have theopportunity to informally teach social and problem solving skills. Additionally, the students inmy group know exactly where they stand in terms of portfolio preparation.
36. Yes...I think they are a great benefit to students and the community
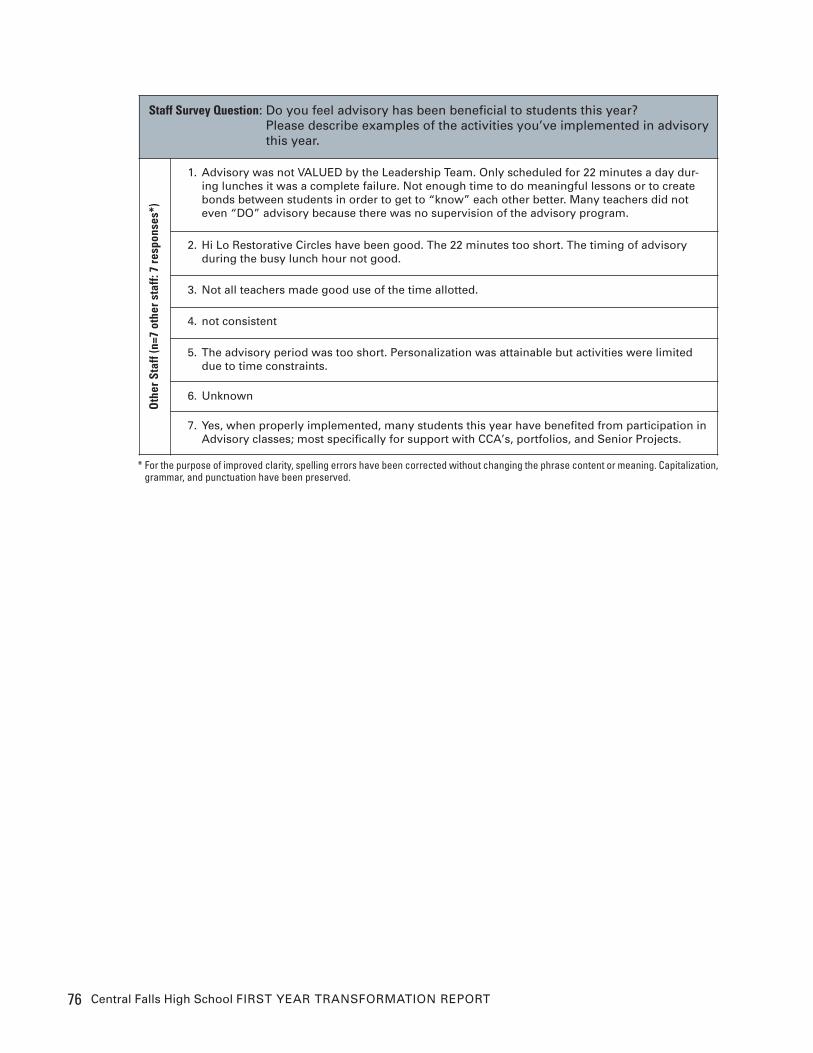
76 Central Falls High School FIRST YEAR TRANSFORMATION REPORT
Staff Survey Question: Do you feel advisory has been beneficial to students this year? Please describe examples of the activities you’ve implemented in advisorythis year.
Other Staff (n=7
other staff: 7 re
spon
ses*
)
1. Advisory was not VALUED by the Leadership Team. Only scheduled for 22 minutes a day dur-ing lunches it was a complete failure. Not enough time to do meaningful lessons or to createbonds between students in order to get to “know” each other better. Many teachers did noteven “DO” advisory because there was no supervision of the advisory program.
2. Hi Lo Restorative Circles have been good. The 22 minutes too short. The timing of advisoryduring the busy lunch hour not good.
3. Not all teachers made good use of the time allotted.
4. not consistent
5. The advisory period was too short. Personalization was attainable but activities were limiteddue to time constraints.
6. Unknown
7. Yes, when properly implemented, many students this year have benefited from participation inAdvisory classes; most specifically for support with CCA’s, portfolios, and Senior Projects.
* For the purpose of improved clarity, spelling errors have been corrected without changing the phrase content or meaning. Capitalization,grammar, and punctuation have been preserved.
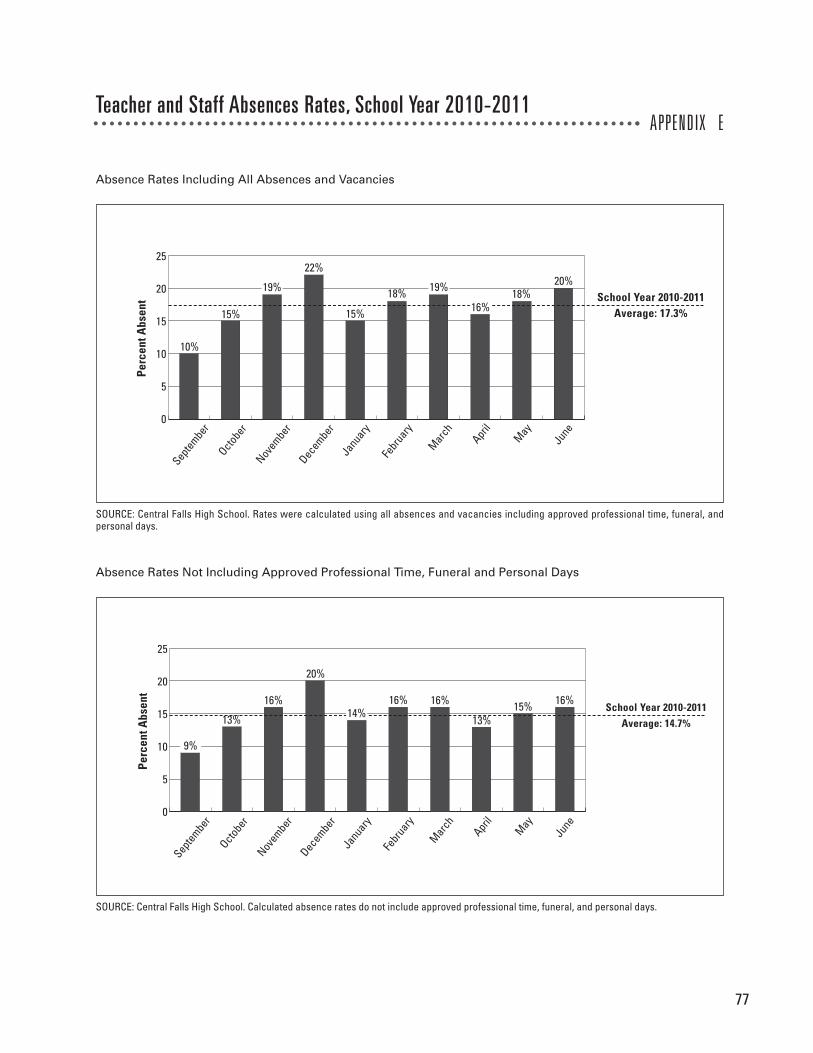
77
APPENDIX ETeacher and Staff Absences Rates, School Year 2010-2011
Absence Rates Including All Absences and Vacancies
SOURCE: Central Falls High School. Rates were calculated using all absences and vacancies including approved professional time, funeral, andpersonal days.
25
20
15
10
5
0
Septe
mber
Octob
erNov
embe
rDe
cembe
rJa
nuar
y
Febr
uary
Mar
ch
April
May
June
School Year 2010-2011Average: 17.3%
Percen
t Abs
ent
Absence Rates Not Including Approved Professional Time, Funeral and Personal Days
SOURCE: Central Falls High School. Calculated absence rates do not include approved professional time, funeral, and personal days.
25
20
15
10
5
0
Septe
mber
Octob
erNov
embe
rDe
cembe
rJa
nuar
y
Febr
uary
Mar
ch
April
May
June
School Year 2010-2011Average: 14.7%
Percen
t Abs
ent
20%18%
16%
19%18%
15%
22%
19%
15%
10%
16%15%13%
16%16%14%
20%
16%
13%
9%
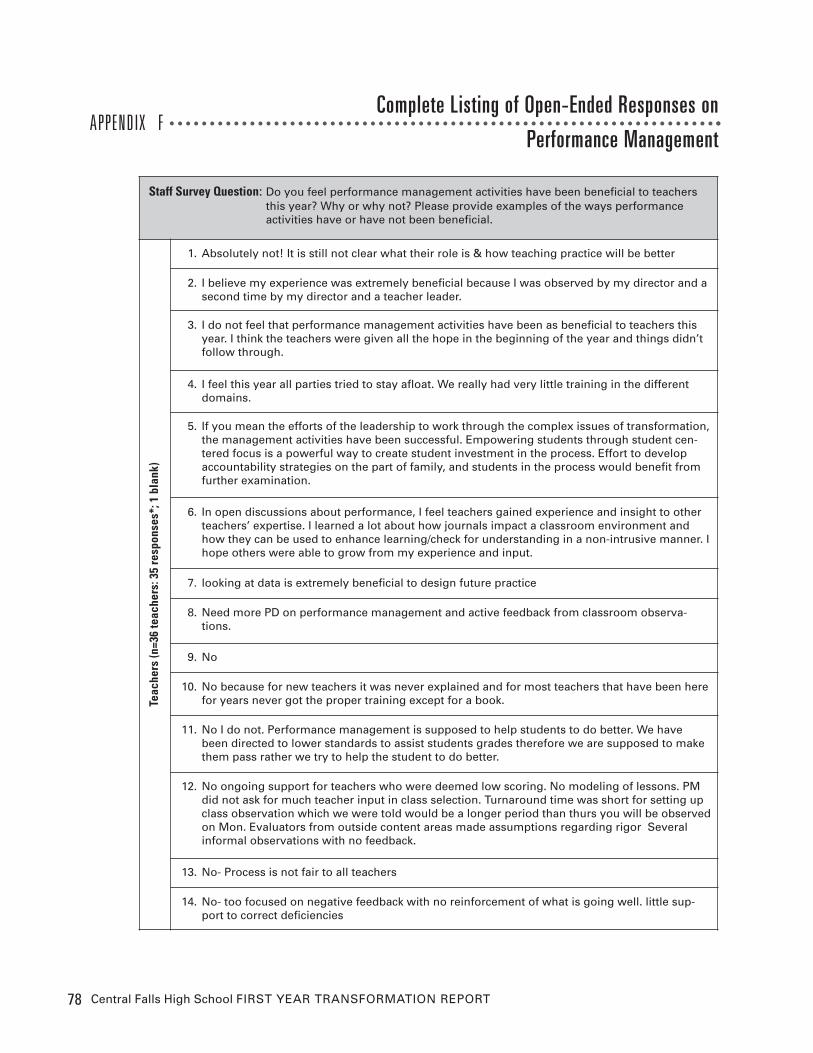
78 Central Falls High School FIRST YEAR TRANSFORMATION REPORT
APPENDIX FComplete Listing of Open-Ended Responses on
Performance Management
Staff Survey Question: Do you feel performance management activities have been beneficial to teachersthis year? Why or why not? Please provide examples of the ways performanceactivities have or have not been beneficial.
Teac
hers (n
=36 teac
hers: 3
5 resp
onse
s*; 1
blank
)
1. Absolutely not! It is still not clear what their role is & how teaching practice will be better
2. I believe my experience was extremely beneficial because I was observed by my director and asecond time by my director and a teacher leader.
3. I do not feel that performance management activities have been as beneficial to teachers thisyear. I think the teachers were given all the hope in the beginning of the year and things didn’tfollow through.
4. I feel this year all parties tried to stay afloat. We really had very little training in the differentdomains.
5. If you mean the efforts of the leadership to work through the complex issues of transformation,the management activities have been successful. Empowering students through student cen-tered focus is a powerful way to create student investment in the process. Effort to developaccountability strategies on the part of family, and students in the process would benefit fromfurther examination.
6. In open discussions about performance, I feel teachers gained experience and insight to otherteachers’ expertise. I learned a lot about how journals impact a classroom environment andhow they can be used to enhance learning/check for understanding in a non-intrusive manner. Ihope others were able to grow from my experience and input.
7. looking at data is extremely beneficial to design future practice
8. Need more PD on performance management and active feedback from classroom observa-tions.
9. No
10. No because for new teachers it was never explained and for most teachers that have been herefor years never got the proper training except for a book.
11. No I do not. Performance management is supposed to help students to do better. We havebeen directed to lower standards to assist students grades therefore we are supposed to makethem pass rather we try to help the student to do better.
12. No ongoing support for teachers who were deemed low scoring. No modeling of lessons. PMdid not ask for much teacher input in class selection. Turnaround time was short for setting upclass observation which we were told would be a longer period than thurs you will be observedon Mon. Evaluators from outside content areas made assumptions regarding rigor Severalinformal observations with no feedback.
13. No- Process is not fair to all teachers
14. No- too focused on negative feedback with no reinforcement of what is going well. little sup-port to correct deficiencies
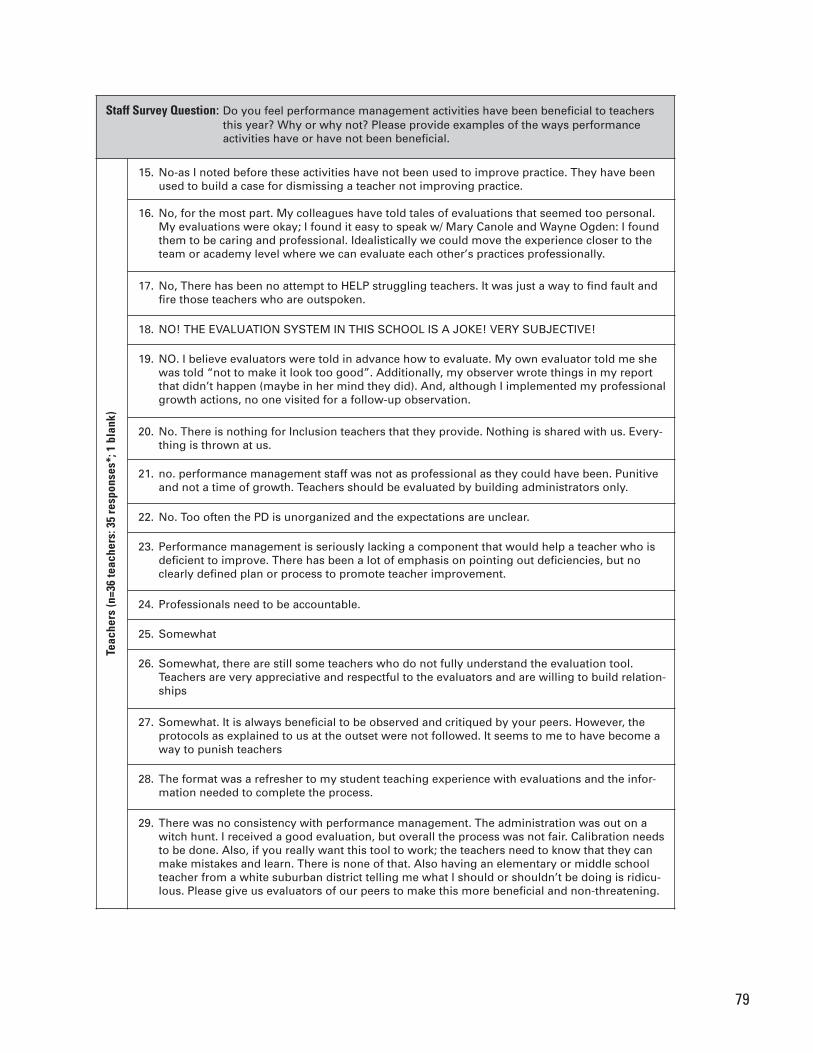
79
Staff Survey Question: Do you feel performance management activities have been beneficial to teachersthis year? Why or why not? Please provide examples of the ways performanceactivities have or have not been beneficial.
Teac
hers (n
=36 teac
hers: 3
5 resp
onse
s*; 1
blank
)
15. No-as I noted before these activities have not been used to improve practice. They have beenused to build a case for dismissing a teacher not improving practice.
16. No, for the most part. My colleagues have told tales of evaluations that seemed too personal.My evaluations were okay; I found it easy to speak w/ Mary Canole and Wayne Ogden: I foundthem to be caring and professional. Idealistically we could move the experience closer to theteam or academy level where we can evaluate each other’s practices professionally.
17. No, There has been no attempt to HELP struggling teachers. It was just a way to find fault andfire those teachers who are outspoken.
18. NO! THE EVALUATION SYSTEM IN THIS SCHOOL IS A JOKE! VERY SUBJECTIVE!
19. NO. I believe evaluators were told in advance how to evaluate. My own evaluator told me shewas told “not to make it look too good”. Additionally, my observer wrote things in my reportthat didn’t happen (maybe in her mind they did). And, although I implemented my professionalgrowth actions, no one visited for a follow-up observation.
20. No. There is nothing for Inclusion teachers that they provide. Nothing is shared with us. Every-thing is thrown at us.
21. no. performance management staff was not as professional as they could have been. Punitiveand not a time of growth. Teachers should be evaluated by building administrators only.
22. No. Too often the PD is unorganized and the expectations are unclear.
23. Performance management is seriously lacking a component that would help a teacher who isdeficient to improve. There has been a lot of emphasis on pointing out deficiencies, but noclearly defined plan or process to promote teacher improvement.
24. Professionals need to be accountable.
25. Somewhat
26. Somewhat, there are still some teachers who do not fully understand the evaluation tool.Teachers are very appreciative and respectful to the evaluators and are willing to build relation-ships
27. Somewhat. It is always beneficial to be observed and critiqued by your peers. However, theprotocols as explained to us at the outset were not followed. It seems to me to have become away to punish teachers
28. The format was a refresher to my student teaching experience with evaluations and the infor-mation needed to complete the process.
29. There was no consistency with performance management. The administration was out on awitch hunt. I received a good evaluation, but overall the process was not fair. Calibration needsto be done. Also, if you really want this tool to work; the teachers need to know that they canmake mistakes and learn. There is none of that. Also having an elementary or middle schoolteacher from a white suburban district telling me what I should or shouldn’t be doing is ridicu-lous. Please give us evaluators of our peers to make this more beneficial and non-threatening.
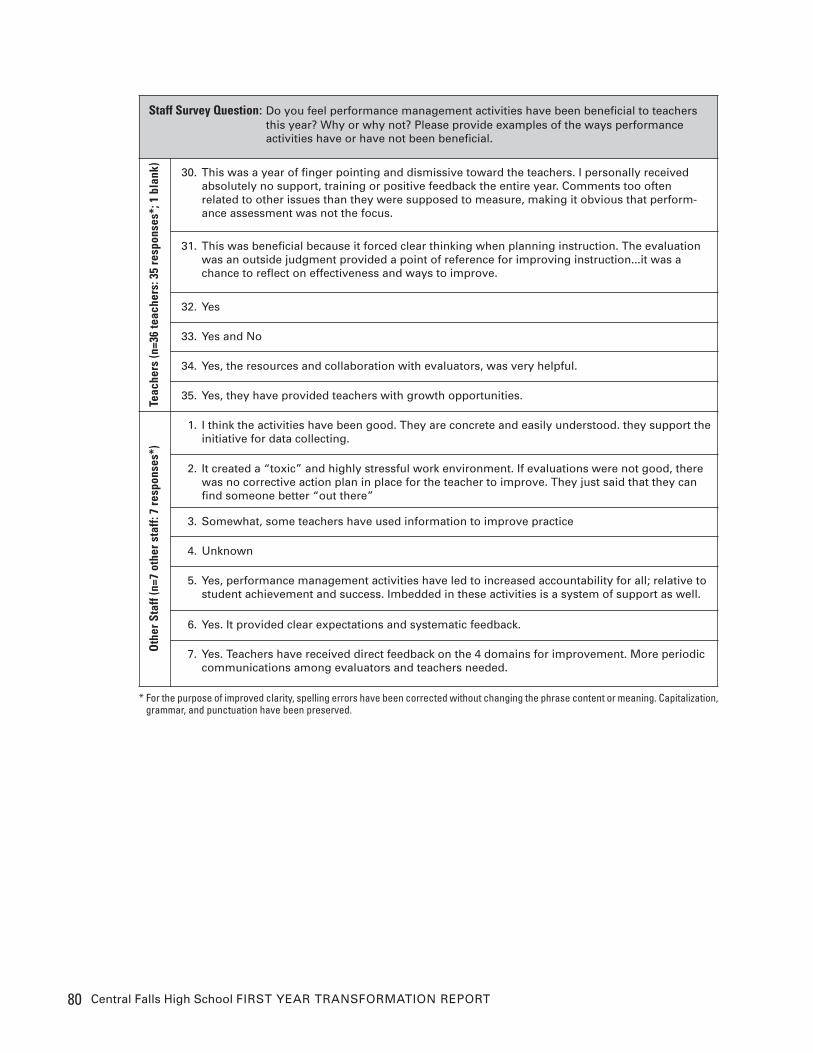
80 Central Falls High School FIRST YEAR TRANSFORMATION REPORT
Staff Survey Question: Do you feel performance management activities have been beneficial to teachersthis year? Why or why not? Please provide examples of the ways performanceactivities have or have not been beneficial.
Teac
hers (n
=36 teac
hers: 3
5 resp
onse
s*; 1
blank
)
30. This was a year of finger pointing and dismissive toward the teachers. I personally receivedabsolutely no support, training or positive feedback the entire year. Comments too oftenrelated to other issues than they were supposed to measure, making it obvious that perform-ance assessment was not the focus.
31. This was beneficial because it forced clear thinking when planning instruction. The evaluationwas an outside judgment provided a point of reference for improving instruction...it was achance to reflect on effectiveness and ways to improve.
32. Yes
33. Yes and No
34. Yes, the resources and collaboration with evaluators, was very helpful.
35. Yes, they have provided teachers with growth opportunities.
Other Staff (n=7
other staff: 7 re
spon
ses*
)
1. I think the activities have been good. They are concrete and easily understood. they support theinitiative for data collecting.
2. It created a “toxic” and highly stressful work environment. If evaluations were not good, therewas no corrective action plan in place for the teacher to improve. They just said that they canfind someone better “out there”
3. Somewhat, some teachers have used information to improve practice
4. Unknown
5. Yes, performance management activities have led to increased accountability for all; relative tostudent achievement and success. Imbedded in these activities is a system of support as well.
6. Yes. It provided clear expectations and systematic feedback.
7. Yes. Teachers have received direct feedback on the 4 domains for improvement. More periodiccommunications among evaluators and teachers needed.
* For the purpose of improved clarity, spelling errors have been corrected without changing the phrase content or meaning. Capitalization,grammar, and punctuation have been preserved.
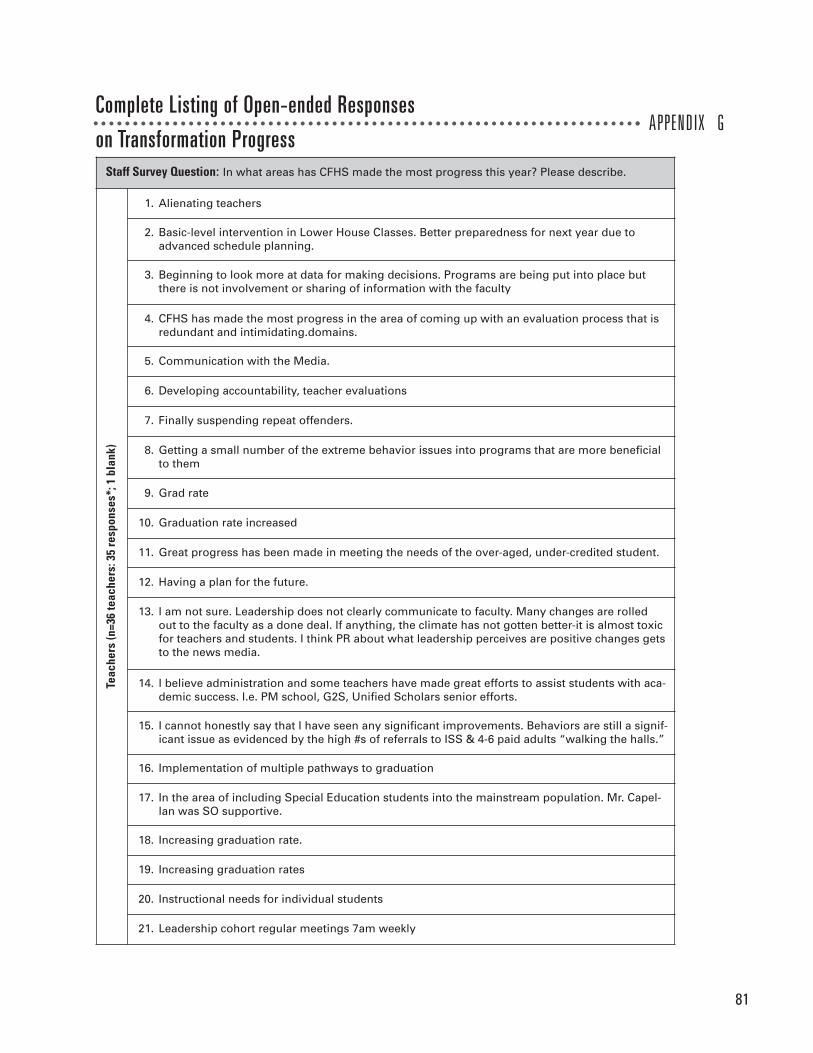
81
APPENDIX GComplete Listing of Open-ended Responses
on Transformation ProgressStaff Survey Question: In what areas has CFHS made the most progress this year? Please describe.
Teac
hers (n
=36 teac
hers: 3
5 resp
onse
s*; 1
blank
)
1. Alienating teachers
2. Basic-level intervention in Lower House Classes. Better preparedness for next year due toadvanced schedule planning.
3. Beginning to look more at data for making decisions. Programs are being put into place butthere is not involvement or sharing of information with the faculty
4. CFHS has made the most progress in the area of coming up with an evaluation process that isredundant and intimidating.domains.
5. Communication with the Media.
6. Developing accountability, teacher evaluations
7. Finally suspending repeat offenders.
8. Getting a small number of the extreme behavior issues into programs that are more beneficialto them
9. Grad rate
10. Graduation rate increased
11. Great progress has been made in meeting the needs of the over-aged, under-credited student.
12. Having a plan for the future.
13. I am not sure. Leadership does not clearly communicate to faculty. Many changes are rolledout to the faculty as a done deal. If anything, the climate has not gotten better-it is almost toxicfor teachers and students. I think PR about what leadership perceives are positive changes getsto the news media.
14. I believe administration and some teachers have made great efforts to assist students with aca-demic success. I.e. PM school, G2S, Unified Scholars senior efforts.
15. I cannot honestly say that I have seen any significant improvements. Behaviors are still a signif-icant issue as evidenced by the high #s of referrals to ISS & 4-6 paid adults “walking the halls.”
16. Implementation of multiple pathways to graduation
17. In the area of including Special Education students into the mainstream population. Mr. Capel-lan was SO supportive.
18. Increasing graduation rate.
19. Increasing graduation rates
20. Instructional needs for individual students
21. Leadership cohort regular meetings 7am weekly
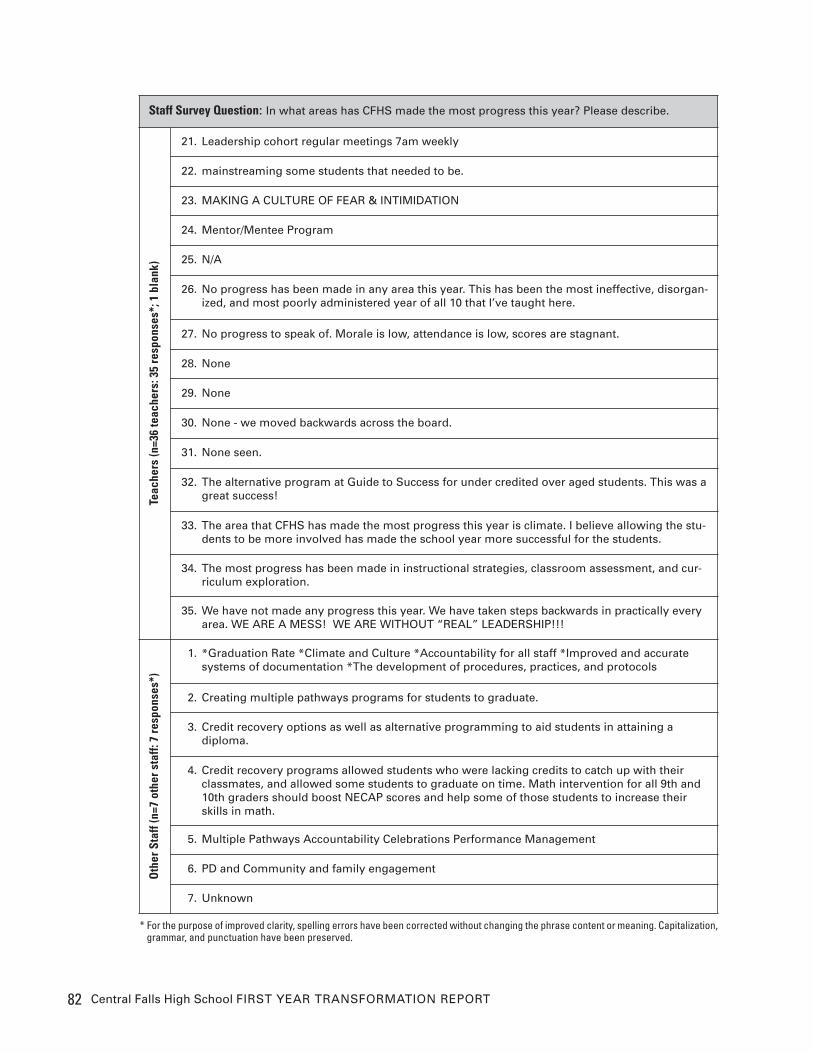
82 Central Falls High School FIRST YEAR TRANSFORMATION REPORT
Staff Survey Question: In what areas has CFHS made the most progress this year? Please describe.
Teac
hers (n
=36 teac
hers: 3
5 resp
onse
s*; 1
blank
)21. Leadership cohort regular meetings 7am weekly
22. mainstreaming some students that needed to be.
23. MAKING A CULTURE OF FEAR & INTIMIDATION
24. Mentor/Mentee Program
25. N/A
26. No progress has been made in any area this year. This has been the most ineffective, disorgan-ized, and most poorly administered year of all 10 that I’ve taught here.
27. No progress to speak of. Morale is low, attendance is low, scores are stagnant.
28. None
29. None
30. None - we moved backwards across the board.
31. None seen.
32. The alternative program at Guide to Success for under credited over aged students. This was agreat success!
33. The area that CFHS has made the most progress this year is climate. I believe allowing the stu-dents to be more involved has made the school year more successful for the students.
34. The most progress has been made in instructional strategies, classroom assessment, and cur-riculum exploration.
35. We have not made any progress this year. We have taken steps backwards in practically everyarea. WE ARE A MESS! WE ARE WITHOUT “REAL” LEADERSHIP!!!
Other Staff (n=7
other staff: 7 re
spon
ses*
)
1. *Graduation Rate *Climate and Culture *Accountability for all staff *Improved and accuratesystems of documentation *The development of procedures, practices, and protocols
2. Creating multiple pathways programs for students to graduate.
3. Credit recovery options as well as alternative programming to aid students in attaining adiploma.
4. Credit recovery programs allowed students who were lacking credits to catch up with theirclassmates, and allowed some students to graduate on time. Math intervention for all 9th and10th graders should boost NECAP scores and help some of those students to increase theirskills in math.
5. Multiple Pathways Accountability Celebrations Performance Management
6. PD and Community and family engagement
7. Unknown
* For the purpose of improved clarity, spelling errors have been corrected without changing the phrase content or meaning. Capitalization,grammar, and punctuation have been preserved.
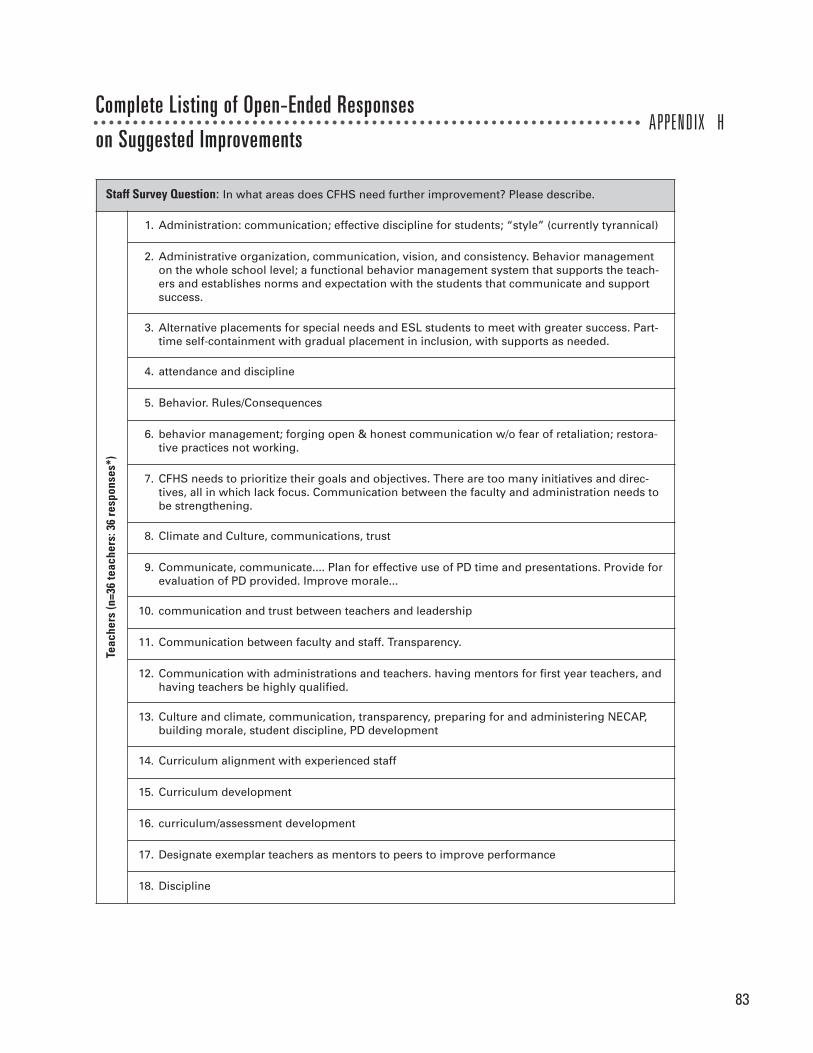
83
APPENDIX HComplete Listing of Open-Ended Responses
on Suggested Improvements
Staff Survey Question: In what areas does CFHS need further improvement? Please describe.
Teac
hers (n
=36 teac
hers: 3
6 resp
onse
s*)
1. Administration: communication; effective discipline for students; “style” (currently tyrannical)
2. Administrative organization, communication, vision, and consistency. Behavior managementon the whole school level; a functional behavior management system that supports the teach-ers and establishes norms and expectation with the students that communicate and supportsuccess.
3. Alternative placements for special needs and ESL students to meet with greater success. Part-time self-containment with gradual placement in inclusion, with supports as needed.
4. attendance and discipline
5. Behavior. Rules/Consequences
6. behavior management; forging open & honest communication w/o fear of retaliation; restora-tive practices not working.
7. CFHS needs to prioritize their goals and objectives. There are too many initiatives and direc-tives, all in which lack focus. Communication between the faculty and administration needs tobe strengthening.
8. Climate and Culture, communications, trust
9. Communicate, communicate.... Plan for effective use of PD time and presentations. Provide forevaluation of PD provided. Improve morale...
10. communication and trust between teachers and leadership
11. Communication between faculty and staff. Transparency.
12. Communication with administrations and teachers. having mentors for first year teachers, andhaving teachers be highly qualified.
13. Culture and climate, communication, transparency, preparing for and administering NECAP,building morale, student discipline, PD development
14. Curriculum alignment with experienced staff
15. Curriculum development
16. curriculum/assessment development
17. Designate exemplar teachers as mentors to peers to improve performance
18. Discipline
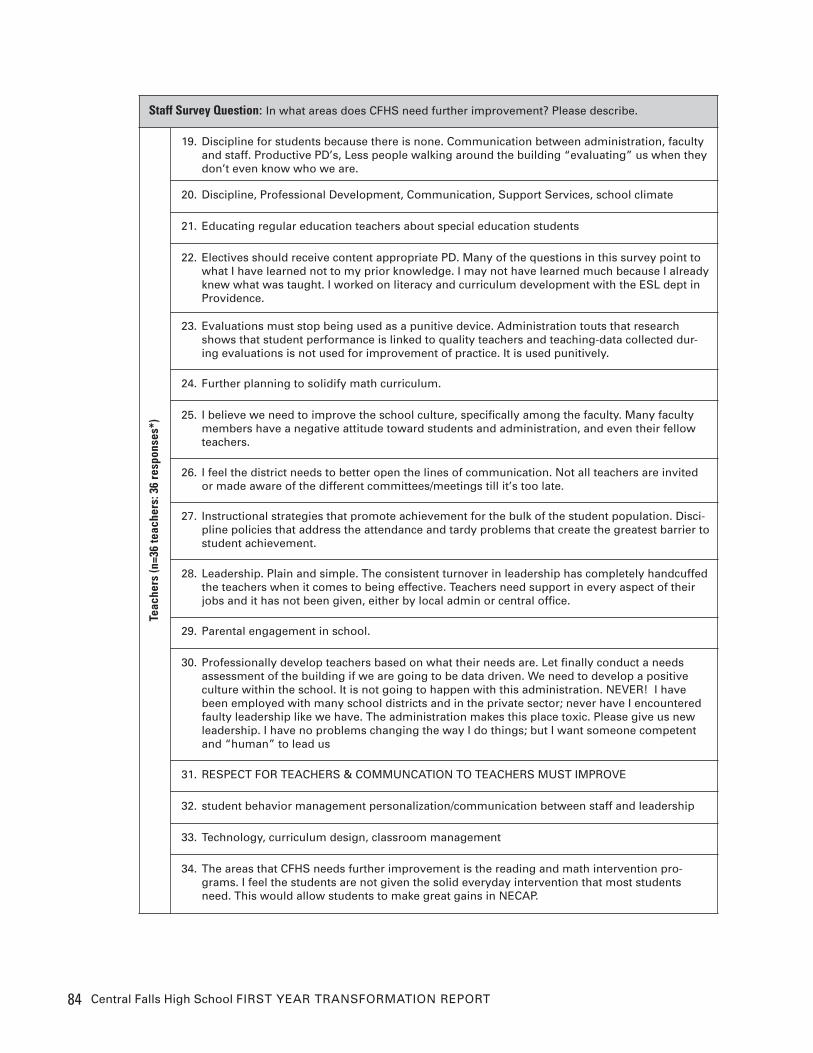
84 Central Falls High School FIRST YEAR TRANSFORMATION REPORT
Staff Survey Question: In what areas does CFHS need further improvement? Please describe.
Teac
hers (n
=36 teac
hers: 3
6 resp
onse
s*)
19. Discipline for students because there is none. Communication between administration, facultyand staff. Productive PD’s, Less people walking around the building “evaluating” us when theydon’t even know who we are.
20. Discipline, Professional Development, Communication, Support Services, school climate
21. Educating regular education teachers about special education students
22. Electives should receive content appropriate PD. Many of the questions in this survey point towhat I have learned not to my prior knowledge. I may not have learned much because I alreadyknew what was taught. I worked on literacy and curriculum development with the ESL dept inProvidence.
23. Evaluations must stop being used as a punitive device. Administration touts that researchshows that student performance is linked to quality teachers and teaching-data collected dur-ing evaluations is not used for improvement of practice. It is used punitively.
24. Further planning to solidify math curriculum.
25. I believe we need to improve the school culture, specifically among the faculty. Many facultymembers have a negative attitude toward students and administration, and even their fellowteachers.
26. I feel the district needs to better open the lines of communication. Not all teachers are invitedor made aware of the different committees/meetings till it’s too late.
27. Instructional strategies that promote achievement for the bulk of the student population. Disci-pline policies that address the attendance and tardy problems that create the greatest barrier tostudent achievement.
28. Leadership. Plain and simple. The consistent turnover in leadership has completely handcuffedthe teachers when it comes to being effective. Teachers need support in every aspect of theirjobs and it has not been given, either by local admin or central office.
29. Parental engagement in school.
30. Professionally develop teachers based on what their needs are. Let finally conduct a needsassessment of the building if we are going to be data driven. We need to develop a positiveculture within the school. It is not going to happen with this administration. NEVER! I havebeen employed with many school districts and in the private sector; never have I encounteredfaulty leadership like we have. The administration makes this place toxic. Please give us newleadership. I have no problems changing the way I do things; but I want someone competentand “human” to lead us
31. RESPECT FOR TEACHERS & COMMUNCATION TO TEACHERS MUST IMPROVE
32. student behavior management personalization/communication between staff and leadership
33. Technology, curriculum design, classroom management
34. The areas that CFHS needs further improvement is the reading and math intervention pro-grams. I feel the students are not given the solid everyday intervention that most studentsneed. This would allow students to make great gains in NECAP.
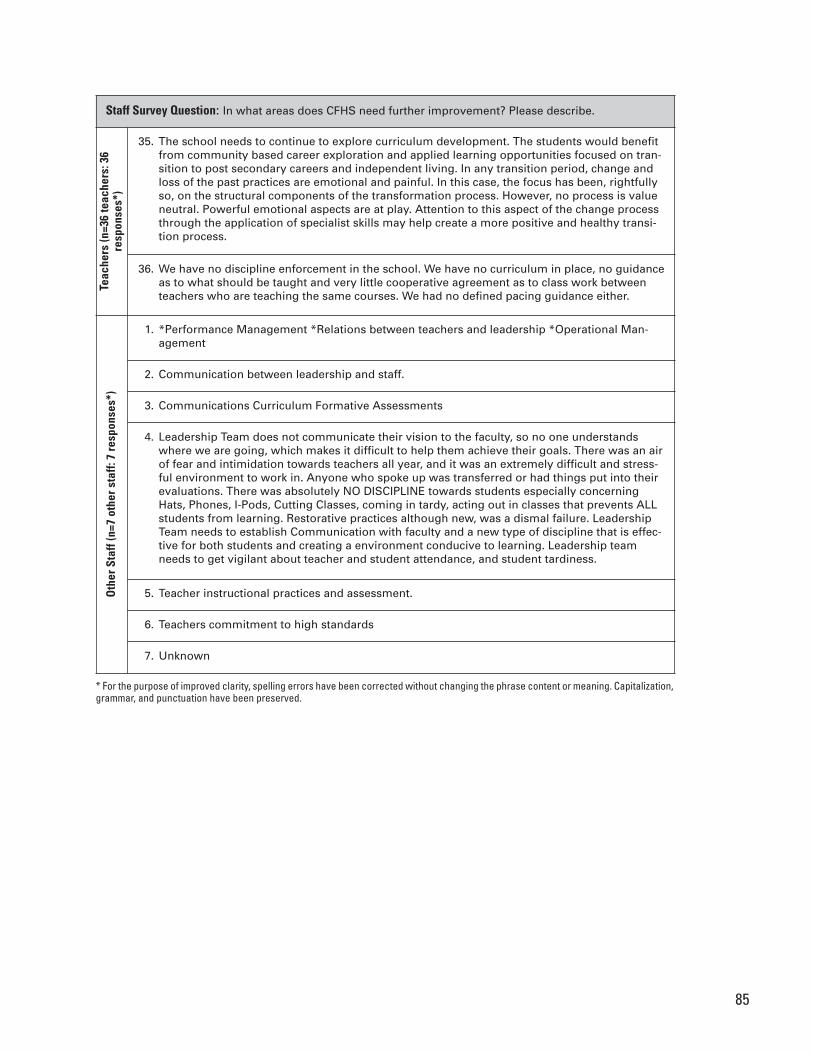
85
* For the purpose of improved clarity, spelling errors have been corrected without changing the phrase content or meaning. Capitalization,grammar, and punctuation have been preserved.
Staff Survey Question: In what areas does CFHS need further improvement? Please describe.Te
ache
rs (n
=36 teac
hers: 3
6resp
onse
s*)
35. The school needs to continue to explore curriculum development. The students would benefitfrom community based career exploration and applied learning opportunities focused on tran-sition to post secondary careers and independent living. In any transition period, change andloss of the past practices are emotional and painful. In this case, the focus has been, rightfullyso, on the structural components of the transformation process. However, no process is valueneutral. Powerful emotional aspects are at play. Attention to this aspect of the change processthrough the application of specialist skills may help create a more positive and healthy transi-tion process.
36. We have no discipline enforcement in the school. We have no curriculum in place, no guidanceas to what should be taught and very little cooperative agreement as to class work betweenteachers who are teaching the same courses. We had no defined pacing guidance either.
Other Staff (n=7
other staff: 7 re
spon
ses*
)
1. *Performance Management *Relations between teachers and leadership *Operational Man-agement
2. Communication between leadership and staff.
3. Communications Curriculum Formative Assessments
4. Leadership Team does not communicate their vision to the faculty, so no one understandswhere we are going, which makes it difficult to help them achieve their goals. There was an airof fear and intimidation towards teachers all year, and it was an extremely difficult and stress-ful environment to work in. Anyone who spoke up was transferred or had things put into theirevaluations. There was absolutely NO DISCIPLINE towards students especially concerningHats, Phones, I-Pods, Cutting Classes, coming in tardy, acting out in classes that prevents ALLstudents from learning. Restorative practices although new, was a dismal failure. LeadershipTeam needs to establish Communication with faculty and a new type of discipline that is effec-tive for both students and creating a environment conducive to learning. Leadership teamneeds to get vigilant about teacher and student attendance, and student tardiness.
5. Teacher instructional practices and assessment.
6. Teachers commitment to high standards
7. Unknown
4 Richmond Square, Fourth Floor, Providence, RI 02906, 401.274.9548
Brown University, Box 1985, Providence, RI 02921, 401.863.7990