Embed Size (px)
Citation preview
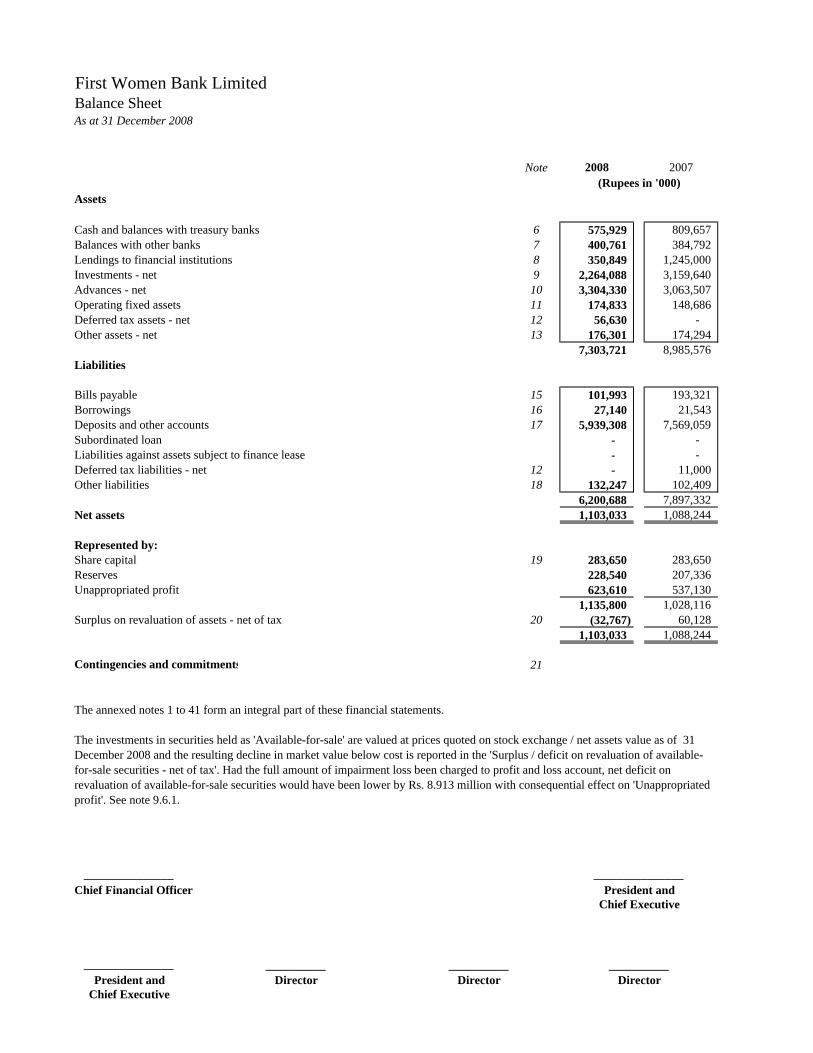
First Women Bank LimitedBalance SheetAs at 31 December 2008
Note 2008 2007(Rupees in '000)
Assets
Cash and balances with treasury banks 6 575,929 809,657 Balances with other banks 7 400,761 384,792 Lendings to financial institutions 8 350,849 1,245,000 Investments - net 9 2,264,088 3,159,640 Advances - net 10 3,304,330 3,063,507 Operating fixed assets 11 174,833 148,686 Deferred tax assets - net 12 56,630 - Other assets - net 13 176,301 174,294
7,303,721 8,985,576 Liabilities
Bills payable 15 101,993 193,321 Borrowings 16 27,140 21,543 Deposits and other accounts 17 5,939,308 7,569,059 Subordinated loan - - Liabilities against assets subject to finance lease - - Deferred tax liabilities - net 12 - 11,000 Other liabilities 18 132,247 102,409
6,200,688 7,897,332 Net assets 1,103,033 1,088,244
Represented by:Share capital 19 283,650 283,650 Reserves 228,540 207,336 Unappropriated profit 623,610 537,130
1,135,800 1,028,116 Surplus on revaluation of assets - net of tax 20 (32,767) 60,128
1,103,033 1,088,244
Contingencies and commitments 21
The annexed notes 1 to 41 form an integral part of these financial statements.
The investments in securities held as 'Available-for-sale' are valued at prices quoted on stock exchange / net assets value as of 31 December 2008 and the resulting decline in market value below cost is reported in the 'Surplus / deficit on revaluation of available-for-sale securities - net of tax'. Had the full amount of impairment loss been charged to profit and loss account, net deficit onrevaluation of available-for-sale securities would have been lower by Rs. 8.913 million with consequential effect on 'Unappropriatedprofit'. See note 9.6.1.
_______________ _______________Chief Financial Officer President and
Chief Executive
_______________ __________ __________ __________President and Director Director Director
Chief Executive
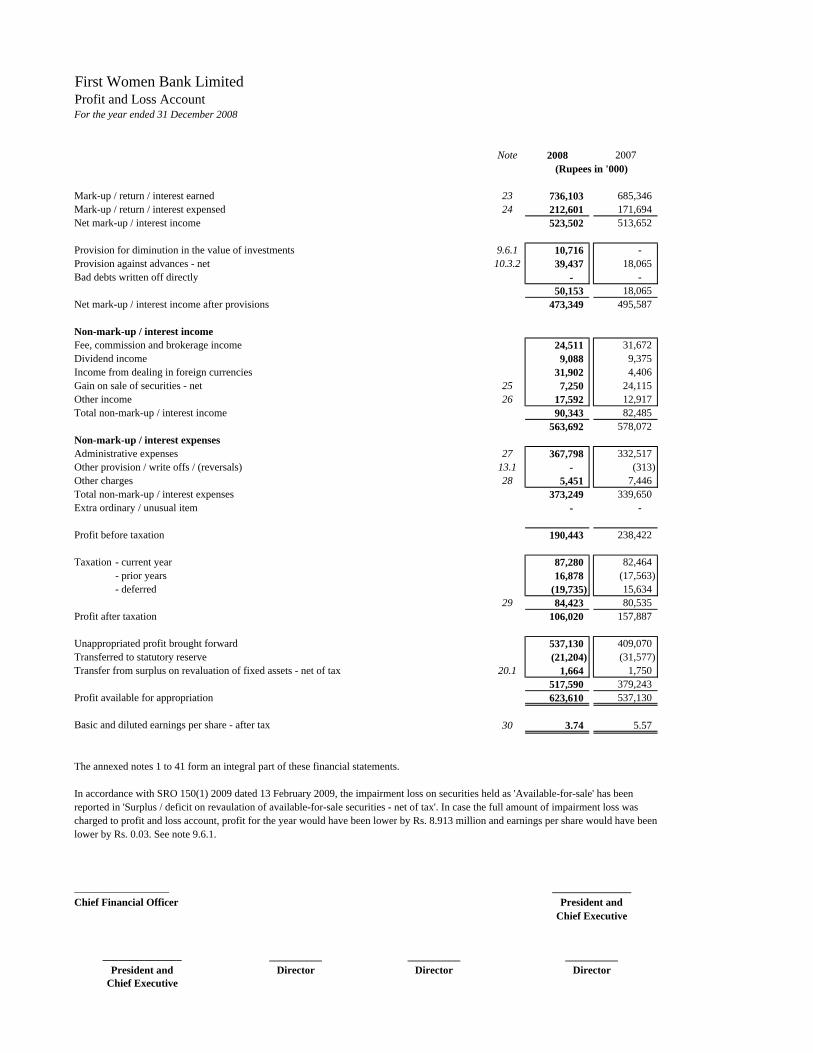
First Women Bank LimitedProfit and Loss AccountFor the year ended 31 December 2008
Note 2008 2007(Rupees in '000)
Mark-up / return / interest earned 23 736,103 685,346 Mark-up / return / interest expensed 24 212,601 171,694 Net mark-up / interest income 523,502 513,652
Provision for diminution in the value of investments 9.6.1 10,716 - Provision against advances - net 10.3.2 39,437 18,065 Bad debts written off directly - -
50,153 18,065 Net mark-up / interest income after provisions 473,349 495,587
Non-mark-up / interest incomeFee, commission and brokerage income 24,511 31,672 Dividend income 9,088 9,375 Income from dealing in foreign currencies 31,902 4,406 Gain on sale of securities - net 25 7,250 24,115 Other income 26 17,592 12,917 Total non-mark-up / interest income 90,343 82,485
563,692 578,072 Non-mark-up / interest expensesAdministrative expenses 27 367,798 332,517 Other provision / write offs / (reversals) 13.1 - (313) Other charges 28 5,451 7,446 Total non-mark-up / interest expenses 373,249 339,650 Extra ordinary / unusual item - -
Profit before taxation 190,443 238,422
Taxation - current year 87,280 82,464 - prior years 16,878 (17,563) - deferred (19,735) 15,634
29 84,423 80,535 Profit after taxation 106,020 157,887
Unappropriated profit brought forward 537,130 409,070 Transferred to statutory reserve (21,204) (31,577) Transfer from surplus on revaluation of fixed assets - net of tax 20.1 1,664 1,750
517,590 379,243 Profit available for appropriation 623,610 537,130
Basic and diluted earnings per share - after tax 30 3.74 5.57
The annexed notes 1 to 41 form an integral part of these financial statements.
In accordance with SRO 150(1) 2009 dated 13 February 2009, the impairment loss on securities held as 'Available-for-sale' has been reported in 'Surplus / deficit on revaulation of available-for-sale securities - net of tax'. In case the full amount of impairment loss wascharged to profit and loss account, profit for the year would have been lower by Rs. 8.913 million and earnings per share would have beenlower by Rs. 0.03. See note 9.6.1.
__________________ _______________Chief Financial Officer President and
Chief Executive
_______________ __________ __________ __________President and Director Director Director
Chief Executive

First Women Bank LimitedCash Flow StatementFor the year ended 31 December 2008
Note 2008 2007(Rupees in '000)
CASH FLOWS FROM OPERATING ACTIVITIESProfit before taxation 190,443 238,422 Dividend income (9,088) (9,375)
181,355 229,047 Adjustments for non-cash charges:
Depreciation 15,429 16,111 Amortisation of intangible assets 1,747 2,184 Provision for diminution in value of investments 10,716 - Provision against advances - net 39,437 18,065 Provision against other assets - (313) Gain on sale of operating fixed assets (172) (155) Bad debts written off directly - -
67,157 35,892 248,512 264,939
Decrease / (increase) in operating assetsLendings to financial institutions 894,151 186,628 Advances (280,260) (15,323) Others assets (excluding advance taxation) (26,950) 25,717
586,941 197,022 (Decrease) / increase in operating liabilities
Bills payable (91,328) 131,264 Borrowings 5,597 (909,977) Deposits and other accounts (1,629,751) 603,681 Other liabilities 29,838 6,594
(1,685,644) (168,438) (850,191) 293,523
Income tax paid (80,112) (79,132) Net cash flows from operating activities (930,303) 214,391
CASH FLOWS FROM INVESTING ACTIVITIESNet investments in available-for-sale investments 229,224 (375,147) Net investments in held-to-maturity investments 480,482 353,040 Dividend income 9,088 9,375 Investments in operating fixed assets (6,820) (14,719) Proceeds from disposal of operating fixed assets 570 750 Net cash flows from investing activities 712,544 (26,701)
(Decrease) / increase in cash and cash equivalents (217,759) 187,690 Cash and cash equivalents at beginning of the year 1,194,449 1,006,759 Cash and cash equivalents at end of the year 31 976,690 1,194,449
The annexed notes 1 to 41 form an integral part of these financial statements.
__________________ _______________Chief Financial Officer President and
Chief Executive
_______________ __________ __________ __________President and Director Director Director
Chief Executive

First Women Bank LimitedStatement of Changes in EquityFor the year ended 31 December 2008
Note Share Statutory Revenue reserve Totalcapital reserve unappropriated
profit
--------------------------------- (Rupees in '000) ------------------------------------
Balance as at 31 December 2006 283,650 175,759 409,070 868,479
Changes in equity for the year 2007Profit after tax for the year
ended 31 December 2007 - - 157,887 157,887
Transferred from surplus onrevaluation of fixed assets tounappropriated profit - net of tax(recognised directly in equity) 20.1 - - 1,750 1,750
Total recognised income for the yearended 31 December 2007 - - 159,637 159,637
Transferred to statutory reserve - 31,577 (31,577) - Balance as at 31 December 2007 283,650 207,336 537,130 1,028,116
Changes in equity for the year 2008Profit after tax for the year
ended 31 December 2008 - - 106,020 106,020
Transferred from surplus onrevaluation of fixed assets tounappropriated profit - net of tax(recognised directly in equity) 20.1 - - 1,664 1,664
Total recognised income for the yearended 31 December 2008 - - 107,684 107,684
Transferred to statutory reserve - 21,204 (21,204) - Balance as at 31 December 2008 283,650 228,540 623,610 1,135,800
The annexed notes 1 to 41 form an integral part of these financial statements.
__________________ _______________Chief Financial Officer President and
Chief Executive
_______________ __________ __________ __________President and Director Director Director
Chief Executive

First Women Bank LimitedNotes to the Financial StatementsFor the year ended 31 December 2008
1. STATUS AND NATURE OF BUSINESS
1.1
2. BASIS OF PRESENTATION
3. STATEMENT OF COMPLIANCE
3.1
3.2
3.3
-
The following standards, amendments and interpretations of approved accounting standards will be effective for accounting periods beginning on or after 1 January 2009:
First Women Bank Limited ("the Bank") was incorporated under the Companies Ordinance, 1984 on 21 November 1989 in Pakistan as an unquoted public limited company and commenced operations on 2 December 1989. The Bank is engaged in commercial banking and related services. The registered office of the Bank is situated at ground floor, S.T.S.M. Foundation Building, Civil Lines, Karachi. The number of branches as at 31 December 2008 was thirty eight (31 December 2007: thirty eight).
In accordance with the directives of the Federal Government regarding the shifting of the banking system to Islamic modes, the State Bank of Pakistan has issued various circulars from time to time. Permissible forms of trade related mode of financing include purchase of goods by the banks from their customers and immediate resale to them at appropriate mark-up in price on deferred payment basis. The purchases and sales arising under these arrangements are not reflected in these financial statements as such but are restricted to the amount of facility actually utilised and the appropriate portion of mark-up thereon.
These financial statements have been prepared in accordance with approved accounting standards as applicable in Pakistan. Approved accounting standards comprise of such International Financial Reporting Standards issued by the International Accounting Standards Board as are notified under the Companies Ordinance, 1984, provisions of and directives issued under the Companies Ordinance, 1984 and Banking Companies Ordinance, 1962 and the directives issued by State Bank of Pakistan (SBP). In case the requirements differ, the provisions of and directives issued under the Companies Ordinance, 1984 and Banking Companies Ordinance, 1962 and the directives issued by SBP shall prevail.
The State Bank of Pakistan, vide its BSD Circular No. 10 dated August 26, 2002 has deferred the applicability of International Accounting Standard 39, Financial Instruments Recognition and Measurement and International Accounting Standard 40, Investment Property for banking companies till further instructions. Accordingly, the requirements of these standards have not been considered in the preparation of these financial statements. However, investments have been classified and valued in accordance with the requirements prescribed by the State Bank of Pakistan through various circulars.
During the year, IFRIC 9 - Reassessment of embedded derivatives, IFRIC 11 - IFRS 2 - Group and Treasury Share Transactions, IFRIC 12 - Service Concession Arrangements, IFRIC 14, IAS 19 - The Limit on Defined Benefit Asset Minimum Funding Requirements and their interaction, became effective. The application of these standards did not have material effect on the Bank's financial statements.
Standards, interpretations and amendments to published approved accounting standards that are not yet effective
Revised IAS 1 - Presentation of financial statements (effective for annual periods beginning on or after 1 January 2009) introduces the term total comprehensive income, which represents changes in equity during a period other than those changes resulting from transactions with owners in their capacity as owners. Total comprehensive income may be presented in either a single statement of comprehensive income (effectively combining both the income statement and all non-owner changes in equity in a single statement), or in an income statement and a separate statement of comprehensive income. The change will be effected after discussions with regulators.

-
-
-
-
-
-
-
-
-
Revised IAS 23 - Borrowing costs (effective for annual periods beginning on or after 1 January 2009) removes the option to expense borrowing costs and requires that an entity capitalize borrowing costs directly attributable to the acquisition, construction or production of a qualifying asset as part of the cost of that asset. The application of the standard is not likely to have an effect on the Bank's financial statements.
Amendment to IFRS 2 Share-based Payment – Vesting Conditions and Cancellations (effective for annual periods beginning on or after 1 January 2009) clarifies the definition of vesting conditions, introduces the concept of non-vesting conditions, requires non-vesting conditions to be reflected in grant-date fair value and provides the accounting treatment for non-vesting conditions and cancellations. The application of this standard will not have any effect on the Bank’s financial statements.
Revised IFRS 3 Business Combinations (applicable for annual periods beginning on or after 1 July 2009) broadens among other things the definition of business resulting in more acquisitions being treated as business combinations, contingent consideration to be measured at fair value, transaction costs other than share and debt issue costs to be expensed, any pre-existing interest in an acquiree to be measured at fair value, with the related gain or loss recognised in profit or loss and any non-controlling (minority) interest to be measured at either fair value, or at its proportionate interest in the identifiable assets and liabilities of an acquiree, on a transaction-by-transaction basis. The application of this standard is not likely to have an effect on the Bank’s financial statements.
IAS 29 – Financial Reporting in Hyperinflationary Economies (effective for annual periods beginning on or after 28 April 2008). The Company does not have any operations in Hyperinflationary Economies and therefore the application of the standard is not likely to have an effect on the Bank's financial statements.
Amendments to IAS 32 Financial instruments: Presentation and IAS 1 Presentation of Financial Statements (effective for annual periods beginning on or after 1 January 2009) – Puttable Financial Instruments and Obligations Arising on Liquidation requires puttable instruments, and instruments that impose on the entity an obligation to deliver to another party a pro rata share of the net assets of the entity only on liquidation, to be classified as equity if certain conditions are met. The amendments, which require retrospective application, are not expected to have any impact on the Bank’s financial statements.
Amended IAS 27 Consolidated and Separate Financial Statements (effective for annual periods beginning on or after 1 July 2009) requires accounting for changes in ownership interest by the group in a subsidiary, while maintaining control, to be recognized as an equity transaction. When the group loses control of subsidiary, any interest retained in the former subsidiary will be measured at fair value with the gain or loss recognized in the profit or loss. The application of the standard will not have any effect on the Bank’s financial statements.
IFRS 7 – Financial Instruments: Disclosures (effective for annual periods beginning on or after 28 April 2008) supersedes IAS 30 – Disclosures in the Financial Statements of Banks and Similar Financial Institutions and the disclosure requirements of IAS 32 – Financial Instruments: Disclosure and Presentation. The standard would be applied when IAS 39 – Financial Instruments – Recognition and Measurement becomes applicable for Banks and would require significant increase in disclosures.
IFRS 8 – Operating Segments (effective for annual periods beginning on or after 1 January 2009) introduces the “management approach” to segment reporting. IFRS 8 will require a change in the presentation and disclosure of segment information based on the internal reports that are regularly reviewed by the Bank’s “chief operating decision maker” in order to assess each segment’s performance and to allocate resources to them. Currently, the Bank presents segment information in respect of its business and geographical segments. This standard will have no effect on the Bank’s reported total profit or loss or equity.
IFRIC 13 Customer Loyalty Programmes (effective for annual periods beginning on or after 01 July 2008) addresses the accounting by entities that operate or otherwise participate in customer loyalty programmes under which the customer can redeem credits for awards such as free or discounted goods or services. The application of IFRIC 13 is not likely to have any effect on the Bank’s financial statements.

-
-
-
-
-
-
4. BASIS OF MEASUREMENT
4.1
4.2
4.3 Critical accounting estimates and judgments
These financial statements have been prepared under the historical cost convention except that certain fixed assets are stated at revalued amounts, available for sale and held for trading investments and derivative financial instruments are measured at fair value.
The financial statements are presented in Pakistan Rupees, which is the Bank's functional and presentation currency. The amounts are rounded to nearest thousand.
The preparation of financial statements in conformity with approved accounting standards requires the management to make judgements, estimates and assumptions that effect the reported amounts of assets and liabilities and income and expenses. It also requires management to exercise judgement in application of its
IFRIC – 17 Distributions of Non-cash Assets to Owners (effective for annual periods beginning on or after 1 July 2009) states that when a company distributes non cash assets to its shareholders as dividend, the liability for the dividend is measured at fair value. If there are subsequent changes in the fair value before the liability is discharged, this is recognised in equity. When the non cash asset is distributed, the difference between the carrying amount and fair value is recognised in the income statement. As the Bank does not distribute non-cash assets to its shareholders, this interpretation has no impact on the Bank’s financial statements.
IFRS 5 Amendment - Improvements to IFRSs - IFRS 5 Non-current Assets Held for Sale and Discontinued Operations (effective for annual periods beginning on or after 1 July 2009) specify that: if an entity is committed to a sale plan involving the loss of control of a subsidiary, then it would classify all of that subsidiary’s assets and liabilities as held for sale when the held for sale criteria in paragraphs 6 to 8 of IFRS 5 are met. Disclosures for discontinued operations would be required by the parent when a subsidiary meets the definition of a discontinued operation. The amendment is not likely to have an effect on Bank’s financial statements.
IFRIC 15- Agreement for the Construction of Real Estate (effective for annual periods beginning on or after 1 October 2009) clarifies the recognition of revenue by real estate developers for sale of units, such as apartments or houses, 'off-plan', that is, before construction is complete. The amendment is not relevant to the Bank’s operations.
IFRIC 16- Hedge of Net Investment in a Foreign Operation (effective for annual periods beginning on or after 1 October 2008) clarifies that net investment hedging can be applied only to foreign exchange differences arising between the functional currency of a foreign operation and the parent entity’s functional currency and only in an amount equal to or less than the net assets of the foreign operation, the hedging instrument may be held by any entity within the group except the foreign operation that is being hedged and that on disposal of a hedged operation, the cumulative gain or loss on the hedging instrument that was determined to be effective is reclassified to profit or loss. The Interpretation allows an entity that uses the step-by-step method of consolidation, an accounting policy choice to determine the cumulative currency translation adjustment that is reclassified to profit or loss on disposal of a net investment as if the direct method of consolidation had been used. The amendment will not have any effect the Bank’s financial statements.
The International Accounting Standards Board made certain amendments to existing standards as part of its first annual improvements project. The effective dates for these amendments vary by standard and most will be applicable to the Bank’s 2009 financial statements. These amendments are unlikely to have an impact on the Bank’s financial statements.
IAS 27 ‘Consolidated and separate financial statements’ (effective for annual periods beginning on or after 1 January 2009). The amendment removes the definition of the cost method from IAS 27 and replaces it with a requirement to present dividends as income in the separate financial statements of the investor. The amendment will not have any effect on Bank’s financial statements.

a) Classification of investments
-
-
-
b) Impairment of available for sale equity investments
c) Provision against advances
d) Taxation
e) Depreciation, amortisation and revaluation of operating fixed assets
accounting policies. The estimates and associated assumptions are based on historical experience and various other factors that are believed to be reasonable under the circumstances. These estimates and assumptions are reviewed on an ongoing basis. Revisions to accounting estimates are recognized in the period in which the estimate is revised if the revision affects only that period, or in the period of revision and future periods if the revision affects both current and future periods.
Significant accounting estimates and areas where judgements were made by the management in the application of accounting policies are as follows:
The Bank reviews its loan portfolio to assess the amount of non-performing advances and provision required thereagainst on a regular basis. While assessing this requirement various factors including the delinquency in the account, financial position of the borrowers and the requirements of the Prudential Regulations are considered. The Bank also maintains general provision against consumer advances in accordance with the requirements of the Prudential Regulations of the State Bank of Pakistan.
In classifying investments as 'held for trading', the Bank determines the securities which are acquired with an intention to trade by taking advantage of short term market / interest rate movements and are to be sold within 90 days. However, currently no held-for-trading instruments are held by the Bank.
In making estimates of the depreciation / amortisation method, the management uses the method which reflects the pattern in which economic benefits are expected to be consumed by the Bank. The method applied is reviewed at each financial year end and if there is a change in the expected pattern of consumption of the future economic benefits embodied in the assets, the method is changed to reflect the changed pattern. Such a change is accounted for as change in accounting estimates in accordance with International Accounting Standard (IAS) 8 "Accounting Policies, Changes in Accounting Estimates and Errors". Further, the Bank estimates the revalued amount of land and buildings on a regular basis. The estimates are based on valuations carried out by independent professional valuers and such valuations are carried out with sufficient regulatory so that the valuation at the year end is close to their fair value.
The investments which are not classified as 'held for trading' or 'held to maturity' are classified as 'available for sale'.
The Bank determines that 'available for sale' equity investments are impaired when there has been a significant or prolonged decline in the fair value below its cost. The determination of what is significant or prolonged requires judgment. In making this judgment, the Bank evaluates among other factors, the normal volatility in share price. In addition the impairment may be appropriate when there is an evidence of deterioration in the financial health of the invested industry and sector performance, changes in technology and operational financial cash flows.
In classifying investments as 'held to maturity', the Bank follows the guidance provided in SBP circulars on classifying non-derivative financial assets with fixed or determinable payments and fixed maturity. In making this judgment, the Bank evaluates its intention and ability to hold such investment to maturity.
In making the estimates for income taxes currently payable by the Bank, the management considers the current income tax laws and the decisions of appellate authorities on certain issues in the past. In making the provisions for deferred taxes, estimates of the Bank's future taxable profits are also taken into account.

f) Staff retirement benefits
5. SUMMARY OF SIGNIFICANT ACCOUNTING POLICIES
5.1 Cash and cash equivalents
5.2
The Bank classifies its investments as follows:
a) Held for trading
b) Held to maturity
c) Available for sale
Investments classified as 'held to maturity' are carried at amortised cost.
These are securities with fixed or determinable payments and fixed maturity in respect of which the Bank has the positive intent and ability to hold to maturity.
These are investments, that do not fall under the 'held for trading' or 'held to maturity' categories.
Investments are initially recognised at cost where its fair value and includes transaction costs associated with the investment except that in case of held for trading financial instruments, these are charged off to the profit and loss account.
All purchases and sales of investments that require delivery within the time frame established by regulations or market conventions are recognised at the trade date. Trade date is the date on which the Bank commits to purchase or sell the investment.
In accordance with the requirements of the State Bank of Pakistan, quoted securities, other than those classified as 'held to maturity', are subsequently re-measured to fair value. Surplus / (deficit) arising on these securties is taken to the profit and loss account when actually realised on disposal or when the investment is considered to be impaired. Surplus / (deficit) arising on revaluation of quoted securities which are classified as 'available for sale', is taken to a separate account which is shown in the balance sheet below equity. Surplus / (deficit) arising on these securties is taken to the Profit & Loss account when actually realised on dispsal or when the investment is considered to be impaired. Surplus / (deficit) arising on revaluation of quoted securities which are classified as 'held for trading', is taken to the profit and loss account (however, at 31 December 2008, no investments were held in the held for trading category).
Unquoted equity securities (including the investment in associated undertaking where the Bank does not have significant influence) are valued at the lower of cost and break-up value. Break-up value of equity securities is calculated with reference to the net assets of the investee company as per the latest available audited financial statements. Associates as defined under local statutes but not under IAS are accounted for as ordinary investments.
These are securities, which are either acquired for generating profit from short-term fluctuations in market prices, interest rate movements, dealers margin or are securities included in a portfolio in which a pattern of short-term profit taking exists. However, currently no held-for-trading instruments are held by the Bank.
For the purpose of the cash flow statement, cash and cash equivalents comprise of cash and balances with treasury banks and balances with other banks.
Investments
Certain actuarial assumptions have been adopted as disclosed in these financial statements (note 33) for the actuarial valuation of staff retirement benefit plans. Actuarial assumptions are entity's best estimates of the variables that will determine the ultimate cost of providing post employment benefits. Changes in these assumptions in future years may effect the liability / asset under these plans in those years.
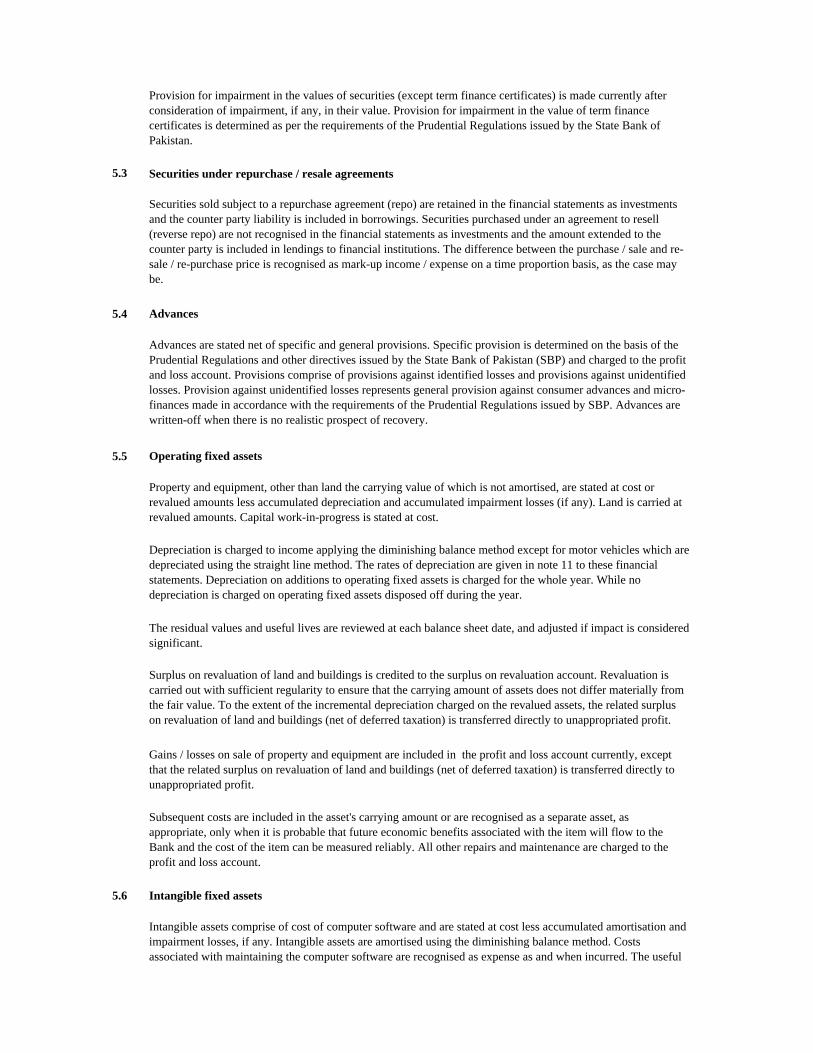
5.3 Securities under repurchase / resale agreements
5.4
5.5 Operating fixed assets
5.6 Intangible fixed assets
Securities sold subject to a repurchase agreement (repo) are retained in the financial statements as investments and the counter party liability is included in borrowings. Securities purchased under an agreement to resell (reverse repo) are not recognised in the financial statements as investments and the amount extended to the counter party is included in lendings to financial institutions. The difference between the purchase / sale and re-sale / re-purchase price is recognised as mark-up income / expense on a time proportion basis, as the case may be.
Advances
Surplus on revaluation of land and buildings is credited to the surplus on revaluation account. Revaluation is carried out with sufficient regularity to ensure that the carrying amount of assets does not differ materially from the fair value. To the extent of the incremental depreciation charged on the revalued assets, the related surplus on revaluation of land and buildings (net of deferred taxation) is transferred directly to unappropriated profit.
Gains / losses on sale of property and equipment are included in the profit and loss account currently, except that the related surplus on revaluation of land and buildings (net of deferred taxation) is transferred directly to unappropriated profit.
Intangible assets comprise of cost of computer software and are stated at cost less accumulated amortisation and impairment losses, if any. Intangible assets are amortised using the diminishing balance method. Costs associated with maintaining the computer software are recognised as expense as and when incurred. The useful
Provision for impairment in the values of securities (except term finance certificates) is made currently after consideration of impairment, if any, in their value. Provision for impairment in the value of term finance certificates is determined as per the requirements of the Prudential Regulations issued by the State Bank of Pakistan.
Advances are stated net of specific and general provisions. Specific provision is determined on the basis of the Prudential Regulations and other directives issued by the State Bank of Pakistan (SBP) and charged to the profit and loss account. Provisions comprise of provisions against identified losses and provisions against unidentified losses. Provision against unidentified losses represents general provision against consumer advances and micro-finances made in accordance with the requirements of the Prudential Regulations issued by SBP. Advances are written-off when there is no realistic prospect of recovery.
Property and equipment, other than land the carrying value of which is not amortised, are stated at cost or revalued amounts less accumulated depreciation and accumulated impairment losses (if any). Land is carried at revalued amounts. Capital work-in-progress is stated at cost.
Subsequent costs are included in the asset's carrying amount or are recognised as a separate asset, as appropriate, only when it is probable that future economic benefits associated with the item will flow to the Bank and the cost of the item can be measured reliably. All other repairs and maintenance are charged to the profit and loss account.
Depreciation is charged to income applying the diminishing balance method except for motor vehicles which are depreciated using the straight line method. The rates of depreciation are given in note 11 to these financial statements. Depreciation on additions to operating fixed assets is charged for the whole year. While no depreciation is charged on operating fixed assets disposed off during the year.
The residual values and useful lives are reviewed at each balance sheet date, and adjusted if impact is considered significant.

5.7 Impairment
5.8 Taxation
Current
Deferred
5.9 Provisions
5.10 Staff retirement benefits
5.10.1
Approved funded gratuity scheme (defined benefit plan)
Approved contributory provident fund (defined contribution plan)
The Bank operates a funded gratuity scheme for its employees. The fund was granted approval by the Commissioner of Income Tax on 31 December 2003 to take effect from 1 January 2003. Contributions to the fund are made on the basis of actuarial recommendations.
lives of intangible assets are reviewed and adjusted, if appropriate, at each balance sheet date.
The carrying value of assets are reviewed at each balance sheet date for impairment whenever events or changes in circumstances indicate that the carrying amounts of the assets may not be recoverable. If such indication exists, and where the carrying value exceeds the estimated recoverable amount, assets are written down to their recoverable amounts. The resulting impairment loss is taken to the profit and loss account except for impairment loss on revalued assets, which is adjusted against the related surplus on revaluation to the extent that the impairment loss does not exceed the surplus on revaluation of that asset.
Provision for current taxation is based on taxable income at the current rates of taxation after taking into consideration available tax credits and rebates. The charge for current tax also includes adjustments where considered necessary, relating to prior years which arise from assessments framed / finalised during the year.
Staff retirement benefits are available to the employees of the Bank under two schemes, viz. old scheme and a new scheme.
For employees of the Bank who were transferred from other scheduled banks and who did not opt for the new scheme, the Bank operates the following schemes:
The Bank operates a recognised contributory provident fund to which equal contributions are made both by the Bank and the employees at a rate of 8.33% of basic salary.
Deferred tax is recognised using the balance sheet liability method on all major temporary differences between the amounts attributed to assets and liabilities for financial reporting purposes and amounts used for taxation purposes. The Bank records deferred tax assets / liabilities using the tax rates, enacted or substantially enacted at the balance sheet date, expected to be applicable at the time of its reversal. Deferred tax asset is recognised only to the extent that it is probable that future taxable profits will be available against which the asset can be utilised. Deferred tax assets are reduced to the extent that it is no longer probable that the related tax benefit will be realised. The Bank also recognises deferred tax asset / liability on deficit / surplus on revaluation of securities and deferred tax liability on surplus on revaluation of fixed assets which is adjusted against the related deficit / surplus in accordance with the requirements of International Accounting Standard (IAS) 12, 'Income Taxes'.
Provisions are recognised when the Bank has a legal or constructive obligation as a result of past events and it is probable that an outflow of resources will be required to settle the obligation and a reliable estimate of the amount can be made. Provisions are reviewed at each balance sheet date and adjusted to reflect the current best estimate.
5.10.2
Approved funded pension scheme (defined benefit plan)
Approved non contributory provident fund (defined contribution plan)
5.10.3
5.10.4 Actuarial gains and losses
5.10.5 Past service cost
5.11 Employees’ compensated absences
5.12 Revenue recognition
-
- Dividend income is recognised when the Bank's right to receive dividend is established.
- Profit / loss on sale of investments is credited / charged to profit and loss account currently.
5.13 Foreign currencies
5.13.1 Foreign currency transactions
For new employees and for those who have opted for the new scheme, the Bank operates the following schemes:
The Bank operates a non contributory provident fund in which monthly contributions are made by employees at a rate of 12% of basic salary.
Mark-up / interest on advances and returns on investments are recognised on a time proportion basis using the effective interest method except that mark-up / interest on non-performing advances and investments is recognised on a receipt basis, in accordance with the requirements of the Prudential Regulations issued by the State Bank of Pakistan (SBP).
Transactions in foreign currencies are translated to Rupees at the foreign exchange rates ruling on the transaction date. Monetary assets and liabilities in foreign currencies are expressed in Rupee terms at the rates of exchange prevailing at the balance sheet date. Foreign bills purchased and forward foreign exchange contracts are valued at the rates applicable to their respective maturities.
The Bank operates a funded pension scheme for its employees. The fund was granted approval by the Commissioner of Income Tax on 6 March 2000 to take effect from 1 October 1999. Contributions are made on the basis of actuarial recommendations.
Contributions to the defined benefit plans are made on the basis of actuarial recommendations using the projected unit credit method. The above benefits are payable to staff at the time of separation / retirement from the Bank's services subject to the completion of qualifying period of service.
Actuarial gains and losses arising from experience adjustments and changes in actuarial assumptions in excess of the greater of 10% of the value of the plan assets or 10% of the defined benefit obligation at the end of the last reporting year are charged or credited to income over the employees' expected average remaining working lives. These limits are calculated and applied separately for each defined benefit plan.
Past service cost resulting from changes to defined benefit plans to the extent the benefits are already vested is recognized immediately and the remaining unrecognized past service cost is recognized as an expense on a straight line basis over the average period until the benefits become vested.
The Bank recognises liability in respect of compensated absences of its employees in the period in which these are earned on the basis of actuarial valuation carried out using the Projected Unit Credit Method.
5.13.2 Translation gains and losses
5.13.3 Commitments
5.14 Off-setting
5.15 Financial instruments
5.15.1 Financial assets and financial liabilities
5.15.2 Derivative financial instruments
5.16 Segment reporting
5.16.1 Business segment
Corporate finance
Trading and sales
Retail and consumer banking
Commercial banking
5.16.2 Geographical segment
The Bank operates in Pakistan only.
Translation gains and losses are included in the profit and loss account currently.
It includes retail lending and deposits, banking services, private lending and deposits, retail offered to its retail customers and small and medium enterprises.
Financial assets and financial liabilities are set off and the net amount is reported in the financial statements when there is a legally enforceable right to set off and the Bank intends to either settle on net basis, or to realise the assets and to settle the liabilities simultaneously.
Financial instruments carried on the balance sheet include cash and balances with treasury banks, balances with other banks, lendings to financial institutions, investments, advances, other assets, bills payable, borrowings, deposits and other accounts and other liabilities. The particular recognition methods adopted for significant financial assets and financial liabilities are disclosed in the individual policy statements associated with these assets and liabilities.
Commitments for outstanding forward foreign exchange contracts are disclosed in these financial statements at committed amounts. Contingent liabilities / commitments for letters of credit and letters of guarantee denominated in foreign currencies are expressed in Rupee terms at the rates of exchange ruling at the balance sheet date.
It includes project finance, export finance, trade finance, other lendings, guarantees and bills of exchange.
Derivative financial instruments are initially recognised at fair value on the date on which a derivative contract is entered into and are subsequently remeasured at their fair value using valuation techniques. All derivative financial instruments are carried as assets when the fair value is positive and liability when fair value is negative. Any change in the fair value of derivative financial instruments is taken to the profit and loss account currently.
A segment is a distinguishable component of the Bank that is engaged in providing products or services (business segment) or in providing products or services within a particular economic environment (geographical segment), which is subject to risks and rewards that are different from those of other segments. The Bank's primary format of reporting is based on business segments.
Corporate finance includes syndications and advances to corporate enterprises.
It includes fixed income, equity, foreign exchange commodities, lendings to financial institutions and borrowings.

6. CASH AND BALANCES WITH TREASURY BANKS Note 2008 2007(Rupees in '000)
In handLocal currency 6.1 128,476 138,283 Foreign currencies 28,047 10,322
With State Bank of Pakistan in: Local currency current account 6.2 301,432 603,469 Foreign currency deposit account 6.3 83,844 38,440 US Dollar clearing account 1,613 2,775
With National Bank of Pakistan in local currency current account - associated undertaking 32,517 16,368
575,929 809,657
6.1 This includes National Prize Bonds of Rs 0.065 million (2007: Rs 0.105 million).
6.2
6.3
7. BALANCES WITH OTHER BANKS
In Pakistancurrent account 7.1 36,076 9,616 deposit account 7.2 292,664 328,600
Outside Pakistancurrent account 72,021 46,576
400,761 384,792
7.1
7.2
8. LENDINGS TO FINANCIAL INSTITUTIONS - in local currency
Short term lendings - secured 8.1 227,767 - Call money lendings - 145,000 Repurchase agreement lendings 8.2 123,082 - Letter of placements (with Non Banking Finance
Companies - NBFCs) - 1,100,000 350,849 1,245,000
8.1
The local currency current account is maintained with the State Bank of Pakistan (SBP) as per the requirements of Section 36 of the State Bank of Pakistan Act, 1956. This section requires banking companies to maintain a local currency cash reserve as percentage of its time liabilities and demand liabilities in Pakistan as may be prescribed by SBP.
The balance held in foreign currency deposit account with the SBP represents the 5% cash reserve requirement and 15% specail cash reserve for holding FE-25 deposits. This amount include Special Cash Reserve of Rs 63.279 million (2007: Rs 19.220 million) on which return is earned at 0.9% per annum (2007: 4.24% per annum).
Placement of funds with banks, against foreign currency deposit scheme (FE-25), are unsecured and carry mark-up rates ranging from 5.75% to 6% per annum (2007: 5% to 6% per annum).
Balances with other banks include balances with associated undertakings amounting to Rs. 36.076 million (2007: Rs. 9.616 million).
This represents secured financings to two financial institutions carrying profit rate at six months KIBOR+2% (which at the year-end amounted to 17.7%). These are due to mature in December 2009 and are adjustable in monthly instalments.

8.2 Securities held as collateral against repurchase agreement lendings
Held by Further Total Held by Further Totalbank given as bank given as
collateral collateral
Market Treasury Bills 123,082 - 123,082 - - -
9. INVESTMENTS - net
9.1 Investments by typesNote Held by Given as Total Held by Given as Total
bank collateral bank collateral
Available-for-sale- Market Treasury Bills 9.4 882,864 - 882,864 1,103,520 - 1,103,520 - Pakistan Investment Bonds 9.4 1,199,680 - 1,199,680 1,205,655 1,205,655 - Term Finance Certificates (TFCs) 9.5 68,209 - 68,209 80,802 - 80,802 - Units / certificates of mutual funds 9.6 60,000 - 60,000 50,000 - 50,000 - Preference shares of a listed company 9.7 10,000 - 10,000 10,000 10,000 - Shares of an unlisted company 9.8 954 - 954 954 - 954
2,221,707 - 2,221,707 2,450,931 - 2,450,931 Held-to-maturity - Pakistan Investment Bonds 9.9 231,771 - 231,771 235,741 235,741 - Punjab Government Loan - - - 26,512 - 26,512 - Certificates of Investments - - - 450,000 - 450,000
231,771 - 231,771 712,253 - 712,253 Investments at cost 2,453,478 - 2,453,478 3,163,184 - 3,163,184 Less: Provision for diminution in
value of investments (10,716) - (10,716) Investments (Net of Provisions) 2,442,762 - 2,442,762 3,163,184 - 3,163,184 Deficit on revaluation of available for sale securities - net 20.2 (178,674) - (178,674) (3,544) - (3,544) Investments at revalued amounts 2,264,088 - 2,264,088 3,159,640 - 3,159,640
2008 2007
9.2 Investments by segments
Federal Government Securities:- Market Treasury Bills 9.4 882,864 1,103,520 - Pakistan Investment Bonds 9.4 & 9.9 1,431,451 1,441,396
Provincial Government Securities- Punjab Government Loan - 26,512
Fully Paid-up Ordinary Shares / Certificates / Units- Listed mutual funds 9.6 60,000 50,000 - Unlisted company (related party) 9.8 954 954
Fully Paid-up Preference Shares:- Shares of a listed company 9.7 10,000 10,000
Term Finance Certificates, Debentures, Bonds and Participation Term Certificates:- Listed Term Finance Certificates 9.5 62,543 73,802 - Unlisted Term Finance Certificates 9.5 5,666 7,000
68,209 80,802 Other Investments:- Certificates of Investments - 450,000
Total investments at cost 2,453,478 3,163,184
Less: Provision for diminution in value of investments (10,716) -
Total investments (Net of Provisions) 2,442,762 -
Deficit on revaluation of available for sale securities - net 20.2 (178,674) (3,544) Investments at revalued amounts 2,264,088 3,159,640
2008 2007
-------------------------------------(Rupees in '000)-------------------------------------
Market value of securities held as collateral against repurchase agreement lendings as at 31 December 2008 amounted to Rs. 121.250 Million (2007: Nil) carrying mark-up rate of 14.90% per annum.
(Rupees in '000)
----------------------------------------(Rupees in '000)----------------------------------------
2008 2007
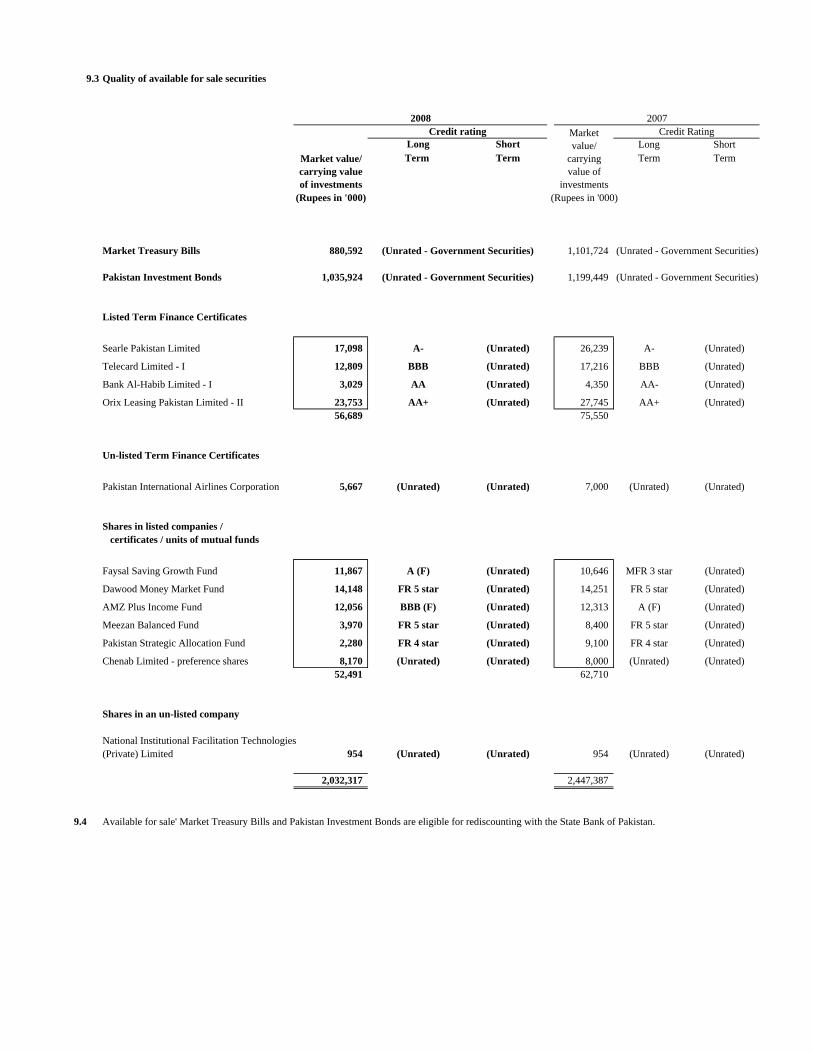
9.3 Quality of available for sale securities
Long Short Long ShortTerm Term Term Term
(Rupees in '000) (Rupees in '000)
Market Treasury Bills 880,592 1,101,724
Pakistan Investment Bonds 1,035,924 1,199,449
Listed Term Finance Certificates
Searle Pakistan Limited 17,098 A- (Unrated) 26,239 A- (Unrated)
Telecard Limited - I 12,809 BBB (Unrated) 17,216 BBB (Unrated)
Bank Al-Habib Limited - I 3,029 AA (Unrated) 4,350 AA- (Unrated)
Orix Leasing Pakistan Limited - II 23,753 AA+ (Unrated) 27,745 AA+ (Unrated)56,689 75,550
Un-listed Term Finance Certificates
Pakistan International Airlines Corporation 5,667 (Unrated) (Unrated) 7,000 (Unrated) (Unrated)
Shares in listed companies / certificates / units of mutual funds
Faysal Saving Growth Fund 11,867 A (F) (Unrated) 10,646 MFR 3 star (Unrated)
Dawood Money Market Fund 14,148 FR 5 star (Unrated) 14,251 FR 5 star (Unrated)
AMZ Plus Income Fund 12,056 BBB (F) (Unrated) 12,313 A (F) (Unrated)
Meezan Balanced Fund 3,970 FR 5 star (Unrated) 8,400 FR 5 star (Unrated)
Pakistan Strategic Allocation Fund 2,280 FR 4 star (Unrated) 9,100 FR 4 star (Unrated)
Chenab Limited - preference shares 8,170 (Unrated) (Unrated) 8,000 (Unrated) (Unrated)52,491 62,710
Shares in an un-listed company
National Institutional Facilitation Technologies(Private) Limited 954 (Unrated) (Unrated) 954 (Unrated) (Unrated)
2,032,317 2,447,387
9.4
20072008Credit rating Credit Rating
Market value/ carrying value of investments
Market value/
carrying value of
investments
Available for sale' Market Treasury Bills and Pakistan Investment Bonds are eligible for rediscounting with the State Bank of Pakistan.
(Unrated - Government Securities)
(Unrated - Government Securities) (Unrated - Government Securities)
(Unrated - Government Securities)
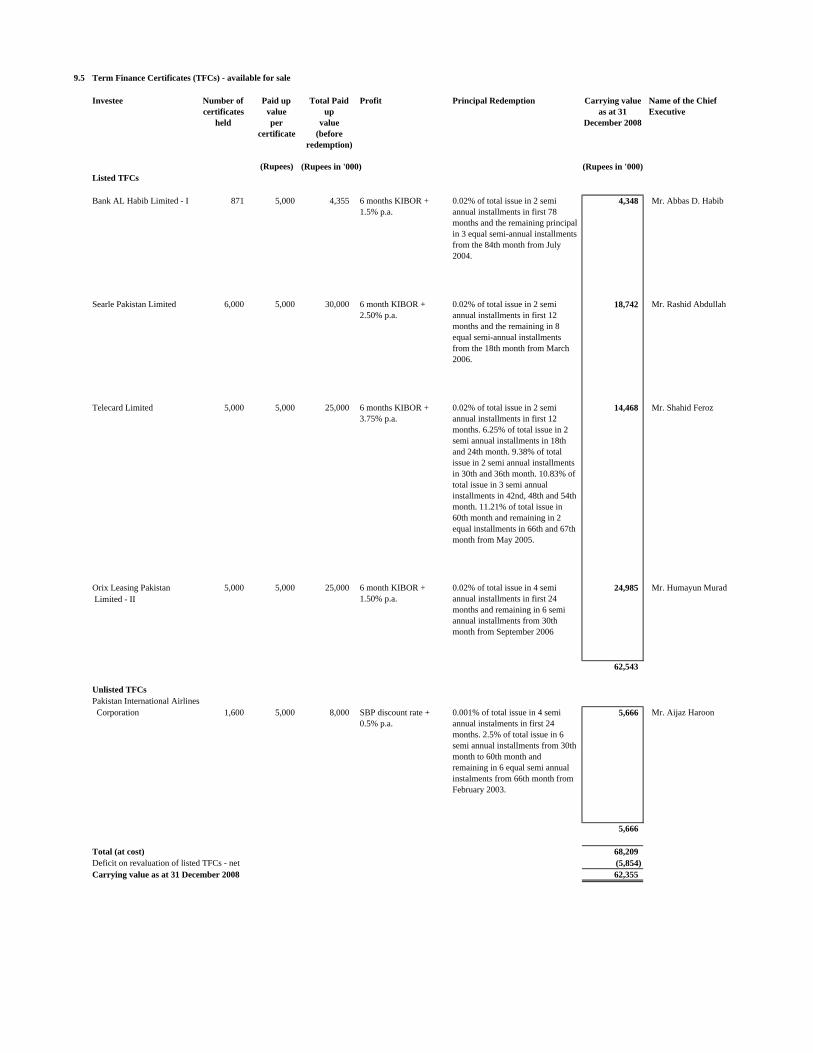
9.5 Term Finance Certificates (TFCs) - available for sale
Investee Number ofcertificates
held
Paid up value per
certificate
Total Paid up
value (before
redemption)
Carrying value as at 31
December 2008
Name of the Chief Executive
(Rupees) (Rupees in '000) (Rupees in '000)Listed TFCs
Bank AL Habib Limited - I 871 5,000 4,355 4,348 Mr. Abbas D. Habib
Searle Pakistan Limited 6,000 5,000 30,000 18,742 Mr. Rashid Abdullah
Telecard Limited 5,000 5,000 25,000 14,468 Mr. Shahid Feroz
Orix Leasing Pakistan 5,000 5,000 25,000 24,985 Mr. Humayun Murad Limited - II
62,543
Unlisted TFCsPakistan International Airlines Corporation 1,600 5,000 8,000 5,666 Mr. Aijaz Haroon
5,666
Total (at cost) 68,209 Deficit on revaluation of listed TFCs - net (5,854) Carrying value as at 31 December 2008 62,355
6 month KIBOR + 1.50% p.a.
SBP discount rate + 0.5% p.a.
0.02% of total issue in 2 semi annual installments in first 78 months and the remaining principal in 3 equal semi-annual installments from the 84th month from July 2004.
Profit
6 months KIBOR + 1.5% p.a.
6 month KIBOR + 2.50% p.a.
6 months KIBOR + 3.75% p.a.
Principal Redemption
0.02% of total issue in 2 semi annual installments in first 12 months and the remaining in 8 equal semi-annual installments from the 18th month from March 2006.
0.001% of total issue in 4 semi annual instalments in first 24 months. 2.5% of total issue in 6 semi annual installments from 30th month to 60th month and remaining in 6 equal semi annual instalments from 66th month from February 2003.
0.02% of total issue in 4 semi annual installments in first 24 months and remaining in 6 semi annual installments from 30th month from September 2006
0.02% of total issue in 2 semi annual installments in first 12 months. 6.25% of total issue in 2 semi annual installments in 18th and 24th month. 9.38% of total issue in 2 semi annual installments in 30th and 36th month. 10.83% of total issue in 3 semi annual installments in 42nd, 48th and 54th month. 11.21% of total issue in 60th month and remaining in 2 equal installments in 66th and 67th month from May 2005.

9.6 Mutual fund units / certificates
Investee Number of units/ certificates
held
Paid-upvalue per
certificate/ unit
Total paid-up / nominal
value
Carrying value as at 31
December 2008
Name of the Chief Executive
(Rupees)Open ended mutual fundsAMZ Plus Income Fund 130,226 100 13,023 10,000 Mr. Main Ikram ul HaqDawood Money Market Fund 194,840 100 19,484 20,000 Ms. T. Uzra Dawood.Faysal Savings Growth Fund 114,571 100 11,457 10,000 Mr. Salman Haider Sheikh
40,000 Closed ended mutual fundsPakistan Strategic Allocation Fund 1,000,000 10 10,000 10,000 Mr. Nasim BegMeezan Balanced Fund 1,000,000 10 10,000 10,000 Mr. Mohammad Shoaib
20,000 Total (at cost) 60,000 Less: Provision for diminution (10,716) Total (Net of Provisions) 49,284 Deficit on revaluation - net (4,963) Carrying value as of 31 December 2008 44,321
9.6.1
31 December 2008
Rupees in '000Increase in ''Impairment Loss' in Profit and Loss Account 10,716 Decrease in tax charge for the year 1,803 Decrease in profit for the year - after tax 8,913
Rupees
Decrease in earnings per share - after tax (basic and diluted) 0.03
Rupees in '000
Decrease in deficit on revaluation of available for sale securities 10,716
Decrease in unappropriated profit 8,913
9.7 Preference shares in a listed company
9.8 Shares in an unlisted company - related party
30 June 2008 30 June 2007
Assets 634,292 484,286 Liabilities 102,514 88,368
Net assets 531,778 395,918
Revenue 788,729 655,882
Profit 178,536 142,460
9.9
The details of assets, liabilities, net assets, revenue and profit of the above company as at 30 June 2008 (the latest available audited financial statements) are as follows:
The market value of Pakistan Investment Bonds classified as 'held to maturity' as at 31 December 2008 amounted to Rs. 158.454 million (2007: Rs. 191.770 million).
Based on the financial statements of the above investee company as of 30 June 2008, the break-up value per share amounts to Rs. 48.93 per share (2007: Rs. 54.18 per share revised).
The recognition of impairment loss in accordance with the requirements of IAS 39 would have had the following effect on these financial statements:
(Rupees in '000)
This represents cumulative redeemable preference shares of Chenab Limited, containing dividend entitlement at 9.25% per annum on the issue price. Market value of these shares at 31 December 2008 amounted to Rs. 8.170 million (2007: Rs. 8 million).
(Rupees in '000)
This represents investment in 616,082 ordinary shares (2007: 616,082 ordinary shares) of Rs. 10 of National Institutional Facilitation Technologies (Private) Limited (NIFT). The Bank's investment in NIFT is carried at cost and is not accounted under the equity method of accounting as the Bank does not have significant influence over the entity. However, an employee of the Bank is a Director of NIFT. The Bank has 5.67% (2007: 5.67%) stake in the above company.
The Karachi Stock Exchange (Guarantee) Limited (“KSE”) placed a “Floor Mechanism” on the market value of securities based on the closing prices of securities prevailing as on 27 August 2008. Under the “Floor Mechanism“, the individual security price of equity securities could vary within normal circuit breaker limit, but not below the floor price level. The mechanism was effective from 28 August 2008 and remained in place until 15 December 2008. Consequent to the introduction of ‘floor mechanism’ by KSE, the market volume declined significantly during the period from 27 August 2008 to 15 December 2008. There were lower floors on a number of securities at 31 December 2008. The equity securities are required to be valued at prices quoted on the KSE on 31 December 2008 without any adjustment as allowed by the State Bank of Pakistan (SBP) BSD Circular Letter No. 2 dated 27 January 2009.
Furthermore, SBP BSD Circular No. 4 dated 13 February 2009 has provided to follow Securities and Exchange Commission of Pakistan (SECP) notification vide SRO 150 (1)/2009 dated 13 February, 2009 allowing that the impairment loss, if any, recognized as on 31 December 2008 due to valuation of listed equity investments held as “Available for Sale’ to quoted market prices may be shown under the equity. The amount taken to equity including any adjustment/effect for price movements shall be taken to Profit and Loss account on quarterly basis during the year ending 31 December 2009. The amount taken to equity at 31 December 2008 shall be treated as a charge to Profit and Loss Account for the purposes of distribution as dividend.
In view of the floor mechanism as explained above and current economic conditions in the country, the management believes that these are ‘rare circumstances’’ and the plunge in equity markets cannot be considered to be a fair reflection of equity values. Therefore recognition of impairment for ‘Available for Sale’ equity securities through Profit and Loss account will not reflect the correct financial performance of the Bank.

10. ADVANCES - net Note 2008 2007
(Rupees in '000)
Loans, cash credits, running finances, etc.
In Pakistan 3,409,842 3,129,582
Provision against advances
Specific provision 10.3 104,441 64,882
General provision 10.3 1,071 1,193
105,512 66,075
Advances - net 3,304,330 3,063,507
10.1 Particulars of advances (gross)
10.1.1 In local currency 3,405,198 3,129,582
In foreign currencies 4,644 -
3,409,842 3,129,582
10.1.2 Short-term 2,932,718 2,450,812
Long-term 477,124 678,770
3,409,842 3,129,582
10.2 Advances include Rs. 174.287 million (2007: Rs. 85.282 million) which have been placed under the non-performing status as detailed below:
Category of
classification Domestic Overseas Total Domestic Overseas Total Domestic Overseas Total
Substandard 91,602 - 91,602 22,900 - 22,900 22,900 - 22,900
Doubtful 2,289 - 2,289 1,145 - 1,145 1,145 - 1,145
Loss 80,396 - 80,396 80,396 - 80,396 80,396 - 80,396
174,287 - 174,287 104,441 - 104,441 104,441 - 104,441
Category of
classification Domestic Overseas Total Domestic Overseas Total Domestic Overseas Total
Substandard 245 - 245 61 - 61 61 - 61
Doubtful 40,432 - 40,432 20,216 - 20,216 20,216 - 20,216
Loss 44,605 - 44,605 44,605 - 44,605 44,605 - 44,605
85,282 - 85,282 64,882 - 64,882 64,882 - 64,882
10.3 Particulars of provision against advances
Note Specific General Total Specific General Total
Opening balance 64,882 1,193 66,075 47,076 1,496 48,572
Charge for the year 55,449 419 55,868 22,334 242 22,576
Reversals (15,890) (541) (16,431) (3,966) (545) (4,511)
10.3.2 39,559 (122) 39,437 18,368 (303) 18,065
Amounts written off 10.4 - - (562) - (562)
Closing balance 104,441 1,071 105,512 64,882 1,193 66,075
10.3.1 Particulars of provision against advances Specific General Total Specific General Total
In local currency 104,441 1,071 105,512 64,882 1,193 66,075
In foreign currencies - - - - - -
104,441 1,071 105,512 64,882 1,193 66,075
Note 2008 2007
10.3.2 The following amounts have been charged to the profit and loss account:
Specific provision 39,559 18,368
General provision 10.3.3 (122) (303)
39,437 18,065
10.3.3
10.4 Particulars of write offs:
10.4.1 Against provisions - 562
Directly charged to the profit and loss account - -
- 562
10.4.2 Write offs of Rs. 500,000 and above 10.4.3 - 545
Write offs of below Rs. 500,000 - 17
- 562
10.4.3
2008
--------------------------------------------------------------- (Rupees in '000) ---------------------------------------------------------------
--------------------------------------------------------------- (Rupees in '000) ---------------------------------------------------------------
2007
Specific provision required
Specific provision heldClassified advances Specific provision required
Specific provision heldClassified advances
2008 2007
--------------------------------------- (Rupees in '000) ---------------------------------------
20072008
This includes general provision against consumer loans representing provision maintained at an amount equal to 1.5% of the fully secured performing portfolio and 5% of the
unsecured performing portfolio as required by the Prudential Regulations issued by the State Bank of Pakistan.
--------------------------------------- (Rupees in '000) ---------------------------------------
(Rupees in '000)
In terms of sub-section (3) of section 33A of the Banking Companies Ordinance, 1962, the Statement in respect of written-off loans or any financial relief of five hundred thousand
rupees or above allowed to a person(s) during the year ended 31 Decemebr 2008 is given at Annexure - I.

10.5 Particulars of advances to directors, associated companies, etc. Note 2008 2007
Debts due by executives or officers of the Bank or any of them either severally or jointly with any other persons
Balance at beginning of the year 53,171 51,054 Loans granted during the year 18,127 20,074 Repayments (4,532) (17,957) Balance at end of the year 66,766 53,171
Debts due by companies or firms in which the directors of the bank are interested as directors, partners or in the case of private companies as members
Balance at beginning of year 116,667 116,667 Given during the year - 50,000 Repaid during the year (58,333) (50,000) Balance at end of year 58,334 116,667
Debts due by subsidiary companies, controlled firms, managed modarabas and other related parties
Balance at beginning of the year 609,962 236,320 Loans granted during the year 1,254,919 712,244 Repayments (1,807,093) (338,602) Balance at end of the year 57,788 609,962
11. OPERATING FIXED ASSETS
Property and equipment 11.1 167,845 139,951 Intangible asset 11.3 6,988 8,735
174,833 148,686
11.1 Property and equipment
Description
Land - leasehold 31,684 - 4,930 36,614 - - - - 36,614 -
Buildings on 71,046 801 17,219 89,066 11,747 3,005 (14,752) - 89,066 5%leasehold land
Furniture and 32,511 375 - 32,729 18,629 1,590 - 20,092 12,637 10% to 33.33%fixtures (157) - (127) -
Electrical, office 57,972 4,690 - 62,628 31,856 6,067 - 37,916 24,712 20%and computer (34) - (7) - equipment
Vehicles 34,587 954 - 33,490 25,617 4,767 - 28,674 4,816 20%(2,051) - (1,710) -
227,800 6,820 22,149 254,527 87,849 15,429 (14,752) 86,682 167,845 (2,242) (1,844)
Description
Land - leasehold 31,684 - - 31,684 - - - - 31,684 -
Buildings on 71,046 - - 71,046 8,626 3,121 - 11,747 59,299 5%leasehold land
Furniture and 33,220 825 (546) 32,511 18,321 1,472 (424) 18,629 13,882 10% to 33.33%fixtures (988) (740)
Electrical, office 54,314 8,364 (1,812) 57,972 28,943 6,235 (856) 31,856 26,116 20%and computer (2,562) (332) (2,186) (280) equipment
Vehicles 34,486 914 - 34,587 21,147 5,283 - 25,617 8,970 20%(813) (813)
224,750 10,103 (2,690) 227,800 77,037 16,111 (1,560) 87,849 139,951 (4,363) (3,739)
Annual rate of depreciati-
on At
1 January 2007
Additions / (disposals) / revaluation
Adjustment At 31 December
2007
At 1 January
2007
Charge for the year /
(deprecation on disposals)
Adjustment
------------------------------------------------------------------------------(Rupees in '000)-----------------------------------------------------------------------
At 31 December
2007
Net book value at 31 December
2007
2007-------------------------Cost/ revalued amount ---------------------- --------- Accumulated depreciation ---------
------------------------------------------------------------------------(Rupees in '000)---------------------------------------------------------------------------
--------- Accumulated depreciation -------------------------------Cost/ revalued amount ----------------------- Net book value at 31 December
2008
At 31 December
2008
At 1 January
2008
Charge for the year / (deprecati-on on disposals)
(Rupees in '000)
Revaluation Revaluation adjustment
At 31 December
2008
2008Annual rate
of depreciati-on
At 1 January
2008
Additions / (disposals)
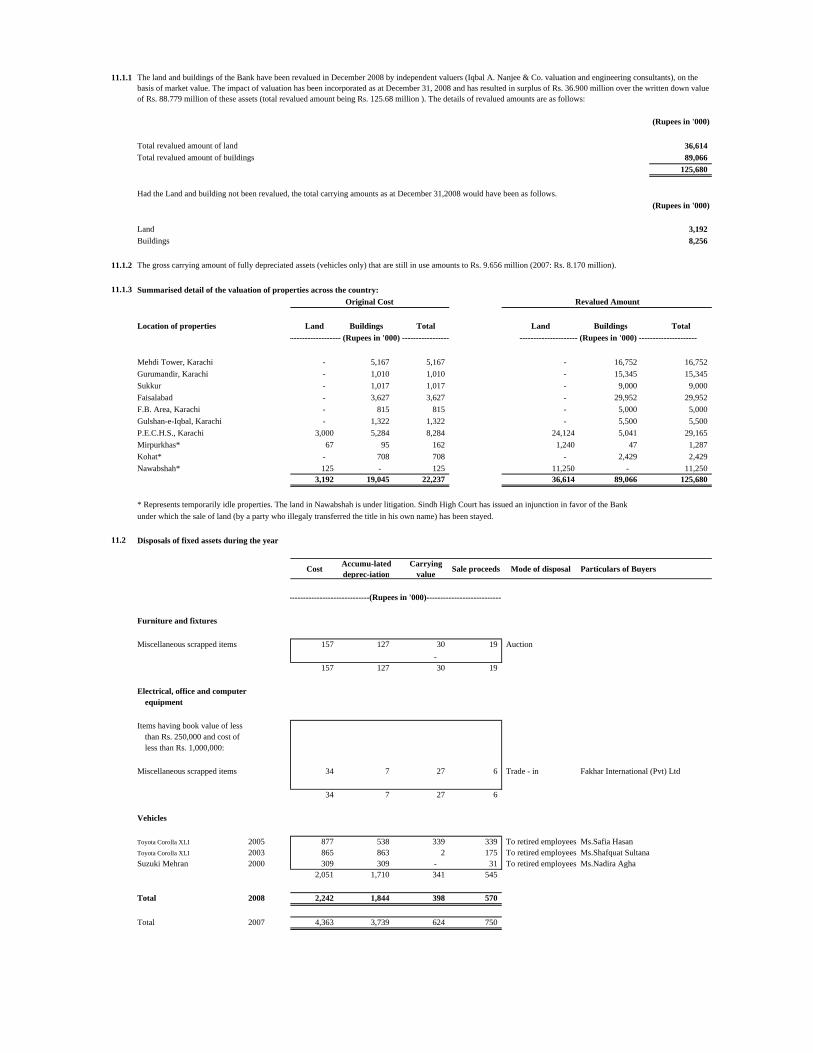
11.1.1
(Rupees in '000)
Total revalued amount of land 36,614 Total revalued amount of buildings 89,066
125,680
Had the Land and building not been revalued, the total carrying amounts as at December 31,2008 would have been as follows.(Rupees in '000)
Land 3,192 Buildings 8,256
11.1.2 The gross carrying amount of fully depreciated assets (vehicles only) that are still in use amounts to Rs. 9.656 million (2007: Rs. 8.170 million).
11.1.3 Summarised detail of the valuation of properties across the country:
Location of properties Land Buildings Total Land Buildings Total
Mehdi Tower, Karachi - 5,167 5,167 - 16,752 16,752 Gurumandir, Karachi - 1,010 1,010 - 15,345 15,345 Sukkur - 1,017 1,017 - 9,000 9,000 Faisalabad - 3,627 3,627 - 29,952 29,952 F.B. Area, Karachi - 815 815 - 5,000 5,000 Gulshan-e-Iqbal, Karachi - 1,322 1,322 - 5,500 5,500 P.E.C.H.S., Karachi 3,000 5,284 8,284 24,124 5,041 29,165 Mirpurkhas* 67 95 162 1,240 47 1,287 Kohat* - 708 708 - 2,429 2,429 Nawabshah* 125 - 125 11,250 - 11,250
3,192 19,045 22,237 36,614 89,066 125,680
* Represents temporarily idle properties. The land in Nawabshah is under litigation. Sindh High Court has issued an injunction in favor of the Bankunder which the sale of land (by a party who illegaly transferred the title in his own name) has been stayed.
11.2 Disposals of fixed assets during the year
Cost Accumu-lated deprec-iation
Carrying value Sale proceeds Mode of disposal Particulars of Buyers
Furniture and fixtures
Miscellaneous scrapped items 157 127 30 19 Auction-
157 127 30 19
Electrical, office and computerequipment
Items having book value of lessthan Rs. 250,000 and cost ofless than Rs. 1,000,000:
Miscellaneous scrapped items 34 7 27 6 Trade - in Fakhar International (Pvt) Ltd
34 7 27 6
Vehicles
Toyota Corolla XLI 2005 877 538 339 339 To retired employees Ms.Safia HasanToyota Corolla XLI 2003 865 863 2 175 To retired employees Ms.Shafquat SultanaSuzuki Mehran 2000 309 309 - 31 To retired employees Ms.Nadira Agha
2,051 1,710 341 545
Total 2008 2,242 1,844 398 570
Total 2007 4,363 3,739 624 750
Original Cost
------------------- (Rupees in '000) -----------------
-----------------------------(Rupees in '000)----------------------------
The land and buildings of the Bank have been revalued in December 2008 by independent valuers (Iqbal A. Nanjee & Co. valuation and engineering consultants), on the basis of market value. The impact of valuation has been incorporated as at December 31, 2008 and has resulted in surplus of Rs. 36.900 million over the written down value of Rs. 88.779 million of these assets (total revalued amount being Rs. 125.68 million ). The details of revalued amounts are as follows:
--------------------- (Rupees in '000) ---------------------
Revalued Amount
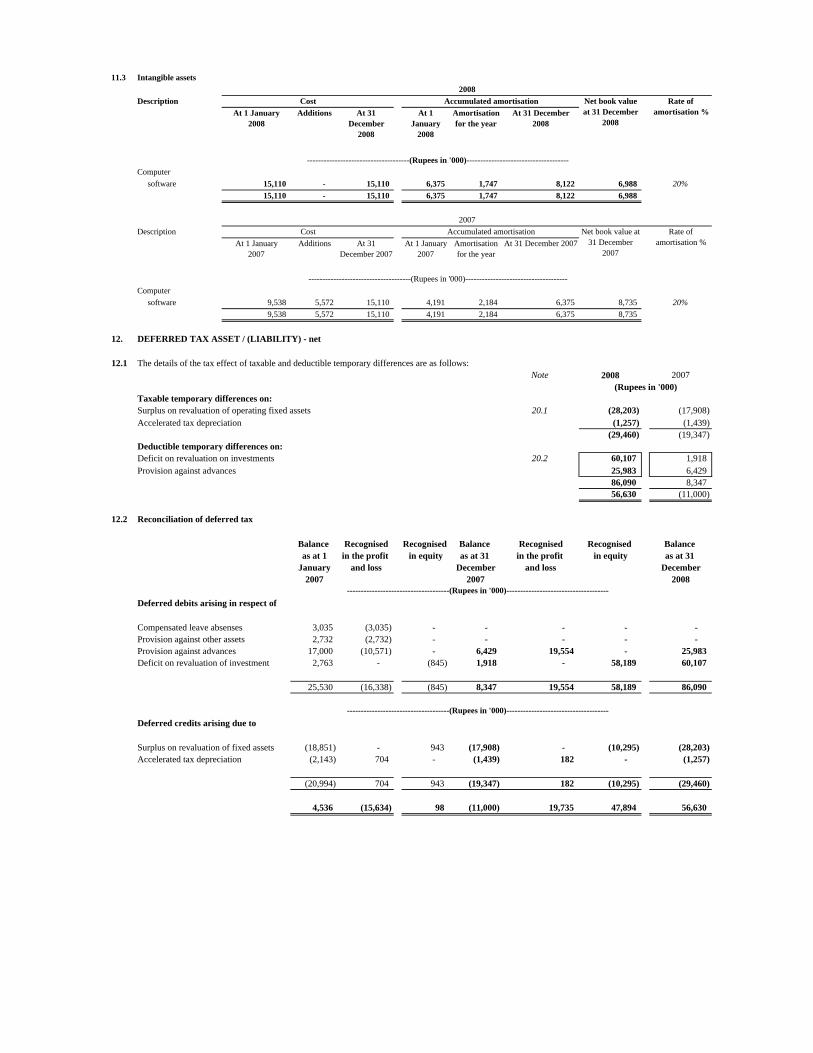
11.3 Intangible assets
Description
-------------------------------------(Rupees in '000)-------------------------------------Computer
software 15,110 - 15,110 6,375 1,747 8,122 6,988 20%15,110 - 15,110 6,375 1,747 8,122 6,988
Description
-------------------------------------(Rupees in '000)-------------------------------------Computer
software 9,538 5,572 15,110 4,191 2,184 6,375 8,735 20%9,538 5,572 15,110 4,191 2,184 6,375 8,735
12. DEFERRED TAX ASSET / (LIABILITY) - net
12.1 The details of the tax effect of taxable and deductible temporary differences are as follows:Note 2008 2007
Taxable temporary differences on:Surplus on revaluation of operating fixed assets 20.1 (28,203) (17,908) Accelerated tax depreciation (1,257) (1,439)
(29,460) (19,347) Deductible temporary differences on:Deficit on revaluation on investments 20.2 60,107 1,918 Provision against advances 25,983 6,429
86,090 8,347 56,630 (11,000)
12.2 Reconciliation of deferred tax
Balance Recognised Recognised Balance Recognised Recognised Balance as at 1 in the profit in equity as at 31 in the profit in equity as at 31
January and loss December and loss December2007 2007 2008
-------------------------------------(Rupees in '000)-------------------------------------Deferred debits arising in respect of
Compensated leave absenses 3,035 (3,035) - - - - - Provision against other assets 2,732 (2,732) - - - - - Provision against advances 17,000 (10,571) - 6,429 19,554 - 25,983 Deficit on revaluation of investment 2,763 - (845) 1,918 - 58,189 60,107
25,530 (16,338) (845) 8,347 19,554 58,189 86,090
-------------------------------------(Rupees in '000)-------------------------------------Deferred credits arising due to
Surplus on revaluation of fixed assets (18,851) - 943 (17,908) - (10,295) (28,203) Accelerated tax depreciation (2,143) 704 - (1,439) 182 - (1,257)
(20,994) 704 943 (19,347) 182 (10,295) (29,460)
4,536 (15,634) 98 (11,000) 19,735 47,894 56,630
At 31 December
2008
At 31 December 2007At 1 January 2007
Accumulated amortisationAdditions At 31
December 2007
(Rupees in '000)
Net book value at 31 December
2007
Rate of amortisation %
2008
At 1 January 2008
Amortisation for the year
2007Cost
Net book value at 31 December
2008
At 1 January 2007
At 1 January
2008
Additions At 31 December 2008
Amortisation for the year
Accumulated amortisationCost Rate of amortisation %
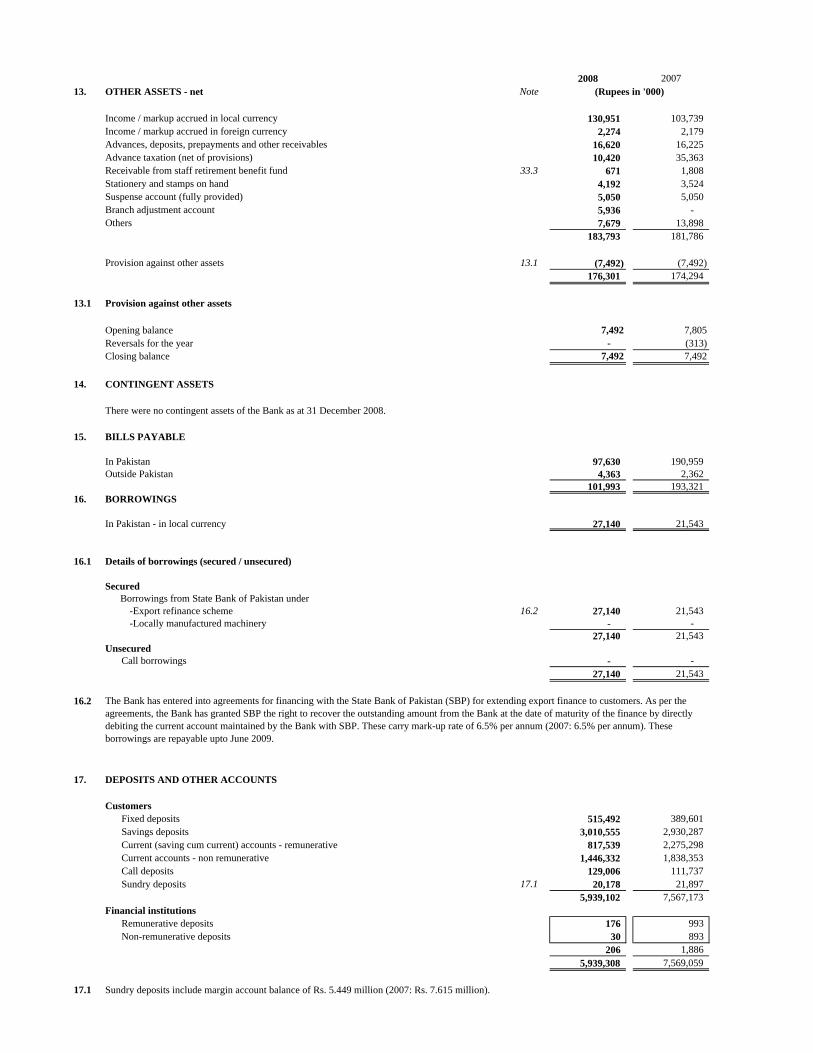
2008 200713. OTHER ASSETS - net Note
Income / markup accrued in local currency 130,951 103,739 Income / markup accrued in foreign currency 2,274 2,179 Advances, deposits, prepayments and other receivables 16,620 16,225 Advance taxation (net of provisions) 10,420 35,363 Receivable from staff retirement benefit fund 33.3 671 1,808 Stationery and stamps on hand 4,192 3,524 Suspense account (fully provided) 5,050 5,050 Branch adjustment account 5,936 - Others 7,679 13,898
183,793 181,786
Provision against other assets 13.1 (7,492) (7,492) 176,301 174,294
13.1 Provision against other assets
Opening balance 7,492 7,805 Reversals for the year - (313) Closing balance 7,492 7,492
14. CONTINGENT ASSETS
There were no contingent assets of the Bank as at 31 December 2008.
15. BILLS PAYABLE
In Pakistan 97,630 190,959 Outside Pakistan 4,363 2,362
101,993 193,321 16. BORROWINGS
In Pakistan - in local currency 27,140 21,543
16.1 Details of borrowings (secured / unsecured)
Secured Borrowings from State Bank of Pakistan under
-Export refinance scheme 16.2 27,140 21,543 -Locally manufactured machinery - -
27,140 21,543 Unsecured
Call borrowings - - 27,140 21,543
16.2
17. DEPOSITS AND OTHER ACCOUNTS
CustomersFixed deposits 515,492 389,601 Savings deposits 3,010,555 2,930,287 Current (saving cum current) accounts - remunerative 817,539 2,275,298 Current accounts - non remunerative 1,446,332 1,838,353 Call deposits 129,006 111,737 Sundry deposits 17.1 20,178 21,897
5,939,102 7,567,173 Financial institutions
Remunerative deposits 176 993 Non-remunerative deposits 30 893
206 1,886 5,939,308 7,569,059
17.1 Sundry deposits include margin account balance of Rs. 5.449 million (2007: Rs. 7.615 million).
The Bank has entered into agreements for financing with the State Bank of Pakistan (SBP) for extending export finance to customers. As per the agreements, the Bank has granted SBP the right to recover the outstanding amount from the Bank at the date of maturity of the finance by directly debiting the current account maintained by the Bank with SBP. These carry mark-up rate of 6.5% per annum (2007: 6.5% per annum). These borrowings are repayable upto June 2009.
(Rupees in '000)

17.2 Particulars of deposits 2008 2007(Rupees in '000)
In local currency 5,551,123 7,198,289 In foreign currencies 388,185 370,770
5,939,308 7,569,059
18. OTHER LIABILITIES
Mark-up/ return/ interest payable in local currency 102,034 73,947 Accrued expenses 3,545 3,228 Branch adjustment account - 6,916 Payable to defined contribution plans - 377 Provision for employees' compensated absences 33.10.3 14,388 12,217 Workers welfare fund 4,604 - Others 7,676 5,724
132,247 102,409
19. SHARE CAPITAL
19.1 Authorised capital
2008 2007(Number of shares)
30,000,000 30,000,000 Ordinary shares of Rs 10 each 300,000 300,000
19.2 Issued, subscribed and paid up capital
This comprises of fully paid-up ordinary shares of Rs 10 each as follows:
24,365,000 24,365,000 Issued for cash 243,650 243,650 4,000,000 4,000,000 Issued as bonus shares 40,000 40,000
28,365,000 28,365,000 283,650 283,650
19.3 Major shareholders (associated undertakings)
Number of Percentage of shares held shareholding
%MCB Bank Limited 7,596,000 26.78 Habib Bank Limited 7,596,000 26.78 Allied Bank Limited 2,544,000 8.96 National Bank of Pakistan 2,532,000 8.93 United Bank Limited 2,532,000 8.93 Ministry of Women Development, Government of Pakistan 5,565,000 19.62
28,365,000 100.00
2008 & 2007
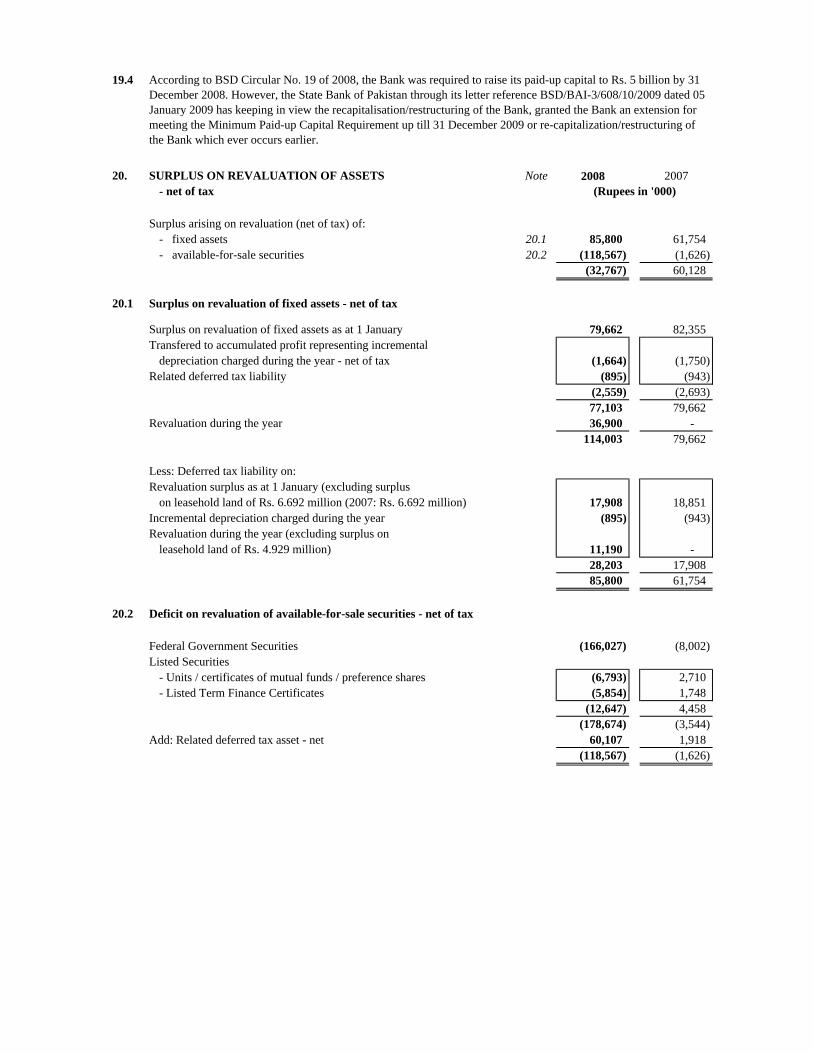
19.4
20. SURPLUS ON REVALUATION OF ASSETS Note 2008 2007- net of tax (Rupees in '000)
Surplus arising on revaluation (net of tax) of: - fixed assets 20.1 85,800 61,754 - available-for-sale securities 20.2 (118,567) (1,626)
(32,767) 60,128
20.1 Surplus on revaluation of fixed assets - net of tax
Surplus on revaluation of fixed assets as at 1 January 79,662 82,355 Transfered to accumulated profit representing incremental
depreciation charged during the year - net of tax (1,664) (1,750) Related deferred tax liability (895) (943)
(2,559) (2,693) 77,103 79,662
Revaluation during the year 36,900 - 114,003 79,662
Less: Deferred tax liability on:Revaluation surplus as at 1 January (excluding surplus
on leasehold land of Rs. 6.692 million (2007: Rs. 6.692 million) 17,908 18,851 Incremental depreciation charged during the year (895) (943) Revaluation during the year (excluding surplus on
leasehold land of Rs. 4.929 million) 11,190 - 28,203 17,908 85,800 61,754
20.2 Deficit on revaluation of available-for-sale securities - net of tax
Federal Government Securities (166,027) (8,002) Listed Securities
- Units / certificates of mutual funds / preference shares (6,793) 2,710 - Listed Term Finance Certificates (5,854) 1,748
(12,647) 4,458 (178,674) (3,544)
Add: Related deferred tax asset - net 60,107 1,918 (118,567) (1,626)
According to BSD Circular No. 19 of 2008, the Bank was required to raise its paid-up capital to Rs. 5 billion by 31 December 2008. However, the State Bank of Pakistan through its letter reference BSD/BAI-3/608/10/2009 dated 05 January 2009 has keeping in view the recapitalisation/restructuring of the Bank, granted the Bank an extension for meeting the Minimum Paid-up Capital Requirement up till 31 December 2009 or re-capitalization/restructuring of the Bank which ever occurs earlier.

21. CONTINGENCIES AND COMMITMENTS2008 2007
21.1 Transaction-related contingent liabilities (Rupees in '000)
Guarantees in favour of:Government 40,739 40,575 Others 1,081 890
41,820 41,465
21.2 Trade-related contingent liabilities
Letter of credit and acceptances on behalf of:Government - 1,342 Others 6,191 1,574
6,191 2,916
21.3 Commitments in respect of lending
Commitments to extend credit - -
21.4 Other contingencies
Claims against the Bank not acknowledged as debt 154,037 154,037
21.5 Commitments in respect of forward foreign exchange contracts
Purchase - - Sale - -
21.6 Taxation
22. DERIVATIVE INSTRUMENTS
23 MARK-UP / RETURN / INTEREST EARNED
On loans and advances to:Customers 386,531 279,821 Financial institutions 5,169 19,294
391,700 299,115 On investments in: Available for sale securities 235,559 215,397 Held to maturity securities 24,328 50,104
259,887 265,501
On deposits with financial institutions 79,785 106,134 On securities purchased under resale agreements 4,731 14,596
736,103 685,346
The Bank makes commitments to extend credit in the normal course of its business but these being revocable commitments do not attract any significant penalty or expense if the facility is unilaterally withdrawn.
The income tax assessments of the Bank have been finalised up to and including the assessment year 2002-03 and Tax year 2003 (financial year ended 31 December 2002) while returns for subsequent years up to tax year 2008 (financial year ended 31 December 2007) have been filed which are deemed to have been assessed for respective years under section 120 of the Income Tax Ordinance, 2001 (untill selected for audit). The tax authorities have made certain disallowances comprising primarily the interest on non-performing advances suspensed by the Bank, Nostro account balances written-off by the Bank, etc. in respect of the assessment years 1995-96 to 2001-02 against which appeals have been filed by the Bank at appellate forums. In case of adverse decisions, the Bank would have to make additional provision of Rs. 35.734 million.
However, the management is confident that the decision in appeals would be in its favour and as such no provision has been made against the above amount.
The Bank, as a policy does not enter into derivatives except for forward foreign exchange contracts, which are primarily backed by trade finance related business of customers. The volume and quantum of such forward contracts is low.

2008 200724 MARK-UP / RETURN / INTEREST EXPENSED (Rupees in '000)
On deposits 191,122 164,586 On securities sold under repurchase agreements 21,397 6,983 On other short-term borrowings 82 125
212,601 171,694
25 GAIN ON SALE OF SECURITIES
Units of Mutual Fund 7,250 24,115
26 OTHER INCOME
Gain on sale of fixed assets 172 126 Rent on lockers 5,239 5,065 Others 12,181 7,726
17,592 12,917
27. ADMINISTRATIVE EXPENSES
Salaries and allowances 197,626 177,488 Charge for employees' compensated absences 33.10.3 2,171 3,710 Charge for defined benefit plans:
Approved pension fund 33.7 16,722 16,543 Approved gratuity fund 33.7 1,028 985
17,750 17,528
Contribution to defined contribution plan - provident fund 34 415 378
Non-executive directors' fees 2 7 Rent, taxes, insurance, electricity 54,330 42,688 Legal and professional charges 3,705 5,437 Worker Welfare Fund 4,604 - Communications 12,954 12,652 Repairs and maintenance 12,790 11,198 Stationery and printing 10,293 9,629 Advertisement and publicity 8,690 5,094 Donations 27.1 - - Auditors' remuneration 27.2 1,715 1,378 Depreciation 11.1 15,429 16,111 Amortization of intangible asset 11.3 1,747 2,184 Remitances, cash handling service charges 7,052 10,499 Conveyance, Travelling, etc. 7,332 5,956 Others 9,193 10,580
367,798 332,517
27.1 No donations were made by the Bank during the year.
27.2 Auditors' remuneration
Audit fee 770 700 Fee for half yearly review of financial statements 300 275 Fee for special certifications and sundry advisory services 250 265 Fee for tax services 355 100 Out of pocket expenses 40 38
1,715 1,378
28. OTHER CHARGES
Penalties imposed by the State Bank of Pakistan 5,451 7,446
29. TAXATION
For the yearCurrent 87,280 82,464 Deferred (19,735) (7,133)
67,545 75,331 Prior years
Current 16,878 (17,563) Deferred - 22,767
16,878 5,204 84,423 80,535
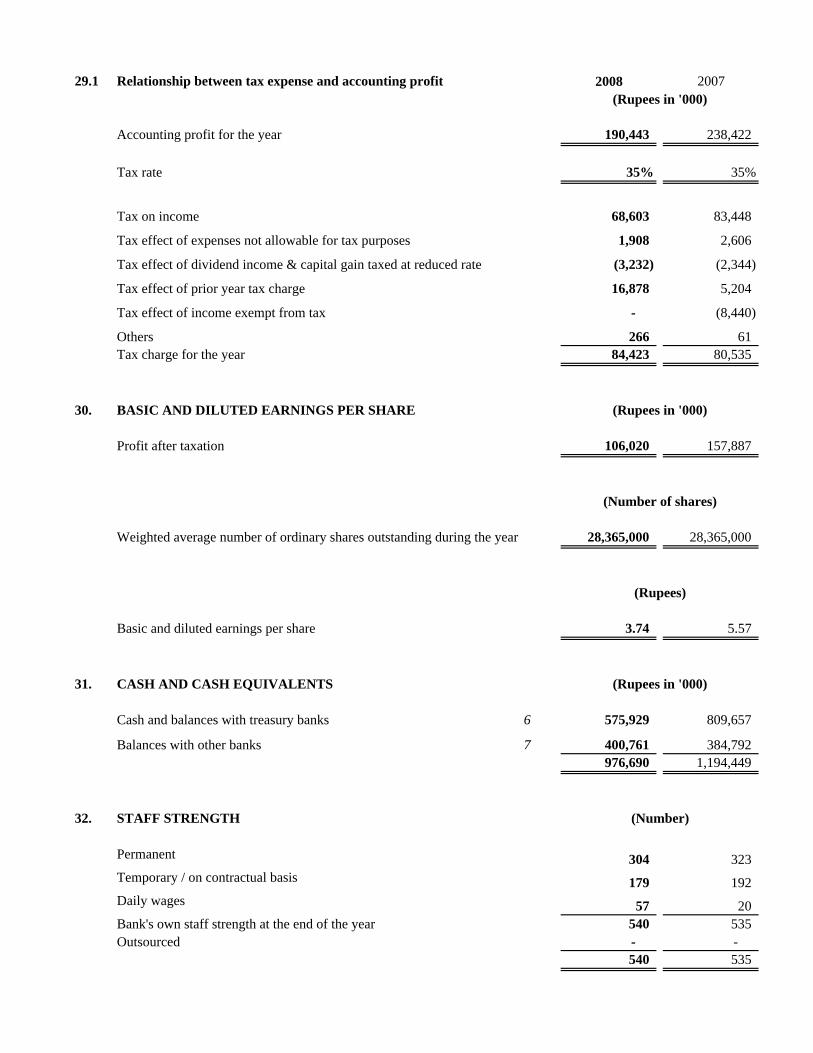
29.1 Relationship between tax expense and accounting profit 2008 2007(Rupees in '000)
Accounting profit for the year 190,443 238,422
Tax rate 35% 35%
Tax on income 68,603 83,448
Tax effect of expenses not allowable for tax purposes 1,908 2,606
Tax effect of dividend income & capital gain taxed at reduced rate (3,232) (2,344)
Tax effect of prior year tax charge 16,878 5,204
Tax effect of income exempt from tax - (8,440)
Others 266 61 Tax charge for the year 84,423 80,535
30. BASIC AND DILUTED EARNINGS PER SHARE
Profit after taxation 106,020 157,887
Weighted average number of ordinary shares outstanding during the year 28,365,000 28,365,000
(Rupees)
Basic and diluted earnings per share 3.74 5.57
31. CASH AND CASH EQUIVALENTS
Cash and balances with treasury banks 6 575,929 809,657
Balances with other banks 7 400,761 384,792 976,690 1,194,449
32. STAFF STRENGTH (Number)
Permanent 304 323 Temporary / on contractual basis 179 192 Daily wages 57 20 Bank's own staff strength at the end of the year 540 535 Outsourced - -
540 535
(Rupees in '000)
(Number of shares)
(Rupees in '000)
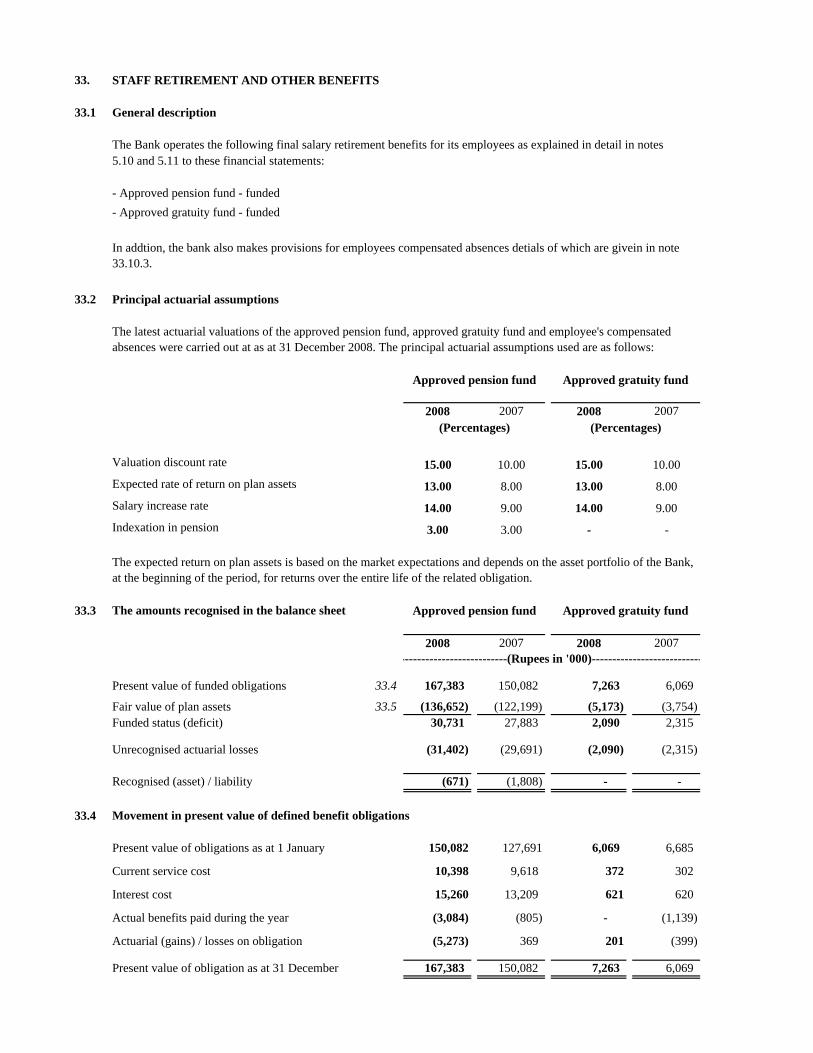
33. STAFF RETIREMENT AND OTHER BENEFITS
33.1 General description
The Bank operates the following final salary retirement benefits for its employees as explained in detail in notes5.10 and 5.11 to these financial statements:
- Approved pension fund - funded - Approved gratuity fund - funded
33.2 Principal actuarial assumptions
2008 2007 2008 2007
Valuation discount rate 15.00 10.00 15.00 10.00Expected rate of return on plan assets 13.00 8.00 13.00 8.00Salary increase rate 14.00 9.00 14.00 9.00Indexation in pension 3.00 3.00 - -
33.3 The amounts recognised in the balance sheet
2008 2007 2008 2007
Present value of funded obligations 33.4 167,383 150,082 7,263 6,069
Fair value of plan assets 33.5 (136,652) (122,199) (5,173) (3,754) Funded status (deficit) 30,731 27,883 2,090 2,315
Unrecognised actuarial losses (31,402) (29,691) (2,090) (2,315)
Recognised (asset) / liability (671) (1,808) - -
33.4 Movement in present value of defined benefit obligations
Present value of obligations as at 1 January 150,082 127,691 6,069 6,685
Current service cost 10,398 9,618 372 302
Interest cost 15,260 13,209 621 620
Actual benefits paid during the year (3,084) (805) - (1,139)
Actuarial (gains) / losses on obligation (5,273) 369 201 (399)
Present value of obligation as at 31 December 167,383 150,082 7,263 6,069
In addtion, the bank also makes provisions for employees compensated absences detials of which are givein in note 33.10.3.
The latest actuarial valuations of the approved pension fund, approved gratuity fund and employee's compensated absences were carried out at as at 31 December 2008. The principal actuarial assumptions used are as follows:
Approved pension fund Approved gratuity fund
(Percentages)(Percentages)
The expected return on plan assets is based on the market expectations and depends on the asset portfolio of the Bank, at the beginning of the period, for returns over the entire life of the related obligation.
--------------------------(Rupees in '000)---------------------------
Approved gratuity fundApproved pension fund

33.5 Movement in fair value of plan assets
Note2008 2007 2008 2007
Fair value of plan assets as at 1 January 122,199 96,544 3,754 3,742 Expected return on plan assets 9,985 8,089 392 262 Contributions during the year 15,585 14,923 1,028 985 Benefits paid (3,084) (805) - (1,139) Actuarial losses on plan assets (8,033) 3,448 (1) (96) Fair value of plan assets as at 31 December 136,652 122,199 5,173 3,754
33.6 Movements in net (asset) / liability recognised in the balance sheet
Opening balance (1,808) (3,280) - - Charge for the year 33.7 16,722 16,543 1,028 985 Contribution to the fund made during the year (15,585) (14,923) (1,028) (985) Adjustment - (148) - - Closing balance (671) (1,808) - -
33.7 Amounts recognised in the profit and loss account
Current service cost 10,398 9,618 372 302 Interest cost 15,260 13,209 621 620 Expected return on plan assets (9,985) (8,089) (392) (262) Amortisation of transitional obligation 1,049 1,805 427 325 Actuarial losses recognised during the year - - - - Net assets as at 31 December 16,722 16,543 1,028 985
33.8 Actual return on plan assets 3,775 5,773 380 187
33.9 Components of plan assets as percentage of total assets 2008 2007 2008 2007
Government securities 11.19% 12.66% 0.00% 0.00%Term Deposits 42.99% 40.08% 80.11% 80.83%Mutual Funds 34.91% 44.62% 0.00% 0.00%Cash at Bank 10.91% 2.64% 19.89% 19.17%
100.00% 100.00% 100.00% 100.00%* This represent funds deployed with First Women Bank Limited.** Includes Rs. 42.5 million (31%) deployed with First Women Bank Limited.
33.10 Other relevant details of above funds are as follows:2008 2007 2006 2005 2004
33.10.1 Approved pension fund
Present value of defined benefit obligation 167,383 150,082 127,691 111,768 86,030 Fair value of plan assets 136,652 122,199 96,544 75,040 56,500 Deficit 30,731
-
27,883 -
31,147 36,728 29,530
Experience adjustments on plan liabilities loss / (gain) 5,273 369 (13,388) 14,795 (15,279) Experience adjustments on plan assets (loss) / gain (8,033) 3,448 2,961 417 19
33.10.2 Approved gratuity fund
Present value of defined benefit obligation 7,263 6,069 6,685 8,878 5,642 Fair value of plan assets 5,173 3,754 3,742 5,298 4,529 Deficit 2,090
-
2,315 -
2,943 3,580 1,113
Experience adjustments on plan liabilities (gain) / loss (201) (399) (274) 2,416 (258) Experience adjustments on plan assets (loss) / gain (1) 96 235 207 267
----------------------------------(Rupees in '000)----------------------------------
Approved gratuity fund
-------------------------(Rupees in '000)-------------------------
Approved pension fund
* * * *
** *
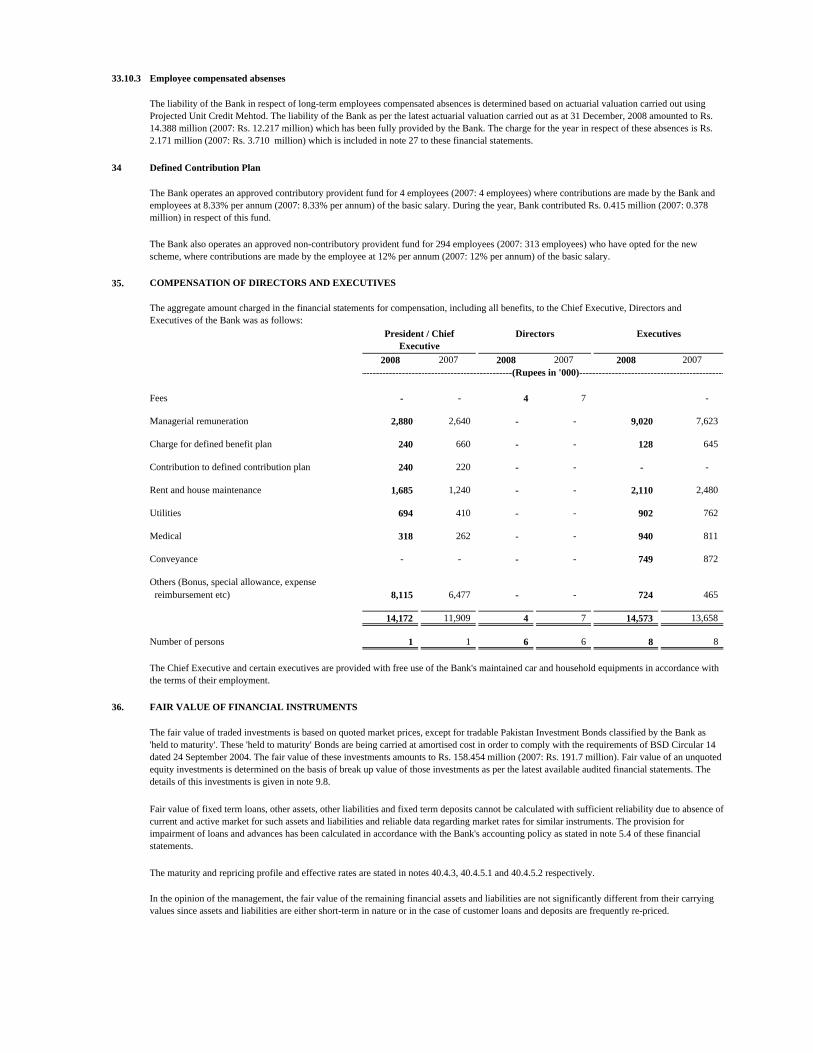
33.10.3 Employee compensated absenses
34 Defined Contribution Plan
35. COMPENSATION OF DIRECTORS AND EXECUTIVES
2008 2007 2008 2007 2008 2007
Fees - - 4 7 -
Managerial remuneration 2,880 2,640 - - 9,020 7,623
Charge for defined benefit plan 240 660 - - 128 645
Contribution to defined contribution plan 240 220 - - - -
Rent and house maintenance 1,685 1,240 - - 2,110 2,480
Utilities 694 410 - - 902 762
Medical 318 262 - - 940 811
Conveyance - - - - 749 872
Others (Bonus, special allowance, expense reimbursement etc) 8,115 6,477 - - 724 465
14,172 11,909 4 7 14,573 13,658
Number of persons 1 1 6 6 8 8
36. FAIR VALUE OF FINANCIAL INSTRUMENTS
The maturity and repricing profile and effective rates are stated in notes 40.4.3, 40.4.5.1 and 40.4.5.2 respectively.
The fair value of traded investments is based on quoted market prices, except for tradable Pakistan Investment Bonds classified by the Bank as 'held to maturity'. These 'held to maturity' Bonds are being carried at amortised cost in order to comply with the requirements of BSD Circular 14 dated 24 September 2004. The fair value of these investments amounts to Rs. 158.454 million (2007: Rs. 191.7 million). Fair value of an unquoted equity investments is determined on the basis of break up value of those investments as per the latest available audited financial statements. The details of this investments is given in note 9.8.
Fair value of fixed term loans, other assets, other liabilities and fixed term deposits cannot be calculated with sufficient reliability due to absence of current and active market for such assets and liabilities and reliable data regarding market rates for similar instruments. The provision for impairment of loans and advances has been calculated in accordance with the Bank's accounting policy as stated in note 5.4 of these financial statements.
In the opinion of the management, the fair value of the remaining financial assets and liabilities are not significantly different from their carrying values since assets and liabilities are either short-term in nature or in the case of customer loans and deposits are frequently re-priced.
The liability of the Bank in respect of long-term employees compensated absences is determined based on actuarial valuation carried out using Projected Unit Credit Mehtod. The liability of the Bank as per the latest actuarial valuation carried out as at 31 December, 2008 amounted to Rs. 14.388 million (2007: Rs. 12.217 million) which has been fully provided by the Bank. The charge for the year in respect of these absences is Rs. 2.171 million (2007: Rs. 3.710 million) which is included in note 27 to these financial statements.
The Bank operates an approved contributory provident fund for 4 employees (2007: 4 employees) where contributions are made by the Bank and employees at 8.33% per annum (2007: 8.33% per annum) of the basic salary. During the year, Bank contributed Rs. 0.415 million (2007: 0.378 million) in respect of this fund.
The Bank also operates an approved non-contributory provident fund for 294 employees (2007: 313 employees) who have opted for the new scheme, where contributions are made by the employee at 12% per annum (2007: 12% per annum) of the basic salary.
The aggregate amount charged in the financial statements for compensation, including all benefits, to the Chief Executive, Directors and Executives of the Bank was as follows:
The Chief Executive and certain executives are provided with free use of the Bank's maintained car and household equipments in accordance with the terms of their employment.
DirectorsPresident / Chief Executive
-----------------------------------------------(Rupees in '000)---------------------------------------------
Executives
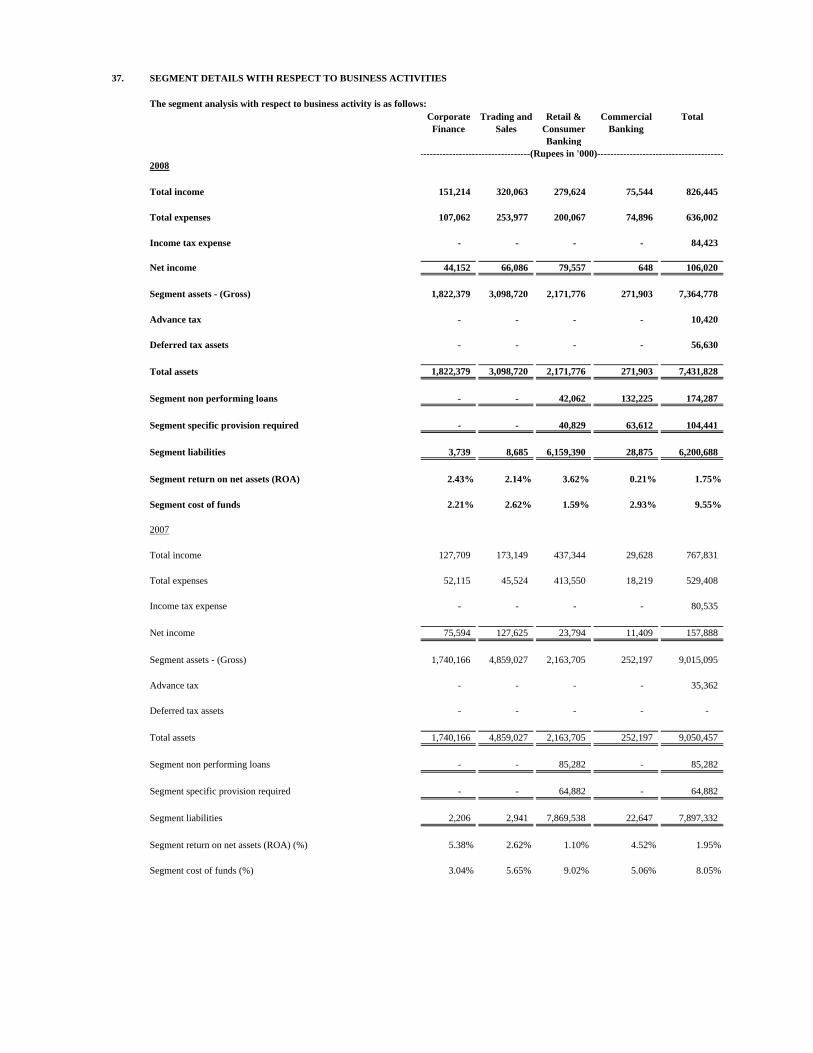
37. SEGMENT DETAILS WITH RESPECT TO BUSINESS ACTIVITIES
The segment analysis with respect to business activity is as follows:Corporate
FinanceTrading and
SalesRetail &
Consumer Banking
Commercial Banking
Total
2008
Total income 151,214 320,063 279,624 75,544 826,445
Total expenses 107,062 253,977 200,067 74,896 636,002
Income tax expense - - - - 84,423
Net income 44,152 66,086 79,557 648 106,020
Segment assets - (Gross) 1,822,379 3,098,720 2,171,776 271,903 7,364,778
Advance tax - - - - 10,420
Deferred tax assets - - - - 56,630
Total assets 1,822,379 3,098,720 2,171,776 271,903 7,431,828
Segment non performing loans - - 42,062 132,225 174,287
Segment specific provision required - - 40,829 63,612 104,441
Segment liabilities 3,739 8,685 6,159,390 28,875 6,200,688
Segment return on net assets (ROA) 2.43% 2.14% 3.62% 0.21% 1.75%
Segment cost of funds 2.21% 2.62% 1.59% 2.93% 9.55%
2007
Total income 127,709 173,149 437,344 29,628 767,831
Total expenses 52,115 45,524 413,550 18,219 529,408
Income tax expense - - - - 80,535
Net income 75,594 127,625 23,794 11,409 157,888
Segment assets - (Gross) 1,740,166 4,859,027 2,163,705 252,197 9,015,095
Advance tax - - - - 35,362
Deferred tax assets - - - - -
Total assets 1,740,166 4,859,027 2,163,705 252,197 9,050,457
Segment non performing loans - - 85,282 - 85,282
Segment specific provision required - - 64,882 - 64,882
Segment liabilities 2,206 2,941 7,869,538 22,647 7,897,332
Segment return on net assets (ROA) (%) 5.38% 2.62% 1.10% 4.52% 1.95%
Segment cost of funds (%) 3.04% 5.65% 9.02% 5.06% 8.05%
----------------------------------(Rupees in '000)---------------------------------------

f


38. RELATED PARTY TRANSACTIONS AND BALANCES
2008 2007 2008 2007 2008 2007 2008 2007A Balances
Deposits
Balance at beginning of the year 923 110 - - 1,619 1,487 6,217 128,865 Deposited during the year 54,079 18,097 - - 22,526 19,143 216,024 92,042 Withdrawn during the year 53,268 17,284 - - 20,895 19,011 154,621 214,690 Balance at end of the year 1,734 923 - - 3,250 1,619 67,620 6,217
Deposits carry mark-up rate at 5% to 15% per annum (2007: 4% per annum).
Mark-up / return / interest expensed 38 13 - 15 32 15 414 2,357
Mark-up payable in local currency 27 4 - 6 25 6 347 87
Advances (secured)
Balance at beginning of the year 5,653 1,224 416,667 116,667 2,044 2,319 309,962 236,320 Loans granted during the year - 4,732 825,727 350,000 2,500 35 429,192 412,245 Repayments received during the year 673 303 1,184,061 50,000 1,159 310 681,366 338,603 Balance at end of the year 4,980 5,653 58,333 416,667 3,385 2,044 57,788 309,962
Advances carry profit rates ranging from 5% to 15.15 % per annum (2007: 5% to 10.99% per annum)
Mark-up / return / interest earned 265 97 52,719 11,302 103 104 23,899 25,278
Mark-up receivable in local currency 186 305 241 5,152 139 135 2,164 7,514
B Other transactions and balances (including profit and loss related transactions)
Balances as at the year end 2008 2007 2008 2007
Cash and balance with treasury bank 32,517 16,368 - -
Balances with other banks 35,659 9,199 - -
Investment in National Institutional FacilitationTechnologies (Private) Limited 954 954 - -
Mark-up receivable in local currency 39 335 - -
MCB ATM settlement account balance 417 417 - -
Receivable from defined benefit plan - - 671 1,808
Payable to defined contribution plan - - - 377
Transactions during the year
Interest income on lendings to financial institutions 3,960 9,705 - -
Interest expense on- Call borrowings - - - - - Repurchase agreement borrowings 3,990 148 - -
148 148 - - Dividend income 6,160 4,037 - -
Charge for retirement benefitsApproved pension fund - - 16,722 16,543 Approved gratuity fund - - 1,028 985 Contributory provident fund - - 415 378
- - 18,165 17,906
Income on Term Finance Certificates - - - -
Other expenses- Cheque processing charges - 2,482 - - - Others - - - -
- 2,482 - -
Remuneration of key management personnel 19,265 15,001 - -
The Bank has related party relationships with associated undertakings, employee benefits, directors and key management personnel and companies with common directors.
Directors Key management personnel Other related parties
Details of advances to the companies or firms in which the directors of the Bank are interested as directors, partners or in case of private companies as members, are given in note 10.5 to these financial statements. There are no transactions with key management personnel other than under their terms of employment. Contributions to and accruals in respect of staff retirement benefit plans are made in accordance with the actuarial valuation / terms of the contribution plan as disclosed in notes 33 and 34. Remuneration to the executives and disposals of vehicles are disclosed in noted 35 and 11.2 to these financial statements. The details of transactions and balances with related parties are as
Associated Undertaking
--------------------------------------------------(Rupees in '000)--------------------------------------------------
--------------------------(Rupees in '000)---------------------------
Associated undertakings Other related parties
39 CAPITAL ADEQUACY
39.1 Capital Management
Objectives and goals of managing capital
The objectives and goals of managing capital of the Bank are as follows:
-
-
-
-
-
i) Available for sale securitiesii) Held to maturity securitiesiii) Other strategic investments, if any
Treasury investments parked in the banking book include:
i) Government securitiesii) Capital market investmentsiii) Strategic investments, if anyiv) Investments in bonds, certificates, etc
The Bank's risk weighted amount for market risk comprise of foreign exchange rate risk, which includes net spot positions, while the Bank does not have any exposure in trading book. Trading book consists of positions in financial instruments held either with trading intent or in order to hedge other elements of the trading book. To be eligible for trading book, financial instruments must be held with the intent of trading and free of any restrictive covenants on their tradability. In addition, positions need to be frequently and accurately valued and the portfolio should be actively managed. However, the Bank has not taken any exposure in the trading book.
All investments excluding trading book are considered as part of banking book, which includes:
Due to the diversified nature of investments in banking book, it is subject to interest rate and equity price risk.
The required capital adequacy ratio (9% of the risk-weighted assets) is tested with reference to the risk weighted exposure of the Bank. It is achieved by the Bank through improvement in the asset quality at the existing volume level, ensuring better recovery management and striking compromise proposal and settlement and composition of asset mix with low risk. Banking operations are categorized as either trading book or banking book and risk-weighted assets are determined according to specified requirements of the State Bank of Pakistan that seek to reflect the varying levels of risk attached to assets and off-balance sheet exposures. The total risk-weighted exposures comprise the credit risk, market risk and operational risk.
The risk weighted amount for operational risk is computed according to basic indicator approach.
On and off-balance sheet assets in the banking book are broken down to various asset classes for calculation of credit risk. Ratings for assets are applied using various ECAI's and aligned with appropriate risk buckets. Collaterals if any, are used as an outflow adjustment. Risk weights notified, are applied at net adjusted exposure. Collaterals used include: Government of Pakistan guarantees for advances and investments in PSE / GOP, deposits / margins, lien on deposits, saving certificates and lending of securities (repo & reverse repo).
The State Bank of Pakistan through its BSD Circular No.19 dated September 05, 2008 requires the minimum paid up capital (net of losses) for banks / development finance institutions to be raised to Rs. 23 billion by the year ending 31 December 2013. The raise is to be achieved in a phased manner requiring Rs.5 billion paid up capital (net of losses) by the end of the financial year 2008. However, the paid up capital of the Bank at 31 December 2008 amounting to Rs. 283.65 million is short of SBP's requirement. The State Bank of Pakistan has granted the Bank an extension for meeting the minimum paid-up capital requirement up to 31 December 2009 (refer note 19.4 for more details).
Tier 1 capital, which includes fully paid up capital (including the bonus shares), general reserves as per the financial statements and net un-appropriated profits, etc after deductions for deficit on revaluation of available for sale investments, if any.
Tier 2 capital, which includes general provisions for loan losses (up to a maximum of 1.25 % risk weighted assets), reserves on the revaluation of fixed assets and equity investments (up to a maximum of 45 % of the balance in the related revaluation reserves).
Tier 3 capital has also been prescribed by the State Bank of Pakistan. However the Bank doesnot have any Tier 3 capital.
Bank’s regulatory capital is analysed into two tiers:
The Capital of the Bank is managed keeping in view the minimum “Capital Adequacy Ratio” required by SBP through BSD Circular No. 30 dated November 25, 2008. The adequacy of the capital is tested with reference to the risk-weighted assets of the Bank. The Bank is required to manage its capital based on Basel II accord under the standardised approach and the Bank is complying with reporting of calculating the capital requirement under this basis.
Statutory minimum capital requirement and management of capital
maintain strong ratings and to protect the Bank against unexpected events;
availability of adequate capital (including the quantum) at a reasonable cost so as to enable the Bank to expand; and
achieve low overall cost of capital with appropriate mix of capital elements.
31 December 31 December 2008 2007
Un-Audited39.2 Tier I Capital
Shareholders' equity /Assigned Capital 283,650 283,650 Reserves 228,540 207,336 Unappropriated profits (Net of Losses) 623,610 537,130
Less: Book value of intangibles (6,988) (8,735) Shortfall in provisions required against classified assets irrespective of relaxation allowed - - Deficit on account of revaluation of investments held in AFS category (171,799) -
(178,787) (8,735) Total Tier I Capital 957,013 1,019,381
Tier II Capital General Provisions subject to 1.25% of Total Risk Weighted Assets 1,071 1,193 Revaluation Reserve (upto 45%) 48,208 34,253 Total Tier II Capital 49,279 35,446
Eligible Tier III Capital - -
Total Regulatory Capital Base 1,006,292 1,054,827
39.3 Risk Weighted Exposures
31 December 31 December 31 December 31 December 2008 2007 2008 2007
Un-Audited Un-AuditedCredit RiskPortfolios subject to standardized approach (Simple or Comprehensive)On- Balance Sheet
(a) 156,523 148,605 - - (b) 2,476,607 3,166,896 - - (c) 85,502 41,215 - - (d)
- - - - (e)
- - - - (f) - - - - (g) 5,927 7,000 2,964 3,500 (h) 68,593 25,984 13,719 5,197 (i) 366,914 375,176 73,383 75,035 (j) 123,132 145,000 4,648 29,000 (k) 3,170,505 3,729,632 2,661,259 1,795,801 (l) 483,812 615,301 361,923 274,704 (m) 18,704 383,277 6,547 134,147 (n)
1
- - - - 1.1 - - - - 1.2 69,845 20,400 69,845 20,400 1.3 - - - - 2
- - - - 3
- - - - (o)
3,232 4,350 3,232 4,350 (p) 954 954 1,431 1,431 (q) - - - - (r) 167,845 139,951 167,845 139,951 (s) - - - - (t) 69,060 174,294 69,060 174,294
7,267,155 8,978,035 3,435,856 2,657,810
Off- Balance Sheet - Non Market related Exposures41,820 41,465 21,387 39,635
6,191 2,916 15 - 48,011 44,381 21,402 39,635
Equity Exposure Risk in the Banking BookEquity portfolio subject to market-based approachesUnder simple risk weight method - - - -
Total Credit Risk (A) 7,315,166 9,022,416 3,457,258 2,697,445
Market Risk
Capital Requirement for portfolios subject to Standardized ApproachInterest rate risk - - - - Equity position risk etc. - - - - Capital Requirement for portfolios subject to Internal Models Approach
Interest rate risk - - - - Foreign exchange risk, etc. 7,090 4,239 88,625 52,983
7,090 4,239 88,625 52,983
Total Market Risk (B) 7,090 4,239 88,625 52,983
Operational Risk
Basic Indicator Approach-Total of operational risk (C ) 80,306 73,508 1,003,825 918,852
TOTAL of A + B + C 7,402,562 9,100,163 4,549,708 3,669,280
Direct Credit Substitutes/ Lending of securities or posting of securities as collateral Trade Related contingencies/Other Commitments with original maturity of one year or less
Listed Equity investments and regulatory capital instruments issued by other banks (other than those deducted from capital) held in the banking book.Unlisted equity investments (other than that deducted from capital) held in banking bookInvestments in venture capitalInvestments in premises, plant and equipment and all other fixed assets
All other assetsClaims on all fixed assets under operating lease
where specific provisions are no less than 20 per cent of the outstanding amount of the past due claim.where specific provisions are more than 50 per cent of the outstanding amount of the past due claim.Loans and claims fully secured against eligible residential mortgages that are past due for more than 90days and/or impairedLoans and claims fully secured against eligible residential mortgage that are past due by 90 days and /orimpaired and specific provision held thereagainst is more than 20% of outstanding amount
The unsecured portion of any claim (other than loans and claims secured against eligible residentialmortgages as defined in section 2.1 of circular 8 of 2006) that is past due for more than 90 days and/orimpaired:
where specific provisions are less than 20 per cent of the outstanding amount of the past due claim.
Claims fully secured by residential propertyPast Due loans:
Claims, denominated in foreign currency, on banks with original maturity of 3 months or lessClaims on banks with original maturity of 3 months or less denominated in PKR and funded in PKRClaims on Corporates (excluding equity exposures)Claims categorized as retail portfolio
Claims on Bank for International Settlements, International Monetary Fund, European Central Bank, and European CommunityClaims on Multilateral Development BanksClaims on Public Sector Entities in PakistanClaims on Banks
Rupees in '000
Capital Requirements Risk Weighted Assets
Rupees in '000
Cash and Cash EquivalentsClaims on Government of Pakistan (Federal or Provincial Governments) and SBP, denominated in PKRForeign Currency claims on SBP arising out of statutory obligations of banks in PakistanClaims on other sovereigns and on Government of Pakistan or provincial governments or SBP denominated in currencies other than PKR
31 December 31 December2008 2007
Un-AuditedCapital Adequacy Ratio
Total eligible regulatory capital held (Note 41.2) (a) 1,006,292 1,054,827
Total Risk Weighted Assets (Note 41.3) (b) 4,549,708 3,669,280
Capital Adequacy Ratio (a) / (b) 22.12% 28.75%
39.4 Types of exposures and External Credit Assessment Institutions (ECAIs) used
Exposures JCR-VIS PACRA
Corporate Yes YesBanks Yes YesSovereigns - -SME's - -Securitizations - -Others Yes Yes
39.5 Credit exposures subject to Standardized Approach
Rating Category
Amount Outstanding
Deduction CRM Net Amount Amount
Outstanding Deduction CRM Net Amount
Corporate 1 24,191 - 24,191 1,167,474 117,776 1,049,698 2 226,693 - 226,693 400,000 - 400,000
3 , 4 153,335 - 153,335 317,216 - 317,216 5 , 6 - - - - - -
Claims on banks with original maturity of 3 months or less 123,132 99,892 23,240 145,000 - 145,000
Retail 483,812 1,249 482,563 615,301 249,029 366,272
Public sector entities 1 - - - - - - 2,3 - - - - - - 4,5 - - - - - - 6 - - - - - -
Others 3,442,405 - 3,442,405 4,434,526 - 4,434,526
Unrated 2,844,235 376,547 2,467,688 1,898,518 776,297 1,122,221
40. RISK MANAGEMENT
40.1 Credit risk
40.2 Concentration of credit and deposit
2008 2007
Investments 2,153,954 2,570,426
Mark-up receivable on government guaranteed financial assets 27,148 29,526
Cash and balances with the State Bank of Pakistan 386,889 644,684
Risk Management is a process consisting of well-defined steps, which support better decision making by contributing to a greater insight into risks and their impacts. The Bank has in place the “Basic Framework & Policy Guidelines”, which cover organizational set up and functions of Risk Management Department (RMD). Risk management processes help to improve safety, quality and performance of activities. The Bank intends to further augment its RMD in line with the regulatory requirements, etc.
Credit risk is the possibility that a borrower or counter party will fail to meet its obligations in accordance with agreed terms. The Bank’s Credit Manual contains detailed procedures and guidelines to address credit risk methodology for identifying, assessing, monitoring and mitigating the risk factors. The credit manual is under process of implementation and it will be followed in conjunction with risk based lending approach.
The Bank’s policies and procedures on Country Risk Management have been approved by the Board of Directors.
Credit risk is the risk that one party to a financial instrument will fail to discharge an obligation and cause the other party to incur a financial loss. Credit risk is monitored, reviewed and analysed by Asset and Liability Management Committee (ALCO), which has established credit lines and credit limits to control exposure to counter parties. Investments are made only in instruments with good credit ratings.
Out of the total financial assets of Rs. 7,045.547 million (2007: 8,796.479 million), the financial assets which were subject to credit risk amounted to Rs. 4,495.313 million (2007: Rs. 5,957.736 million). To manage credit risk the Bank applies credit limits to its customers and obtains adequate collateral.
The following financial assets are guaranteed by the Federal / Provincial Government or the State Bank of Pakistan.
(Rupees in '000)
Exposures
31 December 2008
31 December 2007
Un-Audited----------------------------------------------------Rupees in '000------------------------------------------------
31 December 2008

40.3 Segmental information
40.3.1 Segments by class of business
(Rupees Percent (Rupees Percent (Rupees Percent in '000) (%) in '000) (%) in '000) (%)
Agriculture, forestry, hunting and fishing 56,608 1.66 5,291 0.09 - - Textile 139,963 4.10 39,156 0.66 161,275 79.45 Chemical and pharmaceuticals 27,899 0.82 7,965 0.13 10,793 5.44 Cement 75,981 2.23 - - - - Production and Transmission of Energy 144,720 4.24 224,743 3.78 - - Footwear and leather garments 79,835 2.34 - - - - Whloesale and Retail Trade 110,235 3.23 81,327 1.37 3,010 1.52 Electronics and electrical appliances 200,921 5.89 4,150 0.07 - - Construction 777,177 22.79 81,796 1.38 25 0.01 Transport, storage and communication 28,309 0.83 1,068 0.02 11,718 5.91 Financial 94,735 2.78 206 0.00 - - Services/ Social Development and Education 795,398 23.33 572,351 9.64 25 0.01 Individuals 57,379 1.68 2,718,925 45.78 9,985 5.03 Others 820,682 24.07 2,202,330 37.08 5,217 2.63
3,409,842 100.00 5,939,308 100.00 202,048 100.00 3409842 5939308 202048.332
(Rupees Percent (Rupees Percent (Rupees Percent in '000) (%) in '000) (%) in '000) (%)
Agriculture, forestry, hunting and fishing 95,818 3.06 37,299 0.49 - - Textile 240,144 7.67 15,005 0.20 163,350 82.33 Chemical and pharmaceuticals 81,421 2.60 8,230 0.11 739 0.37 Cement 419,926 13.42 - - 25 0.01 Production and Transmission of Energy 187,509 5.99 1,205,069 15.92 - - Footwear and leather garments 7,453 0.24 - - 275 0.14 Whloesale and Retail Trade 54,250 1.73 79,431 1.05 - - Electronics and electrical appliances 120,274 3.84 2,712 0.04 48 0.02 Construction - - 48,473 0.64 5,563 2.80 Transport, storage and communication 31,242 1.00 1,530 0.02 397 0.20 Financial 567,956 18.15 210 0.00 - - Services/ Social Development and Education 499,718 15.97 866,979 11.45 505 0.25 Individuals 277,746 8.87 2,825,149 37.32 2,051 1.03 Others 546,125 17.45 2,478,972 32.75 25,465 12.83
3,129,582 100.00 7,569,059 100.00 198,418 100.00
40.3.2 Segment by sector
(Rupees Percent (Rupees Percent (Rupees Percent in '000) (%) in '000) (%) in '000) (%)
Public / government - - 1,389,603 23.40 40,739 20.16 Private 3,409,842 100.00 4,549,705 76.60 161,309 79.84
3,409,842 100.00 5,939,308 100.00 202,048 100.00
(Rupees Percent (Rupees Percent (Rupees Percent in '000) (%) in '000) (%) in '000) (%)
Public / government - - 2,801,553 37.01 43,664 22.01 Private 3,129,582 100.00 4,767,506 62.99 154,754 77.99
3,129,582 100.00 7,569,059 100.00 198,418 100.00
Advances (gross) Deposits Contingencies and commitments
Advances (gross) Deposits Contingencies and commitments
2008
Advances (gross) Deposits Contingencies and commitments
Segmental information is presented in respect of the class of business and geographical distribution of advances (gross), deposits, contingencies and commitments. The details are as follows:
2007
2007
Advances (gross) Deposits Contingencies and commitments
2008

40.3.3 Details of non-performing advances and specific provisions by class of business segment
Classified Specific Classified Specific advances provision advances provision
held held
Agriculture, Forestry, Hunting & Fishing 2,140 2,140 2,142 2,142 Textile & Garment 20,513 20,513 20,812 20,812 Chemical and Pharmaceuticals 153 153 153 153 Sugar 2,225 1,113 - - Footwear and Leather garments 1,759 635 260 260 Electronics and electrical appliances - - 2,439 2,439 Construction 1,000 1,000 1,676 1,676 Electricity, Gas, Water, Sanitary 90,000 22,500 - - Wholesale and Retail Trade 4,061 3,985 4,448 4,448 Exports/Imports 2,811 2,811 3,812 3,812 Transport, Storage and Communication 1,905 1,905 1,905 1,905 Services 344 344 2,880 2,880 Individuals 1,399 1,399 1,873 1,873 Others 45,977 45,943 42,882 22,482
174,287 104,441 85,282 64,882
40.3.4 Details of non-performing advances and specific provisions by sector
Private 174,287 104,441 85,282 64,882
40.3.5 Geographical segment analysis
Profit before Total assets Net assets Contingenciestaxation employed employed and
commitments
Pakistan 190,443 7,303,721 1,103,033 202,048
Profit before Total assets Net assets Contingenciestaxation employed employed and
commitments
Pakistan 238,422 8,985,576 1,088,244 198,418
Total assets employed include intra group items of Rs. nil (2007: Rs. nil).
40.4 Market risk management
Market risk is the risk of loss arising from movements in market variables, such as interest rates, exchange rates and equity indices, etc. Concentration limits and other controls are applied through various checks and controls.
The Asset and Liability Management Committee (ALCO) of the Bank is responsible for reviewing policies relating to risk assets, primarily in lending and treasury related transactions as well as in reviewing/ approving the procedures, setting of limits, monitoring and implementation as per Board’s approved policies.
Procedural guidelines for covering the risks involved in various types of financing and customers’ transactions are being followed to ensure customers’ due diligence.
---------------------------(Rupees in '000)---------------------------
2008
2007
2008 2007
---------------------------(Rupees in '000)---------------------------
---------------------------(Rupees in '000)---------------------------

40.4.1 Foreign exchange risk management
Assets Liabilities Off-balance Net foreignsheet items currency
exposure
Pakistan Rupee 6,823,224 5,812,503 - 1,010,721
United States Dollar 468,164 376,714 - 91,450
Pound Sterling 7,855 10,354 - (2,499)
Japanese Yen 43 - - 43
Euro 4,368 1,117 - 3,251
Other currencies 67 - - 67
7,303,721 6,200,688 - 1,103,033
Assets Liabilities Off-balance Net foreignsheet items currency
exposure
Pakistan Rupee 8,556,685 7,524,199 - 1,032,486
United States Dollar 425,421 372,791 - 52,630
Pound Sterling 1,561 342 - 1,219
Japanese Yen 71 - - 71
Euro 1,704 - - 1,704
Other currencies 134 - - 134
8,985,576 7,897,332 - 1,088,244
40.4.2 Equity price risk
Equity price risk arises, primarily in trading book, due to changes in process of individual stocks or levels of equity indices. The Bank's existing equity book primarily comprises of available for sale portfolio, which is maintained with a medium term view of capital gains and higher dividend yields. Equity price risk is managed by applying nominal limits on individual scrips and on portfolio basis. The portfolio is also diversified to minimize the risk.
A number of developments are underway more particularly for operational and credit risk areas. Information technology infrastructure is being developed so as to strengthen the monitoring capacity as well as to keep pace with the modern banking facilities.
The management ensures all policies and procedures are regularly reviewed with a view to have full compliance with SBP guidelines as far as feasible and practicable with a view to ensure an efficient and effective system.
---------------------------(Rupees in '000)---------------------------
2008
Main objective of foreign exchange risk management is to ensure that foreign exchange exposure of the Bank remains within the defined risk appetite (15% of the paid up capital). Daily reports are generated to evaluate the exposure in different currencies. Details of the Bank's currency risk exposure are as follows:
2007
---------------------------(Rupees in '000)---------------------------
40.4.3 Mismatch of interest rate sensitive assets and liabilities
Effective Total Not exposedyield / Up to Over 1 Over 3 Over 6 Over 1 Over 2 Over 3 Over 5 Above to yield /
interest 1 month to 3 to 6 months to to 2 to 3 to 5 to 10 10 years interestrate months months 1 year years years years years risk
On-balance sheet financial instruments
AssetsCash and balances with treasury banks 0.90% 575,929 63,279 - - - - - - - - 512,650
Balances with other banks 5.89% 400,761 328,740 - - - - - - - - 72,021
Lendings to financial institutions 16.12% 350,849 127,933 9,702 21,447 191,767 - - - - - -
Investments - net 10.92% 2,264,088 99,546 781,046 62,356 - 30,016 669,705 531,549 36,424 - 53,446
Advances - net 14.76% 3,304,330 2,641,242 19,953 61,140 104,872 307,506 66,284 59,694 17,756 25,883 -
Other assets - net - 149,590 - - - - - - - - - 149,590 7,045,547 3,260,740 810,701 144,943 296,639 337,522 735,989 591,243 54,180 25,883 787,707
LiabilitiesBills payable - 101,993 - - - - - - - - - 101,993
Borrowings 6.50% 27,140 27,140 - - - - - - - - -
Deposits and other accounts 5% - 15% 5,939,308 4,082,554 31,378 199,833 82,277 25,856 17,530 51,334 1,608 605 1,446,333
Other liabilities - 117,859 - - - - - - - - - 117,859 6,186,300 4,109,694 31,378 199,833 82,277 25,856 17,530 51,334 1,608 605 1,666,185
On-balance sheet gap 859,247 (848,954) 779,323 (54,890) 214,362 311,666 718,459 539,909 52,572 25,278 (878,478)
Off-balance sheet financial instruments
Commitments to extend credit - - - - - - - - - - - -
Off-balance sheet gap - - - - - - - - - - -
Total yield / interest risk sensitivity gap (848,954) 779,323 (54,890) 214,362 311,666 718,459 539,909 52,572 25,278
Cumulative yield / interest risk sensitivity gap (848,954) (69,631) (124,521) 89,841 401,507 1,119,966 1,659,875 1,712,447 1,737,725
Effective Total Not exposedyield / Up to Over 1 Over 3 Over 6 Over 1 Over 2 Over 3 Over 5 Above to yield /interest 1 month to 3 to 6 months to to 2 to 3 to 5 to 10 10 years interest
rate months months 1 year years years years years risk
On-balance sheet financial instruments
AssetsCash and balances with treasury banks 3.68% 809,657 19,220 - - - - - - - - 790,437
Balances with other banks 5.00% 384,792 124,000 204,600 - - - - - - - 56,192
Lendings to financial institutions 10.50% 1,245,000 1,245,000 - - - - - - - - -
Investments - net 9.43% 3,159,640 199,488 695,842 95,862 587,045 - 802,286 554,234 161,220 - 63,663
Advances - net 11.26% 3,063,507 2,135,014 4,517 73,238 171,968 141,178 246,106 257,779 19,473 17,234 -
Other assets - net - 135,597 - - - - - - - - - 135,597 8,798,193 3,722,722 904,959 169,100 759,013 141,178 1,048,392 812,013 180,693 17,234 1,045,889
LiabilitiesBills payable - 193,321 - - - - - - - - - 193,321
Borrowings 8.20% 21,543 - 17,920 3,623 - - - - - - -
Deposits and other accounts 2.38% 7,569,059 5,279,415 115,610 30,017 90,881 25,014 15,426 39,816 - - 1,972,880
Other liabilities - 95,493 - - - - - - - - - 95,493 7,879,416 5,279,415 133,530 33,640 90,881 25,014 15,426 39,816 - - 2,261,694
On-balance sheet gap 918,777 (1,556,693) 771,429 135,460 668,132 116,164 1,032,966 772,197 180,693 17,234 (1,215,805)
Off-balance sheet financial instruments
Commitments to extend credit - - - - - - - - - - - -
Off-balance sheet gap - - - - - - - - - - -
Total yield / interest risk sensitivity gap (1,556,693) 771,429 135,460 668,132 116,164 1,032,966 769,197 180,693 17,234
Cumulative yield / interest risk sensitivity gap (1,556,693) (785,264) (649,804) 18,328 134,492 1,167,458 1,936,655 2,117,348 2,134,582
2007Exposed to yield / interest risk
-------------------------------------------------------------------------------------(Rupees in '000)-----------------------------------------------------------------------------------------
Yield / interest rate sensitivity position for on-balance sheet instruments is based on the earlier of contractual re-pricing or maturity date and for off-balance sheet instruments is based on settlement date.
2008Exposed to yield / interest risk
-------------------------------------------------------------------------------------(Rupees in '000)----------------------------------------------------------------------------------------

The reconciliation of - total assets and total financial assets; and - total liabilities and total financial liabilities is as follows:
2008 2007 2008 2007(Rupees in '000) (Rupees in '000)
Reconciliation to total assets Reconciliation to total liabilities
Balance as per balance sheet 7,303,721 8,985,576 Balance as per balance sheet 6,200,688 7,897,332
Less: Non-financial assets Less: Non-financial liabilities
Operating fixed assets 174,833 148,686 Other liabilities 14,388 6,916 Deferred tax assets 56,630 - Deffered Tax liability - 11,000 Other assets 26,711 38,697 14,388 17,916
258,174 187,383
Total financial assets 7,045,547 8,798,193 Total financial liabilities 6,186,300 7,879,416
40.4.4 Liquidity risk
40.4.5 Maturities of assets and liabilities
40.4.5.1 Maturities of assets and liabilities - Based on contractual maturity of the assets and liabilities of the Bank
Total Up to 1 Over 1 Over 3 Over 6 Over 1 Over 2 Over 3 Over 5 Above month to 3 to 6 months to to 2 to 3 to 5 to 10 10 years
months months 1 year years years years years
AssetsCash and balances with treasury banks 575,929 575,929 - - - - - - - - Balances with other banks 400,761 400,761 - - - - - - - - Lendings to financial institutions 350,849 127,933 9,702 21,447 191,767 - - - - - Investments - net 2,264,088 152,036 781,046 - - 30,017 705,281 558,330 36,423 955 Advances - net 3,304,330 2,641,242 19,953 61,140 104,872 307,506 66,284 59,694 17,756 25,883 Operating fixed assets 174,833 1,142 2,256 3,384 6,770 12,399 11,697 22,212 33,826 81,147 Deferred tax assets 86,090 - 743 - - - 1,147 36,055 42,413 5,732 Other assets - net 176,301 124,129 25,400 1,715 14,857 10,200 - - - -
7,333,181 4,023,173 839,100 87,687 318,266 360,122 784,409 676,291 130,418 113,717
LiabilitiesBills payable 101,993 101,993 - - - - - - - - Borrowings 27,140 - - 27,140 - - - - - - Deposits and other accounts 5,939,308 5,528,887 31,378 199,833 82,277 25,856 17,530 51,334 1,608 605 Deferred tax liabilities 29,460 123 245 368 737 1,473 1,473 2,946 7,365 14,730 Other liabilities 132,247 105,794 - - 4,639 - - 7,573 14,241 -
6,230,148 5,736,797 31,623 227,341 87,653 27,329 19,003 61,853 23,214 15,335
Net assets 1,103,033 (1,713,625) 807,477 (139,655) 230,613 332,793 765,406 614,438 107,204 98,382
Share capital 283,650 Reserves 228,540 Unappropriated profit 623,610 Surplus on revaluation of assets - net of tax (32,767)
1,103,033
Total Up to 1 Over 1 Over 3 Over 6 Over 1 Over 2 Over 3 Over 5 Above month to 3 to 6 months to to 2 to 3 to 5 to 10 10 years
months months 1 year years years years years
AssetsCash and balances with treasury banks 809,657 809,657 - - - - - - - - Balances with other banks 384,792 180,192 204,600 - - - - - - - Lendings to financial institutions 1,245,000 1,245,000 - - - - - - - - Investments - net 3,159,640 254,197 695,841 95,862 587,047 - 800,539 563,981 161,219 954 Advances - net 3,063,507 2,115,014 24,517 73,238 171,968 141,178 246,106 254,779 19,473 17,234 Operating fixed assets 148,686 - - - - 25 2,486 15,194 39,255 91,726 Deferred tax assets 8,347 - - - 1,918 - - 6,429 - - Other assets - net 174,294 75,999 24,350 34,953 1,712 6,554 2,072 26,941 1,713 -
8,993,923 4,680,059 949,308 204,053 762,645 147,757 1,051,203 867,324 221,660 109,914
LiabilitiesBills payable 193,321 193,321 - - - - - - - - Borrowings 21,543 17,920 3,623 - - - - - - Deposits and other accounts 7,569,059 7,235,866 118,895 32,207 93,071 26,109 18,163 42,554 1,534 660 Deferred tax liabilities 19,347 96 912 1,008 1,295 2,591 1,470 - 10,536 1,439 Other liabilities 102,409 86,829 - - - - - 3,202 161 12,217
7,905,679 7,516,112 137,727 36,838 94,366 28,700 19,633 45,756 12,231 14,316
Net assets 1,088,244 (2,836,053) 811,581 167,215 668,279 119,057 1,031,570 821,568 209,429 95,598
Share capital 283,650 Reserves 207,336 Unappropriated profit 537,130 Surplus on revaluation of assets - net of tax 60,128
1,088,244
The below mentioned maturity profile has been prepared on the basis of contractual maturities. The management believes that such a maturity analysis does not reveal the expectematurity of current and saving deposits as a contractual maturity analysis of deposits alone does not provide information about the conditions expected in normal circumstances. The maturity profile disclosed in note 40.4.5.2 that includes maturities of current and saving deposits determined by the Asset and Liability Management Committee (ALCO) keeping in view historical withdrawal pattern of these deposits reflects a more meaningful analysis of the liquidity risk of the bank.
2008
----------------------------------------------------------------------------(Rupees in '000)----------------------------------------------------------------------------
2007
-------------------------------------------------------------------------------------------------(Rupees in '000)-----------------------------------------------------------------------------------------------
Yield risk is the risk of decline in earnings due to adverse movement of the yield curve.
Interest rate risk is the risk that the value of the financial instrument will fluctuate due to changes in the market interest rates.
Liquidity risk is defined as the potential loss arising from the Bank’s inability to meet its own contractual obligations, when due. The liquidity risk is managed through a framework of liquidity policies, controls and limits. These policies and controls ensure that the Bank maintains diversified sources of funding to meet its contractual obligations.

40.4.5.2 Maturities of assets and liabilities - Based on working prepared by the Asset and Liability Management Committee (ALCO) of the Bank
Total Up to 1 Over 1 Over 3 Over 6 Over 1 Over 2 Over 3 Over 5 Above month to 3 to 6 months to to 2 to 3 to 5 to 10 10 years
months months 1 year years years years years
Assets
Cash and balances with treasury banks 575,929 575,929 - - - - - - - -
Balances with other banks 400,761 400,761 - - - - - - - -
Lendings to financial institutions 350,849 127,933 9,702 21,447 191,767 - - - - -
Investments - net 2,264,088 152,036 781,046 - - 30,017 705,281 558,330 36,423 955
Advances - net 3,304,330 2,641,242 19,953 61,140 104,872 307,506 66,284 59,694 17,756 25,883
Operating fixed assets 174,833 1,142 2,256 3,384 6,770 12,399 11,697 22,212 33,826 81,147
Deferred tax assets 86,090 - 743 - - - 1,147 36,055 42,413 5,732
Other assets - net 176,301 124,129 25,400 1,715 14,857 10,200 - - - - 7,333,181 4,023,173 839,101 87,687 318,266 360,122 784,409 676,291 130,418 113,717
Liabilities
Bills payable 101,993 101,993 - - - - - - - -
Borrowings 27,140 - - 27,140 - - - - - - Deposits and other accounts 5,939,308 5,391,744 47,246 223,264 112,330 50,956 32,963 78,415 1,730 660 Deferred tax liabilities 29,460 123 245 368 737 1,473 1,473 2,946 7,365 14,730
Other liabilities 132,247 105,794 - - 4,639 - - 7,573 14,241
6,230,148 5,599,654 47,491 250,772 117,706 52,429 34,436 88,934 23,336 15,390
Net assets 1,103,033 (1,576,482) 791,610 (163,086) 200,560 307,693 749,973 587,357 107,082 98,327
Share capital 283,650 Reserves 228,540 Unappropriated profit 623,610 Surplus on revaluation of assets - net of tax (32,767)
1,103,033
Total Up to 1 Over 1 Over 3 Over 6 Over 1 Over 2 Over 3 Over 5 Above month to 3 to 6 months to to 2 to 3 to 5 to 10 10 years
months months 1 year years years years years
Assets
Cash and balances with treasury banks 809,657 809,657 - - - - - - - -
Balances with other banks 384,792 180,192 204,600 - - - - - - -
Lendings to financial institutions 1,245,000 1,245,000 - - - - - - - -
Investments - net 3,159,640 254,199 695,841 95,862 587,045 - 800,539 563,981 161,219 954
Advances - net 3,063,507 2,115,014 24,517 73,238 171,968 141,178 246,106 254,779 19,473 17,234
Operating fixed assets 148,686 - - - - 25 2,486 15,194 39,255 91,726
Deferred tax assets 8,347 - - - 1,918 - - 6,429 - -
Other assets - net 174,294 75,999 24,350 34,953 1,712 6,554 2,072 26,941 1,713 - 8,993,923 4,680,061 949,308 204,053 762,643 147,757 1,051,203 867,324 221,660 109,914
Liabilities
Bills payable 193,321 193,321 - - - - - - - -
Borrowings 21,543 - 17,920 3,623 - - - - - -
Deposits and other accounts 7,569,059 1,087,178 671,810 747,917 808,781 644,214 1,381,326 1,327,617 658,758 241,458
Deferred tax liabilities 19,347 96 912 1,008 1,295 2,591 1,470 10,536 1,439
Other liabilities 102,409 86,829 - - - - - 3,202 161 12,217
7,905,679 1,367,424 690,642 752,548 810,076 646,805 1,382,796 1,330,819 669,455 255,114
Net assets 1,088,244 3,312,637 258,666 (548,495) (47,433) (499,048) (331,593) (463,495) (447,795) (145,200)
Share capital 283,650 Reserves 207,336 Unappropriated profit 537,130 Surplus on revaluation of assets - net of tax 60,128
1,088,244
------------------------------------------------------------------------------------------------(Rupees in '000)------------------------------------------------------------------------------------------------
Current and savings deposits do not have any contractual maturity therefore, current deposits and savings accounts have been classified between all nine maturities. Further, it has been assumed that on a going concern basis, these deposits are not expected to fall below the current year's level
----------------------------------------------------------------------------(Rupees in '000)----------------------------------------------------------------------------
2007
2008

40.4.6 Operational Risk
41. DATE OF AUTHORISATION FOR ISSUE
__________________ _______________Chief Financial Officer President and
Chief Executive
_______________ __________ __________ __________President and Director Director Director
Chief Executive
Operational risk is the risk resulting from inadequate or failed internal processes, people system or from external events. This risk arises from operational risk is the risk of inadequate documentation, legal or regulatory incapacity and uncertainty in enforcement of contracts. Procedural guidelines have been issued down the line. Necessary information / guidelines for Know Your Customer (KYC) compliance have also been issued by the Bank.
These financial statements were authorised for issue by the Board of Directors of the Bank in their meeting held on ___________.

STATEMENT SHOWING WRITTEN-OFF LOANS OR ANY OTHER FINANCIAL RELIEF Annexure - I
FIVE HUNDRED THOUSAND OR ABOVE FROM 01 JANUARY 2008 TO 31 DECEMBER 2008
(Rupees)
Name and address of Name of individual/ Father's/ Principal Mark-up Other
the borrower partners/directors Husband's Principal Mark-up Others Total Written- Waived Financial
with NIC no. name off Relief
Provided
K.J. Computers Perveen Habibullah Jang Habibullah 2,999,886 1,395,158 120,484 4,515,528 - 655,978 90,550 746,528
56-A New Office 138 Jang
Queens Road 7th street DHA
Lalazar drive Phase 1, Karachi
Karachi 510-56-317433
Total 2,999,886 1,395,158 120,484 4,515,528 - 655,978 90,550 746,528
Total
Outstanding Liability at the beginning of Year