Embed Size (px)
Citation preview
A French corporation with share capital of EUR 576.780.702.50 Head office: 29 boulevard Haussmann 75009 PARIS 552 120 222 R.C.S. PARIS
FIRST UPDATE TO THE 2007 REGISTRATION DOCUMENT
Registration document filed with the AMF (French Securities Regulator) on March 6th 2007 under No. D.07-0146
Amendment to the Registration document filed with the AMF (French Securities Regulator) on March 26th 2007 under No. D.07-0146-R01
This document is a full translation of the original French text.
The original update was filed with the AMF (French Securities Regulator) on May 25th 2007. Only the French version is legally binding.
CONTENTS Update of the 2007 Registration Document by chapter
I. Chapter 1: History and Profile of Société Générale ....................................... 3 1.1 CHANGE IN THE RATING AGENCIES’ LONG-TERM RATING............................................ 3
II. Chapter 2: Group Strategy ............................................................................... 3 2.1 ANNOUNCED INVESTMENTS...................................................................................... 3 2.2 OTHER EVENTS SUBSEQUENT TO THE SUBMISSION OF THE REGISTRATION DOCUMENT 4
III. Chapter 5: Corporate Governance .................................................................. 5 3.1 GENERAL MEETING OF SHAREHOLDERS HELD ON MAY 14TH 2007 ............................ 5 3.2 BOARD OF DIRECTORS AT MAY 14TH 2007............................................................... 5 3.3 GENERAL MANAGEMENT .......................................................................................... 6 3.4 STOCK-OPTIONS PLANS AND FREE SHARES............................................................... 7
IV. Chapter 9: Risk Factors.................................................................................... 8 4.1 PROVISIONING OF DOUBTFUL LOANS......................................................................... 8 4.2 CHANGE IN TRADING VAR ........................................................................................ 9
V. Chapter 10: financial information .................................................................. 10 5.1 EVOLUTION OF SOCIÉTÉ GÉNÉRALE CORPORATE & INVESTMENT BANKING’S FINANCIAL
DISCLOSURE.......................................................................................................... 10 5.2 FIRST QUARTER 2007 RESULTS.............................................................................. 11 5.3 PRUDENTIAL RATIO MANAGEMENT .......................................................................... 32
VI. Chapter 11: Legal information ....................................................................... 33 6.1 AMENDMENT TO SOCIÉTÉ GÉNÉRALE’S BY-LAWS .................................................... 33
VII. Person responsible for the update to the registration document .............. 35 7.1 PERSON RESPONSIBLE FOR THE UPDATE TO THE REGISTRATION DOCUMENT............ 35 7.2 CERTIFICATION OF THE PERSON RESPONSIBLE FOR THE UPDATE TO THE REGISTRATION
DOCUMENT............................................................................................................ 35 7.3 PERSONS RESPONSIBLE FOR THE AUDIT OF THE FINANCIAL STATEMENTS................. 36
VIII. Cross-reference table ..................................................................................... 37
Rankings: the sources for all references to rankings are given explicitly, where they are not, rankings are based on internal sources.
2/39
I. CHAPTER 1: HISTORY AND PROFILE OF SOCIÉTÉ GÉNÉRALE
1.1 Change in the rating agencies’ long-term rating On May 11th 2007, Moody’s raised its long-term counterparty credit rating on Société Générale from Aa2 to Aa1. As a reminder, the Group is rated AA by Standard & Poor’s since November 2006 and AA by Fitch since May 2006.
II. CHAPTER 2: GROUP STRATEGY
2.1 Announced investments
• Extract of press release dated March 6th 2007: Société Générale announces planned acquisition of Ohridska banka
“Société Générale has executed a Tender Agreement with a group of shareholders representing 53% of the capital of Macedonia’s Ohridska banka a.d. In accordance with takeover rules in Macedonia, Société Générale will now launch a tender offer for 100% of the capital of Ohridska banka with an offer price of MKD 8,157.96 (EUR 133.30) per share, for a total consideration of EUR 43 million. The takeover bid will be successful if at least 51% of the regular shares of the Bank have been contributed to Société Générale by the shareholders of Ohridska Banka within the framework of this takeover offer. Detailed terms and conditions of the offer will be contained in the offer document to be published in accordance with the applicable Macedonian takeover rules. Founded in 1994, Ohridska banka is one of the four leading universal banks in Macedonia with market share of 6% in deposits and 5.4% in total assets as of 30 September 2006. The bank offers its products and services to 80,000 corporate and individual clients through its network of 13 branches and employs 183 persons. Its total assets reached EUR 143 million at the end of 2006. This contemplated transaction is in line with the development strategy of Société Générale as one of the major players in universal banking in South-Eastern Europe. On the conclusion of this transaction, Ohridska banka would complement the existing regional coverage of Société Générale already present in Serbia, Montenegro, Croatia and Slovenia.”
• Extract of press release dated April 19th 2007: Société Générale acquires Banka Popullore in Albania
“Société Générale announces the acquisition of 75% of the capital of Albania’s Banka Popullore. The acquisition, signed on 18 April, is subject to the approval of the Albanian regulatory authorities. Banka Popullore is a dynamic universal bank, founded in March 2004. Within 3 years, the bank created a significant network across Albania and attained a market share of 5%. Today, Banka Popullore offers services and products to 42,000 customers through a 30 branch network, and employs 280 persons. Its total assets reached EUR 230 million at end 2006. Société Générale’s know-how, technology, and international network will enable Banka Popullore to pursue its development.
3/39
This acquisition is in line with the development strategy of Société Générale as one of the major players in universal banking in South Eastern Europe, where it has subsidiaries in Serbia, Montenegro, Croatia and Slovenia. With almost 1 million clients and 238 branches, this region will become the third largest franchise in Europe ex-France for Société Générale’s International Retail Banking division, after the Czech Republic (Komercni Banka) and Romania (BRD).”
2.2 Other events subsequent to the submission of the registration document
• Extract of press release dated April 20th 2007: Market rumors “Société Générale notes the recent market speculations on a potential strategic combination involving the company. Although Société Générale’s policy is not to comment on market speculations, in the light of the share price movement and volumes, Société Générale indicates there are currently no negotiations with respect to such a transaction.”
• Extract of press release dated May 14th 2007: General Meeting of Shareholders held on 14 May 2007
“Société Générale’s strategy. Daniel BOUTON made the following comments at the conclusion of his remarks: "Our strategy, combining organic growth and targeted acquisitions, can deliver long-term growth and profitability. Our results for 2006 have shown, once again, that Société Générale does not necessarily need to make large deals to create value for its shareholders. Over the past 10 years we have been among the European banks with the strongest growth and profitability, without a major tie-up. In the coming years we can pursue this strategy: we have the right people, quality projects and shareholders’ equity to finance them. All of our businesses are profitable and developing. However all major European banks are attentive as the environment evolves, with the emergence of very large groups in Asia, the beginning of banking harmonization in Europe and the eventual re-drawing of the European banking landscape set in motion by potential operations concerning ABN-Amro. Thanks to its profitability, capacity for organic growth and balanced and dynamic business mix, Société Générale (as is the case for all European banks of similar size) could play an important role in this evolution. This is my message for shareholders, employee representatives and of course the staff who ensure the success of this institution. " In response to a question, Daniel BOUTON reiterated that "Société Générale is not currently in negotiations with any bank."”
4/39
III. CHAPTER 5: CORPORATE GOVERNANCE
3.1 General Meeting of Shareholders held on May 14th 2007
• Extract of press release dated May 14th 2007: General Meeting of Shareholders held on 14 May 2007
“Over 1,270 shareholders attended the meeting held by Société Générale on 14 May 2007 at La Défense (near Paris). 1,015 shareholders were represented and 7,938 voted by post. 35,684 gave their proxy to the Chairman.
Quorum was established at 47.49% (45.04 % in 2006).
All the resolutions submitted by the Board of Directors were approved.
The 2006 financial statements and dividend payment of 5.2 euros were approved.
Two directors’ mandates were renewed: Daniel BOUTON and Anthony WYAND.
One new independent director was appointed: Jean-Martin FOLZ.”
3.2 Board of Directors at May 14th 2007 The Board of Directors comprises 15 members, including 8 independent directors and two directors elected by employees: Daniel BOUTON Philippe CITERNE Jean AZEMA* Michel CICUREL* Elie COHEN* Robert A. DAY Antoine JEANCOURT-GALIGNANI* Jean-Martin FOLZ* (1)
Elisabeth LULIN*
Gianemilio OSCULATI* Patrick RICARD Luc VANDEVELDE* Anthony WYAND Philippe PRUVOST**
Gérard REVOLTE**
(1) Appointed to replace Marc VIENOT. * Independent Director. ** Director elected by employees.
5/39

3.3 General Management
• Extract of press release dated May 14th 2007: General Meeting of Shareholders
held on 14 May 2007 “Following the Shareholders Meeting, the Board of Directors reaffirmed the management structure of Société Générale. The Board confirmed Daniel BOUTON as Chairman and Chief Executive Officer, Philippe CITERNE as Director and Co-Chief Executive Officer, and Didier ALIX as Co-Chief Executive Officer.” • Extract of press release dated May 25th 2007: Appointments to the Management
Committee of Société Générale Group “Following the re-organization of the Group and the enlargement of its Executive Committee announced 27 September 2006, the Management Committee of Société Générale Group has evolved to adapt to this new phase of the Group’s expansion. The Management Committee meets to discuss strategy and other issues of general interest to the Group. It comprises 46 persons, including members of the Executive Committee. Thirteen new members have joined the Management Committee” : Philippe Aymerich - Deputy Group Chief Risk officer Alain Bataille - Group Country Head for United Kingdom Henri Bonnet - Deputy Head, Specialized Financial Services Luc François - Co-Head, Global Equities & Derivatives Solutions Laurent Goutard - Chairman & Chief Executive Officer of Komercni Banka Olivier Khayat - Co-Head, Capital Raising & Financing Jean-Luc Parer - Co-Head, Capital Raising & Financing Jean-Robert Sautter - Head, Sales and Marketing, Retail Banking Société Générale France Marc I. Stern - Chairman Société Générale GIMS America Patrick Suet - Deputy Group Corporate Secretary Vincent Taupin - Chairman and Chief Executive Officer BOURSORAMA Grégoire Varenne - Co-Head, Fixed Income, Currencies & Commodities Philippe Vigué - Deputy Head, International Retail Banking “This new Management Committee reflects the Group’s re-organization, into six business lines (Société Générale Retail Banking in France, Crédit du Nord, Retail Banking Outside France, Specialized Financial Services, Corporate and Investment Banking, and Global Investment Management & Services) and six functional divisions (risk, finance and development, corporate secretariat, human resources, corporate resources, and communications). "The expanded management committee will adapt the management bodies to the Group’s current organizational structure and size, and enhance the bank’s operational efficiency and pursuit of its profitable growth strategy," said Daniel Bouton, Chairman and CEO of Société Générale.”
6/39
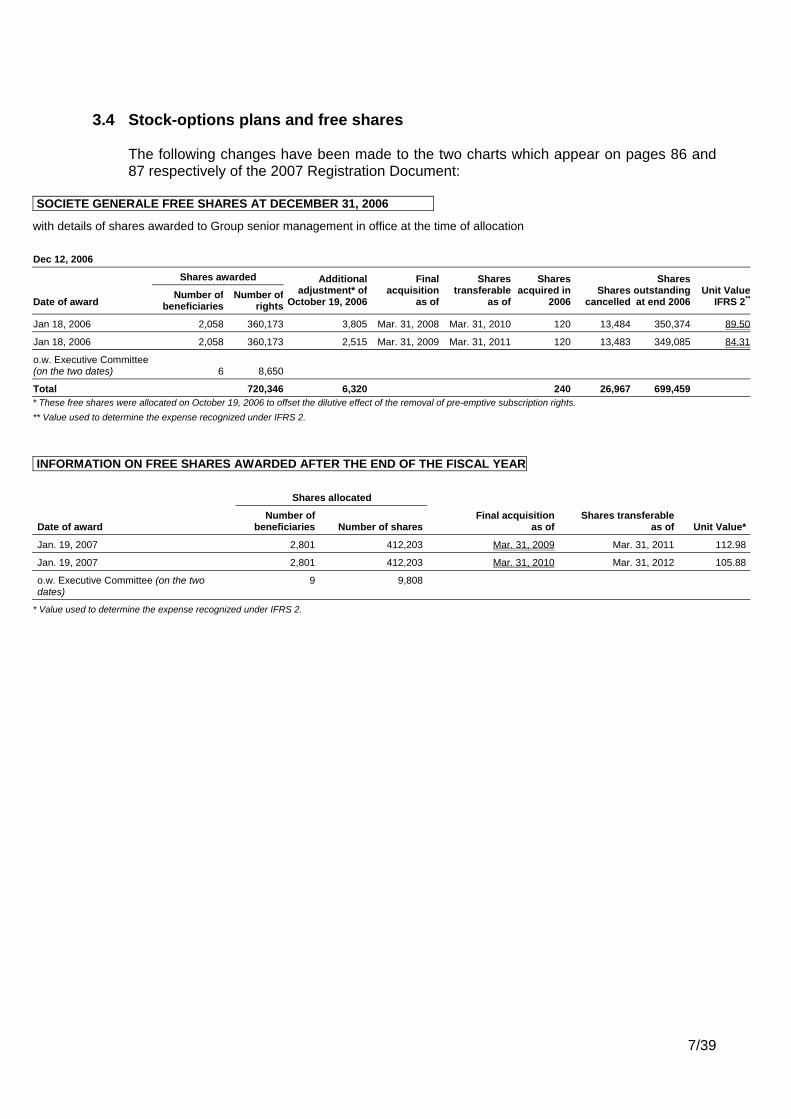
3.4 Stock-options plans and free shares
The following changes have been made to the two charts which appear on pages 86 and 87 respectively of the 2007 Registration Document:
SOCIETE GENERALE FREE SHARES AT DECEMBER 31, 2006
with details of shares awarded to Group senior management in office at the time of allocation Dec 12, 2006
Shares awarded
Date of award Number of
beneficiaries Number of
rights
Additionaladjustment* of
October 19, 2006
Final acquisition
as of
Shares transferable
as of
Shares acquired in
2006Shares
cancelled
Shares outstanding at end 2006
Unit Value IFRS 2**
Jan 18, 2006 2,058 360,173 3,805 Mar. 31, 2008 Mar. 31, 2010 120 13,484 350,374 89.50
Jan 18, 2006 2,058 360,173 2,515 Mar. 31, 2009 Mar. 31, 2011 120 13,483 349,085 84.31
o.w. Executive Committee (on the two dates) 6 8,650
Total 720,346 6,320 240 26,967 699,459* These free shares were allocated on October 19, 2006 to offset the dilutive effect of the removal of pre-emptive subscription rights. ** Value used to determine the expense recognized under IFRS 2.
INFORMATION ON FREE SHARES AWARDED AFTER THE END OF THE FISCAL YEAR Shares allocated
Date of award Number of
beneficiaries Number of sharesFinal acquisition
as of Shares transferable
as of Unit Value*
Jan. 19, 2007 2,801 412,203 Mar. 31, 2009 Mar. 31, 2011 112.98
Jan. 19, 2007 2,801 412,203 Mar. 31, 2010 Mar. 31, 2012 105.88
o.w. Executive Committee (on the two dates)
9 9,808
* Value used to determine the expense recognized under IFRS 2.
7/39
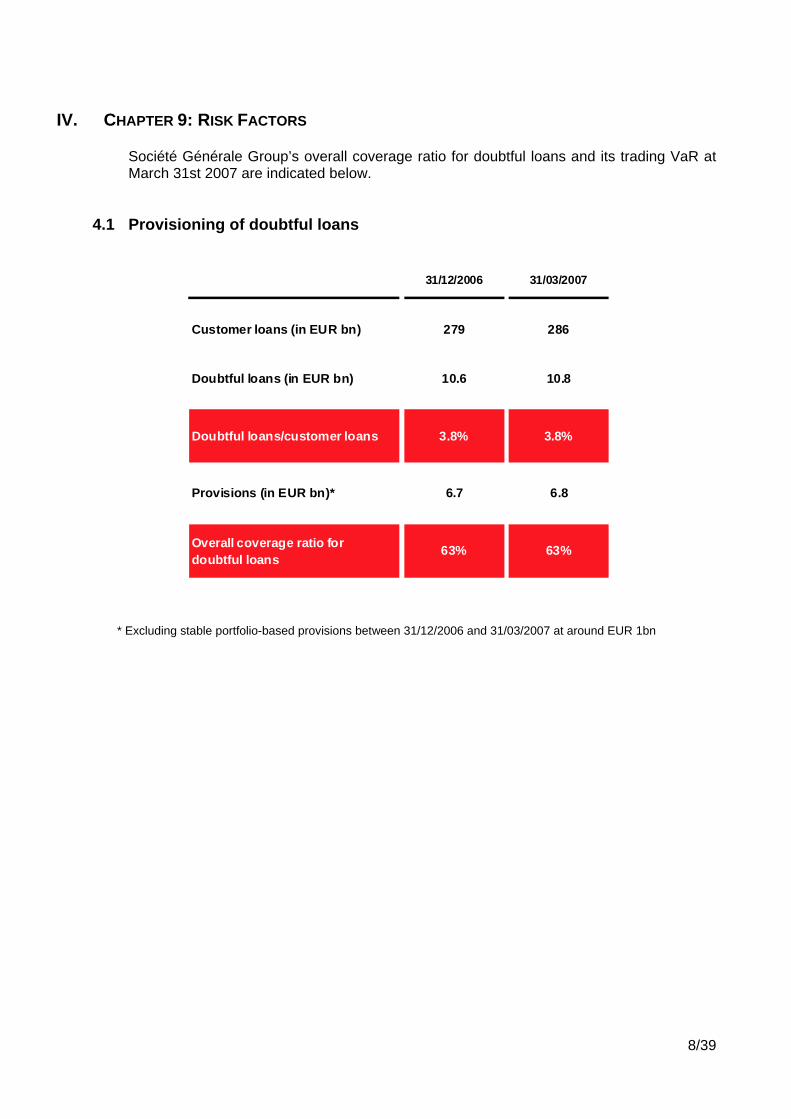
IV. CHAPTER 9: RISK FACTORS
Société Générale Group’s overall coverage ratio for doubtful loans and its trading VaR at March 31st 2007 are indicated below.
4.1 Provisioning of doubtful loans
31/12/2006 31/03/2007
Customer loans (in EUR bn) 279 286
Doubtful loans (in EUR bn) 10.6 10.8
Doubtful loans/customer loans 3.8% 3.8%
Provisions (in EUR bn)* 6.7 6.8
Overall coverage ratio for doubtful loans
63% 63%
* Excluding stable portfolio-based provisions between 31/12/2006 and 31/03/2007 at around EUR 1bn
8/39
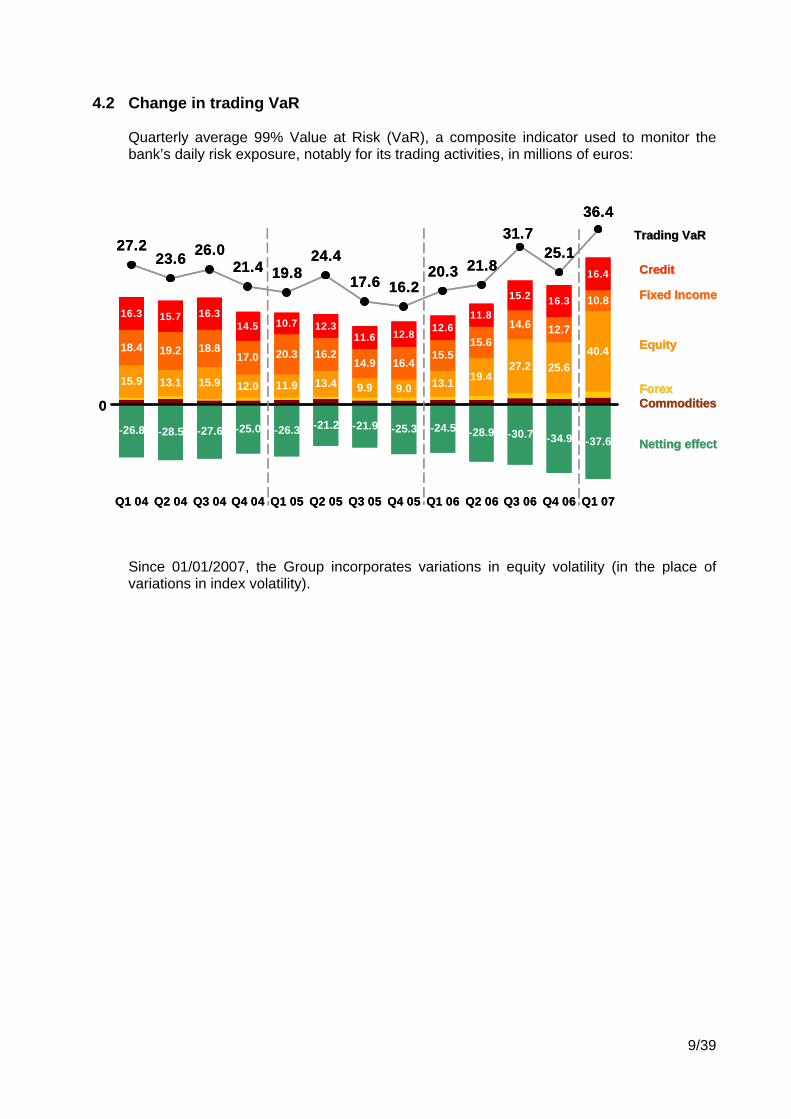
4.2 Change in trading VaR
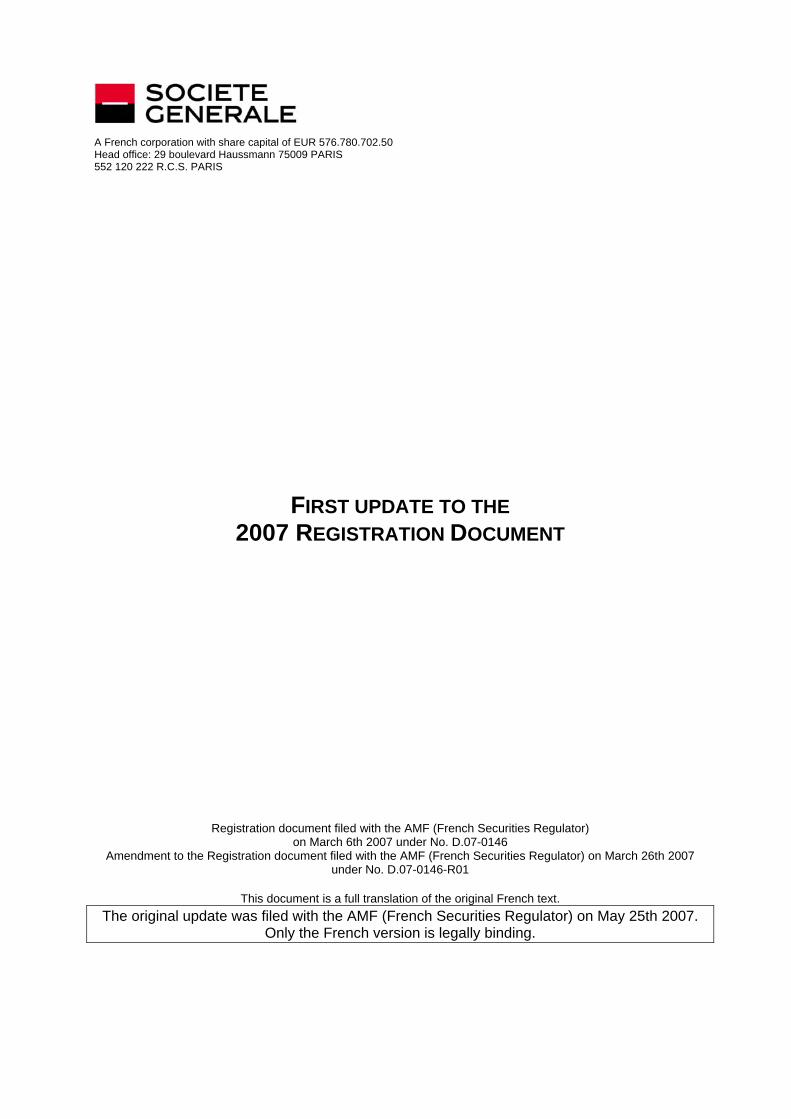
Quarterly average 99% Value at Risk (VaR), a composite indicator used to monitor the bank’s daily risk exposure, notably for its trading activities, in millions of euros:
-26.8 -28.5 -27.6 -25.0 -26.3 -21.2 -21.9 -25.3 -24.5 -28.9 -30.7 -34.9 -37.6
15.9 13.1 15.9 12.0 11.9 13.4 9.9 9.0 13.1 19.427.2 25.6
40.418.4 19.2 18.817.0 20.3 16.2
14.9 16.415.5
15.614.6 12.7
10.816.3 15.7 16.3
14.5 10.7 12.311.6 12.8 12.6
11.8
15.2 16.3
16.4
25.1
36.4
17.6
24.419.821.4
26.023.627.2
16.220.3 21.8
31.7
Q1 04 Q2 04 Q3 04 Q4 04 Q1 05 Q2 05 Q3 05 Q4 05 Q1 06 Q2 06 Q3 06 Q4 06 Q1 07
Trading Trading VaRVaR
Since 01/01/2007, the Group incorporates variations in equity volatility (in the place of variations in index volatility).
CreditCredit
EquityEquity
ForexForex
Netting effectNetting effect
Fixed IncomeFixed Income
0 CommoditiesCommodities
-26.8 -28.5 -27.6 -25.0 -26.3 -21.2 -21.9 -25.3 -24.5 -28.9 -30.7 -34.9 -37.6
15.9 13.1 15.9 12.0 11.9 13.4 9.9 9.0 13.1 19.427.2 25.6
40.418.4 19.2 18.817.0 20.3 16.2
14.9 16.415.5
15.614.6 12.7
10.816.3 15.7 16.3
14.5 10.7 12.311.6 12.8 12.6
11.8
15.2 16.3
16.4
25.1
36.4
17.6
24.419.821.4
26.023.627.2
16.220.3 21.8
31.7
Q1 04 Q2 04 Q3 04 Q4 04 Q1 05 Q2 05 Q3 05 Q4 05 Q1 06 Q2 06 Q3 06 Q4 06 Q1 07
Trading Trading VaRVaR
CreditCredit
EquityEquity
ForexForex
Netting effectNetting effect
Fixed IncomeFixed Income
0 CommoditiesCommodities
9/39
V. CHAPTER 10: FINANCIAL INFORMATION
5.1 Evolution of Société Générale Corporate & Investment Banking’s financial disclosure (Press release dated April 17th 2007)
As of 1st January 2007, the Corporate and Investment Banking division of Société Générale group has put in place an enhanced organizational structure under its « Step Up 2010 » initiative with the objective of strengthening the client/solution approach and adapting to market changes (continued disintermediation and growth of European capital markets). In this context, the Group has decided to change the presentation of Société Générale Corporate & Investment Banking’s results in order to better mirror its new business organization. As of the first quarter 2007, Société Générale will publish for its Corporate & Investment Banking division a single income statement with a breakdown of revenues for the following activities: “Financing & Advisory” includes the full range of products and services for financing,
debt and equity and advisory activities for companies, financial institutions & insurance companies, investment funds and public & sovereign issuers. “Fixed income, Currencies and Commodities”, dedicated to investors, includes
integrated financial engineering and a sales force covering both flow and structured products on fixed income, currencies and commodities. “Equities”, also dedicated to investors, includes the full range of cash equity and equity
derivatives products and services, as well as equity research. The new financial communication aggregates generate the following changes in the breakdown of Société Générale Corporate & Investment Banking’s Net Banking Income: Revenues formerly reported under “Corporate Banking and Fixed Income” will be split
between “Financing & Advisory” and “Fixed income, Currencies and Commodities”. Revenues generated from equity origination / syndication and advisory activities,
formerly reported under “Equity & Advisory” will be included in “Financing & Advisory”.
10/39
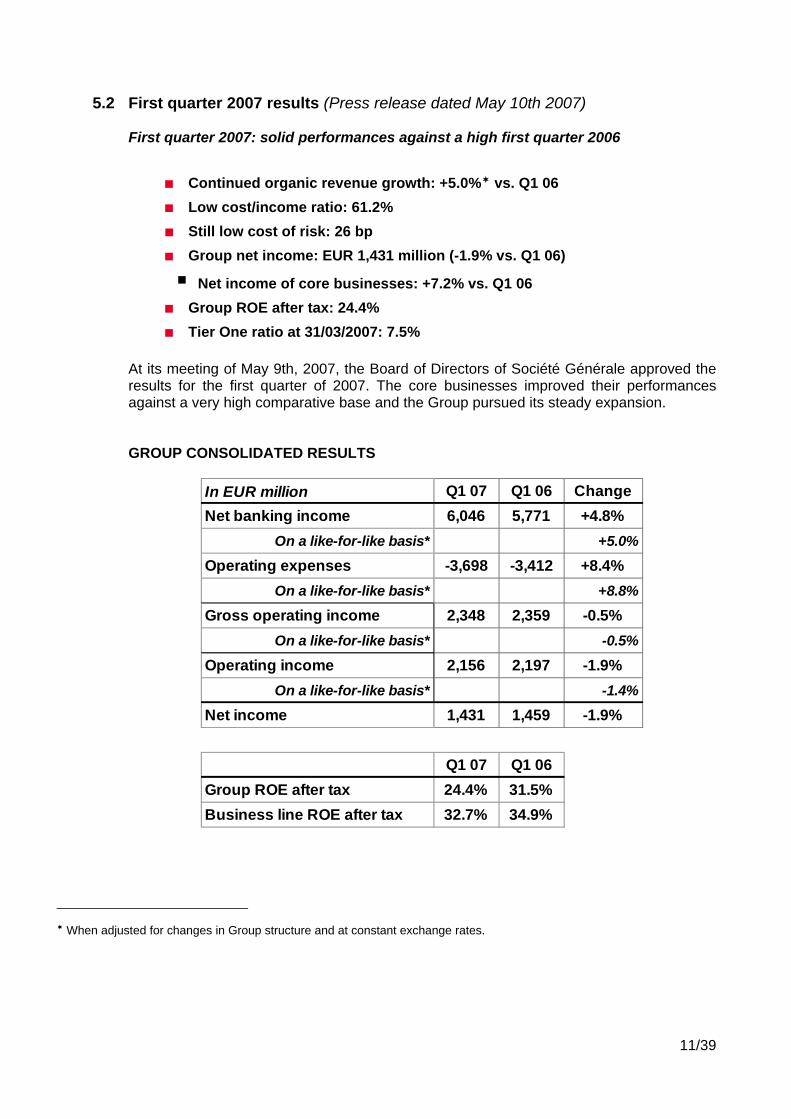
5.2 First quarter 2007 results (Press release dated May 10th 2007)
First quarter 2007: solid performances against a high first quarter 2006
Continued organic revenue growth: +5.0% vs. Q1 06 Low cost/income ratio: 61.2% Still low cost of risk: 26 bp Group net income: EUR 1,431 million (-1.9% vs. Q1 06)
Net income of core businesses: +7.2% vs. Q1 06 Group ROE after tax: 24.4% Tier One ratio at 31/03/2007: 7.5%
At its meeting of May 9th, 2007, the Board of Directors of Société Générale approved the results for the first quarter of 2007. The core businesses improved their performances against a very high comparative base and the Group pursued its steady expansion. GROUP CONSOLIDATED RESULTS
In EUR million Q1 07 Q1 06 Change
Net banking income 6,046 5,771 +4.8%On a like-for-like basis* +5.0%
Operating expenses -3,698 -3,412 +8.4%On a like-for-like basis* +8.8%
Gross operating income 2,348 2,359 -0.5%On a like-for-like basis* -0.5%
Operating income 2,156 2,197 -1.9%On a like-for-like basis* -1.4%
Net income 1,431 1,459 -1.9%
Q1 07 Q1 06Group ROE after tax 24.4% 31.5%Business line ROE after tax 32.7% 34.9%
When adjusted for changes in Group structure and at constant exchange rates.
11/39
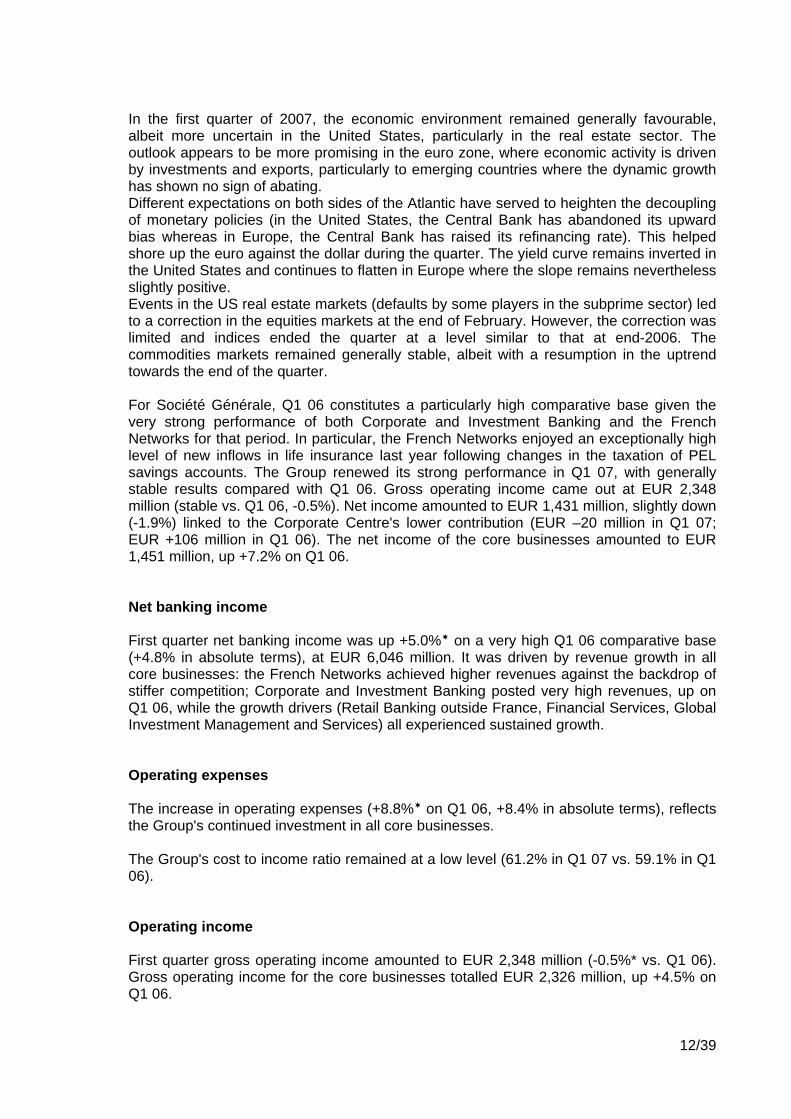
In the first quarter of 2007, the economic environment remained generally favourable, albeit more uncertain in the United States, particularly in the real estate sector. The outlook appears to be more promising in the euro zone, where economic activity is driven by investments and exports, particularly to emerging countries where the dynamic growth has shown no sign of abating. Different expectations on both sides of the Atlantic have served to heighten the decoupling of monetary policies (in the United States, the Central Bank has abandoned its upward bias whereas in Europe, the Central Bank has raised its refinancing rate). This helped shore up the euro against the dollar during the quarter. The yield curve remains inverted in the United States and continues to flatten in Europe where the slope remains nevertheless slightly positive. Events in the US real estate markets (defaults by some players in the subprime sector) led to a correction in the equities markets at the end of February. However, the correction was limited and indices ended the quarter at a level similar to that at end-2006. The commodities markets remained generally stable, albeit with a resumption in the uptrend towards the end of the quarter. For Société Générale, Q1 06 constitutes a particularly high comparative base given the very strong performance of both Corporate and Investment Banking and the French Networks for that period. In particular, the French Networks enjoyed an exceptionally high level of new inflows in life insurance last year following changes in the taxation of PEL savings accounts. The Group renewed its strong performance in Q1 07, with generally stable results compared with Q1 06. Gross operating income came out at EUR 2,348 million (stable vs. Q1 06, -0.5%). Net income amounted to EUR 1,431 million, slightly down (-1.9%) linked to the Corporate Centre's lower contribution (EUR –20 million in Q1 07; EUR +106 million in Q1 06). The net income of the core businesses amounted to EUR 1,451 million, up +7.2% on Q1 06. Net banking income First quarter net banking income was up +5.0% on a very high Q1 06 comparative base (+4.8% in absolute terms), at EUR 6,046 million. It was driven by revenue growth in all core businesses: the French Networks achieved higher revenues against the backdrop of stiffer competition; Corporate and Investment Banking posted very high revenues, up on Q1 06, while the growth drivers (Retail Banking outside France, Financial Services, Global Investment Management and Services) all experienced sustained growth. Operating expenses The increase in operating expenses (+8.8% on Q1 06, +8.4% in absolute terms), reflects the Group's continued investment in all core businesses. The Group's cost to income ratio remained at a low level (61.2% in Q1 07 vs. 59.1% in Q1 06). Operating income First quarter gross operating income amounted to EUR 2,348 million (-0.5%* vs. Q1 06). Gross operating income for the core businesses totalled EUR 2,326 million, up +4.5% on Q1 06.
12/39
The Group's cost of risk was once again low (26 bp of risk-weighted assets), due to both a continued favourable credit environment and factors specific to the Group: a policy of diversification of the businesses portfolio, improved risk management techniques and hedging of high-risk exposure. Corporate and Investment Banking recorded a new net provision reversal of EUR 29 million in Q1 07. Few new loans required provisioning and the flow of reversals continued on conclusively repaid debts. The Group's operating income for Q1 07 totalled EUR 2,156 million (-1.4%* vs. Q1 06, -1.9% in absolute terms). Excluding the Corporate Centre, operating income was EUR 2,134 million (+3.8%* vs. Q1 06, +3.2% in absolute terms). Net income Net income after tax and minority interests (Group effective tax rate: 28.1%) amounted to EUR 1,431 million (-1.7%* vs. Q1 06, -1.9% in absolute terms). Group ROE after tax stood at 24.4% in Q1 07, (31.5% in Q1 06). Earnings per share of EUR 3.26 in Q1 07 were down -7.9% on Q1 06. The decline was mainly due to the increase in the average number of shares in circulation following the capital increase in October 2006. CAPITAL BASE At March 31st, 2007, Group shareholders' equity amounted to EUR 30.3 billion1. Book value per share stood at EUR 66.3, including EUR 5.0 per share of unrealised capital gains. Risk-weighted assets rose by +13.2%* year-on-year (+14.0% in absolute terms), reflecting the Group's strong organic growth. The Group bought back a substantial number of shares (5.5 million) in Q1 07. At end-March, it held 27.7 million treasury shares (i.e. 6.0% of its capital), excluding those held for trading purposes. This resulted in a Tier One ratio of 7.5% at March 31st, 2007. The Group is rated AA by S&P and Fitch, and Aa2 by Moody’s. Société Générale is one of the best-rated banking groups.
1 This figure includes (i) EUR 1.0 billion from the issue of deeply subordinated notes in January 2005, EUR 0.9 billion of undated subordinated notes and (ii) EUR 2.2 billion of unrealised capital gains.
13/39
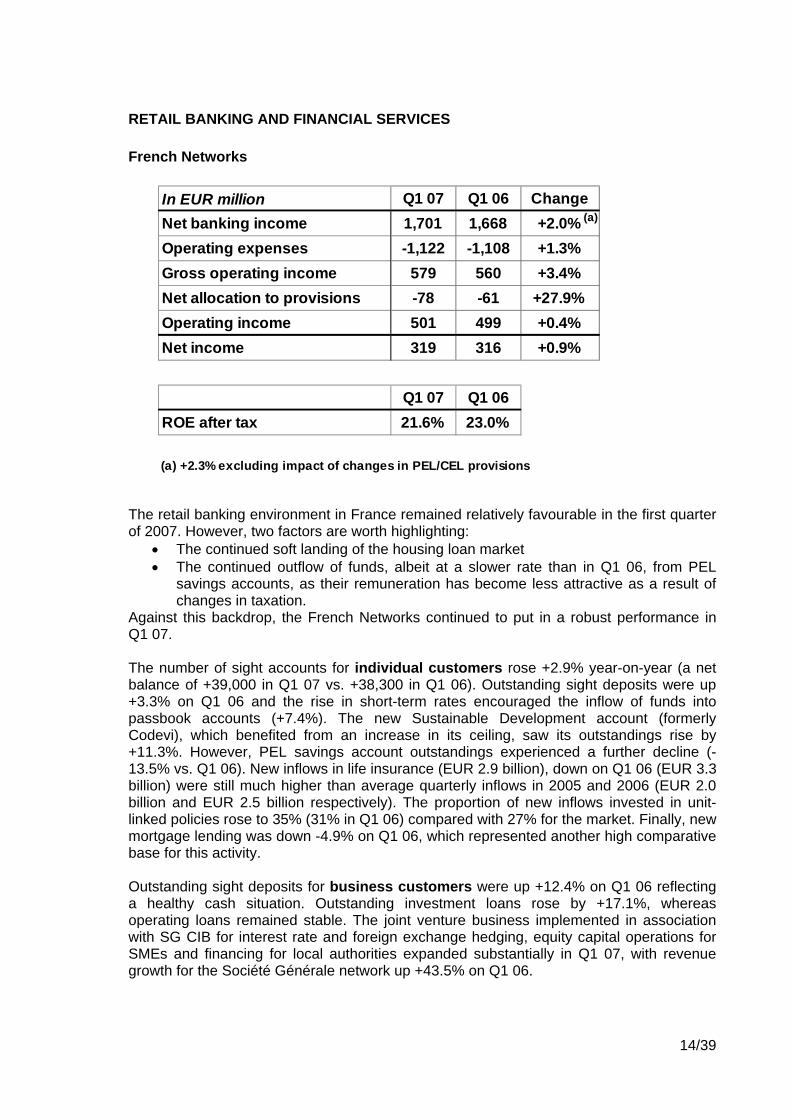
RETAIL BANKING AND FINANCIAL SERVICES French Networks
he retail banking environment in France remained relatively favourable in the first quarter
market e than in Q1 06, from PEL
Agains rench Networks continued to put in a robust performance in
he number of sight accounts for individual customers rose +2.9% year-on-year (a net
utstanding sight deposits for business customers were up +12.4% on Q1 06 reflecting
In EUR million Q1 07 Q1 06 ChangeNet banking income 1,701 1,668 +2.0%Operating expenses -1,122 -1,108 +1.3%Gross operating income 579 560 +3.4%Net allocation to provisions -78 -61 +27.9%Operating income 501 499 +0.4%Net income 319 316 +0.9%
Q1 07 Q1 06ROE after tax 21.6% 23.0%
(a) +2.3% excluding impact of changes in PEL/CEL provisions
(a)
Tof 2007. However, two factors are worth highlighting:
• The continued soft landing of the housing loan• The continued outflow of funds, albeit at a slower rat
savings accounts, as their remuneration has become less attractive as a result of changes in taxation. t this backdrop, the F
Q1 07. Tbalance of +39,000 in Q1 07 vs. +38,300 in Q1 06). Outstanding sight deposits were up +3.3% on Q1 06 and the rise in short-term rates encouraged the inflow of funds into passbook accounts (+7.4%). The new Sustainable Development account (formerly Codevi), which benefited from an increase in its ceiling, saw its outstandings rise by +11.3%. However, PEL savings account outstandings experienced a further decline (-13.5% vs. Q1 06). New inflows in life insurance (EUR 2.9 billion), down on Q1 06 (EUR 3.3 billion) were still much higher than average quarterly inflows in 2005 and 2006 (EUR 2.0 billion and EUR 2.5 billion respectively). The proportion of new inflows invested in unit-linked policies rose to 35% (31% in Q1 06) compared with 27% for the market. Finally, new mortgage lending was down -4.9% on Q1 06, which represented another high comparative base for this activity. Oa healthy cash situation. Outstanding investment loans rose by +17.1%, whereas operating loans remained stable. The joint venture business implemented in association with SG CIB for interest rate and foreign exchange hedging, equity capital operations for SMEs and financing for local authorities expanded substantially in Q1 07, with revenue growth for the Société Générale network up +43.5% on Q1 06.
14/39
From a financial perspective, the consolidated net banking income of the two networks1
xcluding the effect of the PEL/CEL provision, interest income was down -1.8% on Q1 06:
• posits, the effect of the rise in regulated savings rates in August 2006
ommission income was up +7.3% overall on Q1 06. Financial commissions increased by
he increase in operating expenses was limited (+1.3% vs. Q1 06) and lower than the
s a result, the cost to income ratio fell from 67.6% in Q1 06 to 67.0% in Q1 07 (excluding
he net cost of risk was 29 basis points of risk-weighted assets (vs. 26 basis points in Q1
irst quarter net income for the French Networks totalled EUR 319 million, up +0.9% on
(Société Générale and Crédit du Nord) rose to EUR 1,701 million in the first quarter (+2.0% on Q1 06). If NBI is adjusted for changes in PEL/CEL provisions to give a more accurate reflection of underlying performance (EUR 26 million reversal in Q1 07 vs. a EUR 30 million reversal in Q1 06), revenue growth comes out at +2.3% vs. Q1 06. E
• In terms of loans, the decline in margins, especially in the individual customer segment, offset the impact of growth in outstanding credit (+12.6% between Q1 06 and Q1 07). In terms of deneutralised the volume effect and the positive impact of the gradual rise in long-term interest rates over the last 18 months.
Ca moderate +1.4% due to the high comparative base arising from substantial new life insurance inflows in Q1 06. Service commissions were up more sharply (+9.8%), due in particular to the strong growth in areas such as payment methods for business customers or services provided by the joint ventures with SG CIB. Tincrease in revenues. Athe effect of the PEL/CEL provision). T06). This level, which remains low, reflects the quality of the customer base in a favourable credit environment. FQ1 06. ROE after tax amounted to 21.6% (20.6% excluding the effect of the PEL/CEL provision) vs. 23.0% in Q1 06 (21.6% excluding the effect of the PEL/CEL provision).
1 The revenue of the Société Générale Network does not include that of the Private Banking business in France, which is booked under the Global Investment Management & Services division.
15/39
Retail Banking outside France
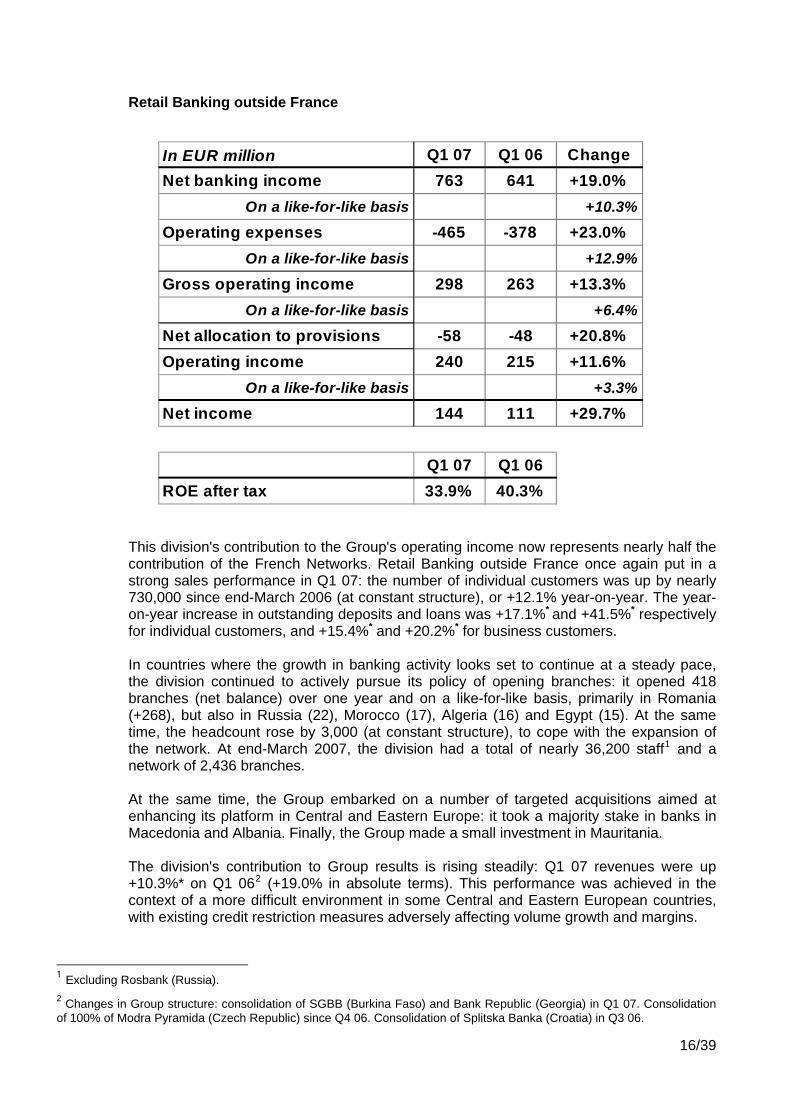
In EUR million Q1 07 Q1 06 ChangeNet banking income 763 641 +19.0%
On a like-for-like basis +10.3%
Operating expenses -465 -378 +23.0%On a like-for-like basis +12.9%
Gross operating income 298 263 +13.3%On a like-for-like basis +6.4%
Net allocation to provisions -58 -48 +20.8%Operating income 240 215 +11.6%
On a like-for-like basis +3.3%
Net income 144 111 +29.7%
Q1 07 Q1 06ROE after tax 33.9% 40.3%
This division's contribution to the Group's operating income now represents nearly half the contribution of the French Networks. Retail Banking outside France once again put in a strong sales performance in Q1 07: the number of individual customers was up by nearly 730,000 since end-March 2006 (at constant structure), or +12.1% year-on-year. The year-on-year increase in outstanding deposits and loans was +17.1%* and +41.5%* respectively for individual customers, and +15.4%* and +20.2%* for business customers. In countries where the growth in banking activity looks set to continue at a steady pace, the division continued to actively pursue its policy of opening branches: it opened 418 branches (net balance) over one year and on a like-for-like basis, primarily in Romania (+268), but also in Russia (22), Morocco (17), Algeria (16) and Egypt (15). At the same time, the headcount rose by 3,000 (at constant structure), to cope with the expansion of the network. At end-March 2007, the division had a total of nearly 36,200 staff1 and a network of 2,436 branches. At the same time, the Group embarked on a number of targeted acquisitions aimed at enhancing its platform in Central and Eastern Europe: it took a majority stake in banks in Macedonia and Albania. Finally, the Group made a small investment in Mauritania. The division's contribution to Group results is rising steadily: Q1 07 revenues were up +10.3%* on Q1 062 (+19.0% in absolute terms). This performance was achieved in the context of a more difficult environment in some Central and Eastern European countries, with existing credit restriction measures adversely affecting volume growth and margins.
1 Excluding Rosbank (Russia). 2 Changes in Group structure: consolidation of SGBB (Burkina Faso) and Bank Republic (Georgia) in Q1 07. Consolidation of 100% of Modra Pyramida (Czech Republic) since Q4 06. Consolidation of Splitska Banka (Croatia) in Q3 06.
16/39
Operating expenses rose by +12.9%* (+23.0% in absolute terms), reflecting the investment by the networks: excluding these costs, the increase would have been limited to +6.9%*. As a result, first quarter gross operating income rose +6.4%* (+13.3% in absolute terms) to EUR 298 million1. The cost to income ratio stood at 60.9% (vs. 59.0% in Q1 06). At EUR 58 million in Q1 07, the cost of risk remains moderate compared with risk-weighted assets, (54 basis points). The division's net income was up +6.4%* (+29.7% in absolute terms) on Q1 06 at EUR 144 million. ROE after tax came to 33.9% in Q1 07 (40.3% in Q1 06). The division continued to implement cooperation agreements with Rosbank. This bank's results have been accounted for by the equity method since Q4 06 and therefore are not included in the division's operating income.
1 The application of IFRS for Splitska Banka's entry into the consolidation scope (revaluation of the credit portfolio and recognition of an intangible asset) had a positive impact of EUR +4 million on Q1 07 GOI (EUR +11 million on NBI and EUR +7 million on operating expenses).
17/39
Financial Services
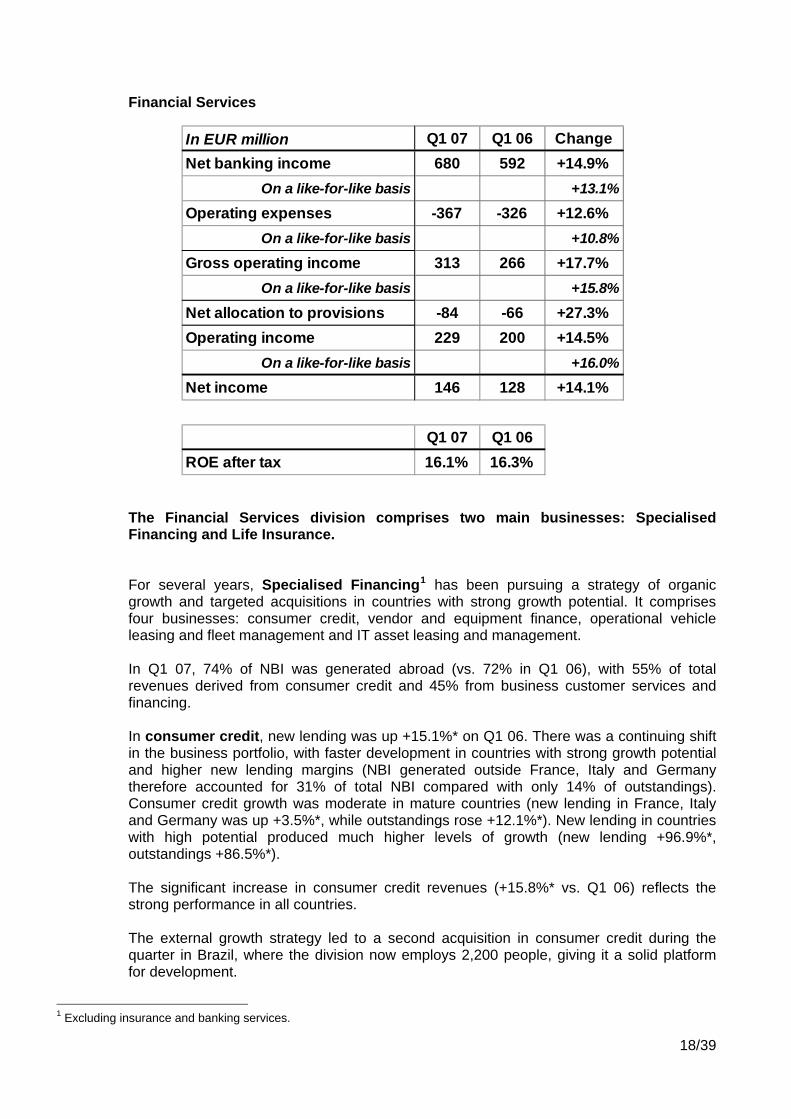
In EUR million Q1 07 Q1 06 ChangeNet banking income 680 592 +14.9%
On a like-for-like basis +13.1%
Operating expenses -367 -326 +12.6%On a like-for-like basis +10.8%
Gross operating income 313 266 +17.7%On a like-for-like basis +15.8%
Net allocation to provisions -84 -66 +27.3%Operating income 229 200 +14.5%
On a like-for-like basis +16.0%
Net income 146 128 +14.1%
Q1 07 Q1 06ROE after tax 16.1% 16.3%
The Financial Services division comprises two main businesses: Specialised Financing and Life Insurance. For several years, Specialised Financing1 has been pursuing a strategy of organic growth and targeted acquisitions in countries with strong growth potential. It comprises four businesses: consumer credit, vendor and equipment finance, operational vehicle leasing and fleet management and IT asset leasing and management. In Q1 07, 74% of NBI was generated abroad (vs. 72% in Q1 06), with 55% of total revenues derived from consumer credit and 45% from business customer services and financing. In consumer credit, new lending was up +15.1%* on Q1 06. There was a continuing shift in the business portfolio, with faster development in countries with strong growth potential and higher new lending margins (NBI generated outside France, Italy and Germany therefore accounted for 31% of total NBI compared with only 14% of outstandings). Consumer credit growth was moderate in mature countries (new lending in France, Italy and Germany was up +3.5%*, while outstandings rose +12.1%*). New lending in countries with high potential produced much higher levels of growth (new lending +96.9%*, outstandings +86.5%*). The significant increase in consumer credit revenues (+15.8%* vs. Q1 06) reflects the strong performance in all countries. The external growth strategy led to a second acquisition in consumer credit during the quarter in Brazil, where the division now employs 2,200 people, giving it a solid platform for development.
1 Excluding insurance and banking services.
18/39
SG Equipment Finance, the European leader in vendor and equipment finance saw new lending increase by +2.8%* (excluding factoring), even though growth in new lending was already exceptionally strong in Q1 06 (+18.6% at constant structure). Business was affected by longer delivery times in the industrial equipment sector in Germany which has to contend with very sustained demand. In operational vehicle leasing and fleet management, ALD Automotive continued to rapidly expand its fleet under management which rose to 687,000 vehicles at end-March 2007 (+12.0% on Q1 06 at constant structure). ALD Automotive continues to rank second in Europe in terms of fleet under management. Total revenues in Specialised Financing rose by +11.5%* compared with Q1 06 (+13.8% in absolute terms). Operating expenses increased at a similar rate (+11.3%* and +13.4% in absolute terms), reflecting the continued investment in these activities' sales platforms. Gross operating income was up +11.9%* on Q1 06 (+14.4% in absolute terms). The net cost of risk increased to 88 basis points (vs. 76 bp in Q1 06). This was due to the integration of new activities (EUR +8 million) and the growing share of consumer credit activities in the global portfolio, particularly in emerging countries. After exceptionally high new inflows in 2006 due to fund transfers following changes in the taxation of PEL savings accounts, gross new inflows for Life Insurance were down -14.6%, with 34% of investments in unit-linked policies. Overall, first quarter revenues were up +19.8%* on Q1 06, driven by the increase in mathematical reserves. Overall, the Financial Services division generated first quarter operating income up +16.0%* (+14.5% in absolute terms) at EUR 229 million. Net income totalled EUR 146 million, up +17.2%* (+14.1% in absolute terms) on Q1 06. ROE after tax came to 16.1%, vs.16.3% in Q1 06.
19/39
GLOBAL INVESTMENT MANAGEMENT AND SERVICES
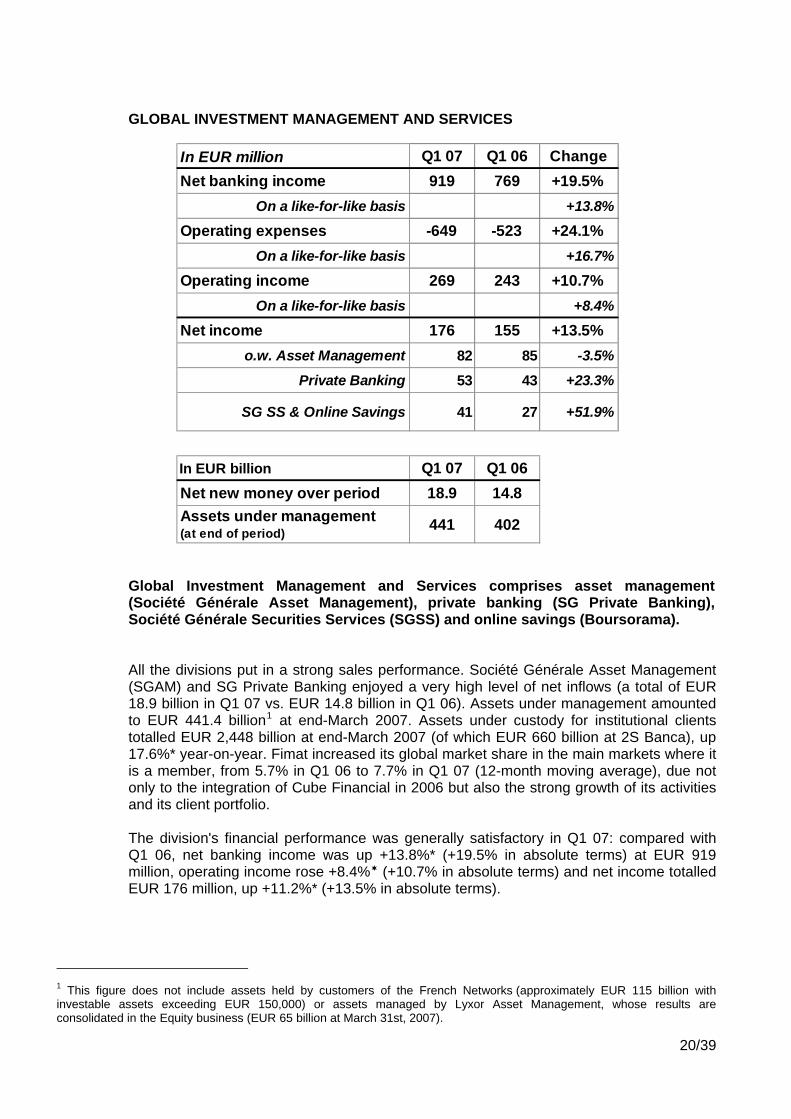
In EUR million Q1 07 Q1 06 ChangeNet banking income 919 769 +19.5%
On a like-for-like basis +13.8%
Operating expenses -649 -523 +24.1%On a like-for-like basis +16.7%
Operating income 269 243 +10.7%On a like-for-like basis +8.4%
Net income 176 155 +13.5%o.w. Asset Management 82 85 -3.5%
Private Banking 53 43 +23.3%
SG SS & Online Savings 41 27 +51.9%
In EUR billion Q1 07 Q1 06Net new money over period 18.9 14.8Assets under management (at end of period) 441 402
Global Investment Management and Services comprises asset management (Société Générale Asset Management), private banking (SG Private Banking), Société Générale Securities Services (SGSS) and online savings (Boursorama). All the divisions put in a strong sales performance. Société Générale Asset Management (SGAM) and SG Private Banking enjoyed a very high level of net inflows (a total of EUR 18.9 billion in Q1 07 vs. EUR 14.8 billion in Q1 06). Assets under management amounted to EUR 441.4 billion1 at end-March 2007. Assets under custody for institutional clients totalled EUR 2,448 billion at end-March 2007 (of which EUR 660 billion at 2S Banca), up 17.6%* year-on-year. Fimat increased its global market share in the main markets where it is a member, from 5.7% in Q1 06 to 7.7% in Q1 07 (12-month moving average), due not only to the integration of Cube Financial in 2006 but also the strong growth of its activities and its client portfolio. The division's financial performance was generally satisfactory in Q1 07: compared with Q1 06, net banking income was up +13.8%* (+19.5% in absolute terms) at EUR 919 million, operating income rose +8.4% (+10.7% in absolute terms) and net income totalled EUR 176 million, up +11.2%* (+13.5% in absolute terms).
1 This figure does not include assets held by customers of the French Networks (approximately EUR 115 billion with investable assets exceeding EUR 150,000) or assets managed by Lyxor Asset Management, whose results are consolidated in the Equity business (EUR 65 billion at March 31st, 2007).
20/39
Asset management SGAM is present in all the main international financial markets with a comprehensive, innovative offering. SGAM saw strong net inflows in the first quarter of 2007 (EUR 16.9 billion vs. EUR 12.4 billion in Q1 06, or 19% of assets under management on an annualised basis). This performance was due mainly to the high level of inflows for money market and fixed income products, primarily CDOs, that are products whose margin is below the average for the range. SGAM managed a total of EUR 371.2 billion of assets at end-March 2007 vs. EUR 338.8 billion one year earlier. Net banking for the quarter rose +5.9% (+2.1% in absolute terms) compared with a particularly high comparative base in Q1 06. With fixed income and money market products accounting for a high proportion of inflows, the margin declined to 37 basis points in Q1 07 (compared with 38 basis points for 2006). The increase in operating expenses (+14.6% , +9.8% in absolute terms vs. Q1 06) is due to the increase in the headcount, continued commercial investment and the increase in performance-linked pay, especially in alternative management. Gross operating income and net income were slightly lower than in Q1 06, down -5.9%* (-8.6% in absolute terms) and -1.2%* (-3.5% in absolute terms) respectively. Private Banking SG Private Banking continued with its fast pace of organic growth. Strong net inflows totalled EUR 2.0 billion in Q1 07 (or 12% of assets under management on an annualised basis). All geographical regions contributed to this good performance. Assets under management totalled EUR 70.2 billion at end-March 2007, vs. EUR 63.0 billion one year earlier. Net banking income was up +17.9% (+16.5% in absolute terms) on Q1 06. The very high gross margin of 111 basis points in the first quarter was significantly up on the margin rate for 2006 (103 basis points). This was due primarily to the increased share of commissions on the sale of structured and alternative management products in total revenues. Operating expenses were up +16.8% (+15.7% in absolute terms) on Q1 06, mainly related to recruitment and continued commercial and infrastructure investment in Europe and Asia. Operating income rose +23.7% (+21.7% in absolute terms) and net income was up +26.2%* (+23.3% in absolute terms) on Q1 06. Société Générale Securities Services (SGSS) and online savings (Boursorama) In a generally favourable environment for capital markets, SGSS experienced strong growth in sales volumes. FIMAT confirmed its excellent positioning and strengthened its share of the global market1 to 7.7% (12-month moving average).
1 On the major markets of which FIMAT is a member.
21/39
The Global Custodian subdivision saw assets under custody increase by +17.6% at constant structure (+60.9% in absolute terms) year-on-year, to EUR 2,448 billion at end-March 2007. Boursorama reinforced its position as a major player in online savings and brokerage in Europe. Online savings rose by +18.3%* year-on-year to EUR 4.3 billion at end-March 2007. The number of orders executed was stable (at constant structure) compared with the same period in 2006, when brokerage activity reached a record level. First quarter net banking income for SGSS and Boursorama was up +20.4% (+42.6% in absolute terms) on Q1 06. Operating expenses were 18.2% higher than in Q1 06 (+39.9% in absolute terms), due to recruitment, continued investment and the increase in performance-linked pay as a result of the growth of the business. Operating income rose +32.6% (+58.1% in absolute terms) and net income was up +25.9%* on Q1 06 (+51.9% in absolute terms).
22/39
CORPORATE AND INVESTMENT BANKING
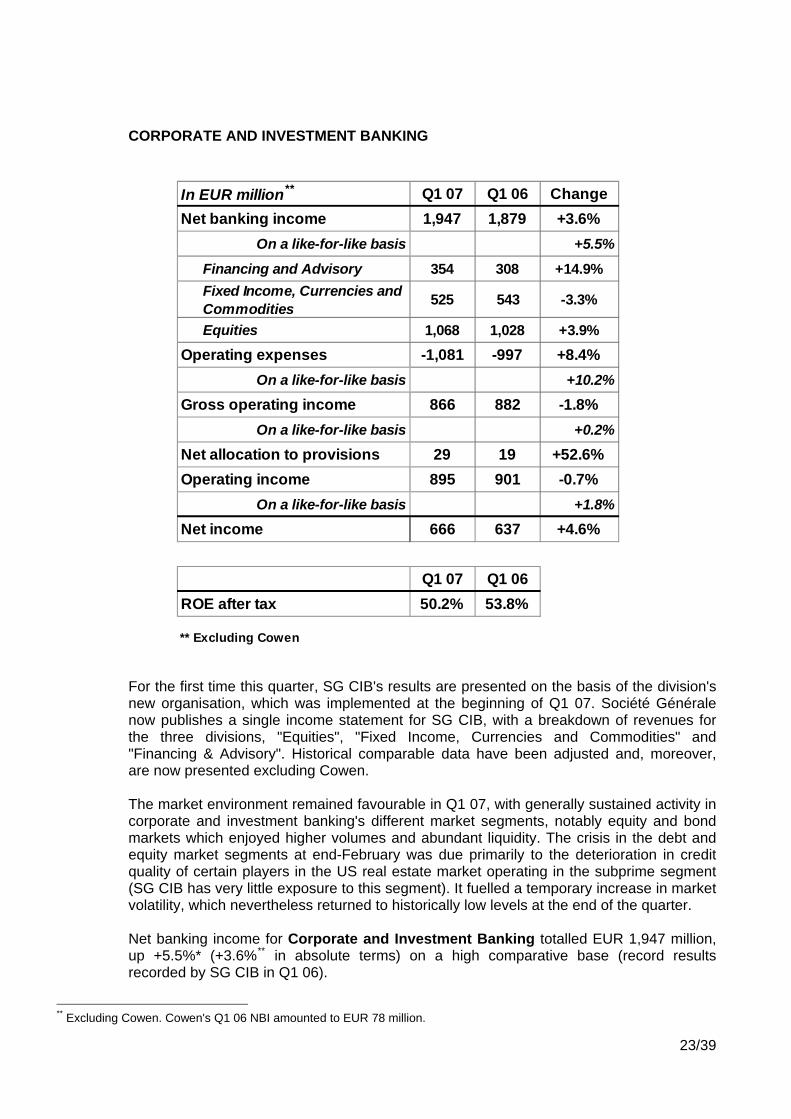
In EUR million Q1 07 Q1 06 ChangeNet banking income 1,947 1,879 +3.6%
On a like-for-like basis +5.5%
Financing and Advisory 354 308 +14.9%Fixed Income, Currencies and Commodities 525 543 -3.3%
Equities 1,068 1,028 +3.9%Operating expenses -1,081 -997 +8.4%
On a like-for-like basis +10.2%
Gross operating income 866 882 -1.8%On a like-for-like basis +0.2%
Net allocation to provisions 29 19 +52.6%Operating income 895 901 -0.7%
On a like-for-like basis +1.8%
Net income 666 637 +4.6%
Q1 07 Q1 06ROE after tax 50.2% 53.8%
** Excluding Cowen
**
For the first time this quarter, SG CIB's results are presented on the basis of the division's new organisation, which was implemented at the beginning of Q1 07. Société Générale now publishes a single income statement for SG CIB, with a breakdown of revenues for the three divisions, "Equities", "Fixed Income, Currencies and Commodities" and "Financing & Advisory". Historical comparable data have been adjusted and, moreover, are now presented excluding Cowen. The market environment remained favourable in Q1 07, with generally sustained activity in corporate and investment banking's different market segments, notably equity and bond markets which enjoyed higher volumes and abundant liquidity. The crisis in the debt and equity market segments at end-February was due primarily to the deterioration in credit quality of certain players in the US real estate market operating in the subprime segment (SG CIB has very little exposure to this segment). It fuelled a temporary increase in market volatility, which nevertheless returned to historically low levels at the end of the quarter. Net banking income for Corporate and Investment Banking totalled EUR 1,947 million, up +5.5%* (+3.6%** in absolute terms) on a high comparative base (record results recorded by SG CIB in Q1 06).
** Excluding Cowen. Cowen's Q1 06 NBI amounted to EUR 78 million.
23/39
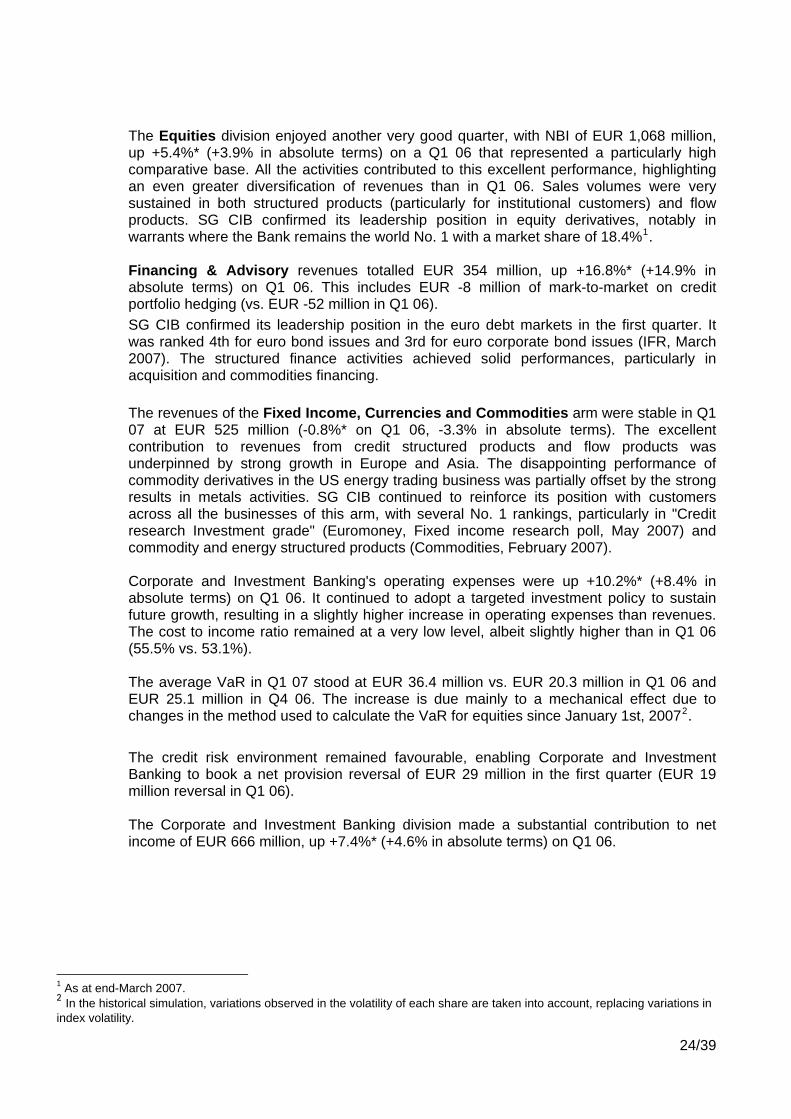
The Equities division enjoyed another very good quarter, with NBI of EUR 1,068 million, up +5.4%* (+3.9% in absolute terms) on a Q1 06 that represented a particularly high comparative base. All the activities contributed to this excellent performance, highlighting an even greater diversification of revenues than in Q1 06. Sales volumes were very sustained in both structured products (particularly for institutional customers) and flow products. SG CIB confirmed its leadership position in equity derivatives, notably in warrants where the Bank remains the world No. 1 with a market share of 18.4%1. Financing & Advisory revenues totalled EUR 354 million, up +16.8%* (+14.9% in absolute terms) on Q1 06. This includes EUR -8 million of mark-to-market on credit portfolio hedging (vs. EUR -52 million in Q1 06). SG CIB confirmed its leadership position in the euro debt markets in the first quarter. It was ranked 4th for euro bond issues and 3rd for euro corporate bond issues (IFR, March 2007). The structured finance activities achieved solid performances, particularly in acquisition and commodities financing. The revenues of the Fixed Income, Currencies and Commodities arm were stable in Q1 07 at EUR 525 million (-0.8%* on Q1 06, -3.3% in absolute terms). The excellent contribution to revenues from credit structured products and flow products was underpinned by strong growth in Europe and Asia. The disappointing performance of commodity derivatives in the US energy trading business was partially offset by the strong results in metals activities. SG CIB continued to reinforce its position with customers across all the businesses of this arm, with several No. 1 rankings, particularly in "Credit research Investment grade" (Euromoney, Fixed income research poll, May 2007) and commodity and energy structured products (Commodities, February 2007). Corporate and Investment Banking's operating expenses were up +10.2%* (+8.4% in absolute terms) on Q1 06. It continued to adopt a targeted investment policy to sustain future growth, resulting in a slightly higher increase in operating expenses than revenues. The cost to income ratio remained at a very low level, albeit slightly higher than in Q1 06 (55.5% vs. 53.1%). The average VaR in Q1 07 stood at EUR 36.4 million vs. EUR 20.3 million in Q1 06 and EUR 25.1 million in Q4 06. The increase is due mainly to a mechanical effect due to changes in the method used to calculate the VaR for equities since January 1st, 20072. The credit risk environment remained favourable, enabling Corporate and Investment Banking to book a net provision reversal of EUR 29 million in the first quarter (EUR 19 million reversal in Q1 06). The Corporate and Investment Banking division made a substantial contribution to net income of EUR 666 million, up +7.4%* (+4.6% in absolute terms) on Q1 06.
1 As at end-March 2007. 2 In the historical simulation, variations observed in the volatility of each share are taken into account, replacing variations in index volatility.
24/39

The division once again posted a very high level of profitability, with ROE after tax of 50.2% in Q1 07 (vs. 53.8% in Q1 06).
25/39
CORPORATE CENTRE
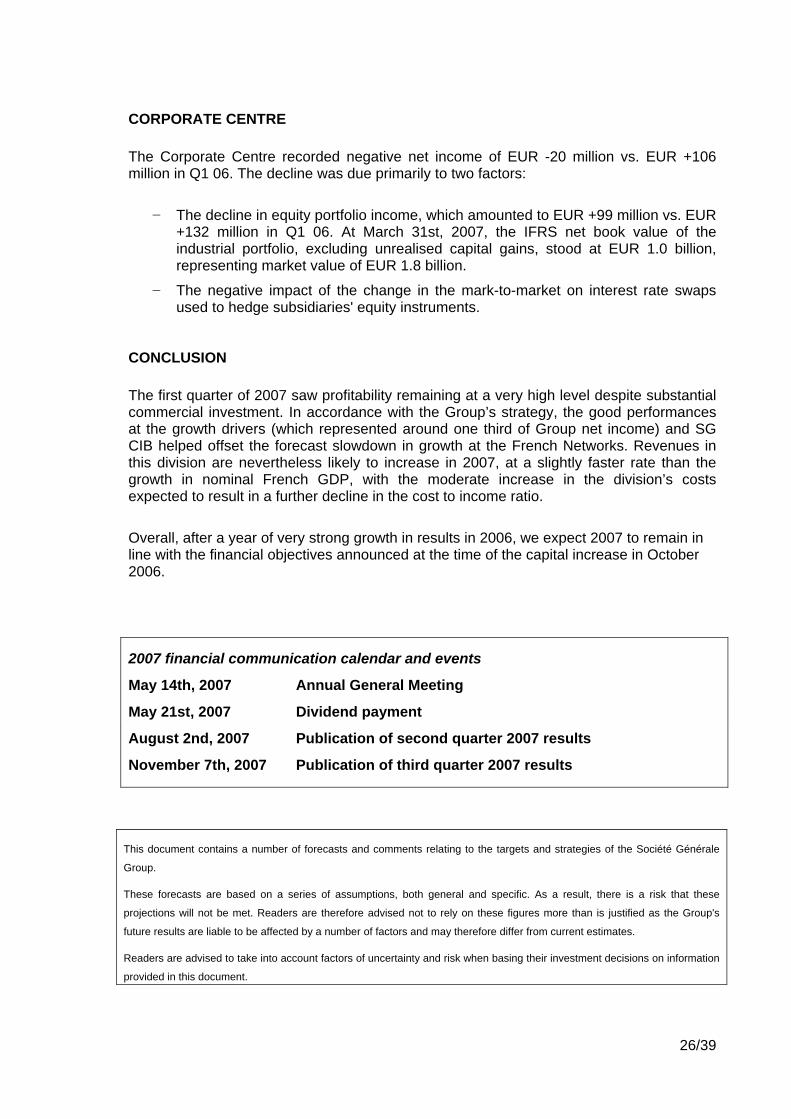
The Corporate Centre recorded negative net income of EUR -20 million vs. EUR +106 million in Q1 06. The decline was due primarily to two factors:
− The decline in equity portfolio income, which amounted to EUR +99 million vs. EUR +132 million in Q1 06. At March 31st, 2007, the IFRS net book value of the industrial portfolio, excluding unrealised capital gains, stood at EUR 1.0 billion, representing market value of EUR 1.8 billion.
− The negative impact of the change in the mark-to-market on interest rate swaps used to hedge subsidiaries' equity instruments.
CONCLUSION
The first quarter of 2007 saw profitability remaining at a very high level despite substantial commercial investment. In accordance with the Group’s strategy, the good performances at the growth drivers (which represented around one third of Group net income) and SG CIB helped offset the forecast slowdown in growth at the French Networks. Revenues in this division are nevertheless likely to increase in 2007, at a slightly faster rate than the growth in nominal French GDP, with the moderate increase in the division’s costs expected to result in a further decline in the cost to income ratio.
Overall, after a year of very strong growth in results in 2006, we expect 2007 to remain in line with the financial objectives announced at the time of the capital increase in October 2006.
2007 financial communication calendar and events
May 14th, 2007 Annual General Meeting
May 21st, 2007 Dividend payment
August 2nd, 2007 Publication of second quarter 2007 results
November 7th, 2007 Publication of third quarter 2007 results
This document contains a number of forecasts and comments relating to the targets and strategies of the Société Générale
Group.
These forecasts are based on a series of assumptions, both general and specific. As a result, there is a risk that these
projections will not be met. Readers are therefore advised not to rely on these figures more than is justified as the Group's
future results are liable to be affected by a number of factors and may therefore differ from current estimates.
Readers are advised to take into account factors of uncertainty and risk when basing their investment decisions on information
provided in this document.
26/39
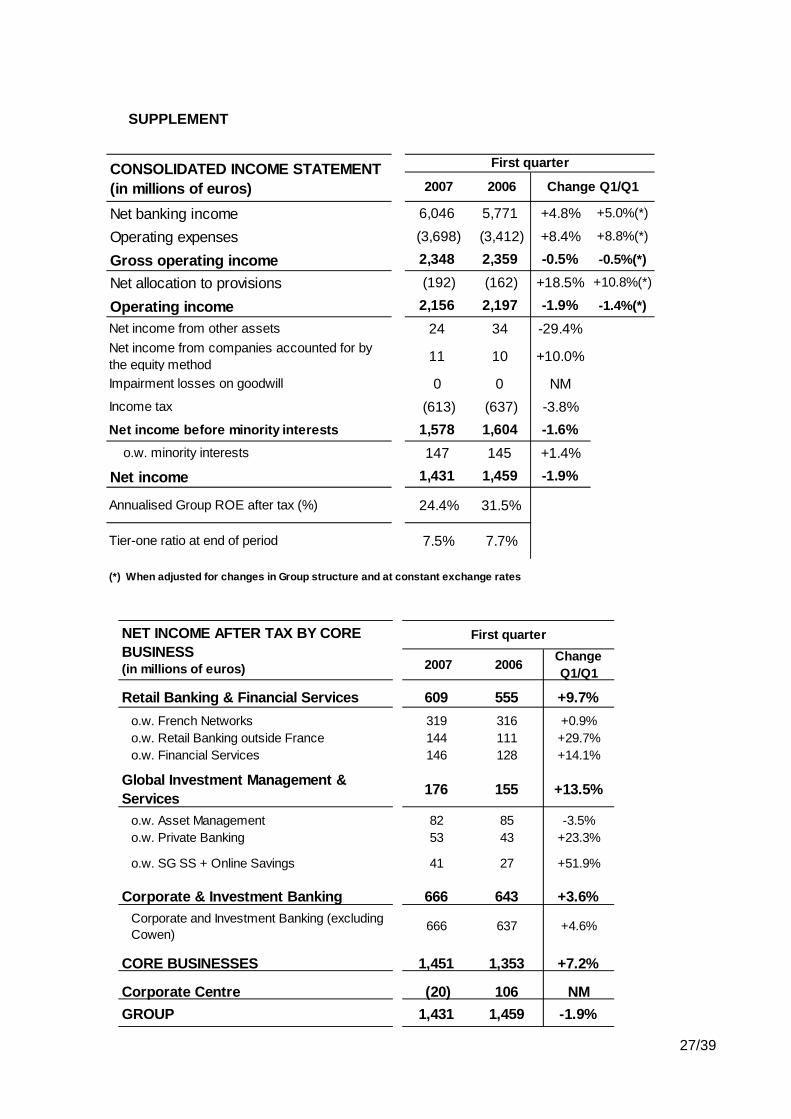
SUPPLEMENT
2007 2006
Net banking income 6,046 5,771 +4.8% +5.0%(*)
Operating expenses (3,698) (3,412) +8.4% +8.8%(*)
Gross operating income 2,348 2,359 -0.5% -0.5%(*)
Net allocation to provisions (192) (162) +18.5% +10.8%(*)
Operating income 2,156 2,197 -1.9% -1.4%(*)Net income from other assets 24 34 -29.4%Net income from companies accounted for by the equity method 11 10 +10.0%
Impairment losses on goodwill 0 0 NMIncome tax (613) (637) -3.8%Net income before minority interests 1,578 1,604 -1.6% o.w. minority interests 147 145 +1.4%
Net income 1,431 1,459 -1.9%
Annualised Group ROE after tax (%) 24.4% 31.5%
Tier-one ratio at end of period 7.5% 7.7%
(*) When adjusted for changes in Group structure and at constant exchange rates
CONSOLIDATED INCOME STATEMENT(in millions of euros)
First quarter
Change Q1/Q1
2007 2006 ChangeQ1/Q1
Retail Banking & Financial Services 609 555 +9.7%o.w. French Networks 319 316 +0.9%o.w. Retail Banking outside France 144 111 +29.7%o.w. Financial Services 146 128 +14.1%
Global Investment Management &Services 176 155 +13.5%
o.w. Asset Management 82 85 -3.5%o.w. Private Banking 53 43 +23.3%
o.w. SG SS + Online Savings 41 27 +51.9%
Corporate & Investment Banking 666 643 +3.6%Corporate and Investment Banking (excluding Cowen)
666 637 +4.6%
CORE BUSINESSES 1,451 1,353 +7.2%
Corporate Centre (20) 106 NMGROUP 1,431 1,459 -1.9%
NET INCOME AFTER TAX BY CORE BUSINESS(in millions of euros)
First quarter
27/39
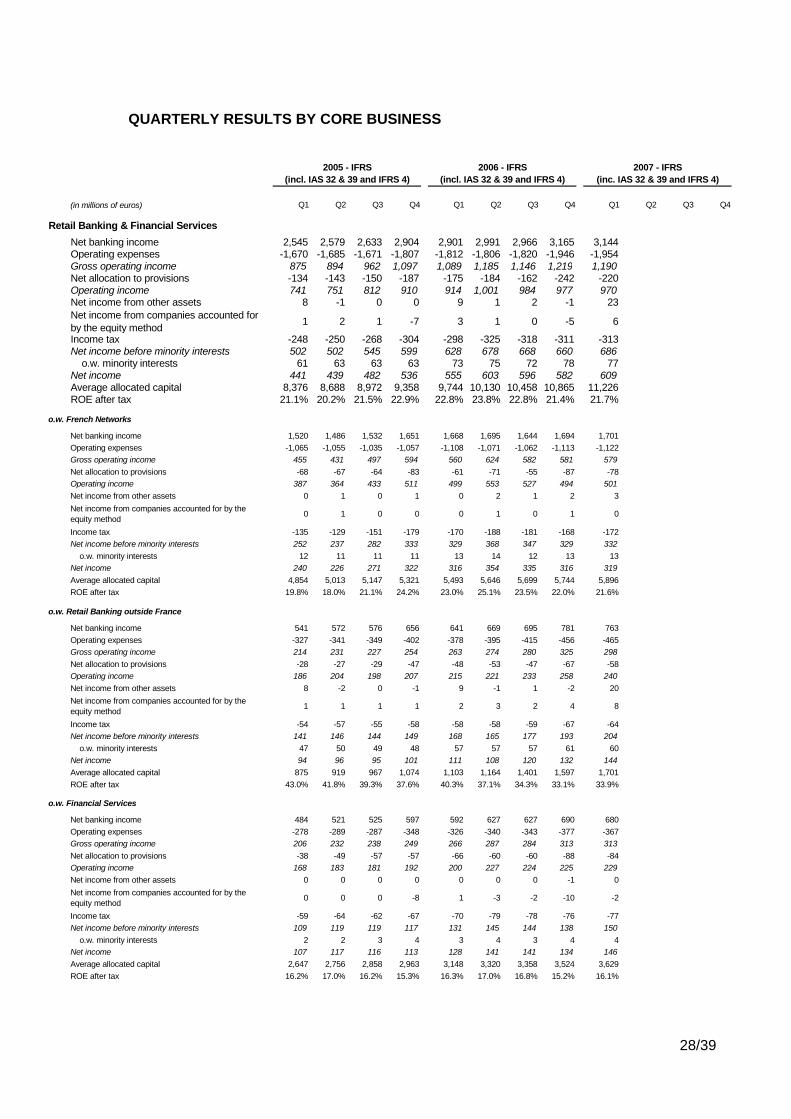
QUARTERLY RESULTS BY CORE BUSINESS
(in millions of euros) Q1 Q2 Q3 Q4 Q1 Q2 Q3 Q4 Q1 Q2 Q3 Q4
Net banking income 2,545 2,579 2,633 2,904 2,901 2,991 2,966 3,165 3,144Operating expenses -1,670 -1,685 -1,671 -1,807 -1,812 -1,806 -1,820 -1,946 -1,954Gross operating income 875 894 962 1,097 1,089 1,185 1,146 1,219 1,190Net allocation to provisions -134 -143 -150 -187 -175 -184 -162 -242 -220Operating income 741 751 812 910 914 1,001 984 977 970Net income from other assets 8 -1 0 0 9 1 2 -1 23Net income from companies accounted for by the equity method 1 2 1 -7 3 1 0 -5 6
Income tax -248 -250 -268 -304 -298 -325 -318 -311 -313Net income before minority interests 502 502 545 599 628 678 668 660 686 o.w. minority interests 61 63 63 63 73 75 72 78 77Net income 441 439 482 536 555 603 596 582 609Average allocated capital 8,376 8,688 8,972 9,358 9,744 10,130 10,458 10,865 11,226ROE after tax 21.1% 20.2% 21.5% 22.9% 22.8% 23.8% 22.8% 21.4% 21.7%
o.w. French Networks
Net banking income 1,520 1,486 1,532 1,651 1,668 1,695 1,644 1,694 1,701Operating expenses -1,065 -1,055 -1,035 -1,057 -1,108 -1,071 -1,062 -1,113 -1,122Gross operating income 455 431 497 594 560 624 582 581 579Net allocation to provisions -68 -67 -64 -83 -61 -71 -55 -87 -78Operating income 387 364 433 511 499 553 527 494 501Net income from other assets 0 1 0 1 0 2 1 2 3Net income from companies accounted for by the equity method 0 1 0 0 0 1 0 1 0
Income tax -135 -129 -151 -179 -170 -188 -181 -168 -172Net income before minority interests 252 237 282 333 329 368 347 329 332 o.w. minority interests 12 11 11 11 13 14 12 13 13Net income 240 226 271 322 316 354 335 316 319Average allocated capital 4,854 5,013 5,147 5,321 5,493 5,646 5,699 5,744 5,896ROE after tax 19.8% 18.0% 21.1% 24.2% 23.0% 25.1% 23.5% 22.0% 21.6%
o.w. Retail Banking outside France
Net banking income 541 572 576 656 641 669 695 781 763Operating expenses -327 -341 -349 -402 -378 -395 -415 -456 -465Gross operating income 214 231 227 254 263 274 280 325 298Net allocation to provisions -28 -27 -29 -47 -48 -53 -47 -67 -58Operating income 186 204 198 207 215 221 233 258 240Net income from other assets 8 -2 0 -1 9 -1 1 -2 20Net income from companies accounted for by the equity method 1 1 1 1 2 3 2 4 8
Income tax -54 -57 -55 -58 -58 -58 -59 -67 -64Net income before minority interests 141 146 144 149 168 165 177 193 204 o.w. minority interests 47 50 49 48 57 57 57 61 60Net income 94 96 95 101 111 108 120 132 144Average allocated capital 875 919 967 1,074 1,103 1,164 1,401 1,597 1,701ROE after tax 43.0% 41.8% 39.3% 37.6% 40.3% 37.1% 34.3% 33.1% 33.9%
o.w. Financial Services
Net banking income 484 521 525 597 592 627 627 690 680Operating expenses -278 -289 -287 -348 -326 -340 -343 -377 -367Gross operating income 206 232 238 249 266 287 284 313 313Net allocation to provisions -38 -49 -57 -57 -66 -60 -60 -88 -84Operating income 168 183 181 192 200 227 224 225 229Net income from other assets 0 0 0 0 0 0 0 -1 0Net income from companies accounted for by the equity method 0 0 0 -8 1 -3 -2 -10 -2
Income tax -59 -64 -62 -67 -70 -79 -78 -76 -77Net income before minority interests 109 119 119 117 131 145 144 138 150 o.w. minority interests 2 2 3 4 3 4 3 4 4Net income 107 117 116 113 128 141 141 134 146Average allocated capital 2,647 2,756 2,858 2,963 3,148 3,320 3,358 3,524 3,629ROE after tax 16.2% 17.0% 16.2% 15.3% 16.3% 17.0% 16.8% 15.2% 16.1%
2006 - IFRS(incl. IAS 32 & 39 and IFRS 4)
Retail Banking & Financial Services
2005 - IFRS(incl. IAS 32 & 39 and IFRS 4)
2007 - IFRS(inc. IAS 32 & 39 and IFRS 4)
28/39
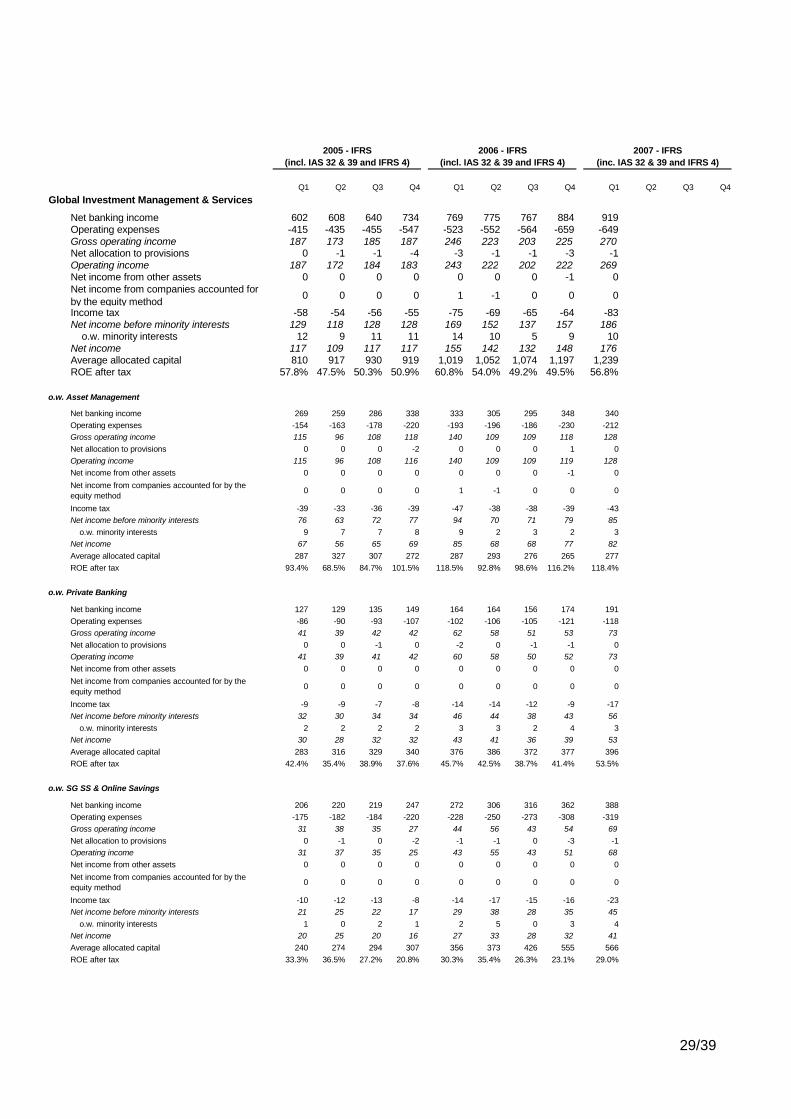
Q1 Q2 Q3 Q4 Q1 Q2 Q3 Q4 Q1 Q2 Q3 Q4Global Investment Management & Services
Net banking income 602 608 640 734 769 775 767 884 919Operating expenses -415 -435 -455 -547 -523 -552 -564 -659 -649Gross operating income 187 173 185 187 246 223 203 225 270Net allocation to provisions 0 -1 -1 -4 -3 -1 -1 -3 -1Operating income 187 172 184 183 243 222 202 222 269Net income from other assets 0 0 0 0 0 0 0 -1 0Net income from companies accounted for by the equity method 0 0 0 0 1 -1 0 0 0
Income tax -58 -54 -56 -55 -75 -69 -65 -64 -83Net income before minority interests 129 118 128 128 169 152 137 157 186 o.w. minority interests 12 9 11 11 14 10 5 9 10Net income 117 109 117 117 155 142 132 148 176Average allocated capital 810 917 930 919 1,019 1,052 1,074 1,197 1,239ROE after tax 57.8% 47.5% 50.3% 50.9% 60.8% 54.0% 49.2% 49.5% 56.8%
o.w. Asset Management
Net banking income 269 259 286 338 333 305 295 348 340Operating expenses -154 -163 -178 -220 -193 -196 -186 -230 -212Gross operating income 115 96 108 118 140 109 109 118 128Net allocation to provisions 0 0 0 -2 0 0 0 1 0Operating income 115 96 108 116 140 109 109 119 128Net income from other assets 0 0 0 0 0 0 0 -1 0Net income from companies accounted for by the equity method 0 0 0 0 1 -1 0 0 0
Income tax -39 -33 -36 -39 -47 -38 -38 -39 -43Net income before minority interests 76 63 72 77 94 70 71 79 85 o.w. minority interests 9 7 7 8 9 2 3 2 3Net income 67 56 65 69 85 68 68 77 82Average allocated capital 287 327 307 272 287 293 276 265 277ROE after tax 93.4% 68.5% 84.7% 101.5% 118.5% 92.8% 98.6% 116.2% 118.4%
o.w. Private Banking
Net banking income 127 129 135 149 164 164 156 174 191Operating expenses -86 -90 -93 -107 -102 -106 -105 -121 -118Gross operating income 41 39 42 42 62 58 51 53 73Net allocation to provisions 0 0 -1 0 -2 0 -1 -1 0Operating income 41 39 41 42 60 58 50 52 73Net income from other assets 0 0 0 0 0 0 0 0 0Net income from companies accounted for by the equity method 0 0 0 0 0 0 0 0 0
Income tax -9 -9 -7 -8 -14 -14 -12 -9 -17Net income before minority interests 32 30 34 34 46 44 38 43 56 o.w. minority interests 2 2 2 2 3 3 2 4 3Net income 30 28 32 32 43 41 36 39 53Average allocated capital 283 316 329 340 376 386 372 377 396ROE after tax 42.4% 35.4% 38.9% 37.6% 45.7% 42.5% 38.7% 41.4% 53.5%
o.w. SG SS & Online Savings
Net banking income 206 220 219 247 272 306 316 362 388Operating expenses -175 -182 -184 -220 -228 -250 -273 -308 -319Gross operating income 31 38 35 27 44 56 43 54 69Net allocation to provisions 0 -1 0 -2 -1 -1 0 -3 -1Operating income 31 37 35 25 43 55 43 51 68Net income from other assets 0 0 0 0 0 0 0 0 0Net income from companies accounted for by the equity method 0 0 0 0 0 0 0 0 0
Income tax -10 -12 -13 -8 -14 -17 -15 -16 -23Net income before minority interests 21 25 22 17 29 38 28 35 45 o.w. minority interests 1 0 2 1 2 5 0 3 4Net income 20 25 20 16 27 33 28 32 41Average allocated capital 240 274 294 307 356 373 426 555 566ROE after tax 33.3% 36.5% 27.2% 20.8% 30.3% 35.4% 26.3% 23.1% 29.0%
2006 - IFRS(incl. IAS 32 & 39 and IFRS 4)
2005 - IFRS(incl. IAS 32 & 39 and IFRS 4)
2007 - IFRS(inc. IAS 32 & 39 and IFRS 4)
29/39
2006 - IFRS(incl. IAS 32 & 39 and IFRS 4)
2005 - IFRS(incl. IAS 32 & 39 and IFRS 4)
2007 - IFRS(inc. IAS 32 & 39 and IFRS 4)
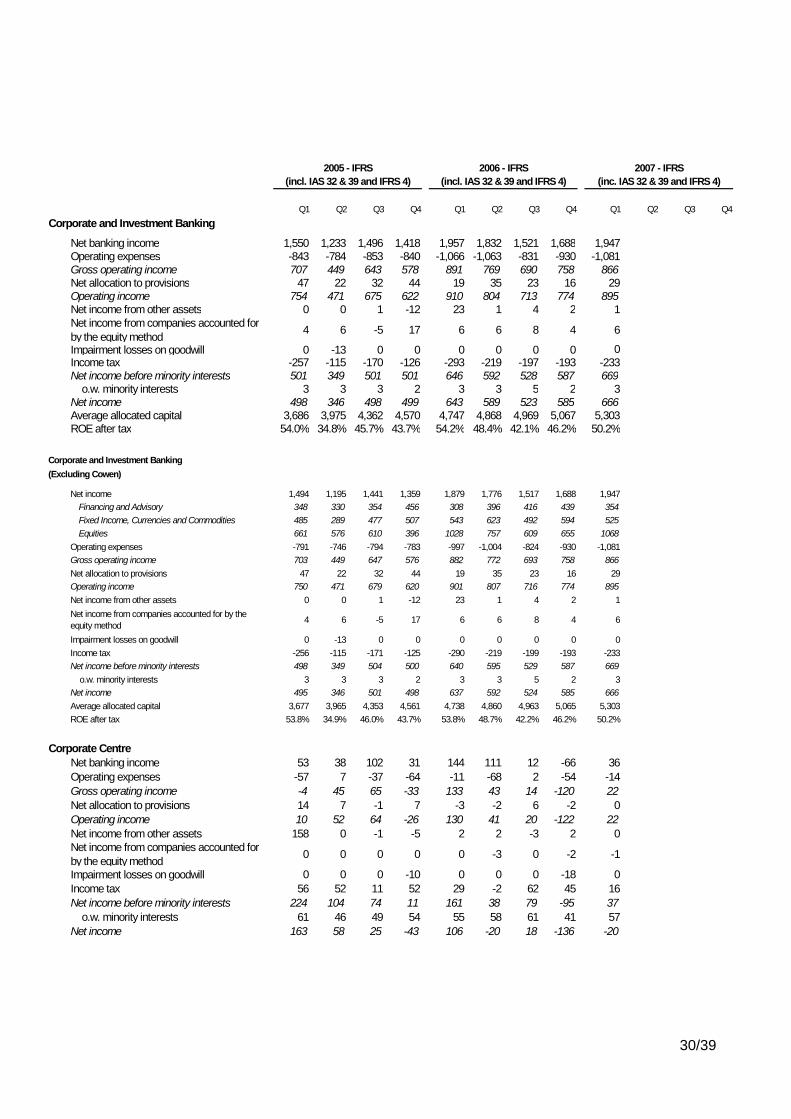
Q1 Q2 Q3 Q4 Q1 Q2 Q3 Q4 Q1 Q2 Q3 Q4Corporate and Investment Banking
Net banking income 1,550 1,233 1,496 1,418 1,957 1,832 1,521 1,688 1,947Operating expenses -843 -784 -853 -840 -1,066 -1,063 -831 -930 -1,081Gross operating income 707 449 643 578 891 769 690 758 866Net allocation to provisions 47 22 32 44 19 35 23 16 29Operating income 754 471 675 622 910 804 713 774 895Net income from other assets 0 0 1 -12 23 1 4 2 1Net income from companies accounted for by the equity method 4 6 -5 17 6 6 8 4 6
Impairment losses on goodwill 0 -13 0 0 0 0 0 0 0Income tax -257 -115 -170 -126 -293 -219 -197 -193 -233Net income before minority interests 501 349 501 501 646 592 528 587 669 o.w. minority interests 3 3 3 2 3 3 5 2 3Net income 498 346 498 499 643 589 523 585 666Average allocated capital 3,686 3,975 4,362 4,570 4,747 4,868 4,969 5,067 5,303ROE after tax 54.0% 34.8% 45.7% 43.7% 54.2% 48.4% 42.1% 46.2% 50.2%
Corporate and Investment Banking(Excluding Cowen)
Net income 1,494 1,195 1,441 1,359 1,879 1,776 1,517 1,688 1,947Financing and Advisory 348 330 354 456 308 396 416 439 354Fixed Income, Currencies and Commodities 485 289 477 507 543 623 492 594 525Equities 661 576 610 396 1028 757 609 655 1068
Operating expenses -791 -746 -794 -783 -997 -1,004 -824 -930 -1,081Gross operating income 703 449 647 576 882 772 693 758 866Net allocation to provisions 47 22 32 44 19 35 23 16 29Operating income 750 471 679 620 901 807 716 774 895Net income from other assets 0 0 1 -12 23 1 4 2 1Net income from companies accounted for by the equity method 4 6 -5 17 6 6 8 4 6
Impairment losses on goodwill 0 -13 0 0 0 0 0 0 0Income tax -256 -115 -171 -125 -290 -219 -199 -193 -233Net income before minority interests 498 349 504 500 640 595 529 587 669 o.w. minority interests 3 3 3 2 3 3 5 2 3Net income 495 346 501 498 637 592 524 585 666Average allocated capital 3,677 3,965 4,353 4,561 4,738 4,860 4,963 5,065 5,303ROE after tax 53.8% 34.9% 46.0% 43.7% 53.8% 48.7% 42.2% 46.2% 50.2%
Corporate CentreNet banking income 53 38 102 31 144 111 12 -66 36Operating expenses -57 7 -37 -64 -11 -68 2 -54 -14Gross operating income -4 45 65 -33 133 43 14 -120 22Net allocation to provisions 14 7 -1 7 -3 -2 6 -2 0Operating income 10 52 64 -26 130 41 20 -122 22Net income from other assets 158 0 -1 -5 2 2 -3 2 0Net income from companies accounted for by the equity method 0 0 0 0 0 -3 0 -2 -1
Impairment losses on goodwill 0 0 0 -10 0 0 0 -18 0Income tax 56 52 11 52 29 -2 62 45 16Net income before minority interests 224 104 74 11 161 38 79 -95 37 o.w. minority interests 61 46 49 54 55 58 61 41 57Net income 163 58 25 -43 106 -20 18 -136 -20
30/39
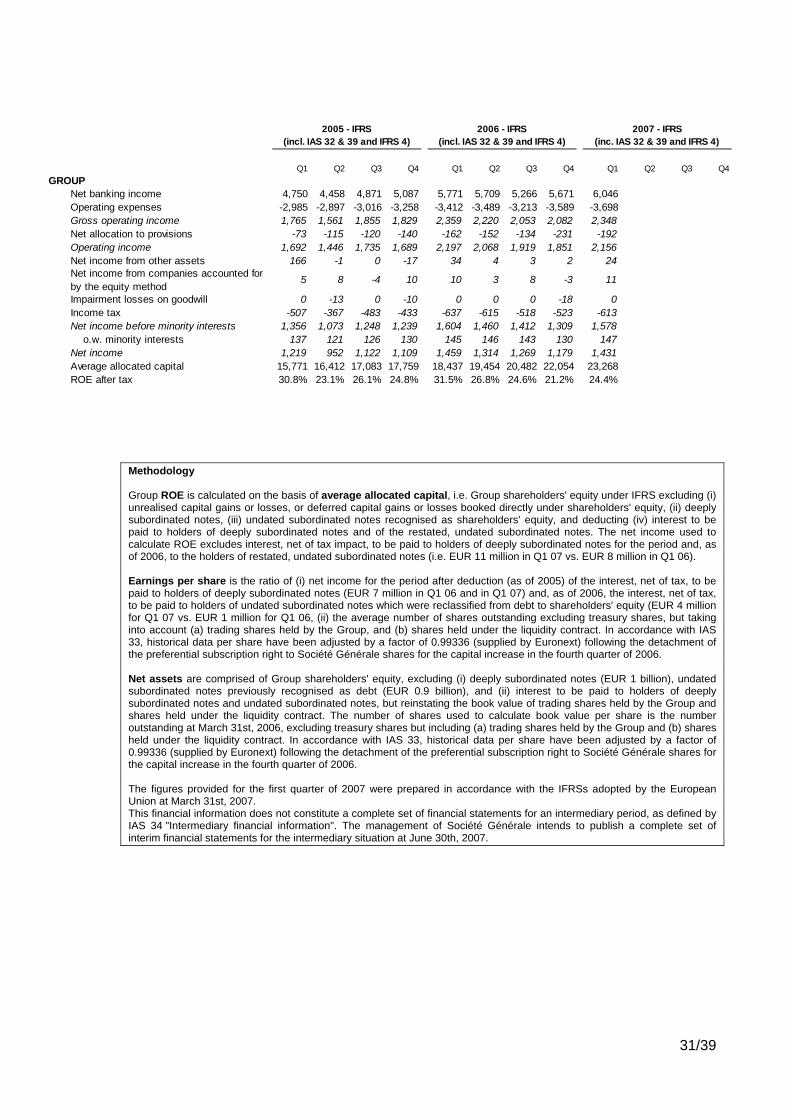
Methodology Group ROE is calculated on the basis of average allocated capital, i.e. Group shareholders' equity under IFRS excluding (i) unrealised capital gains or losses, or deferred capital gains or losses booked directly under shareholders' equity, (ii) deeply subordinated notes, (iii) undated subordinated notes recognised as shareholders' equity, and deducting (iv) interest to be paid to holders of deeply subordinated notes and of the restated, undated subordinated notes. The net income used to calculate ROE excludes interest, net of tax impact, to be paid to holders of deeply subordinated notes for the period and, as of 2006, to the holders of restated, undated subordinated notes (i.e. EUR 11 million in Q1 07 vs. EUR 8 million in Q1 06). Earnings per share is the ratio of (i) net income for the period after deduction (as of 2005) of the interest, net of tax, to be paid to holders of deeply subordinated notes (EUR 7 million in Q1 06 and in Q1 07) and, as of 2006, the interest, net of tax, to be paid to holders of undated subordinated notes which were reclassified from debt to shareholders' equity (EUR 4 million for Q1 07 vs. EUR 1 million for Q1 06, (ii) the average number of shares outstanding excluding treasury shares, but taking into account (a) trading shares held by the Group, and (b) shares held under the liquidity contract. In accordance with IAS 33, historical data per share have been adjusted by a factor of 0.99336 (supplied by Euronext) following the detachment of the preferential subscription right to Société Générale shares for the capital increase in the fourth quarter of 2006. Net assets are comprised of Group shareholders' equity, excluding (i) deeply subordinated notes (EUR 1 billion), undated subordinated notes previously recognised as debt (EUR 0.9 billion), and (ii) interest to be paid to holders of deeply subordinated notes and undated subordinated notes, but reinstating the book value of trading shares held by the Group and shares held under the liquidity contract. The number of shares used to calculate book value per share is the number outstanding at March 31st, 2006, excluding treasury shares but including (a) trading shares held by the Group and (b) shares held under the liquidity contract. In accordance with IAS 33, historical data per share have been adjusted by a factor of 0.99336 (supplied by Euronext) following the detachment of the preferential subscription right to Société Générale shares for the capital increase in the fourth quarter of 2006. The figures provided for the first quarter of 2007 were prepared in accordance with the IFRSs adopted by the European Union at March 31st, 2007. This financial information does not constitute a complete set of financial statements for an intermediary period, as defined by IAS 34 "Intermediary financial information". The management of Société Générale intends to publish a complete set of interim financial statements for the intermediary situation at June 30th, 2007.
Q1 Q2 Q3 Q4 Q1 Q2 Q3 Q4 Q1 Q2 Q3 Q4GROUP
Net banking income 4,750 4,458 4,871 5,087 5,771 5,709 5,266 5,671 6,046Operating expenses -2,985 -2,897 -3,016 -3,258 -3,412 -3,489 -3,213 -3,589 -3,698Gross operating income 1,765 1,561 1,855 1,829 2,359 2,220 2,053 2,082 2,348Net allocation to provisions -73 -115 -120 -140 -162 -152 -134 -231 -192Operating income 1,692 1,446 1,735 1,689 2,197 2,068 1,919 1,851 2,156Net income from other assets 166 -1 0 -17 34 4 3 2 24Net income from companies accounted for by the equity method
5 8 -4 10 10 3 8 -3 11
Impairment losses on goodwill 0 -13 0 -10 0 0 0 -18 0Income tax -507 -367 -483 -433 -637 -615 -518 -523 -613Net income before minority interests 1,356 1,073 1,248 1,239 1,604 1,460 1,412 1,309 1,578 o.w. minority interests 137 121 126 130 145 146 143 130 147Net income 1,219 952 1,122 1,109 1,459 1,314 1,269 1,179 1,431Average allocated capital 15,771 16,412 17,083 17,759 18,437 19,454 20,482 22,054 23,268ROE after tax 30.8% 23.1% 26.1% 24.8% 31.5% 26.8% 24.6% 21.2% 24.4%
2006 - IFRS(incl. IAS 32 & 39 and IFRS 4)
2005 - IFRS(incl. IAS 32 & 39 and IFRS 4)
2007 - IFRS(inc. IAS 32 & 39 and IFRS 4)
31/39
5.3 Prudential ratio management
As part of the prudential ratio management, the Group recently launched 2 issues:
- 1 000 000 000 USD aggregate principal amount of undated deeply
subordinated notes (Tier 1), issued in 2 tranches on the 5 th of April;
- 350 000 000 GBP aggregate principal amount of undated subordinated notes (upper Tier II), issued on the 27 th of march.
32/39
VI. CHAPTER 11: LEGAL INFORMATION
6.1 Amendment to Société Générale’s by-laws (in effect on May 14th 2007)
• Article 7 I - DIRECTORS The Company is administered by a Board of Directors made up of two categories of Directors: 1. Directors appointed by the Shareholders’ Ordinary General Meeting.
There are at least nine of these Directors, and thirteen at the most. The functions of directors appointed by the Ordinary General Meeting shall expire four years after the approval of the current article. This provision does not apply to Directors in office at the time of this approval. When, in application of current legal and statutory provisions, a Director is appointed to replace another, then his term of office shall not exceed that term of office remaining to be served by his predecessor. Each Director must hold at least 600 shares.
2. Directors elected by personnel. The status and methods of electing these Directors are laid down by articles L. 225-27 to L. 225-34 of the French Commercial Code, as well as by these by-laws. There are two directors, one to represent the executives and one to represent all other Company personnel. In any event, their number may not exceed one-third of the Directors appointed by the General Meeting. Their term of office is three years.
Regardless of the appointment procedure, the duties of a Director cease at the end of the Ordinary General Meeting called to approve the financial statements of the previous fiscal year and held during the year in which his term of office expires. Directors may be re-elected, as long as they meet the legal provisions, particularly with regard to age. The rest of the article is unchanged.
• Article 14 The General Meeting is called and deliberates as provided for by the legal and regulatory provisions in force. It meets at the Company’s head office or in any other place in metropolitan France indicated in the notice to attend the meeting. Such meetings are chaired by the Chairman of the Board or, in his absence, by a Director appointed for this purpose by the Chairman of the Board. Regardless of the number of share held, all shareholders whose shares are registered under the terms and at the date set forth by decree have the right, upon proof of their identity and status as a shareholder, to participate in the General Meetings. They may, as provided for by the legal and regulatory provisions in force, personally attend the meetings, vote remotely or appoint a proxy.
33/39

The intermediary registered on behalf of shareholders may participate in the General Meetings, as provided for by the legal and regulatory provisions in force. In order for the ballots to be counted, they must be received by the Company at least two days before the meeting is held, unless a shorter period is specified in the meeting notice or required by the regulations in force. Shareholders may participate in General Meetings by videoconference or any other means of telecommunication, when stipulated in the meeting notice and subject to the conditions provided therein. The meeting may be publicly broadcast by means of electronic communications subject to the approval and under the terms set by the Board of Directors. Notice will be given in the preliminary notice of meeting and/or notice to attend the Meeting. The rest of the article is unchanged.
34/39
VII. PERSON RESPONSIBLE FOR THE UPDATE TO THE REGISTRATION DOCUMENT
7.1 Person responsible for the update to the registration document
M. Daniel Bouton, Chairman and Chief Executive Officer of Société Générale
7.2 Certification of the person responsible for the update to the Registration Document
Having taken all reasonable care to ensure that such is the case, I hereby certify that the information set out in the present update to the 2007 Registration Document is, to the best of my knowledge, true and there are no omissions that could impair its meaning. I have obtained from the Statutory Auditors a letter certifying that they have verified all information contained in the present update relating to the Group’s financial position and accounts and that they have read the entire update to the Registration Document. The Statutory Auditors have verified the historical financial data given in the 2007 Registration Document, as reported on pages 246 to 247 and 301 to 302 of the said document. They have also verified the data enclosed by reference for financial years 2005 and 2004, as reported on pages 215 to 216 of the 2006 Registration Document and page 209 of the 2004 Annual Report respectively. The Statutory Auditors’ reports on the 2006 parent company financial statements and consolidated statements for 2005 contain one observation.
Paris May 25, 2007
The Chairman and Chief Executive Officer Daniel BOUTON
35/39
7.3 Persons responsible for the audit of the financial statements
STATUTORY AUDITORS Name: Cabinet Ernst & Young Audit represented by Philippe Peuch-Lestrade Address: 11, allée de l’Arche - 92400 Courbevoie Date of first appointment: April 18th 2000 Term of mandate: 6 fiscal years End of current mandate: at the close of the Ordinary General Meeting which will approve the financial statements for the year ended December 31st 2011.
Name: Société Deloitte et Associés represented by José-Luis Garcia Address: 185, avenue Charles de Gaulle - 92200 Neuilly sur Seine Date of first appointment: April 18th 2003 Term of mandate: 6 fiscal years End of current mandate: at the close of the Ordinary General Meeting which will approve the financial statements for the year ended December 31st 2011. SUBSTITUTE STATUTORY AUDITORS Gabriel Galet Alain Pons
36/39
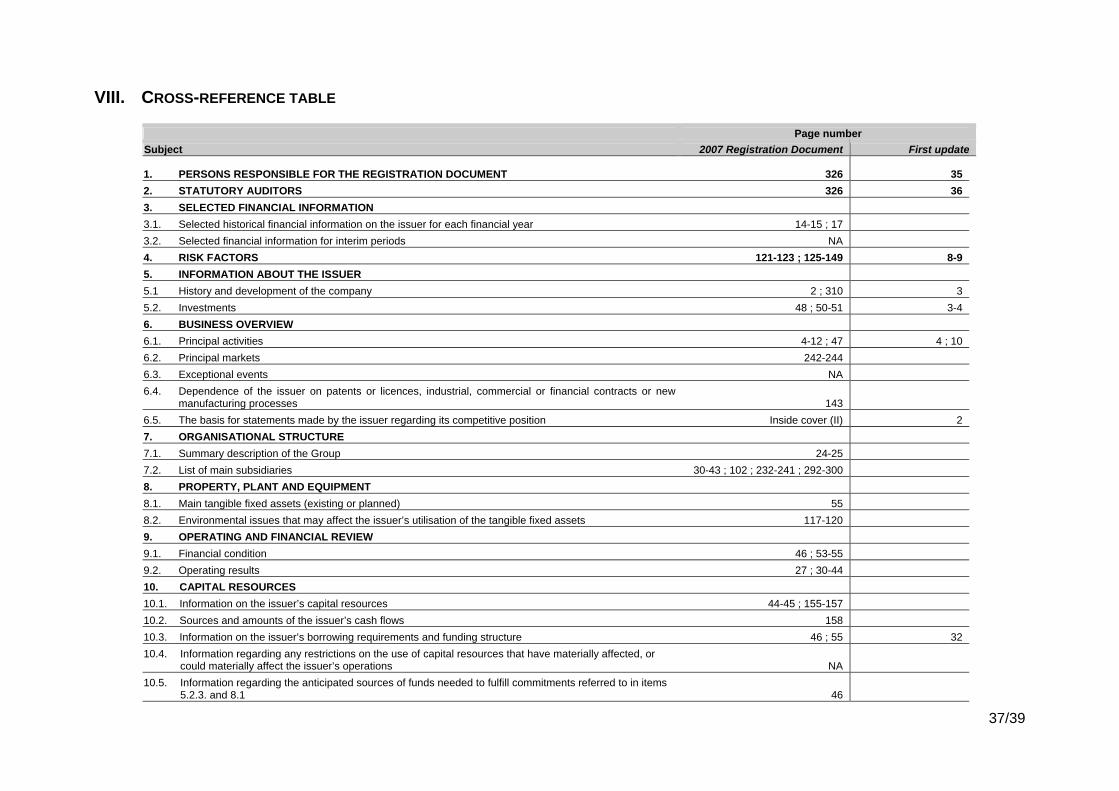
VIII. CROSS-REFERENCE TABLE
Page number Subject 2007 Registration Document First update
1. PERSONS RESPONSIBLE FOR THE REGISTRATION DOCUMENT 326 35 2. STATUTORY AUDITORS 326 36 3. SELECTED FINANCIAL INFORMATION 3.1. Selected historical financial information on the issuer for each financial year 14-15 ; 17 3.2. Selected financial information for interim periods NA 4. RISK FACTORS 121-123 ; 125-149 8-9 5. INFORMATION ABOUT THE ISSUER 5.1 History and development of the company 2 ; 310 3 5.2. Investments 48 ; 50-51 3-4 6. BUSINESS OVERVIEW 6.1. Principal activities 4-12 ; 47 4 ; 10 6.2. Principal markets 242-244 6.3. Exceptional events NA 6.4. Dependence of the issuer on patents or licences, industrial, commercial or financial contracts or new
manufacturing processes 143 6.5. The basis for statements made by the issuer regarding its competitive position Inside cover (II) 2 7. ORGANISATIONAL STRUCTURE 7.1. Summary description of the Group 24-25 7.2. List of main subsidiaries 30-43 ; 102 ; 232-241 ; 292-300 8. PROPERTY, PLANT AND EQUIPMENT 8.1. Main tangible fixed assets (existing or planned) 55 8.2. Environmental issues that may affect the issuer’s utilisation of the tangible fixed assets 117-120 9. OPERATING AND FINANCIAL REVIEW 9.1. Financial condition 46 ; 53-55 9.2. Operating results 27 ; 30-44 10. CAPITAL RESOURCES 10.1. Information on the issuer’s capital resources 44-45 ; 155-157 10.2. Sources and amounts of the issuer’s cash flows 158 10.3. Information on the issuer’s borrowing requirements and funding structure 46 ; 55 32 10.4. Information regarding any restrictions on the use of capital resources that have materially affected, or
could materially affect the issuer’s operations NA 10.5. Information regarding the anticipated sources of funds needed to fulfill commitments referred to in items
5.2.3. and 8.1 46
37/39
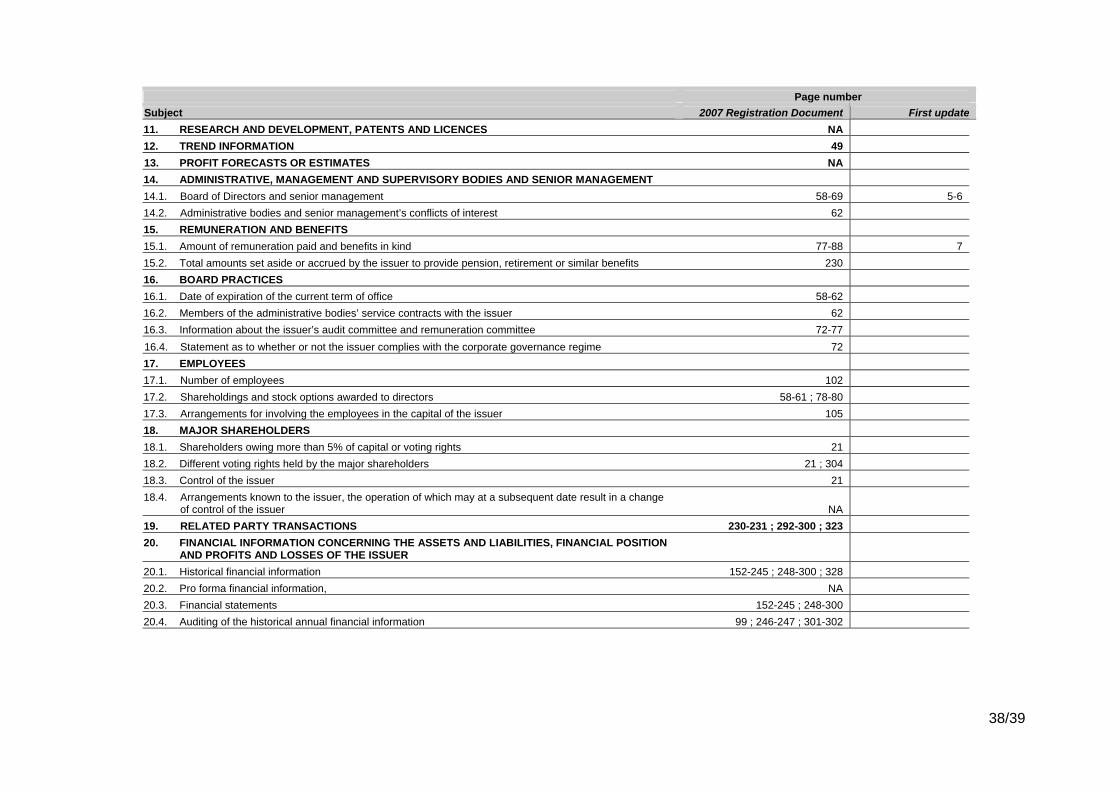
Page number Subject 2007 Registration Document First update 11. RESEARCH AND DEVELOPMENT, PATENTS AND LICENCES NA 12. TREND INFORMATION 49 13. PROFIT FORECASTS OR ESTIMATES NA 14. ADMINISTRATIVE, MANAGEMENT AND SUPERVISORY BODIES AND SENIOR MANAGEMENT 14.1. Board of Directors and senior management 58-69 5-6 14.2. Administrative bodies and senior management’s conflicts of interest 62 15. REMUNERATION AND BENEFITS 15.1. Amount of remuneration paid and benefits in kind 77-88 7 15.2. Total amounts set aside or accrued by the issuer to provide pension, retirement or similar benefits 230 16. BOARD PRACTICES 16.1. Date of expiration of the current term of office 58-62 16.2. Members of the administrative bodies’ service contracts with the issuer 62 16.3. Information about the issuer’s audit committee and remuneration committee 72-77 16.4. Statement as to whether or not the issuer complies with the corporate governance regime 72 17. EMPLOYEES 17.1. Number of employees 102 17.2. Shareholdings and stock options awarded to directors 58-61 ; 78-80 17.3. Arrangements for involving the employees in the capital of the issuer 105 18. MAJOR SHAREHOLDERS 18.1. Shareholders owing more than 5% of capital or voting rights 21 18.2. Different voting rights held by the major shareholders 21 ; 304 18.3. Control of the issuer 21 18.4. Arrangements known to the issuer, the operation of which may at a subsequent date result in a change
of control of the issuer NA 19. RELATED PARTY TRANSACTIONS 230-231 ; 292-300 ; 323 20. FINANCIAL INFORMATION CONCERNING THE ASSETS AND LIABILITIES, FINANCIAL POSITION
AND PROFITS AND LOSSES OF THE ISSUER 20.1. Historical financial information 152-245 ; 248-300 ; 328 20.2. Pro forma financial information, NA 20.3. Financial statements 152-245 ; 248-300 20.4. Auditing of the historical annual financial information 99 ; 246-247 ; 301-302
38/39
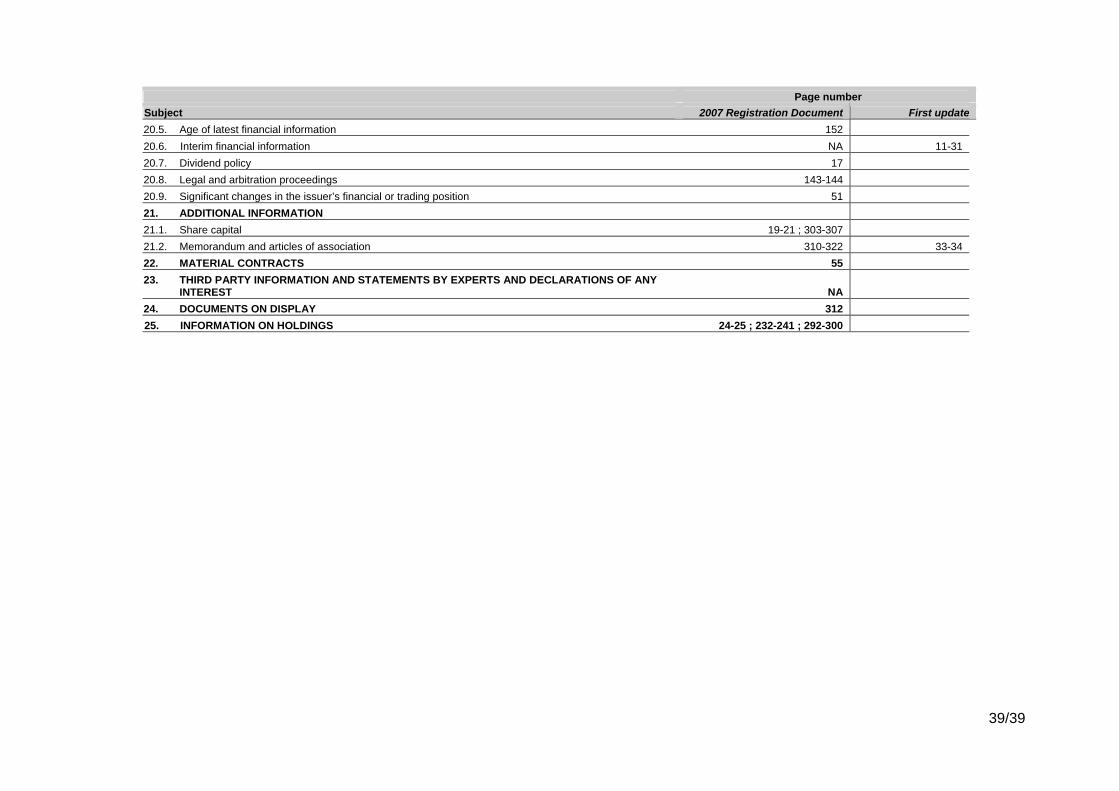
Page number Subject 2007 Registration Document First update 20.5. Age of latest financial information 152 20.6. Interim financial information NA 11-31 20.7. Dividend policy 17 20.8. Legal and arbitration proceedings 143-144 20.9. Significant changes in the issuer’s financial or trading position 51 21. ADDITIONAL INFORMATION 21.1. Share capital 19-21 ; 303-307 21.2. Memorandum and articles of association 310-322 33-34 22. MATERIAL CONTRACTS 55 23. THIRD PARTY INFORMATION AND STATEMENTS BY EXPERTS AND DECLARATIONS OF ANY
INTEREST NA 24. DOCUMENTS ON DISPLAY 312 25. INFORMATION ON HOLDINGS 24-25 ; 232-241 ; 292-300
39/39