Embed Size (px)
Citation preview
FIRST TELECOMMUNICATION REGULATORY MEETING FOR THE ARAB REGION
CORPORATE NETWORKS AND OPENING OF FIXED SERVICES
Mostafa TERRAB
Lead Regulatory Specialist
ALGIERS, April 19, 2003
OUTLINE
• Why are competitive fixed-services and corporate networks important?
• Regional telecom specificities
• Options for improving fixed-services and corporate network provision
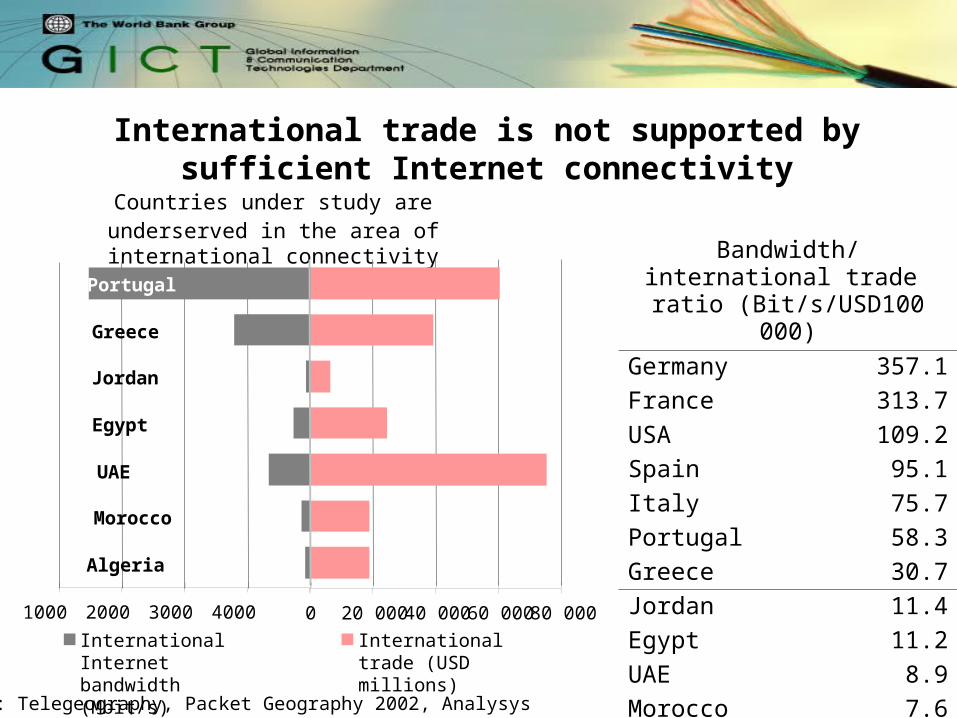
International trade is not supported by sufficient Internet connectivity
Countries under study are underserved in the area of international connectivity
Source: Telegeography, Packet Geography 2002, Analysys
0 20 000 40 000 60 000 80 000
Algeria
Morocco
UAE
Egypt
Jordan
Greece
Portugal
1000 2000 3000 4000
International trade (USD millions)
International Internet bandwidth (Mbit/s)
Bandwidth/international trade ratio (Bit/s/USD100 000)
Germany 357.1
France 313.7
USA 109.2
Spain 95.1
Italy 75.7
Portugal 58.3
Greece 30.7
Jordan 11.4
Egypt 11.2
UAE 8.9
Morocco 7.6
Algeria 4.6
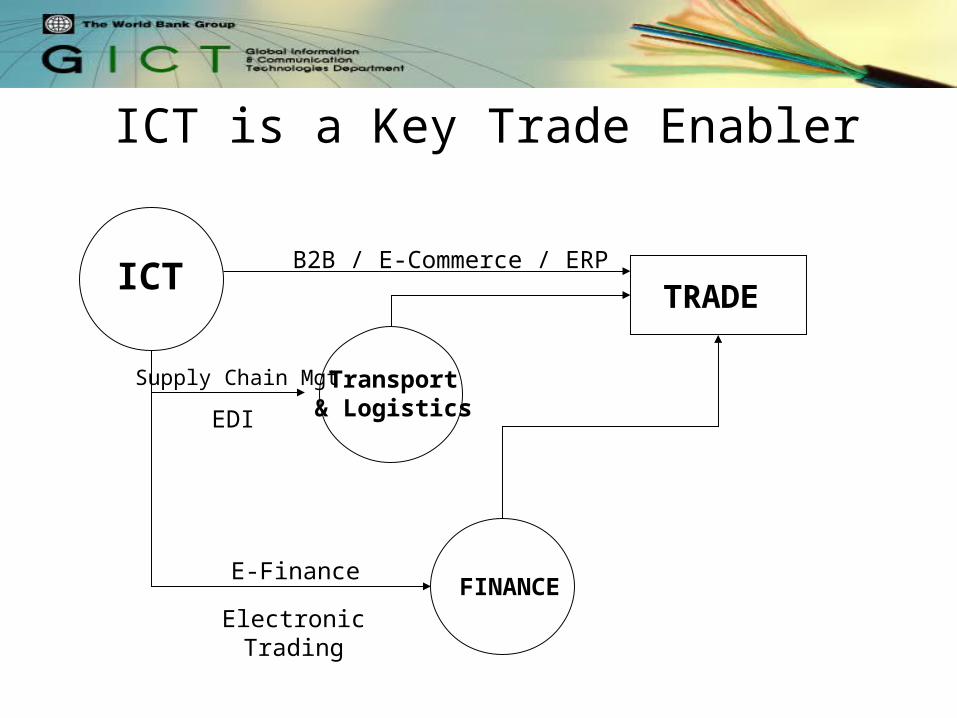
ICT is a Key Trade Enabler
ICTTRADE
FINANCE
Transport& Logistics
B2B / E-Commerce / ERP
E-Finance
Supply Chain Mgt
EDI
ElectronicTrading
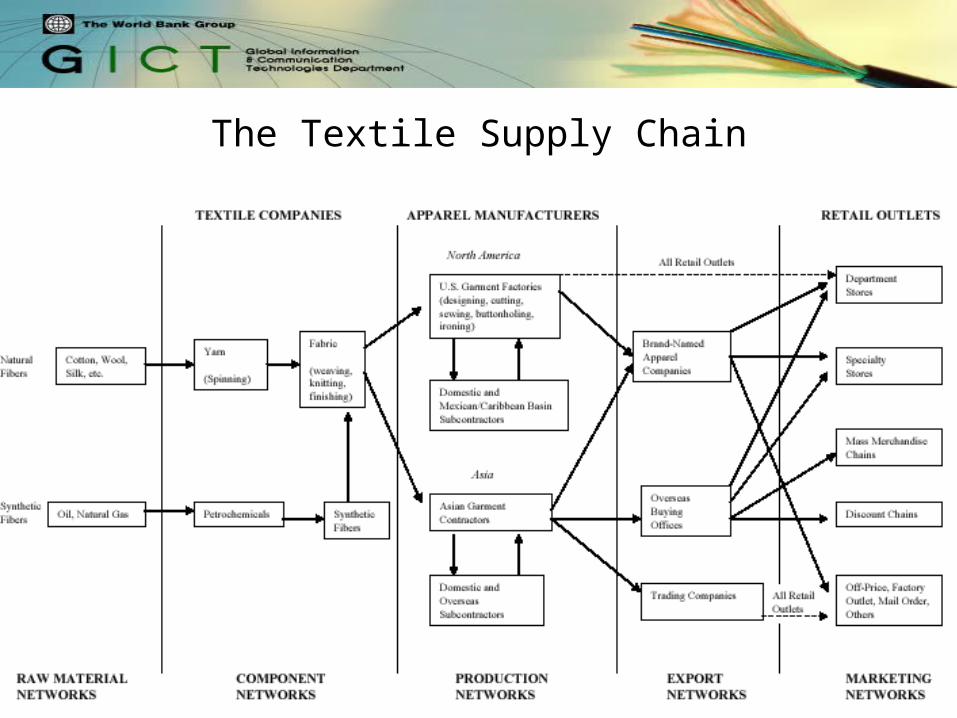
The Textile Supply Chain
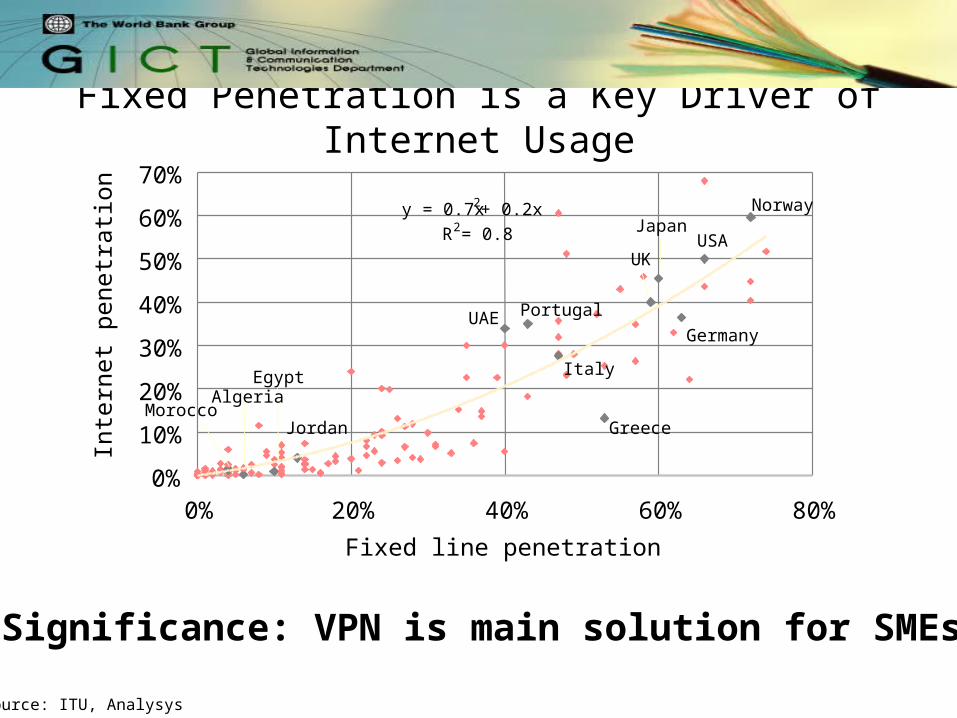
Fixed Penetration is a Key Driver of Internet Usage
Source: ITU, Analysys
y = 0.7x2 + 0.2x
R2 = 0.8
0%
10%
20%
30%
40%
50%
60%
70%
0% 20% 40% 60% 80%
Fixed line penetration
Inte
rnet
pen
etra
tion
AlgeriaMorocco
Egypt
Jordan
UAE
Greece
Germany
Italy
Portugal
UKUSA
JapanNorway
Significance: VPN is main solution for SMEs
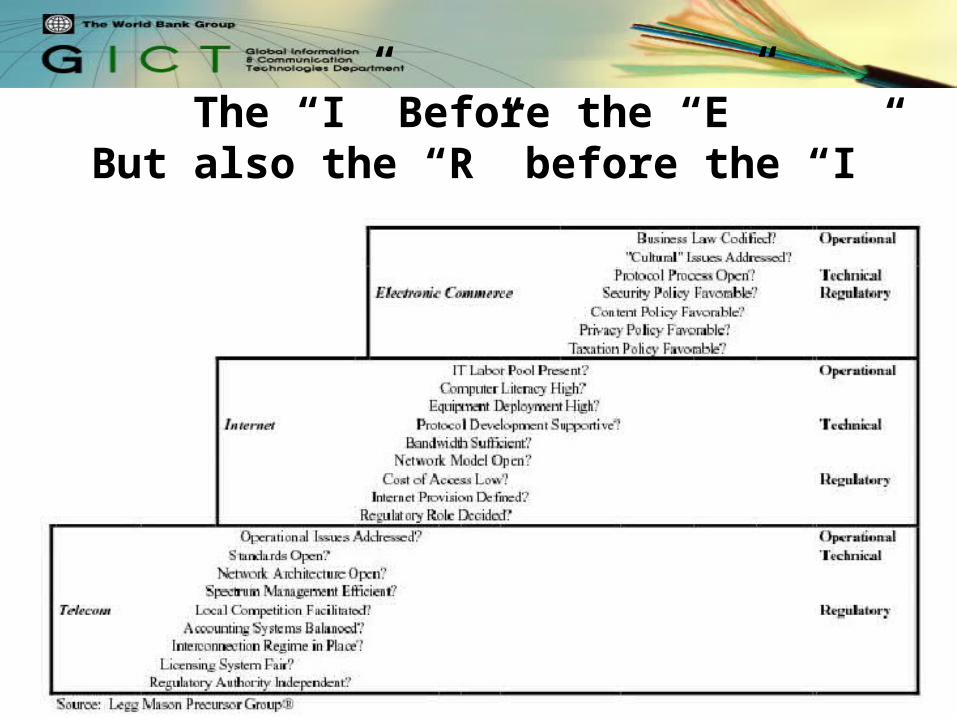
The “I” Before the “E” But also the “R” before the “I”
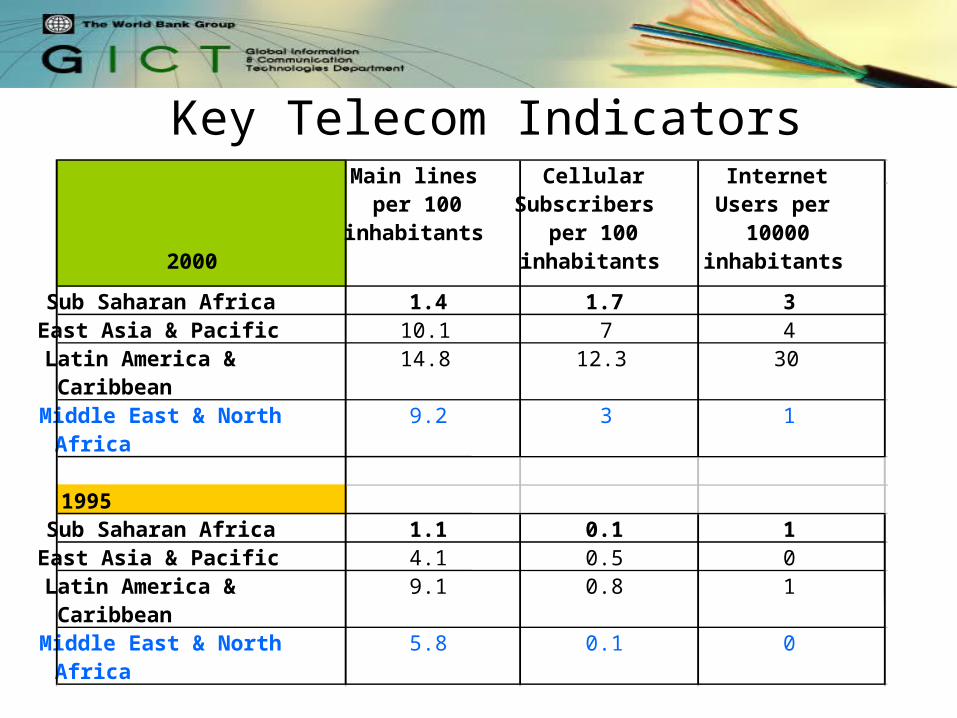
Key Telecom Indicators
Sub Saharan Africa 1.4 1.7 3East Asia & Pacific 10.1 7 4Latin America & Caribbean
14.8 12.3 30
Middle East & North Africa
9.2 3 1
1995Sub Saharan Africa 1.1 0.1 1East Asia & Pacific 4.1 0.5 0Latin America & Caribbean
9.1 0.8 1
Middle East & North Africa
5.8 0.1 0
2000
Main lines per 100
inhabitants
Cellular Subscribers
per 100 inhabitants
Internet Users per
10000 inhabitants
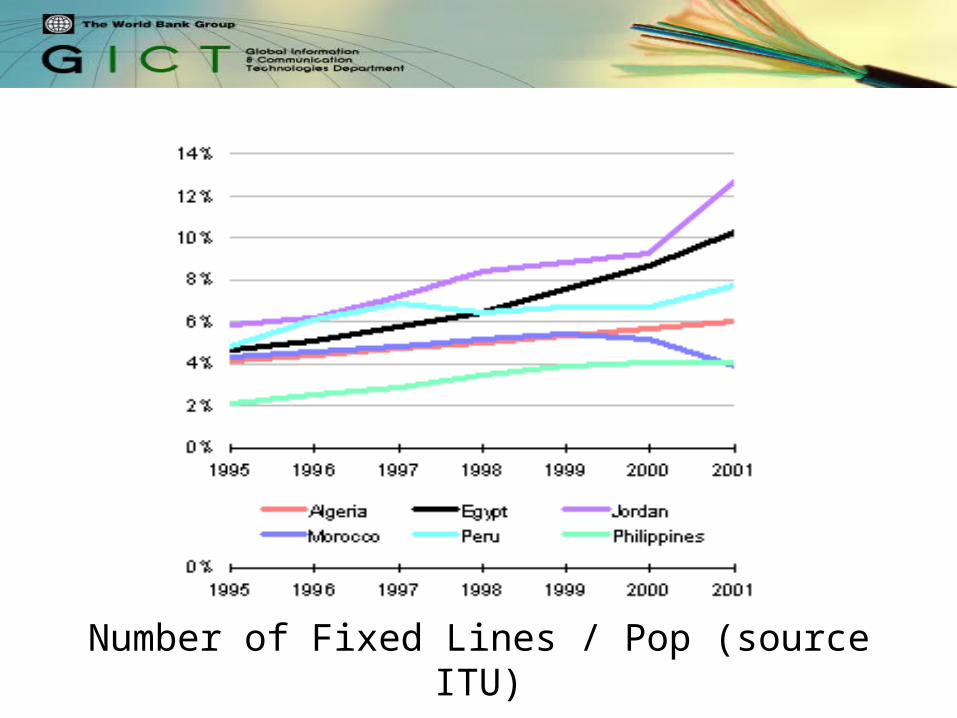
Number of Fixed Lines / Pop (source ITU)
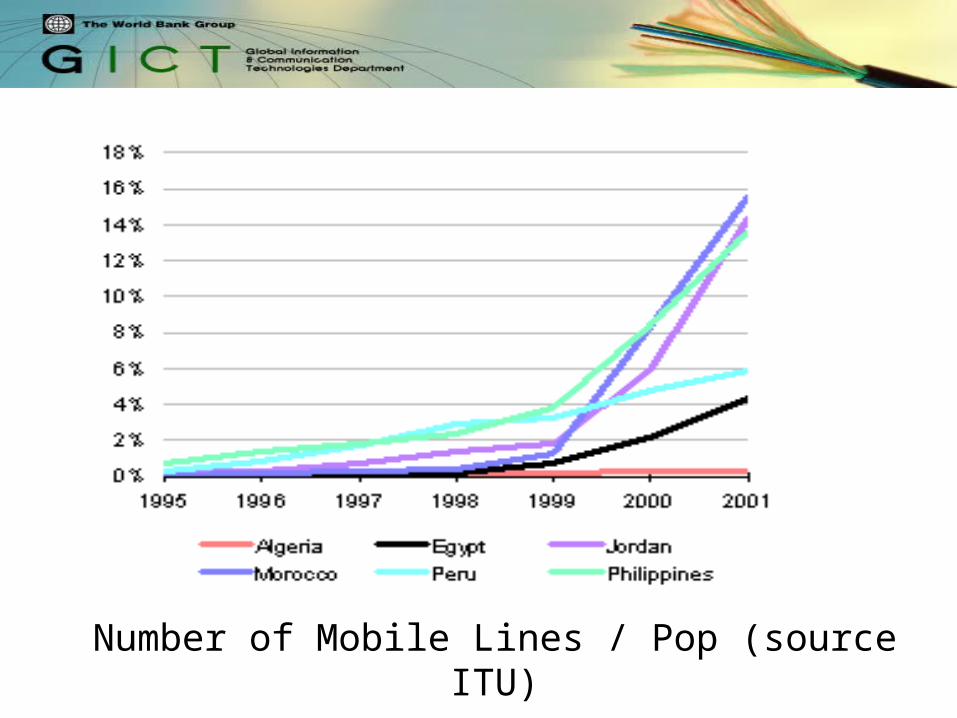
Number of Mobile Lines / Pop (source ITU)
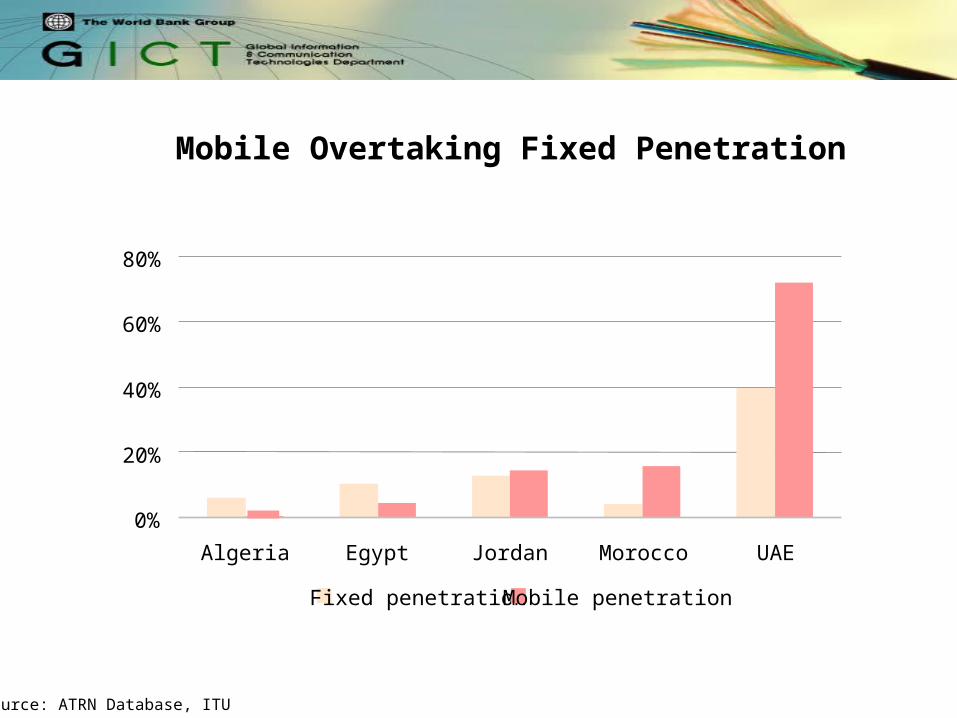
Source: ATRN Database, ITU
Mobile Overtaking Fixed Penetration
0%
20%
40%
60%
80%
Algeria Egypt Jordan Morocco UAE
Fixed penetration Mobile penetration
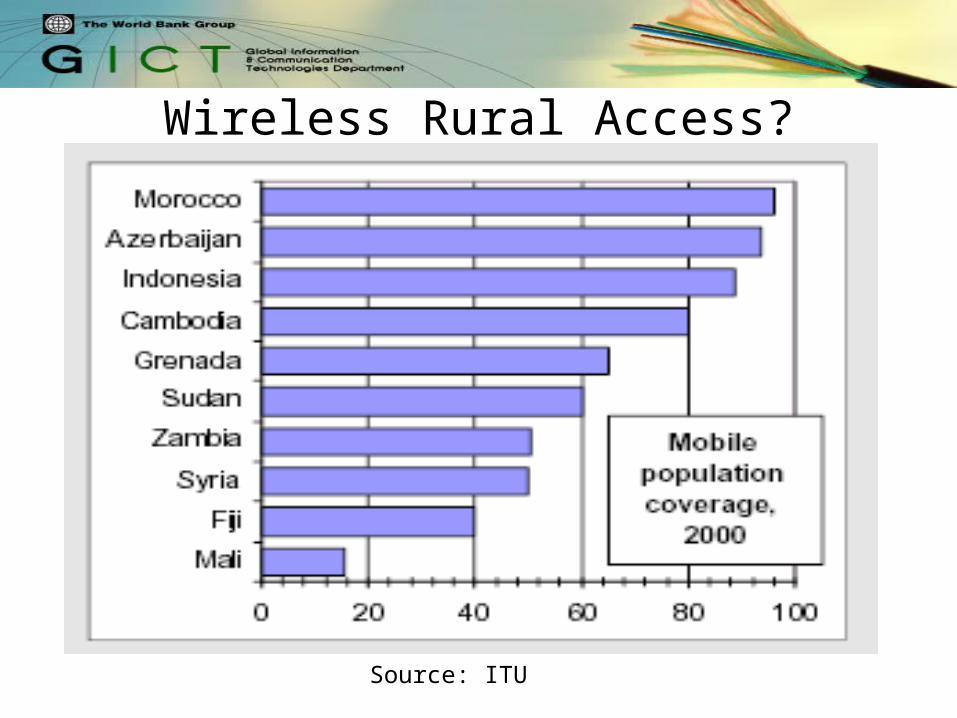
Wireless Rural Access?
Source: ITU
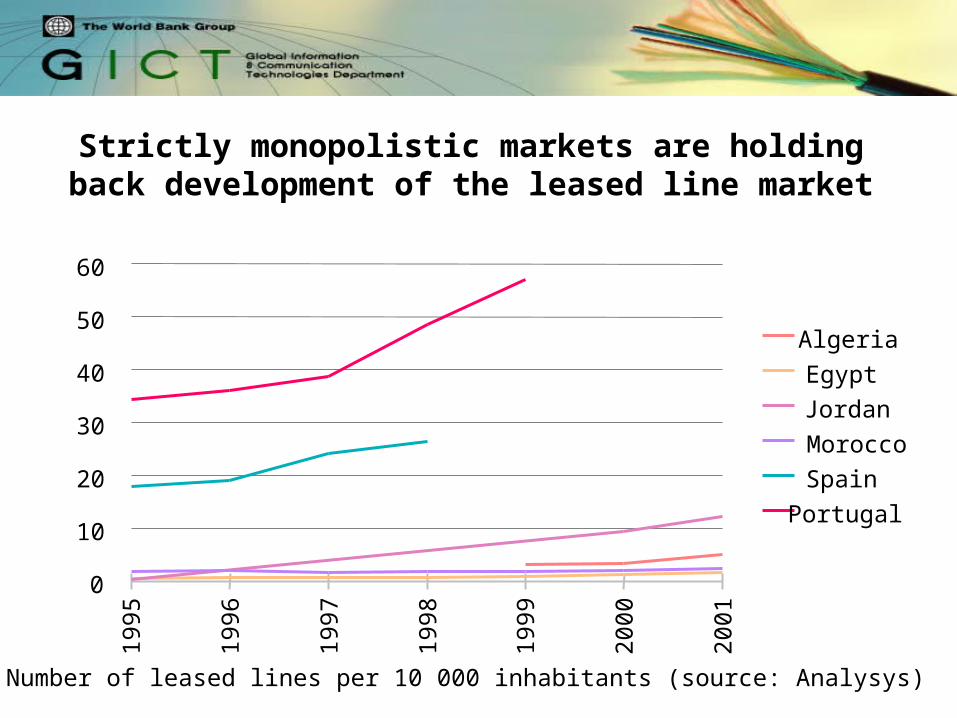
Strictly monopolistic markets are holding back development of the leased line market
Number of leased lines per 10 000 inhabitants (source: Analysys)
0
10
20
30
40
50
60
1995
1996
1997
1998
1999
2000
2001
Algeria
Egypt
Jordan
Morocco
Spain
Portugal
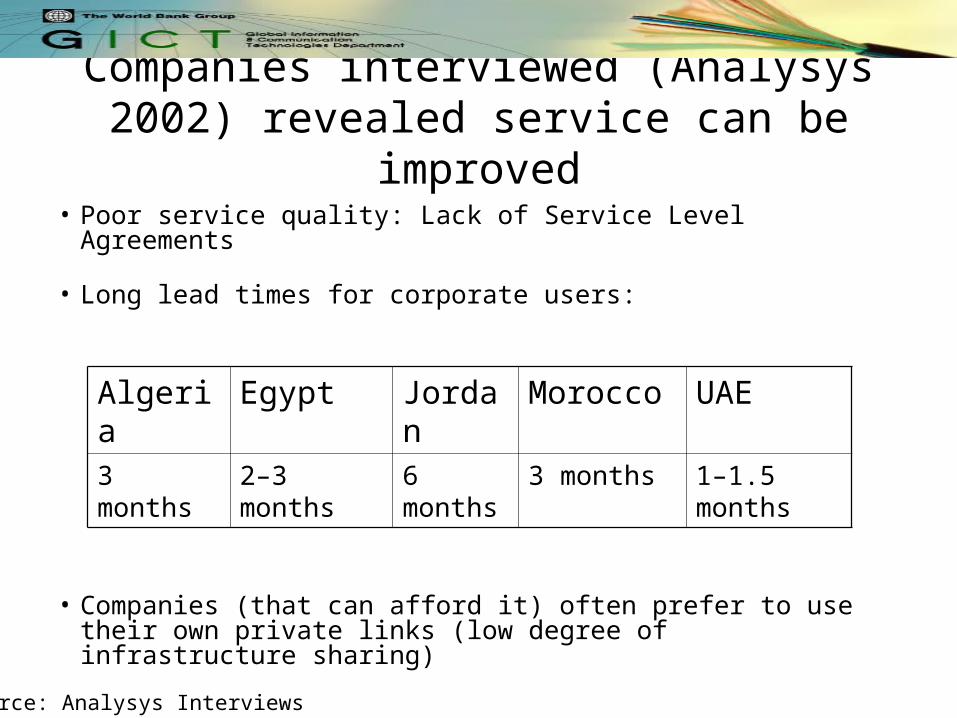
Companies interviewed (Analysys 2002) revealed service can be improved
• Poor service quality: Lack of Service Level Agreements
• Long lead times for corporate users:
• Companies (that can afford it) often prefer to use their own private links (low degree of infrastructure sharing)
Algeria Egypt Jordan Morocco UAE3 months 2–3 months 6
months3 months 1–1.5
months
Source: Analysys Interviews
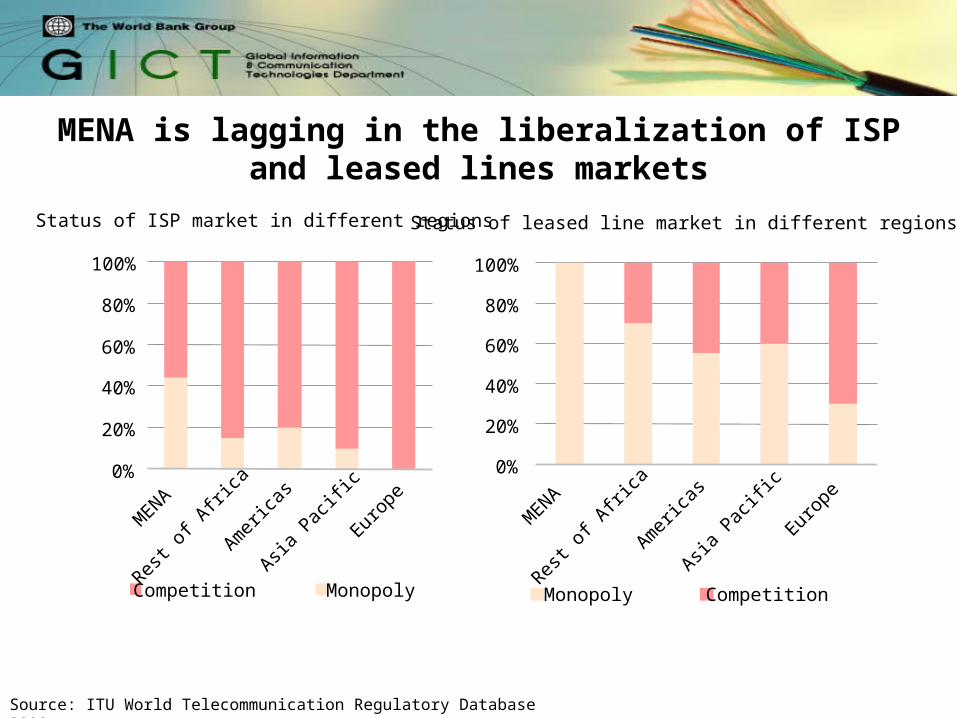
MENA is lagging in the liberalization of ISP and leased lines markets
Source: ITU World Telecommunication Regulatory Database 2000
Status of leased line market in different regions
0%
20%
40%
60%
80%
100%
MENA
Rest o
f Afri
ca
Amer
icas
Asia P
acific
Europ
e
Monopoly Competition
Status of ISP market in different regions
0%
20%
40%
60%
80%
100%
MENA
Rest o
f Afri
ca
Amer
icas
Asia P
acific
Europ
e
Competition Monopoly
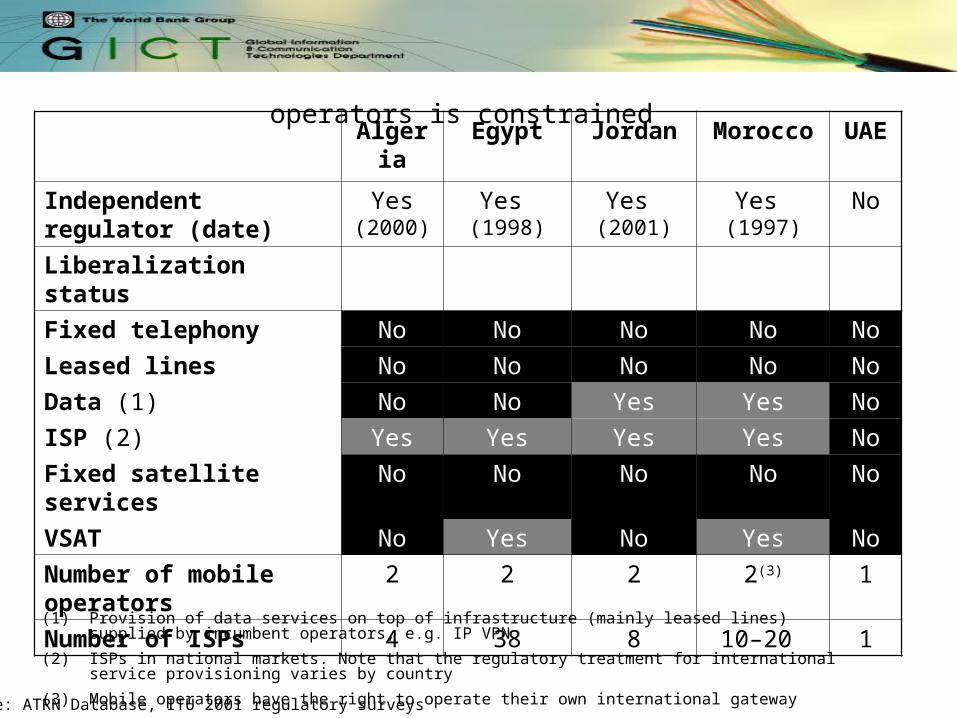
Data and leased lines delivery by alternative operators is constrained Algeria Egypt Jordan Morocco UAE
Independent regulator (date)
Yes (2000)
Yes (1998)
Yes (2001)
Yes (1997)
No
Liberalization status
Fixed telephony No No No No No
Leased lines No No No No No
Data (1) No No Yes Yes No
ISP (2) Yes Yes Yes Yes No
Fixed satellite services No No No No No
VSAT No Yes No Yes No
Number of mobile operators
2 2 2 2(3) 1
Number of ISPs 4 38 8 10–20 1
Source: ATRN Database, ITU 2001 regulatory surveys
(1) Provision of data services on top of infrastructure (mainly leased lines) supplied by incumbent operators, e.g. IP VPN
(2) ISPs in national markets. Note that the regulatory treatment for international service provisioning varies by country
(3) Mobile operators have the right to operate their own international gateway
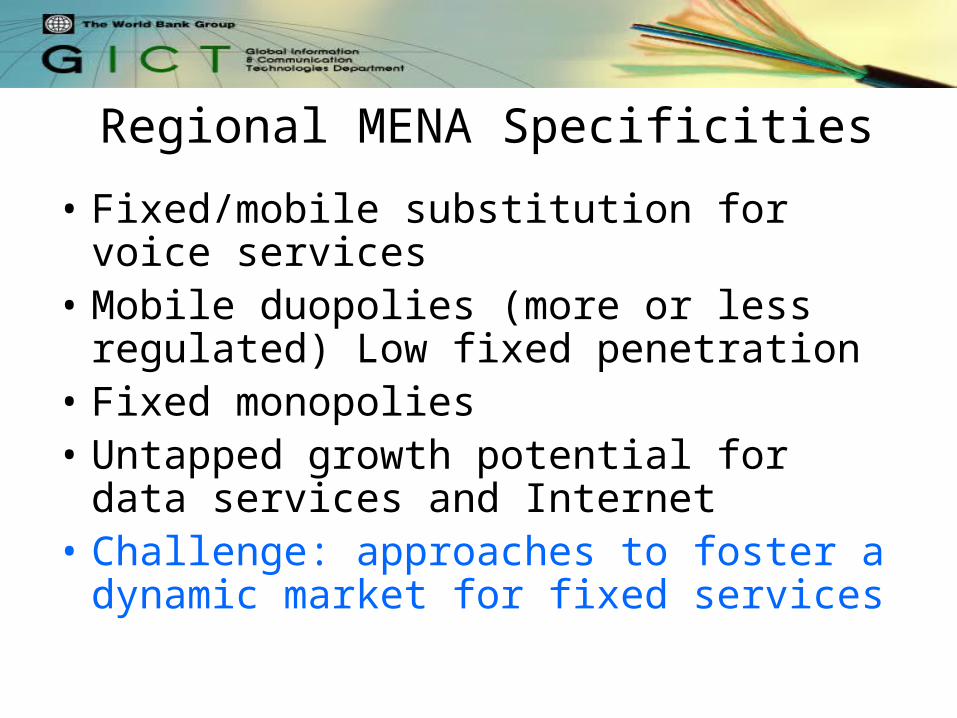
Regional MENA Specificities
• Fixed/mobile substitution for voice services
• Mobile duopolies (more or less regulated) Low fixed penetration
• Fixed monopolies• Untapped growth potential for data
services and Internet• Challenge: approaches to foster a
dynamic market for fixed services
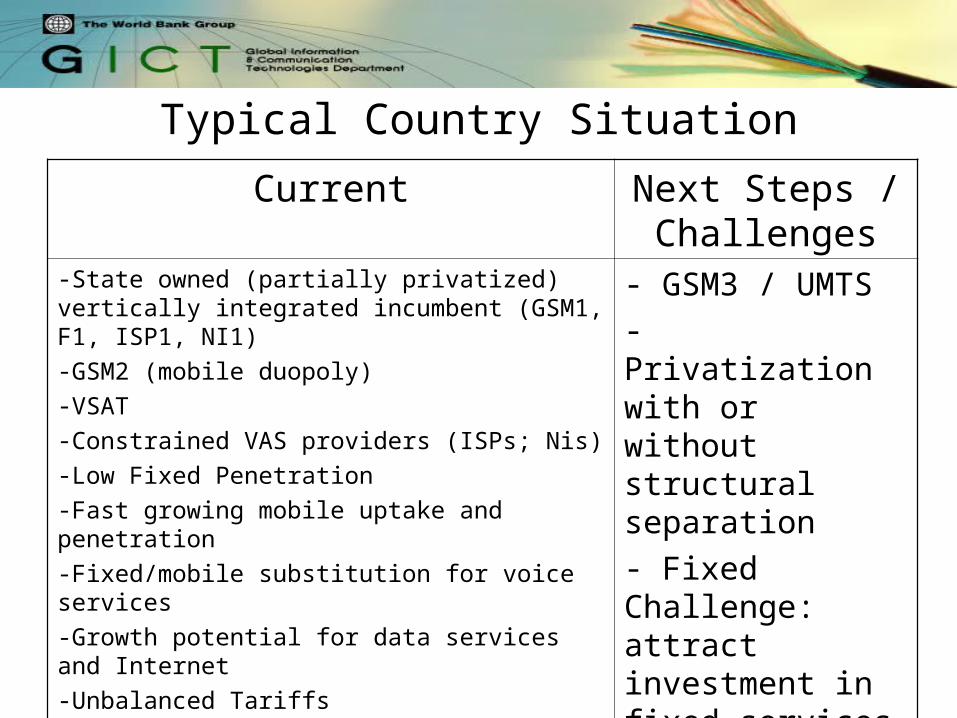
Typical Country Situation
Current Next Steps / Challenges
-State owned (partially privatized) vertically integrated incumbent (GSM1, F1, ISP1, NI1)
-GSM2 (mobile duopoly)
-VSAT
-Constrained VAS providers (ISPs; Nis)
-Low Fixed Penetration
-Fast growing mobile uptake and penetration
-Fixed/mobile substitution for voice services
-Growth potential for data services and Internet
-Unbalanced Tariffs
-High international tariffs
- GSM3 / UMTS- Privatization with or without structural separation- Fixed Challenge: attract investment in fixed services
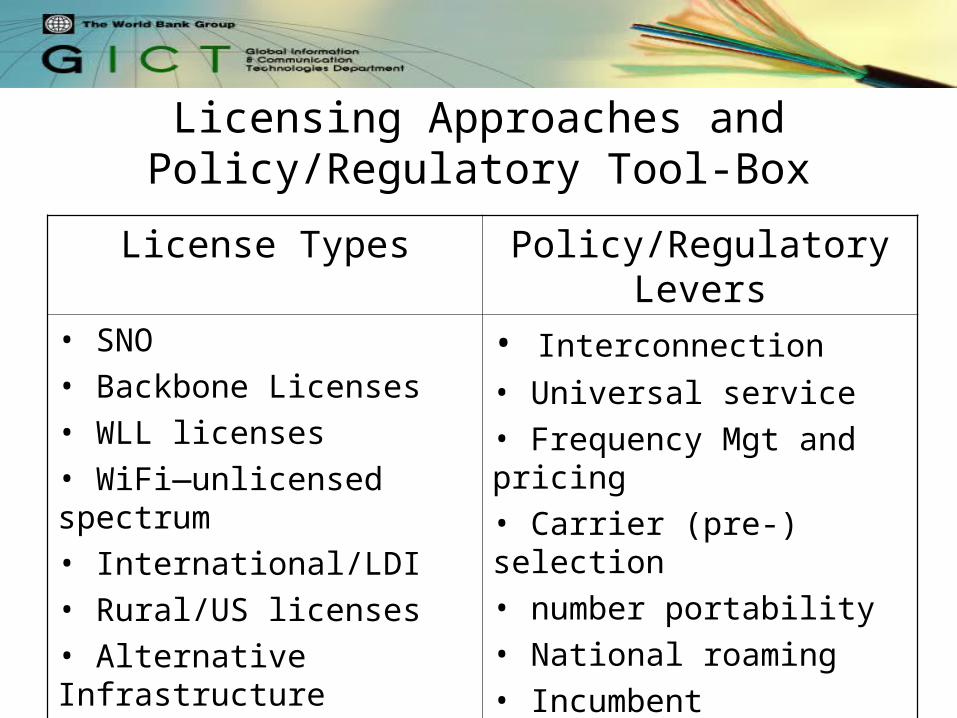
Licensing Approaches and Policy/Regulatory Tool-Box
License Types Policy/Regulatory Levers• SNO• Backbone Licenses• WLL licenses• WiFi—unlicensed spectrum• International/LDI• Rural/US licenses• Alternative Infrastructure licenses• Privatization approach• Structural Separation
• Interconnection
• Universal service• Frequency Mgt and pricing• Carrier (pre-) selection• number portability• National roaming• Incumbent regulation• Regulation of dominance• Market structure
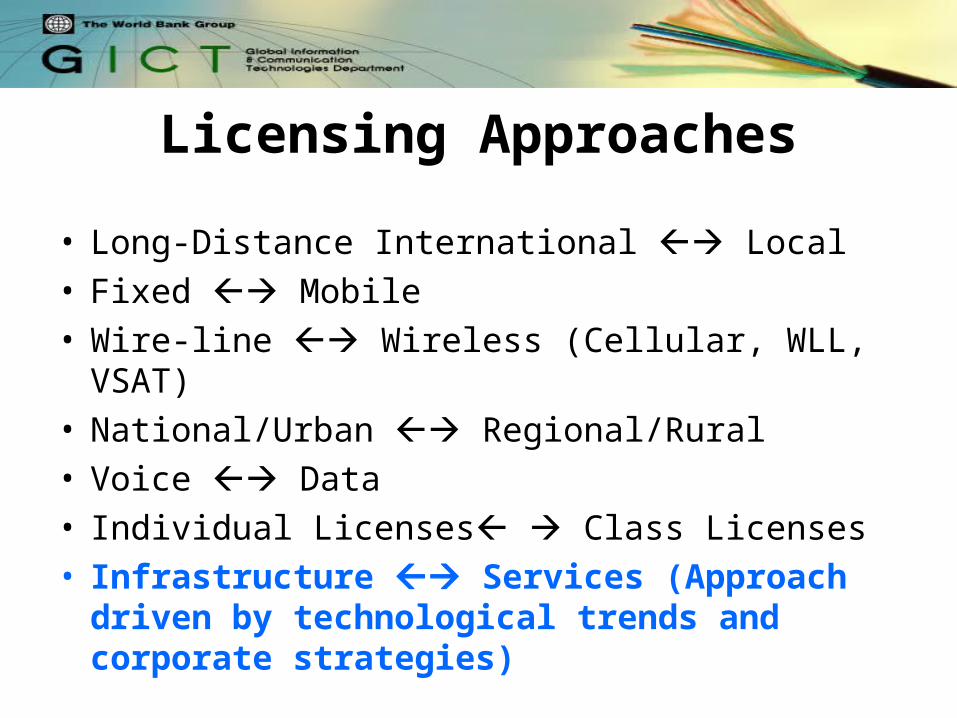
Licensing Approaches
• Long-Distance International Local• Fixed Mobile • Wire-line Wireless (Cellular, WLL, VSAT)• National/Urban Regional/Rural• Voice Data• Individual Licenses Class Licenses• Infrastructure Services (Approach
driven by technological trends and corporate strategies)
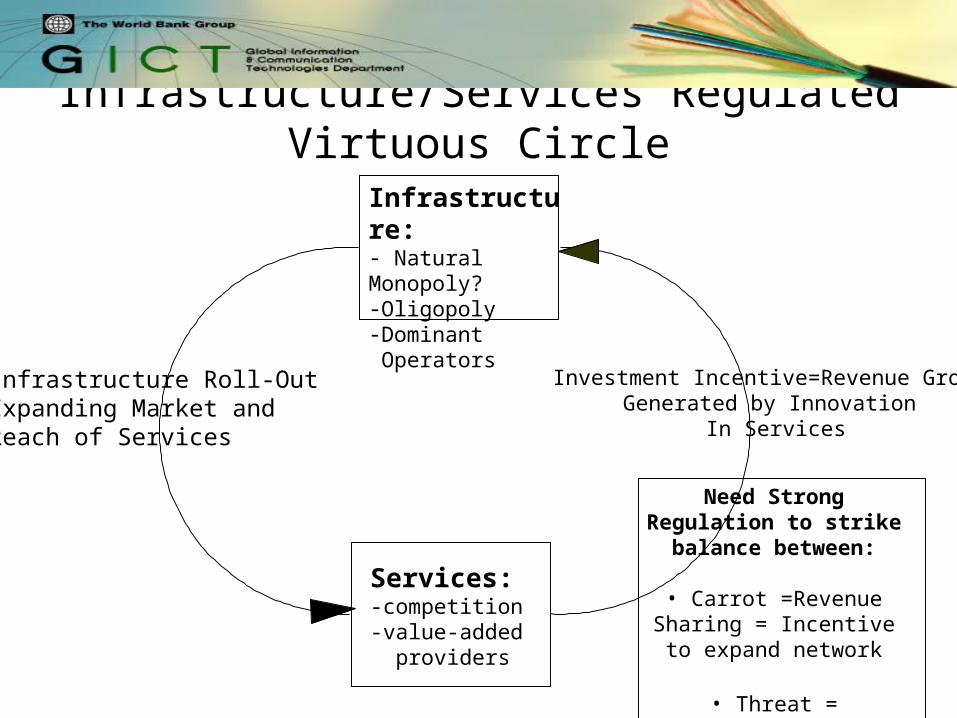
Infrastructure/Services Regulated Virtuous Circle
Investment Incentive=Revenue GrowthGenerated by Innovation
In Services
Need Strong Regulation to strike balance between:
• Carrot =Revenue Sharing = Incentive to expand
network
• Threat = Conditional right to infrastructure
Infrastructure:- Natural Monopoly?-Oligopoly-Dominant Operators
Services:-competition-value-added providers
Infrastructure Roll-OutExpanding Market andReach of Services
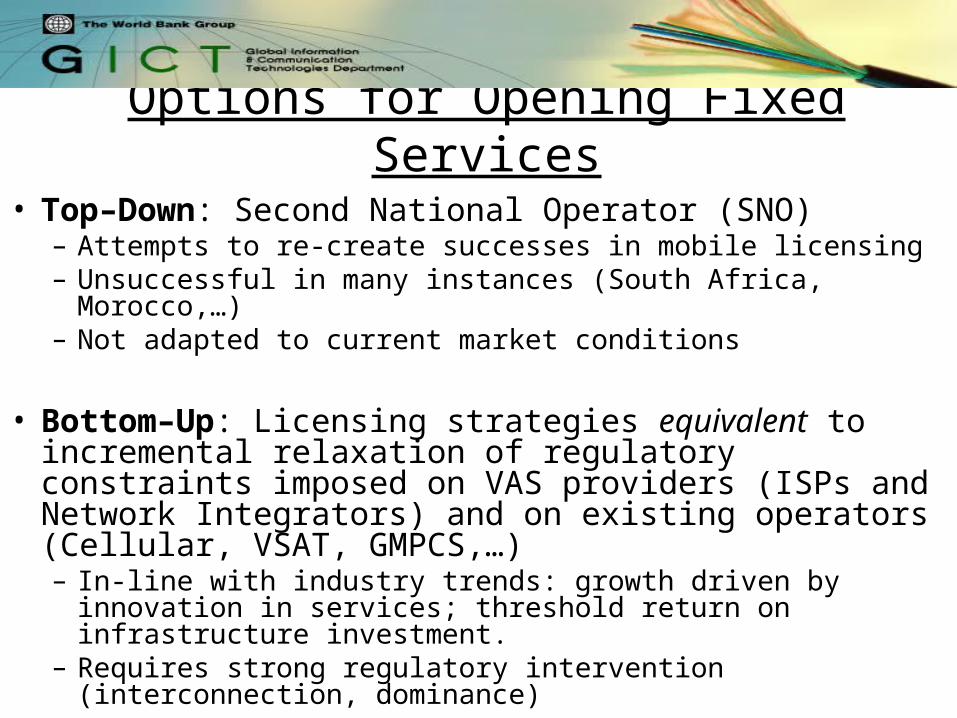
Options for Opening Fixed Services
• Top–Down: Second National Operator (SNO)– Attempts to re-create successes in mobile licensing– Unsuccessful in many instances (South Africa, Morocco,…)– Not adapted to current market conditions
• Bottom–Up: Licensing strategies equivalent to incremental relaxation of regulatory constraints imposed on VAS providers (ISPs and Network Integrators) and on existing operators (Cellular, VSAT, GMPCS,…)– In-line with industry trends: growth driven by innovation in
services; threshold return on infrastructure investment.– Requires strong regulatory intervention (interconnection,
dominance)
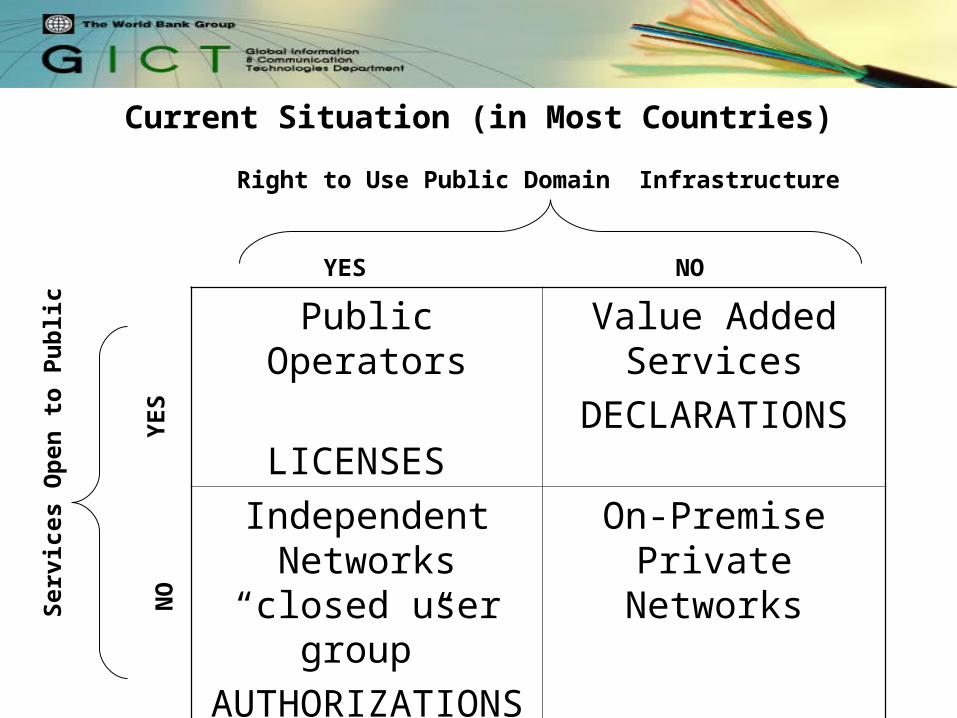
Current Situation (in Most Countries)
Public Operators
LICENSES
Value Added Services
DECLARATIONS
Independent Networks “closed
user group”
AUTHORIZATIONS
On-Premise Private Networks
Right to Use Public Domain Infrastructure
YES
NO
Y
ES
NO
Ser
vice
s O
pen
to
Pu
bli
c
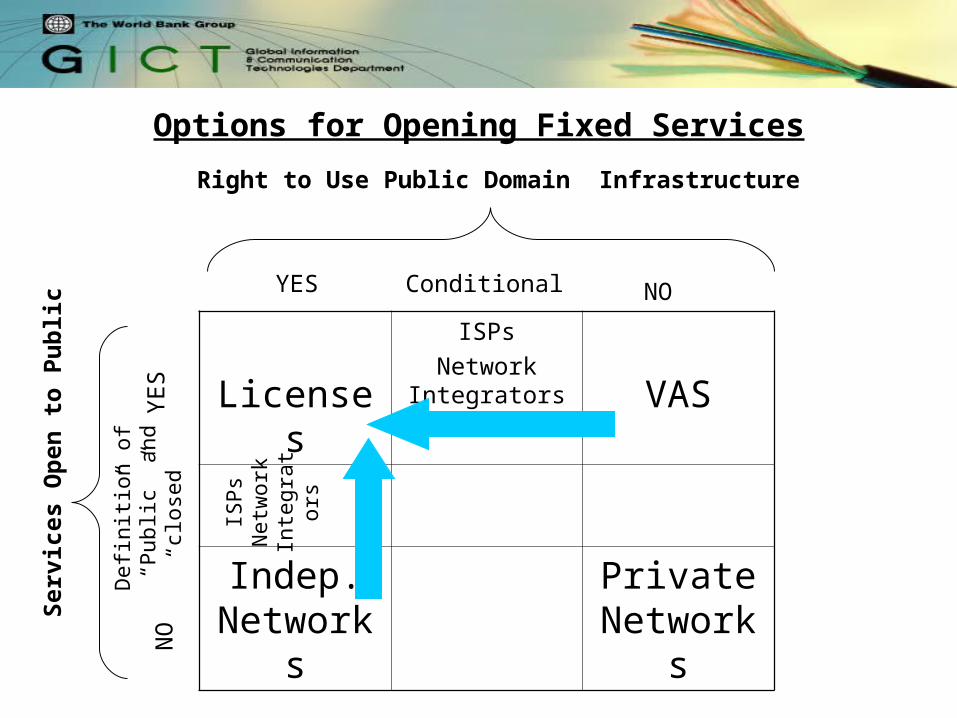
Options for Opening Fixed Services
Right to Use Public Domain Infrastructure
YES
NO
Y
ES
NO
Ser
vice
s O
pen
to
Pu
bli
c
Licenses
ISPs
Network Integrators VAS
Indep. Networks
Private Networks
Conditional
Def
initi
on o
f “
Pub
lic”
and
“clo
sed”
ISP
sN
etw
ork
Inte
grat
ors
Licensing / Regulatory Principles
• Technological neutrality s.t. spectrum• Simplify Market Structure
– Maximize regulatory readability – Avoid intractable regulatory complexity, given
degree of tariff rebalancing and infrastructure roll-out imperative (squeeze; predation;…)
• Best candidates are “local” candidates:– Know the market – Capacity to assess risk– Can leverage existing investments (e.g., GSM2; ISPs;
INCUMBENT; Alternative Infrastructure) – risk management