Embed Size (px)
Citation preview
First State Investments ICVC
Annual Report
31 July 2017
Contents
Page No.
1
1
1
3
4 Remuneration*
5
5
6
6
7
9
9
Asia Pacific equity funds
12
25
39
56
74
97
115
132
148
Emerging Market bond funds
165
200
Emerging Market equity funds
223
239
258
Global equity funds
276
294
314
330
Infrastructure funds
353
Latin America funds
380
398
Notes to the Financial Statements
Investment Review* and Financial Statements for:
Stewart Investors Asia Pacific Fund
Stewart Investors Asia Pacific Leaders Fund
First State Asia Focus Fund
First State All China Fund
First State Asia All-Cap Fund
Authorised Corporate Director's Report*
Statement of the Authorised Corporate Director's Responsibilities in Respect of the Financial Statements of the Company*
Information about the Company*
Changes to the Prospectus and Instrument of Incorporation*
The Investment Manager*
Report of the Authorised Corporate Director*
Independent Auditor's Report to the Shareholders of First State Investments ICVC
Statement of Depositary's Responsibilities
Depositary's Report
Summary of Significant Accounting Policies Applicable to All Sub-Funds
First State Emerging Markets Local Currency Bond Fund
Stewart Investors Indian Subcontinent Fund
Stewart Investors Asia Pacific Sustainability Fund
First State Greater China Growth Fund
First State Emerging Markets Bond Fund
First State Japan Focus Fund
First State Diversified Growth Fund
First State Global Listed Infrastructure Fund
Multi-assets funds
Stewart Investors Worldwide Leaders Fund
Stewart Investors Global Emerging Markets Leaders Fund
Stewart Investors Worldwide Equity Fund
Stewart Investors Global Emerging Markets Fund
Stewart Investors Worldwide Sustainability Fund
First State Global Resources Fund
Stewart Investors Global Emerging Markets Sustainability Fund
Stewart Investors Latin America Fund

Contents (continued)
Property securities funds
434
452
478
479
First State Asian Property Securities Fund
* Collectively, these items, along with the investment reviews disclosed within the individual sub-fund reports, comprise the Authorised CorporateDirector's Report for the purposes of the rules contained in the Financial Conduct Authority’s Collective Investment Schemes Sourcebook.
Corporate Directory*
About First State Investments ICVC
First State Global Property Securities Fund
•
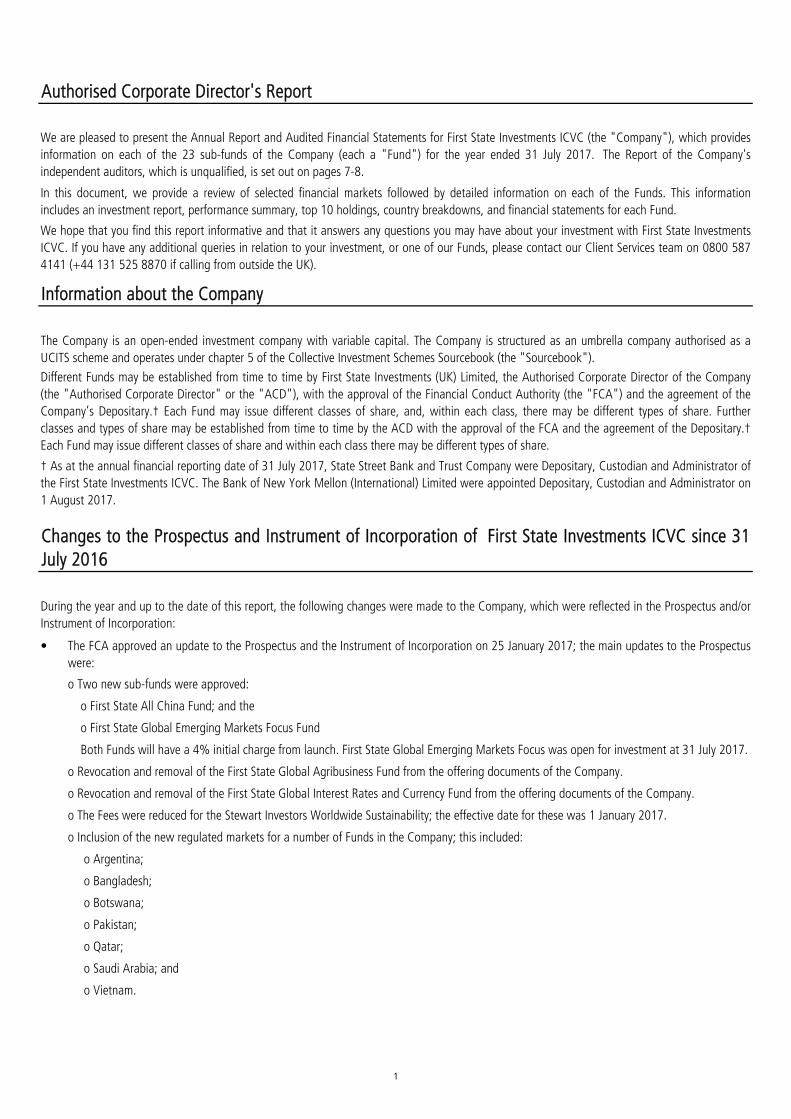
o Revocation and removal of the First State Global Agribusiness Fund from the offering documents of the Company.
† As at the annual financial reporting date of 31 July 2017, State Street Bank and Trust Company were Depositary, Custodian and Administrator ofthe First State Investments ICVC. The Bank of New York Mellon (International) Limited were appointed Depositary, Custodian and Administrator on1 August 2017.
Authorised Corporate Director's Report
o First State Global Emerging Markets Focus Fund
Both Funds will have a 4% initial charge from launch. First State Global Emerging Markets Focus was open for investment at 31 July 2017.
We are pleased to present the Annual Report and Audited Financial Statements for First State Investments ICVC (the "Company"), which providesinformation on each of the 23 sub-funds of the Company (each a "Fund") for the year ended 31 July 2017. The Report of the Company'sindependent auditors, which is unqualified, is set out on pages 7-8.
Changes to the Prospectus and Instrument of Incorporation of First State Investments ICVC since 31July 2016
o Two new sub-funds were approved:
o First State All China Fund; and the
In this document, we provide a review of selected financial markets followed by detailed information on each of the Funds. This informationincludes an investment report, performance summary, top 10 holdings, country breakdowns, and financial statements for each Fund.
We hope that you find this report informative and that it answers any questions you may have about your investment with First State InvestmentsICVC. If you have any additional queries in relation to your investment, or one of our Funds, please contact our Client Services team on 0800 5874141 (+44 131 525 8870 if calling from outside the UK).
Information about the Company
The Company is an open-ended investment company with variable capital. The Company is structured as an umbrella company authorised as aUCITS scheme and operates under chapter 5 of the Collective Investment Schemes Sourcebook (the "Sourcebook").
Different Funds may be established from time to time by First State Investments (UK) Limited, the Authorised Corporate Director of the Company(the "Authorised Corporate Director" or the "ACD"), with the approval of the Financial Conduct Authority (the "FCA") and the agreement of theCompany’s Depositary.† Each Fund may issue different classes of share, and, within each class, there may be different types of share. Furtherclasses and types of share may be established from time to time by the ACD with the approval of the FCA and the agreement of the Depositary.†Each Fund may issue different classes of share and within each class there may be different types of share.
During the year and up to the date of this report, the following changes were made to the Company, which were reflected in the Prospectus and/orInstrument of Incorporation:
The FCA approved an update to the Prospectus and the Instrument of Incorporation on 25 January 2017; the main updates to the Prospectuswere:
o Pakistan;
o Qatar;
o Saudi Arabia; and
o Revocation and removal of the First State Global Interest Rates and Currency Fund from the offering documents of the Company.
o The Fees were reduced for the Stewart Investors Worldwide Sustainability; the effective date for these was 1 January 2017.
o Inclusion of the new regulated markets for a number of Funds in the Company; this included:
o Argentina;
o Bangladesh;
o Botswana;
o Vietnam.
1

Authorised Corporate Director's Report (continued)
•
•
o Updates to Appendix I, Fund Performance for 2016;
o Inclusion of a Class B GBP net income share class for the First State Asia Focus Fund;
o Amendments to the Currency Hedged Share Class Risk;
o Removal of the 4% initial charge on the First State All China Fund;
o Inclusion of language in relation to Shenzhen-HK Stock Connect.
o New risk factor for “Derivative standstill protocol”.
o Disclosures in relation to the Regulation on transparency of securities financing transactions and of reuse (SFTR).
o Amendments to the list of Directors.
o Inclusion of language in relation to RQFII.
o Amendment of the Registrar’s address (the Bank of New York Mellon (International) Limited) from Brentwood to Darlington effective fromDecember 2016.
o Correction of typographical errors identified.
The main updates to the Instrument of Incorporation of the Company on 25 January 2017 were:
o Amendments to the dates of material contracts.
o Inclusion of USD share classes in the Stewart Investors Global Emerging Markets Leaders Fund.
o A reduction in the initial charge from 4% to 0% for the First State Asia All-Cap Fund, the effective date for this was 30 November 2016.
o Removal of the First State Global Agribusiness Fund.
o Removal of the First State Global Interest Rates and Currency Fund.
The FCA approved an update to the Prospectus on 1 August 2017; the main updates to the Prospectus were:
o The addition of the two new sub-funds:
o First State All China Fund; and the
o First State Global Emerging Markets Focus Fund.
o Amendments to the Terms used in the Document;
o Inclusion of the product reference numbers for the FS All China Fund and the FS Global Emerging Markets Focus Fund;
o Amendments throughout in relation to share class hedging;
o Amendments to the Depositary of the Company from State Street Trustees Limited to The Bank of New York Mellon (International) Limited;
o Amendments to the Custodian of the Company from State Street Bank and Trust Company to The Bank of New York Mellon (International)Limited;
o Amendment to the Fund Administrator from State Street Bank and Trust Company to The Bank of New York Mellon (International) Limited;
o Amendments to the material contracts in line with the amendments to the Depositary, Custodian and Fund Administrator of the Company;
o Minor amendments to the Directors' biographies;
o Amendments to the Taxation section and language on Gross Share Classes as a result of “Finance Act 2017, Schedule 5 – Deduction ofincome tax at source” and the amendments to Chapter 3, Part 15 of ITA 2007, deduction of tax from certain payments of yearly interest;
o Inclusion of language to clarify the settlement process under the section Buying Shares;
o Amendments to the table at the start of the Fees and Expenses section;
o Amendments in relation to the Depositary fees, Transaction charges and Custody charges as a consequence of the amendment to theDepositary of the Company;
o Minor amendments to the RQFII language under the China Market Risk, point E1;
o Updates to the Currency Hedged Share Class Risk;
o Updates to the Management and Administration Section covering the changes from State Street to The Bank of New York Mellon, updatesto the Conflicts of Interest;
o Reformatting of all the tables under Appendix I;
2
Authorised Corporate Director's Report (continued)
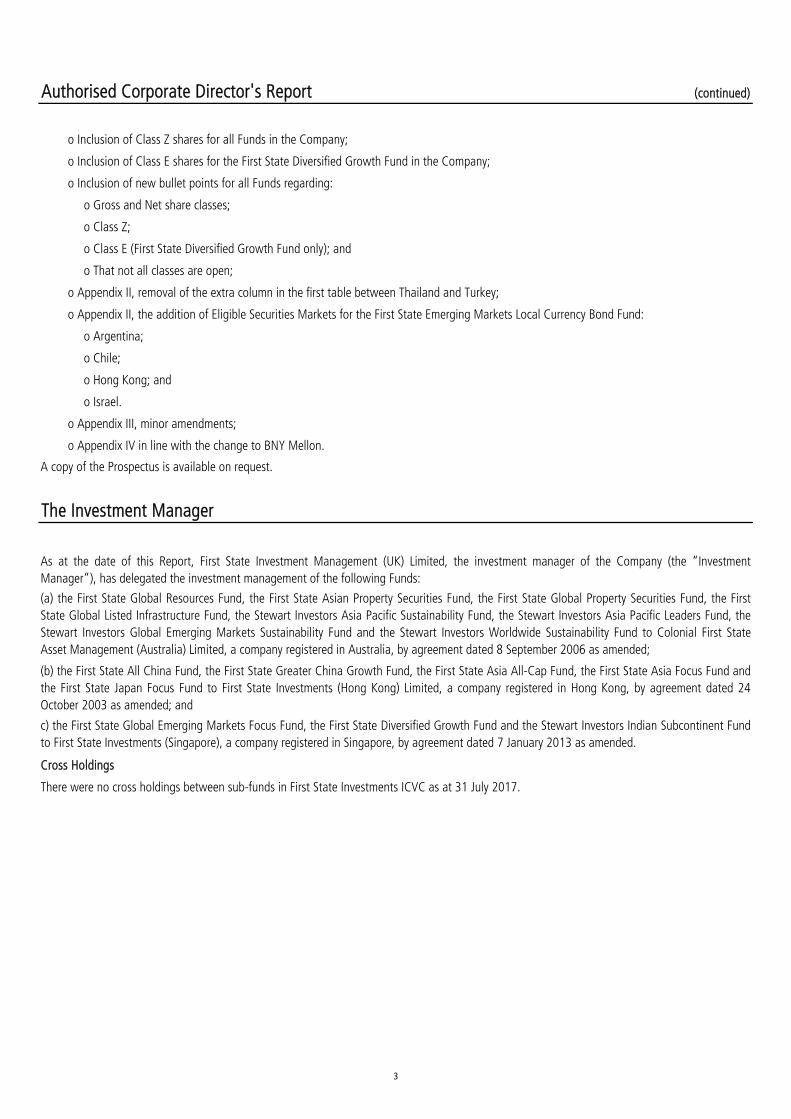
There were no cross holdings between sub-funds in First State Investments ICVC as at 31 July 2017.
A copy of the Prospectus is available on request.
Cross Holdings
The Investment Manager
o Inclusion of Class Z shares for all Funds in the Company;
o Inclusion of Class E shares for the First State Diversified Growth Fund in the Company;
o Appendix II, the addition of Eligible Securities Markets for the First State Emerging Markets Local Currency Bond Fund:
o Argentina;
o Inclusion of new bullet points for all Funds regarding:
o That not all classes are open;
o Gross and Net share classes;
o Class Z;
o Class E (First State Diversified Growth Fund only); and
o Hong Kong; and
(a) the First State Global Resources Fund, the First State Asian Property Securities Fund, the First State Global Property Securities Fund, the FirstState Global Listed Infrastructure Fund, the Stewart Investors Asia Pacific Sustainability Fund, the Stewart Investors Asia Pacific Leaders Fund, theStewart Investors Global Emerging Markets Sustainability Fund and the Stewart Investors Worldwide Sustainability Fund to Colonial First StateAsset Management (Australia) Limited, a company registered in Australia, by agreement dated 8 September 2006 as amended;
c) the First State Global Emerging Markets Focus Fund, the First State Diversified Growth Fund and the Stewart Investors Indian Subcontinent Fundto First State Investments (Singapore), a company registered in Singapore, by agreement dated 7 January 2013 as amended.
(b) the First State All China Fund, the First State Greater China Growth Fund, the First State Asia All-Cap Fund, the First State Asia Focus Fund andthe First State Japan Focus Fund to First State Investments (Hong Kong) Limited, a company registered in Hong Kong, by agreement dated 24October 2003 as amended; and
As at the date of this Report, First State Investment Management (UK) Limited, the investment manager of the Company (the “InvestmentManager”), has delegated the investment management of the following Funds:
o Chile;
o Israel.
o Appendix III, minor amendments;
o Appendix IV in line with the change to BNY Mellon.
o Appendix II, removal of the extra column in the first table between Thailand and Turkey;
3
•
•
1)
2)
The Board adopts, and reviews annually, the general principles of the applicable remuneration policies. The Committee reviews the implementationof the remuneration policies for code staff at least annually for compliance with policies and procedures. No irregularities have been identified inthe course of these reviews. During the period, changes have been made to the adopted remuneration policies in order to ensure compliance withthe requirements under the UCITS Directive and related Guidance, including deferral and retention arrangements and the requirement to satisfyincentive awards partially in shares in the Company.
The ACD actively manages risks associated with delivering and measuring performance. All our activities are carefully managed within our riskappetite, and individual annual incentive outcomes are reviewed. Risk is further managed through the deferral of a portion of the incentives. Thedeferred portion of the incentive award is subject to a risk review prior to vesting and can be reduced or forfeited.
The ACD operates a Remuneration Assurance Committee (Committee). The Committee reports to the Board. The Committee reviews risk andcompliance issues in relation to the vesting of deferred awards for all employees. Compliance is monitored throughout the vesting period by theHead of Risk and Compliance and their department, who reports the information to the Committee for assessment. Any risk or performance issuesthat may impact the vesting of deferred awards are then highlighted to the Committee, along with any recommendations for the reduction orcancelation of any deferred awards (as appropriate).
These remuneration policies apply also to other entities in the Commonwealth Bank of Australia Group to which investment management of Fundshas been delegated, and those delegates are subject to contractual arrangements to ensure that policies that are regarded as equivalent areapplied.
Remuneration is made up of fixed pay (i.e. salary and benefits such as pension contributions) and performance-related pay (annual and long-termincentives). Annual incentives are designed to reward performance in line with the business strategy, objectives, values and long-term interests ofthe ACD and the Commonwealth Bank of Australia group. The annual incentive earned by an individual is dependent on the achievement offinancial and non-financial objectives, including adherence to effective risk-management practices. The ACD provides long-term incentives that aredesigned to link reward with the long-term success of ACD and to recognise the responsibility participants have in driving future success anddelivering value. Long-term incentive awards are conditional on the satisfaction of corporate performance measures. The structure of remunerationpackages is such that the fixed element is sufficiently large to enable a flexible incentive policy to be operated.
Employees are eligible for an annual incentive based on their individual performance, and depending on their role, the performance of their businessunit and/or the group. These incentives are managed within a strict risk framework, and the Board of Directors of the ACD (Board) retains ultimatediscretion to reduce annual incentive outcomes where appropriate.
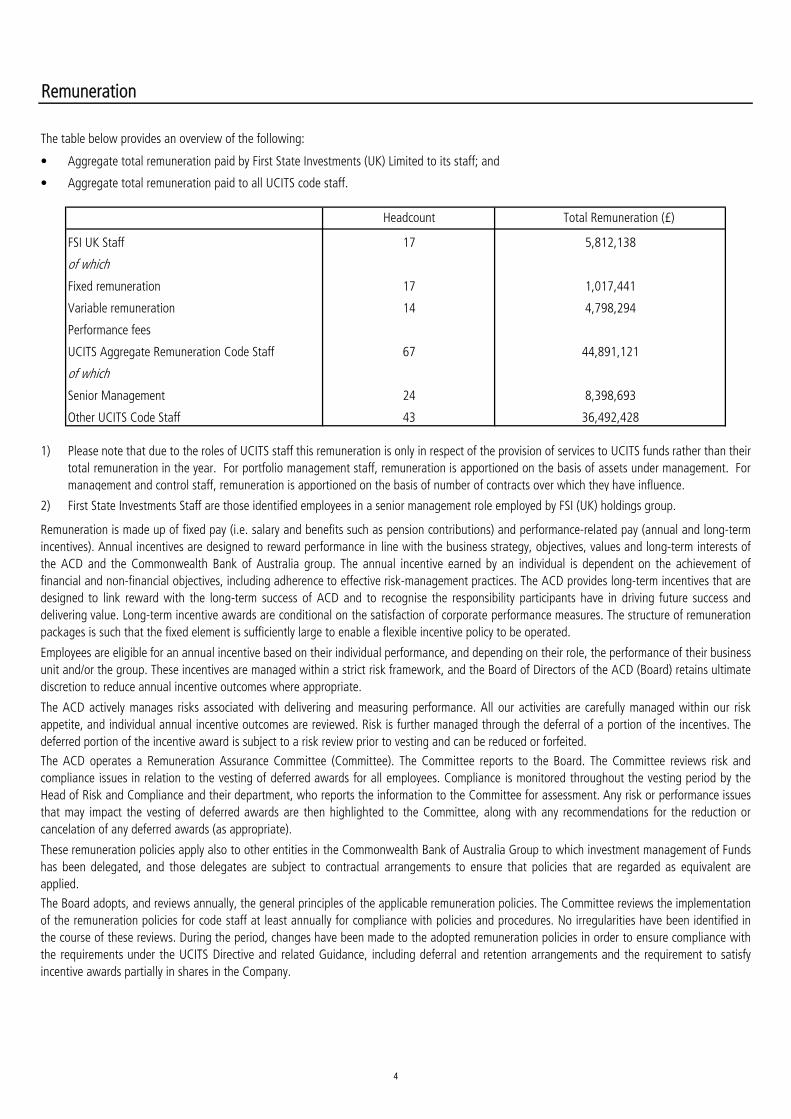
Other UCITS Code Staff 43 36,492,428
Please note that due to the roles of UCITS staff this remuneration is only in respect of the provision of services to UCITS funds rather than theirtotal remuneration in the year. For portfolio management staff, remuneration is apportioned on the basis of assets under management. Formanagement and control staff, remuneration is apportioned on the basis of number of contracts over which they have influence.
First State Investments Staff are those identified employees in a senior management role employed by FSI (UK) holdings group.
of which
Senior Management 24 8,398,693
Performance fees
UCITS Aggregate Remuneration Code Staff 67 44,891,121
Fixed remuneration 17 1,017,441
Variable remuneration 14 4,798,294
FSI UK Staff 17 5,812,138
of which
The table below provides an overview of the following:
Aggregate total remuneration paid by First State Investments (UK) Limited to its staff; and
Aggregate total remuneration paid to all UCITS code staff.
Headcount Total Remuneration (£)
Remuneration
4

●
●
●
●
●
●
● keep proper accounting records and manage the Company in accordance with the Sourcebook, the Instrument of Incorporation and theProspectus. The ACD is also responsible for taking reasonable steps for the prevention and detection of fraud and other irregularities.
Adrian HilderlyDirectorFirst State Investments (UK) Limited 12 October 2017
Report of the Authorised Corporate Director
This report has been approved by the Authorised Corporate Director, First State Investments (UK) Limited, and signed on its behalf in accordancewith the requirements of the OEIC Regulations and the Sourcebook.
make judgements and estimates that are reasonable and prudent;
comply with the disclosure requirements of the Statement of Recommended Practice for Authorised Funds issued by the InvestmentManagement Association in May 2014 (the "IMA SORP 2014");
prepare the Financial Statements on the going concern basis unless it is inappropriate to presume that the Company will continue inoperation; and
comply with the Prospectus, the Instrument of Incorporation, generally accepted accounting principles and applicable accounting standards;
keep proper accounting records that enable it to demonstrate that the Financial Statements as prepared comply with the above requirements;
In preparing the Financial Statements, the ACD is required to:
The open-ended investment companies Regulations 2001 (SI 2001/1228, as amended) (the “OEIC Regulations”)) and the Sourcebook require the ACD to prepare financial statements for each annual and half-yearly accounting period that give a true and fair view in accordance with United Kingdom Generally Accepted Accounting Practice of the financial position of the Company and of its net revenue and the net capital gains on the property of the Company for the year.
select suitable accounting policies and then apply them consistently;
Statement of the Authorised Corporate Director's Responsibilities
in Respect of the Financial Statements of the Company
5
•
•
•
•
•
●
●
the instructions of the Authorised Fund Manager ("the AFM"), which is the UCITS Management Company, are carried out (unless they conflictwith the Regulations).
The Depositary also has a duty to take reasonable care to ensure that Company is managed in accordance with the Regulations and Schemedocuments in relation to the investment and borrowing powers applicable to the Company.
the Company's cash flows are properly monitored and that cash of the Company is booked into the cash accounts in accordance with theRegulations;
any consideration relating to transactions in the Company's assets is remitted to the Company within the usual time limits;
The Depositary is responsible for the safekeeping of all custodial assets and maintaining a record of all other assets of the Company in accordancewith the Regulations.
The Depositary must ensure that:
Statement of Depositary's Responsibilitiesfor the year ended 31 July 2017
The Depositary must ensure that the Company is managed in accordance with the Financial Conduct Authority's Collective Invesmtent Schemes Sourcebook, the open-ended investment companies Regulations 2001 (SI 2001/1228), as amended, the Financial Services and Markets Act 2000, as amended, (together "the Regulations"), the Company's Instrument of Incorporation and Prospectus (together "the Scheme documents") as detailed below.
The Depositary must, in the context of its role, act honestly, fairly, professionally, independently and in the interests of the Company and itsinvestors.
has carried out the issue, sale, redemption and cancellation, and calculation of the price of the Company’s shares and the application of theCompany’s income in accordance with the Regulations and the Scheme documents of the Company; and
State Street Trustees Limited
Edinburgh
12 October 2017
has observed the investment and borrowing powers and restrictions applicable to the Company.
Having carried out such procedures as we consider necessary to discharge our responsibilities as Depositary of the Company, it is our opinion,based on the information available to us and the explanations provided, that in all material respects the Company, acting through the AFM:
Depositary's Report
the sale, issue, repurchase, redemption and cancellation of shares are carried out in accordance with the Regulations;
the value of shares of the Company are calculated in accordance with the Regulations;
6

●
●
●
●
We conducted our audit in accordance with International Standards on Auditing (UK) (“ISAs (UK)”) and applicable law. Our responsibilities underISAs (UK) are further described in the Auditors’ responsibilities for the audit of the financial statements section of our report. We believe that theaudit evidence we have obtained is sufficient and appropriate to provide a basis for our opinion.
First State Investments ICVC (the “Company”) is an open-ended investment company (‘OEIC’) with 23 sub-funds. The financial statements of theCompany comprise the financial statements of each of the sub-funds. We have audited the financial statements, included within the Annual Report(the “Annual Report”), which comprise: the Balance Sheets as at 31 July 2017; the statements of total return and the statements of change in netassets attributable to shareholders for the year/period then ended; the distribution tables and the notes to the financial statements, which includethe summary of significant accounting policies and notes to the financial statements of individual sub-funds.
Opinion
In our opinion, First State Investments ICVC’s financial statements:
However, because not all future events or conditions can be predicted, this statement is not a guarantee as to the Company’s and each of the sub-funds’ ability to continue as a going concern.
Independence
for the year ended 31 July 2017
the Authorised Corporate Directors’ use of the going concern basis of accounting in the preparation of the financial statements is notappropriate; or
Report on the audit of the financial statements
Basis for opinion
Reporting on other information
The other information comprises all of the information in the Annual Report other than the financial statements and our auditors’ report thereon.The Authorised Corporate Director is responsible for the other information. Our opinion on the financial statements does not cover the otherinformation and, accordingly, we do not express an audit opinion or, except to the extent otherwise explicitly stated in this report, any form ofassurance thereon.
Independent Auditors' Report to the Shareholders of First State Investments ICVC
give a true and fair view of the financial position of the Company and each of the sub-funds as at 31 July 2017 and of the netrevenue/(expenses) and the net capital gains/(losses) of the scheme property of the Company and each of the sub-funds for the year/periodthen ended; and
have been properly prepared in accordance with United Kingdom Generally Accepted Accounting Practice (United Kingdom AccountingStandards, comprising FRS 102 “The Financial Reporting Standard applicable in the UK and Republic of Ireland”, and applicable law), theStatement of Recommended Practice for UK Authorised Funds, the Collective Investment Schemes Sourcebook and the Instrument ofIncorporation.
We remained independent of the Company in accordance with the ethical requirements that are relevant to our audit of the financial statements inthe UK, which includes the FRC’s Ethical Standard, and we have fulfilled our other ethical responsibilities in accordance with these requirements.
Conclusions relating to going concern
With the exception of the circumstances described in the Emphasis of Matter – Basis of preparation paragraph above regarding the First StateEmerging Markets Local Currency Bond Fund we have nothing to report in respect of the following matters in relation to which ISAs (UK) require usto report to you when:
the Authorised Corporate Director has not disclosed in the financial statements any identified material uncertainties that may cast significantdoubt about the Company’s and each of the sub-funds’ ability to continue to adopt the going concern basis of accounting for a period of atleast twelve months from the date when the financial statements are authorised for issue.
Emphasis of Matter - Basis of preparation
In forming our opinion on the financial statements, which is not modified, we have considered the adequacy of the disclosures made in note 1 tothe financial statements concerning the basis of preparation for the First State Emerging Markets Local Currency Bond Fund, for which theAuthorised Corporate Director has confirmed their intention to terminate within one year of the date of approval of the financial statements.Accordingly, the going concern basis of accounting is no longer appropriate and the financial statements for this Fund have been prepared on abasis other than going concern as described in note 1 to the financial statements. No adjustments were necessary to the Fund’s financialstatements to reduce assets to their realisable values, to provide for liabilities arising from the termination or to reclassify fixed assets and long-termliabilities as current assets and liabilities.
7
(continued)
for the year ended 31 July 2017
Independent Auditors' Report to the Shareholders of First State Investments ICVC
●
●
Collective Investment Schemes Sourcebook exception reporting
Under the Collective Investment Schemes Sourcebook we are also required to report to you if, in our opinion:
In connection with our audit of the financial statements, our responsibility is to read the other information and, in doing so, consider whether theother information is materially inconsistent with the financial statements or our knowledge obtained in the audit, or otherwise appears to bematerially misstated. If we identify an apparent material inconsistency or material misstatement, we are required to perform procedures to concludewhether there is a material misstatement of the financial statements or a material misstatement of the other information. If, based on the work wehave performed, we conclude that there is a material misstatement of this other information, we are required to report that fact. We have nothingto report based on these responsibilities.
Authorised Corporate Director’s Report
Responsibilities of the Authorised Corporate Director for the financial statementsAs explained more fully in the Statement of the Authorised Corporate Director’s Responsibilities set out on page 5, the Authorised CorporateDirector is responsible for the preparation of the financial statements in accordance with the applicable framework and for being satisfied that theygive a true and fair view. The Authorised Corporate Director is also responsible for such internal control as they determine is necessary to enable thepreparation of financial statements that are free from material misstatement, whether due to fraud or error.
In preparing the financial statements, the Authorised Corporate Director is responsible for assessing the Company’s and each of the sub-funds'ability to continue as a going concern, disclosing, as applicable, matters related to going concern and using the going concern basis of accountingunless the Authorised Corporate Director either intends to liquidate the Company or individual sub-fund or to cease operations, or has no realisticalternative but to do so.
Responsibilities for the financial statements and the audit
In our opinion, the information given in the Authorised Corporate Director’s Report for the financial year for which the financial statements areprepared is consistent with the financial statements.
PricewaterhouseCoopers LLPChartered Accountants & Statutory AuditorsEdinburgh12 October 2017
Auditors’ responsibilities for the audit of the financial statementsOur objectives are to obtain reasonable assurance about whether the financial statements as a whole are free from material misstatement, whetherdue to fraud or error, and to issue an auditors’ report that includes our opinion. Reasonable assurance is a high level of assurance, but is not aguarantee that an audit conducted in accordance with ISAs (UK) will always detect a material misstatement when it exists. Misstatements can arisefrom fraud or error and are considered material if, individually or in the aggregate, they could reasonably be expected to influence the economicdecisions of users taken on the basis of these financial statements.
A further description of our responsibilities for the audit of the financial statements is located on the Financial Reporting Council’s website at:www.frc.org.uk/auditorsresponsibilities. This description forms part of our auditors’ report.
In our opinion, we have obtained all the information and explanations we consider necessary for the purposes of the audit.
Use of this reportThis report, including the opinions, has been prepared for and only for the Company’s shareholders as a body in accordance with paragraph 4.5.12 of the Collective Investment Schemes Sourcebook as required by paragraph 67(2) of the open-ended investment companies Regulations 2001 and for no other purpose. We do not, in giving these opinions, accept or assume responsibility for any other purpose or to any other person to whom this report is shown or into whose hands it may come save where expressly agreed by our prior consent in writing.
Other required reporting
We have no exceptions to report arising from this responsibility.
proper accounting records have not been kept; or
the financial statements are not in agreement with the accounting records and returns.
Opinion on matter required by the Collective Investment Schemes Sourcebook
8
1.
(a)
(b)
(c)
(d)
(e)
as at 31 July 2017
Accounting and distribution policies
Summary of Significant Accounting Policies Applicable to All Sub-Funds
Basis of accounting
The Financial Statements have been prepared under the historical cost basis, as modified by the revaluation of investments, and in accordancewith the Statement of Recommended Practice for Financial Statements of Authorised Funds, issued by the Investment ManagementAssociation (IMA) in May 2014 (SORP 2014), and United Kingdom Generally Accepted Accounting Practice.
Recognition of revenue
All the other Funds make dividend distributions.
Gains and losses, including exchange differences in the valuation of investments held at the balance sheet date, including unrealised exchangedifferences, are treated as capital.
Exchange rates
Amounts in overseas currencies are translated at the exchange rates ruling at the close of business on 31 July 2017. Transactionsdenominated in foreign currencies are converted to sterling at the exchange rate ruling at the date of the transaction.
Distribution policy
Dividends from UK real estate investment trusts ("UK REITs") are recognised as distributable revenue when the securities are quoted ex-dividend.
Dividends on equities are recognised when the security is quoted ex-dividend. Other revenue is accounted for on an accruals basis. UKdividends are shown net of tax credits.
Dividends from US real estate investment trusts ("REITs") are recognised as distributable revenue when the securities are quoted ex-dividend.On receipt of the capital/revenue split in the following calendar year, the allocation of the dividend is adjusted within the FinancialStatements.
First State Emerging Markets Bond Fund and First State Emerging Markets Local Currency Bond Fund satisfied the qualifying investments testof Section 19 The Authorised Investment Funds (Tax) Regulations 2006 (S2006/964) throughout the period. All distributions made aretherefore made as interest distributions.
Dividends received from UK REITs are split into PID (Property Income Distributions) and Non-PID components for tax purposes. Revenuearising from UK REIT's tax-exempt rental business is colloquially known as PID revenue and is taxable in the hands of each Fund. A UK REITmay also carry out activities that give rise to taxable profits and gains. It is from these that the REIT will make a Non-PID distribution. Theseare treated for tax purposes in the same way as dividends from UK companies.
Dividends received as shares (scrip/stock dividends), to the extent that the value of such dividends is equal to the cash dividends, are treatedas revenue. This revenue forms part of any distribution. In the case of enhanced scrip dividends, the amount by which such dividends exceedthe cash dividends is treated as capital and does not form part of the distribution.
The whole of the Fund’s revenue after expenses and tax must be distributed at the end of its financial year. In the event that a share class hasexpenses that exceeds revenue, then no final distribution will be paid and the deficit will be transferred from the capital property of that shareclass to the revenue account. Interim distributions will usually be for the whole of the revenue, after charging expenses and tax determined atthe end of the interim accounting period. The Authorised Corporate Director may, however, in exceptional circumstances distribute a lesseramount, for the interim period.
Basis of valuation of investments
The value of the Funds as at 31 July 2017 was calculated using the bid market value of investments as at 12:00 midday on 31 July 2017, netof any accrued interest. Investments for which published market values are not available are included at the Authorised Corporate Director’svaluation.
Open forward currency contracts are shown in the Portfolio Statement and are valued using quoted forward rate.
Over the Counter (OTC) derivatives (including cross-currency swaps) are held at fair value.
All of the sub-funds have been prepared on a going concern basis with the exception of the First State Emerging Markets Local Currency BondFund which the Authorised Corporate Director intends to terminate within one year of the date of approval of the financial statements andtherefore the financial statements of this Fund has been prepared on a basis other than going concern. In applying this basis of preparation,the assets and liabilities of the Fund continue to be stated at their fair values, which materially equate to their residual values. No adjustmentswere necessary in either Fund’s financial statements to reduce assets to their realisable values, to provide for liabilities arising from thetermination and to reclassify fixed assets and long-term liabilities as current assets and liabilities.
Collective investment schemes are valued at quoted bid prices for dual-priced funds and at quoted prices for single-priced funds, on the lastbusiness day of the accounting period.
9
(continued)
as at 31 July 2017
Summary of Significant Accounting Policies Applicable to All Sub-Funds
(f)
(g)
(h)
(i)
The treatment of special dividends and share buy backs is determined on a case by case basis, taking into account whether the event isincome or capital by nature. The tax treatment will follow the treatment of the principal amounts.
Equalisation
(b) on a Fund experiencing net redemptions (i.e. redemptions less purchases) as this could lead to trading that results in a dilutive effect;
(a) on a Fund experiencing net purchases (i.e. purchases less redemptions) as this could lead to trading that results in a dilutive effect;
Taxation
Provision is made for corporation tax at the current rate on the excess of taxable revenue over allowable expenses. Overseas dividends aredisclosed gross of any foreign tax suffered, the tax element being separately disclosed in the taxation note.
On 1 February 2005, single swinging pricing was adopted for the Funds of the Company. The ACD reserves the right at its sole discretion toimpose a dilution adjustment.
Dilution adjustment
For example:
Tax is calculated using the marginal basis, i.e. the tax effect of revenue and expenditure is allocated between capital and income on the samebasis as the particular item to which it relates. Deferred taxation is provided for on all timing differences that have originated but not reversedat the balance sheet date. Deferred taxation is not recognised on permanent differences. Any liability to deferred tax is provided at theaverage rate of tax enacted, or substantively enacted. Deferred tax assets are only recognised where it is more likely than not that there willbe suitable taxable profits against which the future reversal of underlying timing differences can be deducted. Deferred tax assets andliabilities are not discounted to reflect the time value of money. Withholding tax on accrued overseas dividends is netted off against accruedrevenue in the debtor's note.
Equalisation applies only to shares purchased during the distribution period (group 2 shares). It is the average amount of revenue included inthe purchase price of all group 2 shares and is refunded to holders of these shares as a return of capital. Being capital repayment, it is notliable to income tax but must be deducted from the cost of the shares for capital gains tax purposes.
All expenses, other than those relating to transaction fees, are charged against the revenue property of the Fund. In the case of First StateAsian Property Securities Fund, Global Property Securities Fund,Global Listed Infrastructure Fund, Emerging Markets Bond Fund and EmergingMarkets Local Currency Bond Fund, all expenses are borne by the capital property of the Fund for distribution purposes. Management,registrar and dealing fees are charged directly to the share classes to which they relate. Other expenses are charged on a proportional basis.
Distributions from collective investment schemes are recognised when the schemes are quoted ex-distribution. Equalisation returned with thedistribution is deducted from the cost of the investment and does not form part of the distributable revenue. Any reported revenue from anoffshore fund, in excess of any distribution received in the reporting period, is recognised as revenue no later than the date on which thereporting fund makes this information available.
Overseas capital gains tax is recognised when paid, and no provision is made for this.
Interest on deposits and fixed-interest securities are recognised as earned. Revenue from debt securities is accounted for on an effective yieldbasis.
See the Prospectus for full details.
(c) where there may be a dilutive effect that, in the opinion of the ACD, requires the application of a dilution adjustment in the interests ofexisting/continuing shareholders and potential shareholders.
Applying effective yield to the revenue calculation may result in either higher or lower revenue depending on whether Funds hold more bondspurchased at a discount or purchased at a premium. Where the Funds hold more bonds purchased at a discount than at a premium, incomewill be higher.Where the full initial charge is levied on investment into any Fund that is soft-closed (soft-closed meaning that the Fund can still be accessedby investors, however, a charge is levied in an attempt to control the size of a Fund by discouraging inflows) in the interests of protectingexisting investors’ returns, the Investment Manager has paid this in to the relevant Fund. This is recognised on a cash basis for the individualshare classes of the soft-closed Funds. Prior to it being paid into the Fund, the Investment Manager will exercise discretion on whether todonate some or all of this revenue to charity or reimburse back to the Funds for the benefit of the existing shareholders.
Treatment of expenses
10
(continued)
as at 31 July 2017
Summary of Significant Accounting Policies Applicable to All Sub-Funds
(j)
(k)
The Company has adopted GBP as the presentation currency for the Company as a whole. The Company’s results and financial position aretranslated from the respective Fund's functional currency to the Company’s presentation currency, as follows:
Derivative financial instruments
The treatment of the returns on forward currency contracts depends upon the nature of the transaction. Where these transactions are used toprotect or enhance revenue, the revenue and expenses are included within net revenue in the Statement of Total Return.
(a) assets and liabilities, including net assets attributable to shareholders, are translated at the closing rate at the balance sheet date;
(b) proceeds from subscriptions and amounts paid on redemption of shares are translated at average rates, which approximate the ratesprevailing at the dates of the transactions; and
(c) income and expenses are translated at average exchange rates.
Other Matters
Where the transactions are used to protect or enhance investments, the gains/losses are treated as capital and included within gains/losses oninvestments in the Statement of Total Return. Any open positions in these types of transactions at the year end are included in the BalanceSheet at their mark-to-market value.
Foreign currency translation
Items included in the Company’s financial statements are measured using the primary economic environment in which it operates (the“functional currency”). The functional currency of each Fund is GBP with the exception of First State Emerging Markets Local Currency BondFund and First State Global Interest Rates and Currency Fund, which have adopted USD as their functional currency.
A number of Funds are in the process of reclaiming refunds of dividend withholding tax on the basis of free movement of capital provisions inthe European Union. On receipt, these amounts will be treated as windfall amounts in the Funds and will form part of any distributableincome.
High Court ClaimThe European Court of Justice has held that the UK tax regime in respect of income from portfolio investments contravened the EU right tofree movement of capital. Until 2009, income from portfolio investments in the UK was exempt from corporation tax, whilst dividend incomefrom foreign portfolio investments was taxable with limited relief for foreign tax paid. The Company has made claims against HMRC forrepayment of tax paid on dividend income from foreign portfolio investments in these circumstances. The claims form part of the CFC andDividend Group Litigation, in which test cases, including the Prudential dividend test case, are still ongoing in relation to various issues. Theinterest that each Fund has in these claims has not been recognised in the financial statements as the timing and amount of any benefit isuncertain. In the event claims are successful, any monies awarded by the court will be paid to the relevant Funds as a windfall to thoseshareholders who remain in the Fund at the date of payment of the claims.
Foreign Retrospective Tax Claims
11
Risks and reward profile
Lower Risk Higher Risk
Potentially Lower Rewards Potentially Higher Rewards
1 2 3 4 5 6 7
The Fund may use derivatives for efficient portfolio management purposes only.
• The synthetic risk reward indicator (the SRRI) rating is not a measure of the risk of you losing your investment but describes how much the valueof the Fund went up and down in the past;
• The SRRI rating is based on historical data, which may not be a reliable indication of the future risks and rewards of the Fund;
• On a scale of 1 (less risky) to 7 (more risky), this Fund has a rating of 6 due to its past performance and the nature of its investments. Shareswith a rating of 6 might have higher risks, but also higher returns;
Currency risk: the Fund invests in assets that are denominated in other currencies; changes in exchange rates will affect the value of the Fund.
Emerging market risk: emerging markets may not provide the same level of investor protection as a developed market; they may involve a higherrisk than investing in developed markets.
The Fund might also experience the following risks:
• The value of the Fund and its return is not guaranteed and may fall as well as rise. You may get back less than you originally invested.
• Even the lowest rating 1 does not mean a risk-free investment;
Concentration risk: the Fund invests in a relatively small number of companies or countries, which may be riskier than a fund that invests in alarge number of companies or countries. Investing in a larger number of companies or countries helps spread risk.
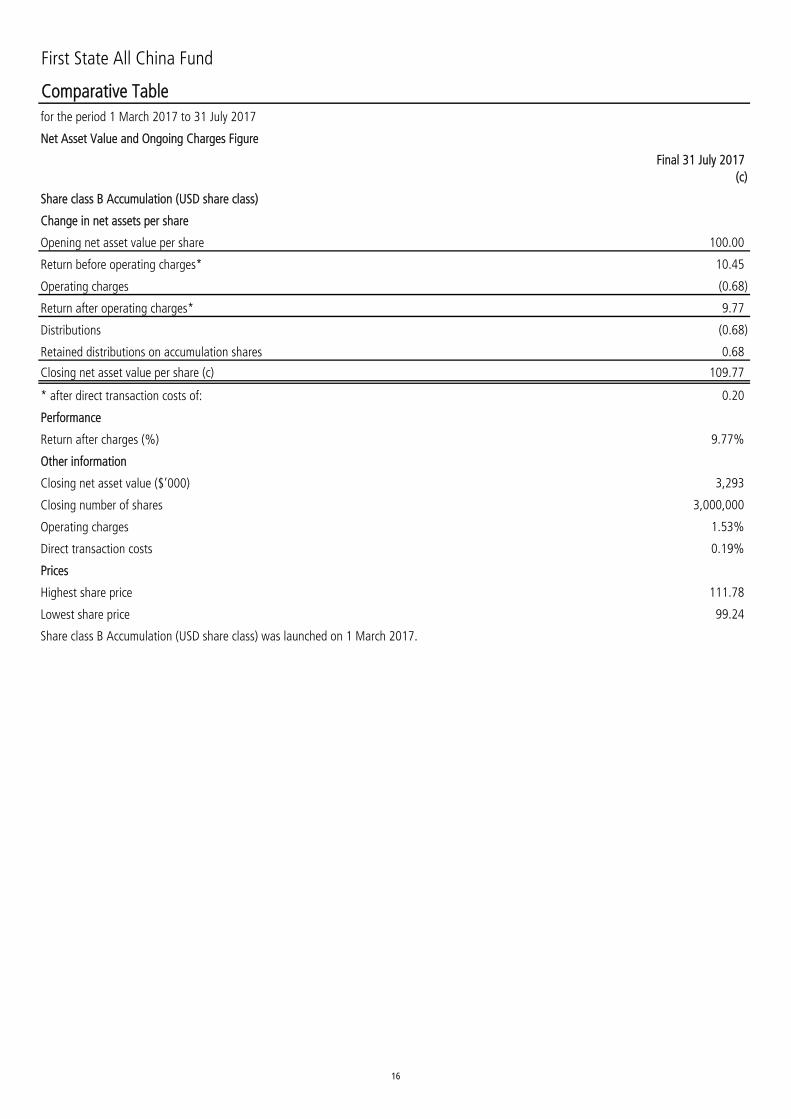
First State All China Fund
In order to gain exposure to these types of equities and equity-related instruments, up to 10% of the net assets of the Fund may be invested inother collective investment schemes, including in collective investment schemes managed by the ACD or its associates (“Associated Schemes”),and/or other Funds of the Company (“Second Funds”).
Investment may be in cash or near cash.
Investment Objective and Policy
The Fund aims to achieve long-term capital growth.
for the period 1 March 2017 to 31 July 2017
Authorised Fund Manager's Report
The Fund invests primarily in a concentrated portfolio of securities issued by companies with either assets in or revenues derived from the People’sRepublic of China that are listed, traded or dealt in on Regulated Markets in China, Hong Kong, Singapore or in a member state of the OECD(Organisation for Economic Co-operation and Development).
As the Fund was launched on 1 March 2017 and has not yet reached one year of performance, we have not included any fund commentary at thispoint.
• We cannot guarantee that the rating of the Fund will remain the same; it may change over time;
Single-country risk: investing in a single country may be riskier than investing in a number of different countries. Investing in a larger number ofcountries helps spread risk.
For further information on risks, please refer to the Risk Factors section in the Company's prospectus.
Outlook
• Risk is taken in order to make a higher potential return; the more risk a Fund takes, the higher the potential return but the greater the risk ofloss; and
Performance
There are near-term risks in the Greater China markets to be aware of. Hong Kong and China’s property prices seem overheated, which raises theprospect of more aggressive cooling measures from the government. Meanwhile, a number of internet and technology stocks have tested newyear-to-date highs (albeit supported by relatively strong rates of growth), which gives reason to pause. When the market is so upbeat and broadlyin consensus, it is usually the right time to be cautious.
Share class B Accumulation (USD share class)
12
(continued)
First State All China Fund
for the period 1 March 2017 to 31 July 2017
Authorised Fund Manager's Report
31 July 2017% of Fund
6.345.865.465.024.073.633.233.113.032.91
Accumulation.
Cumulative performance as at 31 July 2017
We are not in a position to provide performance data as the Fund was launched to the market on 1 March 2017. This will be provided in futurereports once the Fund has obtained a track record of one year.
Shanghai International Airport 'A'
Ten largest holdings
Stock nameChina Mengniu Dairy
Types of shares
Shanghai M&G StationeryLuye Pharma GroupASM Pacific Technology
Yunnan Baiyao GroupChina TelecomChina Resources Gas Group
Bank of NingboJiangsu Hengrui Medicine
13
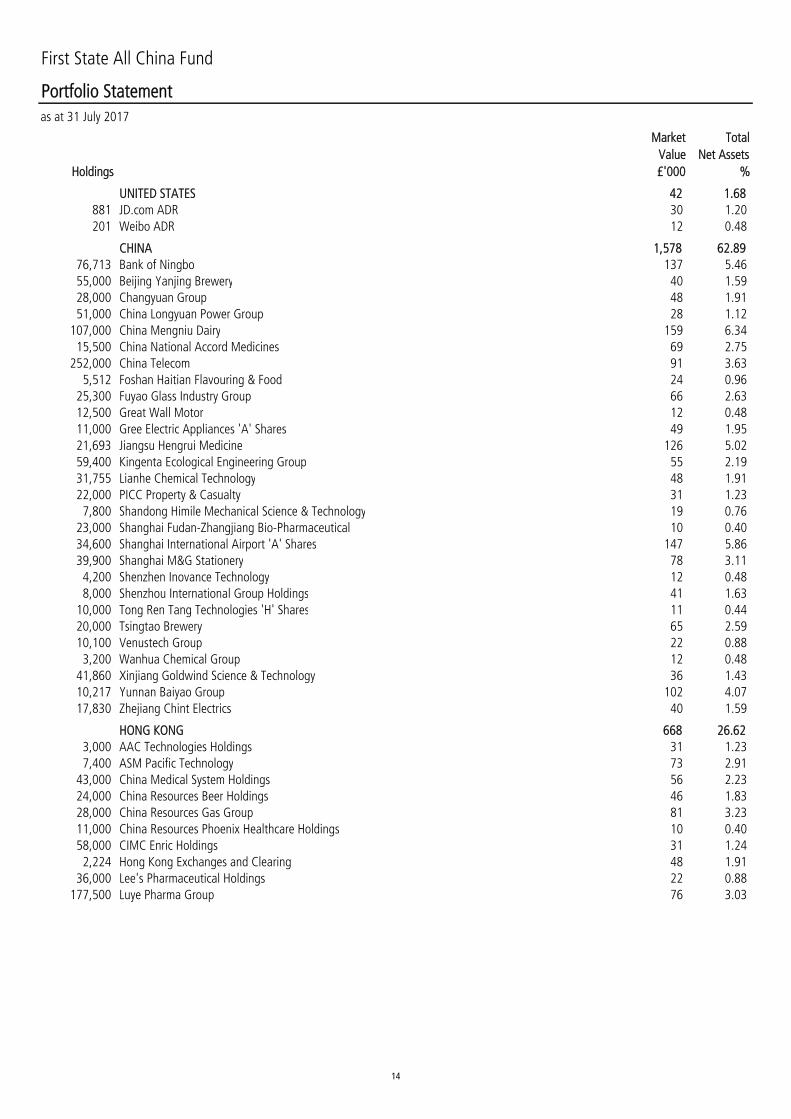
Holdings
MarketValue£'000
TotalNet Assets
%
UNITED STATES 42 1.68881 JD.com ADR 30 1.20201 Weibo ADR 12 0.48
CHINA 1,578 62.8976,713 Bank of Ningbo 137 5.4655,000 Beijing Yanjing Brewery 40 1.5928,000 Changyuan Group 48 1.9151,000 China Longyuan Power Group 28 1.12
107,000 China Mengniu Dairy 159 6.3415,500 China National Accord Medicines 69 2.75
252,000 China Telecom 91 3.635,512 Foshan Haitian Flavouring & Food 24 0.96
25,300 Fuyao Glass Industry Group 66 2.6312,500 Great Wall Motor 12 0.4811,000 Gree Electric Appliances 'A' Shares 49 1.9521,693 Jiangsu Hengrui Medicine 126 5.0259,400 Kingenta Ecological Engineering Group 55 2.1931,755 Lianhe Chemical Technology 48 1.9122,000 PICC Property & Casualty 31 1.23
7,800 Shandong Himile Mechanical Science & Technology 19 0.7623,000 Shanghai Fudan-Zhangjiang Bio-Pharmaceutical 10 0.4034,600 Shanghai International Airport 'A' Shares 147 5.8639,900 Shanghai M&G Stationery 78 3.11
4,200 Shenzhen Inovance Technology 12 0.488,000 Shenzhou International Group Holdings 41 1.63
10,000 Tong Ren Tang Technologies 'H' Shares 11 0.4420,000 Tsingtao Brewery 65 2.5910,100 Venustech Group 22 0.88
3,200 Wanhua Chemical Group 12 0.4841,860 Xinjiang Goldwind Science & Technology 36 1.4310,217 Yunnan Baiyao Group 102 4.0717,830 Zhejiang Chint Electrics 40 1.59
HONG KONG 668 26.623,000 AAC Technologies Holdings 31 1.237,400 ASM Pacific Technology 73 2.91
43,000 China Medical System Holdings 56 2.2324,000 China Resources Beer Holdings 46 1.8328,000 China Resources Gas Group 81 3.2311,000 China Resources Phoenix Healthcare Holdings 10 0.4058,000 CIMC Enric Holdings 31 1.24
2,224 Hong Kong Exchanges and Clearing 48 1.9136,000 Lee's Pharmaceutical Holdings 22 0.88
177,500 Luye Pharma Group 76 3.03
First State All China Fund
as at 31 July 2017
Portfolio Statement
14

Holdings
MarketValue£'000
TotalNet Assets
%
First State All China Fund
as at 31 July 2017
(continued)Portfolio Statement
11,200 Sinopharm Group 36 1.431,800 Tencent Holdings 55 2.19
121,952 Towngas China 65 2.5994,000 Wasion Group Holdings 32 1.2844,000 Yashili International Holdings 6 0.24
Portfolio of investments 2,288 91.19
Net other assets 221 8.81
Total net assets 2,509 100.00
Stocks shown as ADRs represent American Depositary Receipts.
All investments held are listed, unless otherwise stated.For the purposes of the portfolio holdings analysis, securities are shown based on their country of listing.
There are no comparatives for this statement as this Fund launched on 1 March 2017.
15
Share class B Accumulation (USD share class)
Change in net assets per share
Opening net asset value per share
Return before operating charges*
Operating charges
Return after operating charges*
Distributions
Retained distributions on accumulation shares
Closing net asset value per share (c)
* after direct transaction costs of:
Performance
Return after charges (%)
Other information
Closing net asset value ($’000)
Closing number of shares
Operating charges
Direct transaction costs
Prices
Highest share price
Lowest share price
Final 31 July 2017(c)
First State All China Fund
Comparative Tablefor the period 1 March 2017 to 31 July 2017
Net Asset Value and Ongoing Charges Figure
100.00
10.45
(0.68)
9.77
(0.68)
0.68
109.77
0.20
9.77%
3,293
3,000,000
1.53%
0.19%
111.78
Share class B Accumulation (USD share class) was launched on 1 March 2017.
99.24
16
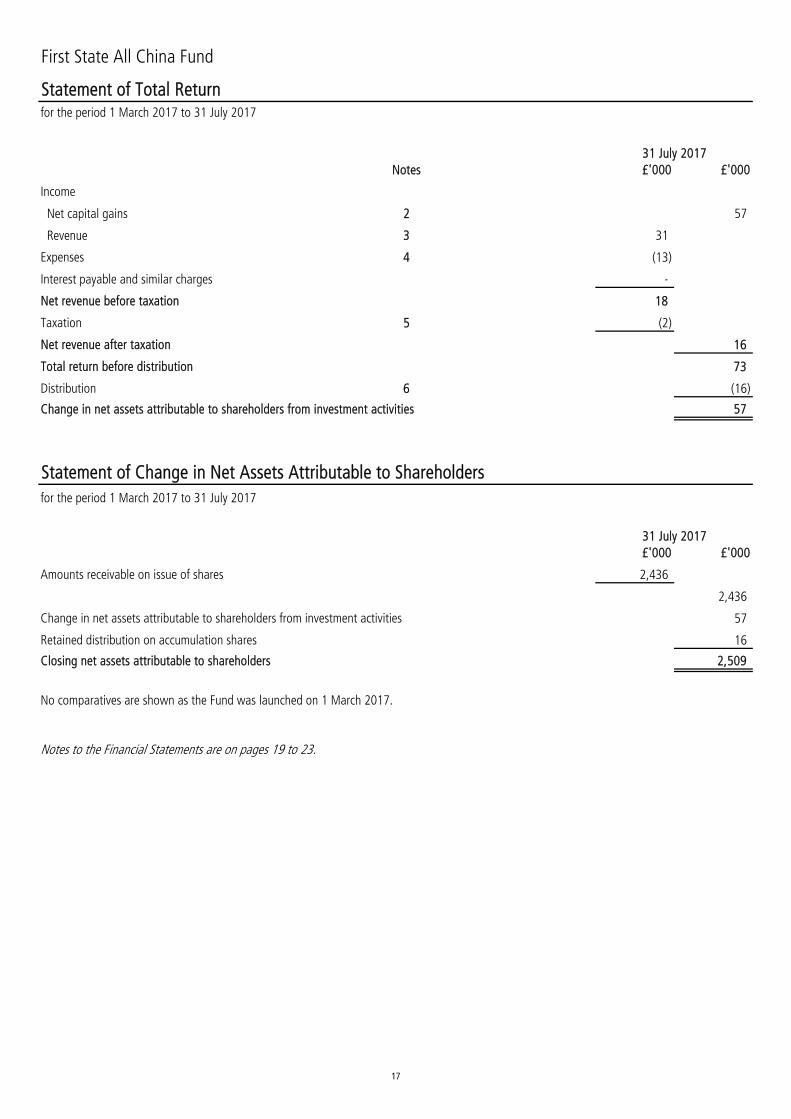
Notes £'000 £'000
Net capital gains 2 57
Revenue 3 31
4 (13)
Interest payable and similar charges -
18
5 (2)
16
73
6 (16)
57
£'000 £'000
2,436
2,436
57
16
2,509
First State All China Fund
Statement of Total Returnfor the period 1 March 2017 to 31 July 2017
Total return before distribution
Change in net assets attributable to shareholders from investment activities
Income
Retained distribution on accumulation shares
Change in net assets attributable to shareholders from investment activities
31 July 2017
Net revenue before taxation
Net revenue after taxation
Statement of Change in Net Assets Attributable to Shareholders
Taxation
Distribution
Expenses
for the period 1 March 2017 to 31 July 2017
31 July 2017
Amounts receivable on issue of shares
Closing net assets attributable to shareholders
Notes to the Financial Statements are on pages 19 to 23.
No comparatives are shown as the Fund was launched on 1 March 2017.
17
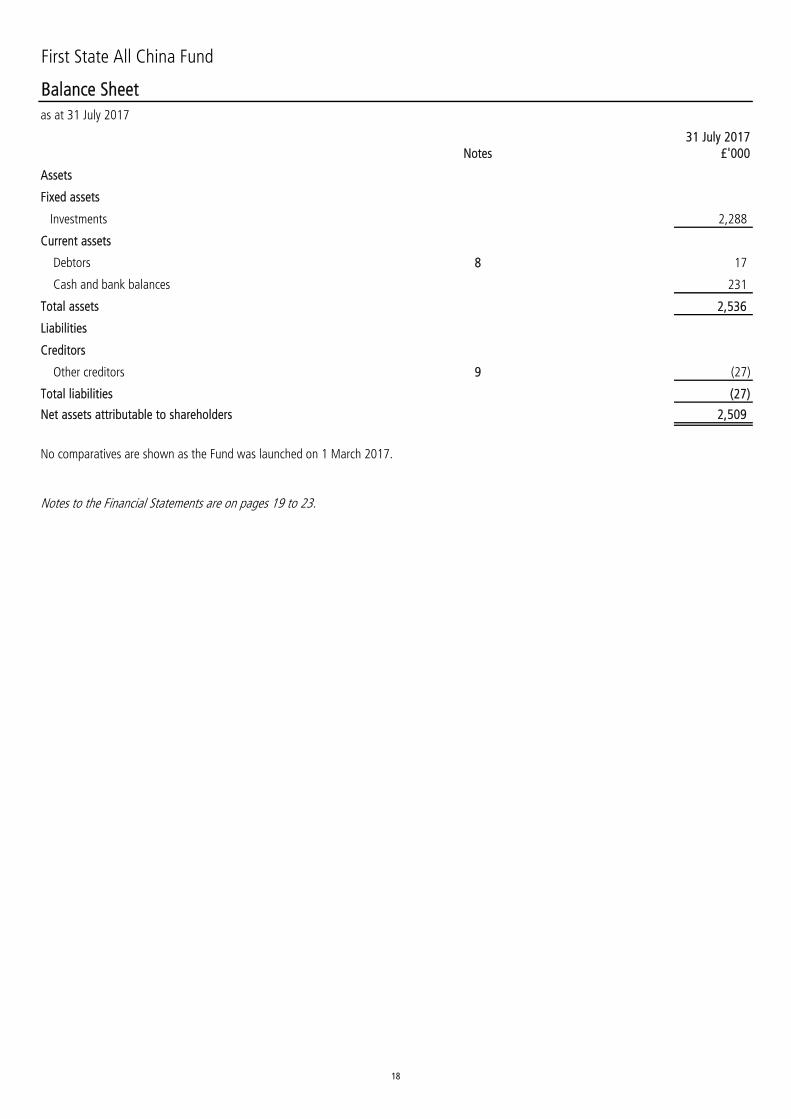
First State All China Fund
31 July 2017Notes £'000
Investments 2,288
Current assets
8 17
231
2,536
Creditors
Other creditors 9 (27)
(27)
2,509
No comparatives are shown as the Fund was launched on 1 March 2017.
Notes to the Financial Statements are on pages 19 to 23.
Fixed assets
Total assets
Liabilities
Debtors
Assets
Net assets attributable to shareholders
Cash and bank balances
Total liabilities
Balance Sheetas at 31 July 2017
18
1.
2.
31 July 2017£'000
561
57
3.
31 July 2017£'000
292
31
4.
31 July 2017£'000
10(26)
(16)
623
29
13
Currency gains
Net capital gains
Revenue
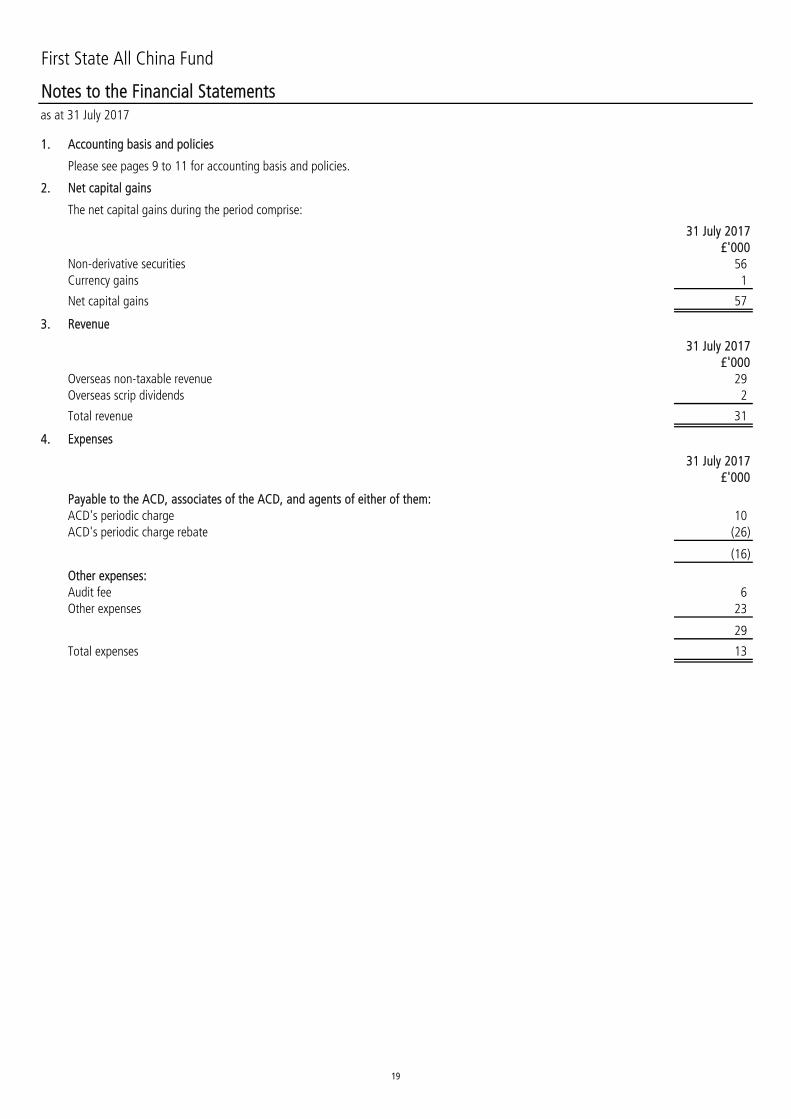
ACD's periodic charge
Expenses
Overseas non-taxable revenue
Total revenue
Overseas scrip dividends
Payable to the ACD, associates of the ACD, and agents of either of them:
Audit fee
ACD's periodic charge rebate
Other expenses:
as at 31 July 2017
Please see pages 9 to 11 for accounting basis and policies.
The net capital gains during the period comprise:
Non-derivative securities
First State All China Fund
Notes to the Financial Statements
Net capital gains
Accounting basis and policies
Total expenses
Other expenses
19
as at 31 July 2017
First State All China Fund
(continued)Notes to the Financial Statements
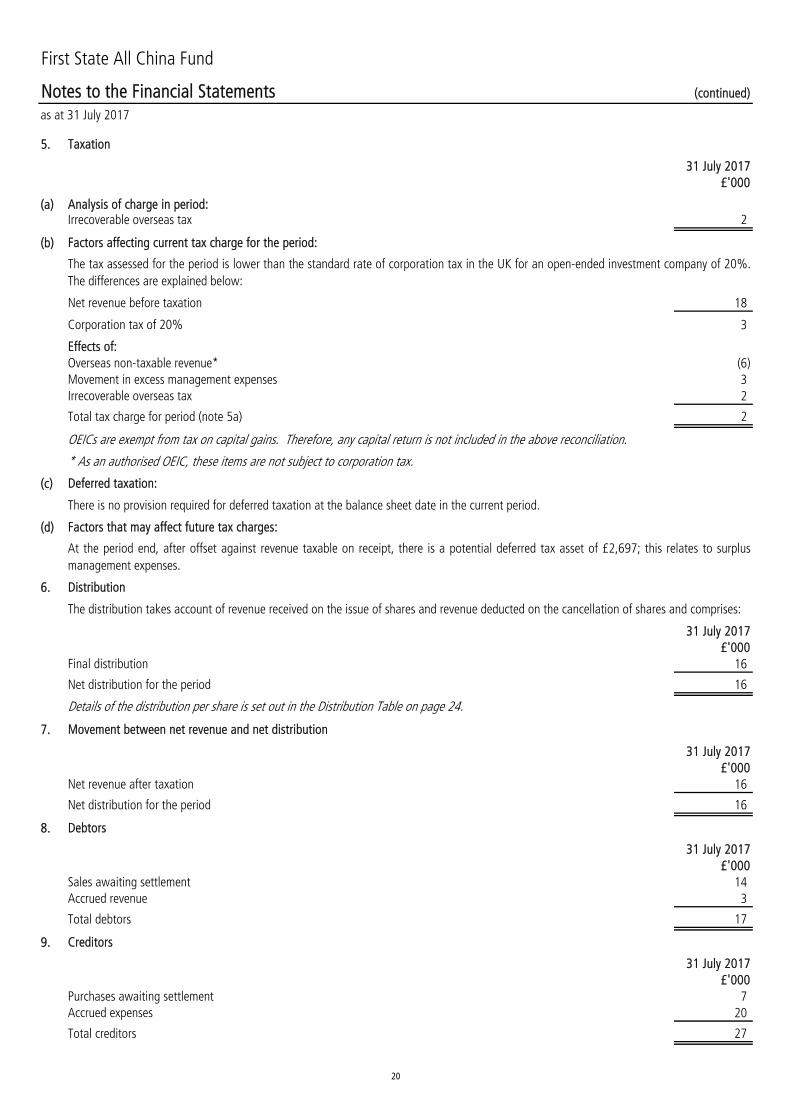
5.
31 July 2017£'000
(a)2
(b)
18
3
(6)32
2
(c)
(d)
6.
31 July 2017£'000
16
16
7.
31 July 2017£'000
16
16
8.
31 July 2017£'000
143
17
9.
31 July 2017£'000
720
27
Sales awaiting settlement
Debtors
Accrued revenue
Net revenue after taxation
OEICs are exempt from tax on capital gains. Therefore, any capital return is not included in the above reconciliation.
Total tax charge for period (note 5a)
Deferred taxation:
* As an authorised OEIC, these items are not subject to corporation tax.
At the period end, after offset against revenue taxable on receipt, there is a potential deferred tax asset of £2,697; this relates to surplusmanagement expenses.
Overseas non-taxable revenue*
The distribution takes account of revenue received on the issue of shares and revenue deducted on the cancellation of shares and comprises:
Analysis of charge in period:Irrecoverable overseas tax
Net distribution for the period
Accrued expenses
Total debtors
Purchases awaiting settlement
Total creditors
Details of the distribution per share is set out in the Distribution Table on page 24.
Net distribution for the period
The tax assessed for the period is lower than the standard rate of corporation tax in the UK for an open-ended investment company of 20%.The differences are explained below:
Factors affecting current tax charge for the period:
Net revenue before taxation
Corporation tax of 20%
Effects of:
Factors that may affect future tax charges:
There is no provision required for deferred taxation at the balance sheet date in the current period.
Irrecoverable overseas tax
Creditors
Taxation
Movement in excess management expenses
Movement between net revenue and net distribution
Final distribution
Distribution
20
as at 31 July 2017
First State All China Fund
(continued)Notes to the Financial Statements
10.
31 July 2017 31 July 2017£'000 £'0002,498 274
2,498 274
3 -
2 -
5 -
2,503 274
31 July 2017 31 July 2017% %
0.12 -
0.08 -
11.
Analysis of total trade costs:
Total costs
Equities
Total transaction cost expressed as a percentage of asset type cost:
Purchases Sales
CommissionsEquities
Taxes
Equities
Contingent liabilities and commitments
Portfolio transaction costs
Commissions 0.12
Sales
Total transaction cost expressed as a percentage of average net asset value:
Trades in the period before transaction costs
Purchases
0.19
Equities
0.07
Taxes
The average portfolio dealing spread at the balance sheet date was 0.18%.
31 July 2017%
Commissions
Taxes
Total net trades in the period after transaction costs
Equities
Average portfolio dealing spread
Total costs
As at 31 July 2017, the Fund had no contingent liabilities and no commitments.
21
as at 31 July 2017
First State All China Fund
(continued)Notes to the Financial Statements
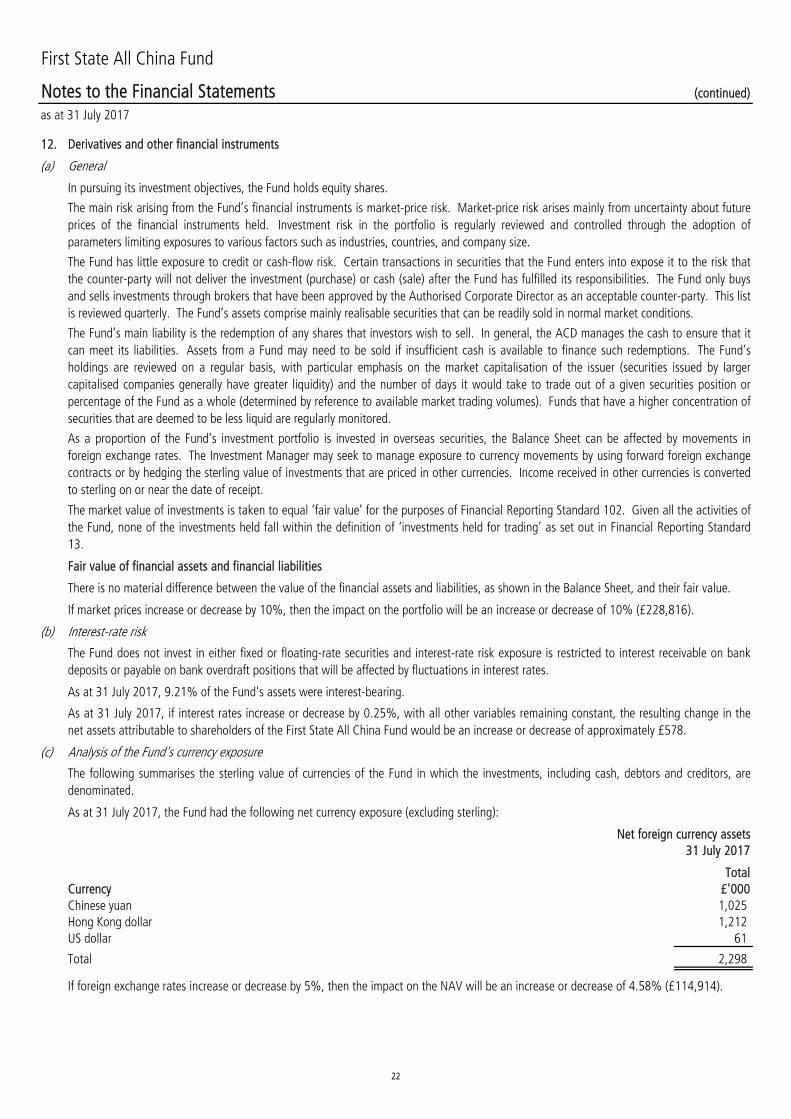
12.
(a)
(b)
(c)
TotalCurrency £'000Chinese yuan 1,025Hong Kong dollar 1,212US dollar 61
Total 2,298
General
Fair value of financial assets and financial liabilities
The following summarises the sterling value of currencies of the Fund in which the investments, including cash, debtors and creditors, aredenominated.
If foreign exchange rates increase or decrease by 5%, then the impact on the NAV will be an increase or decrease of 4.58% (£114,914).
Analysis of the Fund's currency exposure
If market prices increase or decrease by 10%, then the impact on the portfolio will be an increase or decrease of 10% (£228,816).
31 July 2017
As at 31 July 2017, if interest rates increase or decrease by 0.25%, with all other variables remaining constant, the resulting change in thenet assets attributable to shareholders of the First State All China Fund would be an increase or decrease of approximately £578.
The Fund’s main liability is the redemption of any shares that investors wish to sell. In general, the ACD manages the cash to ensure that itcan meet its liabilities. Assets from a Fund may need to be sold if insufficient cash is available to finance such redemptions. The Fund’sholdings are reviewed on a regular basis, with particular emphasis on the market capitalisation of the issuer (securities issued by largercapitalised companies generally have greater liquidity) and the number of days it would take to trade out of a given securities position orpercentage of the Fund as a whole (determined by reference to available market trading volumes). Funds that have a higher concentration ofsecurities that are deemed to be less liquid are regularly monitored.
The market value of investments is taken to equal ‘fair value’ for the purposes of Financial Reporting Standard 102. Given all the activities ofthe Fund, none of the investments held fall within the definition of ‘investments held for trading’ as set out in Financial Reporting Standard13.
As a proportion of the Fund’s investment portfolio is invested in overseas securities, the Balance Sheet can be affected by movements inforeign exchange rates. The Investment Manager may seek to manage exposure to currency movements by using forward foreign exchangecontracts or by hedging the sterling value of investments that are priced in other currencies. Income received in other currencies is convertedto sterling on or near the date of receipt.
Net foreign currency assets
The Fund does not invest in either fixed or floating-rate securities and interest-rate risk exposure is restricted to interest receivable on bankdeposits or payable on bank overdraft positions that will be affected by fluctuations in interest rates.
In pursuing its investment objectives, the Fund holds equity shares.
The main risk arising from the Fund’s financial instruments is market-price risk. Market-price risk arises mainly from uncertainty about futureprices of the financial instruments held. Investment risk in the portfolio is regularly reviewed and controlled through the adoption ofparameters limiting exposures to various factors such as industries, countries, and company size.
The Fund has little exposure to credit or cash-flow risk. Certain transactions in securities that the Fund enters into expose it to the risk thatthe counter-party will not deliver the investment (purchase) or cash (sale) after the Fund has fulfilled its responsibilities. The Fund only buysand sells investments through brokers that have been approved by the Authorised Corporate Director as an acceptable counter-party. This listis reviewed quarterly. The Fund’s assets comprise mainly realisable securities that can be readily sold in normal market conditions.
There is no material difference between the value of the financial assets and liabilities, as shown in the Balance Sheet, and their fair value.
Interest-rate risk
As at 31 July 2017, 9.21% of the Fund's assets were interest-bearing.
As at 31 July 2017, the Fund had the following net currency exposure (excluding sterling):
Derivatives and other financial instruments
22
as at 31 July 2017
First State All China Fund
(continued)Notes to the Financial Statements
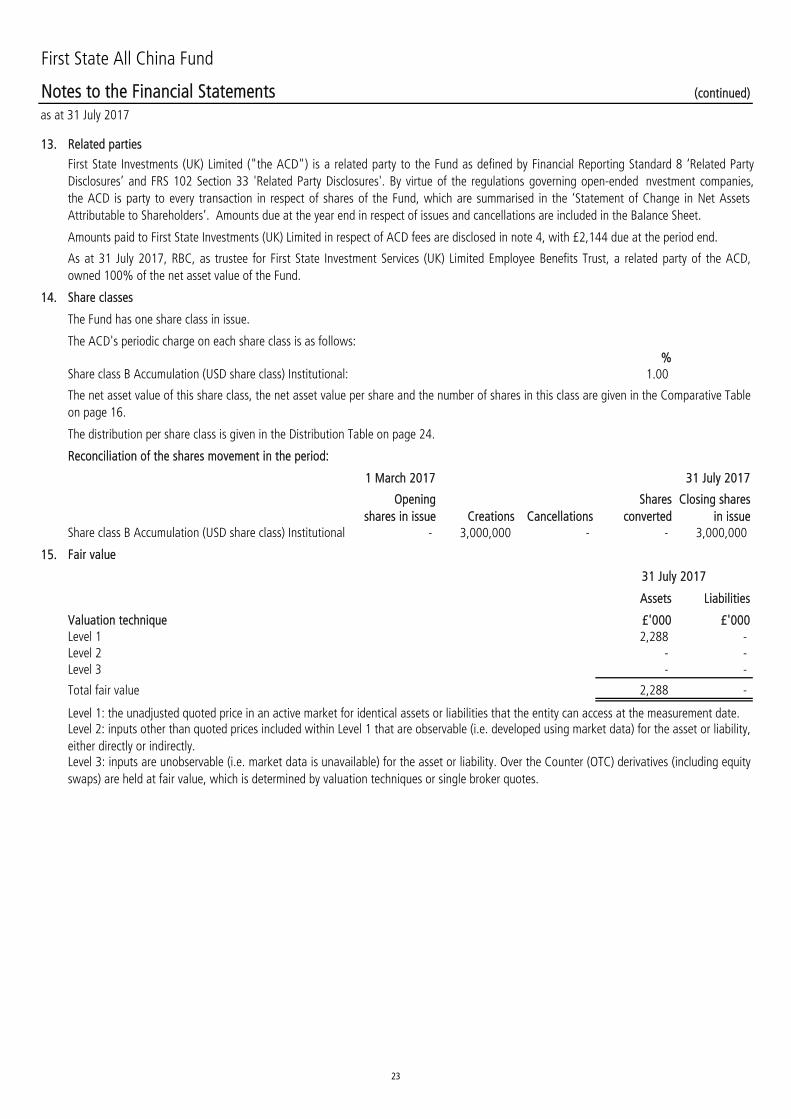
13.
14.
%1.00
1 March 2017 31 July 2017
Opening shares in issue Creations Cancellations
Shares converted
Closing shares in issue
- 3,000,000 - - 3,000,000
15.
Assets Liabilities
£'000 £'0002,288 -
- -- -
2,288 -
Share class B Accumulation (USD share class) Institutional:
The ACD's periodic charge on each share class is as follows:
Related parties
Share classes
Level 1Level 2Level 3
Total fair value
Fair value
Valuation technique
As at 31 July 2017, RBC, as trustee for First State Investment Services (UK) Limited Employee Benefits Trust, a related party of the ACD,owned 100% of the net asset value of the Fund.
The Fund has one share class in issue.
Level 3: inputs are unobservable (i.e. market data is unavailable) for the asset or liability. Over the Counter (OTC) derivatives (including equityswaps) are held at fair value, which is determined by valuation techniques or single broker quotes.
Amounts paid to First State Investments (UK) Limited in respect of ACD fees are disclosed in note 4, with £2,144 due at the period end.
Reconciliation of the shares movement in the period:
Share class B Accumulation (USD share class) Institutional
Level 1: the unadjusted quoted price in an active market for identical assets or liabilities that the entity can access at the measurement date. Level 2: inputs other than quoted prices included within Level 1 that are observable (i.e. developed using market data) for the asset or liability,either directly or indirectly.
31 July 2017
First State Investments (UK) Limited ("the ACD") is a related party to the Fund as defined by Financial Reporting Standard 8 ‘Related Party Disclosures’ and FRS 102 Section 33 'Related Party Disclosures'. By virtue of the regulations governing open-ended investment companies, the ACD is party to every transaction in respect of shares of the Fund, which are summarised in the ‘Statement of Change in Net Assets Attributable to Shareholders’. Amounts due at the year end in respect of issues and cancellations are included in the Balance Sheet.
The net asset value of this share class, the net asset value per share and the number of shares in this class are given in the Comparative Tableon page 16.
The distribution per share class is given in the Distribution Table on page 24.
23
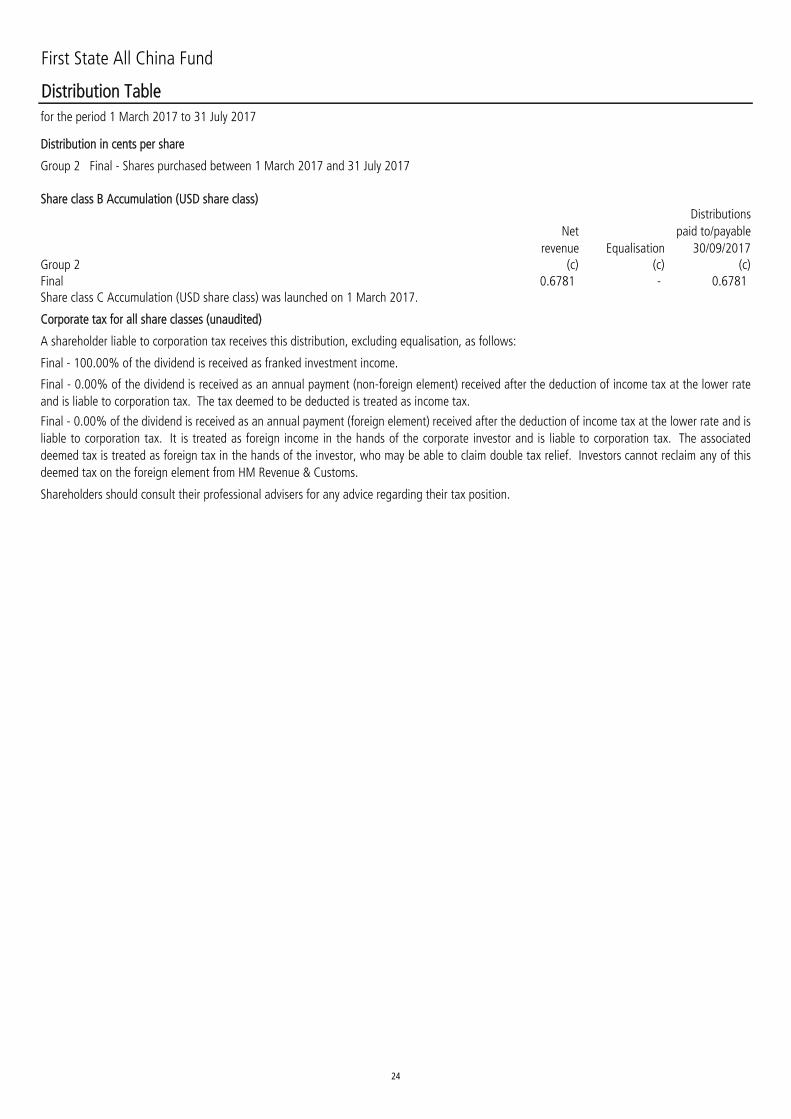
Share class B Accumulation (USD share class)
Netrevenue Equalisation
Distributions paid to/payable
30/09/2017Group 2 (c) (c) (c)Final 0.6781 - 0.6781
First State All China Fund
Distribution Tablefor the period 1 March 2017 to 31 July 2017
Distribution in cents per share
Group 2 Final - Shares purchased between 1 March 2017 and 31 July 2017
Share class C Accumulation (USD share class) was launched on 1 March 2017.
Corporate tax for all share classes (unaudited)
A shareholder liable to corporation tax receives this distribution, excluding equalisation, as follows:
Shareholders should consult their professional advisers for any advice regarding their tax position.
Final - 100.00% of the dividend is received as franked investment income.
Final - 0.00% of the dividend is received as an annual payment (non-foreign element) received after the deduction of income tax at the lower rateand is liable to corporation tax. The tax deemed to be deducted is treated as income tax.
Final - 0.00% of the dividend is received as an annual payment (foreign element) received after the deduction of income tax at the lower rate and isliable to corporation tax. It is treated as foreign income in the hands of the corporate investor and is liable to corporation tax. The associateddeemed tax is treated as foreign tax in the hands of the investor, who may be able to claim double tax relief. Investors cannot reclaim any of thisdeemed tax on the foreign element from HM Revenue & Customs.
24
•
Risks and reward profile
Lower Risk Higher Risk
Potentially Lower Rewards Potentially Higher Rewards
1 2 3 4 5* 6 7
1 2 3 4 5** 6 7
Clarification point: "Australasia" refers to Australia, New Zealand and other South-East Asian countries.
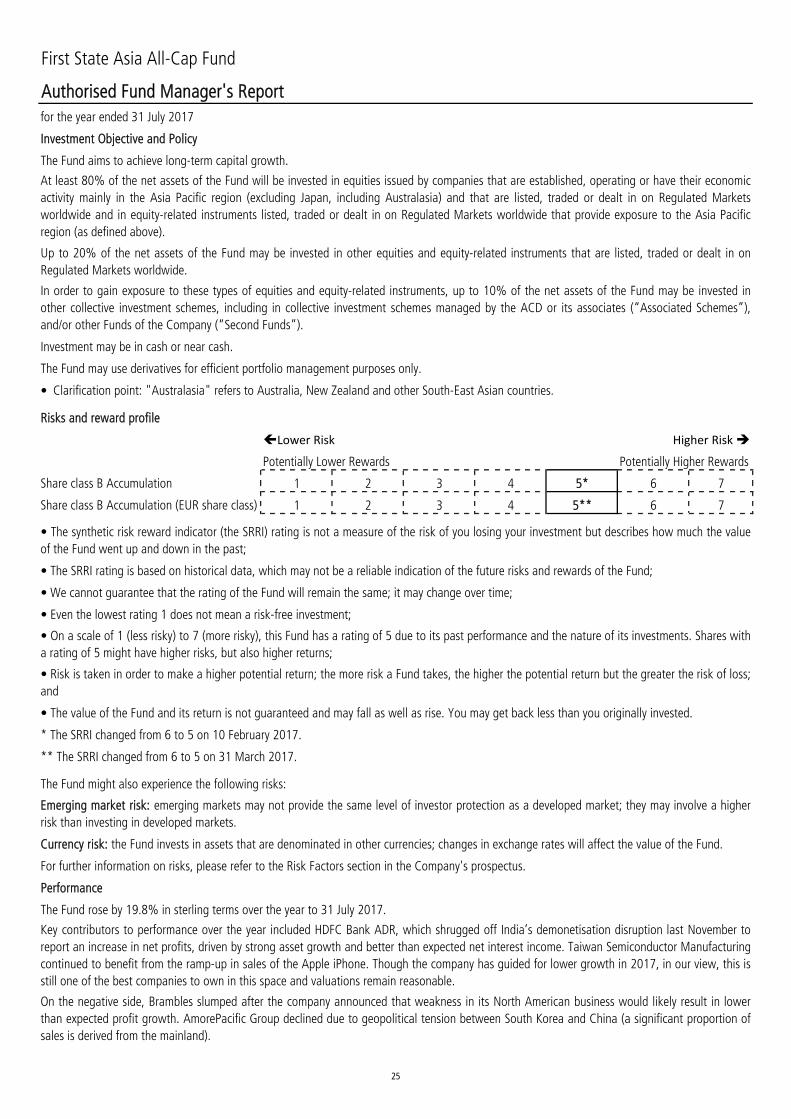
First State Asia All-Cap Fund
Authorised Fund Manager's Reportfor the year ended 31 July 2017
Investment Objective and Policy
In order to gain exposure to these types of equities and equity-related instruments, up to 10% of the net assets of the Fund may be invested inother collective investment schemes, including in collective investment schemes managed by the ACD or its associates (“Associated Schemes”),and/or other Funds of the Company (“Second Funds”).
Investment may be in cash or near cash.
The Fund may use derivatives for efficient portfolio management purposes only.
The Fund aims to achieve long-term capital growth.
At least 80% of the net assets of the Fund will be invested in equities issued by companies that are established, operating or have their economicactivity mainly in the Asia Pacific region (excluding Japan, including Australasia) and that are listed, traded or dealt in on Regulated Marketsworldwide and in equity-related instruments listed, traded or dealt in on Regulated Markets worldwide that provide exposure to the Asia Pacificregion (as defined above).
Up to 20% of the net assets of the Fund may be invested in other equities and equity-related instruments that are listed, traded or dealt in onRegulated Markets worldwide.
Share class B Accumulation
Share class B Accumulation (EUR share class)
• The synthetic risk reward indicator (the SRRI) rating is not a measure of the risk of you losing your investment but describes how much the valueof the Fund went up and down in the past;
• The SRRI rating is based on historical data, which may not be a reliable indication of the future risks and rewards of the Fund;
• We cannot guarantee that the rating of the Fund will remain the same; it may change over time;
Emerging market risk: emerging markets may not provide the same level of investor protection as a developed market; they may involve a higherrisk than investing in developed markets.
Currency risk: the Fund invests in assets that are denominated in other currencies; changes in exchange rates will affect the value of the Fund.
• Even the lowest rating 1 does not mean a risk-free investment;
• On a scale of 1 (less risky) to 7 (more risky), this Fund has a rating of 5 due to its past performance and the nature of its investments. Shares witha rating of 5 might have higher risks, but also higher returns;
• Risk is taken in order to make a higher potential return; the more risk a Fund takes, the higher the potential return but the greater the risk of loss;and
• The value of the Fund and its return is not guaranteed and may fall as well as rise. You may get back less than you originally invested.
The Fund might also experience the following risks:
** The SRRI changed from 6 to 5 on 31 March 2017.
* The SRRI changed from 6 to 5 on 10 February 2017.
For further information on risks, please refer to the Risk Factors section in the Company's prospectus.
Performance
The Fund rose by 19.8% in sterling terms over the year to 31 July 2017.
Key contributors to performance over the year included HDFC Bank ADR, which shrugged off India’s demonetisation disruption last November toreport an increase in net profits, driven by strong asset growth and better than expected net interest income. Taiwan Semiconductor Manufacturingcontinued to benefit from the ramp-up in sales of the Apple iPhone. Though the company has guided for lower growth in 2017, in our view, this isstill one of the best companies to own in this space and valuations remain reasonable.
On the negative side, Brambles slumped after the company announced that weakness in its North American business would likely result in lowerthan expected profit growth. AmorePacific Group declined due to geopolitical tension between South Korea and China (a significant proportion ofsales is derived from the mainland).
25
(continued)
First State Asia All-Cap Fund
Authorised Fund Manager's Reportfor the year ended 31 July 2017
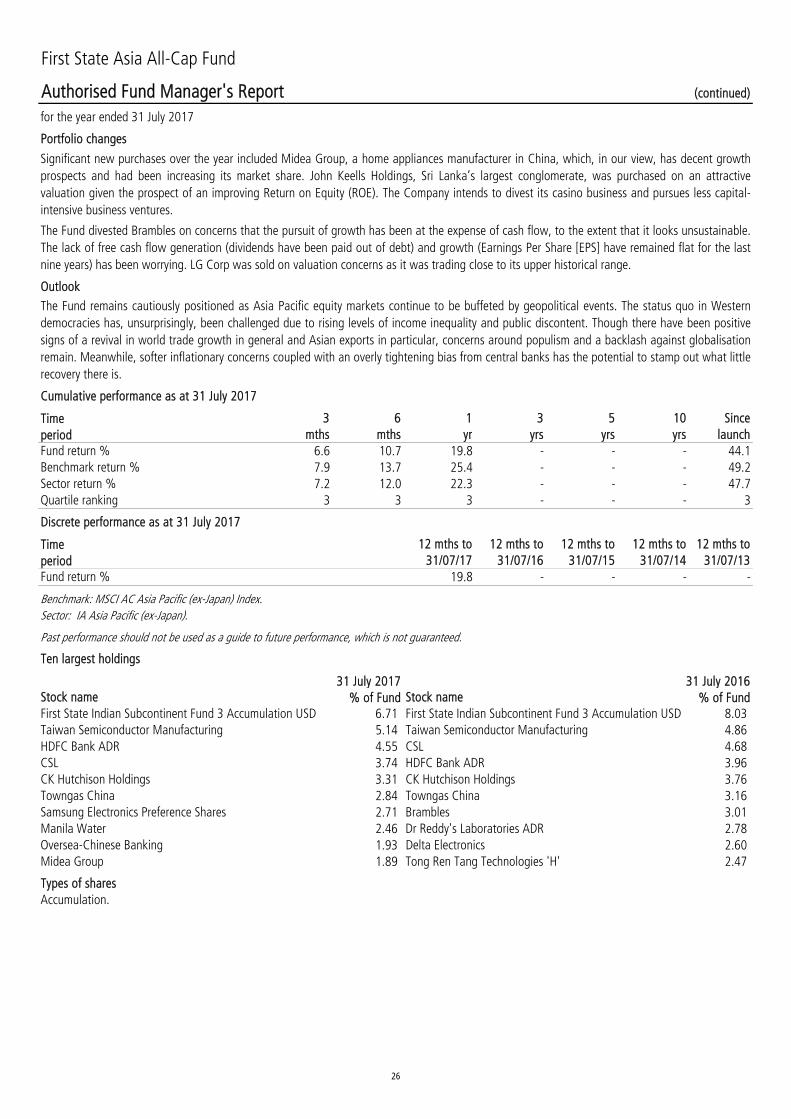
Time 3 6 1 3 5 10 Sinceperiod mths mths yr yrs yrs yrs launch
6.6 10.7 19.8 - - - 44.1 7.9 13.7 25.4 - - - 49.2 7.2 12.0 22.3 - - - 47.7
3 3 3 - - - 3
12 mths to 12 mths to 12 mths to 12 mths to 12 mths to31/07/17 31/07/16 31/07/15 31/07/14 31/07/13
19.8 - - - -
31 July 2017 31 July 2016% of Fund % of Fund
6.71 8.035.14 4.864.55 4.683.74 3.963.31 3.762.84 3.162.71 3.012.46 2.781.93 2.601.89 2.47
Portfolio changes
Significant new purchases over the year included Midea Group, a home appliances manufacturer in China, which, in our view, has decent growthprospects and had been increasing its market share. John Keells Holdings, Sri Lanka’s largest conglomerate, was purchased on an attractivevaluation given the prospect of an improving Return on Equity (ROE). The Company intends to divest its casino business and pursues less capital-intensive business ventures.
The Fund divested Brambles on concerns that the pursuit of growth has been at the expense of cash flow, to the extent that it looks unsustainable.The lack of free cash flow generation (dividends have been paid out of debt) and growth (Earnings Per Share [EPS] have remained flat for the lastnine years) has been worrying. LG Corp was sold on valuation concerns as it was trading close to its upper historical range.
Outlook
The Fund remains cautiously positioned as Asia Pacific equity markets continue to be buffeted by geopolitical events. The status quo in Westerndemocracies has, unsurprisingly, been challenged due to rising levels of income inequality and public discontent. Though there have been positivesigns of a revival in world trade growth in general and Asian exports in particular, concerns around populism and a backlash against globalisationremain. Meanwhile, softer inflationary concerns coupled with an overly tightening bias from central banks has the potential to stamp out what littlerecovery there is.
Cumulative performance as at 31 July 2017
Fund return %
TimeperiodFund return %
Benchmark: MSCI AC Asia Pacific (ex-Japan) Index.Sector: IA Asia Pacific (ex-Japan).
Benchmark return %Sector return %Quartile ranking
Discrete performance as at 31 July 2017
Stock name Stock nameFirst State Indian Subcontinent Fund 3 Accumulation USD First State Indian Subcontinent Fund 3 Accumulation USD
Past performance should not be used as a guide to future performance, which is not guaranteed.
Ten largest holdings
CK Hutchison Holdings CK Hutchison HoldingsTowngas China Towngas ChinaSamsung Electronics Preference Shares Brambles
Taiwan Semiconductor Manufacturing Taiwan Semiconductor ManufacturingHDFC Bank ADR CSLCSL HDFC Bank ADR
Types of sharesAccumulation.
Manila Water Dr Reddy's Laboratories ADROversea-Chinese Banking Delta ElectronicsMidea Group Tong Ren Tang Technologies 'H'
26

Holdings
MarketValue£'000
TotalNet Assets
%
UNITED STATES (0.85%*) 46 0.60272 Baidu ADR 46 0.60
IRELAND (0.00%*)‡ - -
SPAIN (0.00%*) 78 1.024,166 CIE Automotive 78 1.02
JAPAN (8.32%*) 385 5.02400 Keyence 141 1.84
6,000 MISUMI Group 113 1.472,600 Pigeon 73 0.95
300 Ryohin Keikaku 58 0.76
AUSTRALIA (8.82%*) 508 6.623,751 CSL 287 3.743,010 Ramsay Health Care 129 1.68
15,717 ResMed CDI 92 1.20
BANGLADESH (0.95%*) 115 1.5011,990 Marico Bangladesh 115 1.50
CHINA (10.59%*) 716 9.33254,000 China BlueChemical 'H' Shares 54 0.70
76,000 China Mengniu Dairy 113 1.4738,499 China South Publishing & Media Group 75 0.9821,000 ENN Energy Holdings 108 1.4134,423 Fuyao Glass Industry Group 'H' Shares 89 1.1631,000 Midea Group 145 1.89
120,000 Tong Ren Tang Technologies 'H' Shares 132 1.72
HONG KONG (13.60%*) 1,145 14.9111,500 AAC Technologies Holdings 118 1.5480,500 Aeon Stores Hong Kong 55 0.7219,800 AIA Group 119 1.55
6,300 ASM Pacific Technology 62 0.8142,500 China Resources Phoenix Healthcare Holdings 41 0.5325,500 CK Hutchison Holdings 255 3.3154,000 CSPC Pharmaceutical Group 64 0.8332,000 Minth Group 112 1.46
407,259 Towngas China 218 2.8462,000 Vitasoy International Holdings 101 1.32
INDIA (16.21%*)‡ 1,022 13.312,539 Dr Reddy's Laboratories ADR 71 0.92
27,716 First State Indian Subcontinent Fund 3 Accumulation USD† 515 6.714,723 HDFC Bank ADR 349 4.557,277 Infosys ADR 87 1.13
INDONESIA (1.95%*) 294 3.833,481,000 BFI Finance Indonesia 106 1.381,093,100 Hero Supermarket 70 0.91
48,800 Indocement Tunggal Prakarsa 48 0.631,087,100 Selamat Sempurna 70 0.91
MALAYSIA (0.93%*) - -
PAKISTAN (0.00%*) 36 0.472,860 Indus Motor 36 0.47
PHILIPPINES (7.20%*) 696 9.0752,843 BDO Unibank 99 1.29
First State Asia All-Cap Fund
Portfolio Statementas at 31 July 2017
27
Holdings
MarketValue£'000
TotalNet Assets
%
First State Asia All-Cap Fund
Portfolio Statement (continued)
as at 31 July 2017
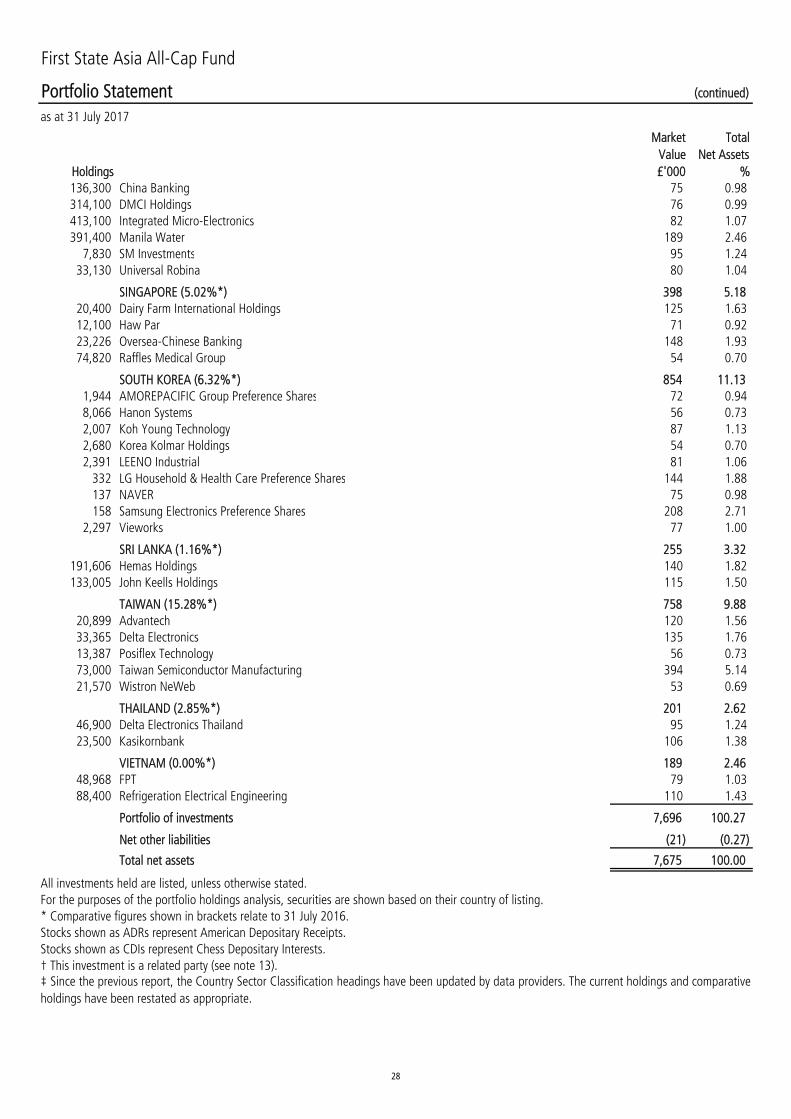
136,300 China Banking 75 0.98314,100 DMCI Holdings 76 0.99413,100 Integrated Micro-Electronics 82 1.07391,400 Manila Water 189 2.46
7,830 SM Investments 95 1.2433,130 Universal Robina 80 1.04
SINGAPORE (5.02%*) 398 5.1820,400 Dairy Farm International Holdings 125 1.6312,100 Haw Par 71 0.9223,226 Oversea-Chinese Banking 148 1.9374,820 Raffles Medical Group 54 0.70
SOUTH KOREA (6.32%*) 854 11.131,944 AMOREPACIFIC Group Preference Shares 72 0.948,066 Hanon Systems 56 0.732,007 Koh Young Technology 87 1.132,680 Korea Kolmar Holdings 54 0.702,391 LEENO Industrial 81 1.06
332 LG Household & Health Care Preference Shares 144 1.88137 NAVER 75 0.98158 Samsung Electronics Preference Shares 208 2.71
2,297 Vieworks 77 1.00
SRI LANKA (1.16%*) 255 3.32191,606 Hemas Holdings 140 1.82133,005 John Keells Holdings 115 1.50
TAIWAN (15.28%*) 758 9.8820,899 Advantech 120 1.5633,365 Delta Electronics 135 1.7613,387 Posiflex Technology 56 0.7373,000 Taiwan Semiconductor Manufacturing 394 5.1421,570 Wistron NeWeb 53 0.69
THAILAND (2.85%*) 201 2.6246,900 Delta Electronics Thailand 95 1.2423,500 Kasikornbank 106 1.38
VIETNAM (0.00%*) 189 2.4648,968 FPT 79 1.0388,400 Refrigeration Electrical Engineering 110 1.43
Portfolio of investments 7,696 100.27
Net other liabilities (21) (0.27)
Total net assets 7,675 100.00
‡ Since the previous report, the Country Sector Classification headings have been updated by data providers. The current holdings and comparativeholdings have been restated as appropriate.
† This investment is a related party (see note 13).
Stocks shown as ADRs represent American Depositary Receipts.Stocks shown as CDIs represent Chess Depositary Interests.
All investments held are listed, unless otherwise stated.
* Comparative figures shown in brackets relate to 31 July 2016.For the purposes of the portfolio holdings analysis, securities are shown based on their country of listing.
28

Share class B Accumulation
Change in net assets per share
Opening net asset value per share
Return before operating charges*
Operating charges
Return after operating charges*
Distributions*
Retained distributions on accumulation shares
Closing net asset value per share (p)
* after direct transaction costs of:
Performance
Return after charges (%)
Other information
Closing net asset value (£’000)
Closing number of shares
Operating charges
Direct transaction costs
Prices
Highest share price
Lowest share price
Share class B Accumulation was launched on 26 October 2015.
118.62 93.00
0.19% 0.14%
146.83 121.19
1.60% 1.60%
7,674 3,887
5,332,127 3,238,286
19.90% 20.03%
143.92 120.03
0.25 0.15
0.92 0.49
23.89 20.03
(0.92) (0.49)
26.01 21.29
(2.12) (1.26)
120.03 100.00
First State Asia All-Cap Fund
Comparative Tablefor the year ended 31 July 2017
Net Asset Value and Ongoing Charges Figure
Final 31 July 2017(p)
Final 31 July 2016(p)
29
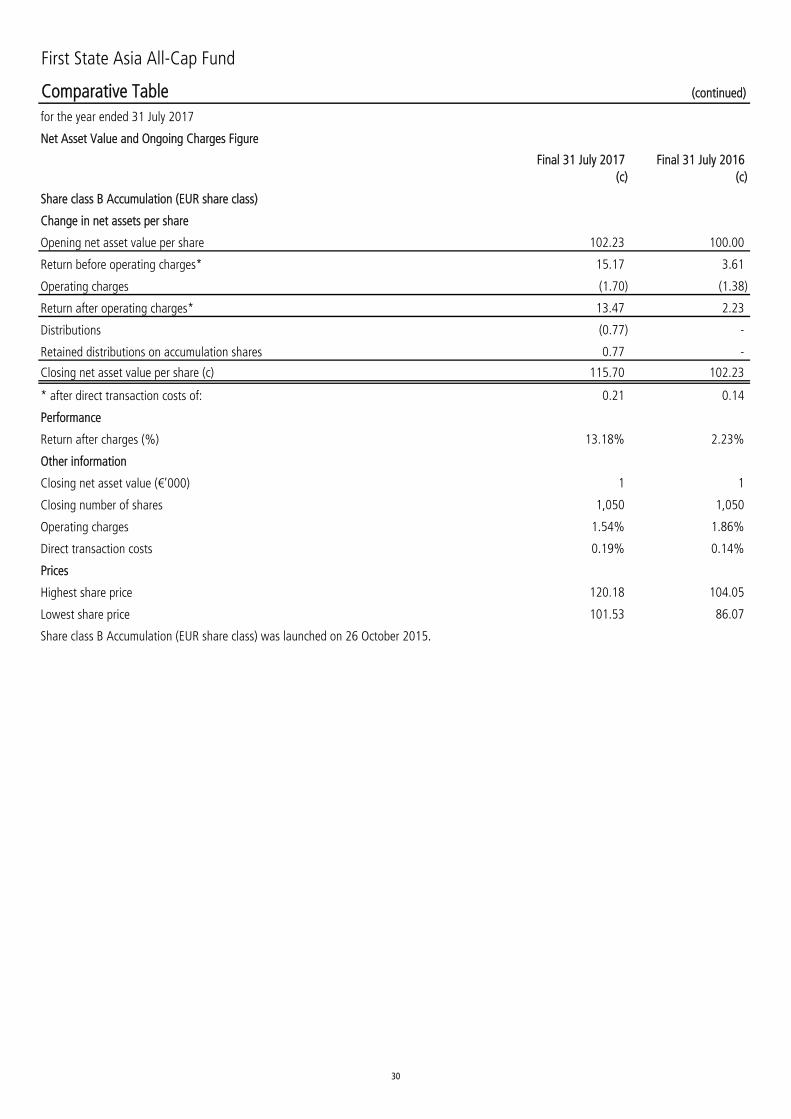
First State Asia All-Cap Fund
Comparative Table (continued)
for the year ended 31 July 2017
Net Asset Value and Ongoing Charges Figure
Share class B Accumulation (EUR share class)
Change in net assets per share
Opening net asset value per share
Return before operating charges*
Operating charges
Return after operating charges*
Distributions
Retained distributions on accumulation shares
Closing net asset value per share (c)
* after direct transaction costs of:
Performance
Return after charges (%)
Other information
Closing net asset value (€’000)
Closing number of shares
Operating charges
Direct transaction costs
Prices
Highest share price
Lowest share price
Share class B Accumulation (EUR share class) was launched on 26 October 2015.
101.53 86.07
0.19% 0.14%
120.18 104.05
1.54% 1.86%
1 1
1,050 1,050
13.18% 2.23%
115.70 102.23
0.21 0.14
0.77 -
13.47 2.23
(0.77) -
15.17 3.61
(1.70) (1.38)
102.23 100.00
Final 31 July 2017(c)
Final 31 July 2016(c)
30
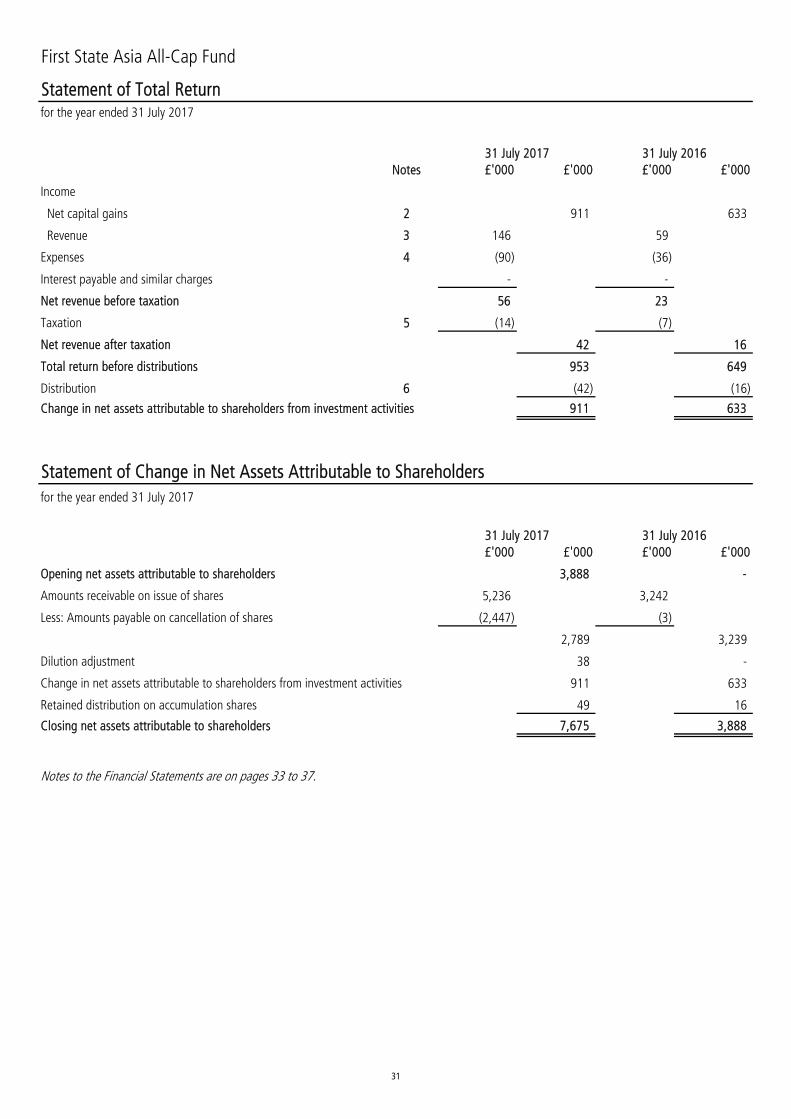
Notes £'000 £'000 £'000 £'000
Net capital gains 2 911 633
Revenue 3 146 59
4 (90) (36)
Interest payable and similar charges - -
56 23
5 (14) (7)
42 16
953 649
6 (42) (16)
911 633
£'000 £'000 £'000 £'000
3,888 -
5,236 3,242
(2,447) (3)
2,789 3,239
38 -
911 633
49 16
7,675 3,888
Less: Amounts payable on cancellation of shares
Dilution adjustment
Change in net assets attributable to shareholders from investment activities
Retained distribution on accumulation shares
Closing net assets attributable to shareholders
Notes to the Financial Statements are on pages 33 to 37.
Amounts receivable on issue of shares
for the year ended 31 July 2017
31 July 2017 31 July 2016
Opening net assets attributable to shareholders
Statement of Change in Net Assets Attributable to Shareholders
Income
Expenses
Net revenue before taxation
Taxation
Net revenue after taxation
Total return before distributions
Distribution
Change in net assets attributable to shareholders from investment activities
31 July 2017 31 July 2016
First State Asia All-Cap Fund
Statement of Total Returnfor the year ended 31 July 2017
31

First State Asia All-Cap Fund
31 July 2017 31 July 2016Notes £'000 £'000
Investments 7,696 3,890
Current assets
8 15 13
98 26
7,809 3,929
Creditors
Other creditors 9 (134) (41)
(134) (41)
7,675 3,888
Notes to the Financial Statements are on pages 33 to 37.
Total liabilities
Net assets attributable to shareholders
Balance Sheetas at 31 July 2017
Assets
Fixed assets
Debtors
Cash and bank balances
Total assets
Liabilities
32

1.
2.
31 July 2017 31 July 2016£'000 £'000
914 633(3) -
911 633
3.
31 July 2017 31 July 2016£'000 £'000
1 -140 54
5 5
146 59
4.
31 July 2017 31 July 2016£'000 £'000
77 30(33) (47)
44 (17)
1 2
1 91 -
43 42
45 51
90 36Total expenses
* The Audit fee for the year to 31 July 2017 is £8,447 net of VAT. The figure above includes an adjustment for the over accrual of the prioryears fee.
Audit fee*Safe custody chargesOther expenses
Other expenses:
ACD's periodic charge rebate
Payable to the Depositary, associates of the Depositary, and agents of either of them:Depositary's fees
Expenses
Payable to the ACD, associates of the ACD, and agents of either of them:ACD's periodic charge
Total revenue
Overseas scrip dividends
Overseas taxable revenueOverseas non-taxable revenue
Net capital gains
Revenue
Currency losses
Accounting basis and policies
Please see pages 9 to 11 for accounting basis and policies.
Net capital gains
The net capital gains during the year comprise:
Non-derivative securities
Notes to the Financial Statementsas at 31 July 2017
First State Asia All-Cap Fund
33
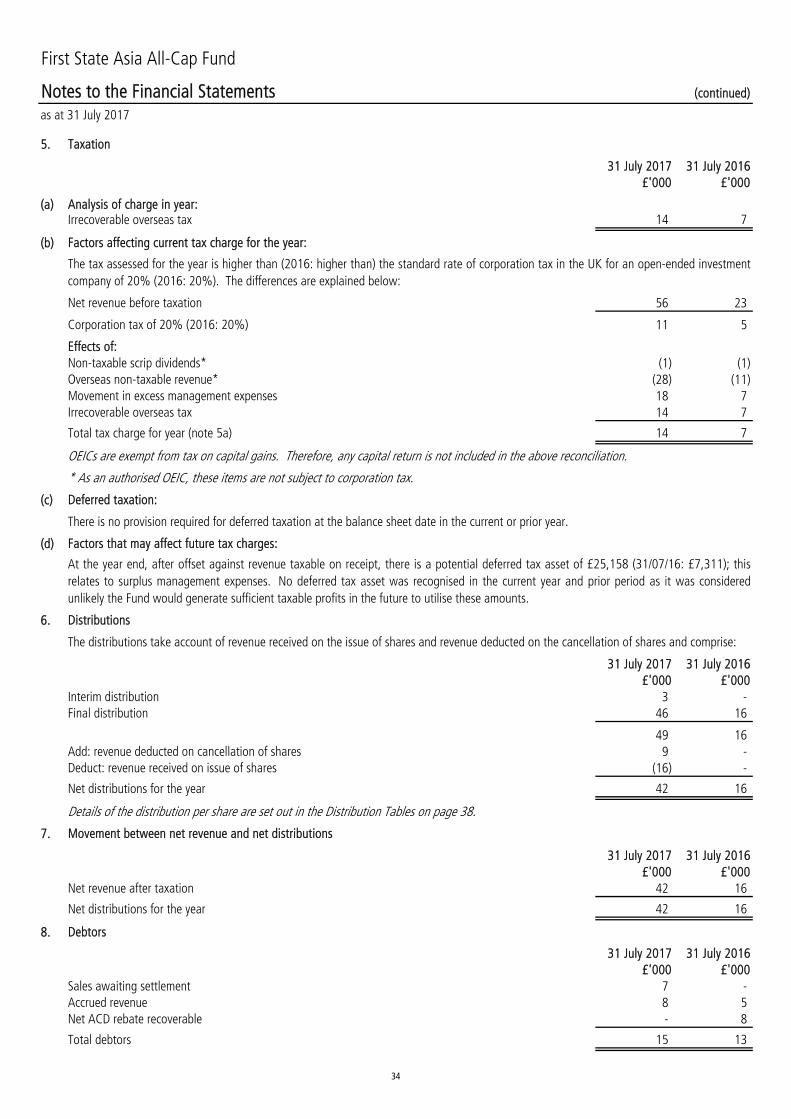
Notes to the Financial Statements (continued)
as at 31 July 2017
First State Asia All-Cap Fund
5.
31 July 2017 31 July 2016£'000 £'000
(a)14 7
(b)
56 23
11 5
(1) (1)(28) (11)18 714 7
14 7
(c)
(d)
6.
31 July 2017 31 July 2016£'000 £'000
3 -46 16
49 169 -
(16) -
42 16
7.
31 July 2017 31 July 2016£'000 £'000
42 16
42 16
8.
31 July 2017 31 July 2016£'000 £'000
7 -8 5- 8
15 13Total debtors
Accrued revenueNet ACD rebate recoverable
Debtors
Sales awaiting settlement
Net distributions for the year
Details of the distribution per share are set out in the Distribution Tables on page 38.
Movement between net revenue and net distributions
Net revenue after taxation
Add: revenue deducted on cancellation of sharesDeduct: revenue received on issue of shares
Net distributions for the year
Final distributionInterim distribution
Distributions
The distributions take account of revenue received on the issue of shares and revenue deducted on the cancellation of shares and comprise:
Factors that may affect future tax charges:
At the year end, after offset against revenue taxable on receipt, there is a potential deferred tax asset of £25,158 (31/07/16: £7,311); thisrelates to surplus management expenses. No deferred tax asset was recognised in the current year and prior period as it was consideredunlikely the Fund would generate sufficient taxable profits in the future to utilise these amounts.
Deferred taxation:
There is no provision required for deferred taxation at the balance sheet date in the current or prior year.
Total tax charge for year (note 5a)
OEICs are exempt from tax on capital gains. Therefore, any capital return is not included in the above reconciliation.
* As an authorised OEIC, these items are not subject to corporation tax.
Movement in excess management expensesIrrecoverable overseas tax
Non-taxable scrip dividends*Overseas non-taxable revenue*
Net revenue before taxation
Corporation tax of 20% (2016: 20%)
Effects of:
Factors affecting current tax charge for the year:
The tax assessed for the year is higher than (2016: higher than) the standard rate of corporation tax in the UK for an open-ended investmentcompany of 20% (2016: 20%). The differences are explained below:
Irrecoverable overseas taxAnalysis of charge in year:
Taxation
34
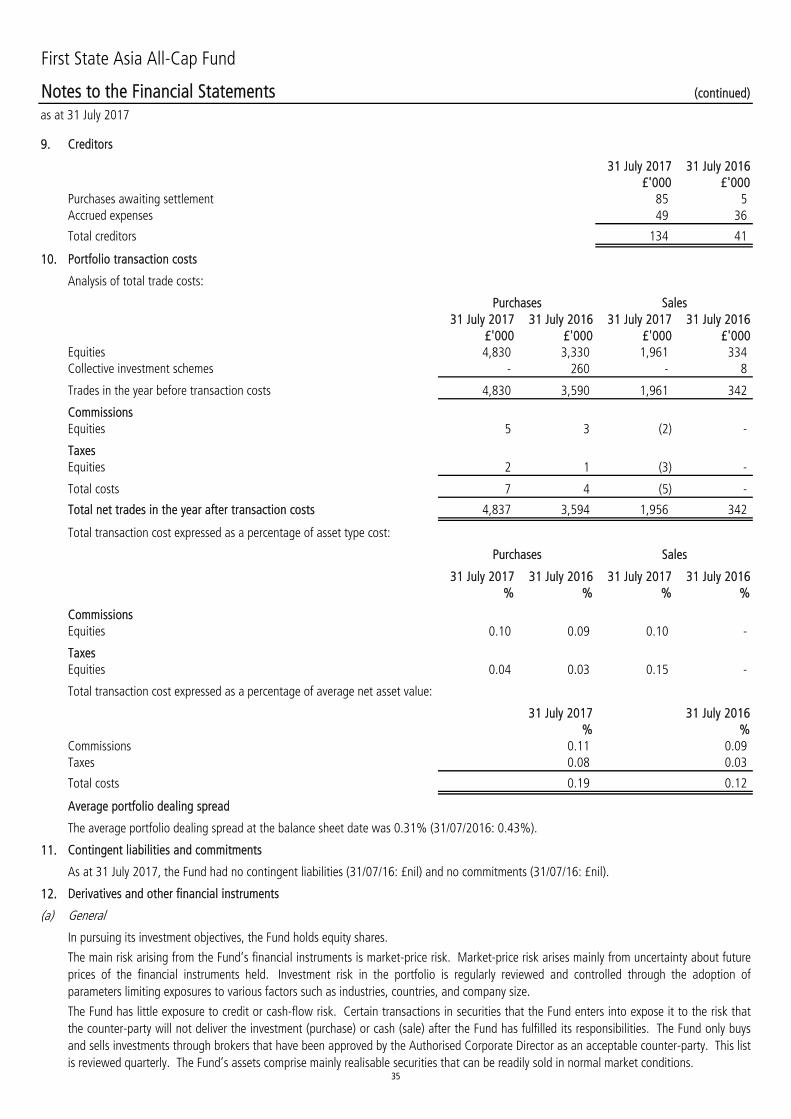
Notes to the Financial Statements (continued)
as at 31 July 2017
First State Asia All-Cap Fund
9.
31 July 2017 31 July 2016£'000 £'000
85 549 36
134 41
10.
31 July 2017 31 July 2016 31 July 2017 31 July 2016£'000 £'000 £'000 £'0004,830 3,330 1,961 334
- 260 - 8
4,830 3,590 1,961 342
5 3 (2) -
2 1 (3) -
7 4 (5) -
4,837 3,594 1,956 342
31 July 2017 31 July 2016 31 July 2017 31 July 2016% % % %
0.10 0.09 0.10 -
0.04 0.03 0.15 -
11.
12.
(a)
Derivatives and other financial instruments
General
In pursuing its investment objectives, the Fund holds equity shares.
The main risk arising from the Fund’s financial instruments is market-price risk. Market-price risk arises mainly from uncertainty about futureprices of the financial instruments held. Investment risk in the portfolio is regularly reviewed and controlled through the adoption ofparameters limiting exposures to various factors such as industries, countries, and company size.
The Fund has little exposure to credit or cash-flow risk. Certain transactions in securities that the Fund enters into expose it to the risk thatthe counter-party will not deliver the investment (purchase) or cash (sale) after the Fund has fulfilled its responsibilities. The Fund only buysand sells investments through brokers that have been approved by the Authorised Corporate Director as an acceptable counter-party. This listis reviewed quarterly. The Fund’s assets comprise mainly realisable securities that can be readily sold in normal market conditions.
Contingent liabilities and commitments
As at 31 July 2017, the Fund had no contingent liabilities (31/07/16: £nil) and no commitments (31/07/16: £nil).
The average portfolio dealing spread at the balance sheet date was 0.31% (31/07/2016: 0.43%).
Total costs 0.19 0.12
Average portfolio dealing spread
Commissions 0.11 0.09Taxes 0.08 0.03
Total transaction cost expressed as a percentage of average net asset value:
31 July 2017 31 July 2016% %
EquitiesTaxes
CommissionsEquities
Total transaction cost expressed as a percentage of asset type cost:
Purchases Sales
Total costs
Total net trades in the year after transaction costs
TaxesEquities
Trades in the year before transaction costs
CommissionsEquities
Collective investment schemes
Analysis of total trade costs:
Purchases Sales
Equities
Total creditors
Portfolio transaction costs
Purchases awaiting settlementAccrued expenses
Creditors
35
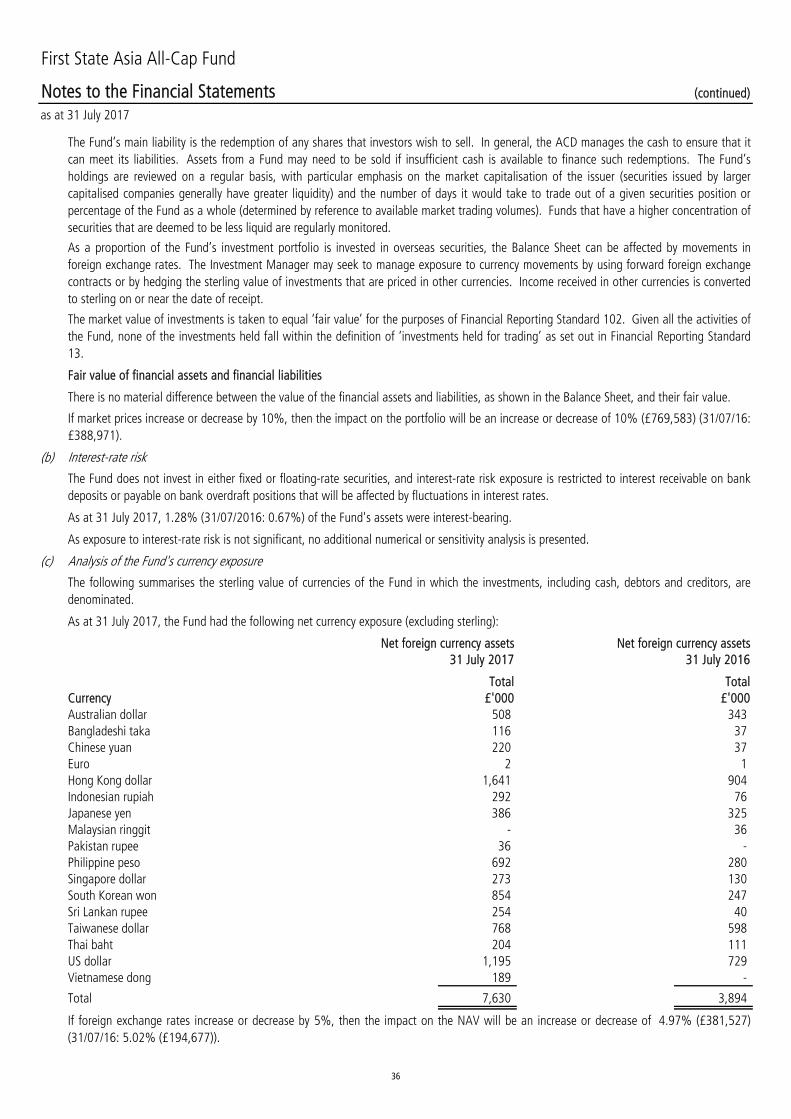
Notes to the Financial Statements (continued)
as at 31 July 2017
First State Asia All-Cap Fund
(b)
(c)
Total TotalCurrency £'000 £'000Australian dollar 508 343Bangladeshi taka 116 37Chinese yuan 220 37Euro 2 1Hong Kong dollar 1,641 904Indonesian rupiah 292 76Japanese yen 386 325Malaysian ringgit - 36Pakistan rupee 36 -Philippine peso 692 280Singapore dollar 273 130South Korean won 854 247Sri Lankan rupee 254 40Taiwanese dollar 768 598Thai baht 204 111US dollar 1,195 729Vietnamese dong 189 -
Total 7,630 3,894
If foreign exchange rates increase or decrease by 5%, then the impact on the NAV will be an increase or decrease of 4.97% (£381,527)(31/07/16: 5.02% (£194,677)).
The following summarises the sterling value of currencies of the Fund in which the investments, including cash, debtors and creditors, aredenominated.
As at 31 July 2017, the Fund had the following net currency exposure (excluding sterling):
Net foreign currency assets Net foreign currency assets31 July 2017 31 July 2016
As at 31 July 2017, 1.28% (31/07/2016: 0.67%) of the Fund's assets were interest-bearing.
As exposure to interest-rate risk is not significant, no additional numerical or sensitivity analysis is presented.
Analysis of the Fund's currency exposure
There is no material difference between the value of the financial assets and liabilities, as shown in the Balance Sheet, and their fair value.
If market prices increase or decrease by 10%, then the impact on the portfolio will be an increase or decrease of 10% (£769,583) (31/07/16:£388,971).
Interest-rate risk
The Fund does not invest in either fixed or floating-rate securities, and interest-rate risk exposure is restricted to interest receivable on bankdeposits or payable on bank overdraft positions that will be affected by fluctuations in interest rates.
The Fund’s main liability is the redemption of any shares that investors wish to sell. In general, the ACD manages the cash to ensure that itcan meet its liabilities. Assets from a Fund may need to be sold if insufficient cash is available to finance such redemptions. The Fund’sholdings are reviewed on a regular basis, with particular emphasis on the market capitalisation of the issuer (securities issued by largercapitalised companies generally have greater liquidity) and the number of days it would take to trade out of a given securities position orpercentage of the Fund as a whole (determined by reference to available market trading volumes). Funds that have a higher concentration ofsecurities that are deemed to be less liquid are regularly monitored.
As a proportion of the Fund’s investment portfolio is invested in overseas securities, the Balance Sheet can be affected by movements inforeign exchange rates. The Investment Manager may seek to manage exposure to currency movements by using forward foreign exchangecontracts or by hedging the sterling value of investments that are priced in other currencies. Income received in other currencies is convertedto sterling on or near the date of receipt.
The market value of investments is taken to equal ‘fair value’ for the purposes of Financial Reporting Standard 102. Given all the activities ofthe Fund, none of the investments held fall within the definition of ‘investments held for trading’ as set out in Financial Reporting Standard13.
Fair value of financial assets and financial liabilities
36
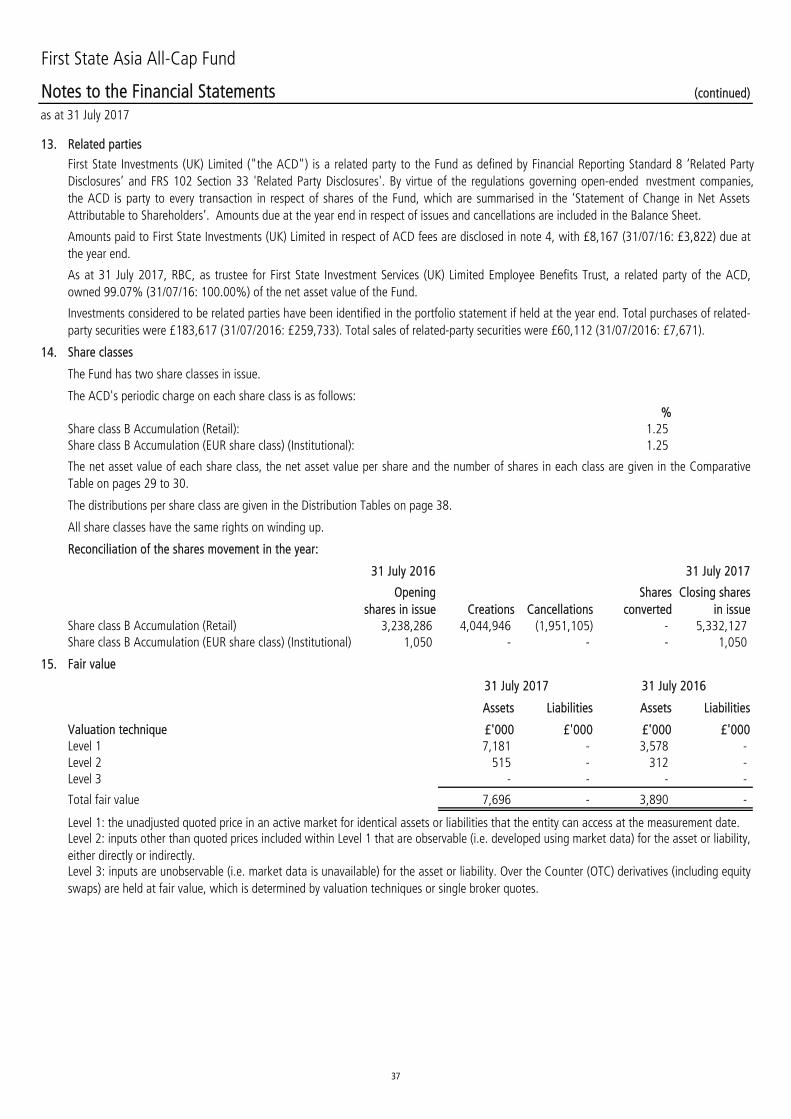
Notes to the Financial Statements (continued)
as at 31 July 2017
First State Asia All-Cap Fund
13.
14.
%Share class B Accumulation (Retail): 1.25Share class B Accumulation (EUR share class) (Institutional): 1.25
31 July 2016 31 July 2017
Opening shares in issue Creations Cancellations
Shares converted
Closing shares in issue
3,238,286 4,044,946 (1,951,105) - 5,332,1271,050 - - - 1,050
15.
Assets Liabilities Assets Liabilities
£'000 £'000 £'000 £'0007,181 - 3,578 -
515 - 312 -- - - -
7,696 - 3,890 -
Level 3: inputs are unobservable (i.e. market data is unavailable) for the asset or liability. Over the Counter (OTC) derivatives (including equityswaps) are held at fair value, which is determined by valuation techniques or single broker quotes.
Level 1Level 2Level 3
Total fair value
Level 1: the unadjusted quoted price in an active market for identical assets or liabilities that the entity can access at the measurement date. Level 2: inputs other than quoted prices included within Level 1 that are observable (i.e. developed using market data) for the asset or liability,either directly or indirectly.
Fair value
Valuation technique
31 July 2017 31 July 2016
All share classes have the same rights on winding up.
Reconciliation of the shares movement in the year:
Share class B Accumulation (Retail)Share class B Accumulation (EUR share class) (Institutional)
The net asset value of each share class, the net asset value per share and the number of shares in each class are given in the ComparativeTable on pages 29 to 30.
The distributions per share class are given in the Distribution Tables on page 38.
The ACD's periodic charge on each share class is as follows:
Investments considered to be related parties have been identified in the portfolio statement if held at the year end. Total purchases of related-party securities were £183,617 (31/07/2016: £259,733). Total sales of related-party securities were £60,112 (31/07/2016: £7,671).
Share classes
The Fund has two share classes in issue.
Amounts paid to First State Investments (UK) Limited in respect of ACD fees are disclosed in note 4, with £8,167 (31/07/16: £3,822) due atthe year end.
As at 31 July 2017, RBC, as trustee for First State Investment Services (UK) Limited Employee Benefits Trust, a related party of the ACD,owned 99.07% (31/07/16: 100.00%) of the net asset value of the Fund.
Related parties
First State Investments (UK) Limited ("the ACD") is a related party to the Fund as defined by Financial Reporting Standard 8 ‘Related Party Disclosures’ and FRS 102 Section 33 'Related Party Disclosures'. By virtue of the regulations governing open-ended investment companies, the ACD is party to every transaction in respect of shares of the Fund, which are summarised in the ‘Statement of Change in Net Assets Attributable to Shareholders’. Amounts due at the year end in respect of issues and cancellations are included in the Balance Sheet.
37
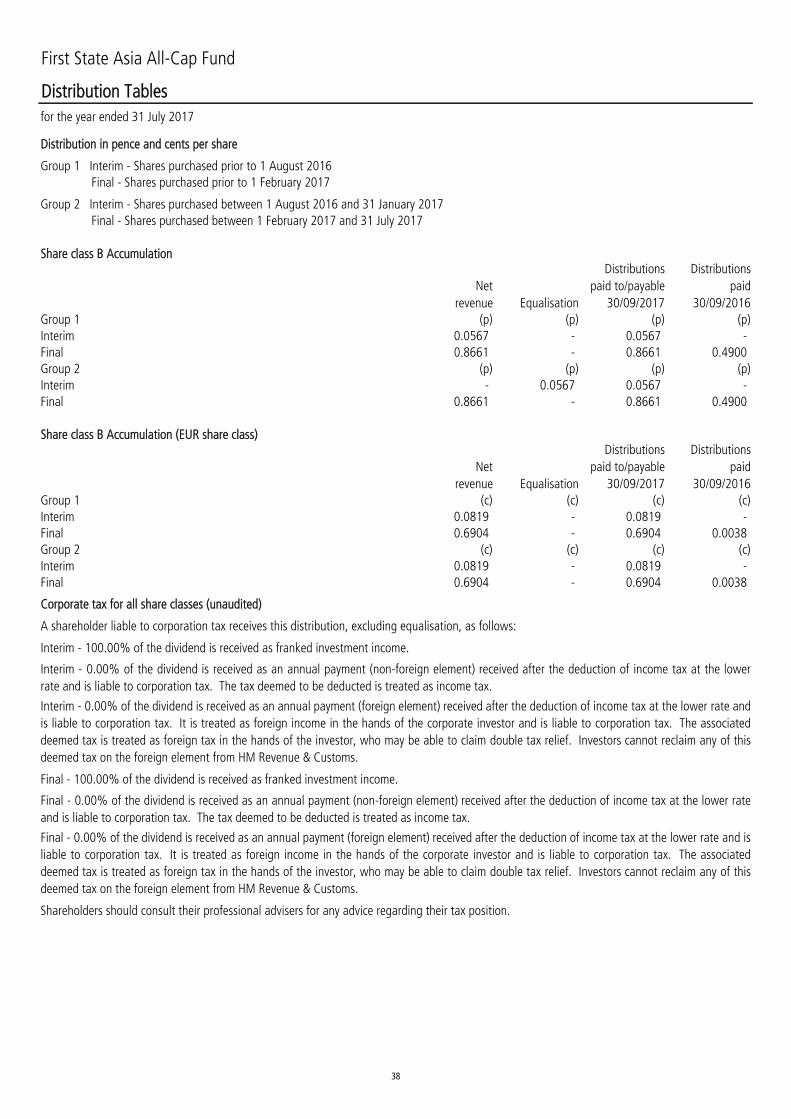
Share class B Accumulation
Netrevenue Equalisation
Distributions paid to/payable
30/09/2017
Distributions paid
30/09/2016Group 1 (p) (p) (p) (p)Interim 0.0567 - 0.0567 -Final 0.8661 - 0.8661 0.4900Group 2 (p) (p) (p) (p)Interim - 0.0567 0.0567 -Final 0.8661 - 0.8661 0.4900
Share class B Accumulation (EUR share class)
Netrevenue Equalisation
Distributions paid to/payable
30/09/2017
Distributions paid
30/09/2016Group 1 (c) (c) (c) (c)Interim 0.0819 - 0.0819 -Final 0.6904 - 0.6904 0.0038Group 2 (c) (c) (c) (c)Interim 0.0819 - 0.0819 -Final 0.6904 - 0.6904 0.0038
Shareholders should consult their professional advisers for any advice regarding their tax position.
Final - 100.00% of the dividend is received as franked investment income.
Final - 0.00% of the dividend is received as an annual payment (non-foreign element) received after the deduction of income tax at the lower rateand is liable to corporation tax. The tax deemed to be deducted is treated as income tax.
Final - 0.00% of the dividend is received as an annual payment (foreign element) received after the deduction of income tax at the lower rate and isliable to corporation tax. It is treated as foreign income in the hands of the corporate investor and is liable to corporation tax. The associateddeemed tax is treated as foreign tax in the hands of the investor, who may be able to claim double tax relief. Investors cannot reclaim any of thisdeemed tax on the foreign element from HM Revenue & Customs.
Interim - 100.00% of the dividend is received as franked investment income.
Interim - 0.00% of the dividend is received as an annual payment (non-foreign element) received after the deduction of income tax at the lowerrate and is liable to corporation tax. The tax deemed to be deducted is treated as income tax.
Interim - 0.00% of the dividend is received as an annual payment (foreign element) received after the deduction of income tax at the lower rate andis liable to corporation tax. It is treated as foreign income in the hands of the corporate investor and is liable to corporation tax. The associateddeemed tax is treated as foreign tax in the hands of the investor, who may be able to claim double tax relief. Investors cannot reclaim any of thisdeemed tax on the foreign element from HM Revenue & Customs.
Corporate tax for all share classes (unaudited)
A shareholder liable to corporation tax receives this distribution, excluding equalisation, as follows:
Final - Shares purchased between 1 February 2017 and 31 July 2017Group 2 Interim - Shares purchased between 1 August 2016 and 31 January 2017
Final - Shares purchased prior to 1 February 2017
Distribution in pence and cents per share
First State Asia All-Cap Fund
Distribution Tablesfor the year ended 31 July 2017
Group 1 Interim - Shares purchased prior to 1 August 2016
38
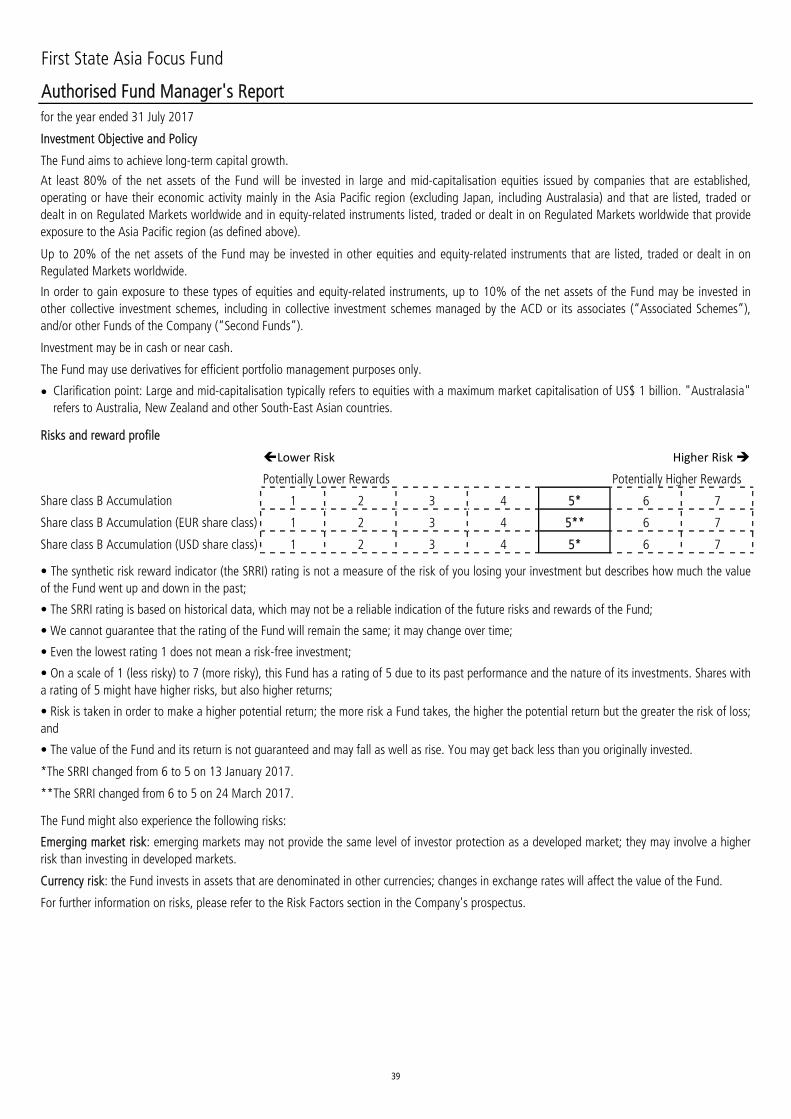
•
Risks and reward profile
Lower Risk Higher Risk
Potentially Lower Rewards Potentially Higher Rewards
1 2 3 4 5* 6 7
1 2 3 4 5** 6 7
1 2 3 4 5* 6 7
First State Asia Focus Fund
Authorised Fund Manager's Reportfor the year ended 31 July 2017
Investment Objective and Policy
Clarification point: Large and mid-capitalisation typically refers to equities with a maximum market capitalisation of US$ 1 billion. "Australasia"refers to Australia, New Zealand and other South-East Asian countries.
In order to gain exposure to these types of equities and equity-related instruments, up to 10% of the net assets of the Fund may be invested inother collective investment schemes, including in collective investment schemes managed by the ACD or its associates (“Associated Schemes”),and/or other Funds of the Company (“Second Funds”).
Investment may be in cash or near cash.
The Fund aims to achieve long-term capital growth.
At least 80% of the net assets of the Fund will be invested in large and mid-capitalisation equities issued by companies that are established,operating or have their economic activity mainly in the Asia Pacific region (excluding Japan, including Australasia) and that are listed, traded ordealt in on Regulated Markets worldwide and in equity-related instruments listed, traded or dealt in on Regulated Markets worldwide that provideexposure to the Asia Pacific region (as defined above).
Up to 20% of the net assets of the Fund may be invested in other equities and equity-related instruments that are listed, traded or dealt in onRegulated Markets worldwide.
The Fund may use derivatives for efficient portfolio management purposes only.
Share class B Accumulation
Share class B Accumulation (EUR share class)
Share class B Accumulation (USD share class)
• Even the lowest rating 1 does not mean a risk-free investment;
• On a scale of 1 (less risky) to 7 (more risky), this Fund has a rating of 5 due to its past performance and the nature of its investments. Shares witha rating of 5 might have higher risks, but also higher returns;
• Risk is taken in order to make a higher potential return; the more risk a Fund takes, the higher the potential return but the greater the risk of loss;and
• The value of the Fund and its return is not guaranteed and may fall as well as rise. You may get back less than you originally invested.
The Fund might also experience the following risks:
• The synthetic risk reward indicator (the SRRI) rating is not a measure of the risk of you losing your investment but describes how much the valueof the Fund went up and down in the past;
• The SRRI rating is based on historical data, which may not be a reliable indication of the future risks and rewards of the Fund;
• We cannot guarantee that the rating of the Fund will remain the same; it may change over time;
*The SRRI changed from 6 to 5 on 13 January 2017.
**The SRRI changed from 6 to 5 on 24 March 2017.
Emerging market risk: emerging markets may not provide the same level of investor protection as a developed market; they may involve a higherrisk than investing in developed markets.
Currency risk: the Fund invests in assets that are denominated in other currencies; changes in exchange rates will affect the value of the Fund.
For further information on risks, please refer to the Risk Factors section in the Company's prospectus.
39
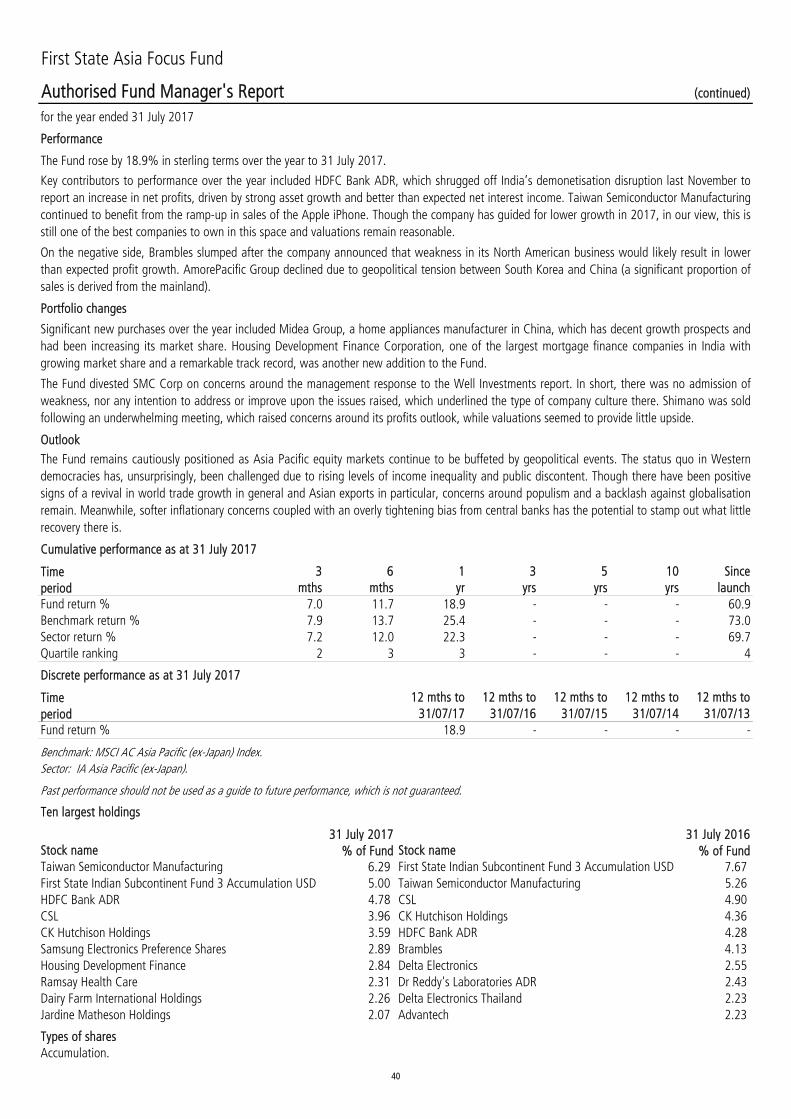
(continued)
First State Asia Focus Fund
Authorised Fund Manager's Reportfor the year ended 31 July 2017
Time 3 6 1 3 5 10 Sinceperiod mths mths yr yrs yrs yrs launch
7.0 11.7 18.9 - - - 60.9 7.9 13.7 25.4 - - - 73.0 7.2 12.0 22.3 - - - 69.7
2 3 3 - - - 4
12 mths to 12 mths to 12 mths to 12 mths to 12 mths to31/07/17 31/07/16 31/07/15 31/07/14 31/07/13
18.9 - - - -
31 July 2017 31 July 2016% of Fund % of Fund
6.29 7.67First State Indian Subcontinent Fund 3 Accumulation USD 5.00 Taiwan Semiconductor Manufacturing 5.26HDFC Bank ADR 4.78 CSL 4.90CSL 3.96 CK Hutchison Holdings 4.36CK Hutchison Holdings 3.59 HDFC Bank ADR 4.28Samsung Electronics Preference Shares 2.89 Brambles 4.13Housing Development Finance 2.84 Delta Electronics 2.55Ramsay Health Care 2.31 Dr Reddy's Laboratories ADR 2.43Dairy Farm International Holdings 2.26 Delta Electronics Thailand 2.23Jardine Matheson Holdings 2.07 Advantech 2.23
Performance
The Fund rose by 18.9% in sterling terms over the year to 31 July 2017.
Key contributors to performance over the year included HDFC Bank ADR, which shrugged off India’s demonetisation disruption last November toreport an increase in net profits, driven by strong asset growth and better than expected net interest income. Taiwan Semiconductor Manufacturingcontinued to benefit from the ramp-up in sales of the Apple iPhone. Though the company has guided for lower growth in 2017, in our view, this isstill one of the best companies to own in this space and valuations remain reasonable.
On the negative side, Brambles slumped after the company announced that weakness in its North American business would likely result in lowerthan expected profit growth. AmorePacific Group declined due to geopolitical tension between South Korea and China (a significant proportion ofsales is derived from the mainland).
Portfolio changes
Significant new purchases over the year included Midea Group, a home appliances manufacturer in China, which has decent growth prospects andhad been increasing its market share. Housing Development Finance Corporation, one of the largest mortgage finance companies in India withgrowing market share and a remarkable track record, was another new addition to the Fund.
The Fund divested SMC Corp on concerns around the management response to the Well Investments report. In short, there was no admission ofweakness, nor any intention to address or improve upon the issues raised, which underlined the type of company culture there. Shimano was soldfollowing an underwhelming meeting, which raised concerns around its profits outlook, while valuations seemed to provide little upside.
Outlook
The Fund remains cautiously positioned as Asia Pacific equity markets continue to be buffeted by geopolitical events. The status quo in Westerndemocracies has, unsurprisingly, been challenged due to rising levels of income inequality and public discontent. Though there have been positivesigns of a revival in world trade growth in general and Asian exports in particular, concerns around populism and a backlash against globalisationremain. Meanwhile, softer inflationary concerns coupled with an overly tightening bias from central banks has the potential to stamp out what littlerecovery there is.
Benchmark return %Sector return %Quartile ranking
Discrete performance as at 31 July 2017
Cumulative performance as at 31 July 2017
Fund return %
Past performance should not be used as a guide to future performance, which is not guaranteed.
Ten largest holdings
TimeperiodFund return %
Benchmark: MSCI AC Asia Pacific (ex-Japan) Index.Sector: IA Asia Pacific (ex-Japan).
Types of sharesAccumulation.
Stock name Stock nameTaiwan Semiconductor Manufacturing First State Indian Subcontinent Fund 3 Accumulation USD
40
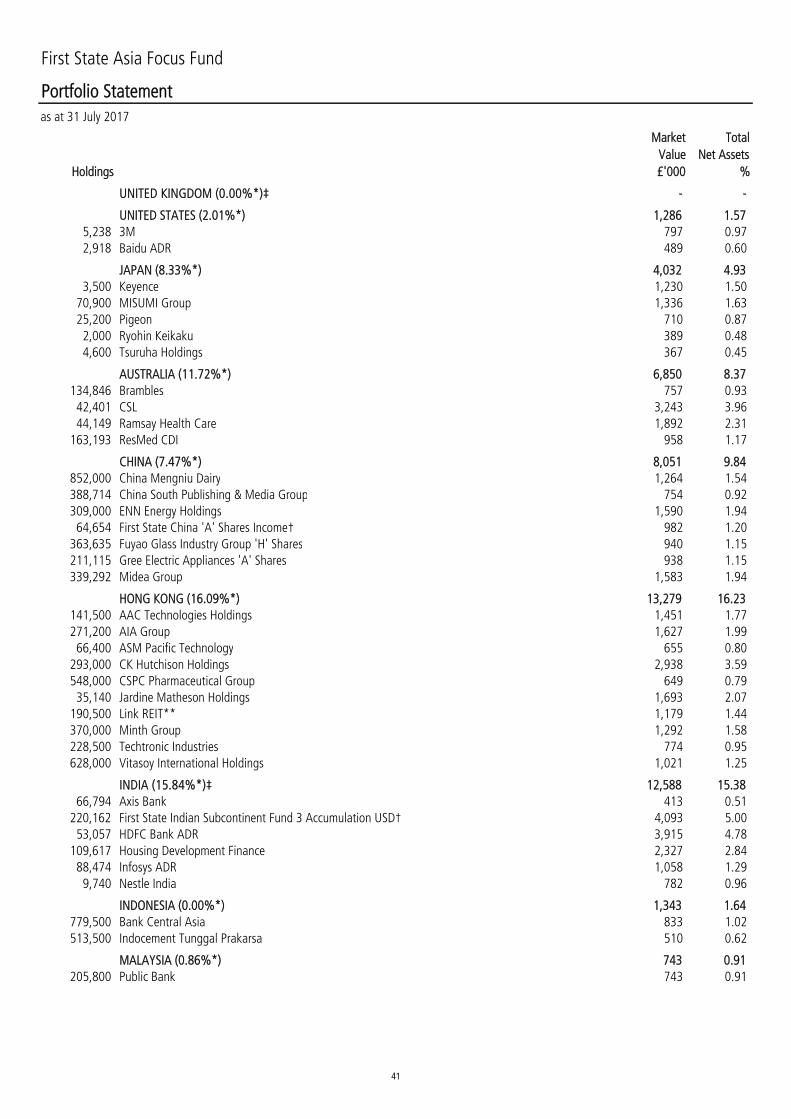
Holdings
MarketValue£'000
TotalNet Assets
%
UNITED KINGDOM (0.00%*)‡ - -
UNITED STATES (2.01%*) 1,286 1.575,238 3M 797 0.972,918 Baidu ADR 489 0.60
JAPAN (8.33%*) 4,032 4.933,500 Keyence 1,230 1.50
70,900 MISUMI Group 1,336 1.6325,200 Pigeon 710 0.87
2,000 Ryohin Keikaku 389 0.484,600 Tsuruha Holdings 367 0.45
AUSTRALIA (11.72%*) 6,850 8.37134,846 Brambles 757 0.93
42,401 CSL 3,243 3.9644,149 Ramsay Health Care 1,892 2.31
163,193 ResMed CDI 958 1.17
CHINA (7.47%*) 8,051 9.84852,000 China Mengniu Dairy 1,264 1.54388,714 China South Publishing & Media Group 754 0.92309,000 ENN Energy Holdings 1,590 1.94
64,654 First State China 'A' Shares Income† 982 1.20363,635 Fuyao Glass Industry Group 'H' Shares 940 1.15211,115 Gree Electric Appliances 'A' Shares 938 1.15339,292 Midea Group 1,583 1.94
HONG KONG (16.09%*) 13,279 16.23141,500 AAC Technologies Holdings 1,451 1.77271,200 AIA Group 1,627 1.99
66,400 ASM Pacific Technology 655 0.80293,000 CK Hutchison Holdings 2,938 3.59548,000 CSPC Pharmaceutical Group 649 0.79
35,140 Jardine Matheson Holdings 1,693 2.07190,500 Link REIT** 1,179 1.44370,000 Minth Group 1,292 1.58228,500 Techtronic Industries 774 0.95628,000 Vitasoy International Holdings 1,021 1.25
INDIA (15.84%*)‡ 12,588 15.3866,794 Axis Bank 413 0.51
220,162 First State Indian Subcontinent Fund 3 Accumulation USD† 4,093 5.0053,057 HDFC Bank ADR 3,915 4.78
109,617 Housing Development Finance 2,327 2.8488,474 Infosys ADR 1,058 1.29
9,740 Nestle India 782 0.96
INDONESIA (0.00%*) 1,343 1.64779,500 Bank Central Asia 833 1.02513,500 Indocement Tunggal Prakarsa 510 0.62
MALAYSIA (0.86%*) 743 0.91205,800 Public Bank 743 0.91
First State Asia Focus Fund
Portfolio Statementas at 31 July 2017
41

Holdings
MarketValue£'000
TotalNet Assets
%
First State Asia Focus Fund
Portfolio Statement (continued)
as at 31 July 2017
PHILIPPINES (4.92%*) 5,607 6.85560,070 BDO Unibank 1,050 1.28
3,914,100 DMCI Holdings 952 1.162,880,400 Manila Water 1,392 1.70
86,835 SM Investments 1,055 1.29482,390 Universal Robina 1,158 1.42
SINGAPORE (7.18%*) 5,455 6.67301,500 Dairy Farm International Holdings 1,847 2.26101,012 DBS Group Holdings 1,225 1.50243,589 Oversea-Chinese Banking 1,554 1.90371,800 Singapore Telecom 829 1.01
SOUTH KOREA (5.84%*) 7,594 9.289,341 AMOREPACIFIC Group 769 0.94
83,463 Hanon Systems 580 0.7114,240 LG 730 0.89
3,188 LG Chem 711 0.872,412 LG Household & Health Care 1,626 1.991,489 NAVER 814 0.991,799 Samsung Electronics Preference Shares 2,364 2.89
TAIWAN (13.84%*) 10,023 12.25244,191 Advantech 1,402 1.71373,589 Delta Electronics 1,508 1.84125,000 President Chain Store 808 0.99953,000 Taiwan Semiconductor Manufacturing 5,146 6.29796,000 Uni-President Enterprises 1,159 1.42
THAILAND (3.62%*) 2,261 2.76511,300 Delta Electronics Thailand 1,033 1.26270,900 Kasikornbank 1,228 1.50
VIETNAM (0.00%*) 1,192 1.46735,830 FPT 1,192 1.46
Portfolio of investments 80,304 98.14
Net other assets 1,518 1.86
Total net assets 81,822 100.00
‡ Since the previous report, the Country Sector Classification headings have been updated by data providers. The current holdings and comparativeholdings have been restated as appropriate.
† This investment is a related party (see note 12).
Stocks shown as ADRs represent American Depositary Receipts.Stocks shown as CDIs represent Chess Depositary Interests.
All investments held are listed, unless otherwise stated.
* Comparative figures shown in brackets relate to 31 July 2016.** Real estate investment trust (REIT).
For the purposes of the portfolio holdings analysis, securities are shown based on their country of listing.
42

Share class B Accumulation
Change in net assets per share
Opening net asset value per share
Return before operating charges*
Operating charges
Return after operating charges*
Distributions
Retained distributions on accumulation shares
Closing net asset value per share (p)
* after direct transaction costs of:
Performance
Return after charges (%)
Other information
Closing net asset value (£’000)
Closing number of shares
Operating charges
Direct transaction costs
Prices
Highest share price
Lowest share price
Share class B Accumulation was launched on 24 August 2015.
133.23 99.66
0.12% 0.12%
163.30 136.40
1.04% 1.04%
35,224 16,687
21,918,144 12,341,311
18.86% 35.21%
160.71 135.21
0.18 0.13
1.60 0.81
25.50 35.21
(1.60) (0.81)
27.04 36.32
(1.54) (1.11)
135.21 100.00
First State Asia Focus Fund
Comparative Tablefor the year ended 31 July 2017
Net Asset Value and Ongoing Charges Figure
Final 31 July 2017(p)
Final 31 July 2016(p)
43

First State Asia Focus Fund
Comparative Table (continued)
for the year ended 31 July 2017
Net Asset Value and Ongoing Charges Figure
Share class B Accumulation (EUR share class)
Change in net assets per share
Opening net asset value per share
Return before operating charges*
Operating charges
Return after operating charges*
Distributions
Retained distributions on accumulation shares
Closing net asset value per share (c)
* after direct transaction costs of:
Performance
Return after charges (%)
Other information
Closing net asset value (€’000)
Closing number of shares
Operating charges
Direct transaction costs
Prices
Highest share price
Lowest share price
Share class B Accumulation (EUR share class) was launched on 24 August 2015.
115.84 97.20
0.12% 0.12%
135.90 119.24
0.97% 0.97%
50,856 49,514
38,643,504 42,211,296
12.19% 17.30%
131.60 117.30
0.15 0.13
1.41 0.72
14.30 17.30
(1.41) (0.72)
15.51 18.28
(1.21) (0.98)
117.30 100.00
Final 31 July 2017(c)
Final 31 July 2016(c)
44

First State Asia Focus Fund
Comparative Table (continued)
for the year ended 31 July 2017
Net Asset Value and Ongoing Charges Figure
Share class B Accumulation (USD share class)
Change in net assets per share
Opening net asset value per share
Return before operating charges*
Operating charges
Return after operating charges*
Distributions
Retained distributions on accumulation shares
Closing net asset value per share (c)
* after direct transaction costs of:
Performance
Return after charges (%)
Other information
Closing net asset value ($’000)
Closing number of shares
Operating charges
Direct transaction costs
Prices
Highest share price
Lowest share price
Share class B Accumulation (USD share class) was launched on 24 August 2015.
106.90 93.65
0.12% 0.12%
135.02 114.34
0.95% 0.94%
1,489 311
1,108,231 273,656
18.46% 13.45%
134.39 113.45
0.15 0.13
1.42 0.77
20.94 13.45
(1.42) (0.77)
22.08 14.39
(1.14) (0.94)
113.45 100.00
Final 31 July 2017(c)
Final 31 July 2016(c)
45
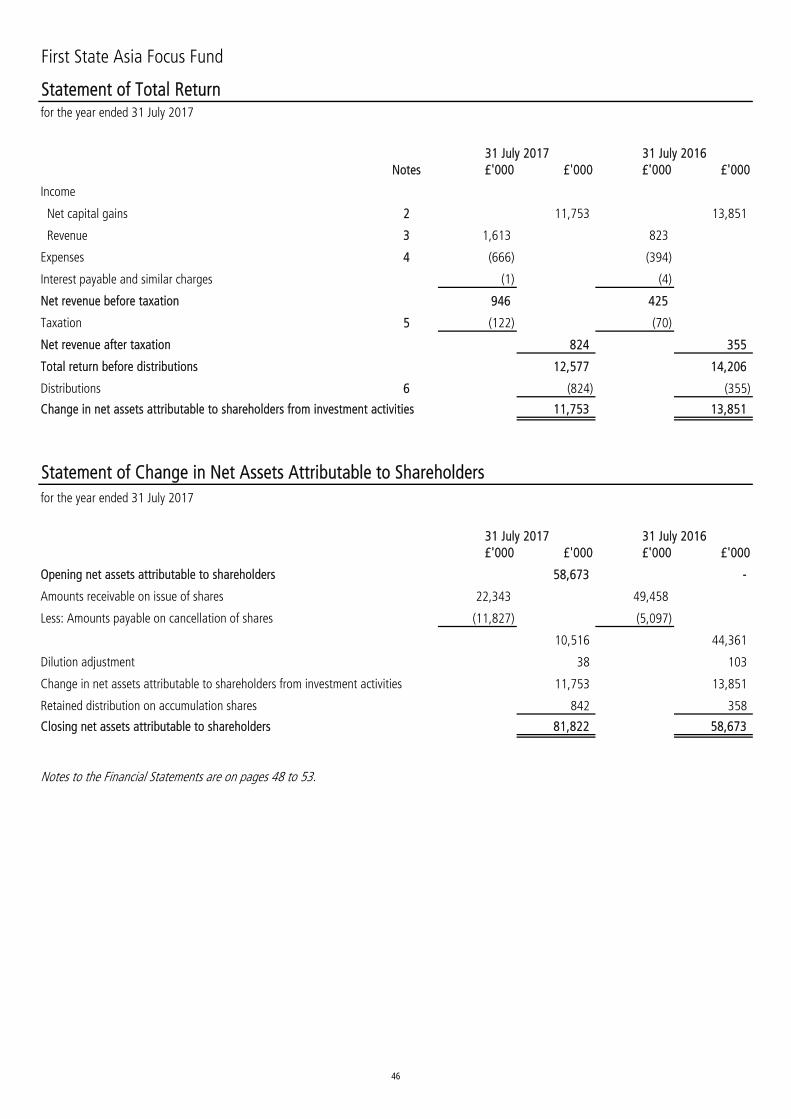
Notes £'000 £'000 £'000 £'000
Net capital gains 2 11,753 13,851
Revenue 3 1,613 823
4 (666) (394)
Interest payable and similar charges (1) (4)
946 425
5 (122) (70)
824 355
12,577 14,206
6 (824) (355)
11,753 13,851
£'000 £'000 £'000 £'000
58,673 -
22,343 49,458
(11,827) (5,097)
10,516 44,361
38 103
11,753 13,851
842 358
81,822 58,673
Less: Amounts payable on cancellation of shares
Dilution adjustment
Change in net assets attributable to shareholders from investment activities
Retained distribution on accumulation shares
Closing net assets attributable to shareholders
Notes to the Financial Statements are on pages 48 to 53.
Amounts receivable on issue of shares
for the year ended 31 July 2017
31 July 2017 31 July 2016
Opening net assets attributable to shareholders
Statement of Change in Net Assets Attributable to Shareholders
Income
Expenses
Net revenue before taxation
Taxation
Net revenue after taxation
Total return before distributions
Distributions
Change in net assets attributable to shareholders from investment activities
31 July 2017 31 July 2016
First State Asia Focus Fund
Statement of Total Returnfor the year ended 31 July 2017
46

First State Asia Focus Fund
31 July 2017 31 July 2016Notes £'000 £'000
Investments 80,304 57,336
Current assets
8 1,661 124
1,812 1,285
83,777 58,745
Creditors
Other creditors 9 (1,955) (72)
(1,955) (72)
81,822 58,673
Notes to the Financial Statements are on pages 48 to 53.
Total liabilities
Net assets attributable to shareholders
Balance Sheetas at 31 July 2017
Assets
Fixed assets
Debtors
Cash and bank balances
Total assets
Liabilities
47
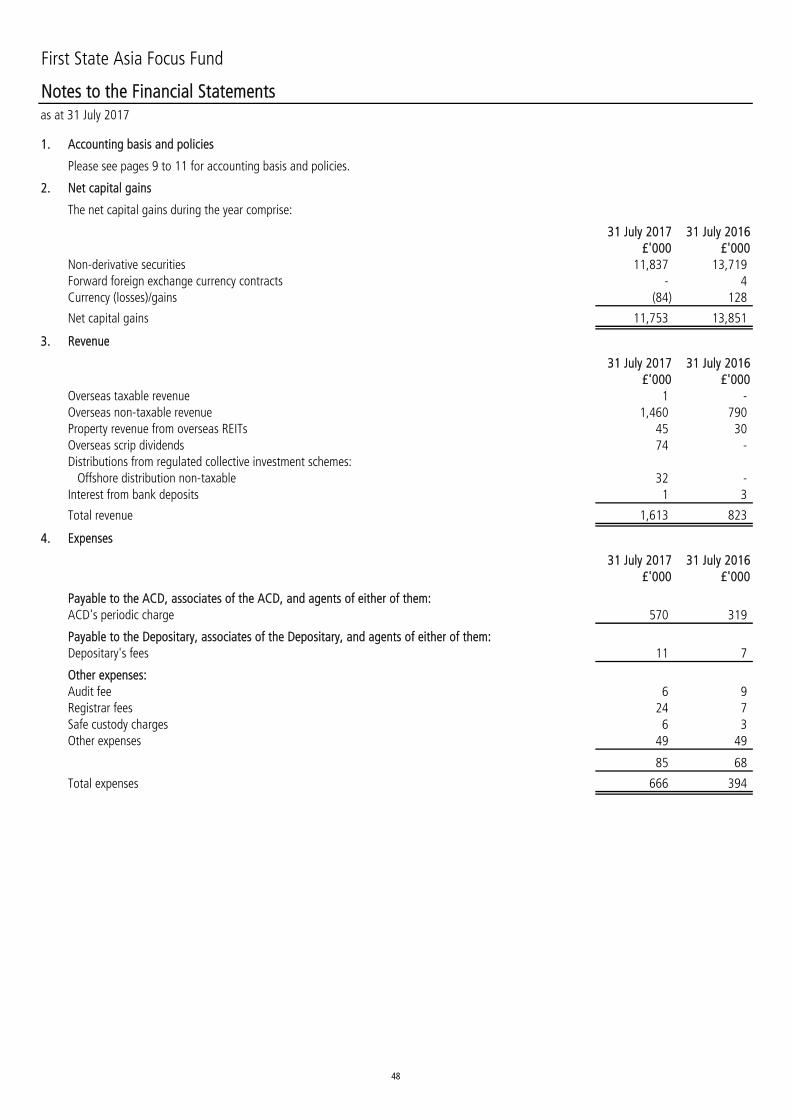
1.
2.
31 July 2017 31 July 2016£'000 £'000
11,837 13,719- 4
(84) 128
11,753 13,851
3.
31 July 2017 31 July 2016£'000 £'000
1 -1,460 790
45 3074 -
32 -1 3
1,613 823
4.
31 July 2017 31 July 2016£'000 £'000
570 319
11 7
6 924 7
6 349 49
85 68
666 394Total expenses
Audit feeRegistrar feesSafe custody chargesOther expenses
Other expenses:
Payable to the Depositary, associates of the Depositary, and agents of either of them:Depositary's fees
Expenses
Payable to the ACD, associates of the ACD, and agents of either of them:ACD's periodic charge
Total revenue
Interest from bank deposits Offshore distribution non-taxable
Property revenue from overseas REITsOverseas scrip dividendsDistributions from regulated collective investment schemes:
Overseas taxable revenueOverseas non-taxable revenue
Net capital gains
Revenue
Forward foreign exchange currency contractsCurrency (losses)/gains
Accounting basis and policies
Please see pages 9 to 11 for accounting basis and policies.
Net capital gains
The net capital gains during the year comprise:
Non-derivative securities
Notes to the Financial Statementsas at 31 July 2017
First State Asia Focus Fund
48
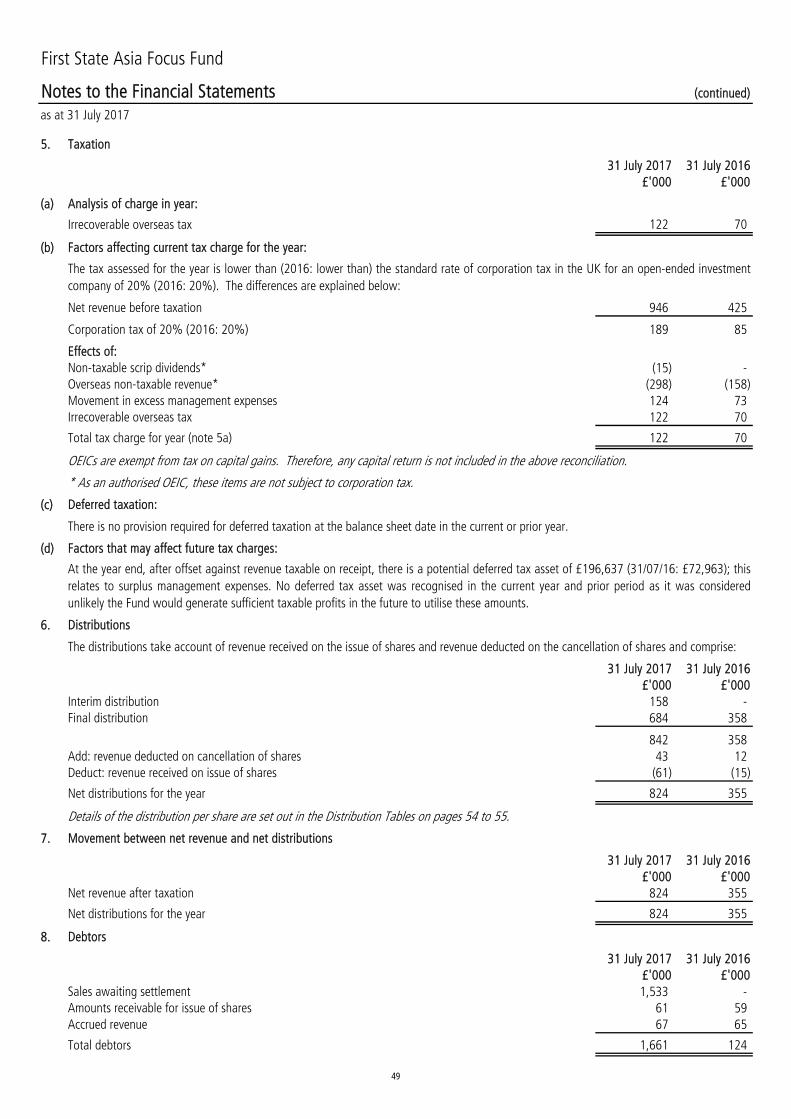
Notes to the Financial Statements (continued)
as at 31 July 2017
First State Asia Focus Fund
5.
31 July 2017 31 July 2016£'000 £'000
(a)
122 70
(b)
946 425
189 85
(15) -(298) (158)124 73122 70
122 70
(c)
(d)
6.
31 July 2017 31 July 2016£'000 £'000
158 -684 358
842 35843 12
(61) (15)
824 355
7.
31 July 2017 31 July 2016£'000 £'000
824 355
824 355
8.
31 July 2017 31 July 2016£'000 £'0001,533 -
61 5967 65
1,661 124Total debtors
Amounts receivable for issue of sharesAccrued revenue
Debtors
Sales awaiting settlement
Net distributions for the year
Details of the distribution per share are set out in the Distribution Tables on pages 54 to 55.
Movement between net revenue and net distributions
Net revenue after taxation
Add: revenue deducted on cancellation of sharesDeduct: revenue received on issue of shares
Net distributions for the year
Final distributionInterim distribution
Distributions
The distributions take account of revenue received on the issue of shares and revenue deducted on the cancellation of shares and comprise:
Factors that may affect future tax charges:
At the year end, after offset against revenue taxable on receipt, there is a potential deferred tax asset of £196,637 (31/07/16: £72,963); thisrelates to surplus management expenses. No deferred tax asset was recognised in the current year and prior period as it was consideredunlikely the Fund would generate sufficient taxable profits in the future to utilise these amounts.
Deferred taxation:
There is no provision required for deferred taxation at the balance sheet date in the current or prior year.
Total tax charge for year (note 5a)
OEICs are exempt from tax on capital gains. Therefore, any capital return is not included in the above reconciliation.
* As an authorised OEIC, these items are not subject to corporation tax.
Movement in excess management expensesIrrecoverable overseas tax
Non-taxable scrip dividends*Overseas non-taxable revenue*
Net revenue before taxation
Corporation tax of 20% (2016: 20%)
Effects of:
Factors affecting current tax charge for the year:
The tax assessed for the year is lower than (2016: lower than) the standard rate of corporation tax in the UK for an open-ended investmentcompany of 20% (2016: 20%). The differences are explained below:
Irrecoverable overseas tax
Analysis of charge in year:
Taxation
49
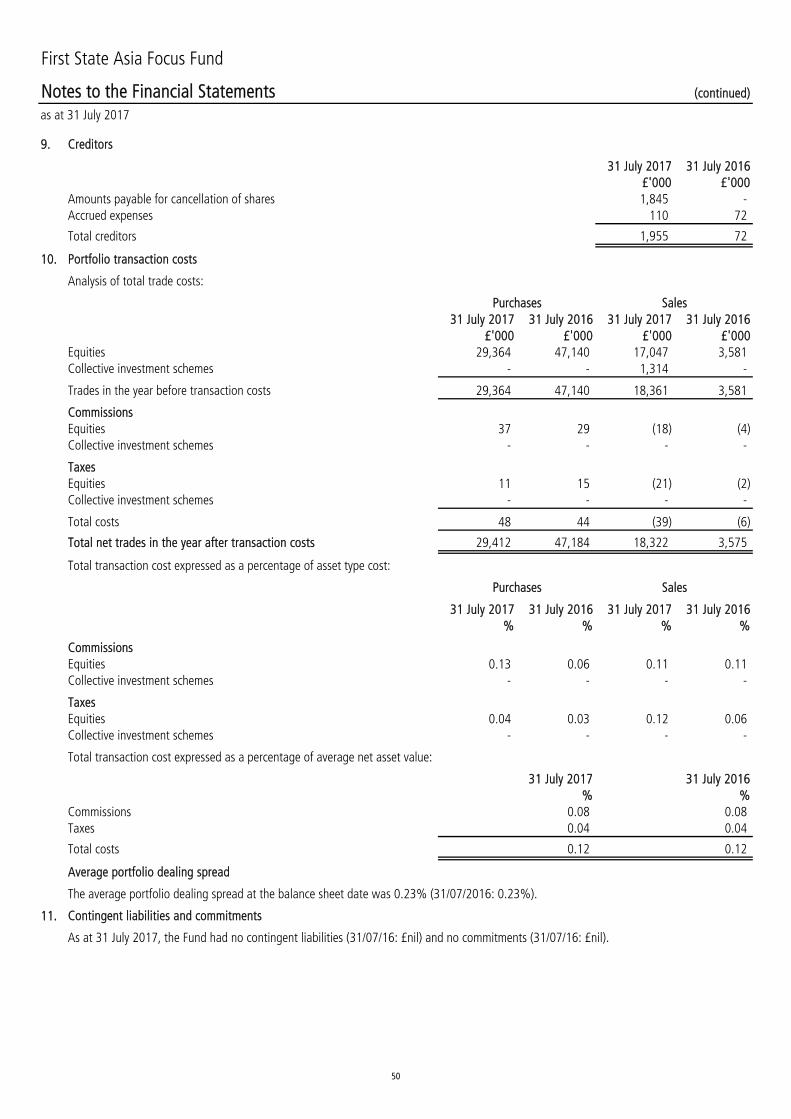
Notes to the Financial Statements (continued)
as at 31 July 2017
First State Asia Focus Fund
9.
31 July 2017 31 July 2016£'000 £'0001,845 -
110 72
1,955 72
10.
31 July 2017 31 July 2016 31 July 2017 31 July 2016£'000 £'000 £'000 £'000
29,364 47,140 17,047 3,581- - 1,314 -
29,364 47,140 18,361 3,581
37 29 (18) (4)- - - -
11 15 (21) (2)- - - -
48 44 (39) (6)
29,412 47,184 18,322 3,575
31 July 2017 31 July 2016 31 July 2017 31 July 2016% % % %
0.13 0.06 0.11 0.11- - - -
0.04 0.03 0.12 0.06- - - -
11. Contingent liabilities and commitments
As at 31 July 2017, the Fund had no contingent liabilities (31/07/16: £nil) and no commitments (31/07/16: £nil).
The average portfolio dealing spread at the balance sheet date was 0.23% (31/07/2016: 0.23%).
Total costs 0.12 0.12
Average portfolio dealing spread
Commissions 0.08 0.08Taxes 0.04 0.04
Total transaction cost expressed as a percentage of average net asset value:
31 July 2017 31 July 2016% %
EquitiesCollective investment schemes
Taxes
CommissionsEquitiesCollective investment schemes
Total transaction cost expressed as a percentage of asset type cost:
Purchases Sales
Total costs
Total net trades in the year after transaction costs
Collective investment schemes
TaxesEquities
Collective investment schemes
Trades in the year before transaction costs
CommissionsEquities
Collective investment schemes
Analysis of total trade costs:
Purchases Sales
Equities
Total creditors
Portfolio transaction costs
Amounts payable for cancellation of sharesAccrued expenses
Creditors
50
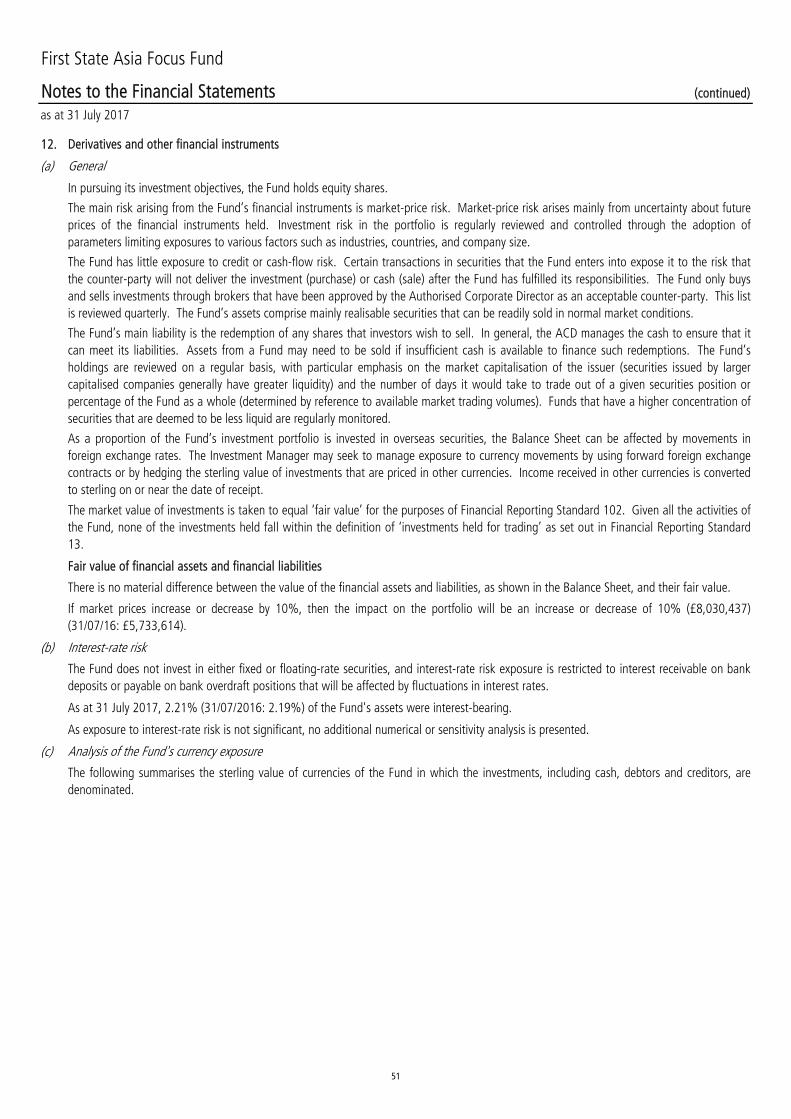
Notes to the Financial Statements (continued)
as at 31 July 2017
First State Asia Focus Fund
12.
(a)
(b)
(c)
The following summarises the sterling value of currencies of the Fund in which the investments, including cash, debtors and creditors, aredenominated.
As at 31 July 2017, 2.21% (31/07/2016: 2.19%) of the Fund's assets were interest-bearing.
As exposure to interest-rate risk is not significant, no additional numerical or sensitivity analysis is presented.
Analysis of the Fund's currency exposure
There is no material difference between the value of the financial assets and liabilities, as shown in the Balance Sheet, and their fair value.
If market prices increase or decrease by 10%, then the impact on the portfolio will be an increase or decrease of 10% (£8,030,437)(31/07/16: £5,733,614).
Interest-rate risk
The Fund does not invest in either fixed or floating-rate securities, and interest-rate risk exposure is restricted to interest receivable on bankdeposits or payable on bank overdraft positions that will be affected by fluctuations in interest rates.
The Fund’s main liability is the redemption of any shares that investors wish to sell. In general, the ACD manages the cash to ensure that itcan meet its liabilities. Assets from a Fund may need to be sold if insufficient cash is available to finance such redemptions. The Fund’sholdings are reviewed on a regular basis, with particular emphasis on the market capitalisation of the issuer (securities issued by largercapitalised companies generally have greater liquidity) and the number of days it would take to trade out of a given securities position orpercentage of the Fund as a whole (determined by reference to available market trading volumes). Funds that have a higher concentration ofsecurities that are deemed to be less liquid are regularly monitored.
As a proportion of the Fund’s investment portfolio is invested in overseas securities, the Balance Sheet can be affected by movements inforeign exchange rates. The Investment Manager may seek to manage exposure to currency movements by using forward foreign exchangecontracts or by hedging the sterling value of investments that are priced in other currencies. Income received in other currencies is convertedto sterling on or near the date of receipt.
The market value of investments is taken to equal ‘fair value’ for the purposes of Financial Reporting Standard 102. Given all the activities ofthe Fund, none of the investments held fall within the definition of ‘investments held for trading’ as set out in Financial Reporting Standard13.
Fair value of financial assets and financial liabilities
Derivatives and other financial instruments
General
In pursuing its investment objectives, the Fund holds equity shares.
The main risk arising from the Fund’s financial instruments is market-price risk. Market-price risk arises mainly from uncertainty about futureprices of the financial instruments held. Investment risk in the portfolio is regularly reviewed and controlled through the adoption ofparameters limiting exposures to various factors such as industries, countries, and company size.
The Fund has little exposure to credit or cash-flow risk. Certain transactions in securities that the Fund enters into expose it to the risk thatthe counter-party will not deliver the investment (purchase) or cash (sale) after the Fund has fulfilled its responsibilities. The Fund only buysand sells investments through brokers that have been approved by the Authorised Corporate Director as an acceptable counter-party. This listis reviewed quarterly. The Fund’s assets comprise mainly realisable securities that can be readily sold in normal market conditions.
51
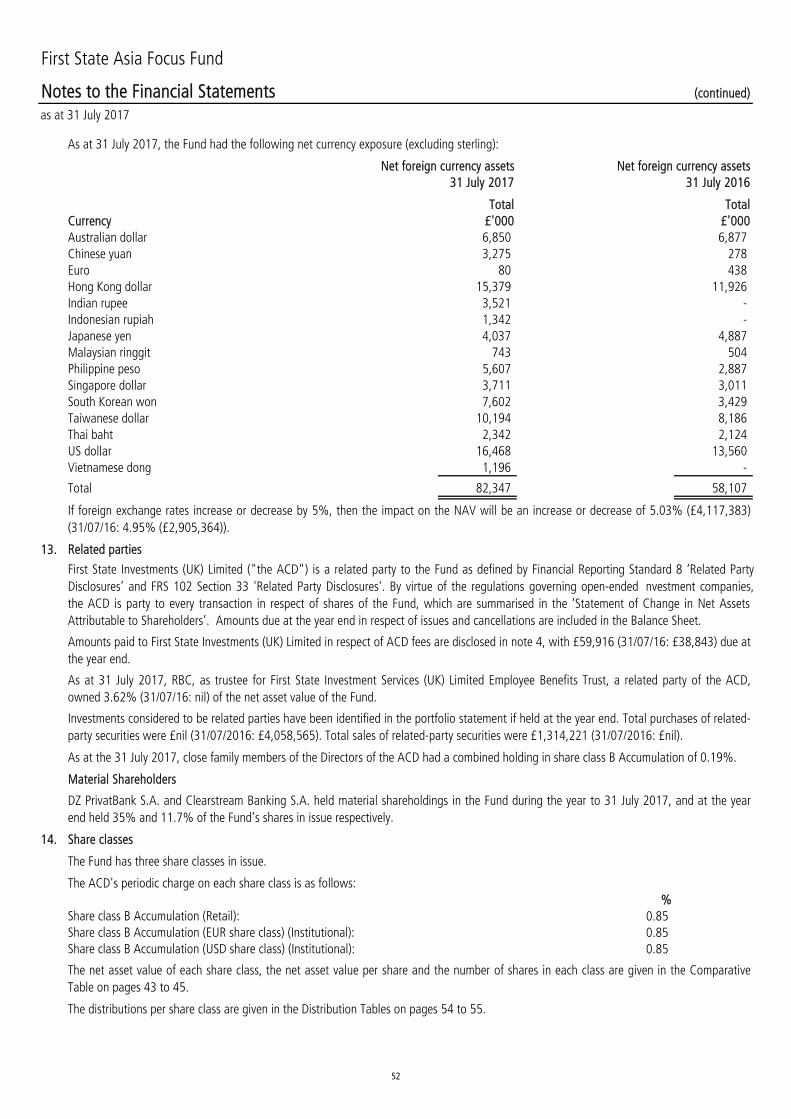
Notes to the Financial Statements (continued)
as at 31 July 2017
First State Asia Focus Fund
Total TotalCurrency £'000 £'000Australian dollar 6,850 6,877Chinese yuan 3,275 278Euro 80 438Hong Kong dollar 15,379 11,926Indian rupee 3,521 -Indonesian rupiah 1,342 -Japanese yen 4,037 4,887Malaysian ringgit 743 504Philippine peso 5,607 2,887Singapore dollar 3,711 3,011South Korean won 7,602 3,429Taiwanese dollar 10,194 8,186Thai baht 2,342 2,124US dollar 16,468 13,560Vietnamese dong 1,196 -
Total 82,347 58,107
13.
14.
%0.850.850.85
The net asset value of each share class, the net asset value per share and the number of shares in each class are given in the ComparativeTable on pages 43 to 45.
The distributions per share class are given in the Distribution Tables on pages 54 to 55.
The ACD's periodic charge on each share class is as follows:
Share class B Accumulation (Retail):Share class B Accumulation (EUR share class) (Institutional):Share class B Accumulation (USD share class) (Institutional):
As at the 31 July 2017, close family members of the Directors of the ACD had a combined holding in share class B Accumulation of 0.19%.
Material Shareholders
DZ PrivatBank S.A. and Clearstream Banking S.A. held material shareholdings in the Fund during the year to 31 July 2017, and at the yearend held 35% and 11.7% of the Fund’s shares in issue respectively.
Share classes
The Fund has three share classes in issue.
Amounts paid to First State Investments (UK) Limited in respect of ACD fees are disclosed in note 4, with £59,916 (31/07/16: £38,843) due at the year end.
As at 31 July 2017, RBC, as trustee for First State Investment Services (UK) Limited Employee Benefits Trust, a related party of the ACD,owned 3.62% (31/07/16: nil) of the net asset value of the Fund.
Investments considered to be related parties have been identified in the portfolio statement if held at the year end. Total purchases of related-party securities were £nil (31/07/2016: £4,058,565). Total sales of related-party securities were £1,314,221 (31/07/2016: £nil).
Related parties
First State Investments (UK) Limited ("the ACD") is a related party to the Fund as defined by Financial Reporting Standard 8 ‘Related Party Disclosures’ and FRS 102 Section 33 'Related Party Disclosures'. By virtue of the regulations governing open-ended investment companies, the ACD is party to every transaction in respect of shares of the Fund, which are summarised in the ‘Statement of Change in Net Assets Attributable to Shareholders’. Amounts due at the year end in respect of issues and cancellations are included in the Balance Sheet.
If foreign exchange rates increase or decrease by 5%, then the impact on the NAV will be an increase or decrease of 5.03% (£4,117,383)(31/07/16: 4.95% (£2,905,364)).
As at 31 July 2017, the Fund had the following net currency exposure (excluding sterling):
Net foreign currency assets Net foreign currency assets31 July 2017 31 July 2016
52
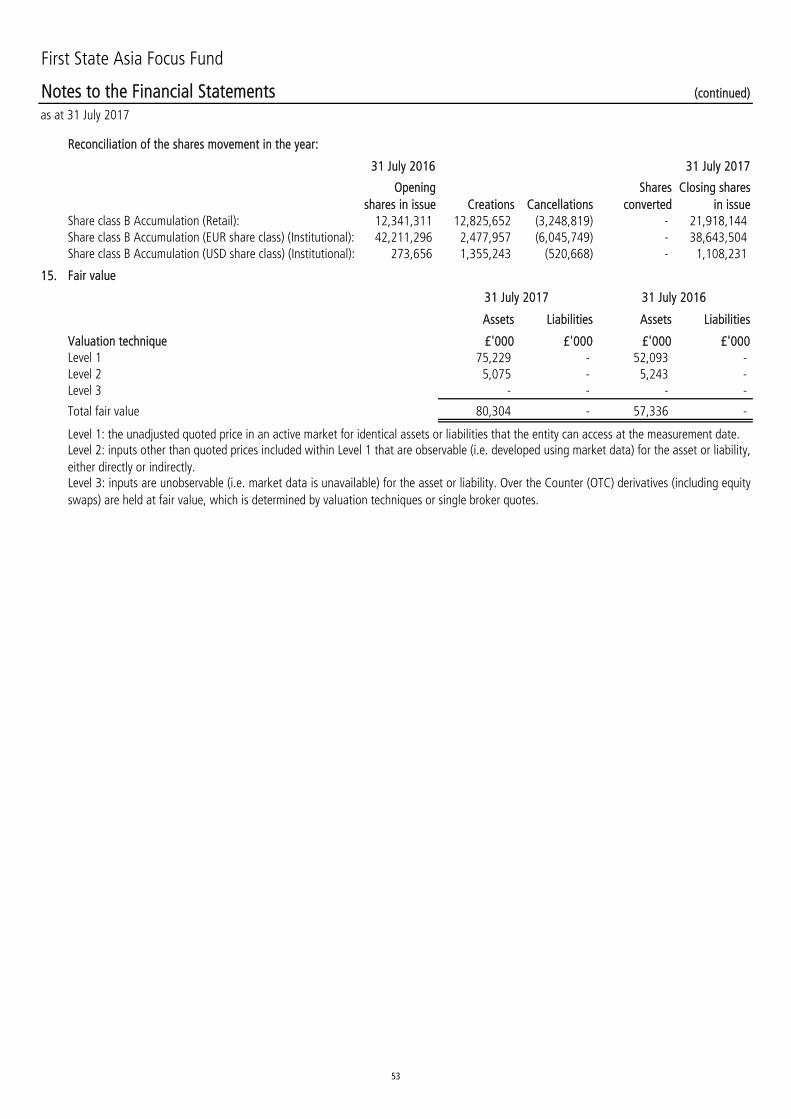
Notes to the Financial Statements (continued)
as at 31 July 2017
First State Asia Focus Fund
31 July 2016 31 July 2017
Opening shares in issue Creations Cancellations
Shares converted
Closing shares in issue
12,341,311 12,825,652 (3,248,819) - 21,918,14442,211,296 2,477,957 (6,045,749) - 38,643,504
273,656 1,355,243 (520,668) - 1,108,231
15.
Assets Liabilities Assets Liabilities
£'000 £'000 £'000 £'00075,229 - 52,093 -
5,075 - 5,243 -- - - -
80,304 - 57,336 -
Level 3: inputs are unobservable (i.e. market data is unavailable) for the asset or liability. Over the Counter (OTC) derivatives (including equityswaps) are held at fair value, which is determined by valuation techniques or single broker quotes.
Level 1Level 2Level 3
Total fair value
Level 1: the unadjusted quoted price in an active market for identical assets or liabilities that the entity can access at the measurement date. Level 2: inputs other than quoted prices included within Level 1 that are observable (i.e. developed using market data) for the asset or liability,either directly or indirectly.
Fair value
Valuation technique
31 July 2017 31 July 2016
Reconciliation of the shares movement in the year:
Share class B Accumulation (Retail):Share class B Accumulation (EUR share class) (Institutional):Share class B Accumulation (USD share class) (Institutional):
53
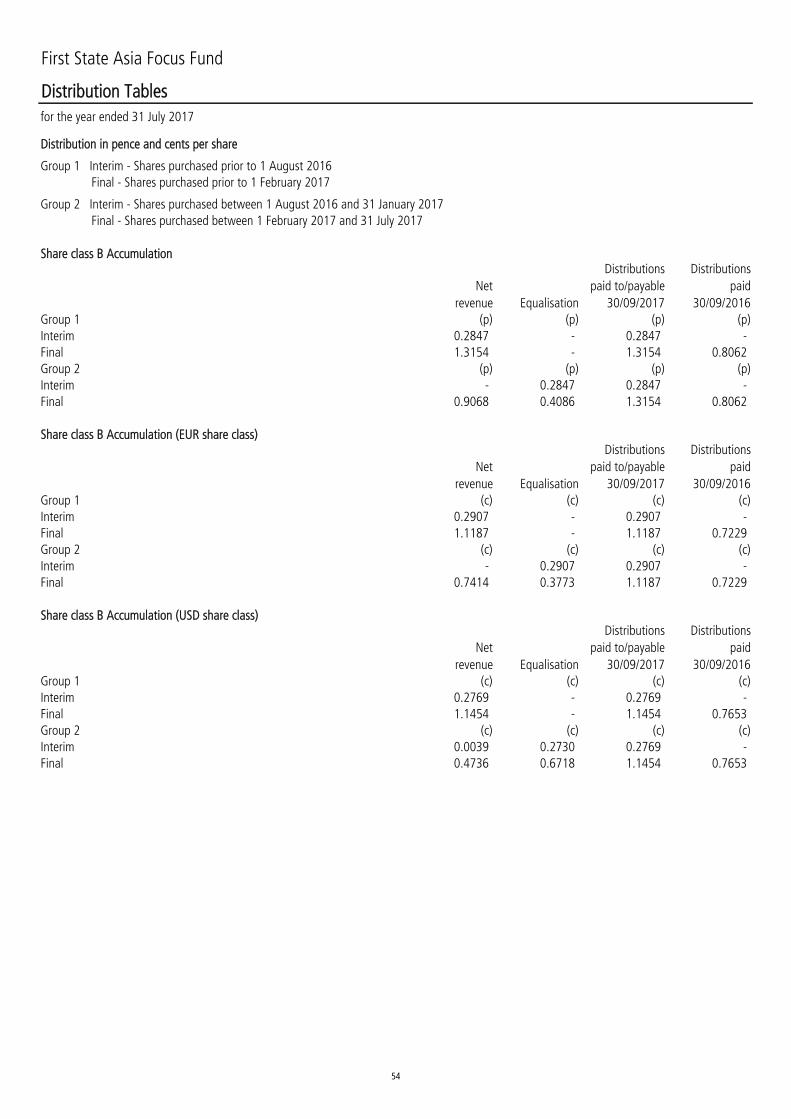
Share class B Accumulation
Netrevenue Equalisation
Distributions paid to/payable
30/09/2017
Distributions paid
30/09/2016Group 1 (p) (p) (p) (p)Interim 0.2847 - 0.2847 -Final 1.3154 - 1.3154 0.8062Group 2 (p) (p) (p) (p)Interim - 0.2847 0.2847 -Final 0.9068 0.4086 1.3154 0.8062
Share class B Accumulation (EUR share class)
Netrevenue Equalisation
Distributions paid to/payable
30/09/2017
Distributions paid
30/09/2016Group 1 (c) (c) (c) (c)Interim 0.2907 - 0.2907 -Final 1.1187 - 1.1187 0.7229Group 2 (c) (c) (c) (c)Interim - 0.2907 0.2907 -Final 0.7414 0.3773 1.1187 0.7229
Share class B Accumulation (USD share class)
Netrevenue Equalisation
Distributions paid to/payable
30/09/2017
Distributions paid
30/09/2016Group 1 (c) (c) (c) (c)Interim 0.2769 - 0.2769 -Final 1.1454 - 1.1454 0.7653Group 2 (c) (c) (c) (c)Interim 0.0039 0.2730 0.2769 -Final 0.4736 0.6718 1.1454 0.7653
Final - Shares purchased between 1 February 2017 and 31 July 2017Group 2 Interim - Shares purchased between 1 August 2016 and 31 January 2017
Final - Shares purchased prior to 1 February 2017
Distribution in pence and cents per share
First State Asia Focus Fund
Distribution Tablesfor the year ended 31 July 2017
Group 1 Interim - Shares purchased prior to 1 August 2016
54
First State Asia Focus Fund
Distribution Tables (continued)
for the year ended 31 July 2017
Shareholders should consult their professional advisers for any advice regarding their tax position.
Final - 100.00% of the dividend is received as franked investment income.
Final - 0.00% of the dividend is received as an annual payment (non-foreign element) received after the deduction of income tax at the lower rateand is liable to corporation tax. The tax deemed to be deducted is treated as income tax.
Final - 0.00% of the dividend is received as an annual payment (foreign element) received after the deduction of income tax at the lower rate and isliable to corporation tax. It is treated as foreign income in the hands of the corporate investor and is liable to corporation tax. The associateddeemed tax is treated as foreign tax in the hands of the investor, who may be able to claim double tax relief. Investors cannot reclaim any of thisdeemed tax on the foreign element from HM Revenue & Customs.
Interim - 100.00% of the dividend is received as franked investment income.
Interim - 0.00% of the dividend is received as an annual payment (non-foreign element) received after the deduction of income tax at the lowerrate and is liable to corporation tax. The tax deemed to be deducted is treated as income tax.
Interim - 0.00% of the dividend is received as an annual payment (foreign element) received after the deduction of income tax at the lower rate andis liable to corporation tax. It is treated as foreign income in the hands of the corporate investor and is liable to corporation tax. The associateddeemed tax is treated as foreign tax in the hands of the investor, who may be able to claim double tax relief. Investors cannot reclaim any of thisdeemed tax on the foreign element from HM Revenue & Customs.
Corporate tax for all share classes (unaudited)
A shareholder liable to corporation tax receives this distribution, excluding equalisation, as follows:
55
Risks and reward profile
Lower Risk Higher Risk
Potentially Lower Rewards Potentially Higher Rewards
1 2 3 4 5 6 7
1 2 3 4 5 6 7
1 2 3 4 5 6 7
1 2 3 4 5 6 7
Stewart Investors Asia Pacific Fund
Authorised Fund Manager's Reportfor the year ended 31 July 2017
Investment Objective and Policy
The Fund aims to achieve long-term capital growth.
The Fund invests in equities issued by companies that are incorporated or listed, or which conduct the majority of their economic activity, in theAsia Pacific region (excluding Japan, including Australasia).
• Clarification point: "Australasia" refers to Australia, New Zealand and other South-East Asian countries.
Share class A Accumulation
Share class A Income
Share class B Accumulation
Share class B Income
• Even the lowest rating 1 does not mean a risk-free investment;
• On a scale of 1 (less risky) to 7 (more risky), this Fund has a rating of 5 due to its past performance and the nature of its investments. Shares witha rating of 5 might have higher risks, but also higher returns;
• Risk is taken in order to make a higher potential return; the more risk a Fund takes, the higher the potential return but the greater the risk of loss;and
• The value of the Fund and its return is not guaranteed and may fall as well as rise. You may get back less than you originally invested.
The Fund might also experience the following risk:
• The synthetic risk reward indicator (the SRRI) rating is not a measure of the risk of you losing your investment but describes how much the valueof the Fund went up and down in the past;
• The SRRI rating is based on historical data, which may not be a reliable indication of the future risks and rewards of the Fund;
• We cannot guarantee that the rating of the Fund will remain the same; it may change over time;
Currency risk: the Fund invests in assets that are denominated in other currencies; changes in exchange rates will affect the value of the Fund.
Performance
The Fund rose by 10.9% in sterling terms over the year and has provided cumulative returns of 43.6% and 80.0% over three and five yearsrespectively to 31 July 2017.
Oversea-Chinese Banking (Singapore: Financials) rose on the improving performance of its insurance and wealth management businesses, and TataGlobal Beverages (India: Consumer Staples) gained on the back of lower commodity prices, lower borrowing costs, and an increased focus onexiting loss-making businesses like its Chinese joint venture. Zhongsheng Group (China: Consumer Discretionary) climbed on strong luxury cardemand and increasing contribution from BMW sales.
On the negative side, Brambles (Australia: Industrials) declined due to competitive pressures in the US, and Newcrest Mining (Australia: Materials)fell because of the subdued gold price. Delfi (Singapore: Consumer Staples) was weak due to a bleak retail environment in Indonesia and highercosts as it continues to invest in rationalising its brand portfolio.
For further information on risks, please refer to the Risk Factors section in the Company's prospectus.
Portfolio changes
Significant purchases over the year included Cipla (India: Health Care), one of India’s oldest family-owned pharmaceutical companies, which hasproven manufacturing capabilities in generic drugs and new management in place from another Indian pharmaceutical company that we respect.The Fund bought Uni-President Enterprises (Taiwan: Consumer Staples), a well-regarded Taiwanese family-run company where the Chinesebusiness could be turning around gradually, driven largely by a more healthy product portfolio. The Fund also bought John Keells (Sri Lanka:Industrials), an out-of-favour, net cash, diversified conglomerate run by a long-tenured management team overseen by a high-quality board ofdirectors.The Fund sold CSL (Australia: Health Care) and AIA Group (Hong Kong: Financials) on valuation worries. The Fund also sold Taiwan SemiconductorManufacturing (Information Technology) on valuation concerns given ongoing questions about management succession.
56
(continued)
Stewart Investors Asia Pacific Fund
Authorised Fund Manager's Reportfor the year ended 31 July 2017
Time 3 6 1 3 5 10 Sinceperiod mths mths yr yrs yrs yrs launch
2.6 5.1 10.9 43.6 80.0 201.6 4,677.0 7.9 13.7 25.4 44.8 72.3 124.2 1,094.6 7.2 12.0 22.3 46.6 73.7 123.4 2,021.8
4 4 4 3 2 1 1
12 mths to 12 mths to 12 mths to 12 mths to 12 mths to31/07/17 31/07/16 31/07/15 31/07/14 31/07/13
10.9 18.7 9.1 9.3 14.6
31 July 2017 31 July 2016% of Fund % of Fund
4.40 4.17Oversea-Chinese Banking 4.29 Oversea-Chinese Banking 4.07Tata Consultancy Services 4.13 CSL 3.98Newcrest Mining 3.80 Newcrest Mining 3.56MediaTek 3.40 Taiwan Semiconductor Manufacturing 3.49Tata Global Beverages 3.33 Standard Foods 3.03Uni-President Enterprises 2.98 Tata Consultancy Services 2.93Cyient 2.89 MediaTek 2.34Brambles 2.75 Delfi 2.21Asustek Computer 2.70 Cyient 2.20
Outlook
The Manager remains concerned about political instability in the Region and across the world, and continues to worry about the health of theChinese economy where debt levels are very high and have risen rapidly in a relatively short period of time. Rising political risk in China is anotherrisk, although we remain positive about the long-term potential for improvement at a company level in terms of corporate governance. TheManager believes that the outlook remains uncertain, and we maintain our cautious positioning due to risks in the financial system and the risinglevel of stock markets.
Benchmark return %Sector return %Quartile ranking
Discrete performance as at 31 July 2017
Cumulative performance as at 31 July 2017
Fund return %
Past performance should not be used as a guide to future performance, which is not guaranteed.
Ten largest holdings
TimeperiodFund return %
Benchmark: MSCI AC Asia Pacific (ex-Japan) Index.Sector: IA Asia Pacific (ex-Japan).
Types of sharesIncome and Accumulation.
Stock name Stock nameStandard Foods Brambles
57
Holdings
MarketValue£'000
TotalNet Assets
%
UNITED KINGDOM (0.94%*) 2,995 0.363,023,695 Myanmar Investments International 2,995 0.36
973,315 Myanmar Investments International Warrants Expiry 21/06/2018 - -
AUSTRALIA (11.71%*) 59,199 7.131,408,819 Bapcor 4,835 0.584,069,315 Brambles 22,838 2.752,571,992 Newcrest Mining 31,526 3.80
CHINA (1.90%*) 15,853 1.9110,691,000 China Mengniu Dairy 15,853 1.91
HONG KONG (16.65%*) 121,335 14.616,922,000 Cathay Pacific Airways 8,252 0.998,119,677 China Resources Pharmaceutical Group 7,414 0.891,724,256 CK Hutchison Holdings 17,292 2.08
34,969,000 Greatview Aseptic Packaging 15,352 1.852,102,800 Hong Kong Aircraft Engineering 11,180 1.35
11,442,552 Hong Kong & China Gas 16,477 1.9941,446,000 Li & Fung 11,524 1.3915,978,000 Public Financial Holdings 5,658 0.6830,730,000 Singamas Container Holdings 3,328 0.40
7,080,000 Vinda International Holdings 10,153 1.222,562,931 Vitasoy International Holdings 4,166 0.506,317,290 Zhongsheng Group Holdings 10,539 1.27
INDIA (22.10%*) 203,367 24.492,897,241 Cipla 19,309 2.323,848,615 Cyient 23,999 2.891,032,909 Elgi Equipments 2,895 0.352,989,445 Federal Bank 4,096 0.49
976,354 Great Eastern Shipping 4,593 0.55863,014 Housing Development Finance 18,323 2.21
8,845,458 Idea Cellular 9,702 1.175,389,142 IDFC Bank 3,809 0.463,177,399 Indoco Remedies 7,544 0.91
770,131 Mahindra & Mahindra 12,861 1.551,237,656 Mahindra Lifespace Developers 6,190 0.741,818,869 S H Kelkar 5,708 0.691,158,264 Tata Consultancy Services 34,296 4.13
13,695,283 Tata Global Beverages 27,653 3.339,031,504 Tata Power 8,796 1.061,404,260 United Breweries 13,593 1.64
INDONESIA (0.00%*) 14,382 1.7395,788,900 Bank OCBC Nisp 9,860 1.19
101,363,500 Holcim Indonesia 4,522 0.54
PHILIPPINES (1.51%*) 8,170 0.983,402,820 Universal Robina 8,170 0.98
Stewart Investors Asia Pacific Fund
Portfolio Statementas at 31 July 2017
58

Holdings
MarketValue£'000
TotalNet Assets
%
Stewart Investors Asia Pacific Fund
Portfolio Statement (continued)
as at 31 July 2017
SINGAPORE (12.99%*) 133,560 16.083,101,200 Bukit Sembawang Estates 11,839 1.422,449,900 Dairy Farm International Holdings 15,009 1.81
16,904,700 Delfi 18,505 2.2316,590,118 Ezion Holdings 2,235 0.2735,367,773 Ezion Holdings Warrants Expiry 24/04/2020 715 0.09
685,400 Great Eastern Holdings 9,612 1.162,983,000 Haw Par 17,617 2.124,011,300 Hong Leong Finance 5,922 0.715,590,149 Oversea-Chinese Banking 35,650 4.29
22,991,389 Raffles Medical Group 16,456 1.98
SOUTH KOREA (4.25%*) 45,427 5.47163,896 AMOREPACIFIC Group 13,503 1.63279,023 Leeno Industrial 9,414 1.13
31,300 LG Household & Health Care Preference Shares 13,597 1.64245,116 Youngone Holdings 8,913 1.07
SRI LANKA (2.40%*) 31,966 3.853,617,374 Commercial Bank of Ceylon 2,472 0.302,054,445 Dialog Axiata 117 0.01
15,486,461 John Keells Holdings 13,356 1.6115,285,500 Nations Trust Bank 6,068 0.7349,278,338 Teejay Lanka 9,953 1.20
TAIWAN (15.47%*) 136,519 16.443,168,000 Asustek Computer 22,424 2.702,750,000 Chroma ATE 6,627 0.804,205,000 MediaTek 28,225 3.403,085,000 Merida Industry 11,249 1.35
18,061,736 Standard Foods 36,553 4.4016,997,000 Uni-President Enterprises 24,748 2.98
514,000 Voltronic Power Technology 6,693 0.81
THAILAND (1.57%*) 12,909 1.556,388,400 Delta Electronics Thailand 12,909 1.55
Portfolio of investments 785,682 94.60
Net other assets 44,810 5.40
Total net assets 830,492 100.00
All investments held are listed, unless otherwise stated.
* Comparative figures shown in brackets relate to 31 July 2016.For the purposes of the portfolio holdings analysis, securities are shown based on their country of listing.
59
Share class A Accumulation
Change in net assets per share
Opening net asset value per share
Return before operating charges*
Operating charges
Return after operating charges*
Distributions
Retained distributions on accumulation shares
Closing net asset value per share (p)
* after direct transaction costs of:
Performance
Return after charges (%)
Other information
Closing net asset value (£’000)
Closing number of shares
Operating charges
Direct transaction costs
Prices
Highest share price
Lowest share price 1,146.69 851.43 884.46
0.18% 0.12% 0.19%
1,313.05 1,168.03 1,104.16
1.84% 1.85% 1.84%
131,028 137,622 187,090
10,210,491 11,897,315 19,193,517
10.94% 18.67% 9.02%
1,283.27 1,156.75 974.76
2.18 1.14 1.85
2.93 2.88 3.86
126.52 181.99 80.63
(2.93) (2.88) (3.86)
149.29 199.91 98.74
(22.77) (17.92) (18.11)
1,156.75 974.76 894.13
Stewart Investors Asia Pacific Fund
Comparative Tablefor the year ended 31 July 2017
Net Asset Value and Ongoing Charges Figure
Final 31 July 2017(p)
Final 31 July 2016(p)
Final 31 July 2015(p)
60

Stewart Investors Asia Pacific Fund
Comparative Table (continued)
for the year ended 31 July 2017
Net Asset Value and Ongoing Charges Figure
Share class A Income
Change in net assets per share
Opening net asset value per share
Return before operating charges*
Operating charges
Return after operating charges*
Distributions
Closing net asset value per share (p)
* after direct transaction costs of:
Performance
Return after charges (%)
Other information
Closing net asset value (£’000)
Closing number of shares
Operating charges
Direct transaction costs
Prices
Highest share price
Lowest share price 207.86 154.70 161.36
0.18% 0.12% 0.19%
238.12 212.74 201.38
1.80% 1.81% 1.81%
833 740 1,167
358,814 352,634 658,935
11.48% 18.95% 8.95%
232.09 209.68 177.12
0.39 0.21 0.34
24.07 33.56 14.60
(1.66) (1.00) (0.61)
28.12 36.74 17.85
(4.05) (3.18) (3.25)
209.68 177.12 163.13
Final 31 July 2017(p)
Final 31 July 2016(p)
Final 31 July 2015(p)
61
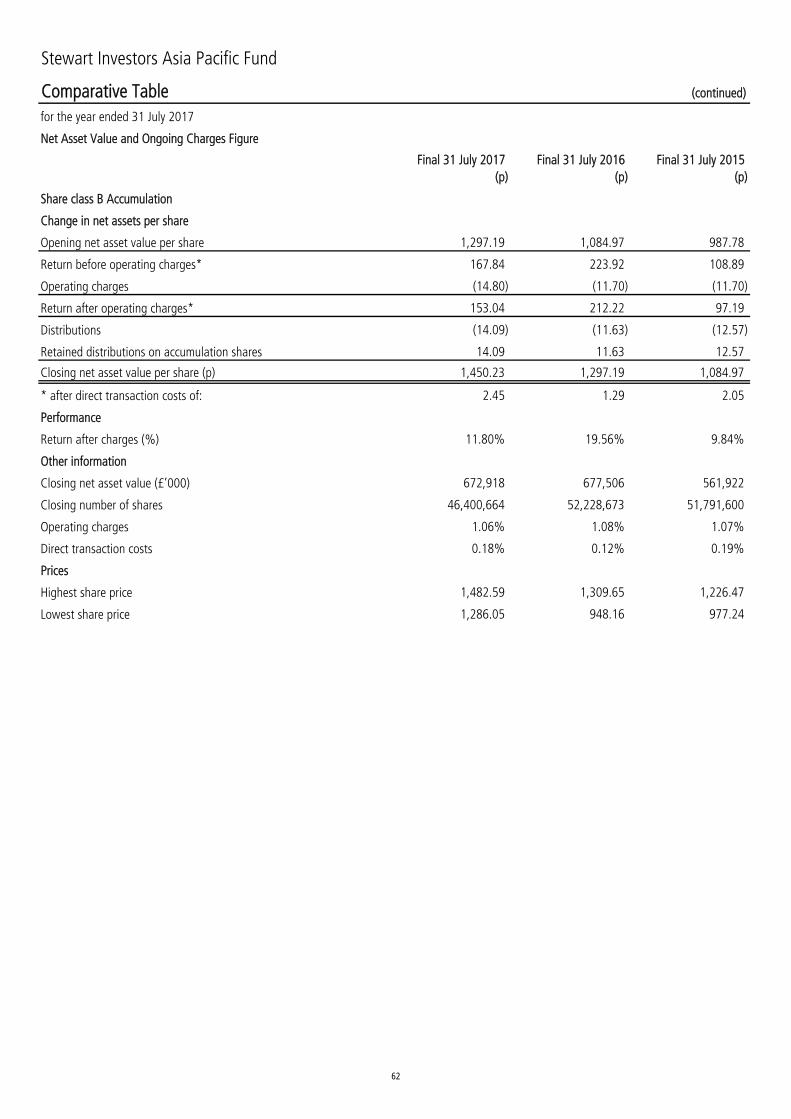
Stewart Investors Asia Pacific Fund
Comparative Table (continued)
for the year ended 31 July 2017
Net Asset Value and Ongoing Charges Figure
Share class B Accumulation
Change in net assets per share
Opening net asset value per share
Return before operating charges*
Operating charges
Return after operating charges*
Distributions
Retained distributions on accumulation shares
Closing net asset value per share (p)
* after direct transaction costs of:
Performance
Return after charges (%)
Other information
Closing net asset value (£’000)
Closing number of shares
Operating charges
Direct transaction costs
Prices
Highest share price
Lowest share price 1,286.05 948.16 977.24
0.18% 0.12% 0.19%
1,482.59 1,309.65 1,226.47
1.06% 1.08% 1.07%
672,918 677,506 561,922
46,400,664 52,228,673 51,791,600
11.80% 19.56% 9.84%
1,450.23 1,297.19 1,084.97
2.45 1.29 2.05
14.09 11.63 12.57
153.04 212.22 97.19
(14.09) (11.63) (12.57)
167.84 223.92 108.89
(14.80) (11.70) (11.70)
1,297.19 1,084.97 987.78
Final 31 July 2017(p)
Final 31 July 2016(p)
Final 31 July 2015(p)
62

Stewart Investors Asia Pacific Fund
Comparative Table (continued)
for the year ended 31 July 2017
Net Asset Value and Ongoing Charges Figure
Share class B Income
Change in net assets per share
Opening net asset value per share
Return before operating charges*
Operating charges
Return after operating charges*
Distributions
Closing net asset value per share (p)
* after direct transaction costs of:
Performance
Return after charges (%)
Other information
Closing net asset value (£’000)
Closing number of shares
Operating charges
Direct transaction costs
Prices
Highest share price
Lowest share price 208.50 155.17 161.78
0.18% 0.12% 0.19%
239.30 213.88 202.39
1.07% 1.09% 1.08%
25,713 23,563 19,455
11,045,589 11,204,534 10,956,892
11.78% 19.59% 9.77%
232.79 210.30 177.56
0.40 0.21 0.34
24.77 34.79 15.97
(2.28) (2.05) (1.93)
27.19 36.73 17.92
(2.42) (1.94) (1.95)
210.30 177.56 163.52
Final 31 July 2017(p)
Final 31 July 2016(p)
Final 31 July 2015(p)
63

Notes £'000 £'000 £'000 £'000
Net capital gains 2 89,536 127,273
Revenue 3 18,247 16,117
4 (10,334) (8,836)
Interest payable and similar charges (3) (1)
7,910 7,280
5 (919) (1,447)
6,991 5,833
96,527 133,106
6 (7,686) (6,725)
88,841 126,381
£'000 £'000 £'000 £'000
839,431 769,634
11,262 17,995
(116,306) (81,136)
(105,044) (63,141)
160 167
88,841 126,381
7,104 6,390
830,492 839,431
Less: Amounts payable on cancellation of shares
Dilution adjustment
Change in net assets attributable to shareholders from investment activities
Retained distribution on accumulation shares
Closing net assets attributable to shareholders
Notes to the Financial Statements are on pages 66 to 71.
Amounts receivable on issue of shares
for the year ended 31 July 2017
31 July 2017 31 July 2016
Opening net assets attributable to shareholders
Statement of Change in Net Assets Attributable to Shareholders
Income
Expenses
Net revenue before taxation
Taxation
Net revenue after taxation
Total return before distributions
Distributions
Change in net assets attributable to shareholders from investment activities
31 July 2017 31 July 2016
Stewart Investors Asia Pacific Fund
Statement of Total Returnfor the year ended 31 July 2017
64

Stewart Investors Asia Pacific Fund
31 July 2017 31 July 2016Notes £'000 £'000
Investments 785,682 767,972
Current assets
8 1,958 1,533
46,880 73,679
834,520 843,184
Creditors
(144) (177)
Other creditors 9 (3,884) (3,576)
(4,028) (3,753)
830,492 839,431
Notes to the Financial Statements are on pages 66 to 71.
Distribution payable
Total liabilities
Net assets attributable to shareholders
Balance Sheetas at 31 July 2017
Assets
Fixed assets
Debtors
Cash and bank balances
Total assets
Liabilities
65
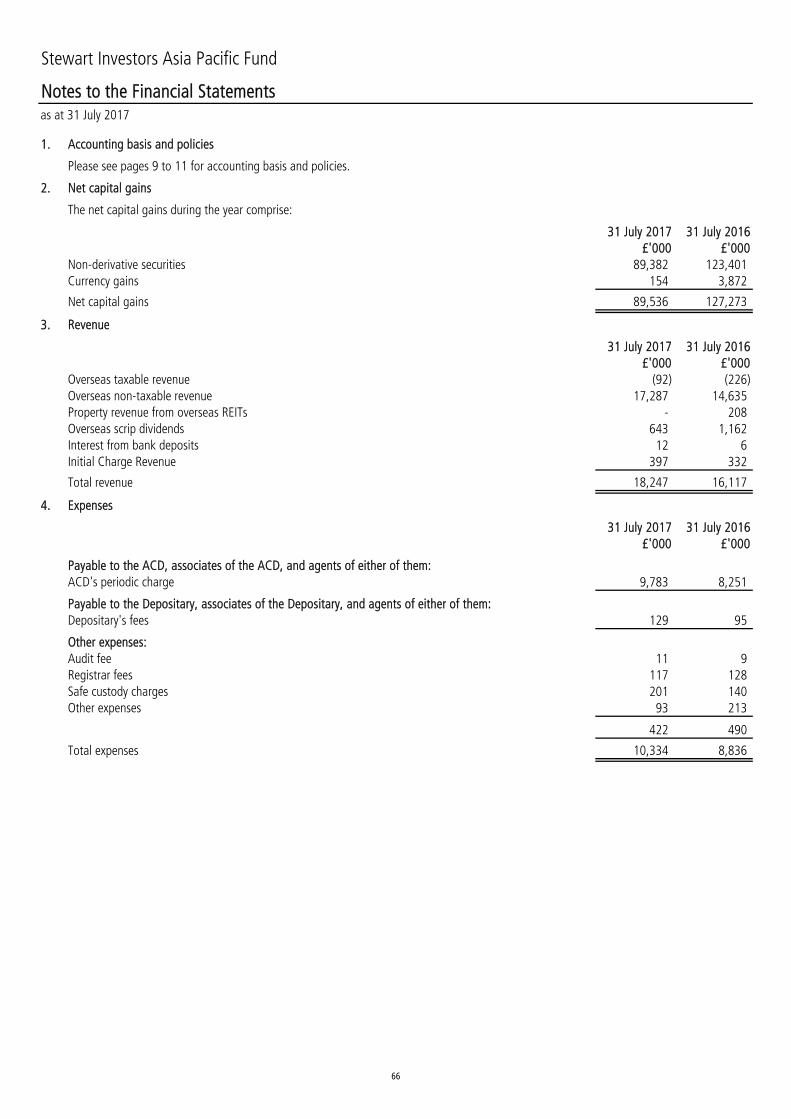
1.
2.
31 July 2017 31 July 2016£'000 £'000
89,382 123,401154 3,872
89,536 127,273
3.
31 July 2017 31 July 2016£'000 £'000
(92) (226)17,287 14,635
- 208643 1,162
12 6397 332
18,247 16,117
4.
31 July 2017 31 July 2016£'000 £'000
9,783 8,251
129 95
11 9117 128201 140
93 213
422 490
10,334 8,836Total expenses
Audit feeRegistrar feesSafe custody chargesOther expenses
Other expenses:
Payable to the Depositary, associates of the Depositary, and agents of either of them:Depositary's fees
Expenses
Payable to the ACD, associates of the ACD, and agents of either of them:ACD's periodic charge
Initial Charge Revenue
Total revenue
Interest from bank deposits
Property revenue from overseas REITsOverseas scrip dividends
Overseas taxable revenueOverseas non-taxable revenue
Net capital gains
Revenue
Currency gains
Accounting basis and policies
Please see pages 9 to 11 for accounting basis and policies.
Net capital gains
The net capital gains during the year comprise:
Non-derivative securities
Notes to the Financial Statementsas at 31 July 2017
Stewart Investors Asia Pacific Fund
66
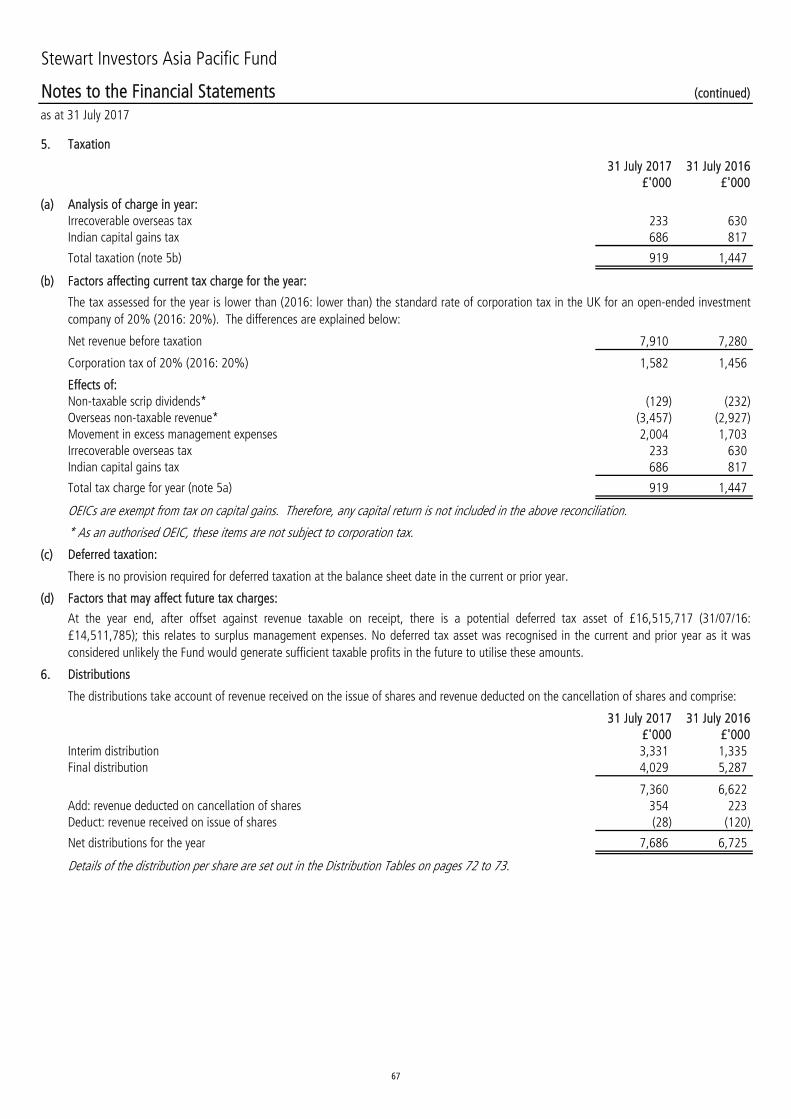
Notes to the Financial Statements (continued)
as at 31 July 2017
Stewart Investors Asia Pacific Fund
5.
31 July 2017 31 July 2016£'000 £'000
(a)233 630686 817
919 1,447
(b)
7,910 7,280
1,582 1,456
(129) (232)(3,457) (2,927)2,004 1,703
233 630686 817
919 1,447
(c)
(d)
6.
31 July 2017 31 July 2016£'000 £'0003,331 1,3354,029 5,287
7,360 6,622354 223(28) (120)
7,686 6,725
Details of the distribution per share are set out in the Distribution Tables on pages 72 to 73.
Add: revenue deducted on cancellation of sharesDeduct: revenue received on issue of shares
Net distributions for the year
Final distributionInterim distribution
Distributions
The distributions take account of revenue received on the issue of shares and revenue deducted on the cancellation of shares and comprise:
Factors that may affect future tax charges:
At the year end, after offset against revenue taxable on receipt, there is a potential deferred tax asset of £16,515,717 (31/07/16:£14,511,785); this relates to surplus management expenses. No deferred tax asset was recognised in the current and prior year as it wasconsidered unlikely the Fund would generate sufficient taxable profits in the future to utilise these amounts.
Deferred taxation:
There is no provision required for deferred taxation at the balance sheet date in the current or prior year.
Total tax charge for year (note 5a)
OEICs are exempt from tax on capital gains. Therefore, any capital return is not included in the above reconciliation.
* As an authorised OEIC, these items are not subject to corporation tax.
Indian capital gains tax
Movement in excess management expensesIrrecoverable overseas tax
Non-taxable scrip dividends*Overseas non-taxable revenue*
Net revenue before taxation
Corporation tax of 20% (2016: 20%)
Effects of:
Total taxation (note 5b)
Factors affecting current tax charge for the year:
The tax assessed for the year is lower than (2016: lower than) the standard rate of corporation tax in the UK for an open-ended investmentcompany of 20% (2016: 20%). The differences are explained below:
Indian capital gains taxIrrecoverable overseas taxAnalysis of charge in year:
Taxation
67
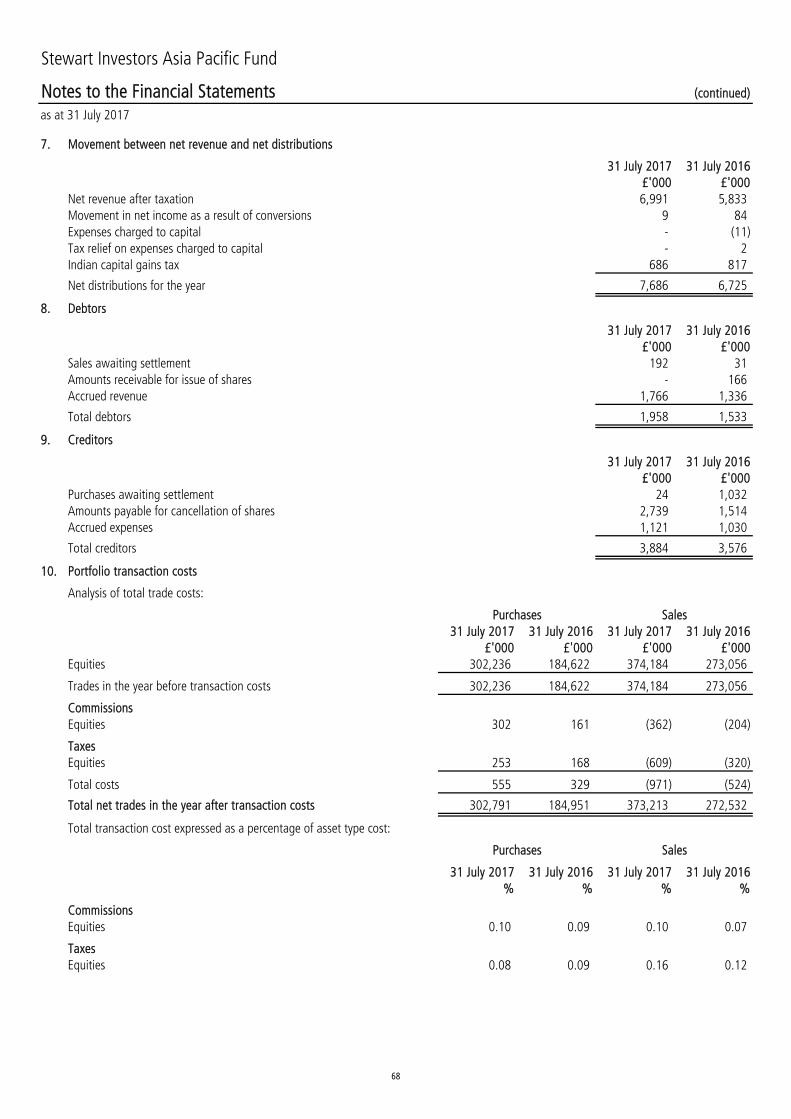
Notes to the Financial Statements (continued)
as at 31 July 2017
Stewart Investors Asia Pacific Fund
7.
31 July 2017 31 July 2016£'000 £'0006,991 5,833
9 84Expenses charged to capital - (11)Tax relief on expenses charged to capital - 2Indian capital gains tax 686 817
7,686 6,725
8.
31 July 2017 31 July 2016£'000 £'000
192 31- 166
1,766 1,336
1,958 1,533
9.
31 July 2017 31 July 2016£'000 £'000
24 1,0322,739 1,5141,121 1,030
3,884 3,576
10.
31 July 2017 31 July 2016 31 July 2017 31 July 2016£'000 £'000 £'000 £'000
302,236 184,622 374,184 273,056
302,236 184,622 374,184 273,056
302 161 (362) (204)
253 168 (609) (320)
555 329 (971) (524)
302,791 184,951 373,213 272,532
31 July 2017 31 July 2016 31 July 2017 31 July 2016% % % %
0.10 0.09 0.10 0.07
0.08 0.09 0.16 0.12EquitiesTaxes
CommissionsEquities
Total transaction cost expressed as a percentage of asset type cost:
Purchases Sales
Total costs
Total net trades in the year after transaction costs
TaxesEquities
Trades in the year before transaction costs
CommissionsEquities
Analysis of total trade costs:
Purchases Sales
Equities
Total creditors
Portfolio transaction costs
Purchases awaiting settlementAmounts payable for cancellation of sharesAccrued expenses
Creditors
Total debtors
Amounts receivable for issue of sharesAccrued revenue
Debtors
Sales awaiting settlement
Movement in net income as a result of conversions
Net distributions for the year
Movement between net revenue and net distributions
Net revenue after taxation
68
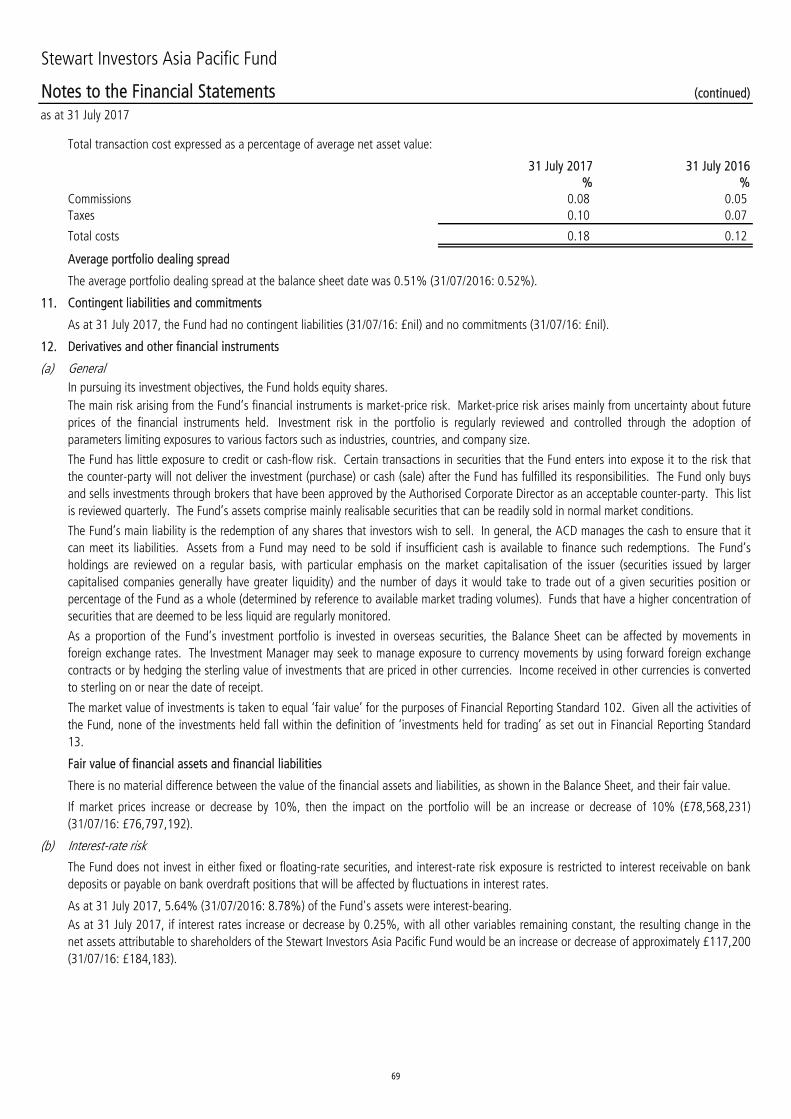
Notes to the Financial Statements (continued)
as at 31 July 2017
Stewart Investors Asia Pacific Fund
11.
12.
(a)
(b)
As at 31 July 2017, 5.64% (31/07/2016: 8.78%) of the Fund's assets were interest-bearing.As at 31 July 2017, if interest rates increase or decrease by 0.25%, with all other variables remaining constant, the resulting change in thenet assets attributable to shareholders of the Stewart Investors Asia Pacific Fund would be an increase or decrease of approximately £117,200 (31/07/16: £184,183).
There is no material difference between the value of the financial assets and liabilities, as shown in the Balance Sheet, and their fair value.
If market prices increase or decrease by 10%, then the impact on the portfolio will be an increase or decrease of 10% (£78,568,231)(31/07/16: £76,797,192).
Interest-rate risk
The Fund does not invest in either fixed or floating-rate securities, and interest-rate risk exposure is restricted to interest receivable on bankdeposits or payable on bank overdraft positions that will be affected by fluctuations in interest rates.
The Fund’s main liability is the redemption of any shares that investors wish to sell. In general, the ACD manages the cash to ensure that itcan meet its liabilities. Assets from a Fund may need to be sold if insufficient cash is available to finance such redemptions. The Fund’sholdings are reviewed on a regular basis, with particular emphasis on the market capitalisation of the issuer (securities issued by largercapitalised companies generally have greater liquidity) and the number of days it would take to trade out of a given securities position orpercentage of the Fund as a whole (determined by reference to available market trading volumes). Funds that have a higher concentration ofsecurities that are deemed to be less liquid are regularly monitored.
As a proportion of the Fund’s investment portfolio is invested in overseas securities, the Balance Sheet can be affected by movements inforeign exchange rates. The Investment Manager may seek to manage exposure to currency movements by using forward foreign exchangecontracts or by hedging the sterling value of investments that are priced in other currencies. Income received in other currencies is convertedto sterling on or near the date of receipt.
The market value of investments is taken to equal ‘fair value’ for the purposes of Financial Reporting Standard 102. Given all the activities ofthe Fund, none of the investments held fall within the definition of ‘investments held for trading’ as set out in Financial Reporting Standard13.
Fair value of financial assets and financial liabilities
Derivatives and other financial instruments
GeneralIn pursuing its investment objectives, the Fund holds equity shares.The main risk arising from the Fund’s financial instruments is market-price risk. Market-price risk arises mainly from uncertainty about futureprices of the financial instruments held. Investment risk in the portfolio is regularly reviewed and controlled through the adoption ofparameters limiting exposures to various factors such as industries, countries, and company size.
The Fund has little exposure to credit or cash-flow risk. Certain transactions in securities that the Fund enters into expose it to the risk thatthe counter-party will not deliver the investment (purchase) or cash (sale) after the Fund has fulfilled its responsibilities. The Fund only buysand sells investments through brokers that have been approved by the Authorised Corporate Director as an acceptable counter-party. This listis reviewed quarterly. The Fund’s assets comprise mainly realisable securities that can be readily sold in normal market conditions.
Contingent liabilities and commitments
As at 31 July 2017, the Fund had no contingent liabilities (31/07/16: £nil) and no commitments (31/07/16: £nil).
The average portfolio dealing spread at the balance sheet date was 0.51% (31/07/2016: 0.52%).
Total costs 0.18 0.12
Average portfolio dealing spread
Commissions 0.08 0.05Taxes 0.10 0.07
Total transaction cost expressed as a percentage of average net asset value:
31 July 2017 31 July 2016% %
69
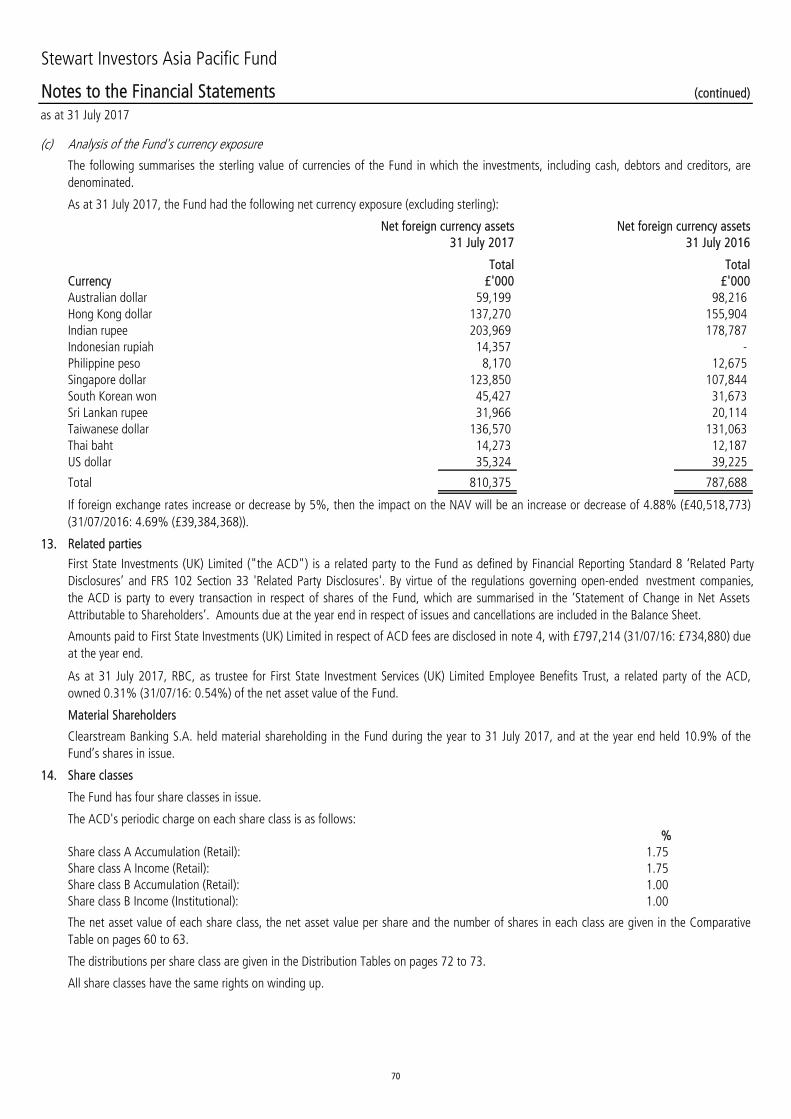
Notes to the Financial Statements (continued)
as at 31 July 2017
Stewart Investors Asia Pacific Fund
(c)
Total TotalCurrency £'000 £'000Australian dollar 59,199 98,216Hong Kong dollar 137,270 155,904Indian rupee 203,969 178,787Indonesian rupiah 14,357 -Philippine peso 8,170 12,675Singapore dollar 123,850 107,844South Korean won 45,427 31,673Sri Lankan rupee 31,966 20,114Taiwanese dollar 136,570 131,063Thai baht 14,273 12,187US dollar 35,324 39,225
Total 810,375 787,688
13.
14.
%1.751.751.001.00
All share classes have the same rights on winding up.
The net asset value of each share class, the net asset value per share and the number of shares in each class are given in the ComparativeTable on pages 60 to 63.
The distributions per share class are given in the Distribution Tables on pages 72 to 73.
The ACD's periodic charge on each share class is as follows:
Share class A Accumulation (Retail):Share class A Income (Retail):Share class B Accumulation (Retail):Share class B Income (Institutional):
Material Shareholders
Clearstream Banking S.A. held material shareholding in the Fund during the year to 31 July 2017, and at the year end held 10.9% of theFund’s shares in issue.
Share classes
The Fund has four share classes in issue.
Amounts paid to First State Investments (UK) Limited in respect of ACD fees are disclosed in note 4, with £797,214 (31/07/16: £734,880) due at the year end.
As at 31 July 2017, RBC, as trustee for First State Investment Services (UK) Limited Employee Benefits Trust, a related party of the ACD,owned 0.31% (31/07/16: 0.54%) of the net asset value of the Fund.
Related parties
First State Investments (UK) Limited ("the ACD") is a related party to the Fund as defined by Financial Reporting Standard 8 ‘Related Party Disclosures’ and FRS 102 Section 33 'Related Party Disclosures'. By virtue of the regulations governing open-ended investment companies, the ACD is party to every transaction in respect of shares of the Fund, which are summarised in the ‘Statement of Change in Net Assets Attributable to Shareholders’. Amounts due at the year end in respect of issues and cancellations are included in the Balance Sheet.
If foreign exchange rates increase or decrease by 5%, then the impact on the NAV will be an increase or decrease of 4.88% (£40,518,773)(31/07/2016: 4.69% (£39,384,368)).
The following summarises the sterling value of currencies of the Fund in which the investments, including cash, debtors and creditors, aredenominated.
As at 31 July 2017, the Fund had the following net currency exposure (excluding sterling):
Net foreign currency assets Net foreign currency assets31 July 2017 31 July 2016
Analysis of the Fund's currency exposure
70
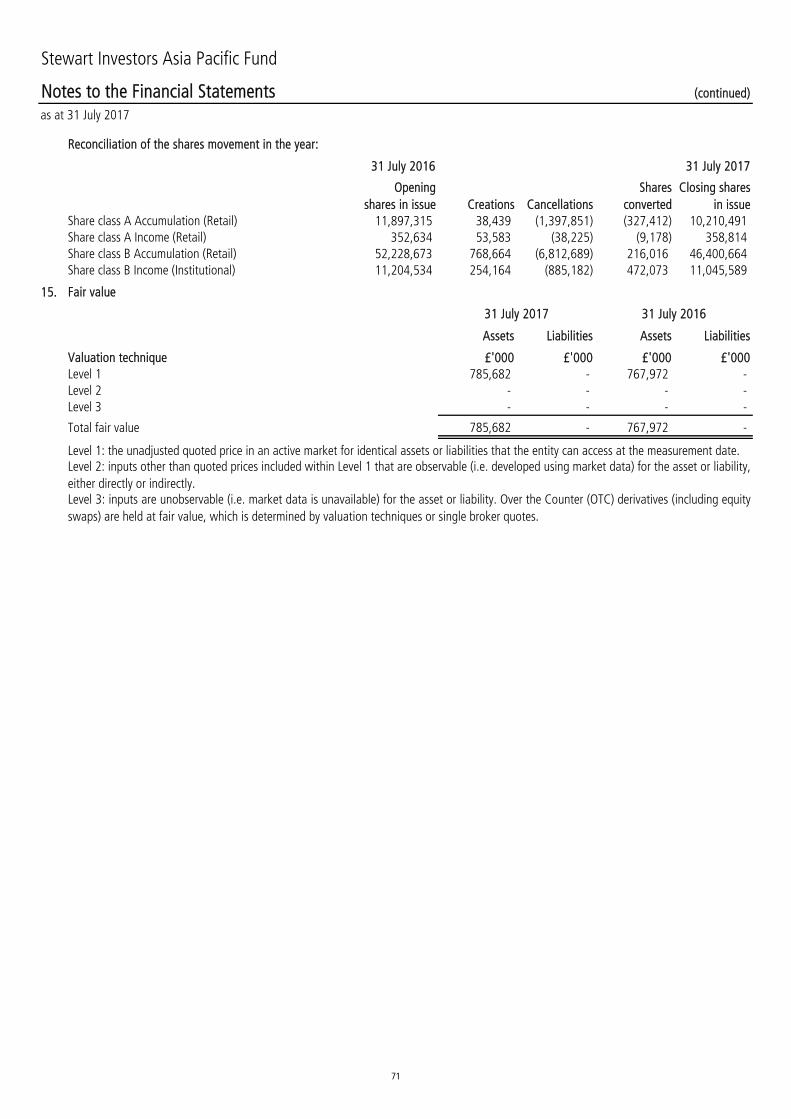
Notes to the Financial Statements (continued)
as at 31 July 2017
Stewart Investors Asia Pacific Fund
31 July 2016 31 July 2017
Opening shares in issue Creations Cancellations
Shares converted
Closing shares in issue
11,897,315 38,439 (1,397,851) (327,412) 10,210,491352,634 53,583 (38,225) (9,178) 358,814
52,228,673 768,664 (6,812,689) 216,016 46,400,66411,204,534 254,164 (885,182) 472,073 11,045,589
15.
Assets Liabilities Assets Liabilities
£'000 £'000 £'000 £'000785,682 - 767,972 -
- - - -- - - -
785,682 - 767,972 -
Level 3: inputs are unobservable (i.e. market data is unavailable) for the asset or liability. Over the Counter (OTC) derivatives (including equityswaps) are held at fair value, which is determined by valuation techniques or single broker quotes.
Level 1Level 2Level 3
Total fair value
Level 1: the unadjusted quoted price in an active market for identical assets or liabilities that the entity can access at the measurement date. Level 2: inputs other than quoted prices included within Level 1 that are observable (i.e. developed using market data) for the asset or liability,either directly or indirectly.
Fair value
Valuation technique
31 July 2017 31 July 2016
Share class B Income (Institutional)
Reconciliation of the shares movement in the year:
Share class A Accumulation (Retail)Share class A Income (Retail)Share class B Accumulation (Retail)
71
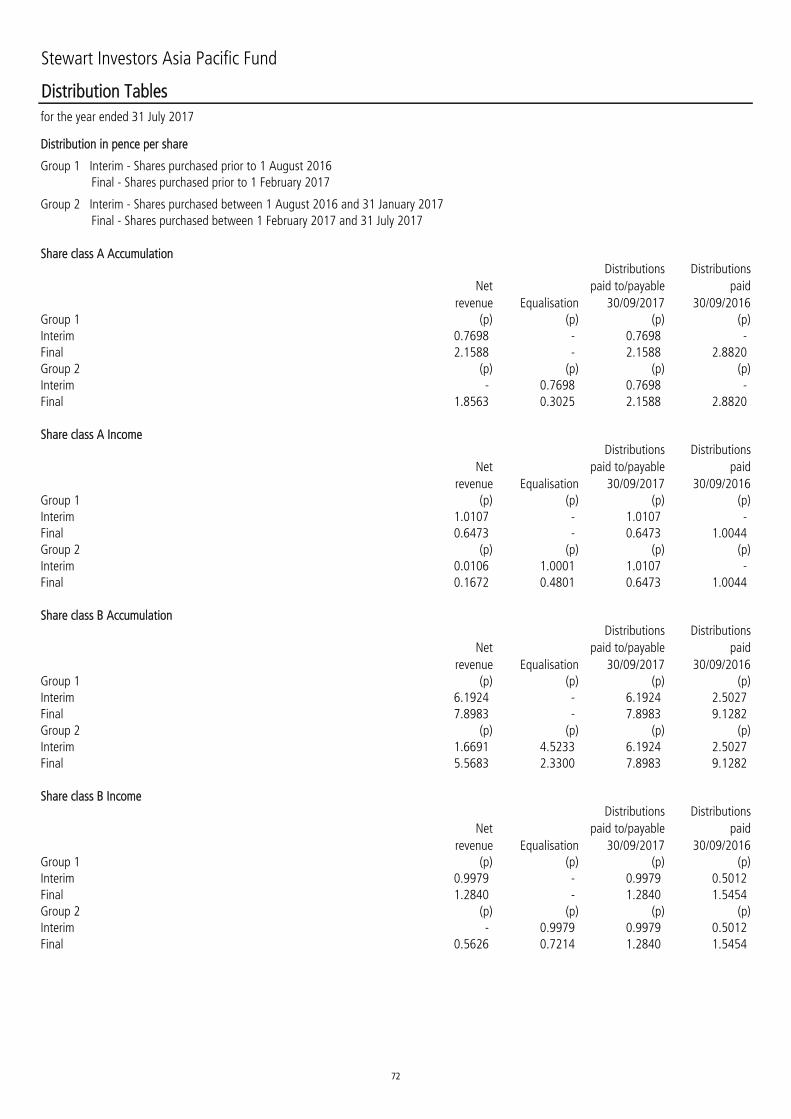
Share class A Accumulation
Netrevenue Equalisation
Distributions paid to/payable
30/09/2017
Distributions paid
30/09/2016Group 1 (p) (p) (p) (p)Interim 0.7698 - 0.7698 -Final 2.1588 - 2.1588 2.8820Group 2 (p) (p) (p) (p)Interim - 0.7698 0.7698 -Final 1.8563 0.3025 2.1588 2.8820
Share class A Income
Netrevenue Equalisation
Distributions paid to/payable
30/09/2017
Distributions paid
30/09/2016Group 1 (p) (p) (p) (p)Interim 1.0107 - 1.0107 -Final 0.6473 - 0.6473 1.0044Group 2 (p) (p) (p) (p)Interim 0.0106 1.0001 1.0107 -Final 0.1672 0.4801 0.6473 1.0044
Share class B Accumulation
Netrevenue Equalisation
Distributions paid to/payable
30/09/2017
Distributions paid
30/09/2016Group 1 (p) (p) (p) (p)Interim 6.1924 - 6.1924 2.5027Final 7.8983 - 7.8983 9.1282Group 2 (p) (p) (p) (p)Interim 1.6691 4.5233 6.1924 2.5027Final 5.5683 2.3300 7.8983 9.1282
Share class B Income
Netrevenue Equalisation
Distributions paid to/payable
30/09/2017
Distributions paid
30/09/2016Group 1 (p) (p) (p) (p)Interim 0.9979 - 0.9979 0.5012Final 1.2840 - 1.2840 1.5454Group 2 (p) (p) (p) (p)Interim - 0.9979 0.9979 0.5012Final 0.5626 0.7214 1.2840 1.5454
Final - Shares purchased between 1 February 2017 and 31 July 2017Group 2 Interim - Shares purchased between 1 August 2016 and 31 January 2017
Final - Shares purchased prior to 1 February 2017
Distribution in pence per share
Stewart Investors Asia Pacific Fund
Distribution Tablesfor the year ended 31 July 2017
Group 1 Interim - Shares purchased prior to 1 August 2016
72

Stewart Investors Asia Pacific Fund
Distribution Tables (continued)
for the year ended 31 July 2017
Shareholders should consult their professional advisers for any advice regarding their tax position.
Final - 100.00% of the dividend is received as franked investment income.
Final - 0.00% of the dividend is received as an annual payment (non-foreign element) received after the deduction of income tax at the lower rateand is liable to corporation tax. The tax deemed to be deducted is treated as income tax.
Final - 0.00% of the dividend is received as an annual payment (foreign element) received after the deduction of income tax at the lower rate and isliable to corporation tax. It is treated as foreign income in the hands of the corporate investor and is liable to corporation tax. The associateddeemed tax is treated as foreign tax in the hands of the investor, who may be able to claim double tax relief. Investors cannot reclaim any of thisdeemed tax on the foreign element from HM Revenue & Customs.
Interim - 100.00% of the dividend is received as franked investment income.
Interim - 0.00% of the dividend is received as an annual payment (non-foreign element) received after the deduction of income tax at the lowerrate and is liable to corporation tax. The tax deemed to be deducted is treated as income tax.
Interim - 0.00% of the dividend is received as an annual payment (foreign element) received after the deduction of income tax at the lower rate andis liable to corporation tax. It is treated as foreign income in the hands of the corporate investor and is liable to corporation tax. The associateddeemed tax is treated as foreign tax in the hands of the investor, who may be able to claim double tax relief. Investors cannot reclaim any of thisdeemed tax on the foreign element from HM Revenue & Customs.
Corporate tax for all share classes (unaudited)
A shareholder liable to corporation tax receives this distribution, excluding equalisation, as follows:
73
•
Risks and reward profile
Lower Risk Higher Risk
Potentially Lower Rewards Potentially Higher Rewards
1 2 3 4 5 6 7
1 2 3 4 5 6 7
1 2 3 4 5 6 7
1 2 3 4 5 6 7
1 2 3 4 5 6 7
1 2 3 4 5 6 7
1 2 3 4 5 6 7
1 2 3 4 5 6 7
Performance
The Fund rose by 9.7% in sterling terms over the year and has provided cumulative returns of 41.2% and 69.6% over three and five yearsrespectively to 31 July 2017.
Taiwan Semiconductor Manufacturing (Information Technology) rose as improving cash generation supported higher dividend payments, andOversea-Chinese Banking (Singapore: Financials) rebounded as stresses eased in its loans to the oil & gas sector. Kotak Mahindra Bank (Financials)gained as investors were attracted by this well-governed bank with a strong Balance Sheet and prudent lending policy.
On the negative side, Brambles (Australia: Industrials) declined due to a profit warning caused by competitive pressures in the US, and Lupin (India:Health Care) was weak on increasing concerns about profitability in the US. Li & Fung (Hong Kong: Consumer Discretionary) fell as the tradingenvironment for the company and its customers was challenging.
For further information on risks, please refer to the Risk Factors section in the Company's prospectus.
Emerging market risk: emerging markets may not provide the same level of investor protection as a developed market; they may involve a higherrisk than investing in developed markets.
Currency risk: the Fund invests in assets that are denominated in other currencies; changes in exchange rates will affect the value of the Fund.
• Even the lowest rating 1 does not mean a risk-free investment;
• On a scale of 1 (less risky) to 7 (more risky), this Fund has a rating of 5 due to its past performance and the nature of its investments. Shareswith a rating of 5 might have higher risks, but also higher returns;
• Risk is taken in order to make a higher potential return; the more risk a Fund takes, the higher the potential return but the greater the risk ofloss; and
• The value of the Fund and its return is not guaranteed and may fall as well as rise. You may get back less than you originally invested.
The Fund might also experience the following risks:
• The synthetic risk reward indicator (the SRRI) rating is not a measure of the risk of you losing your investment but describes how much the valueof the Fund went up and down in the past;
• The SRRI rating is based on historical data, which may not be a reliable indication of the future risks and rewards of the Fund;
• We cannot guarantee that the rating of the Fund will remain the same; it may change over time;
Share class A Accumulation (EUR share class)
Share class A Income (EUR share class)
Share class B Accumulation (EUR share class)
Share class B Income (EUR share class)
Share class A Accumulation
Share class A Income
Share class B Accumulation
Share class B Income
The Fund aims to achieve long-term capital growth.
The Fund invests in large and mid-capitalisation equities issued by companies that are incorporated or listed, or which conduct the majority of theireconomic activity, in the Asia Pacific region (excluding Japan, including Australasia).
Particular consideration is given to investment in companies that are positioned to benefit from, and contribute to, the sustainable development ofthe countries in which they operate.
Clarification point: Large and mid-capitalisation typically refers to equities with a minimum market capitalisation of US$1 billion and aminimum free float of US$500 million. “Australasia” refers to Australia, New Zealand and other South-East Asian countries.
Stewart Investors Asia Pacific Leaders Fund
Authorised Fund Manager's Reportfor the year ended 31 July 2017
Investment Objective and Policy
74
(continued)
Stewart Investors Asia Pacific Leaders Fund
Authorised Fund Manager's Reportfor the year ended 31 July 2017
Time 3 6 1 3 5 10 Sinceperiod mths mths yr yrs yrs yrs launch
3.2 6.4 9.7 41.2 69.6 185.9 527.5 7.9 13.7 25.4 44.8 72.3 124.2 382.3 7.2 12.0 22.3 46.6 73.7 123.4 382.2
4 4 4 3 3 1 1
12 mths to 12 mths to 12 mths to 12 mths to 12 mths to31/07/17 31/07/16 31/07/15 31/07/14 31/07/13
9.7 17.0 10.1 5.3 14.1
31 July 2017 31 July 2016% of Fund % of Fund
6.67 6.175.40 6.054.86 5.444.49 5.063.88 3.963.43 3.203.37 3.143.10 2.982.96 2.742.94 2.68
Portfolio changes
Significant purchases over the year included Expeditors (US: Industrials), one of the world’s leading freight forwarding and logistic companies, andHoya (Japan: Health Care), an optical technology manufacturer, managed by the third generation of the founding family, with a diverse andresilient culture. The Fund also bought Cipla (India: Health Care), one of India’s oldest family-owned pharmaceutical companies, which has aconservative Balance Sheet and new management.
The Fund sold Infosys Technologies (India: Information Technology) because of concerns about a deterioration of corporate governance and LinkREIT (Hong Kong: Real Estate) on valuation concerns. The Fund also sold Cathay Pacific Airways (Hong Kong: Industrials) because of worries aboutincreasing competition.
Outlook
The Manager remains concerned about political instability in the region and across the world. The health of the Chinese economy, where debtlevels are very high and have risen rapidly in a relatively short period of time, is another worry. The Manager is also concerned about rising politicalrisk in China, but remains positive about the long-term potential for improvement at a company level in terms of corporate governance. There arestill insufficient opportunities in the Asia Pacific Region at present valuations.
Cumulative performance as at 31 July 2017
Fund return %
TimeperiodFund return %
Benchmark: MSCI Asia Pacific (ex-Japan) Index.Sector: IA Asia Pacific (ex-Japan).
Benchmark return %Sector return %Quartile ranking
Discrete performance as at 31 July 2017
Stock name Stock nameOversea-Chinese Banking Taiwan Semiconductor Manufacturing
Past performance should not be used as a guide to future performance, which is not guaranteed.
Ten largest holdings
Kotak Mahindra Bank UnicharmAsustek Computer Asustek ComputerHong Kong & China Gas Tata Consultancy Services
Unicharm BramblesTata Consultancy Services CSLTaiwan Semiconductor Manufacturing Oversea-Chinese Banking
Types of sharesIncome and Accumulation.
CK Hutchison Holdings Hong Kong & China GasCSL CK Hutchison HoldingsMahindra & Mahindra Kotak Mahindra Bank
75

Holdings
MarketValue£'000
TotalNet Assets
%
UNITED STATES (1.03%*) 200,001 2.091,883,380 Expeditors International of Washington 84,353 0.881,961,186 ResMed 115,648 1.21
JAPAN (3.97%*) 703,022 7.382,666,400 Hoya 114,304 1.202,545,300 Nippon Paint Holdings 74,543 0.78
26,380,200 Unicharm 514,175 5.40
AUSTRALIA (12.60%*) 551,786 5.7948,001,460 Brambles 269,402 2.83
3,691,497 CSL 282,384 2.96
CHINA (1.48%*) 153,709 1.61103,656,000 China Mengniu Dairy 153,709 1.61
HONG KONG (14.60%*) 1,111,322 11.6730,698,600 AIA Group 184,185 1.9310,147,800 ASM Pacific Technology 100,089 1.0529,420,436 CK Hutchison Holdings 295,055 3.10
222,881,814 Hong Kong & China Gas 320,938 3.37457,736,000 Li & Fung 127,268 1.34
26,755,500 Yue Yuen Industrial Holdings 83,787 0.88
INDIA (27.02%*) 2,920,558 30.6522,132,075 Cipla 147,500 1.55
1,830,437 Colgate-Palmolive India 23,501 0.2521,822,618 Dabur India 80,080 0.84
5,377,008 Dr Reddy's Laboratories 151,730 1.591,108,174 Dr Reddy's Laboratories ADR 31,082 0.33
15,810,506 Godrej Consumer Products 194,598 2.0413,015,764 Housing Development Finance 276,340 2.90
116,671,993 Idea Cellular 127,977 1.3430,435,940 Kotak Mahindra Bank 369,821 3.8810,956,806 Lupin 134,175 1.4116,790,782 Mahindra & Mahindra 280,405 2.9453,225,033 Marico 210,549 2.2115,643,444 Tata Consultancy Services 463,197 4.8647,829,519 Tech Mahindra 218,690 2.3061,603,466 Wipro 210,913 2.21
INDONESIA (0.00%*) 74,574 0.78755,959,900 Kalbe Farma 74,574 0.78
PHILIPPINES (3.31%*) 309,777 3.2612,882,900 Ayala 168,274 1.7789,587,730 Bank of the Philippine Islands 141,503 1.49
SINGAPORE (6.28%*) 855,313 8.9835,848,000 Dairy Farm International Holdings 219,611 2.3199,682,115 Oversea-Chinese Banking 635,702 6.67
SOUTH KOREA (2.29%*) 279,250 2.931,974,013 LG 101,211 1.064,933,492 Shinhan Financial Group 178,039 1.87
Stewart Investors Asia Pacific Leaders Fund
Portfolio Statementas at 31 July 2017
76
Holdings
MarketValue£'000
TotalNet Assets
%
Stewart Investors Asia Pacific Leaders Fund
Portfolio Statement (continued)
as at 31 July 2017
TAIWAN (18.15%*) 1,641,457 17.2346,193,000 Asustek Computer 326,965 3.4366,269,622 Delta Electronics 267,563 2.81
432,763,911 E.Sun Financial Holding 210,219 2.2123,849,000 Giant Manufacturing 89,068 0.9322,557,000 MediaTek 151,410 1.5926,099,208 President Chain Store 168,601 1.7779,188,807 Taiwan Semiconductor Manufacturing 427,631 4.49
Portfolio of investments 8,800,769 92.37
Net other assets 726,565 7.63
Total net assets 9,527,334 100.00
Stocks shown as ADRs represent American Depositary Receipts.
All investments held are listed, unless otherwise stated.
* Comparative figures shown in brackets relate to 31 July 2016.For the purposes of the portfolio holdings analysis, securities are shown based on their country of listing.
77
Share class A Accumulation
Change in net assets per share
Opening net asset value per share
Return before operating charges*
Operating charges
Return after operating charges*
Distributions
Retained distributions on accumulation shares
Closing net asset value per share (p)
* after direct transaction costs of:
Performance
Return after charges (%)
Other information
Closing net asset value (£’000)
Closing number of shares
Operating charges
Direct transaction costs
Prices
Highest share price
Lowest share price 552.44 430.34 437.27
0.06% 0.06% 0.14%
638.80 576.08 551.03
1.55% 1.54% 1.55%
952,236 1,094,801 1,430,800
151,871,481 191,583,486 292,903,909
9.72% 16.98% 10.04%
627.00 571.45 488.49
0.36 0.31 0.68
1.80 3.26 (1.26)
55.55 82.96 44.55
(1.80) (3.26) 1.26
64.83 90.41 52.10
(9.28) (7.45) (7.55)
571.45 488.49 443.94
Stewart Investors Asia Pacific Leaders Fund
Comparative Tablefor the year ended 31 July 2017
Net Asset Value and Ongoing Charges Figure
Final 31 July 2017(p)
Final 31 July 2016(p)
Final 31 July 2015(p)
78

Stewart Investors Asia Pacific Leaders Fund
Comparative Table (continued)
for the year ended 31 July 2017
Net Asset Value and Ongoing Charges Figure
Share class A Income
Change in net assets per share
Opening net asset value per share
Return before operating charges*
Operating charges
Return after operating charges*
Distributions
Closing net asset value per share (p)
* after direct transaction costs of:
Performance
Return after charges (%)
Other information
Closing net asset value (£’000)
Closing number of shares
Operating charges
Direct transaction costs
Prices
Highest share price
Lowest share price 190.67 149.42 152.22
0.06% 0.06% 0.14%
220.40 199.81 191.76
1.61% 1.61% 1.61%
17,769 17,429 27,737
8,234,156 8,835,101 16,352,568
9.65% 16.89% 9.97%
215.80 197.27 169.62
0.12 0.11 0.24
19.04 28.65 15.41
(0.51) (1.00) (0.34)
22.38 31.34 18.14
(3.34) (2.69) (2.73)
197.27 169.62 154.55
Final 31 July 2017(p)
Final 31 July 2016(p)
Final 31 July 2015(p)
79

Stewart Investors Asia Pacific Leaders Fund
Comparative Table (continued)
for the year ended 31 July 2017
Net Asset Value and Ongoing Charges Figure
Share class B Accumulation
Change in net assets per share
Opening net asset value per share
Return before operating charges*
Operating charges
Return after operating charges*
Distributions
Retained distributions on accumulation shares
Closing net asset value per share (p)
* after direct transaction costs of:
Performance
Return after charges (%)
Other information
Closing net asset value (£’000)
Closing number of shares
Operating charges
Direct transaction costs
Prices
Highest share price
Lowest share price 596.69 460.89 465.12
0.06% 0.06% 0.14%
692.42 620.75 588.75
0.89% 0.89% 0.90%
6,382,297 6,164,056 4,668,235
938,383,441 1,001,003,678 892,673,897
10.45% 17.75% 10.76%
680.14 615.79 522.95
0.39 0.34 0.73
6.29 6.94 4.96
64.35 92.84 50.79
(6.29) (6.94) (4.96)
70.13 97.47 55.49
(5.78) (4.63) (4.70)
615.79 522.95 472.16
Final 31 July 2017(p)
Final 31 July 2016(p)
Final 31 July 2015(p)
80
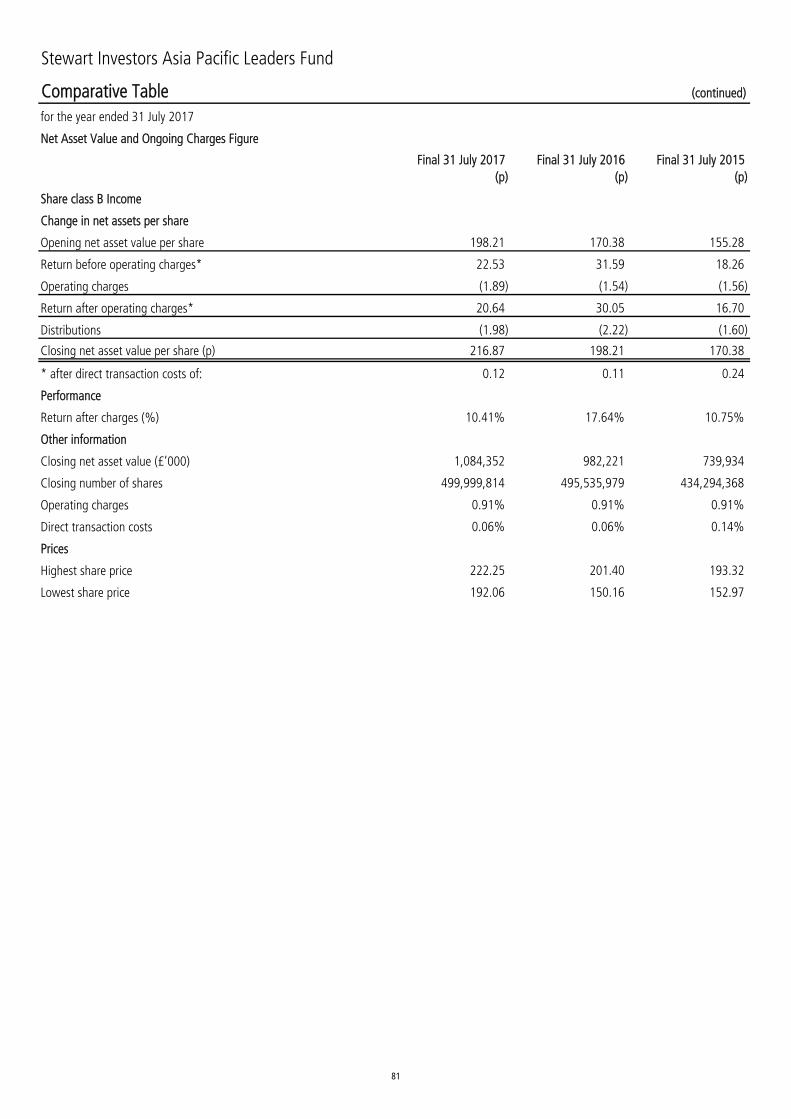
Stewart Investors Asia Pacific Leaders Fund
Comparative Table (continued)
for the year ended 31 July 2017
Net Asset Value and Ongoing Charges Figure
Share class B Income
Change in net assets per share
Opening net asset value per share
Return before operating charges*
Operating charges
Return after operating charges*
Distributions
Closing net asset value per share (p)
* after direct transaction costs of:
Performance
Return after charges (%)
Other information
Closing net asset value (£’000)
Closing number of shares
Operating charges
Direct transaction costs
Prices
Highest share price
Lowest share price 192.06 150.16 152.97
0.06% 0.06% 0.14%
222.25 201.40 193.32
0.91% 0.91% 0.91%
1,084,352 982,221 739,934
499,999,814 495,535,979 434,294,368
10.41% 17.64% 10.75%
216.87 198.21 170.38
0.12 0.11 0.24
20.64 30.05 16.70
(1.98) (2.22) (1.60)
22.53 31.59 18.26
(1.89) (1.54) (1.56)
198.21 170.38 155.28
Final 31 July 2017(p)
Final 31 July 2016(p)
Final 31 July 2015(p)
81

Stewart Investors Asia Pacific Leaders Fund
Comparative Table (continued)
for the year ended 31 July 2017
Net Asset Value and Ongoing Charges Figure
Share class A Accumulation (EUR share class)
Change in net assets per share
Opening net asset value per share
Return before operating charges*
Operating charges
Return after operating charges*
Distributions
Retained distributions on accumulation shares
Closing net asset value per share (c)
* after direct transaction costs of:
Performance
Return after charges (%)
Other information
Closing net asset value (€’000)
Closing number of shares
Operating charges
Direct transaction costs
Prices
Highest share price
Lowest share price 208.25 181.21 173.81
0.06% 0.06% 0.14%
233.60 221.11 242.08
1.55% 1.55% 1.55%
198,132 255,108 364,766
89,178,178 118,828,488 166,151,750
3.49% (2.21)% 23.78%
222.18 214.69 219.54
0.13 0.13 0.29
0.63 1.24 0.66
7.49 (4.85) 42.18
(0.63) (1.24) (0.66)
10.90 (1.72) 45.37
(3.41) (3.13) (3.19)
214.69 219.54 177.36
Final 31 July 2017(c)
Final 31 July 2016(c)
Final 31 July 2015(c)
82
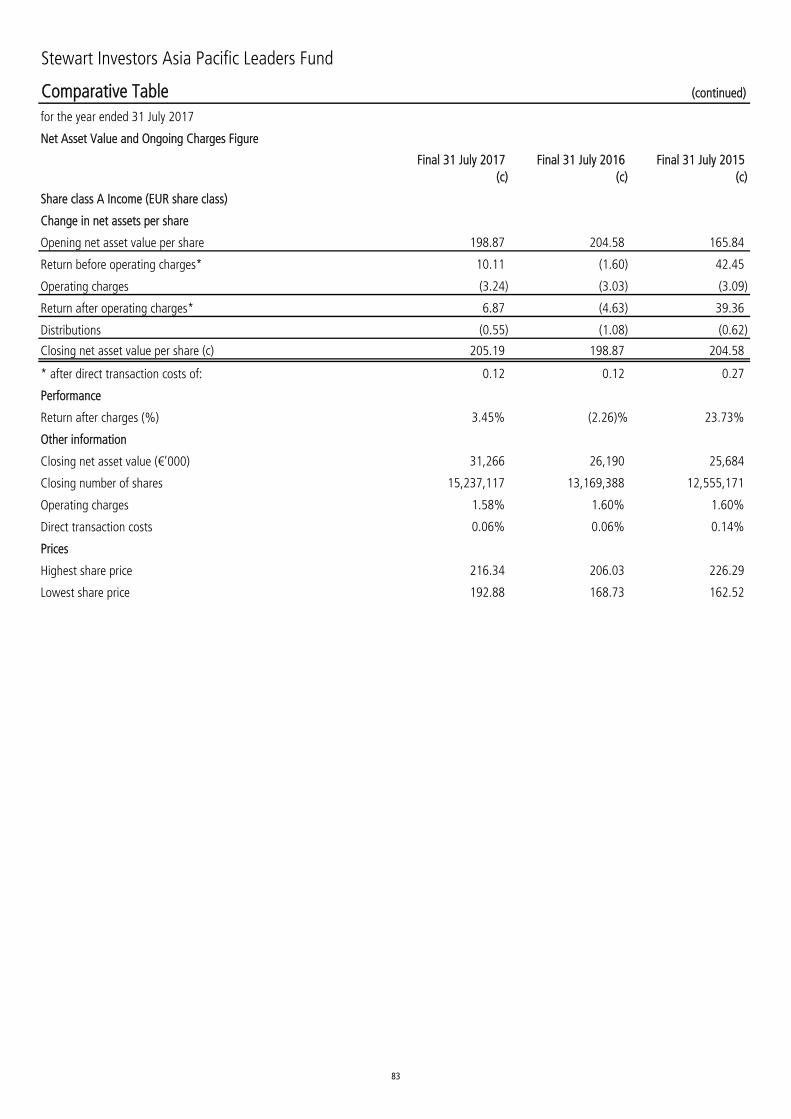
Stewart Investors Asia Pacific Leaders Fund
Comparative Table (continued)
for the year ended 31 July 2017
Net Asset Value and Ongoing Charges Figure
Share class A Income (EUR share class)
Change in net assets per share
Opening net asset value per share
Return before operating charges*
Operating charges
Return after operating charges*
Distributions
Closing net asset value per share (c)
* after direct transaction costs of:
Performance
Return after charges (%)
Other information
Closing net asset value (€’000)
Closing number of shares
Operating charges
Direct transaction costs
Prices
Highest share price
Lowest share price 192.88 168.73 162.52
0.06% 0.06% 0.14%
216.34 206.03 226.29
1.58% 1.60% 1.60%
31,266 26,190 25,684
15,237,117 13,169,388 12,555,171
3.45% (2.26)% 23.73%
205.19 198.87 204.58
0.12 0.12 0.27
6.87 (4.63) 39.36
(0.55) (1.08) (0.62)
10.11 (1.60) 42.45
(3.24) (3.03) (3.09)
198.87 204.58 165.84
Final 31 July 2017(c)
Final 31 July 2016(c)
Final 31 July 2015(c)
83
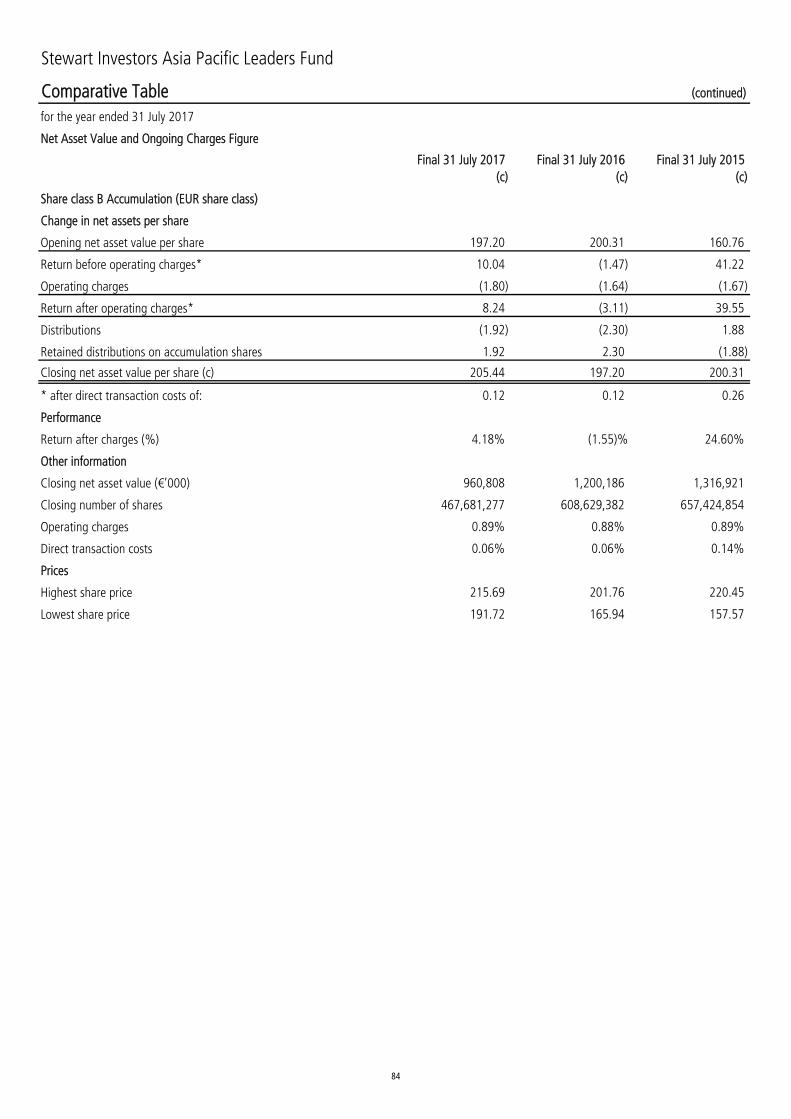
Stewart Investors Asia Pacific Leaders Fund
Comparative Table (continued)
for the year ended 31 July 2017
Net Asset Value and Ongoing Charges Figure
Share class B Accumulation (EUR share class)
Change in net assets per share
Opening net asset value per share
Return before operating charges*
Operating charges
Return after operating charges*
Distributions
Retained distributions on accumulation shares
Closing net asset value per share (c)
* after direct transaction costs of:
Performance
Return after charges (%)
Other information
Closing net asset value (€’000)
Closing number of shares
Operating charges
Direct transaction costs
Prices
Highest share price
Lowest share price 191.72 165.94 157.57
0.06% 0.06% 0.14%
215.69 201.76 220.45
0.89% 0.88% 0.89%
960,808 1,200,186 1,316,921
467,681,277 608,629,382 657,424,854
4.18% (1.55)% 24.60%
205.44 197.20 200.31
0.12 0.12 0.26
1.92 2.30 (1.88)
8.24 (3.11) 39.55
(1.92) (2.30) 1.88
10.04 (1.47) 41.22
(1.80) (1.64) (1.67)
197.20 200.31 160.76
Final 31 July 2017(c)
Final 31 July 2016(c)
Final 31 July 2015(c)
84

Stewart Investors Asia Pacific Leaders Fund
Comparative Table (continued)
for the year ended 31 July 2017
Net Asset Value and Ongoing Charges Figure
Share class B Income (EUR share class)
Change in net assets per share
Opening net asset value per share
Return before operating charges*
Operating charges
Return after operating charges*
Distributions
Closing net asset value per share (c)
* after direct transaction costs of:
Performance
Return after charges (%)
Other information
Closing net asset value (€’000)
Closing number of shares
Operating charges
Direct transaction costs
Prices
Highest share price
Lowest share price 140.56 122.64 118.04
0.06% 0.06% 0.14%
157.69 149.73 164.88
0.88% 0.87% 0.90%
29,830 18,014 24,576
19,993,210 12,460,278 16,532,526
4.18% (1.59)% 24.60%
149.20 144.58 148.66
0.09 0.09 0.20
6.04 (2.37) 29.63
(1.42) (1.71) (1.41)
7.35 (1.18) 30.92
(1.31) (1.19) (1.29)
144.58 148.66 120.44
Final 31 July 2017(c)
Final 31 July 2016(c)
Final 31 July 2015(c)
85
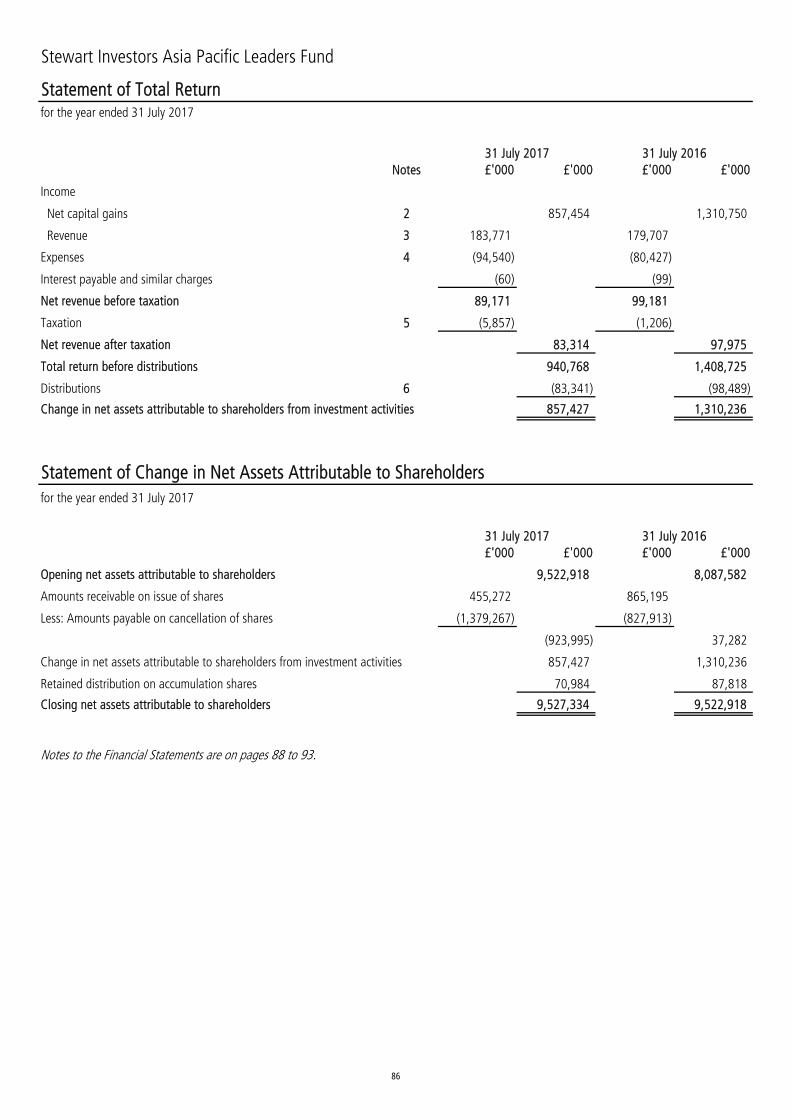
Notes £'000 £'000 £'000 £'000
Net capital gains 2 857,454 1,310,750
Revenue 3 183,771 179,707
4 (94,540) (80,427)
Interest payable and similar charges (60) (99)
89,171 99,181
5 (5,857) (1,206)
83,314 97,975
940,768 1,408,725
6 (83,341) (98,489)
857,427 1,310,236
£'000 £'000 £'000 £'000
9,522,918 8,087,582
455,272 865,195
(1,379,267) (827,913)
(923,995) 37,282
857,427 1,310,236
70,984 87,818
9,527,334 9,522,918
Less: Amounts payable on cancellation of shares
Change in net assets attributable to shareholders from investment activities
Retained distribution on accumulation shares
Closing net assets attributable to shareholders
Notes to the Financial Statements are on pages 88 to 93.
Amounts receivable on issue of shares
for the year ended 31 July 2017
31 July 2017 31 July 2016
Opening net assets attributable to shareholders
Statement of Change in Net Assets Attributable to Shareholders
Income
Expenses
Net revenue before taxation
Taxation
Net revenue after taxation
Total return before distributions
Distributions
Change in net assets attributable to shareholders from investment activities
31 July 2017 31 July 2016
Stewart Investors Asia Pacific Leaders Fund
Statement of Total Returnfor the year ended 31 July 2017
86
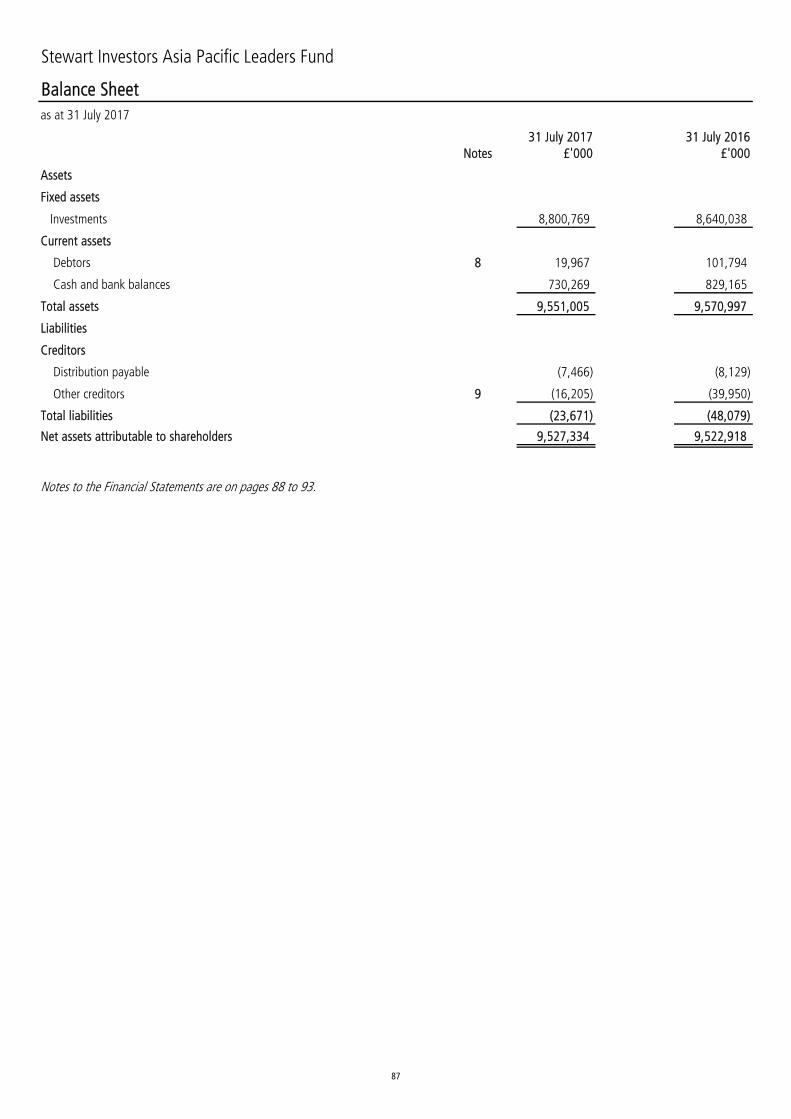
Stewart Investors Asia Pacific Leaders Fund
31 July 2017 31 July 2016Notes £'000 £'000
Investments 8,800,769 8,640,038
Current assets
8 19,967 101,794
730,269 829,165
9,551,005 9,570,997
Creditors
(7,466) (8,129)
Other creditors 9 (16,205) (39,950)
(23,671) (48,079)
9,527,334 9,522,918
Notes to the Financial Statements are on pages 88 to 93.
Distribution payable
Total liabilities
Net assets attributable to shareholders
Balance Sheetas at 31 July 2017
Assets
Fixed assets
Debtors
Cash and bank balances
Total assets
Liabilities
87
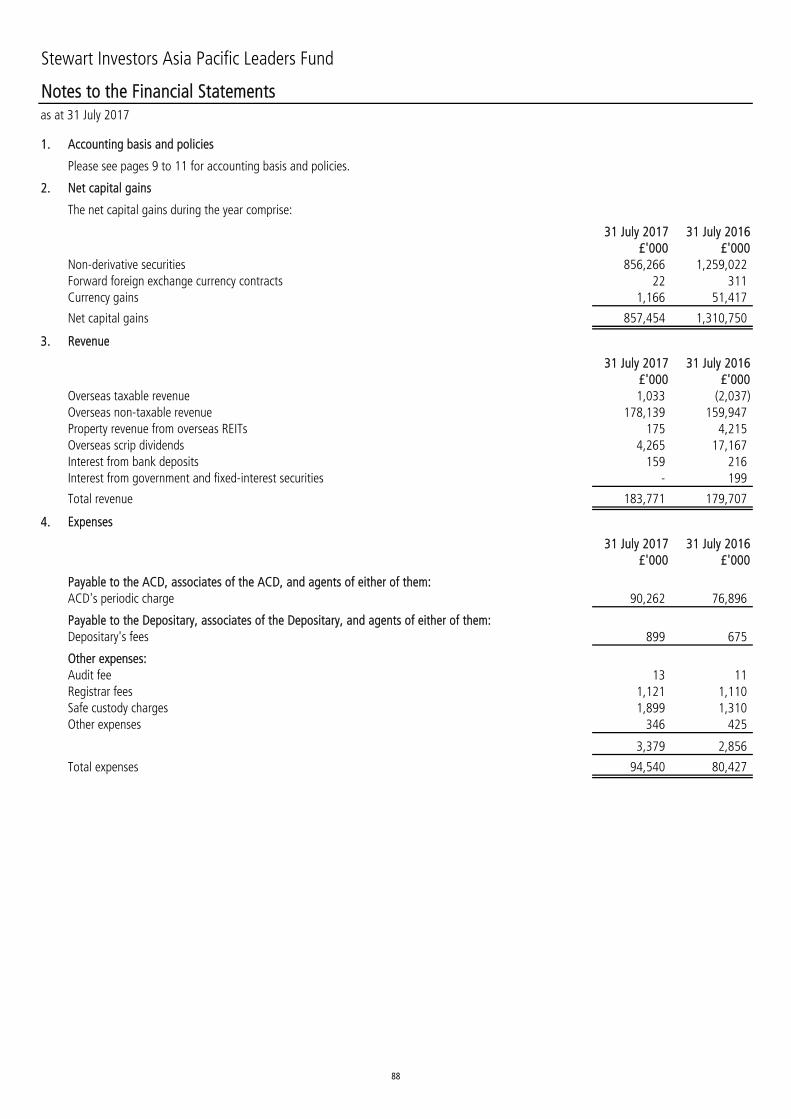
1.
2.
31 July 2017 31 July 2016£'000 £'000
856,266 1,259,02222 311
1,166 51,417
857,454 1,310,750
3.
31 July 2017 31 July 2016£'000 £'0001,033 (2,037)
178,139 159,947175 4,215
4,265 17,167159 216
- 199
183,771 179,707
4.
31 July 2017 31 July 2016£'000 £'000
90,262 76,896
899 675
13 111,121 1,1101,899 1,310
346 425
3,379 2,856
94,540 80,427Total expenses
Audit feeRegistrar feesSafe custody chargesOther expenses
Other expenses:
Payable to the Depositary, associates of the Depositary, and agents of either of them:Depositary's fees
Expenses
Payable to the ACD, associates of the ACD, and agents of either of them:ACD's periodic charge
Total revenue
Interest from bank depositsInterest from government and fixed-interest securities
Property revenue from overseas REITsOverseas scrip dividends
Overseas taxable revenueOverseas non-taxable revenue
Net capital gains
Revenue
Forward foreign exchange currency contractsCurrency gains
Accounting basis and policies
Please see pages 9 to 11 for accounting basis and policies.
Net capital gains
The net capital gains during the year comprise:
Non-derivative securities
Notes to the Financial Statementsas at 31 July 2017
Stewart Investors Asia Pacific Leaders Fund
88
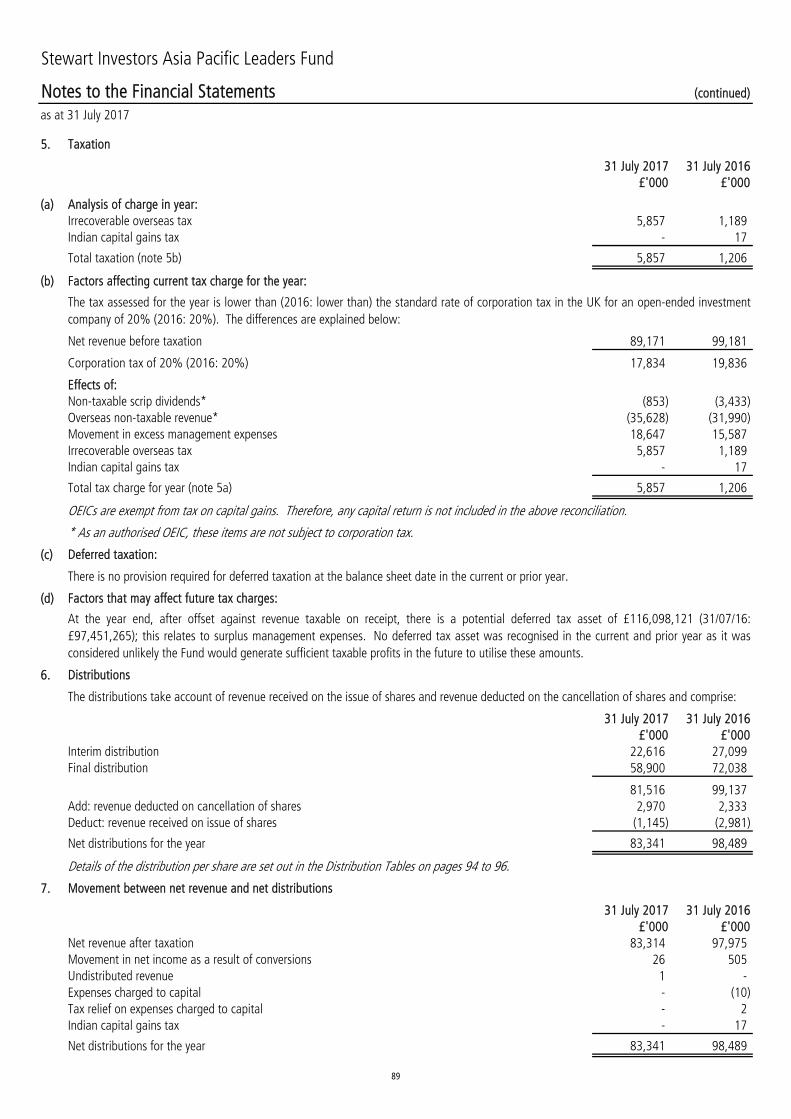
Notes to the Financial Statements (continued)
as at 31 July 2017
Stewart Investors Asia Pacific Leaders Fund
5.
31 July 2017 31 July 2016£'000 £'000
(a)5,857 1,189
- 17
5,857 1,206
(b)
89,171 99,181
17,834 19,836
(853) (3,433)(35,628) (31,990)18,647 15,587
5,857 1,189- 17
5,857 1,206
(c)
(d)
6.
31 July 2017 31 July 2016£'000 £'000
22,616 27,09958,900 72,038
81,516 99,1372,970 2,333
(1,145) (2,981)
83,341 98,489
7.
31 July 2017 31 July 2016£'000 £'000
83,314 97,97526 505
1 -Expenses charged to capital - (10)Tax relief on expenses charged to capital - 2Indian capital gains tax - 17
83,341 98,489
Movement in net income as a result of conversionsUndistributed revenue
Net distributions for the year
Details of the distribution per share are set out in the Distribution Tables on pages 94 to 96.
Movement between net revenue and net distributions
Net revenue after taxation
Add: revenue deducted on cancellation of sharesDeduct: revenue received on issue of shares
Net distributions for the year
Final distributionInterim distribution
Distributions
The distributions take account of revenue received on the issue of shares and revenue deducted on the cancellation of shares and comprise:
Factors that may affect future tax charges:
At the year end, after offset against revenue taxable on receipt, there is a potential deferred tax asset of £116,098,121 (31/07/16:£97,451,265); this relates to surplus management expenses. No deferred tax asset was recognised in the current and prior year as it wasconsidered unlikely the Fund would generate sufficient taxable profits in the future to utilise these amounts.
Deferred taxation:
There is no provision required for deferred taxation at the balance sheet date in the current or prior year.
Total tax charge for year (note 5a)
OEICs are exempt from tax on capital gains. Therefore, any capital return is not included in the above reconciliation.
* As an authorised OEIC, these items are not subject to corporation tax.
Indian capital gains tax
Movement in excess management expensesIrrecoverable overseas tax
Non-taxable scrip dividends*Overseas non-taxable revenue*
Net revenue before taxation
Corporation tax of 20% (2016: 20%)
Effects of:
Total taxation (note 5b)
Factors affecting current tax charge for the year:
The tax assessed for the year is lower than (2016: lower than) the standard rate of corporation tax in the UK for an open-ended investmentcompany of 20% (2016: 20%). The differences are explained below:
Indian capital gains taxIrrecoverable overseas taxAnalysis of charge in year:
Taxation
89
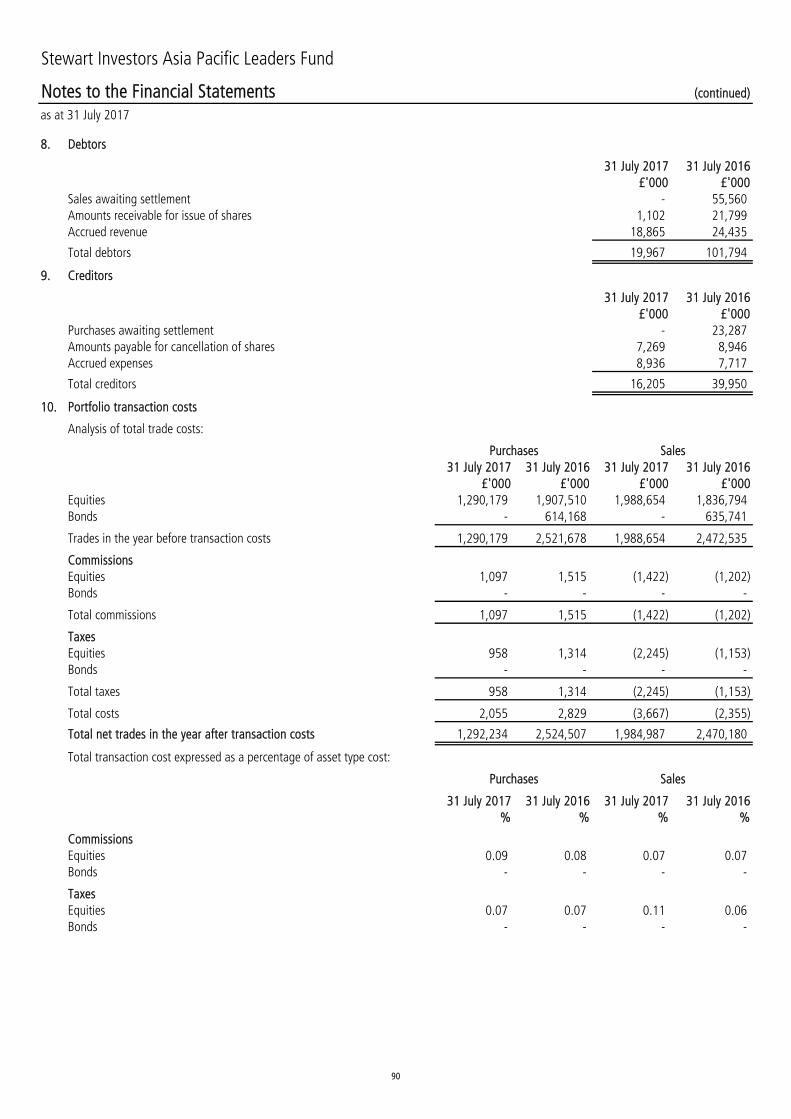
Notes to the Financial Statements (continued)
as at 31 July 2017
Stewart Investors Asia Pacific Leaders Fund
8.
31 July 2017 31 July 2016£'000 £'000
- 55,5601,102 21,799
18,865 24,435
19,967 101,794
9.
31 July 2017 31 July 2016£'000 £'000
- 23,2877,269 8,9468,936 7,717
16,205 39,950
10.
31 July 2017 31 July 2016 31 July 2017 31 July 2016£'000 £'000 £'000 £'000
1,290,179 1,907,510 1,988,654 1,836,794- 614,168 - 635,741
1,290,179 2,521,678 1,988,654 2,472,535
1,097 1,515 (1,422) (1,202)- - - -
1,097 1,515 (1,422) (1,202)
958 1,314 (2,245) (1,153)- - - -
958 1,314 (2,245) (1,153)
2,055 2,829 (3,667) (2,355)
1,292,234 2,524,507 1,984,987 2,470,180
31 July 2017 31 July 2016 31 July 2017 31 July 2016% % % %
0.09 0.08 0.07 0.07- - - -
0.07 0.07 0.11 0.06- - - -
EquitiesBonds
Taxes
CommissionsEquitiesBonds
Total transaction cost expressed as a percentage of asset type cost:
Purchases Sales
Total taxes
Total costs
Total net trades in the year after transaction costs
Total commissions
TaxesEquitiesBonds
Trades in the year before transaction costs
CommissionsEquitiesBonds
Analysis of total trade costs:
Purchases Sales
EquitiesBonds
Total creditors
Portfolio transaction costs
Purchases awaiting settlementAmounts payable for cancellation of sharesAccrued expenses
Creditors
Total debtors
Amounts receivable for issue of sharesAccrued revenue
Debtors
Sales awaiting settlement
90
Notes to the Financial Statements (continued)
as at 31 July 2017
Stewart Investors Asia Pacific Leaders Fund
11.
12.
(a)
(b)
As at 31 July 2017, 7.66% (31/07/2016: 8.71%) of the Fund's assets were interest-bearing.
As at 31 July 2017, if interest rates increase or decrease by 0.25%, with all other variables remaining constant, the resulting change in thenet assets attributable to shareholders of the Stewart Investors Asia Pacific Leaders Fund would be an increase or decrease of approximately£1,825,672 (31/07/16: £2,072,799).
There is no material difference between the value of the financial assets and liabilities, as shown in the Balance Sheet, and their fair value.
If market prices increase or decrease by 10%, then the impact on the portfolio will be an increase or decrease of 10% (£880,076,868)(31/07/16: £864,003,813).
Interest-rate risk
The Fund does not invest in either fixed or floating-rate securities, and interest-rate risk exposure is restricted to interest receivable on bankdeposits or payable on bank overdraft positions that will be affected by fluctuations in interest rates.
The Fund’s main liability is the redemption of any shares that investors wish to sell. In general, the ACD manages the cash to ensure that itcan meet its liabilities. Assets from a Fund may need to be sold if insufficient cash is available to finance such redemptions. The Fund’sholdings are reviewed on a regular basis, with particular emphasis on the market capitalisation of the issuer (securities issued by largercapitalised companies generally have greater liquidity) and the number of days it would take to trade out of a given securities position orpercentage of the Fund as a whole (determined by reference to available market trading volumes). Funds that have a higher concentration ofsecurities that are deemed to be less liquid are regularly monitored.
As a proportion of the Fund’s investment portfolio is invested in overseas securities, the Balance Sheet can be affected by movements inforeign exchange rates. The Investment Manager may seek to manage exposure to currency movements by using forward foreign exchangecontracts or by hedging the sterling value of investments that are priced in other currencies. Income received in other currencies is convertedto sterling on or near the date of receipt.
The market value of investments is taken to equal ‘fair value’ for the purposes of Financial Reporting Standard 102. Given all the activities ofthe Fund, none of the investments held fall within the definition of ‘investments held for trading’ as set out in Financial Reporting Standard13.
Fair value of financial assets and financial liabilities
Derivatives and other financial instruments
General
In pursuing its investment objectives, the Fund holds equity shares.
The main risk arising from the Fund’s financial instruments is market-price risk. Market-price risk arises mainly from uncertainty about futureprices of the financial instruments held. Investment risk in the portfolio is regularly reviewed and controlled through the adoption ofparameters limiting exposures to various factors such as industries, countries, and company size.
The Fund has little exposure to credit or cash-flow risk. Certain transactions in securities that the Fund enters into expose it to the risk thatthe counter-party will not deliver the investment (purchase) or cash (sale) after the Fund has fulfilled its responsibilities. The Fund only buysand sells investments through brokers that have been approved by the Authorised Corporate Director as an acceptable counter-party. This listis reviewed quarterly. The Fund’s assets comprise mainly realisable securities that can be readily sold in normal market conditions.
Contingent liabilities and commitments
As at 31 July 2017, the Fund had no contingent liabilities (31/07/16: £nil) and no commitments (31/07/16: £nil).
The average portfolio dealing spread at the balance sheet date was 0.16% (31/07/2016: 0.24%).
Total costs 0.06 0.06
Average portfolio dealing spread
Commissions 0.03 0.03Taxes 0.03 0.03
Total transaction cost expressed as a percentage of average net asset value:
31 July 2017 31 July 2016% %
91
Notes to the Financial Statements (continued)
as at 31 July 2017
Stewart Investors Asia Pacific Leaders Fund
(c)
Total TotalCurrency £'000 £'000Australian dollar 551,786 1,256,610Euro 6,140 1,397Hong Kong dollar 1,265,031 1,531,913Indian rupee 2,900,146 2,401,783Indonesian rupiah 86,433 -Japanese yen 704,810 359,241Philippine peso 309,777 314,565Singapore dollar 635,702 492,919South Korean won 279,250 218,438Taiwanese dollar 1,646,640 1,745,927US dollar 697,616 655,751
Total 9,083,331 8,978,544
13.
Material Shareholders
Clearstream Banking S.A. held material shareholding in the Fund during the year to 31 July 2017, and at the year end held 10% of the Fund’sshares in issue.
Amounts paid to First State Investments (UK) Limited in respect of ACD fees are disclosed in note 4, with £7,526,694 (31/07/16: £7,026,283)due at the year end.
As at 31 July 2017, Commonwealth Bank of Australia (UK) Staff Pension Scheme, a related party of the ACD, owned 0.02% (31/07/16:0.02%) of the net asset value of the Fund.
As at 31 July 2017, RBC, as trustee for First State Investment Services (UK) Limited Employee Benefits Trust, a related party of the ACD,owned 0.12% (31/07/16: 0.30%) of the net asset value of the Fund.
Related parties
First State Investments (UK) Limited ("the ACD") is a related party to the Fund as defined by Financial Reporting Standard 8 ‘Related Party Disclosures’ and FRS 102 Section 33 'Related Party Disclosures'. By virtue of the regulations governing open-ended investment companies, the ACD is party to every transaction in respect of shares of the Fund, which are summarised in the ‘Statement of Change in Net Assets Attributable to Shareholders’. Amounts due at the year end in respect of issues and cancellations are included in the Balance Sheet.
If foreign exchange rates increase or decrease by 5%, then the impact on the NAV will be an increase or decrease of 4.77% (£454,166,530)(31/07/16: 4.71% (£448,927,206)).
The following summarises the sterling value of currencies of the Fund in which the investments, including cash, debtors and creditors, aredenominated.
As at 31 July 2017, the Fund had the following net currency exposure (excluding sterling):
Net foreign currency assets Net foreign currency assets31 July 2017 31 July 2016
Analysis of the Fund's currency exposure
92
Notes to the Financial Statements (continued)
as at 31 July 2017
Stewart Investors Asia Pacific Leaders Fund
14.
%1.501.500.850.851.501.500.850.85
31 July 2016 31 July 2017
Opening shares in issue Creations Cancellations
Shares converted
Closing shares in issue
191,583,486 1,659,018 (38,845,351) (2,525,672) 151,871,4818,835,101 1,020,718 (1,306,974) (314,689) 8,234,156
1,001,003,678 21,128,458 (71,794,288) (11,954,407) 938,383,441495,535,979 44,326,284 (84,581,630) 44,719,181 499,999,814118,828,488 11,560,926 (41,180,049) (31,187) 89,178,178
13,169,388 4,150,169 (2,082,440) - 15,237,117608,629,382 96,847,650 (235,895,903) (1,899,852) 467,681,277
12,460,278 13,039,521 (8,144,057) 2,637,468 19,993,210
15.
Assets Liabilities Assets Liabilities
£'000 £'000 £'000 £'0008,800,769 - 8,640,038 -
- - - -- - - -
8,800,769 - 8,640,038 -
Level 3: inputs are unobservable (i.e. market data is unavailable) for the asset or liability. Over the Counter (OTC) derivatives (including equityswaps) are held at fair value, which is determined by valuation techniques or single broker quotes.
Level 1Level 2Level 3
Total fair value
Level 1: the unadjusted quoted price in an active market for identical assets or liabilities that the entity can access at the measurement date. Level 2: inputs other than quoted prices included within Level 1 that are observable (i.e. developed using market data) for the asset or liability,either directly or indirectly.
Fair value
Valuation technique
31 July 2017 31 July 2016
Share class B Income (Institutional):Share class A Accumulation (EUR share class) (Retail)Share class A Income (EUR share class) (Retail)Share class B Accumulation (EUR share class) (Institutional)Share class B Income (EUR share class) (Institutional)
All share classes have the same rights on winding up.
Reconciliation of the shares movement in the year:
Share class A Accumulation (Retail)Share class A Income (Retail)Share class B Accumulation (Retail)
The net asset value of each share class, the net asset value per share and the number of shares in each class are given in the ComparativeTable on pages 78 to 85.
The distributions per share class are given in the Distribution Tables on pages 94 to 96.
Share class A Accumulation (EUR share class) (Retail):Share class A Income (EUR share class) (Retail):Share class B Accumulation (EUR share class) (Institutional):Share class B Income (EUR share class) (Institutional):
The ACD's periodic charge on each share class is as follows:
Share class A Accumulation (Retail):Share class A Income (Retail):Share class B Accumulation (Retail):Share class B Income (Institutional):
Share classes
The Fund has eight share classes in issue.
93

Share class A Accumulation
Netrevenue Equalisation
Distributions paid to/payable
30/09/2017
Distributions paid
30/09/2016Group 1 (p) (p) (p) (p)Interim - - - 0.3586Final 1.7995 - 1.7995 2.8966Group 2 (p) (p) (p) (p)Interim - - - 0.3586Final 1.6052 0.1943 1.7995 2.8966
Share class A Income
Netrevenue Equalisation
Distributions paid to/payable
30/09/2017
Distributions paid
30/09/2016Group 1 (p) (p) (p) (p)Interim - - - 0.0681Final 0.5064 - 0.5064 0.9364Group 2 (p) (p) (p) (p)Interim - - - 0.0681Final 0.4762 0.0302 0.5064 0.9364
Share class B Accumulation
Netrevenue Equalisation
Distributions paid to/payable
30/09/2017
Distributions paid
30/09/2016Group 1 (p) (p) (p) (p)Interim 1.7616 - 1.7616 2.0255Final 4.5265 - 4.5265 4.9123Group 2 (p) (p) (p) (p)Interim - 1.7616 1.7616 2.0255Final 3.4381 1.0884 4.5265 4.9123
Share class B Income
Netrevenue Equalisation
Distributions paid to/payable
30/09/2017
Distributions paid
30/09/2016Group 1 (p) (p) (p) (p)Interim 0.5507 - 0.5507 0.6446Final 1.4337 - 1.4337 1.5768Group 2 (p) (p) (p) (p)Interim - 0.5507 0.5507 0.6446Final 1.0859 0.3478 1.4337 1.5768
Final - Shares purchased between 1 February 2017 and 31 July 2017Group 2 Interim - Shares purchased between 1 August 2016 and 31 January 2017
Final - Shares purchased prior to 1 February 2017
Distribution in pence and cents per share
Stewart Investors Asia Pacific Leaders Fund
Distribution Tablesfor the year ended 31 July 2017
Group 1 Interim - Shares purchased prior to 1 August 2016
94
Stewart Investors Asia Pacific Leaders Fund
Distribution Tables (continued)
for the year ended 31 July 2017
Share class A Accumulation (EUR share class)
Netrevenue Equalisation
Distributions paid to/payable
30/09/2017
Distributions paid
30/09/2016Group 1 (c) (c) (c) (c)Interim - - - 0.1461Final 0.6268 - 0.6268 1.0925Group 2 (c) (c) (c) (c)Interim - - - 0.1461Final 0.5829 0.0439 0.6268 1.0925
Share class A Income (EUR share class)
Netrevenue Equalisation
Distributions paid to/payable
30/09/2017
Distributions paid
30/09/2016Group 1 (c) (c) (c) (c)Interim - - - 0.0899Final 0.5537 - 0.5537 0.9869Group 2 (c) (c) (c) (c)Interim - - - 0.0899Final 0.5234 0.0303 0.5537 0.9869
Share class B Accumulation (EUR share class)
Netrevenue Equalisation
Distributions paid to/payable
30/09/2017
Distributions paid
30/09/2016Group 1 (c) (c) (c) (c)Interim 0.5544 - 0.5544 0.7199Final 1.3691 - 1.3691 1.5767Group 2 (c) (c) (c) (c)Interim - 0.5544 0.5544 0.7199Final 0.9352 0.4339 1.3691 1.5767
Share class B Income (EUR share class)
Netrevenue Equalisation
Distributions paid to/payable
30/09/2017
Distributions paid
30/09/2016Group 1 (c) (c) (c) (c)Interim 0.4148 - 0.4148 0.5458Final 1.0071 - 1.0071 1.1678Group 2 (c) (c) (c) (c)Interim - 0.4148 0.4148 0.5458Final 0.8562 0.1509 1.0071 1.1678
95
Stewart Investors Asia Pacific Leaders Fund
Distribution Tables (continued)
for the year ended 31 July 2017
Shareholders should consult their professional advisers for any advice regarding their tax position.
Final - 100.00% of the dividend is received as franked investment income.
Final - 0.00% of the dividend is received as an annual payment (non-foreign element) received after the deduction of income tax at the lower rateand is liable to corporation tax. The tax deemed to be deducted is treated as income tax.
Final - 0.00% of the dividend is received as an annual payment (foreign element) received after the deduction of income tax at the lower rate and isliable to corporation tax. It is treated as foreign income in the hands of the corporate investor and is liable to corporation tax. The associateddeemed tax is treated as foreign tax in the hands of the investor, who may be able to claim double tax relief. Investors cannot reclaim any of thisdeemed tax on the foreign element from HM Revenue & Customs.
Interim - 100.00% of the dividend is received as franked investment income.
Interim - 0.00% of the dividend is received as an annual payment (non-foreign element) received after the deduction of income tax at the lowerrate and is liable to corporation tax. The tax deemed to be deducted is treated as income tax.
Interim - 0.00% of the dividend is received as an annual payment (foreign element) received after the deduction of income tax at the lower rate andis liable to corporation tax. It is treated as foreign income in the hands of the corporate investor and is liable to corporation tax. The associateddeemed tax is treated as foreign tax in the hands of the investor, who may be able to claim double tax relief. Investors cannot reclaim any of thisdeemed tax on the foreign element from HM Revenue & Customs.
Corporate tax for all share classes (unaudited)
A shareholder liable to corporation tax receives this distribution, excluding equalisation, as follows:
96
•
I
II
III
•
Risks and reward profile
Lower Risk Higher Risk
Potentially Lower Rewards Potentially Higher Rewards
1 2 3 4 5 6 7
1 2 3 4 5 6 7
1 2 3 4 5 6 7
1 2 3 4 5 6 7
Stewart Investors Asia Pacific Sustainability Fund
Authorised Fund Manager's Reportfor the year ended 31 July 2017
Investment Objective and Policy
The Fund aims to achieve long-term capital growth.
The Fund invests in equities issued by companies that are incorporated or listed, or which conduct the majority of their economic activity, in theAsia Pacific region (excluding Japan, including Australasia). The Fund invests in companies that are positioned to benefit from, and contribute to,the sustainable development of the countries in which they operate.
Clarification point 1: The Fund’s emphasis on sustainable development incorporates three key features in making investment decisions. Theseare:
Clarification point 2: "Australasia" refers to Australia, New Zealand and other South-East Asian countries.
Share class A Accumulation
Share class B Accumulation
Share class A Accumulation (EUR share class)
Share class B Accumulation (EUR share class)
Company classification (identifying companies whose management are believed able to manage sustainability risks and opportunities facing theircompanies, seeking out sustainable companies with a positive sustainable development impact);
Integration of environmental, social and corporate governance factors into investment analysis;
Engagement with and exit from companies based on our own research and external global norms-based screening (the Fund manager willengage senior management on any identified environmental, social and governance issues, and exit a stock if insufficient progress is made).
• The synthetic risk reward indicator (the SRRI) rating is not a measure of the risk of you losing your investment but describes how much the valueof the Fund went up and down in the past;
• The SRRI rating is based on historical data, which may not be a reliable indication of the future risks and rewards of the Fund;
• We cannot guarantee that the rating of the Fund will remain the same; it may change over time;
Emerging market risk: emerging markets may not provide the same level of investor protection as a developed market; they may involve a higherrisk than investing in developed markets.
Currency risk: the Fund invests in assets that are denominated in other currencies; changes in exchange rates will affect the value of the Fund.
• Even the lowest rating 1 does not mean a risk-free investment;
• On a scale of 1 (less risky) to 7 (more risky), this Fund has a rating of 5 due to its past performance and the nature of its investments. Shares witha rating of 5 might have higher risks, but also higher returns;
• Risk is taken in order to make a higher potential return; the more risk a Fund takes, the higher the potential return but the greater the risk of loss;and
• The value of the Fund and its return is not guaranteed and may fall as well as rise. You may get back less than you originally invested.
The Fund might also experience the following risks:
For further information on risks, please refer to the Risk Factors section in the Company's prospectus.
Performance
The Fund rose by 10.6% in sterling terms over the year and provided cumulative returns of 47.3% and 96.0% over three and five years respectivelyto 31 July 2017.
Marico (India: Consumer Staples) gained on the back of both strong operational performance and the market becoming more optimistic about theprospects of Indian consumer companies. Kotak Mahindra Bank (India: Financials) rose as investors were attracted to this well-governed bank witha strong Balance Sheet and prudent lending policy. Taiwan Semiconductor Manufacturing (Information Technology) climbed on improving cashgeneration.
Tech Mahindra (India: Information Technology) declined on subdued profit growth, although the long-term outlook for the company remainspositive, and Dr Reddy’s Laboratories (India: Health Care) was weak on regulatory risk alongside concerns about the backdrop for generic drugs.Brambles (Australia: Industrials) declined due to competitive pressures in the US.
97
(continued)
Stewart Investors Asia Pacific Sustainability Fund
Authorised Fund Manager's Reportfor the year ended 31 July 2017
Time 3 6 1 3 5 10 Sinceperiod mths mths yr yrs yrs yrs launch
2.1 6.2 10.6 47.3 96.0 234.2 378.1 7.9 13.7 25.4 44.8 72.3 124.2 222.7 7.2 12.0 22.3 46.6 73.7 123.4 239.4
4 4 4 2 1 1 1
12 mths to 12 mths to 12 mths to 12 mths to 12 mths to31/07/17 31/07/16 31/07/15 31/07/14 31/07/13
10.6 20.1 10.8 8.9 22.2
31 July 2017 31 July 2016% of Fund % of Fund
6.74 6.924.83 6.184.30 5.664.19 3.994.04 3.543.66 3.333.58 3.242.72 3.162.71 3.152.67 3.11
Portfolio changes
Significant new positions over the year included Cyient (India: Information Technology), an engineering design services company operating across arange of industries, including rail transportation, power generation, communications, utilities and medical technology. The Fund also boughtMahindra & Mahindra (India: Consumer Discretionary), the holding company of one of the most respected and highest quality family groups inIndia, and Tata Consultancy Services (India: Information Technology), a strong IT franchise with good quality stewards that was reasonably valued.
The Fund sold Infosys (India: Information Technology) on worries about cultural drift at the company and Towngas China (Utilities) on concernsabout the long-term risk of alignment with the Chinese government. The Fund also sold Airtac International (Taiwan: Industrials) because it wasexpensively valued.
Outlook
The Manager remains cautious about the outlook for companies across the Asia Pacific Region. Quality companies remain expensive in terms ofvaluation, although there are a few more ideas to investigate following research trips. The Manager remains focused on investing in companies thatshould benefit from and contribute to the sustainable development of the region over the long term.
Cumulative performance as at 31 July 2017
Fund return %
TimeperiodFund return %
Benchmark: MSCI Asia Pacific (ex-Japan) Index.Sector: IA Asia Pacific (ex-Japan).
Benchmark return %Sector return %Quartile ranking
Discrete performance as at 31 July 2017
Stock name Stock nameVitasoy International Holdings Vitasoy International Holdings
Past performance should not be used as a guide to future performance, which is not guaranteed.
Ten largest holdings
Kotak Mahindra Bank Standard FoodsHousing Development Finance Kotak Mahindra BankTaiwan Semiconductor Manufacturing Chroma ATE
Marico MaricoTech Mahindra Tech MahindraStandard Foods Taiwan Semiconductor Manufacturing
Types of sharesAccumulation.
Manila Water InfosysCSL Manila WaterE.Sun Financial Holding Housing Development Finance
98
Holdings
MarketValue£'000
TotalNet Assets
%
UNITED STATES (0.99%*) 4,414 1.0098,558 Expeditors International of Washington 4,414 1.00
JAPAN (1.19%*) 10,482 2.38537,800 Unicharm 10,482 2.38
AUSTRALIA (6.11%*) 22,357 5.081,341,744 Brambles 7,530 1.71
155,953 CSL 11,930 2.71493,668 ResMed CDI 2,897 0.66
BANGLADESH (0.79%*) 8,188 1.856,081,171 BRAC Bank 4,999 1.131,204,164 Square Pharmaceuticals 3,189 0.72
CHINA (1.60%*) 4,985 1.133,362,000 China Mengniu Dairy 4,985 1.13
HONG KONG (8.99%*) 29,697 6.7418,271,559 Vitasoy International Holdings 29,697 6.74
INDIA (35.09%*) 147,730 33.561,223,106 Cipla 8,151 1.851,255,008 Cyient 7,826 1.782,003,039 Dabur India 7,350 1.67
325,587 Dr Reddy's Laboratories 9,187 2.09375,104 Godrej Consumer Products 4,617 1.05758,216 Housing Development Finance 16,098 3.66
6,411,488 Idea Cellular 7,033 1.60300,030 Info Edge India 3,542 0.80
1,463,876 Kotak Mahindra Bank 17,787 4.04160,510 Lupin 1,966 0.45265,346 Mahindra & Mahindra 4,431 1.01519,372 Mahindra Lifespace Developers 2,597 0.59
5,379,534 Marico 21,281 4.831,106,413 S H Kelkar 3,472 0.79
366,779 Tata Chemicals 2,697 0.61146,323 Tata Consultancy Services 4,333 0.98
4,144,466 Tech Mahindra 18,950 4.30698,325 Tube Investments of India 6,412 1.46
INDONESIA (2.16%*) 11,223 2.5427,863,100 Kalbe Farma 2,749 0.6295,589,800 Selamat Sempurna 6,122 1.3912,275,150 XL Axiata 2,352 0.53
MALAYSIA (1.47%*) 5,523 1.251,530,360 Public Bank 5,523 1.25
PHILIPPINES (8.20%*) 33,786 7.67819,480 Ayala 10,704 2.43
4,966,894 Bank of the Philippine Islands 7,845 1.7824,767,891 Manila Water 11,968 2.72
2,501,260 Robinsons Retail Holdings 3,269 0.74
Stewart Investors Asia Pacific Sustainability Fund
Portfolio Statementas at 31 July 2017
99
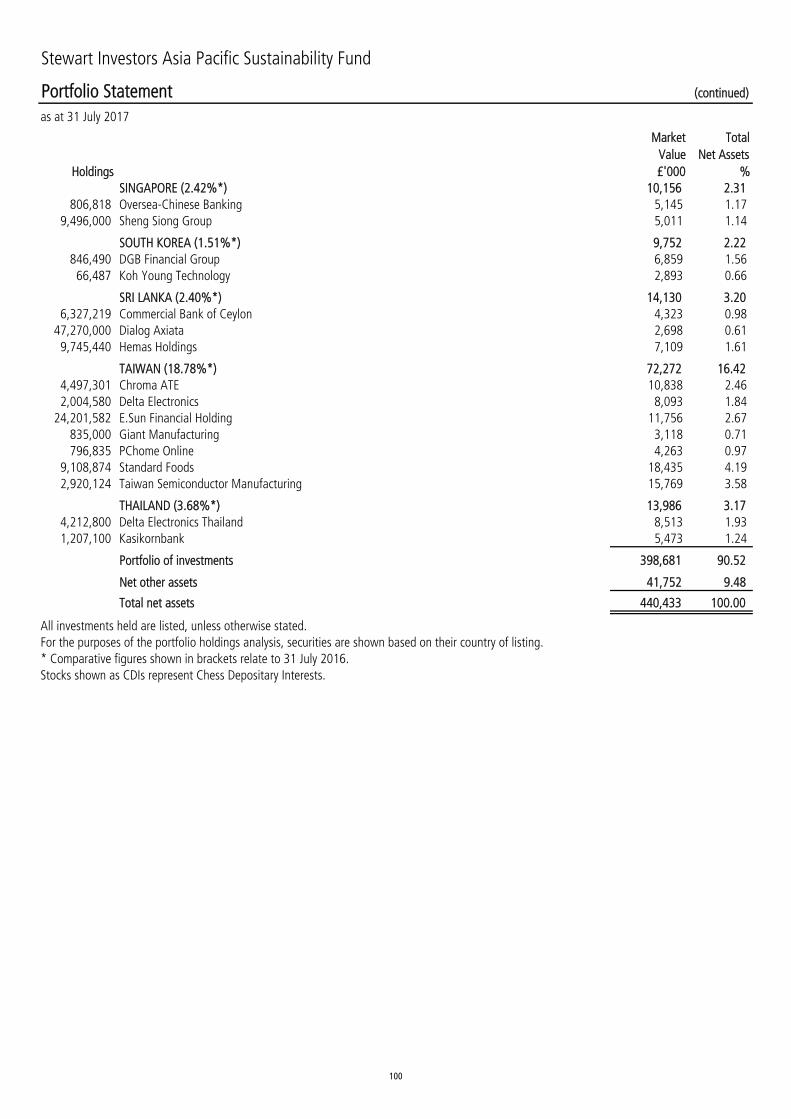
Holdings
MarketValue£'000
TotalNet Assets
%
Stewart Investors Asia Pacific Sustainability Fund
Portfolio Statement (continued)
as at 31 July 2017
SINGAPORE (2.42%*) 10,156 2.31806,818 Oversea-Chinese Banking 5,145 1.17
9,496,000 Sheng Siong Group 5,011 1.14
SOUTH KOREA (1.51%*) 9,752 2.22846,490 DGB Financial Group 6,859 1.56
66,487 Koh Young Technology 2,893 0.66
SRI LANKA (2.40%*) 14,130 3.206,327,219 Commercial Bank of Ceylon 4,323 0.98
47,270,000 Dialog Axiata 2,698 0.619,745,440 Hemas Holdings 7,109 1.61
TAIWAN (18.78%*) 72,272 16.424,497,301 Chroma ATE 10,838 2.462,004,580 Delta Electronics 8,093 1.84
24,201,582 E.Sun Financial Holding 11,756 2.67835,000 Giant Manufacturing 3,118 0.71796,835 PChome Online 4,263 0.97
9,108,874 Standard Foods 18,435 4.192,920,124 Taiwan Semiconductor Manufacturing 15,769 3.58
THAILAND (3.68%*) 13,986 3.174,212,800 Delta Electronics Thailand 8,513 1.931,207,100 Kasikornbank 5,473 1.24
Portfolio of investments 398,681 90.52
Net other assets 41,752 9.48
Total net assets 440,433 100.00
Stocks shown as CDIs represent Chess Depositary Interests.
All investments held are listed, unless otherwise stated.
* Comparative figures shown in brackets relate to 31 July 2016.For the purposes of the portfolio holdings analysis, securities are shown based on their country of listing.
100

Share class A Accumulation
Change in net assets per share
Opening net asset value per share
Return before operating charges*
Operating charges
Return after operating charges*
Distributions
Retained distributions on accumulation shares
Closing net asset value per share (p)
* after direct transaction costs of:
Performance
Return after charges (%)
Other information
Closing net asset value (£’000)
Closing number of shares
Operating charges
Direct transaction costs
Prices
Highest share price
Lowest share price 427.26 316.28 322.49
0.07% 0.07% 0.18%
487.36 436.43 407.11
1.66% 1.70% 1.69%
48,938 47,265 61,452
10,245,952 10,951,666 17,123,949
10.67% 20.26% 10.75%
477.64 431.57 358.87
0.31 0.25 0.66
0.76 1.29 (1.39)
46.07 72.70 34.84
(0.76) (1.29) 1.39
53.70 78.82 40.98
(7.63) (6.12) (6.14)
431.57 358.87 324.03
Stewart Investors Asia Pacific Sustainability Fund
Comparative Tablefor the year ended 31 July 2017
Net Asset Value and Ongoing Charges Figure
Final 31 July 2017(p)
Final 31 July 2016(p)
Final 31 July 2015(p)
101
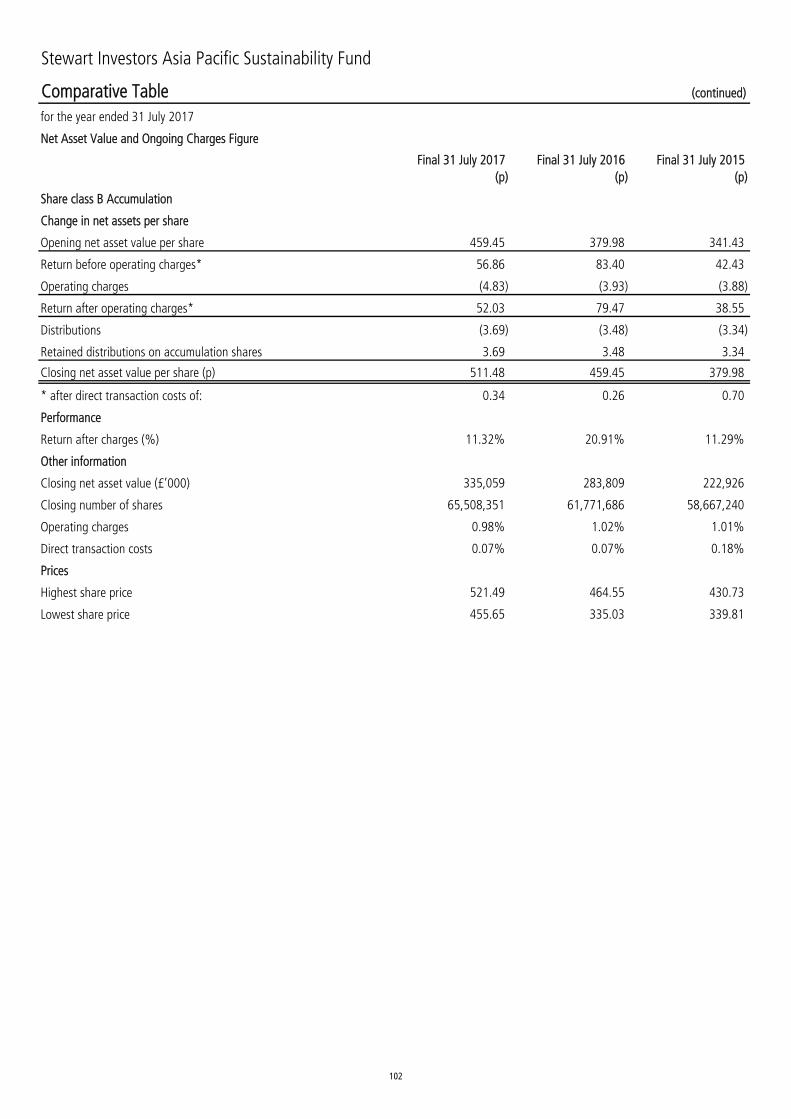
Stewart Investors Asia Pacific Sustainability Fund
Comparative Table (continued)
for the year ended 31 July 2017
Net Asset Value and Ongoing Charges Figure
Share class B Accumulation
Change in net assets per share
Opening net asset value per share
Return before operating charges*
Operating charges
Return after operating charges*
Distributions
Retained distributions on accumulation shares
Closing net asset value per share (p)
* after direct transaction costs of:
Performance
Return after charges (%)
Other information
Closing net asset value (£’000)
Closing number of shares
Operating charges
Direct transaction costs
Prices
Highest share price
Lowest share price 455.65 335.03 339.81
0.07% 0.07% 0.18%
521.49 464.55 430.73
0.98% 1.02% 1.01%
335,059 283,809 222,926
65,508,351 61,771,686 58,667,240
11.32% 20.91% 11.29%
511.48 459.45 379.98
0.34 0.26 0.70
3.69 3.48 3.34
52.03 79.47 38.55
(3.69) (3.48) (3.34)
56.86 83.40 42.43
(4.83) (3.93) (3.88)
459.45 379.98 341.43
Final 31 July 2017(p)
Final 31 July 2016(p)
Final 31 July 2015(p)
102

Stewart Investors Asia Pacific Sustainability Fund
Comparative Table (continued)
for the year ended 31 July 2017
Net Asset Value and Ongoing Charges Figure
Share class A Accumulation (EUR share class)
Change in net assets per share
Opening net asset value per share
Return before operating charges*
Operating charges
Return after operating charges*
Distributions
Retained distributions on accumulation shares
Closing net asset value per share (c)
* after direct transaction costs of:
Performance
Return after charges (%)
Other information
Closing net asset value (€’000)
Closing number of shares
Operating charges
Direct transaction costs
Prices
Highest share price
Lowest share price 267.95 226.98 210.46
0.07% 0.07% 0.18%
297.89 275.00 294.90
1.65% 1.69% 1.70%
24,218 20,380 25,372
8,558,703 7,541,201 9,499,627
4.70% 1.19% 25.87%
282.96 270.26 267.08
0.19 0.17 0.46
1.26 2.34 3.82
12.70 3.18 54.90
(1.26) (2.34) (3.82)
17.35 7.43 59.21
(4.65) (4.25) (4.31)
270.26 267.08 212.18
Final 31 July 2017(c)
Final 31 July 2016(c)
Final 31 July 2015(c)
103
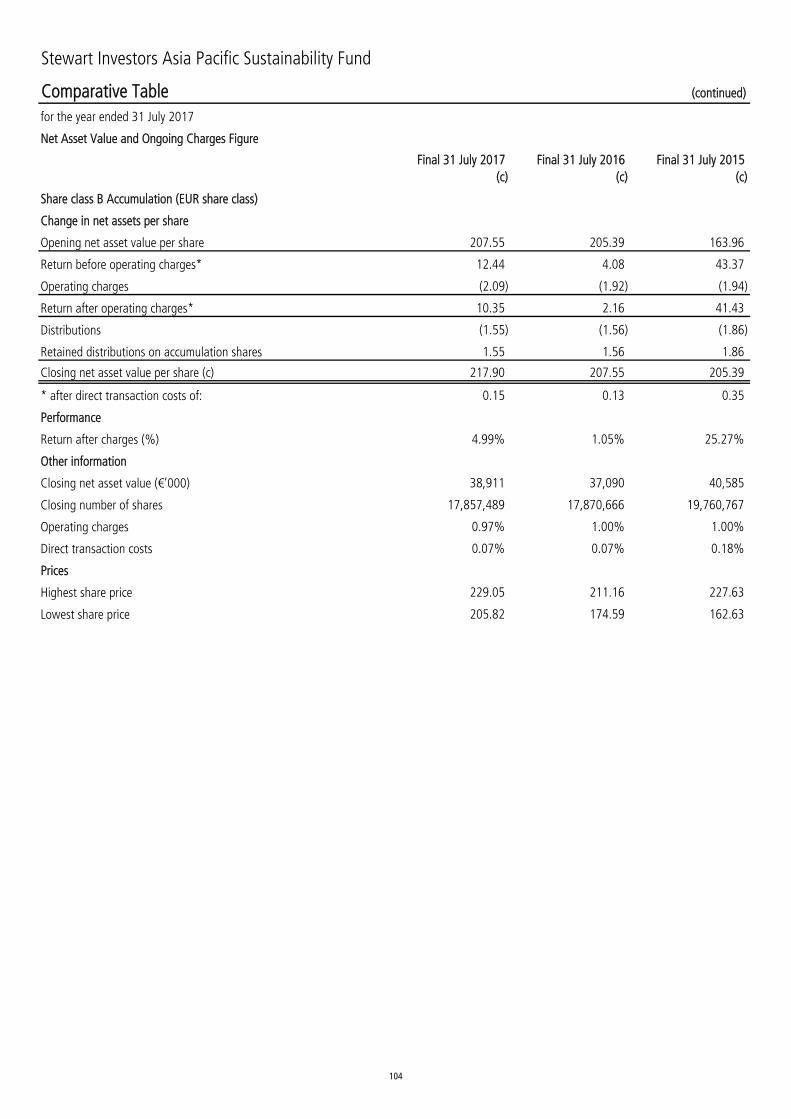
Stewart Investors Asia Pacific Sustainability Fund
Comparative Table (continued)
for the year ended 31 July 2017
Net Asset Value and Ongoing Charges Figure
Share class B Accumulation (EUR share class)
Change in net assets per share
Opening net asset value per share
Return before operating charges*
Operating charges
Return after operating charges*
Distributions
Retained distributions on accumulation shares
Closing net asset value per share (c)
* after direct transaction costs of:
Performance
Return after charges (%)
Other information
Closing net asset value (€’000)
Closing number of shares
Operating charges
Direct transaction costs
Prices
Highest share price
Lowest share price 205.82 174.59 162.63
0.07% 0.07% 0.18%
229.05 211.16 227.63
0.97% 1.00% 1.00%
38,911 37,090 40,585
17,857,489 17,870,666 19,760,767
4.99% 1.05% 25.27%
217.90 207.55 205.39
0.15 0.13 0.35
1.55 1.56 1.86
10.35 2.16 41.43
(1.55) (1.56) (1.86)
12.44 4.08 43.37
(2.09) (1.92) (1.94)
207.55 205.39 163.96
Final 31 July 2017(c)
Final 31 July 2016(c)
Final 31 July 2015(c)
104

Notes £'000 £'000 £'000 £'000
Net capital gains 2 40,067 62,361
Revenue 3 7,787 6,833
4 (4,516) (3,716)
Interest payable and similar charges (14) (2)
3,257 3,115
5 (498) (447)
2,759 2,668
42,826 65,029
6 (2,761) (2,691)
40,065 62,338
£'000 £'000 £'000 £'000
379,534 330,873
43,784 13,790
(25,804) (30,152)
17,980 (16,362)
63 18
40,065 62,338
2,791 2,667
440,433 379,534
Less: Amounts payable on cancellation of shares
Dilution adjustment
Change in net assets attributable to shareholders from investment activities
Retained distribution on accumulation shares
Closing net assets attributable to shareholders
Notes to the Financial Statements are on pages 107 to 112.
Amounts receivable on issue of shares
for the year ended 31 July 2017
31 July 2017 31 July 2016
Opening net assets attributable to shareholders
Statement of Change in Net Assets Attributable to Shareholders
Income
Expenses
Net revenue before taxation
Taxation
Net revenue after taxation
Total return before distributions
Distributions
Change in net assets attributable to shareholders from investment activities
31 July 2017 31 July 2016
Stewart Investors Asia Pacific Sustainability Fund
Statement of Total Returnfor the year ended 31 July 2017
105
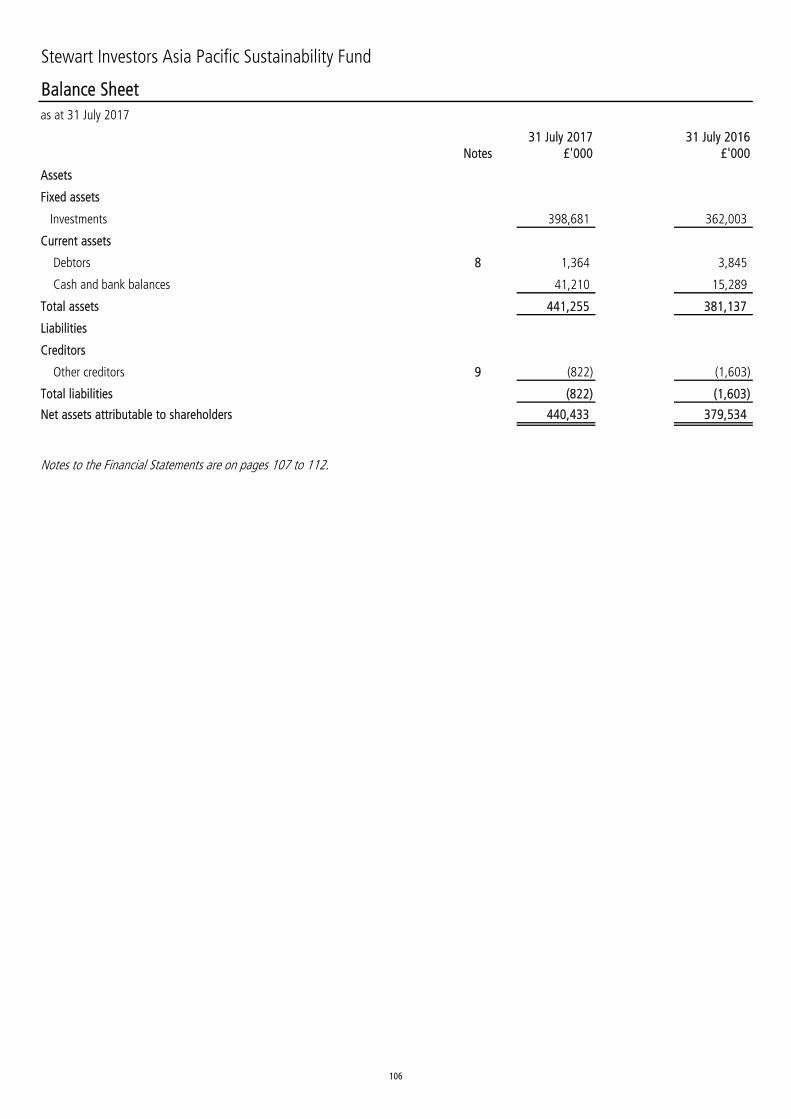
Stewart Investors Asia Pacific Sustainability Fund
31 July 2017 31 July 2016Notes £'000 £'000
Investments 398,681 362,003
Current assets
8 1,364 3,845
41,210 15,289
441,255 381,137
Creditors
Other creditors 9 (822) (1,603)
(822) (1,603)
440,433 379,534
Notes to the Financial Statements are on pages 107 to 112.
Total liabilities
Net assets attributable to shareholders
Balance Sheetas at 31 July 2017
Assets
Fixed assets
Debtors
Cash and bank balances
Total assets
Liabilities
106
1.
2.
31 July 2017 31 July 2016£'000 £'000
40,378 61,976(1) 17
(310) 368
40,067 62,361
3.
31 July 2017 31 July 2016£'000 £'000
29 37,234 6,215
119 1947 3
398 418
7,787 6,833
4.
31 July 2017 31 July 2016£'000 £'000
4,176 3,330
62 45
9 795 100
123 10151 133
278 341
4,516 3,716Total expenses
Audit feeRegistrar feesSafe custody chargesOther expenses
Other expenses:
Payable to the Depositary, associates of the Depositary, and agents of either of them:Depositary's fees
Expenses
Payable to the ACD, associates of the ACD, and agents of either of them:ACD's periodic charge
Initial Charge Revenue
Total revenue
Interest from bank depositsOverseas scrip dividends
Overseas taxable revenueOverseas non-taxable revenue
Net capital gains
Revenue
Forward foreign exchange currency contractsCurrency (losses)/gains
Accounting basis and policies
Please see pages 9 to 11 for accounting basis and policies.
Net capital gains
The net capital gains during the year comprise:
Non-derivative securities
Notes to the Financial Statementsas at 31 July 2017
Stewart Investors Asia Pacific Sustainability Fund
107
Notes to the Financial Statements (continued)
as at 31 July 2017
Stewart Investors Asia Pacific Sustainability Fund
5.
31 July 2017 31 July 2016£'000 £'000
(a)498 447
(b)
3,257 3,115
651 623
(24) (39)(1,447) (1,243)
820 659498 447
498 447
(c)
(d)
6.
31 July 2017 31 July 2016£'000 £'000
738 5022,053 2,166
2,791 2,66846 51
(76) (28)
2,761 2,691
7.
31 July 2017 31 July 2016£'000 £'0002,759 2,668
2 23
2,761 2,691
Movement in net income as a result of conversions
Net distributions for the year
Details of the distribution per share are set out in the Distribution Tables on pages 113 to 114.
Movement between net revenue and net distributions
Net revenue after taxation
Add: revenue deducted on cancellation of sharesDeduct: revenue received on issue of shares
Net distributions for the year
Final distributionInterim distribution
Distributions
The distributions take account of revenue received on the issue of shares and revenue deducted on the cancellation of shares and comprise:
Factors that may affect future tax charges:
At the year end, after offset against revenue taxable on receipt, there is a potential deferred tax asset of £4,351,119 (31/07/16: £3,531,853);this relates to surplus management expenses. No deferred tax asset was recognised in the current and prior year as it was considered unlikelythe Fund would generate sufficient taxable profits in the future to utilise these amounts.
Deferred taxation:
There is no provision required for deferred taxation at the balance sheet date in the current or prior year.
Total tax charge for year (note 5a)
OEICs are exempt from tax on capital gains. Therefore, any capital return is not included in the above reconciliation.
* As an authorised OEIC, these items are not subject to corporation tax.
Movement in excess management expensesIrrecoverable overseas tax
Non-taxable scrip dividends*Overseas non-taxable revenue*
Net revenue before taxation
Corporation tax of 20% (2016: 20%)
Effects of:
Factors affecting current tax charge for the year:
The tax assessed for the year is lower than (2016: lower than) the standard rate of corporation tax in the UK for an open-ended investmentcompany of 20% (2016: 20%). The differences are explained below:
Irrecoverable overseas taxAnalysis of charge in year:
Taxation
108
Notes to the Financial Statements (continued)
as at 31 July 2017
Stewart Investors Asia Pacific Sustainability Fund
8.
31 July 2017 31 July 2016£'000 £'000
- 2,611224 375
1,140 859
1,364 3,845
9.
31 July 2017 31 July 2016£'000 £'000
1 795266 353555 455
822 1,603
10.
31 July 2017 31 July 2016 31 July 2017 31 July 2016£'000 £'000 £'000 £'000
54,359 42,229 58,178 52,508
54,359 42,229 58,178 52,508
74 52 (55) (47)
47 38 (105) (86)
121 90 (160) (133)
54,480 42,319 58,018 52,375
31 July 2017 31 July 2016 31 July 2017 31 July 2016% % % %
0.14 0.12 0.09 0.09
0.09 0.09 0.18 0.16
The average portfolio dealing spread at the balance sheet date was 0.25% (31/07/2016: 0.28%).
Total costs 0.07 0.07
Average portfolio dealing spread
Commissions 0.03 0.03Taxes 0.04 0.04
Total transaction cost expressed as a percentage of average net asset value:
31 July 2017 31 July 2016% %
EquitiesTaxes
CommissionsEquities
Total transaction cost expressed as a percentage of asset type cost:
Purchases Sales
Total costs
Total net trades in the year after transaction costs
TaxesEquities
Trades in the year before transaction costs
CommissionsEquities
Analysis of total trade costs:
Purchases Sales
Equities
Total creditors
Portfolio transaction costs
Purchases awaiting settlementAmounts payable for cancellation of sharesAccrued expenses
Creditors
Total debtors
Amounts receivable for issue of sharesAccrued revenue
Debtors
Sales awaiting settlement
109
Notes to the Financial Statements (continued)
as at 31 July 2017
Stewart Investors Asia Pacific Sustainability Fund
11.
12.
(a)
(b)
(c)
The following summarises the sterling value of currencies of the Fund in which the investments, including cash, debtors and creditors, aredenominated.
As at 31 July 2017, 9.36% (31/07/16: 4.03%) of the Fund's assets were interest-bearing.
As at 31 July 2017, if interest rates increase or decrease by 0.25%, with all other variables remaining constant, the resulting change in thenet assets attributable to shareholders of the Stewart Investors Asia Pacific Sustainability Fund would be an increase or decrease ofapproximately £103,026 (31/07/16: £38,218*).
*The comparative figures for 2016 have been restated to correct prior year disclosure.
Analysis of the Fund's currency exposure
There is no material difference between the value of the financial assets and liabilities, as shown in the Balance Sheet, and their fair value.
If market prices increase or decrease by 10%, then the impact on the portfolio will be an increase or decrease of 10% (£39,868,109)(31/07/16: £36,200,326).
Interest-rate risk
The Fund does not invest in either fixed or floating-rate securities, and interest-rate risk exposure is restricted to interest receivable on bankdeposits or payable on bank overdraft positions that will be affected by fluctuations in interest rates.
The Fund’s main liability is the redemption of any shares that investors wish to sell. In general, the ACD manages the cash to ensure that itcan meet its liabilities. Assets from a Fund may need to be sold if insufficient cash is available to finance such redemptions. The Fund’sholdings are reviewed on a regular basis, with particular emphasis on the market capitalisation of the issuer (securities issued by largercapitalised companies generally have greater liquidity) and the number of days it would take to trade out of a given securities position orpercentage of the Fund as a whole (determined by reference to available market trading volumes). Funds that have a higher concentration ofsecurities that are deemed to be less liquid are regularly monitored.
As a proportion of the Fund’s investment portfolio is invested in overseas securities, the Balance Sheet can be affected by movements inforeign exchange rates. The Investment Manager may seek to manage exposure to currency movements by using forward foreign exchangecontracts or by hedging the sterling value of investments that are priced in other currencies. Income received in other currencies is convertedto sterling on or near the date of receipt.
The market value of investments is taken to equal ‘fair value’ for the purposes of Financial Reporting Standard 102. Given all the activities ofthe Fund, none of the investments held fall within the definition of ‘investments held for trading’ as set out in Financial Reporting Standard13.
Fair value of financial assets and financial liabilities
Derivatives and other financial instruments
General
In pursuing its investment objectives, the Fund holds equity shares.
The main risk arising from the Fund’s financial instruments is market-price risk. Market-price risk arises mainly from uncertainty about futureprices of the financial instruments held. Investment risk in the portfolio is regularly reviewed and controlled through the adoption ofparameters limiting exposures to various factors such as industries, countries, and company size.
The Fund has little exposure to credit or cash-flow risk. Certain transactions in securities that the Fund enters into expose it to the risk thatthe counter-party will not deliver the investment (purchase) or cash (sale) after the Fund has fulfilled its responsibilities. The Fund only buysand sells investments through brokers that have been approved by the Authorised Corporate Director as an acceptable counter-party. This listis reviewed quarterly. The Fund’s assets comprise mainly realisable securities that can be readily sold in normal market conditions.
Contingent liabilities and commitments
As at 31 July 2017, the Fund had no contingent liabilities (31/07/16: £nil) and no commitments (31/07/16: £nil).
110
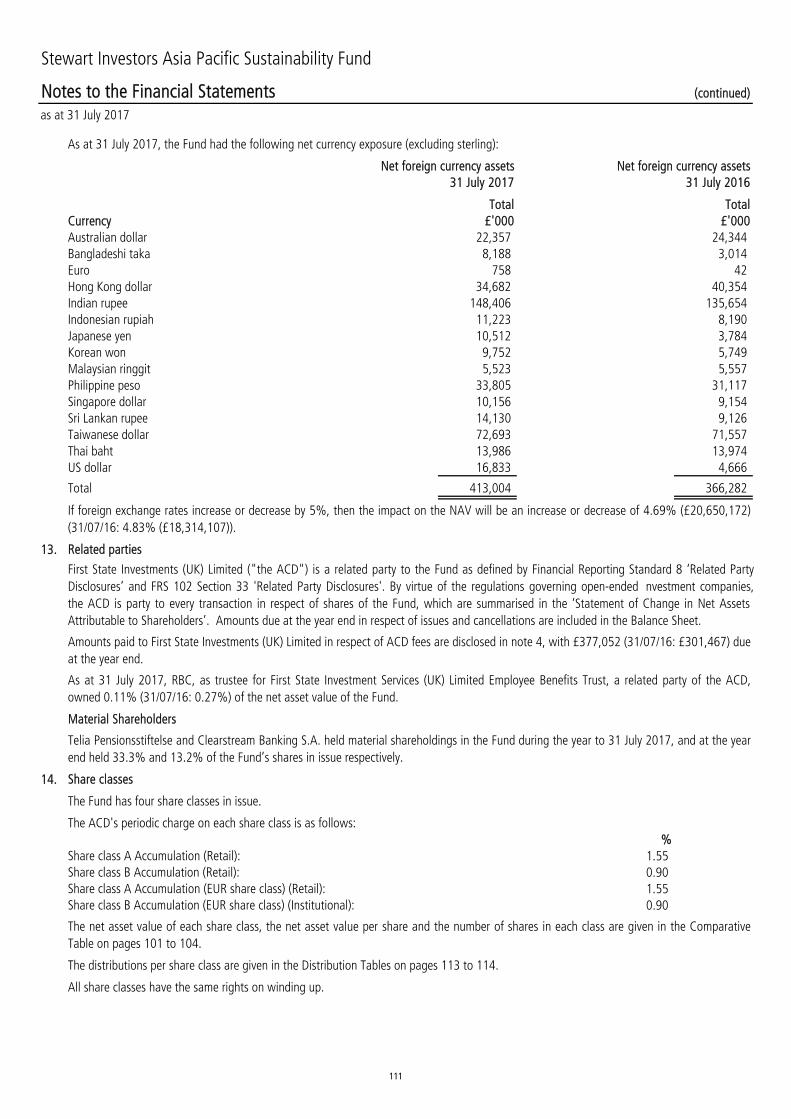
Notes to the Financial Statements (continued)
as at 31 July 2017
Stewart Investors Asia Pacific Sustainability Fund
Total TotalCurrency £'000 £'000Australian dollar 22,357 24,344Bangladeshi taka 8,188 3,014Euro 758 42Hong Kong dollar 34,682 40,354Indian rupee 148,406 135,654Indonesian rupiah 11,223 8,190Japanese yen 10,512 3,784Korean won 9,752 5,749Malaysian ringgit 5,523 5,557Philippine peso 33,805 31,117Singapore dollar 10,156 9,154Sri Lankan rupee 14,130 9,126Taiwanese dollar 72,693 71,557Thai baht 13,986 13,974US dollar 16,833 4,666
Total 413,004 366,282
13.
14.
%1.550.901.550.90
All share classes have the same rights on winding up.
The net asset value of each share class, the net asset value per share and the number of shares in each class are given in the ComparativeTable on pages 101 to 104.
The distributions per share class are given in the Distribution Tables on pages 113 to 114.
The ACD's periodic charge on each share class is as follows:
Share class A Accumulation (Retail):Share class B Accumulation (Retail):Share class A Accumulation (EUR share class) (Retail):Share class B Accumulation (EUR share class) (Institutional):
Material Shareholders
Telia Pensionsstiftelse and Clearstream Banking S.A. held material shareholdings in the Fund during the year to 31 July 2017, and at the yearend held 33.3% and 13.2% of the Fund’s shares in issue respectively.
Share classes
The Fund has four share classes in issue.
Amounts paid to First State Investments (UK) Limited in respect of ACD fees are disclosed in note 4, with £377,052 (31/07/16: £301,467) due at the year end.
As at 31 July 2017, RBC, as trustee for First State Investment Services (UK) Limited Employee Benefits Trust, a related party of the ACD,owned 0.11% (31/07/16: 0.27%) of the net asset value of the Fund.
Related parties
First State Investments (UK) Limited ("the ACD") is a related party to the Fund as defined by Financial Reporting Standard 8 ‘Related Party Disclosures’ and FRS 102 Section 33 'Related Party Disclosures'. By virtue of the regulations governing open-ended investment companies, the ACD is party to every transaction in respect of shares of the Fund, which are summarised in the ‘Statement of Change in Net Assets Attributable to Shareholders’. Amounts due at the year end in respect of issues and cancellations are included in the Balance Sheet.
If foreign exchange rates increase or decrease by 5%, then the impact on the NAV will be an increase or decrease of 4.69% (£20,650,172)(31/07/16: 4.83% (£18,314,107)).
As at 31 July 2017, the Fund had the following net currency exposure (excluding sterling):
Net foreign currency assets Net foreign currency assets31 July 2017 31 July 2016
111
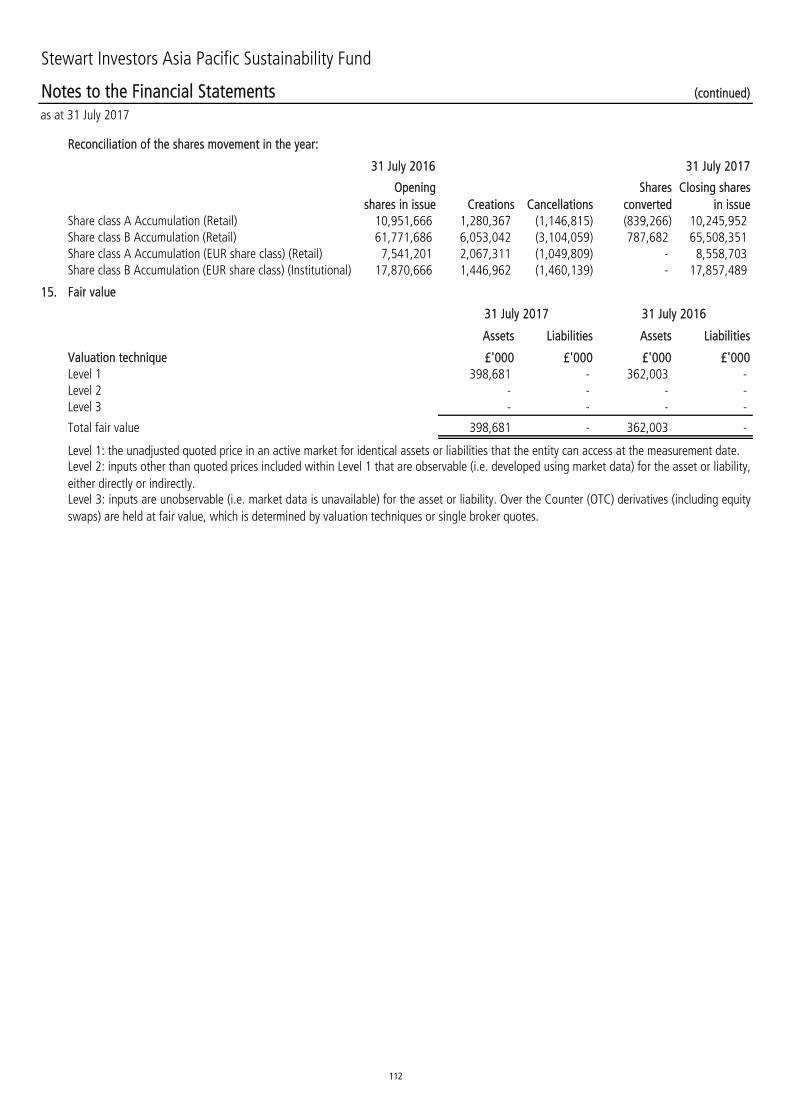
Notes to the Financial Statements (continued)
as at 31 July 2017
Stewart Investors Asia Pacific Sustainability Fund
31 July 2016 31 July 2017
Opening shares in issue Creations Cancellations
Shares converted
Closing shares in issue
10,951,666 1,280,367 (1,146,815) (839,266) 10,245,95261,771,686 6,053,042 (3,104,059) 787,682 65,508,351
7,541,201 2,067,311 (1,049,809) - 8,558,70317,870,666 1,446,962 (1,460,139) - 17,857,489
15.
Assets Liabilities Assets Liabilities
£'000 £'000 £'000 £'000398,681 - 362,003 -
- - - -- - - -
398,681 - 362,003 -
Level 3: inputs are unobservable (i.e. market data is unavailable) for the asset or liability. Over the Counter (OTC) derivatives (including equityswaps) are held at fair value, which is determined by valuation techniques or single broker quotes.
Level 1Level 2Level 3
Total fair value
Level 1: the unadjusted quoted price in an active market for identical assets or liabilities that the entity can access at the measurement date. Level 2: inputs other than quoted prices included within Level 1 that are observable (i.e. developed using market data) for the asset or liability,either directly or indirectly.
Fair value
Valuation technique
31 July 2017 31 July 2016
Share class B Accumulation (EUR share class) (Institutional)
Reconciliation of the shares movement in the year:
Share class A Accumulation (Retail)Share class B Accumulation (Retail)Share class A Accumulation (EUR share class) (Retail)
112
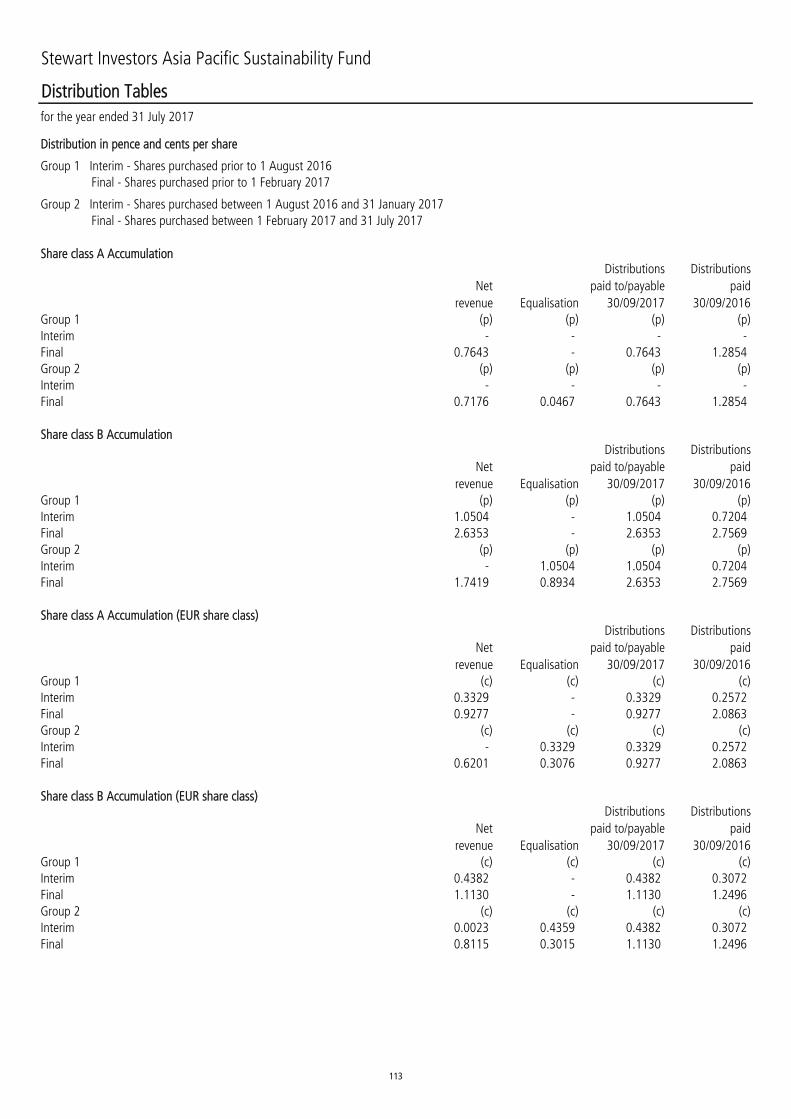
Share class A Accumulation
Netrevenue Equalisation
Distributions paid to/payable
30/09/2017
Distributions paid
30/09/2016Group 1 (p) (p) (p) (p)Interim - - - -Final 0.7643 - 0.7643 1.2854Group 2 (p) (p) (p) (p)Interim - - - -Final 0.7176 0.0467 0.7643 1.2854
Share class B Accumulation
Netrevenue Equalisation
Distributions paid to/payable
30/09/2017
Distributions paid
30/09/2016Group 1 (p) (p) (p) (p)Interim 1.0504 - 1.0504 0.7204Final 2.6353 - 2.6353 2.7569Group 2 (p) (p) (p) (p)Interim - 1.0504 1.0504 0.7204Final 1.7419 0.8934 2.6353 2.7569
Share class A Accumulation (EUR share class)
Netrevenue Equalisation
Distributions paid to/payable
30/09/2017
Distributions paid
30/09/2016Group 1 (c) (c) (c) (c)Interim 0.3329 - 0.3329 0.2572Final 0.9277 - 0.9277 2.0863Group 2 (c) (c) (c) (c)Interim - 0.3329 0.3329 0.2572Final 0.6201 0.3076 0.9277 2.0863
Share class B Accumulation (EUR share class)
Netrevenue Equalisation
Distributions paid to/payable
30/09/2017
Distributions paid
30/09/2016Group 1 (c) (c) (c) (c)Interim 0.4382 - 0.4382 0.3072Final 1.1130 - 1.1130 1.2496Group 2 (c) (c) (c) (c)Interim 0.0023 0.4359 0.4382 0.3072Final 0.8115 0.3015 1.1130 1.2496
Final - Shares purchased between 1 February 2017 and 31 July 2017Group 2 Interim - Shares purchased between 1 August 2016 and 31 January 2017
Final - Shares purchased prior to 1 February 2017
Distribution in pence and cents per share
Stewart Investors Asia Pacific Sustainability Fund
Distribution Tablesfor the year ended 31 July 2017
Group 1 Interim - Shares purchased prior to 1 August 2016
113
Stewart Investors Asia Pacific Sustainability Fund
Distribution Tables (continued)
for the year ended 31 July 2017
Shareholders should consult their professional advisers for any advice regarding their tax position.
Final - 100.00% of the dividend is received as franked investment income.
Final - 0.00% of the dividend is received as an annual payment (non-foreign element) received after the deduction of income tax at the lower rateand is liable to corporation tax. The tax deemed to be deducted is treated as income tax.
Final - 0.00% of the dividend is received as an annual payment (foreign element) received after the deduction of income tax at the lower rate and isliable to corporation tax. It is treated as foreign income in the hands of the corporate investor and is liable to corporation tax. The associateddeemed tax is treated as foreign tax in the hands of the investor, who may be able to claim double tax relief. Investors cannot reclaim any of thisdeemed tax on the foreign element from HM Revenue & Customs.
Interim - 100.00% of the dividend is received as franked investment income.
Interim - 0.00% of the dividend is received as an annual payment (non-foreign element) received after the deduction of income tax at the lowerrate and is liable to corporation tax. The tax deemed to be deducted is treated as income tax.
Interim - 0.00% of the dividend is received as an annual payment (foreign element) received after the deduction of income tax at the lower rate andis liable to corporation tax. It is treated as foreign income in the hands of the corporate investor and is liable to corporation tax. The associateddeemed tax is treated as foreign tax in the hands of the investor, who may be able to claim double tax relief. Investors cannot reclaim any of thisdeemed tax on the foreign element from HM Revenue & Customs.
Corporate tax for all share classes (unaudited)
A shareholder liable to corporation tax receives this distribution, excluding equalisation, as follows:
114
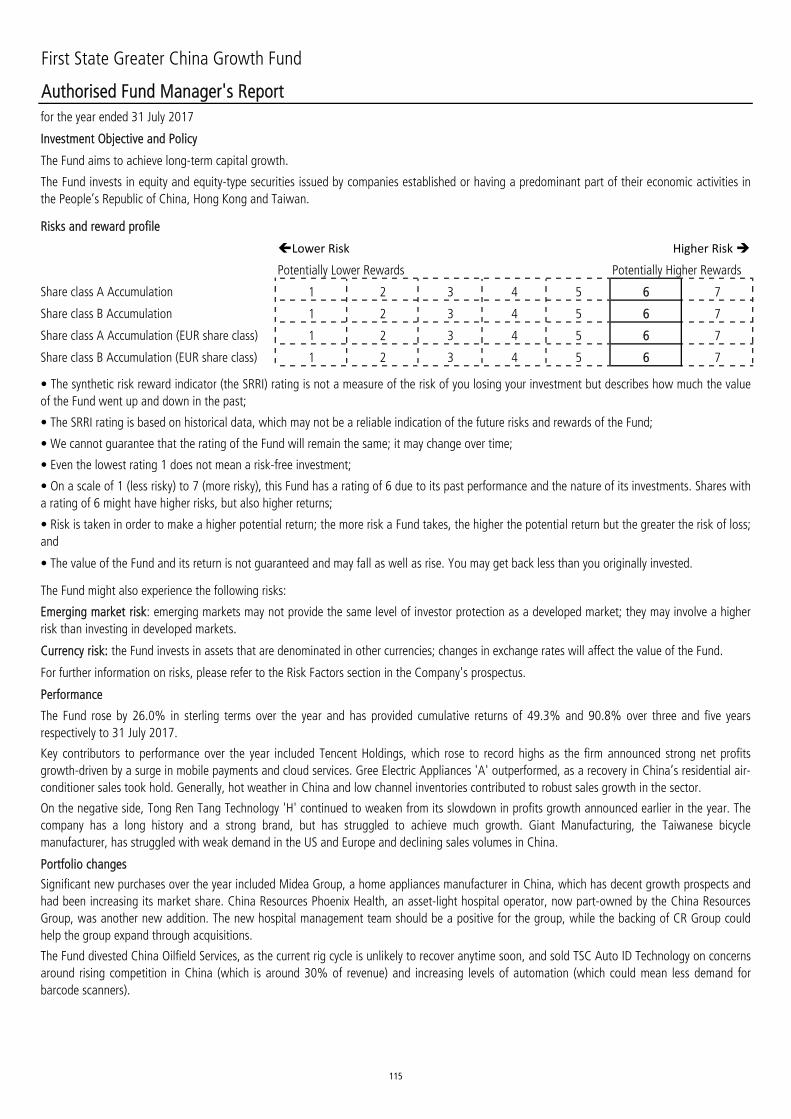
Risks and reward profile
Lower Risk Higher Risk
Potentially Lower Rewards Potentially Higher Rewards
1 2 3 4 5 6 7
1 2 3 4 5 6 7
1 2 3 4 5 6 7
1 2 3 4 5 6 7
Share class A Accumulation
Share class B Accumulation
Share class A Accumulation (EUR share class)
Share class B Accumulation (EUR share class)
The Fund divested China Oilfield Services, as the current rig cycle is unlikely to recover anytime soon, and sold TSC Auto ID Technology on concernsaround rising competition in China (which is around 30% of revenue) and increasing levels of automation (which could mean less demand forbarcode scanners).
• Risk is taken in order to make a higher potential return; the more risk a Fund takes, the higher the potential return but the greater the risk of loss;and
Significant new purchases over the year included Midea Group, a home appliances manufacturer in China, which has decent growth prospects andhad been increasing its market share. China Resources Phoenix Health, an asset-light hospital operator, now part-owned by the China ResourcesGroup, was another new addition. The new hospital management team should be a positive for the group, while the backing of CR Group couldhelp the group expand through acquisitions.
Portfolio changes
Performance
Key contributors to performance over the year included Tencent Holdings, which rose to record highs as the firm announced strong net profitsgrowth-driven by a surge in mobile payments and cloud services. Gree Electric Appliances 'A' outperformed, as a recovery in China’s residential air-conditioner sales took hold. Generally, hot weather in China and low channel inventories contributed to robust sales growth in the sector.
The Fund rose by 26.0% in sterling terms over the year and has provided cumulative returns of 49.3% and 90.8% over three and five yearsrespectively to 31 July 2017.
On the negative side, Tong Ren Tang Technology 'H' continued to weaken from its slowdown in profits growth announced earlier in the year. Thecompany has a long history and a strong brand, but has struggled to achieve much growth. Giant Manufacturing, the Taiwanese bicyclemanufacturer, has struggled with weak demand in the US and Europe and declining sales volumes in China.
• We cannot guarantee that the rating of the Fund will remain the same; it may change over time;
For further information on risks, please refer to the Risk Factors section in the Company's prospectus.
First State Greater China Growth Fund
Investment Objective and Policy
The Fund aims to achieve long-term capital growth.
for the year ended 31 July 2017
Authorised Fund Manager's Report
The Fund invests in equity and equity-type securities issued by companies established or having a predominant part of their economic activities inthe People’s Republic of China, Hong Kong and Taiwan.
• The synthetic risk reward indicator (the SRRI) rating is not a measure of the risk of you losing your investment but describes how much the valueof the Fund went up and down in the past;
• The SRRI rating is based on historical data, which may not be a reliable indication of the future risks and rewards of the Fund;
• On a scale of 1 (less risky) to 7 (more risky), this Fund has a rating of 6 due to its past performance and the nature of its investments. Shares witha rating of 6 might have higher risks, but also higher returns;
Currency risk: the Fund invests in assets that are denominated in other currencies; changes in exchange rates will affect the value of the Fund.
Emerging market risk: emerging markets may not provide the same level of investor protection as a developed market; they may involve a higherrisk than investing in developed markets.
The Fund might also experience the following risks:
• The value of the Fund and its return is not guaranteed and may fall as well as rise. You may get back less than you originally invested.
• Even the lowest rating 1 does not mean a risk-free investment;
115
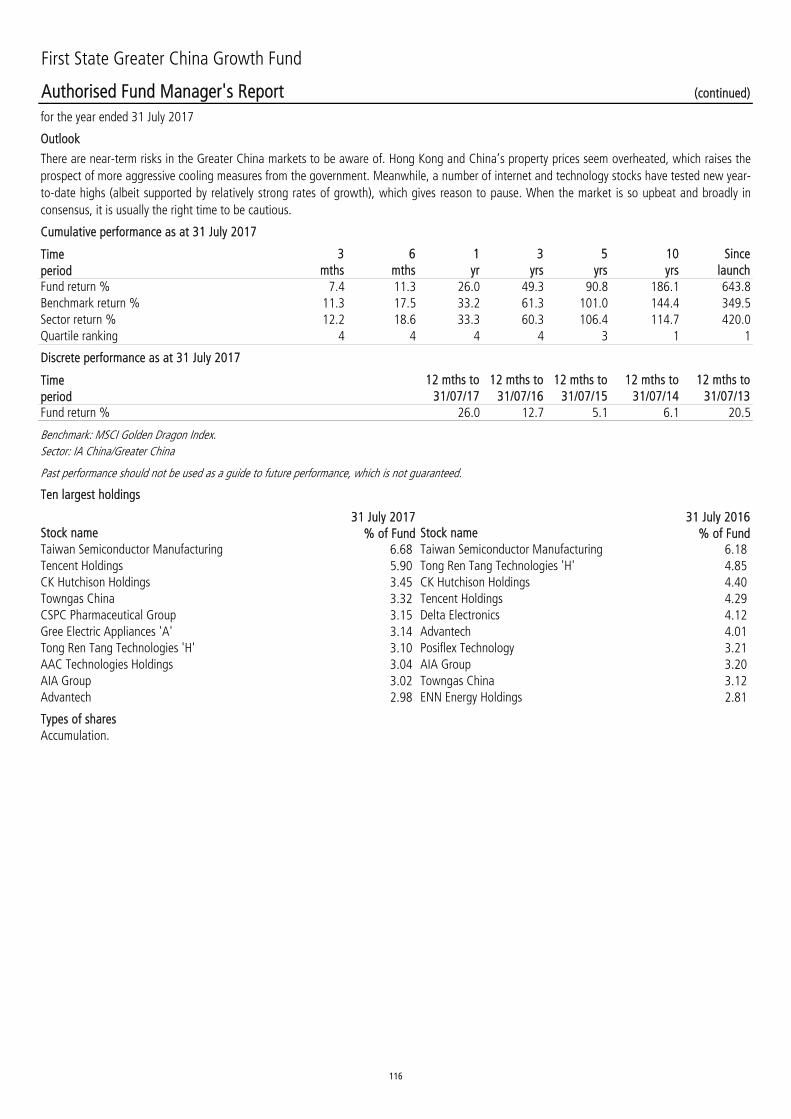
(continued)
First State Greater China Growth Fund
for the year ended 31 July 2017
Authorised Fund Manager's Report
Time 3 6 1 3 5 10 Sinceperiod mths mths yr yrs yrs yrs launch
7.4 11.3 26.0 49.3 90.8 186.1 643.8 11.3 17.5 33.2 61.3 101.0 144.4 349.5 12.2 18.6 33.3 60.3 106.4 114.7 420.0
4 4 4 4 3 1 1
12 mths to 12 mths to 12 mths to 12 mths to 12 mths to31/07/17 31/07/16 31/07/15 31/07/14 31/07/13
26.0 12.7 5.1 6.1 20.5
31 July 2017 31 July 2016% of Fund % of Fund
6.68 6.185.90 4.853.45 4.403.32 4.293.15 4.123.14 4.013.10 3.213.04 3.203.02 3.122.98 2.81
Tencent Holdings
Stock nameTaiwan Semiconductor Manufacturing Taiwan Semiconductor Manufacturing
Types of shares
AAC Technologies Holdings AIA GroupAIA Group Towngas ChinaAdvantech
CSPC Pharmaceutical Group Delta Electronics
ENN Energy Holdings
Gree Electric Appliances 'A' AdvantechTong Ren Tang Technologies 'H' Posiflex Technology
CK Hutchison Holdings CK Hutchison HoldingsTowngas China
Accumulation.
Discrete performance as at 31 July 2017
Fund return %Benchmark return %
Cumulative performance as at 31 July 2017
There are near-term risks in the Greater China markets to be aware of. Hong Kong and China’s property prices seem overheated, which raises theprospect of more aggressive cooling measures from the government. Meanwhile, a number of internet and technology stocks have tested new year-to-date highs (albeit supported by relatively strong rates of growth), which gives reason to pause. When the market is so upbeat and broadly inconsensus, it is usually the right time to be cautious.
Past performance should not be used as a guide to future performance, which is not guaranteed.
Benchmark: MSCI Golden Dragon Index.
Tencent Holdings Tong Ren Tang Technologies 'H'
Ten largest holdings
Stock name
periodFund return %
Sector: IA China/Greater China
Time
Sector return %
Outlook
Quartile ranking
116
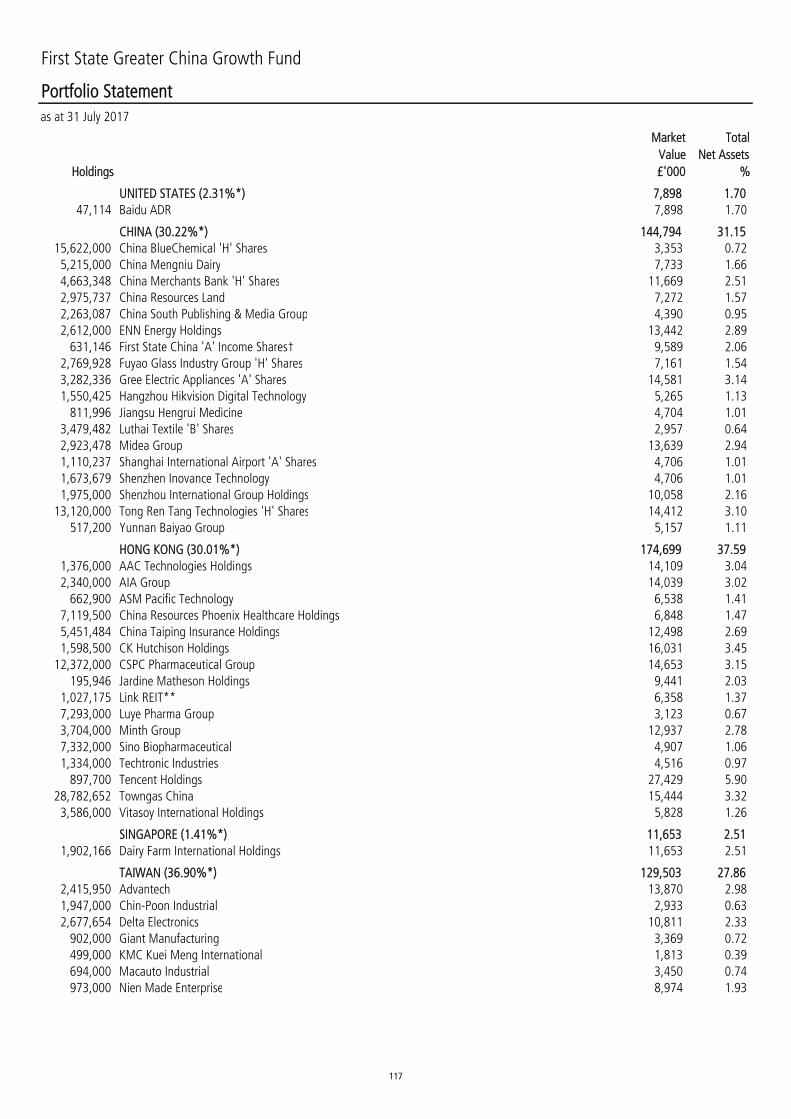
Holdings
MarketValue£'000
TotalNet Assets
%
UNITED STATES (2.31%*) 7,898 1.7047,114 Baidu ADR 7,898 1.70
CHINA (30.22%*) 144,794 31.1515,622,000 China BlueChemical 'H' Shares 3,353 0.72
5,215,000 China Mengniu Dairy 7,733 1.664,663,348 China Merchants Bank 'H' Shares 11,669 2.512,975,737 China Resources Land 7,272 1.572,263,087 China South Publishing & Media Group 4,390 0.952,612,000 ENN Energy Holdings 13,442 2.89
631,146 First State China 'A' Income Shares† 9,589 2.062,769,928 Fuyao Glass Industry Group 'H' Shares 7,161 1.543,282,336 Gree Electric Appliances 'A' Shares 14,581 3.141,550,425 Hangzhou Hikvision Digital Technology 5,265 1.13
811,996 Jiangsu Hengrui Medicine 4,704 1.013,479,482 Luthai Textile 'B' Shares 2,957 0.642,923,478 Midea Group 13,639 2.941,110,237 Shanghai International Airport 'A' Shares 4,706 1.011,673,679 Shenzhen Inovance Technology 4,706 1.011,975,000 Shenzhou International Group Holdings 10,058 2.16
13,120,000 Tong Ren Tang Technologies 'H' Shares 14,412 3.10517,200 Yunnan Baiyao Group 5,157 1.11
HONG KONG (30.01%*) 174,699 37.591,376,000 AAC Technologies Holdings 14,109 3.042,340,000 AIA Group 14,039 3.02
662,900 ASM Pacific Technology 6,538 1.417,119,500 China Resources Phoenix Healthcare Holdings 6,848 1.475,451,484 China Taiping Insurance Holdings 12,498 2.691,598,500 CK Hutchison Holdings 16,031 3.45
12,372,000 CSPC Pharmaceutical Group 14,653 3.15195,946 Jardine Matheson Holdings 9,441 2.03
1,027,175 Link REIT** 6,358 1.377,293,000 Luye Pharma Group 3,123 0.673,704,000 Minth Group 12,937 2.787,332,000 Sino Biopharmaceutical 4,907 1.061,334,000 Techtronic Industries 4,516 0.97
897,700 Tencent Holdings 27,429 5.9028,782,652 Towngas China 15,444 3.32
3,586,000 Vitasoy International Holdings 5,828 1.26
SINGAPORE (1.41%*) 11,653 2.511,902,166 Dairy Farm International Holdings 11,653 2.51
TAIWAN (36.90%*) 129,503 27.862,415,950 Advantech 13,870 2.981,947,000 Chin-Poon Industrial 2,933 0.632,677,654 Delta Electronics 10,811 2.33
902,000 Giant Manufacturing 3,369 0.72499,000 KMC Kuei Meng International 1,813 0.39694,000 Macauto Industrial 3,450 0.74973,000 Nien Made Enterprise 8,974 1.93
First State Greater China Growth Fund
as at 31 July 2017
Portfolio Statement
117
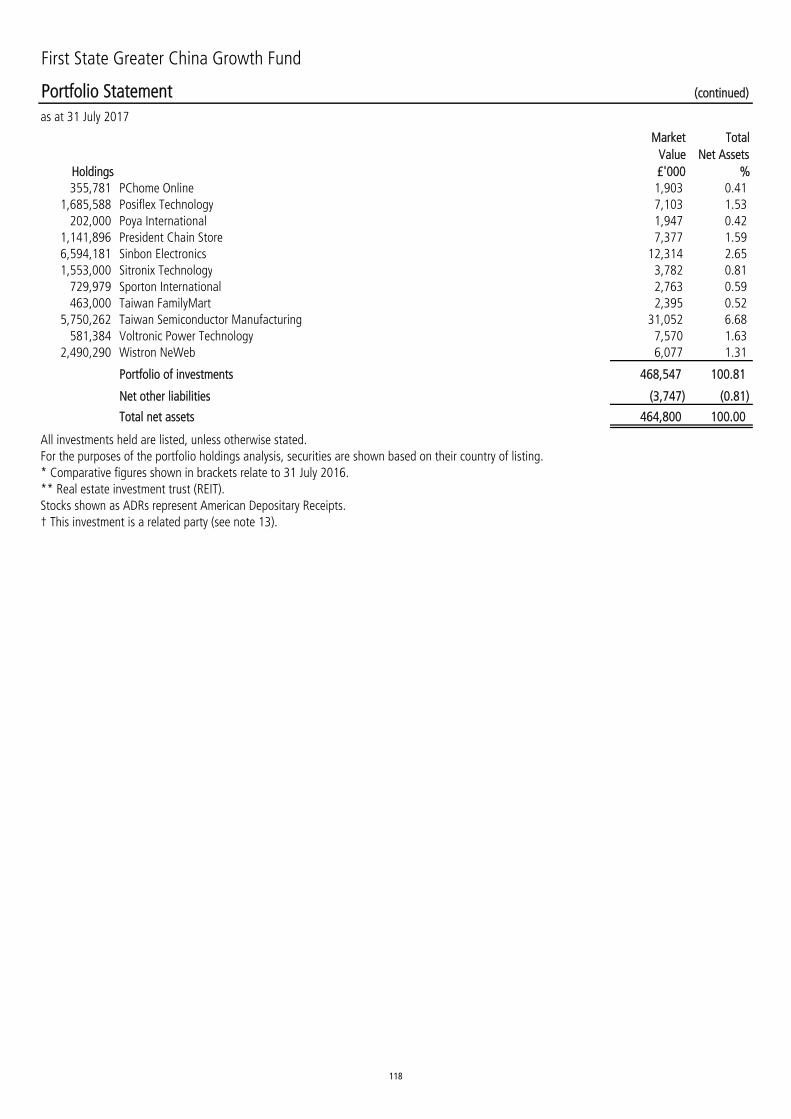
Holdings
MarketValue£'000
TotalNet Assets
%
First State Greater China Growth Fund
as at 31 July 2017
(continued)Portfolio Statement
355,781 PChome Online 1,903 0.411,685,588 Posiflex Technology 7,103 1.53
202,000 Poya International 1,947 0.421,141,896 President Chain Store 7,377 1.596,594,181 Sinbon Electronics 12,314 2.651,553,000 Sitronix Technology 3,782 0.81
729,979 Sporton International 2,763 0.59463,000 Taiwan FamilyMart 2,395 0.52
5,750,262 Taiwan Semiconductor Manufacturing 31,052 6.68581,384 Voltronic Power Technology 7,570 1.63
2,490,290 Wistron NeWeb 6,077 1.31
Portfolio of investments 468,547 100.81
Net other liabilities (3,747) (0.81)
Total net assets 464,800 100.00
* Comparative figures shown in brackets relate to 31 July 2016.
Stocks shown as ADRs represent American Depositary Receipts.
All investments held are listed, unless otherwise stated.For the purposes of the portfolio holdings analysis, securities are shown based on their country of listing.
** Real estate investment trust (REIT).
† This investment is a related party (see note 13).
118

Share class A Accumulation
Change in net assets per share
Opening net asset value per share
Return before operating charges*
Operating charges
Return after operating charges*
Distributions
Retained distributions on accumulation shares
Closing net asset value per share (p)
* after direct transaction costs of:
Performance
Return after charges (%)
Other information
Closing net asset value (£’000)
Closing number of shares
Operating charges
Direct transaction costs
Prices
Highest share price
Lowest share price 584.99 436.69 479.24
0.15% 0.15% 0.16%
756.43 598.03 638.30
1.84% 1.84% 1.82%
147,748 130,287 203,541
19,890,913 22,104,621 38,974,106
26.02% 12.86% 4.97%
742.79 589.41 522.25
0.99 0.75 0.86
7.20 1.84 4.77
153.38 67.16 24.71
(7.20) (1.84) (4.77)
165.78 76.46 34.42
(12.40) (9.30) (9.71)
589.41 522.25 497.54
First State Greater China Growth Fund
Comparative Tablefor the year ended 31 July 2017
Net Asset Value and Ongoing Charges Figure
Final 31 July 2017(p)
Final 31 July 2016(p)
Final 31 July 2015(p)
119
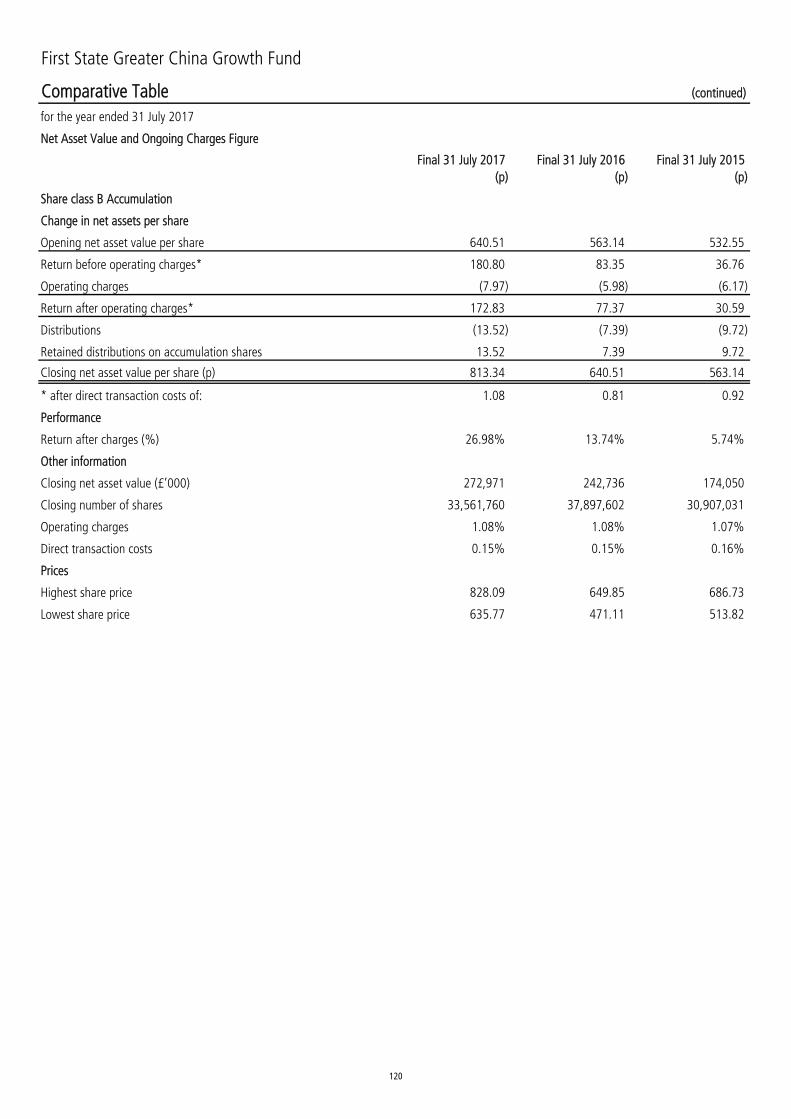
First State Greater China Growth Fund
Comparative Table (continued)
for the year ended 31 July 2017
Net Asset Value and Ongoing Charges Figure
Share class B Accumulation
Change in net assets per share
Opening net asset value per share
Return before operating charges*
Operating charges
Return after operating charges*
Distributions
Retained distributions on accumulation shares
Closing net asset value per share (p)
* after direct transaction costs of:
Performance
Return after charges (%)
Other information
Closing net asset value (£’000)
Closing number of shares
Operating charges
Direct transaction costs
Prices
Highest share price
Lowest share price 635.77 471.11 513.82
0.15% 0.15% 0.16%
828.09 649.85 686.73
1.08% 1.08% 1.07%
272,971 242,736 174,050
33,561,760 37,897,602 30,907,031
26.98% 13.74% 5.74%
813.34 640.51 563.14
1.08 0.81 0.92
13.52 7.39 9.72
172.83 77.37 30.59
(13.52) (7.39) (9.72)
180.80 83.35 36.76
(7.97) (5.98) (6.17)
640.51 563.14 532.55
Final 31 July 2017(p)
Final 31 July 2016(p)
Final 31 July 2015(p)
120
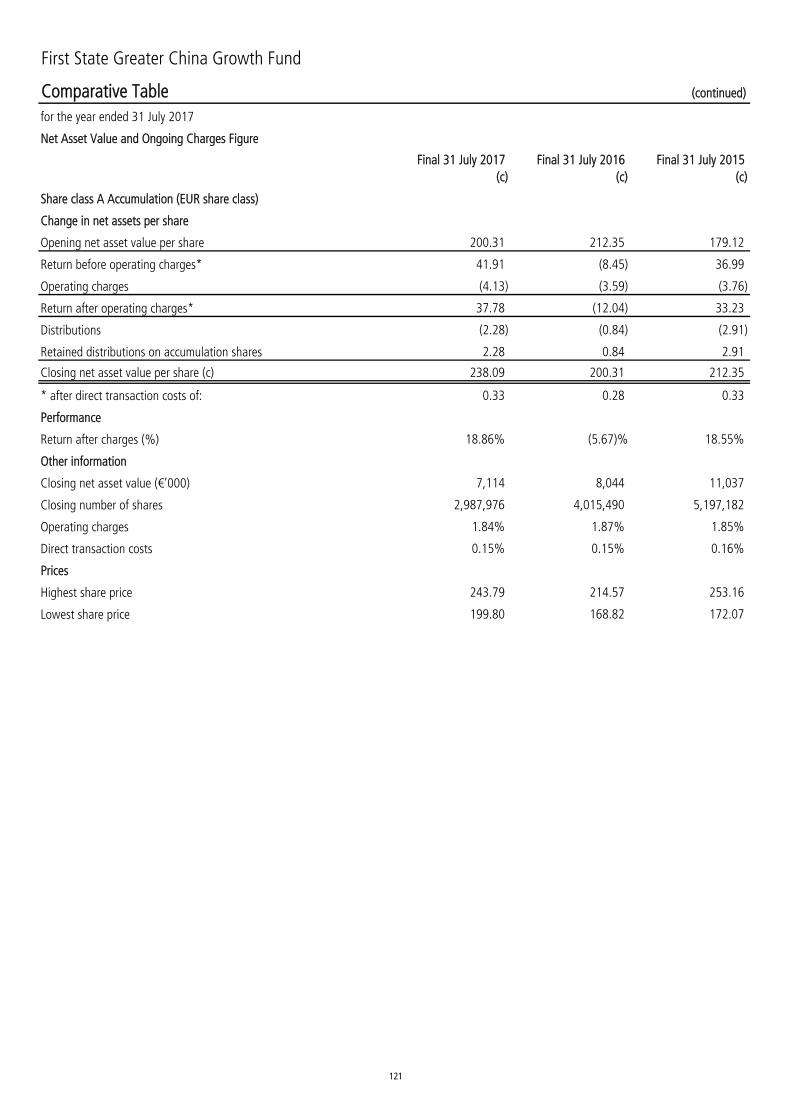
First State Greater China Growth Fund
Comparative Table (continued)
for the year ended 31 July 2017
Net Asset Value and Ongoing Charges Figure
Share class A Accumulation (EUR share class)
Change in net assets per share
Opening net asset value per share
Return before operating charges*
Operating charges
Return after operating charges*
Distributions
Retained distributions on accumulation shares
Closing net asset value per share (c)
* after direct transaction costs of:
Performance
Return after charges (%)
Other information
Closing net asset value (€’000)
Closing number of shares
Operating charges
Direct transaction costs
Prices
Highest share price
Lowest share price 199.80 168.82 172.07
0.15% 0.15% 0.16%
243.79 214.57 253.16
1.84% 1.87% 1.85%
7,114 8,044 11,037
2,987,976 4,015,490 5,197,182
18.86% (5.67)% 18.55%
238.09 200.31 212.35
0.33 0.28 0.33
2.28 0.84 2.91
37.78 (12.04) 33.23
(2.28) (0.84) (2.91)
41.91 (8.45) 36.99
(4.13) (3.59) (3.76)
200.31 212.35 179.12
Final 31 July 2017(c)
Final 31 July 2016(c)
Final 31 July 2015(c)
121

First State Greater China Growth Fund
Comparative Table (continued)
for the year ended 31 July 2017
Net Asset Value and Ongoing Charges Figure
Share class B Accumulation (EUR share class)
Change in net assets per share
Opening net asset value per share
Return before operating charges*
Operating charges
Return after operating charges*
Distributions
Retained distributions on accumulation shares
Closing net asset value per share (c)
* after direct transaction costs of:
Performance
Return after charges (%)
Other information
Closing net asset value (€’000)
Closing number of shares
Operating charges
Direct transaction costs
Prices
Highest share price
Lowest share price 160.37 134.96 136.63
0.15% 0.15% 0.16%
197.18 170.88 201.53
1.05% 1.05% 1.04%
42,195 52,340 64,257
21,907,399 32,556,745 38,005,165
19.81% (4.92)% 18.97%
192.60 160.76 169.07
0.26 0.23 0.26
3.29 1.86 2.94
31.84 (8.31) 26.96
(3.29) (1.86) (2.94)
33.74 (6.70) 28.64
(1.90) (1.61) (1.68)
160.76 169.07 142.11
Final 31 July 2017(c)
Final 31 July 2016(c)
Final 31 July 2015(c)
122
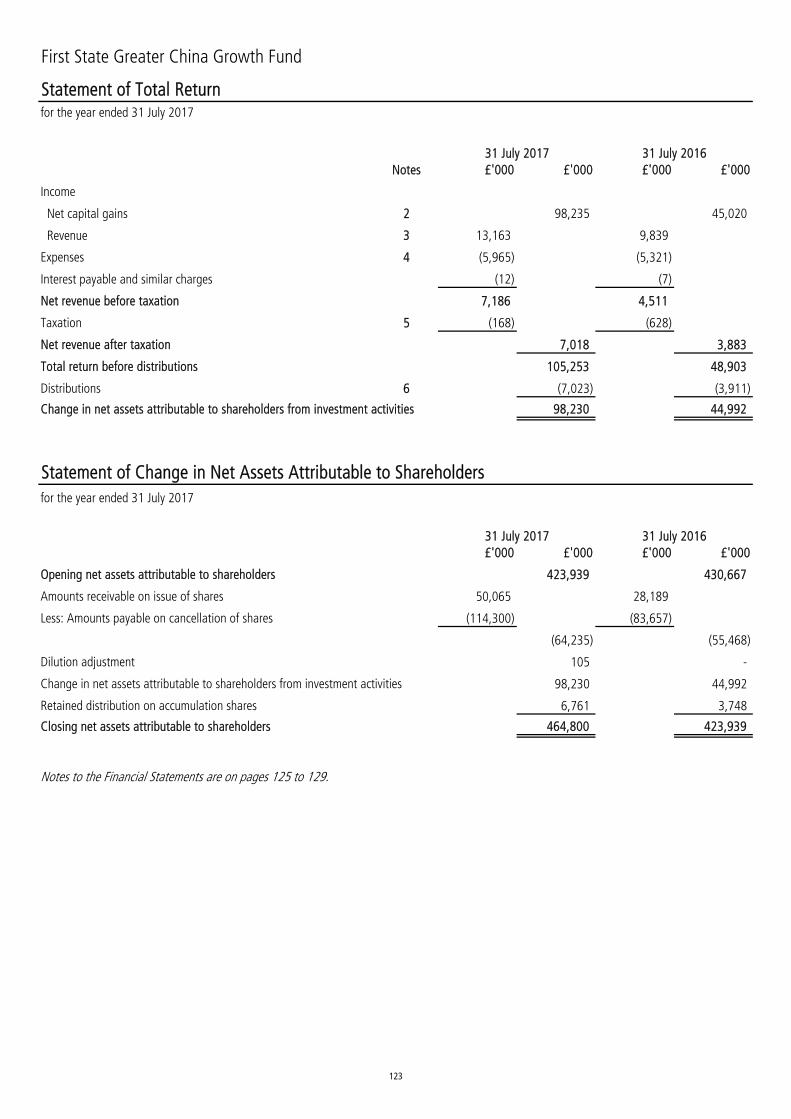
Notes £'000 £'000 £'000 £'000
Net capital gains 2 98,235 45,020
Revenue 3 13,163 9,839
4 (5,965) (5,321)
Interest payable and similar charges (12) (7)
7,186 4,511
5 (168) (628)
7,018 3,883
105,253 48,903
6 (7,023) (3,911)
98,230 44,992
£'000 £'000 £'000 £'000
423,939 430,667
50,065 28,189
(114,300) (83,657)
(64,235) (55,468)
105 -
98,230 44,992
6,761 3,748
464,800 423,939Closing net assets attributable to shareholders
Notes to the Financial Statements are on pages 125 to 129.
31 July 2017
Dilution adjustment
Less: Amounts payable on cancellation of shares
Amounts receivable on issue of shares
Change in net assets attributable to shareholders from investment activities
31 July 2016
Net revenue before taxation
Net revenue after taxation
Statement of Change in Net Assets Attributable to Shareholders
Taxation
Distributions
Expenses
for the year ended 31 July 2017
31 July 2016
Opening net assets attributable to shareholders
First State Greater China Growth Fund
Statement of Total Returnfor the year ended 31 July 2017
Total return before distributions
Change in net assets attributable to shareholders from investment activities
31 July 2017
Income
Retained distribution on accumulation shares
123
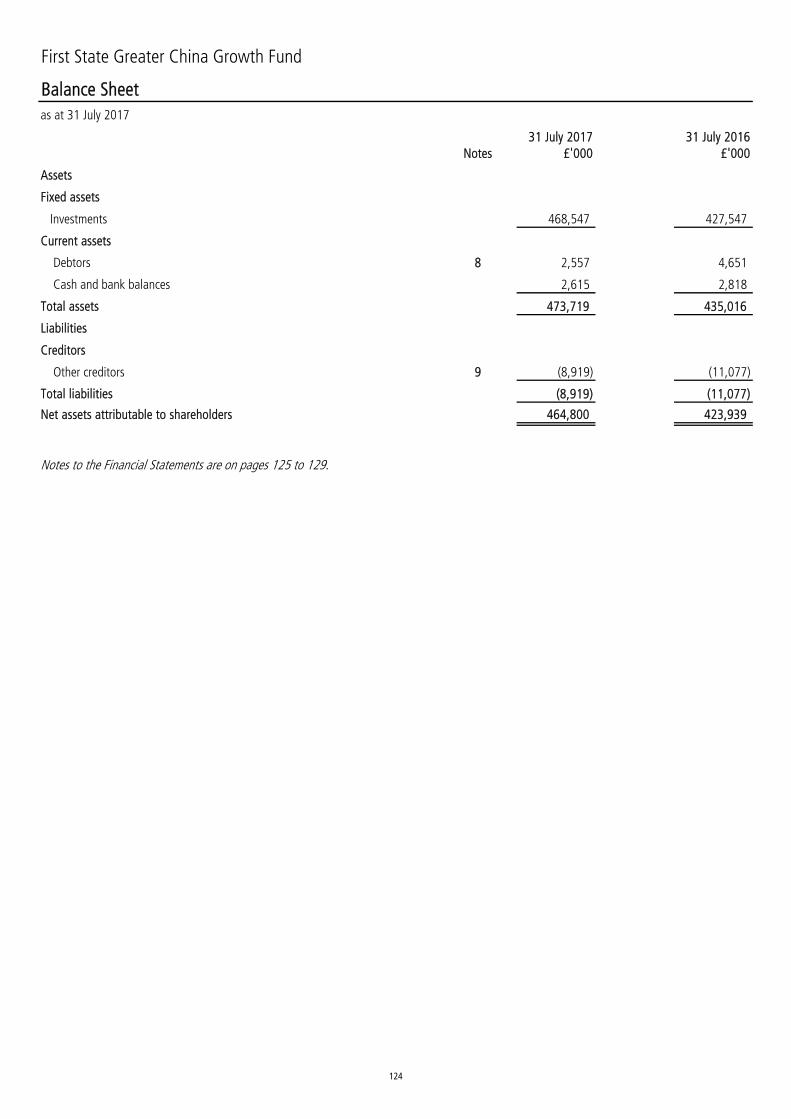
First State Greater China Growth Fund
31 July 2017 31 July 2016Notes £'000 £'000
Investments 468,547 427,547
Current assets
8 2,557 4,651
2,615 2,818
473,719 435,016
Creditors
Other creditors 9 (8,919) (11,077)
(8,919) (11,077)
464,800 423,939
Balance Sheetas at 31 July 2017
Notes to the Financial Statements are on pages 125 to 129.
Fixed assets
Total assets
Liabilities
Debtors
Assets
Net assets attributable to shareholders
Cash and bank balances
Total liabilities
124
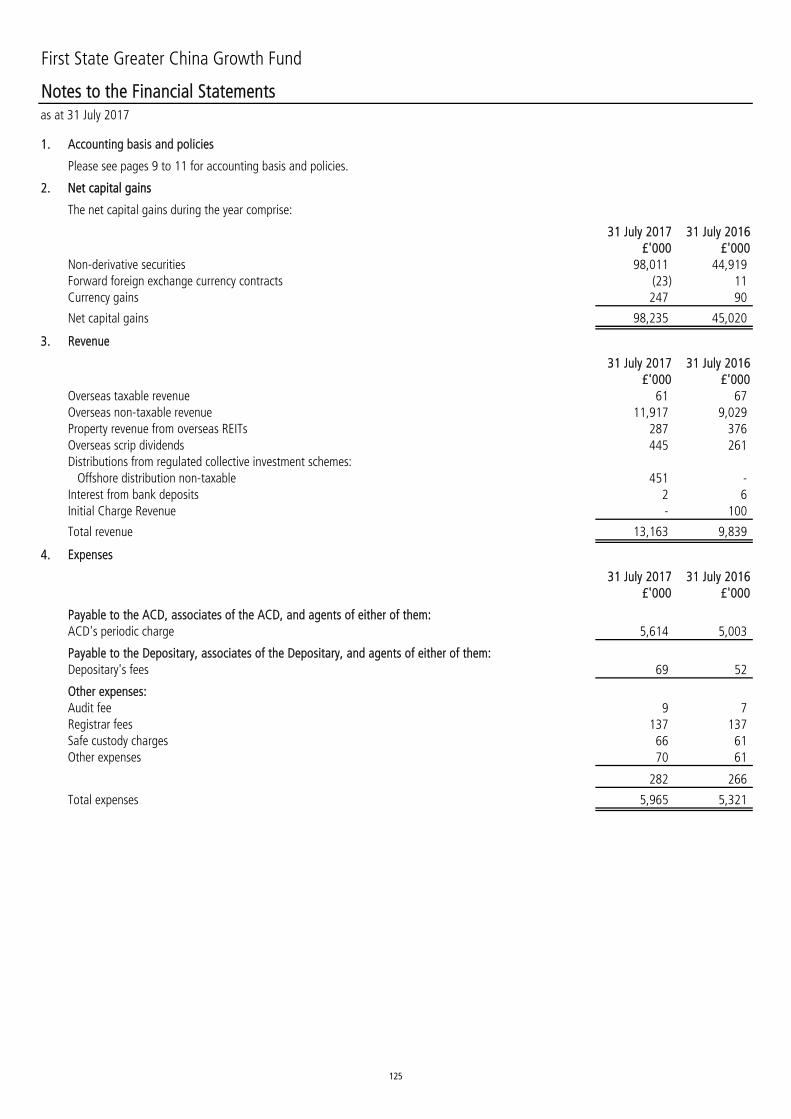
1.
2.
31 July 2017 31 July 2016£'000 £'000
98,011 44,919(23) 11247 90
98,235 45,020
3.
31 July 2017 31 July 2016£'000 £'000
61 6711,917 9,029
287 376445 261
451 -2 6- 100
13,163 9,839
4.
31 July 2017 31 July 2016£'000 £'000
5,614 5,003
69 52
9 7137 137
66 6170 61
282 266
5,965 5,321
Distributions from regulated collective investment schemes: Offshore distribution non-taxable
Net capital gains
Revenue
Expenses
Overseas non-taxable revenueProperty revenue from overseas REITs
Overseas taxable revenue
Overseas scrip dividends
Please see pages 9 to 11 for accounting basis and policies.
Net capital gains
The net capital gains during the year comprise:
Non-derivative securities
First State Greater China Growth Fund
Notes to the Financial Statements
Accounting basis and policies
as at 31 July 2017
Forward foreign exchange currency contracts
Total expenses
Other expenses
Registrar fees
Other expenses:
Payable to the ACD, associates of the ACD, and agents of either of them:
Audit fee
Total revenue
Interest from bank deposits
ACD's periodic charge
Currency gains
Safe custody charges
Payable to the Depositary, associates of the Depositary, and agents of either of them:
Initial Charge Revenue
Depositary's fees
125
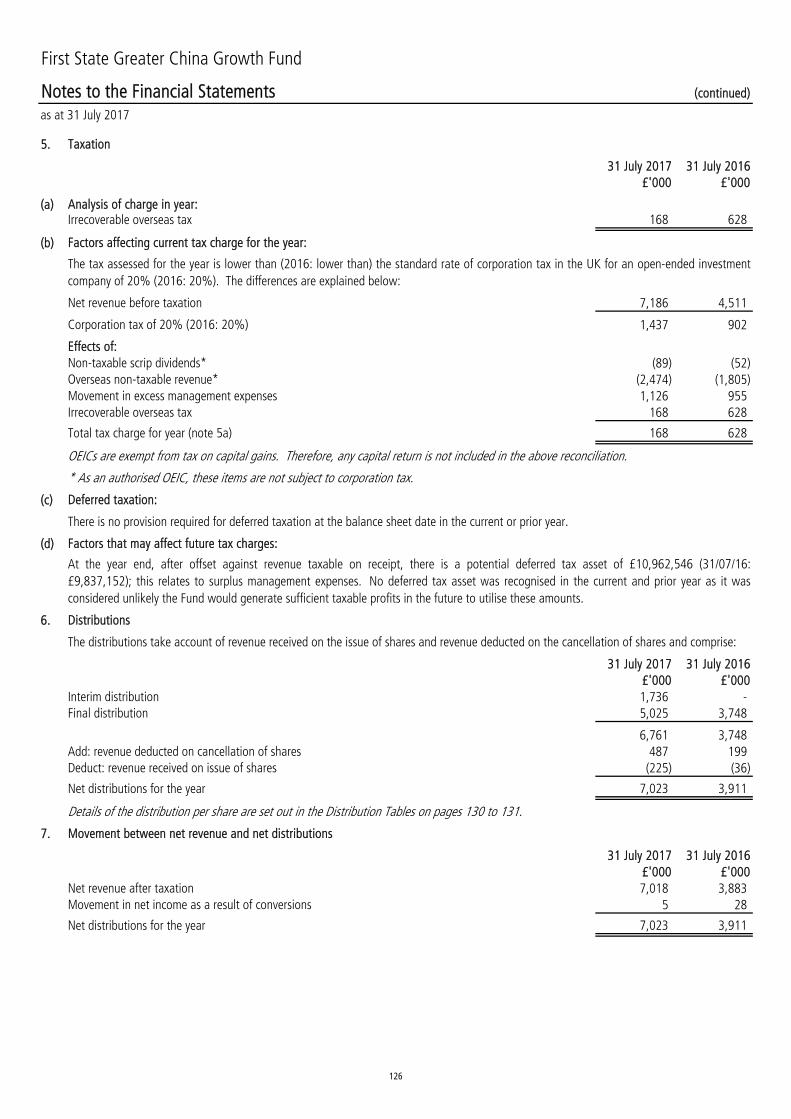
First State Greater China Growth Fund
(continued)Notes to the Financial Statementsas at 31 July 2017
5.
31 July 2017 31 July 2016£'000 £'000
(a)168 628
(b)
7,186 4,511
1,437 902
(89) (52)(2,474) (1,805)1,126 955
168 628
168 628
(c)
(d)
6.
31 July 2017 31 July 2016£'000 £'0001,736 -5,025 3,748
6,761 3,748487 199
(225) (36)
7,023 3,911
7.
31 July 2017 31 July 2016£'000 £'0007,018 3,883
5 28
7,023 3,911
Distributions
Interim distribution
Movement in net income as a result of conversions
Movement between net revenue and net distributions
Movement in excess management expensesIrrecoverable overseas tax
Net distributions for the year
Details of the distribution per share are set out in the Distribution Tables on pages 130 to 131.
Net distributions for the year
Deduct: revenue received on issue of shares
Final distribution
Add: revenue deducted on cancellation of shares
OEICs are exempt from tax on capital gains. Therefore, any capital return is not included in the above reconciliation.
There is no provision required for deferred taxation at the balance sheet date in the current or prior year.
At the year end, after offset against revenue taxable on receipt, there is a potential deferred tax asset of £10,962,546 (31/07/16:£9,837,152); this relates to surplus management expenses. No deferred tax asset was recognised in the current and prior year as it wasconsidered unlikely the Fund would generate sufficient taxable profits in the future to utilise these amounts.
Factors that may affect future tax charges:
Net revenue before taxation
Irrecoverable overseas tax
The tax assessed for the year is lower than (2016: lower than) the standard rate of corporation tax in the UK for an open-ended investmentcompany of 20% (2016: 20%). The differences are explained below:
Factors affecting current tax charge for the year:
Taxation
Analysis of charge in year:
Corporation tax of 20% (2016: 20%)
Effects of:Non-taxable scrip dividends*Overseas non-taxable revenue*
Total tax charge for year (note 5a)
Deferred taxation:
* As an authorised OEIC, these items are not subject to corporation tax.
The distributions take account of revenue received on the issue of shares and revenue deducted on the cancellation of shares and comprise:
Net revenue after taxation
126
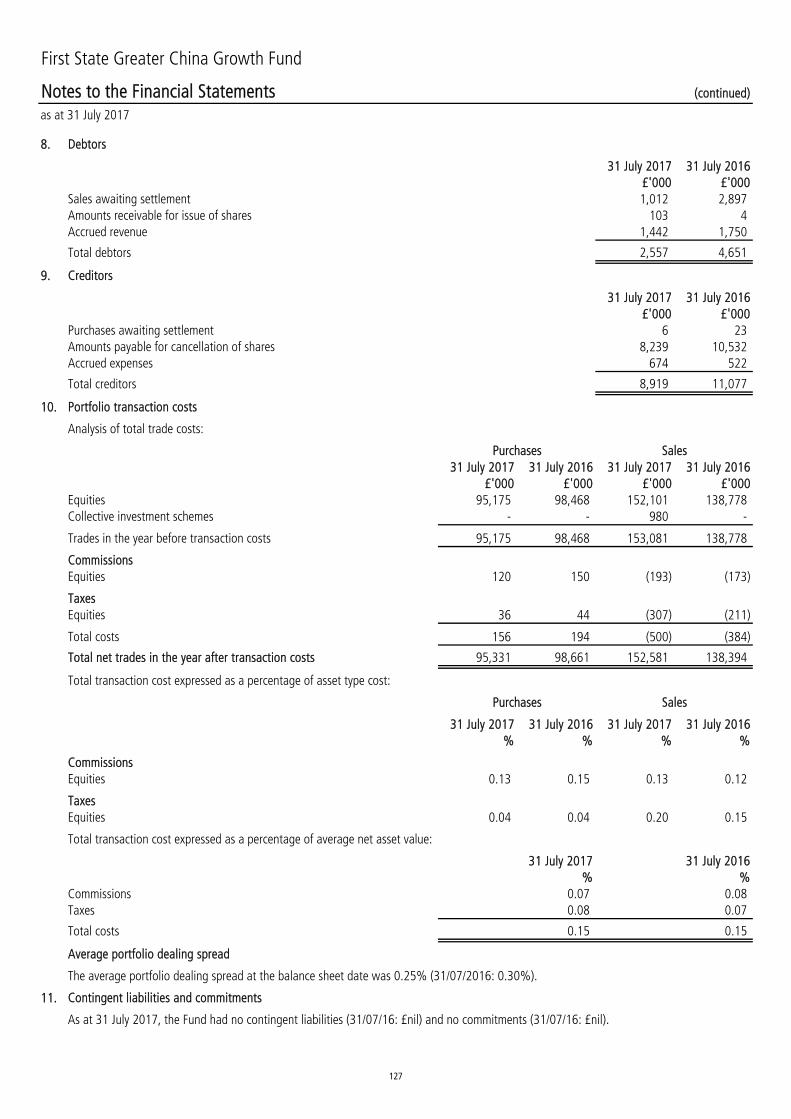
First State Greater China Growth Fund
(continued)Notes to the Financial Statementsas at 31 July 2017
8.
31 July 2017 31 July 2016£'000 £'0001,012 2,897
103 41,442 1,750
2,557 4,651
9.
31 July 2017 31 July 2016£'000 £'000
6 238,239 10,532
674 522
8,919 11,077
10.
31 July 2017 31 July 2016 31 July 2017 31 July 2016£'000 £'000 £'000 £'000
95,175 98,468 152,101 138,778- - 980 -
95,175 98,468 153,081 138,778
120 150 (193) (173)
36 44 (307) (211)
156 194 (500) (384)
95,331 98,661 152,581 138,394
31 July 2017 31 July 2016 31 July 2017 31 July 2016% % % %
0.13 0.15 0.13 0.12
0.04 0.04 0.20 0.15
11.
Taxes
0.15
31 July 2017
Total transaction cost expressed as a percentage of average net asset value:
0.07
Total costs
0.08
As at 31 July 2017, the Fund had no contingent liabilities (31/07/16: £nil) and no commitments (31/07/16: £nil).
Average portfolio dealing spread
0.15
The average portfolio dealing spread at the balance sheet date was 0.25% (31/07/2016: 0.30%).
31 July 2016% %
Commissions
Taxes
Total net trades in the year after transaction costs
Equities
Purchases
Amounts payable for cancellation of shares
Collective investment schemes
Purchases awaiting settlement
Trades in the year before transaction costs
Creditors
Total creditors
Portfolio transaction costs
Total costs
Taxes
Equities
Equities
Total transaction cost expressed as a percentage of asset type cost:
Purchases Sales
CommissionsEquities
Equities
Contingent liabilities and commitments
Analysis of total trade costs:
Total debtors
Accrued expenses
Amounts receivable for issue of sharesSales awaiting settlement
Debtors
Accrued revenue
Commissions 0.07 0.08
Sales
127

First State Greater China Growth Fund
(continued)Notes to the Financial Statementsas at 31 July 2017
12.
(a)
(b)
(c)
Total TotalCurrency £'000 £'000Chinese yuan 57,148 56,930Euro (4,814) 388Hong Kong dollar 243,527 192,910Taiwanese dollar 131,142 159,673US dollar 39,564 23,769
Total 466,567 433,670
Derivatives and other financial instruments
Net foreign currency assets
In pursuing its investment objectives, the Fund holds equity shares.
The main risk arising from the Fund’s financial instruments is market-price risk. Market-price risk arises mainly from uncertainty about futureprices of the financial instruments held. Investment risk in the portfolio is regularly reviewed and controlled through the adoption ofparameters limiting exposures to various factors such as industries, countries, and company size.
The Fund has little exposure to credit or cash-flow risk. Certain transactions in securities that the Fund enters into expose it to the risk thatthe counter-party will not deliver the investment (purchase) or cash (sale) after the Fund has fulfilled its responsibilities. The Fund only buysand sells investments through brokers that have been approved by the Authorised Corporate Director as an acceptable counter-party. This listis reviewed quarterly. The Fund’s assets comprise mainly realisable securities that can be readily sold in normal market conditions.
The Fund’s main liability is the redemption of any shares that investors wish to sell. In general, the ACD manages the cash to ensure that itcan meet its liabilities. Assets from a Fund may need to be sold if insufficient cash is available to finance such redemptions. The Fund’sholdings are reviewed on a regular basis, with particular emphasis on the market capitalisation of the issuer (securities issued by largercapitalised companies generally have greater liquidity) and the number of days it would take to trade out of a given securities position orpercentage of the Fund as a whole (determined by reference to available market trading volumes). Funds that have a higher concentration ofsecurities that are deemed to be less liquid are regularly monitored.
As a proportion of the Fund’s investment portfolio is invested in overseas securities, the Balance Sheet can be affected by movements inforeign exchange rates. The Investment Manager may seek to manage exposure to currency movements by using forward foreign exchangecontracts or by hedging the sterling value of investments that are priced in other currencies. Income received in other currencies is convertedto sterling on or near the date of receipt.
There is no material difference between the value of the financial assets and liabilities, as shown in the Balance Sheet, and their fair value.
Interest-rate risk
As at 31 July 2017, 0.56% (31/07/2016: 0.66%) of the Fund's assets were interest-bearing.
31 July 2017
As at 31 July 2017, the Fund had the following net currency exposure (excluding sterling):
The Fund does not invest in either fixed or floating-rate securities, and interest-rate risk exposure is restricted to interest receivable on bankdeposits or payable on bank overdraft positions that will be affected by fluctuations in interest rates.
Analysis of the Fund's currency exposure
If market prices increase or decrease by 10%, then the impact on the portfolio will be an increase or decrease of 10% (£46,855) (31/07/16:£42,755).
General
Fair value of financial assets and financial liabilities
The following summarises the sterling value of currencies of the Fund in which the investments, including cash, debtors and creditors, aredenominated.
If foreign exchange rates increase or decrease by 5%, then the impact on the NAV will be an increase or decrease of 5.02% (£23,328,336)(31/07/16: 5.11% (£21,684)).
31 July 2016
The market value of investments is taken to equal ‘fair value’ for the purposes of Financial Reporting Standard 102. Given all the activities ofthe Fund, none of the investments held fall within the definition of ‘investments held for trading’ as set out in Financial Reporting Standard13.
Net foreign currency assets
As exposure to interest-rate risk is not significant, no additional numerical or sensitivity analysis is presented.
128
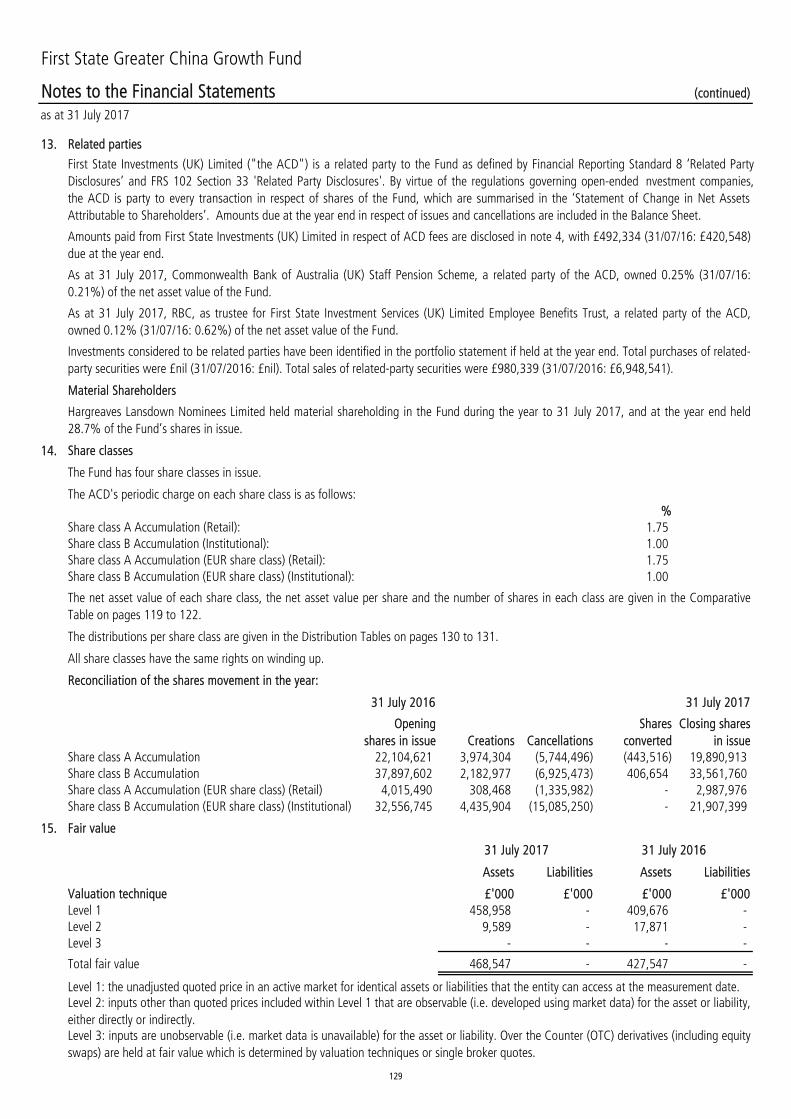
First State Greater China Growth Fund
(continued)Notes to the Financial Statementsas at 31 July 2017
13.
14.
%1.751.001.751.00
31 July 2016 31 July 2017
Opening shares in issue Creations Cancellations
Shares converted
Closing shares in issue
22,104,621 3,974,304 (5,744,496) (443,516) 19,890,91337,897,602 2,182,977 (6,925,473) 406,654 33,561,760
4,015,490 308,468 (1,335,982) - 2,987,97632,556,745 4,435,904 (15,085,250) - 21,907,399
15.
Assets Liabilities Assets Liabilities
£'000 £'000 £'000 £'000458,958 - 409,676 -
9,589 - 17,871 -- - - -
468,547 - 427,547 -
Level 1: the unadjusted quoted price in an active market for identical assets or liabilities that the entity can access at the measurement date. Level 2: inputs other than quoted prices included within Level 1 that are observable (i.e. developed using market data) for the asset or liability,either directly or indirectly.
Share class A Accumulation (EUR share class) (Retail)Share class B Accumulation (EUR share class) (Institutional)
Level 3: inputs are unobservable (i.e. market data is unavailable) for the asset or liability. Over the Counter (OTC) derivatives (including equityswaps) are held at fair value which is determined by valuation techniques or single broker quotes.
Level 1Level 2Level 3
Total fair value
Fair value
Valuation technique
31 July 2017 31 July 2016
All share classes have the same rights on winding up.
First State Investments (UK) Limited ("the ACD") is a related party to the Fund as defined by Financial Reporting Standard 8 ‘Related Party Disclosures’ and FRS 102 Section 33 'Related Party Disclosures'. By virtue of the regulations governing open-ended investment companies, the ACD is party to every transaction in respect of shares of the Fund, which are summarised in the ‘Statement of Change in Net Assets Attributable to Shareholders’. Amounts due at the year end in respect of issues and cancellations are included in the Balance Sheet.
Related parties
Share classes
Hargreaves Lansdown Nominees Limited held material shareholding in the Fund during the year to 31 July 2017, and at the year end held28.7% of the Fund’s shares in issue.
Reconciliation of the shares movement in the year:
Share class A AccumulationShare class B Accumulation
As at 31 July 2017, RBC, as trustee for First State Investment Services (UK) Limited Employee Benefits Trust, a related party of the ACD,owned 0.12% (31/07/16: 0.62%) of the net asset value of the Fund.
Share class B Accumulation (EUR share class) (Institutional):
Share class B Accumulation (Institutional):
Material Shareholders
The distributions per share class are given in the Distribution Tables on pages 130 to 131.
Share class A Accumulation (EUR share class) (Retail):
Share class A Accumulation (Retail):
The ACD's periodic charge on each share class is as follows:
The net asset value of each share class, the net asset value per share and the number of shares in each class are given in the ComparativeTable on pages 119 to 122.
Amounts paid from First State Investments (UK) Limited in respect of ACD fees are disclosed in note 4, with £492,334 (31/07/16: £420,548)due at the year end.
As at 31 July 2017, Commonwealth Bank of Australia (UK) Staff Pension Scheme, a related party of the ACD, owned 0.25% (31/07/16:0.21%) of the net asset value of the Fund.
The Fund has four share classes in issue.
Investments considered to be related parties have been identified in the portfolio statement if held at the year end. Total purchases of related-party securities were £nil (31/07/2016: £nil). Total sales of related-party securities were £980,339 (31/07/2016: £6,948,541).
129
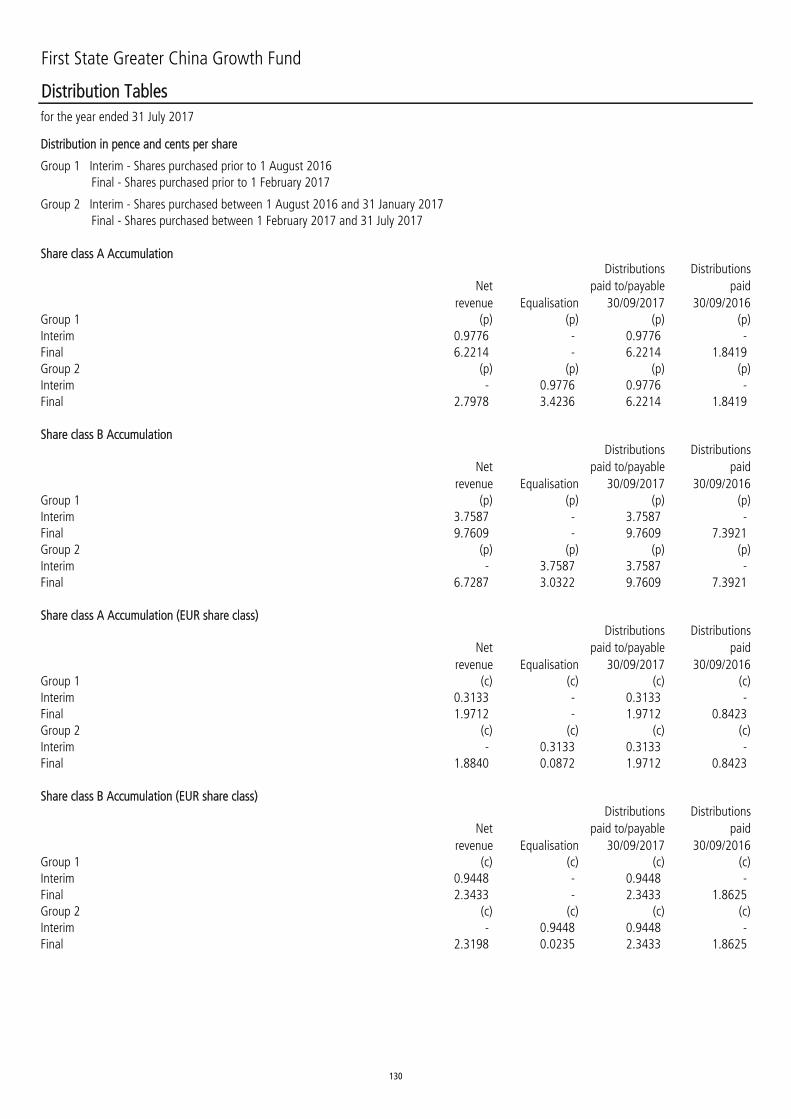
Share class A Accumulation
Netrevenue Equalisation
Distributions paid to/payable
30/09/2017
Distributions paid
30/09/2016Group 1 (p) (p) (p) (p)Interim 0.9776 - 0.9776 -Final 6.2214 - 6.2214 1.8419Group 2 (p) (p) (p) (p)Interim - 0.9776 0.9776 -Final 2.7978 3.4236 6.2214 1.8419
Share class B Accumulation
Netrevenue Equalisation
Distributions paid to/payable
30/09/2017
Distributions paid
30/09/2016Group 1 (p) (p) (p) (p)Interim 3.7587 - 3.7587 -Final 9.7609 - 9.7609 7.3921Group 2 (p) (p) (p) (p)Interim - 3.7587 3.7587 -Final 6.7287 3.0322 9.7609 7.3921
Share class A Accumulation (EUR share class)
Netrevenue Equalisation
Distributions paid to/payable
30/09/2017
Distributions paid
30/09/2016Group 1 (c) (c) (c) (c)Interim 0.3133 - 0.3133 -Final 1.9712 - 1.9712 0.8423Group 2 (c) (c) (c) (c)Interim - 0.3133 0.3133 -Final 1.8840 0.0872 1.9712 0.8423
Share class B Accumulation (EUR share class)
Netrevenue Equalisation
Distributions paid to/payable
30/09/2017
Distributions paid
30/09/2016Group 1 (c) (c) (c) (c)Interim 0.9448 - 0.9448 -Final 2.3433 - 2.3433 1.8625Group 2 (c) (c) (c) (c)Interim - 0.9448 0.9448 -Final 2.3198 0.0235 2.3433 1.8625
Final - Shares purchased between 1 February 2017 and 31 July 2017Group 2 Interim - Shares purchased between 1 August 2016 and 31 January 2017
Final - Shares purchased prior to 1 February 2017
Distribution in pence and cents per share
First State Greater China Growth Fund
Distribution Tablesfor the year ended 31 July 2017
Group 1 Interim - Shares purchased prior to 1 August 2016
130

First State Greater China Growth Fund
Distribution Tables (continued)
for the year ended 31 July 2017
Shareholders should consult their professional advisers for any advice regarding their tax position.
Final - 100.00% of the dividend is received as franked investment income.
Final - 0.00% of the dividend is received as an annual payment (non-foreign element) received after the deduction of income tax at the lower rateand is liable to corporation tax. The tax deemed to be deducted is treated as income tax.
Final - 0.00% of the dividend is received as an annual payment (foreign element) received after the deduction of income tax at the lower rate and isliable to corporation tax. It is treated as foreign income in the hands of the corporate investor and is liable to corporation tax. The associateddeemed tax is treated as foreign tax in the hands of the investor, who may be able to claim double tax relief. Investors cannot reclaim any of thisdeemed tax on the foreign element from HM Revenue & Customs.
Interim - 100.00% of the dividend is received as franked investment income.
Interim - 0.00% of the dividend is received as an annual payment (non-foreign element) received after the deduction of income tax at the lowerrate and is liable to corporation tax. The tax deemed to be deducted is treated as income tax.
Interim - 0.00% of the dividend is received as an annual payment (foreign element) received after the deduction of income tax at the lower rate andis liable to corporation tax. It is treated as foreign income in the hands of the corporate investor, and is liable to corporation tax. The associateddeemed tax is treated as foreign tax in the hands of the investor who may be able to claim double tax relief. Investors cannot reclaim any of thisdeemed tax on the foreign element from HM Revenue & Customs.
Corporate tax for all share classes (unaudited)
A shareholder liable to corporation tax receives this distribution, excluding equalisation, as follows:
131
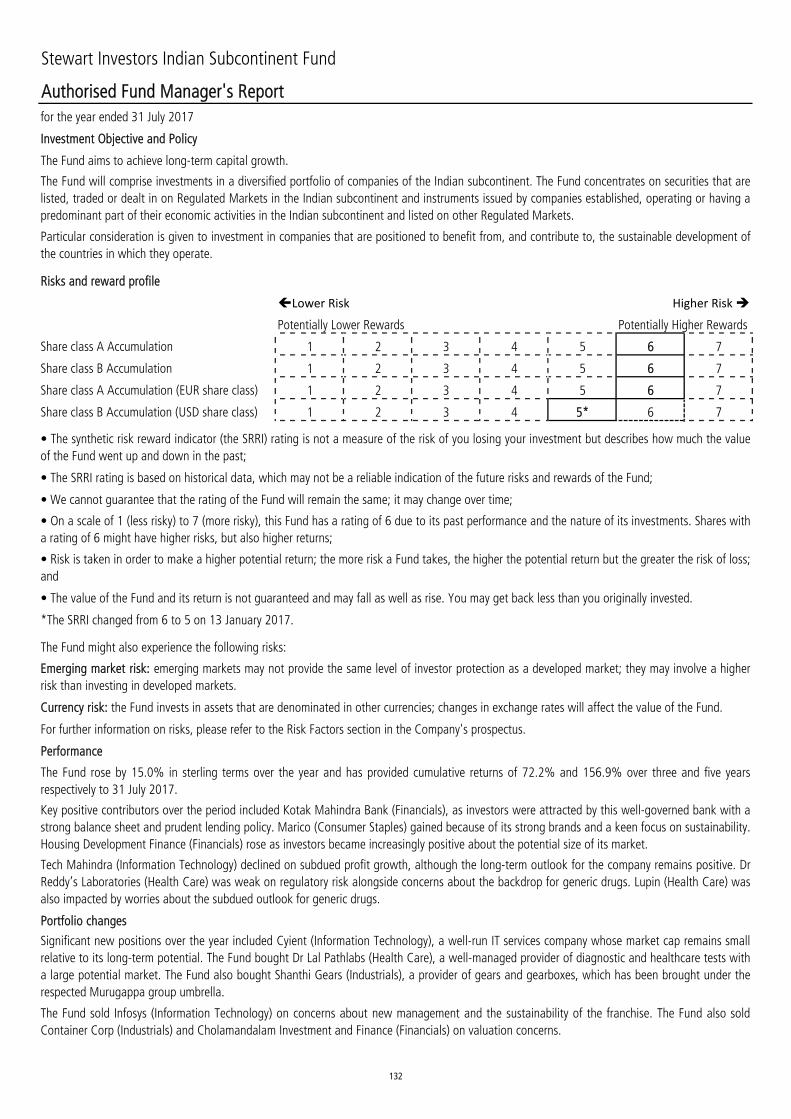
Risks and reward profile
Lower Risk Higher Risk
Potentially Lower Rewards Potentially Higher Rewards
1 2 3 4 5 6 7
1 2 3 4 5 6 7
1 2 3 4 5 6 7
1 2 3 4 5* 6 7
Stewart Investors Indian Subcontinent Fund
Authorised Fund Manager's Reportfor the year ended 31 July 2017
Investment Objective and Policy
The Fund aims to achieve long-term capital growth.
The Fund will comprise investments in a diversified portfolio of companies of the Indian subcontinent. The Fund concentrates on securities that arelisted, traded or dealt in on Regulated Markets in the Indian subcontinent and instruments issued by companies established, operating or having apredominant part of their economic activities in the Indian subcontinent and listed on other Regulated Markets.
Particular consideration is given to investment in companies that are positioned to benefit from, and contribute to, the sustainable development ofthe countries in which they operate.
Share class A Accumulation
Share class B Accumulation
Share class A Accumulation (EUR share class)
Share class B Accumulation (USD share class)
• The synthetic risk reward indicator (the SRRI) rating is not a measure of the risk of you losing your investment but describes how much the valueof the Fund went up and down in the past;
• The SRRI rating is based on historical data, which may not be a reliable indication of the future risks and rewards of the Fund;
• We cannot guarantee that the rating of the Fund will remain the same; it may change over time;
Emerging market risk: emerging markets may not provide the same level of investor protection as a developed market; they may involve a higherrisk than investing in developed markets.
Currency risk: the Fund invests in assets that are denominated in other currencies; changes in exchange rates will affect the value of the Fund.
• On a scale of 1 (less risky) to 7 (more risky), this Fund has a rating of 6 due to its past performance and the nature of its investments. Shares witha rating of 6 might have higher risks, but also higher returns;
• Risk is taken in order to make a higher potential return; the more risk a Fund takes, the higher the potential return but the greater the risk of loss;and
• The value of the Fund and its return is not guaranteed and may fall as well as rise. You may get back less than you originally invested.
The Fund might also experience the following risks:
*The SRRI changed from 6 to 5 on 13 January 2017.
For further information on risks, please refer to the Risk Factors section in the Company's prospectus.
Performance
The Fund rose by 15.0% in sterling terms over the year and has provided cumulative returns of 72.2% and 156.9% over three and five yearsrespectively to 31 July 2017.
Key positive contributors over the period included Kotak Mahindra Bank (Financials), as investors were attracted by this well-governed bank with astrong balance sheet and prudent lending policy. Marico (Consumer Staples) gained because of its strong brands and a keen focus on sustainability.Housing Development Finance (Financials) rose as investors became increasingly positive about the potential size of its market.
Tech Mahindra (Information Technology) declined on subdued profit growth, although the long-term outlook for the company remains positive. DrReddy’s Laboratories (Health Care) was weak on regulatory risk alongside concerns about the backdrop for generic drugs. Lupin (Health Care) wasalso impacted by worries about the subdued outlook for generic drugs.
Portfolio changes
Significant new positions over the year included Cyient (Information Technology), a well-run IT services company whose market cap remains smallrelative to its long-term potential. The Fund bought Dr Lal Pathlabs (Health Care), a well-managed provider of diagnostic and healthcare tests witha large potential market. The Fund also bought Shanthi Gears (Industrials), a provider of gears and gearboxes, which has been brought under therespected Murugappa group umbrella.
The Fund sold Infosys (Information Technology) on concerns about new management and the sustainability of the franchise. The Fund also soldContainer Corp (Industrials) and Cholamandalam Investment and Finance (Financials) on valuation concerns.
132
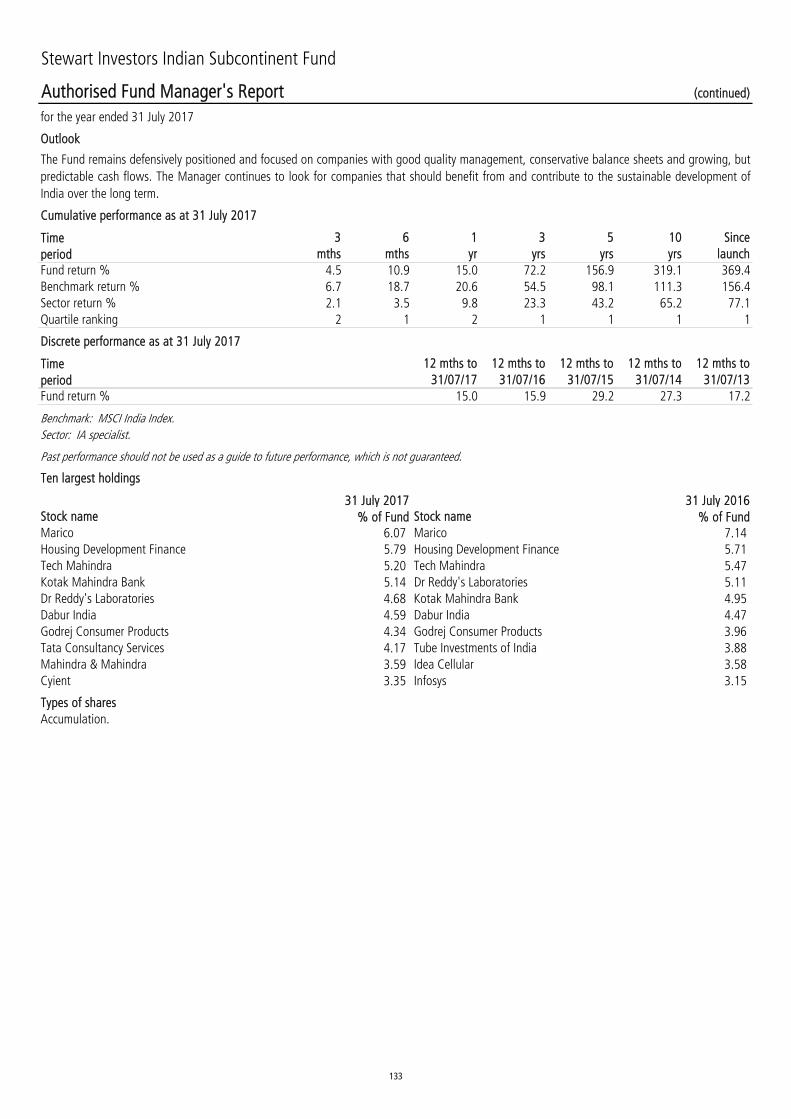
(continued)
Stewart Investors Indian Subcontinent Fund
Authorised Fund Manager's Reportfor the year ended 31 July 2017
Time 3 6 1 3 5 10 Sinceperiod mths mths yr yrs yrs yrs launch
4.5 10.9 15.0 72.2 156.9 319.1 369.4 6.7 18.7 20.6 54.5 98.1 111.3 156.4 2.1 3.5 9.8 23.3 43.2 65.2 77.1
2 1 2 1 1 1 1
12 mths to 12 mths to 12 mths to 12 mths to 12 mths to31/07/17 31/07/16 31/07/15 31/07/14 31/07/13
15.0 15.9 29.2 27.3 17.2
31 July 2017 31 July 2016% of Fund % of Fund
6.07 7.145.79 5.715.20 5.475.14 5.114.68 4.954.59 4.474.34 3.964.17 3.883.59 3.583.35 3.15
Outlook
The Fund remains defensively positioned and focused on companies with good quality management, conservative balance sheets and growing, butpredictable cash flows. The Manager continues to look for companies that should benefit from and contribute to the sustainable development ofIndia over the long term.
Cumulative performance as at 31 July 2017
Fund return %
TimeperiodFund return %
Benchmark: MSCI India Index.Sector: IA specialist.
Benchmark return %Sector return %Quartile ranking
Discrete performance as at 31 July 2017
Stock name Stock nameMarico Marico
Past performance should not be used as a guide to future performance, which is not guaranteed.
Ten largest holdings
Dr Reddy's Laboratories Kotak Mahindra BankDabur India Dabur IndiaGodrej Consumer Products Godrej Consumer Products
Housing Development Finance Housing Development FinanceTech Mahindra Tech MahindraKotak Mahindra Bank Dr Reddy's Laboratories
Types of sharesAccumulation.
Tata Consultancy Services Tube Investments of IndiaMahindra & Mahindra Idea CellularCyient Infosys
133
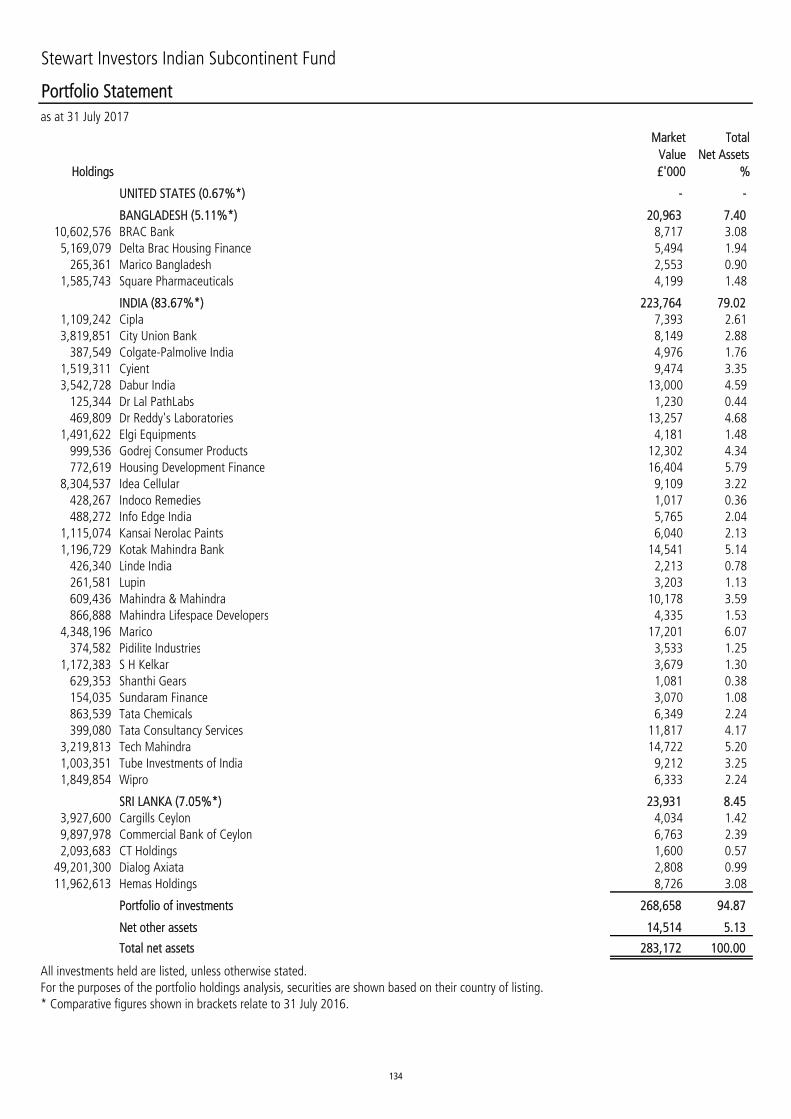
Holdings
MarketValue£'000
TotalNet Assets
%
UNITED STATES (0.67%*) - -
BANGLADESH (5.11%*) 20,963 7.4010,602,576 BRAC Bank 8,717 3.08
5,169,079 Delta Brac Housing Finance 5,494 1.94265,361 Marico Bangladesh 2,553 0.90
1,585,743 Square Pharmaceuticals 4,199 1.48
INDIA (83.67%*) 223,764 79.021,109,242 Cipla 7,393 2.613,819,851 City Union Bank 8,149 2.88
387,549 Colgate-Palmolive India 4,976 1.761,519,311 Cyient 9,474 3.353,542,728 Dabur India 13,000 4.59
125,344 Dr Lal PathLabs 1,230 0.44469,809 Dr Reddy's Laboratories 13,257 4.68
1,491,622 Elgi Equipments 4,181 1.48999,536 Godrej Consumer Products 12,302 4.34772,619 Housing Development Finance 16,404 5.79
8,304,537 Idea Cellular 9,109 3.22428,267 Indoco Remedies 1,017 0.36488,272 Info Edge India 5,765 2.04
1,115,074 Kansai Nerolac Paints 6,040 2.131,196,729 Kotak Mahindra Bank 14,541 5.14
426,340 Linde India 2,213 0.78261,581 Lupin 3,203 1.13609,436 Mahindra & Mahindra 10,178 3.59866,888 Mahindra Lifespace Developers 4,335 1.53
4,348,196 Marico 17,201 6.07374,582 Pidilite Industries 3,533 1.25
1,172,383 S H Kelkar 3,679 1.30629,353 Shanthi Gears 1,081 0.38154,035 Sundaram Finance 3,070 1.08863,539 Tata Chemicals 6,349 2.24399,080 Tata Consultancy Services 11,817 4.17
3,219,813 Tech Mahindra 14,722 5.201,003,351 Tube Investments of India 9,212 3.251,849,854 Wipro 6,333 2.24
SRI LANKA (7.05%*) 23,931 8.453,927,600 Cargills Ceylon 4,034 1.429,897,978 Commercial Bank of Ceylon 6,763 2.392,093,683 CT Holdings 1,600 0.57
49,201,300 Dialog Axiata 2,808 0.9911,962,613 Hemas Holdings 8,726 3.08
Portfolio of investments 268,658 94.87
Net other assets 14,514 5.13
Total net assets 283,172 100.00
Stewart Investors Indian Subcontinent Fund
Portfolio Statementas at 31 July 2017
All investments held are listed, unless otherwise stated.
* Comparative figures shown in brackets relate to 31 July 2016.For the purposes of the portfolio holdings analysis, securities are shown based on their country of listing.
134

Share class A Accumulation
Change in net assets per share
Opening net asset value per share
Return before operating charges*
Operating charges
Return after operating charges*
Distributions
Retained distributions on accumulation shares
Closing net asset value per share (p)
* after direct transaction costs of:
Performance
Return after charges (%)
Other information
Closing net asset value (£’000)
Closing number of shares
Operating charges
Direct transaction costs
Prices
Highest share price
Lowest share price
Stewart Investors Indian Subcontinent Fund
Comparative Tablefor the year ended 31 July 2017
Net Asset Value and Ongoing Charges Figure
Final 31 July 2017(p)
Final 31 July 2016(p)
Final 31 July 2015(p)
407.64 351.74 272.18
61.25 55.90 79.56
- - -
69.60 62.54 86.00
(8.35) (6.64) (6.44)
468.89 407.64 351.74
0.54 0.33 0.62
- - -
103,431 104,445 157,657
22,058,659 25,621,795 44,822,455
15.03% 15.89% 29.23%
0.12% 0.10% 0.19%
471.54 410.47 384.65
1.92% 1.94% 1.94%
399.52 309.57 268.31
135

Stewart Investors Indian Subcontinent Fund
Comparative Table (continued)
for the year ended 31 July 2017
Net Asset Value and Ongoing Charges Figure
Share class B Accumulation
Change in net assets per share
Opening net asset value per share
Return before operating charges*
Operating charges
Return after operating charges*
Distributions
Retained distributions on accumulation shares
Closing net asset value per share (p)
* after direct transaction costs of:
Performance
Return after charges (%)
Other information
Closing net asset value (£’000)
Closing number of shares
Operating charges
Direct transaction costs
Prices
Highest share price
Lowest share price
Final 31 July 2017(p)
Final 31 July 2016(p)
Final 31 July 2015(p)
203.15 174.12 133.83
32.15 29.03 40.29
(0.21) (0.38) -
34.69 31.08 42.35
(2.54) (2.05) (2.06)
235.30 203.15 174.12
0.27 0.17 0.31
0.21 0.38 -
155,491 148,746 72,847
66,080,779 73,218,321 41,838,672
15.83% 16.67% 30.11%
0.12% 0.10% 0.19%
236.61 204.55 190.04
1.16% 1.20% 1.24%
199.59 153.87 131.93
136

Stewart Investors Indian Subcontinent Fund
Comparative Table (continued)
for the year ended 31 July 2017
Net Asset Value and Ongoing Charges Figure
Share class A Accumulation (EUR share class)
Change in net assets per share
Opening net asset value per share
Return before operating charges*
Operating charges
Return after operating charges*
Distributions
Retained distributions on accumulation shares
Closing net asset value per share (c)
* after direct transaction costs of:
Performance
Return after charges (%)
Other information
Closing net asset value (€’000)
Closing number of shares
Operating charges
Direct transaction costs
Prices
Highest share price
Lowest share price
Final 31 July 2017(c)
Final 31 July 2016(c)
Final 31 July 2015(c)
297.90 307.75 211.11
25.40 (9.85) 96.64
- - -
31.28 (4.52) 101.92
(5.88) (5.33) (5.28)
323.30 297.90 307.75
0.39 0.27 0.51
- - -
25,980 60,277 74,304
8,035,670 20,233,413 24,144,452
8.53% (3.20)% 45.78%
0.12% 0.10% 0.19%
335.31 316.05 328.82
1.89% 1.91% 1.93%
291.37 242.74 207.34
137

Stewart Investors Indian Subcontinent Fund
Comparative Table (continued)
for the year ended 31 July 2017
Net Asset Value and Ongoing Charges Figure
Share class B Accumulation (USD share class)
Change in net assets per share
Opening net asset value per share
Return before operating charges*
Operating charges
Return after operating charges*
Distributions
Retained distributions on accumulation shares
Closing net asset value per share (c)
* after direct transaction costs of:
Performance
Return after charges (%)
Other information
Closing net asset value ($’000)
Closing number of shares
Operating charges
Direct transaction costs
Prices
Highest share price
Lowest share price
Final 31 July 2017(c)
Final 31 July 2016(c)
Final 31 July 2015(c)
104.20 105.65 99.54
16.30 (1.45) 6.11
(0.38) - (0.21)
17.51 (0.34) 7.99
(1.21) (1.11) (1.88)
120.50 104.20 105.65
0.13 0.09 0.30
0.38 - 0.21
1,345 1,786 15,899
1,116,400 1,713,299 15,048,266
15.64% (1.37)% 6.14%
0.12% 0.10% 0.19%
120.69 107.74 224.58
1.12% 1.16% 1.16%
Share class B Accumulation (USD share class) was launched on 25 March 2013, closed on 28 January 2014 and relaunched on 8 December 2014.
97.43 85.91 93.70
138

Notes £'000 £'000 £'000 £'000
Net capital gains 2 43,069 43,277
Revenue 3 3,776 3,802
4 (4,405) (4,434)
Interest payable and similar charges (1) (5)
(630) (637)
5 (374) (262)
(1,004) (899)
42,065 42,378
6 (142) (281)
41,923 42,097
£'000 £'000 £'000 £'000
305,373 293,092
10,847 17,121
(75,230) (47,275)
(64,383) (30,154)
118 57
41,923 42,097
141 281
283,172 305,373
31 July 2017 31 July 2016
Stewart Investors Indian Subcontinent Fund
Statement of Total Returnfor the year ended 31 July 2017
Statement of Change in Net Assets Attributable to Shareholders
Income
Expenses
Net expenses before taxation
Taxation
Net expenses after taxation
Total return before distribution
Distribution
Change in net assets attributable to shareholders from investment activities
Amounts receivable on issue of shares
for the year ended 31 July 2017
31 July 2017 31 July 2016
Opening net assets attributable to shareholders
Less: Amounts payable on cancellation of shares
Dilution adjustment
Change in net assets attributable to shareholders from investment activities
Retained distribution on accumulation shares
Closing net assets attributable to shareholders
Notes to the Financial Statements are on pages 141 to 145.
139
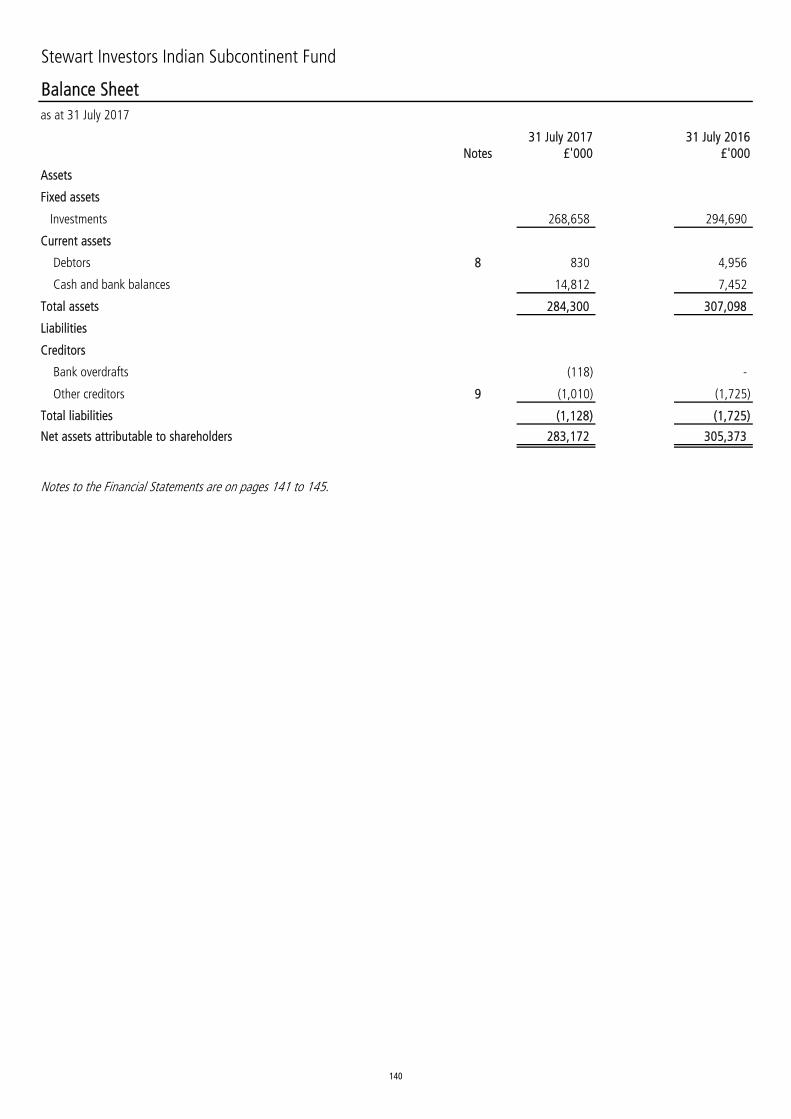
Stewart Investors Indian Subcontinent Fund
31 July 2017 31 July 2016Notes £'000 £'000
Investments 268,658 294,690
Current assets
8 830 4,956
14,812 7,452
284,300 307,098
Creditors
(118) -
Other creditors 9 (1,010) (1,725)
(1,128) (1,725)
283,172 305,373
Balance Sheetas at 31 July 2017
Assets
Fixed assets
Debtors
Cash and bank balances
Total assets
Liabilities
Notes to the Financial Statements are on pages 141 to 145.
Bank overdrafts
Total liabilities
Net assets attributable to shareholders
140

1.
2.
31 July 2017 31 July 2016£'000 £'000
43,513 41,70811 (8)
(455) 1,577
43,069 43,277
3.
31 July 2017 31 July 2016£'000 £'000
(3) -3,508 3,362
3 4268 436
3,776 3,802
4.
31 July 2017 31 July 2016£'000 £'000
3,956 3,932
44 39
9 8110 122213 180
73 153
405 463
4,405 4,434
Accounting basis and policies
Please see pages 9 to 11 for accounting basis and policies.
Net capital gains
The net capital gains during the year comprise:
Non-derivative securities
Notes to the Financial Statementsas at 31 July 2017
Stewart Investors Indian Subcontinent Fund
Net capital gains
Revenue
Forward foreign exchange currency contractsCurrency (losses)/gains
Overseas taxable revenueOverseas non-taxable revenueInterest from bank depositsInitial Charge Revenue
Total revenue
Payable to the Depositary, associates of the Depositary, and agents of either of them:Depositary's fees
Expenses
Payable to the ACD, associates of the ACD, and agents of either of them:ACD's periodic charge
Audit feeRegistrar feesSafe custody chargesOther expenses
Other expenses:
Total expenses
141
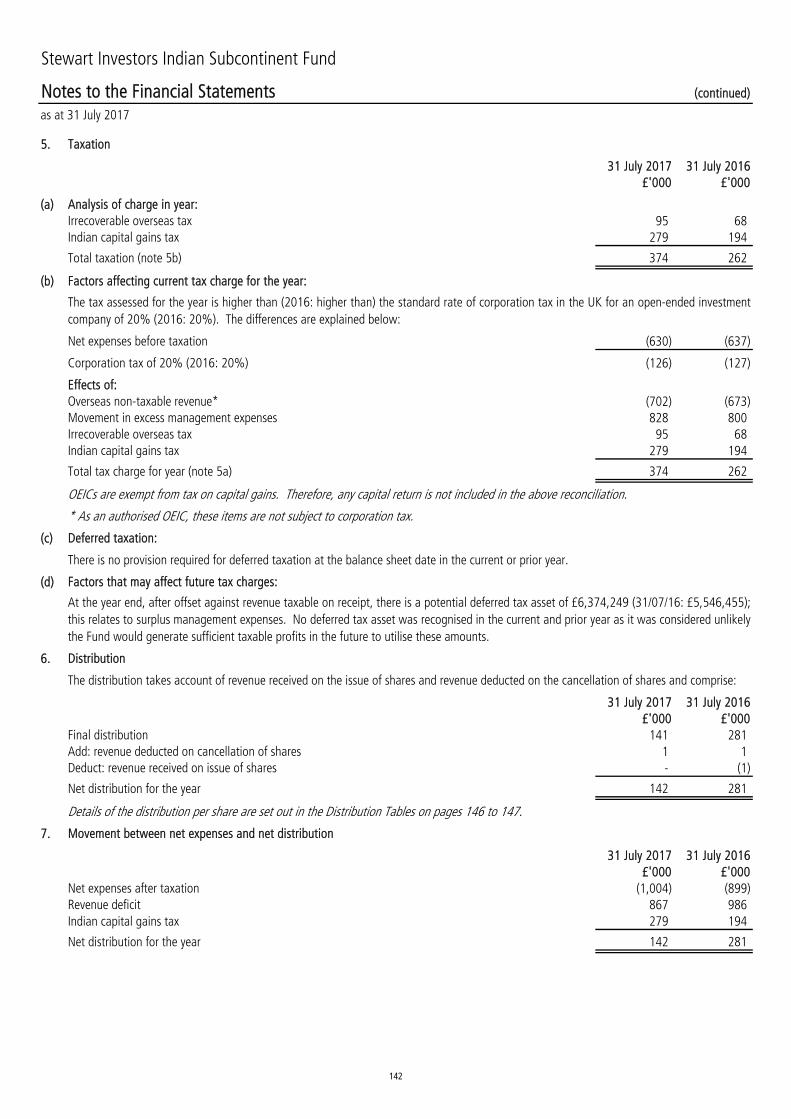
Notes to the Financial Statements (continued)
as at 31 July 2017
Stewart Investors Indian Subcontinent Fund
5.
31 July 2017 31 July 2016£'000 £'000
(a)95 68
279 194
374 262
(b)
(630) (637)
(126) (127)
(702) (673)828 800
95 68279 194
374 262
(c)
(d)
6.
31 July 2017 31 July 2016£'000 £'000
141 2811 1- (1)
142 281
7.
31 July 2017 31 July 2016£'000 £'000
(1,004) (899)867 986
Indian capital gains tax 279 194
142 281
Taxation
Irrecoverable overseas taxAnalysis of charge in year:
Indian capital gains tax
Net expenses before taxation
Corporation tax of 20% (2016: 20%)
Effects of:
Total taxation (note 5b)
Factors affecting current tax charge for the year:
The tax assessed for the year is higher than (2016: higher than) the standard rate of corporation tax in the UK for an open-ended investmentcompany of 20% (2016: 20%). The differences are explained below:
Movement in excess management expensesIrrecoverable overseas tax
Overseas non-taxable revenue*
Indian capital gains tax
Deferred taxation:
There is no provision required for deferred taxation at the balance sheet date in the current or prior year.
Total tax charge for year (note 5a)
OEICs are exempt from tax on capital gains. Therefore, any capital return is not included in the above reconciliation.
* As an authorised OEIC, these items are not subject to corporation tax.
Factors that may affect future tax charges:
At the year end, after offset against revenue taxable on receipt, there is a potential deferred tax asset of £6,374,249 (31/07/16: £5,546,455);this relates to surplus management expenses. No deferred tax asset was recognised in the current and prior year as it was considered unlikelythe Fund would generate sufficient taxable profits in the future to utilise these amounts.
Distribution
The distribution takes account of revenue received on the issue of shares and revenue deducted on the cancellation of shares and comprise:
Add: revenue deducted on cancellation of sharesDeduct: revenue received on issue of shares
Net distribution for the year
Final distribution
Details of the distribution per share are set out in the Distribution Tables on pages 146 to 147.
Movement between net expenses and net distribution
Net expenses after taxationRevenue deficit
Net distribution for the year
142

Notes to the Financial Statements (continued)
as at 31 July 2017
Stewart Investors Indian Subcontinent Fund
8.
31 July 2017 31 July 2016£'000 £'000
- 2,860- 1,317
830 779
830 4,956
9.
31 July 2017 31 July 2016£'000 £'000
- 38467 1,186543 501
1,010 1,725
10.
31 July 2017 31 July 2016 31 July 2017 31 July 2016£'000 £'000 £'000 £'000
37,580 43,076 107,487 56,147
37,580 43,076 107,487 56,147
59 87 (127) (56)
40 55 (136) (70)
99 142 (263) (126)
37,679 43,218 107,224 56,021
31 July 2017 31 July 2016 31 July 2017 31 July 2016% % % %
0.16 0.20 0.12 0.10
0.11 0.13 0.13 0.12
11.
Amounts receivable for issue of sharesAccrued revenue
Debtors
Sales awaiting settlement
Total debtors
Creditors
Purchases awaiting settlementAmounts payable for cancellation of sharesAccrued expenses
Analysis of total trade costs:
Purchases Sales
Equities
Total creditors
Portfolio transaction costs
Trades in the year before transaction costs
CommissionsEquities
TaxesEquities
Total costs
Total net trades in the year after transaction costs
CommissionsEquities
Total transaction cost expressed as a percentage of asset type cost:
Purchases Sales
EquitiesTaxes
Commissions 0.06 0.05Taxes 0.06 0.05
Total transaction cost expressed as a percentage of average net asset value:
31 July 2017 31 July 2016% %
Total costs 0.12 0.10
Average portfolio dealing spread
Contingent liabilities and commitments
As at 31 July 2017, the Fund had no contingent liabilities (31/07/16: £nil) and no commitments (31/07/16: £nil).
The average portfolio dealing spread at the balance sheet date was 0.23% (31/07/2016: 0.27%).
143

Notes to the Financial Statements (continued)
as at 31 July 2017
Stewart Investors Indian Subcontinent Fund
12.
(a)
(b)
(c)
Total TotalCurrency £'000 £'000Bangladeshi taka 20,973 15,604Euro (327) -Indian rupee 224,585 260,096Sri Lankan rupee 23,932 21,542US dollar 4,718 4,620
Total 273,881 301,862
The Fund’s main liability is the redemption of any shares that investors wish to sell. In general, the ACD manages the cash to ensure that itcan meet its liabilities. Assets from a Fund may need to be sold if insufficient cash is available to finance such redemptions. The Fund’sholdings are reviewed on a regular basis, with particular emphasis on the market capitalisation of the issuer (securities issued by largercapitalised companies generally have greater liquidity) and the number of days it would take to trade out of a given securities position orpercentage of the Fund as a whole (determined by reference to available market trading volumes). Funds that have a higher concentration ofsecurities that are deemed to be less liquid are regularly monitored.
As a proportion of the Fund’s investment portfolio is invested in overseas securities, the Balance Sheet can be affected by movements inforeign exchange rates. The Investment Manager may seek to manage exposure to currency movements by using forward foreign exchangecontracts or by hedging the sterling value of investments that are priced in other currencies. Income received in other currencies is convertedto sterling on or near the date of receipt.
The market value of investments is taken to equal ‘fair value’ for the purposes of Financial Reporting Standard 102. Given all the activities ofthe Fund, none of the investments held fall within the definition of ‘investments held for trading’ as set out in Financial Reporting Standard13.
Fair value of financial assets and financial liabilities
Derivatives and other financial instruments
General
In pursuing its investment objectives, the Fund holds equity shares.
The main risk arising from the Fund’s financial instruments is market-price risk. Market-price risk arises mainly from uncertainty about futureprices of the financial instruments held. Investment risk in the portfolio is regularly reviewed and controlled through the adoption ofparameters limiting exposures to various factors such as industries, countries, and company size.
The Fund has little exposure to credit or cash-flow risk. Certain transactions in securities that the Fund enters into expose it to the risk thatthe counter-party will not deliver the investment (purchase) or cash (sale) after the Fund has fulfilled its responsibilities. The Fund only buysand sells investments through brokers that have been approved by the Authorised Corporate Director as an acceptable counter-party. This listis reviewed quarterly. The Fund’s assets comprise mainly realisable securities that can be readily sold in normal market conditions.
As at 31 July 2017, 5.19% (31/07/16: 2.44%) of the Fund's assets were interest-bearing.
As at 31 July 2017, if interest rates increase or decrease by 0.25%, with all other variables remaining constant, the resulting change in thenet assets attributable to shareholders of the Stewart Investors Indian Subcontinent Fund would be an increase or decrease of approximately£36,733 (31/07/16: £18,631).
Analysis of the Fund's currency exposure
There is no material difference between the value of the financial assets and liabilities, as shown in the Balance Sheet, and their fair value.
If market prices increase or decrease by 10%, then the impact on the portfolio will be an increase or decrease of 10% (£26,865,773)(31/07/16: £29,469,017).
Interest-rate risk
The Fund does not invest in either fixed or floating-rate securities, and interest-rate risk exposure is restricted to interest receivable on bankdeposits or payable on bank overdraft positions that will be affected by fluctuations in interest rates.
The following summarises the sterling value of currencies of the Fund in which the investments, including cash, debtors and creditors, aredenominated.
As at 31 July 2017, the Fund had the following net currency exposure (excluding sterling):
Net foreign currency assets Net foreign currency assets31 July 2017 31 July 2016
If foreign exchange rates increase or decrease by 5%, then the impact on the NAV will be an increase or decrease of 4.84% (£13,694,033)(31/07/16: 4.94% (£15,093,114)).
144
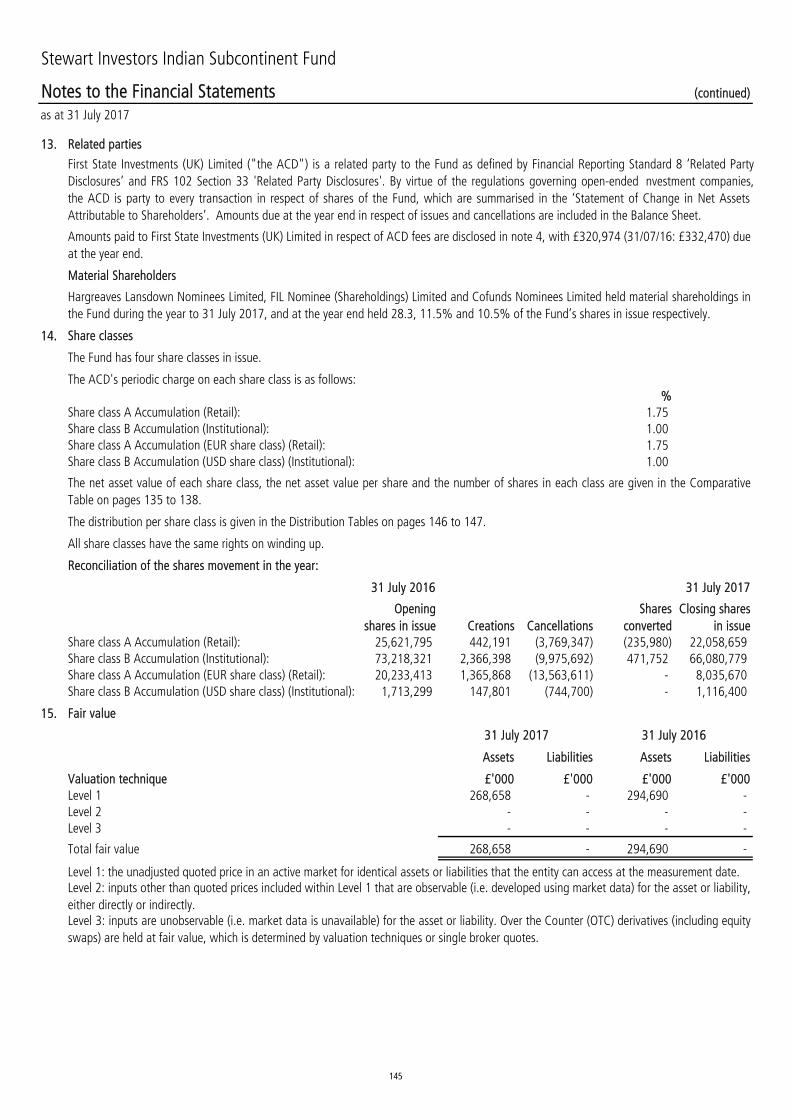
Notes to the Financial Statements (continued)
as at 31 July 2017
Stewart Investors Indian Subcontinent Fund
13.
14.
%1.751.001.751.00
31 July 2016 31 July 2017
Opening shares in issue Creations Cancellations
Shares converted
Closing shares in issue
25,621,795 442,191 (3,769,347) (235,980) 22,058,65973,218,321 2,366,398 (9,975,692) 471,752 66,080,77920,233,413 1,365,868 (13,563,611) - 8,035,670
1,713,299 147,801 (744,700) - 1,116,400
15.
Assets Liabilities Assets Liabilities
£'000 £'000 £'000 £'000268,658 - 294,690 -
- - - -- - - -
268,658 - 294,690 -
Related parties
First State Investments (UK) Limited ("the ACD") is a related party to the Fund as defined by Financial Reporting Standard 8 ‘Related Party Disclosures’ and FRS 102 Section 33 'Related Party Disclosures'. By virtue of the regulations governing open-ended investment companies, the ACD is party to every transaction in respect of shares of the Fund, which are summarised in the ‘Statement of Change in Net Assets Attributable to Shareholders’. Amounts due at the year end in respect of issues and cancellations are included in the Balance Sheet.
Material Shareholders
Hargreaves Lansdown Nominees Limited, FIL Nominee (Shareholdings) Limited and Cofunds Nominees Limited held material shareholdings inthe Fund during the year to 31 July 2017, and at the year end held 28.3, 11.5% and 10.5% of the Fund’s shares in issue respectively.
Share classes
The Fund has four share classes in issue.
Amounts paid to First State Investments (UK) Limited in respect of ACD fees are disclosed in note 4, with £320,974 (31/07/16: £332,470) due at the year end.
The ACD's periodic charge on each share class is as follows:
Share class A Accumulation (Retail):Share class B Accumulation (Institutional):Share class A Accumulation (EUR share class) (Retail):Share class B Accumulation (USD share class) (Institutional):
All share classes have the same rights on winding up.
Reconciliation of the shares movement in the year:
Share class A Accumulation (Retail):Share class B Accumulation (Institutional):Share class A Accumulation (EUR share class) (Retail):
The net asset value of each share class, the net asset value per share and the number of shares in each class are given in the ComparativeTable on pages 135 to 138.
The distribution per share class is given in the Distribution Tables on pages 146 to 147.
Share class B Accumulation (USD share class) (Institutional):
Fair value
Valuation technique
31 July 2017 31 July 2016
Level 3: inputs are unobservable (i.e. market data is unavailable) for the asset or liability. Over the Counter (OTC) derivatives (including equityswaps) are held at fair value, which is determined by valuation techniques or single broker quotes.
Level 1Level 2Level 3
Total fair value
Level 1: the unadjusted quoted price in an active market for identical assets or liabilities that the entity can access at the measurement date. Level 2: inputs other than quoted prices included within Level 1 that are observable (i.e. developed using market data) for the asset or liability,either directly or indirectly.
145
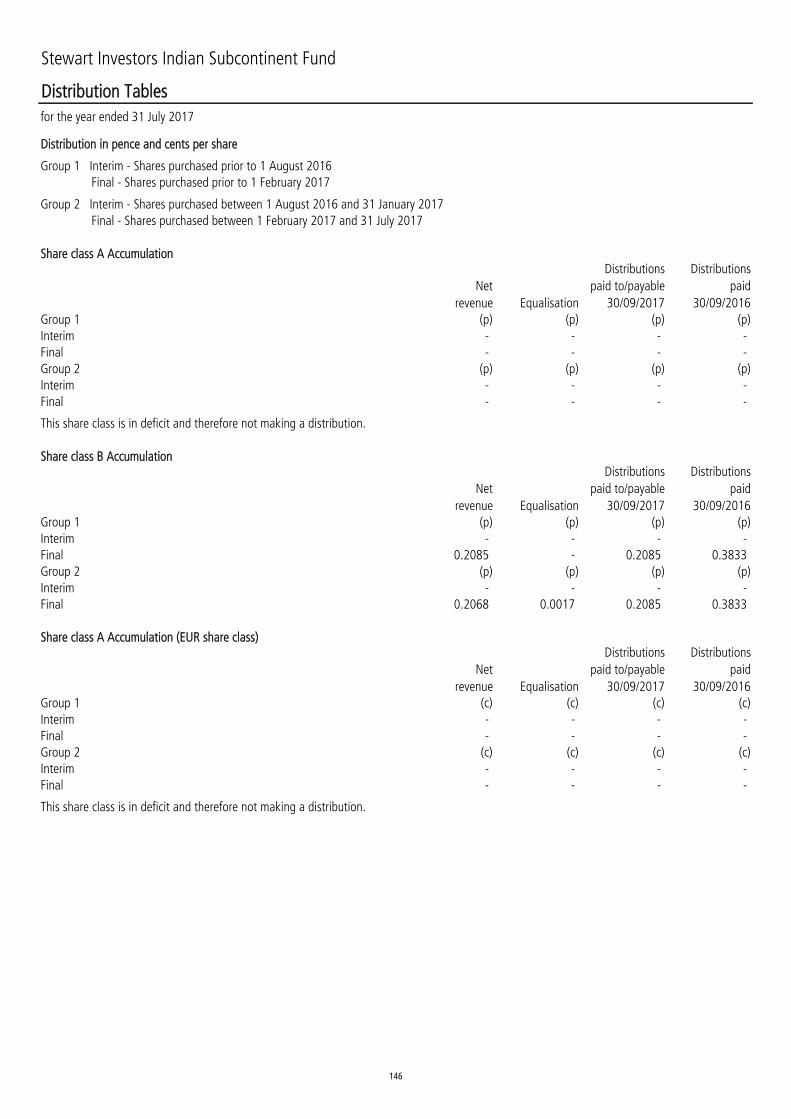
Share class A Accumulation
Netrevenue Equalisation
Distributions paid to/payable
30/09/2017
Distributions paid
30/09/2016Group 1 (p) (p) (p) (p)Interim - - - -Final - - - -Group 2 (p) (p) (p) (p)Interim - - - -Final - - - -
Share class B Accumulation
Netrevenue Equalisation
Distributions paid to/payable
30/09/2017
Distributions paid
30/09/2016Group 1 (p) (p) (p) (p)Interim - - - -Final 0.2085 - 0.2085 0.3833Group 2 (p) (p) (p) (p)Interim - - - -Final 0.2068 0.0017 0.2085 0.3833
Share class A Accumulation (EUR share class)
Netrevenue Equalisation
Distributions paid to/payable
30/09/2017
Distributions paid
30/09/2016Group 1 (c) (c) (c) (c)Interim - - - -Final - - - -Group 2 (c) (c) (c) (c)Interim - - - -Final - - - -
Stewart Investors Indian Subcontinent Fund
Distribution Tablesfor the year ended 31 July 2017
Group 1 Interim - Shares purchased prior to 1 August 2016
Distribution in pence and cents per share
Group 2 Interim - Shares purchased between 1 August 2016 and 31 January 2017
Final - Shares purchased prior to 1 February 2017
This share class is in deficit and therefore not making a distribution.
Final - Shares purchased between 1 February 2017 and 31 July 2017
This share class is in deficit and therefore not making a distribution.
146

Stewart Investors Indian Subcontinent Fund
Distribution Tables (continued)
for the year ended 31 July 2017
Share class B Accumulation (USD share class)
Netrevenue Equalisation
Distributions paid to/payable
30/09/2017
Distributions paid
30/09/2016Group 1 (c) (c) (c) (c)Interim - - - -Final 0.3798 - 0.3798 -Group 2 (c) (c) (c) (c)Interim - - - -Final 0.3798 - 0.3798 -
Corporate tax for all share classes (unaudited)
A shareholder liable to corporation tax receives this distribution, excluding equalisation, as follows:
Interim - 100.00% of the dividend is received as franked investment income.
Interim - 0.00% of the dividend is received as an annual payment (non-foreign element) received after the deduction of income tax at the lowerrate and is liable to corporation tax. The tax deemed to be deducted is treated as income tax.
Interim - 0.00% of the dividend is received as an annual payment (foreign element) received after the deduction of income tax at the lower rate andis liable to corporation tax. It is treated as foreign income in the hands of the corporate investor and is liable to corporation tax. The associateddeemed tax is treated as foreign tax in the hands of the investor, who may be able to claim double tax relief. Investors cannot reclaim any of thisdeemed tax on the foreign element from HM Revenue & Customs.
Shareholders should consult their professional advisers for any advice regarding their tax position.
Final - 100.00% of the dividend is received as franked investment income.
Final - 0.00% of the dividend is received as an annual payment (non-foreign element) received after the deduction of income tax at the lower rateand is liable to corporation tax. The tax deemed to be deducted is treated as income tax.
Final - 0.00% of the dividend is received as an annual payment (foreign element) received after the deduction of income tax at the lower rate and isliable to corporation tax. It is treated as foreign income in the hands of the corporate investor and is liable to corporation tax. The associateddeemed tax is treated as foreign tax in the hands of the investor, who may be able to claim double tax relief. Investors cannot reclaim any of thisdeemed tax on the foreign element from HM Revenue & Customs.
147
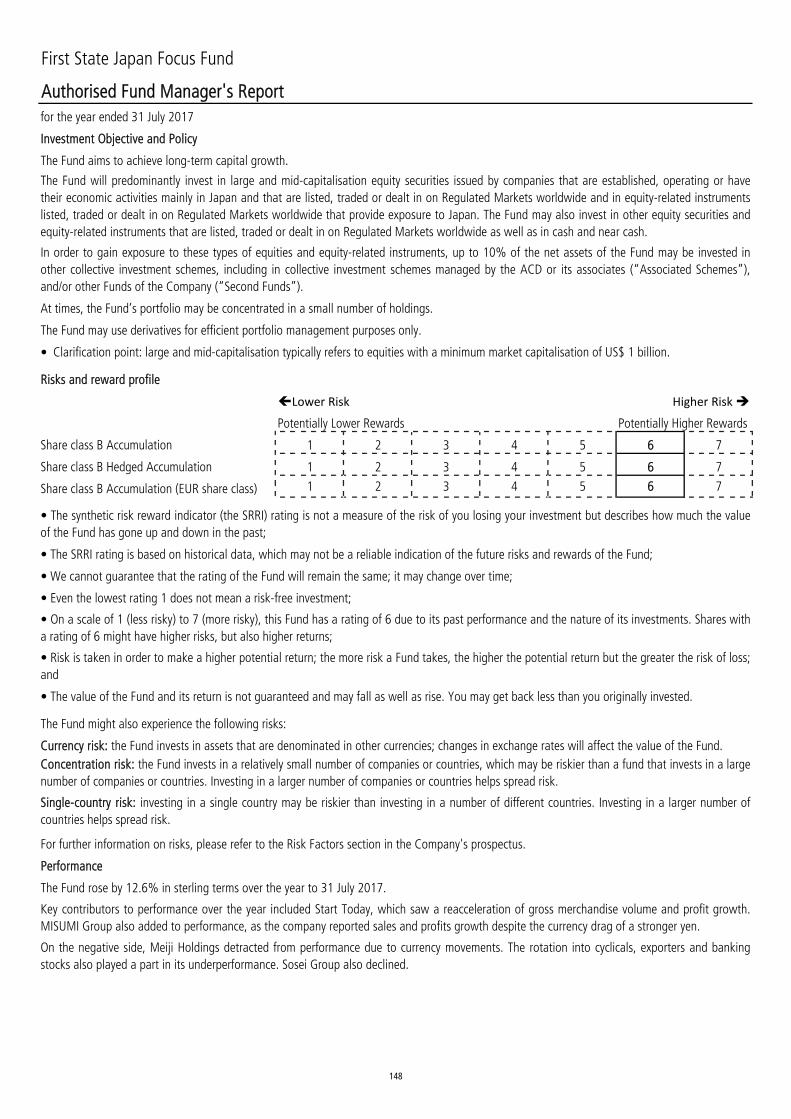
•
Risks and reward profile
Lower Risk Higher Risk
Potentially Lower Rewards Potentially Higher Rewards
1 2 3 4 5 6 7
1 2 3 4 5 6 7
1 2 3 4 5 6 7
First State Japan Focus Fund
Authorised Fund Manager's Reportfor the year ended 31 July 2017
Investment Objective and Policy
At times, the Fund’s portfolio may be concentrated in a small number of holdings.
The Fund may use derivatives for efficient portfolio management purposes only.
The Fund aims to achieve long-term capital growth.
The Fund will predominantly invest in large and mid-capitalisation equity securities issued by companies that are established, operating or havetheir economic activities mainly in Japan and that are listed, traded or dealt in on Regulated Markets worldwide and in equity-related instrumentslisted, traded or dealt in on Regulated Markets worldwide that provide exposure to Japan. The Fund may also invest in other equity securities andequity-related instruments that are listed, traded or dealt in on Regulated Markets worldwide as well as in cash and near cash.
In order to gain exposure to these types of equities and equity-related instruments, up to 10% of the net assets of the Fund may be invested inother collective investment schemes, including in collective investment schemes managed by the ACD or its associates (“Associated Schemes”),and/or other Funds of the Company (“Second Funds”).
Clarification point: large and mid-capitalisation typically refers to equities with a minimum market capitalisation of US$ 1 billion.
Share class B Accumulation
Share class B Hedged Accumulation
Share class B Accumulation (EUR share class)
• The synthetic risk reward indicator (the SRRI) rating is not a measure of the risk of you losing your investment but describes how much the valueof the Fund has gone up and down in the past;
• The SRRI rating is based on historical data, which may not be a reliable indication of the future risks and rewards of the Fund;
• We cannot guarantee that the rating of the Fund will remain the same; it may change over time;
Currency risk: the Fund invests in assets that are denominated in other currencies; changes in exchange rates will affect the value of the Fund.Concentration risk: the Fund invests in a relatively small number of companies or countries, which may be riskier than a fund that invests in a largenumber of companies or countries. Investing in a larger number of companies or countries helps spread risk.
Single-country risk: investing in a single country may be riskier than investing in a number of different countries. Investing in a larger number ofcountries helps spread risk.
• Even the lowest rating 1 does not mean a risk-free investment;
• On a scale of 1 (less risky) to 7 (more risky), this Fund has a rating of 6 due to its past performance and the nature of its investments. Shares witha rating of 6 might have higher risks, but also higher returns;
• Risk is taken in order to make a higher potential return; the more risk a Fund takes, the higher the potential return but the greater the risk of loss;and
• The value of the Fund and its return is not guaranteed and may fall as well as rise. You may get back less than you originally invested.
The Fund might also experience the following risks:
For further information on risks, please refer to the Risk Factors section in the Company's prospectus.
Performance
The Fund rose by 12.6% in sterling terms over the year to 31 July 2017.
Key contributors to performance over the year included Start Today, which saw a reacceleration of gross merchandise volume and profit growth.MISUMI Group also added to performance, as the company reported sales and profits growth despite the currency drag of a stronger yen.
On the negative side, Meiji Holdings detracted from performance due to currency movements. The rotation into cyclicals, exporters and bankingstocks also played a part in its underperformance. Sosei Group also declined.
148
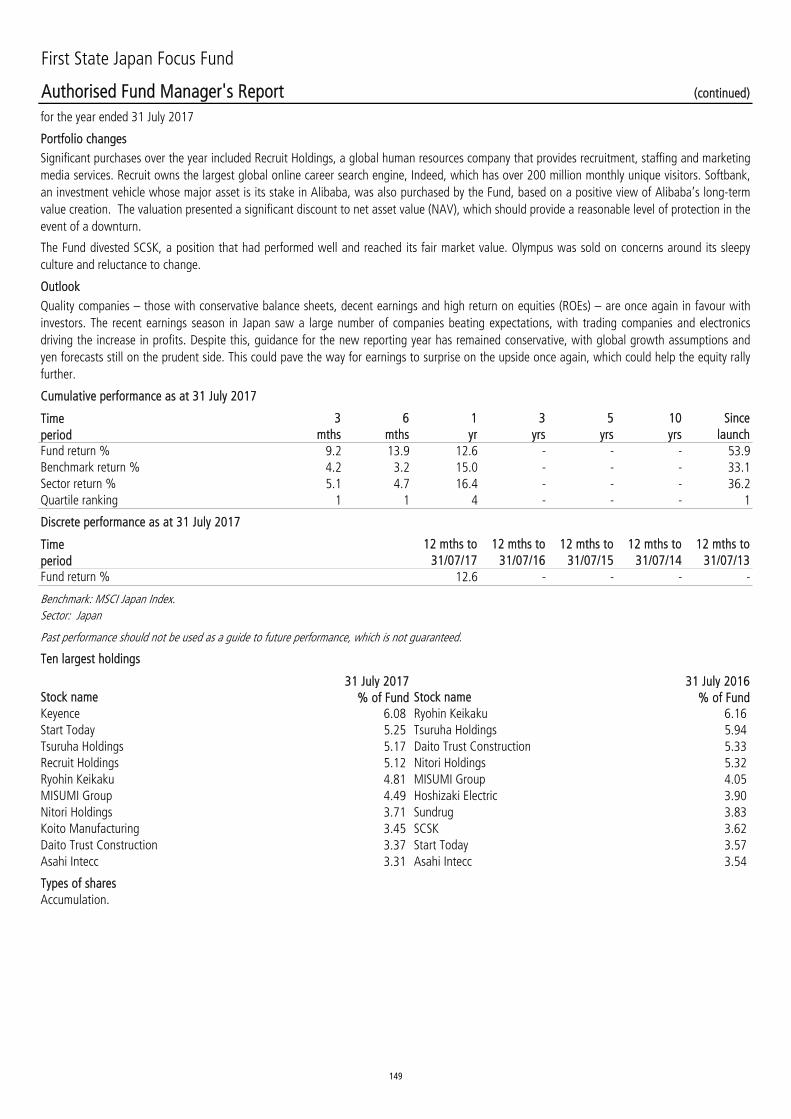
(continued)
First State Japan Focus Fund
Authorised Fund Manager's Reportfor the year ended 31 July 2017
Time 3 6 1 3 5 10 Sinceperiod mths mths yr yrs yrs yrs launch
9.2 13.9 12.6 - - - 53.9 4.2 3.2 15.0 - - - 33.1 5.1 4.7 16.4 - - - 36.2
1 1 4 - - - 1
12 mths to 12 mths to 12 mths to 12 mths to 12 mths to31/07/17 31/07/16 31/07/15 31/07/14 31/07/13
12.6 - - - -
31 July 2017 31 July 2016% of Fund % of Fund
6.08 6.165.25 5.945.17 5.335.12 5.324.81 4.054.49 3.903.71 3.833.45 3.623.37 3.573.31 3.54
Portfolio changes
Significant purchases over the year included Recruit Holdings, a global human resources company that provides recruitment, staffing and marketingmedia services. Recruit owns the largest global online career search engine, Indeed, which has over 200 million monthly unique visitors. Softbank,an investment vehicle whose major asset is its stake in Alibaba, was also purchased by the Fund, based on a positive view of Alibaba’s long-termvalue creation. The valuation presented a significant discount to net asset value (NAV), which should provide a reasonable level of protection in theevent of a downturn.
The Fund divested SCSK, a position that had performed well and reached its fair market value. Olympus was sold on concerns around its sleepyculture and reluctance to change.
Outlook
Quality companies – those with conservative balance sheets, decent earnings and high return on equities (ROEs) – are once again in favour withinvestors. The recent earnings season in Japan saw a large number of companies beating expectations, with trading companies and electronicsdriving the increase in profits. Despite this, guidance for the new reporting year has remained conservative, with global growth assumptions andyen forecasts still on the prudent side. This could pave the way for earnings to surprise on the upside once again, which could help the equity rallyfurther.
Cumulative performance as at 31 July 2017
Fund return %
TimeperiodFund return %
Benchmark: MSCI Japan Index.Sector: Japan
Benchmark return %Sector return %Quartile ranking
Discrete performance as at 31 July 2017
Stock name Stock nameKeyence Ryohin Keikaku
Past performance should not be used as a guide to future performance, which is not guaranteed.
Ten largest holdings
Ryohin Keikaku MISUMI GroupMISUMI Group Hoshizaki ElectricNitori Holdings Sundrug
Start Today Tsuruha HoldingsTsuruha Holdings Daito Trust ConstructionRecruit Holdings Nitori Holdings
Types of sharesAccumulation.
Koito Manufacturing SCSKDaito Trust Construction Start TodayAsahi Intecc Asahi Intecc
149
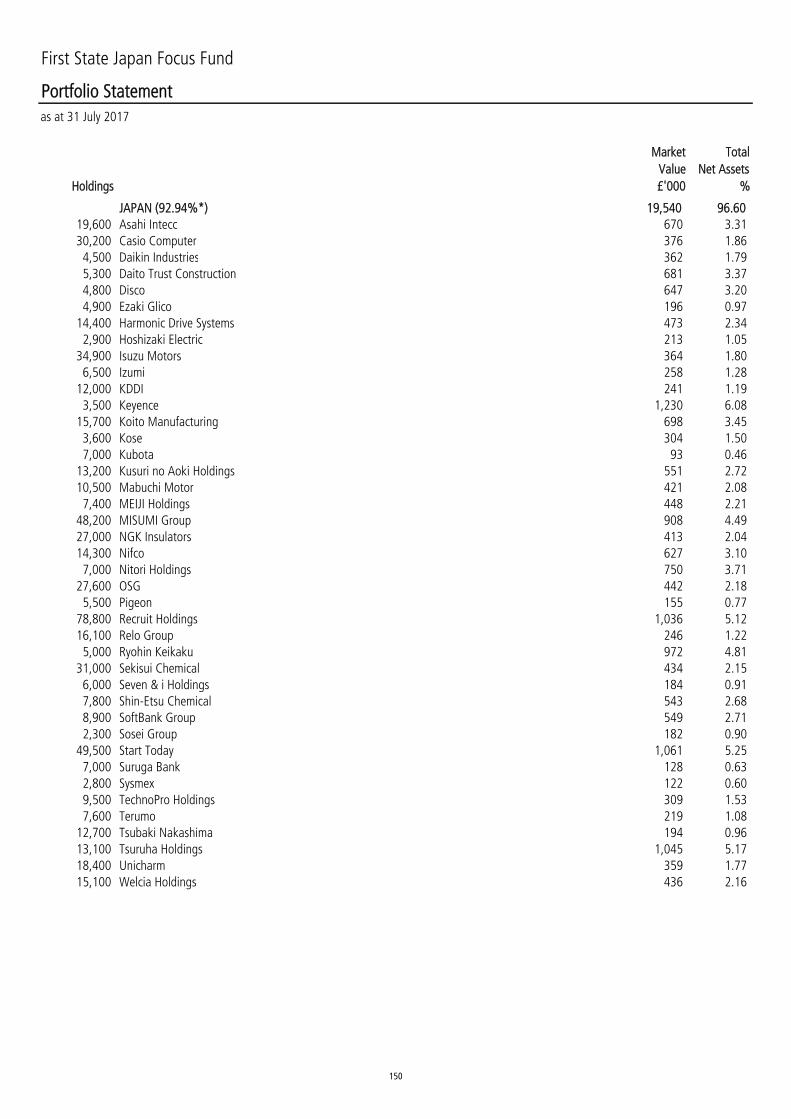
Holdings
MarketValue£'000
TotalNet Assets
%
JAPAN (92.94%*) 19,540 96.6019,600 Asahi Intecc 670 3.3130,200 Casio Computer 376 1.86
4,500 Daikin Industries 362 1.795,300 Daito Trust Construction 681 3.374,800 Disco 647 3.204,900 Ezaki Glico 196 0.97
14,400 Harmonic Drive Systems 473 2.342,900 Hoshizaki Electric 213 1.05
34,900 Isuzu Motors 364 1.806,500 Izumi 258 1.28
12,000 KDDI 241 1.193,500 Keyence 1,230 6.08
15,700 Koito Manufacturing 698 3.453,600 Kose 304 1.507,000 Kubota 93 0.46
13,200 Kusuri no Aoki Holdings 551 2.7210,500 Mabuchi Motor 421 2.08
7,400 MEIJI Holdings 448 2.2148,200 MISUMI Group 908 4.4927,000 NGK Insulators 413 2.0414,300 Nifco 627 3.10
7,000 Nitori Holdings 750 3.7127,600 OSG 442 2.18
5,500 Pigeon 155 0.7778,800 Recruit Holdings 1,036 5.1216,100 Relo Group 246 1.22
5,000 Ryohin Keikaku 972 4.8131,000 Sekisui Chemical 434 2.15
6,000 Seven & i Holdings 184 0.917,800 Shin-Etsu Chemical 543 2.688,900 SoftBank Group 549 2.712,300 Sosei Group 182 0.90
49,500 Start Today 1,061 5.257,000 Suruga Bank 128 0.632,800 Sysmex 122 0.609,500 TechnoPro Holdings 309 1.537,600 Terumo 219 1.08
12,700 Tsubaki Nakashima 194 0.9613,100 Tsuruha Holdings 1,045 5.1718,400 Unicharm 359 1.7715,100 Welcia Holdings 436 2.16
First State Japan Focus Fund
Portfolio Statementas at 31 July 2017
150
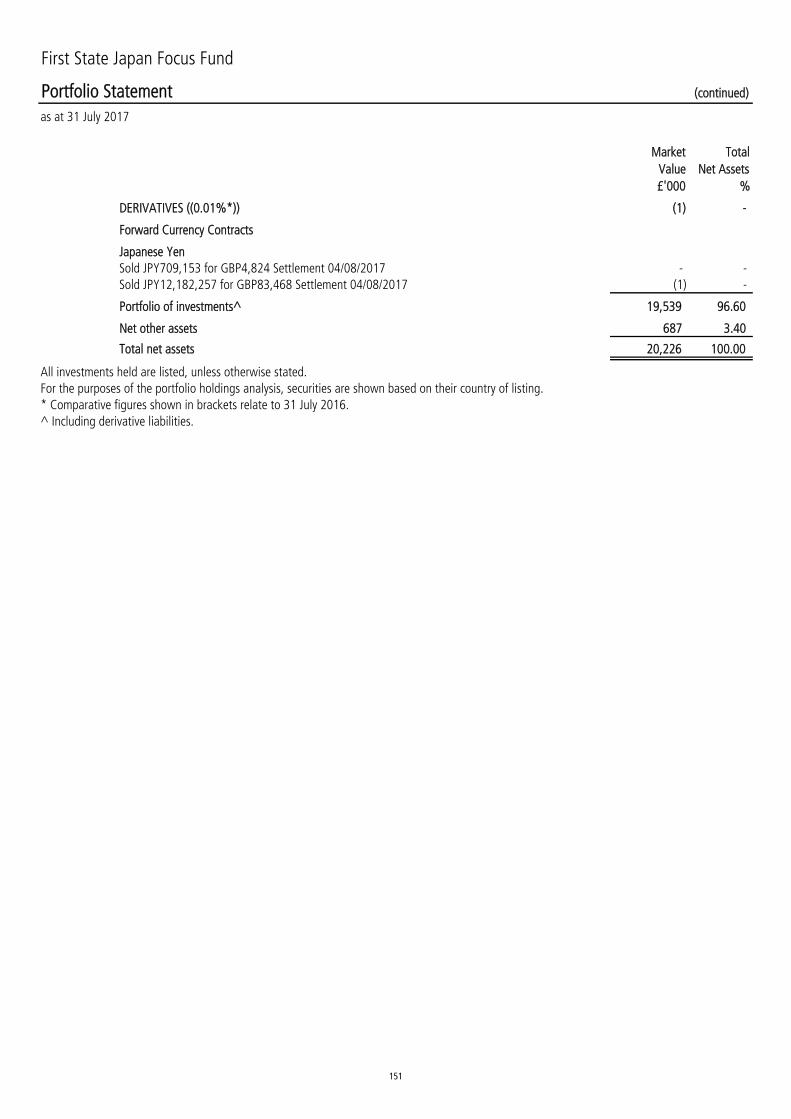
MarketValue£'000
TotalNet Assets
%
First State Japan Focus Fund
Portfolio Statement (continued)
as at 31 July 2017
DERIVATIVES ((0.01%*)) (1) -
Forward Currency Contracts
Japanese YenSold JPY709,153 for GBP4,824 Settlement 04/08/2017 - -Sold JPY12,182,257 for GBP83,468 Settlement 04/08/2017 (1) -
Portfolio of investments^ 19,539 96.60
Net other assets 687 3.40
Total net assets 20,226 100.00
^ Including derivative liabilities.
All investments held are listed, unless otherwise stated.
* Comparative figures shown in brackets relate to 31 July 2016.For the purposes of the portfolio holdings analysis, securities are shown based on their country of listing.
151

Share class B Accumulation
Change in net assets per share
Opening net asset value per share
Return before operating charges*
Operating charges
Return after operating charges*
Distributions
Retained distributions on accumulation shares
Closing net asset value per share (p)
* after direct transaction costs of:
Performance
Return after charges (%)
Other information
Closing net asset value (£’000)
Closing number of shares
Operating charges
Direct transaction costs
Prices
Highest share price
Lowest share price
First State Japan Focus Fund
Comparative Tablefor the year ended 31 July 2017
Net Asset Value and Ongoing Charges Figure
Final 31 July 2017(p)
Final 31 July 2016(p)
136.48 100.00
17.30 36.48
(0.12) -
18.80 37.46
(1.50) (0.98)
153.78 136.48
0.14 0.14
0.12 -
18,698 12,080
12,159,065 8,850,593
12.68% 36.48%
0.10% 0.12%
158.79 140.74
1.06% 1.10%
Share class B Accumulation was launched on 26 October 2015.
126.20 97.76
152
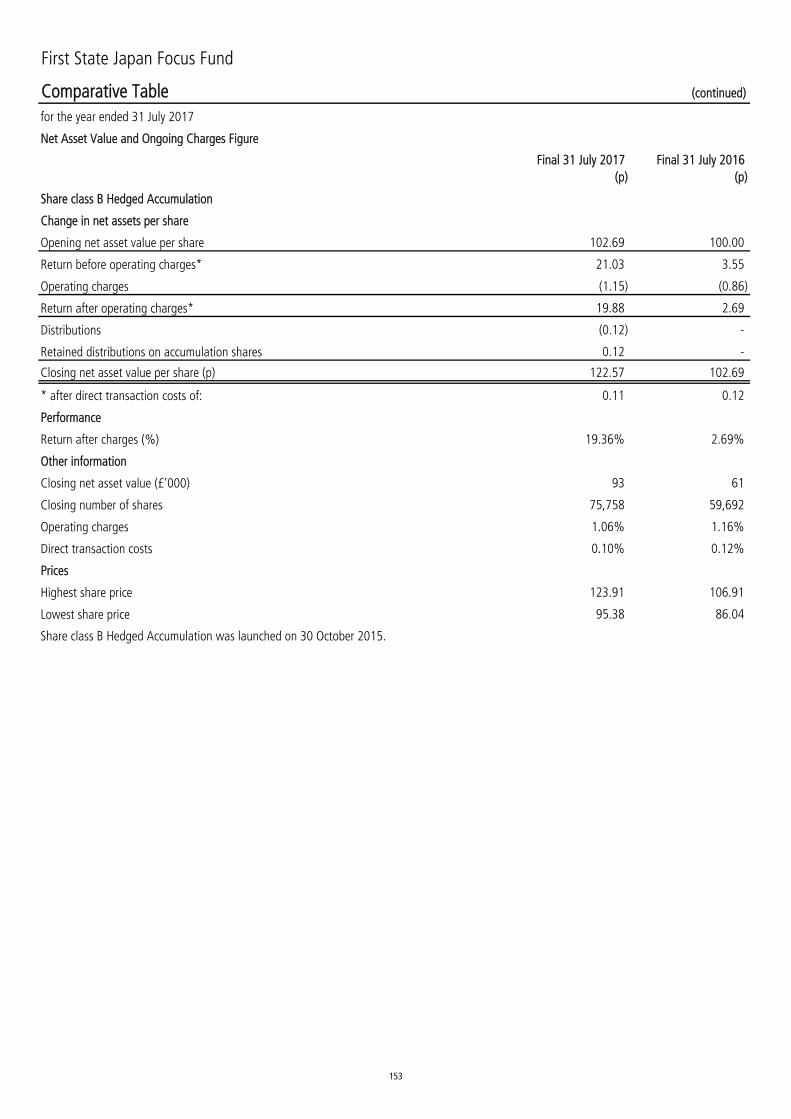
First State Japan Focus Fund
Comparative Table (continued)
for the year ended 31 July 2017
Net Asset Value and Ongoing Charges Figure
Share class B Hedged Accumulation
Change in net assets per share
Opening net asset value per share
Return before operating charges*
Operating charges
Return after operating charges*
Distributions
Retained distributions on accumulation shares
Closing net asset value per share (p)
* after direct transaction costs of:
Performance
Return after charges (%)
Other information
Closing net asset value (£’000)
Closing number of shares
Operating charges
Direct transaction costs
Prices
Highest share price
Lowest share price
Final 31 July 2017(p)
Final 31 July 2016(p)
102.69 100.00
19.88 2.69
(0.12) -
21.03 3.55
(1.15) (0.86)
122.57 102.69
0.11 0.12
0.12 -
93 61
75,758 59,692
19.36% 2.69%
0.10% 0.12%
123.91 106.91
1.06% 1.16%
Share class B Hedged Accumulation was launched on 30 October 2015.
95.38 86.04
153
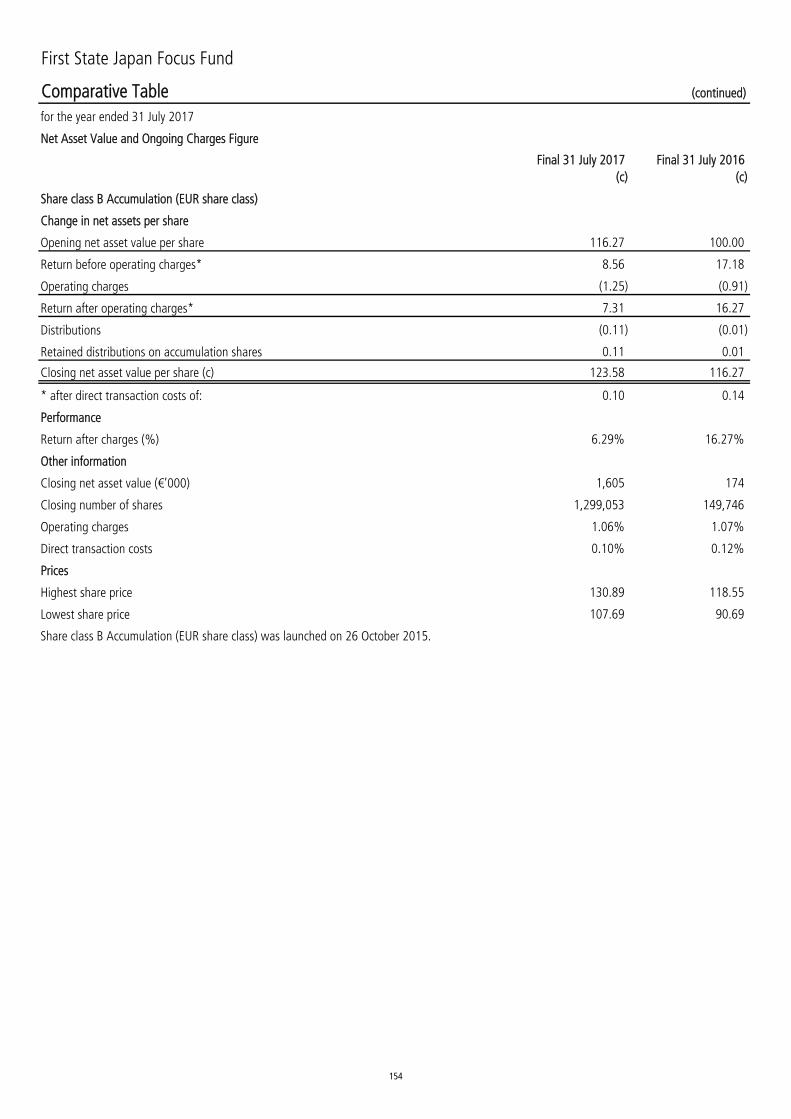
First State Japan Focus Fund
Comparative Table (continued)
for the year ended 31 July 2017
Net Asset Value and Ongoing Charges Figure
Share class B Accumulation (EUR share class)
Change in net assets per share
Opening net asset value per share
Return before operating charges*
Operating charges
Return after operating charges*
Distributions
Retained distributions on accumulation shares
Closing net asset value per share (c)
* after direct transaction costs of:
Performance
Return after charges (%)
Other information
Closing net asset value (€’000)
Closing number of shares
Operating charges
Direct transaction costs
Prices
Highest share price
Lowest share price
Final 31 July 2017(c)
Final 31 July 2016(c)
116.27 100.00
7.31 16.27
(0.11) (0.01)
8.56 17.18
(1.25) (0.91)
123.58 116.27
0.10 0.14
0.11 0.01
1,605 174
1,299,053 149,746
6.29% 16.27%
0.10% 0.12%
130.89 118.55
1.06% 1.07%
Share class B Accumulation (EUR share class) was launched on 26 October 2015.
107.69 90.69
154
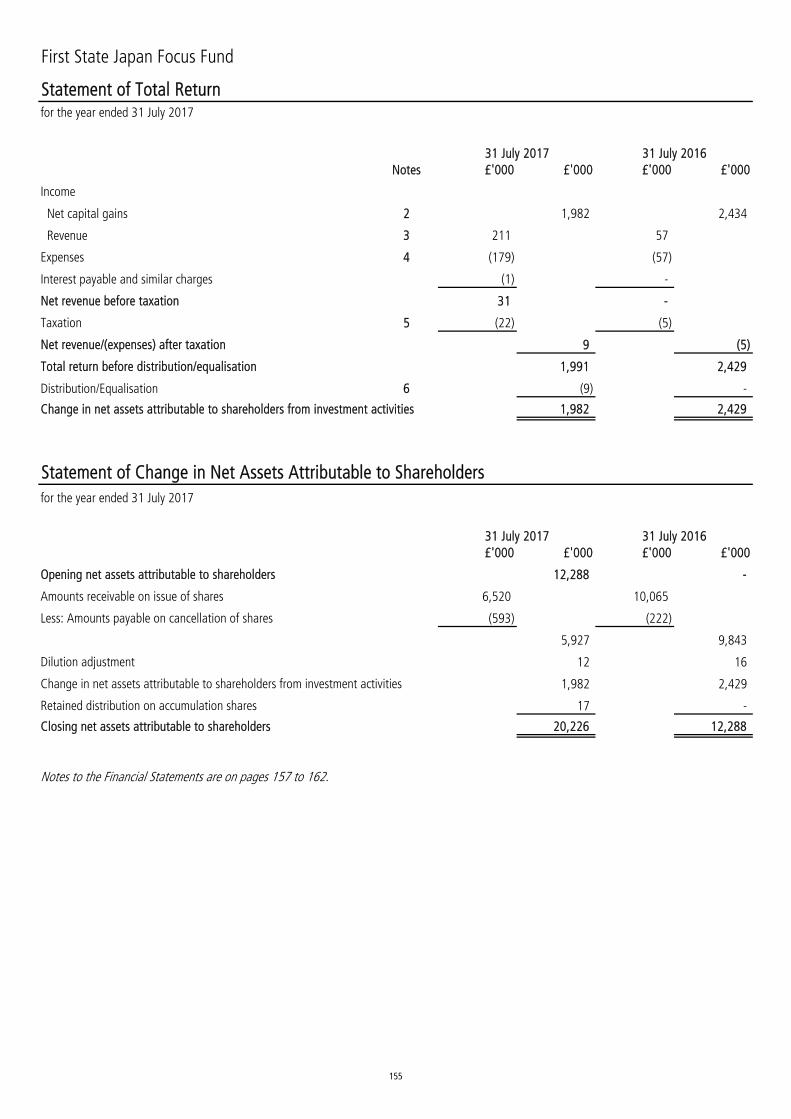
Notes £'000 £'000 £'000 £'000
Net capital gains 2 1,982 2,434
Revenue 3 211 57
4 (179) (57)
Interest payable and similar charges (1) -
31 -
5 (22) (5)
9 (5)
1,991 2,429
Distribution/Equalisation 6 (9) -
1,982 2,429
£'000 £'000 £'000 £'000
12,288 -
6,520 10,065
(593) (222)
5,927 9,843
12 16
1,982 2,429
17 -
20,226 12,288
31 July 2017 31 July 2016
First State Japan Focus Fund
Statement of Total Returnfor the year ended 31 July 2017
Statement of Change in Net Assets Attributable to Shareholders
Income
Expenses
Net revenue before taxation
Taxation
Net revenue/(expenses) after taxation
Total return before distribution/equalisation
Change in net assets attributable to shareholders from investment activities
Amounts receivable on issue of shares
for the year ended 31 July 2017
31 July 2017 31 July 2016
Opening net assets attributable to shareholders
Less: Amounts payable on cancellation of shares
Dilution adjustment
Change in net assets attributable to shareholders from investment activities
Retained distribution on accumulation shares
Closing net assets attributable to shareholders
Notes to the Financial Statements are on pages 157 to 162.
155
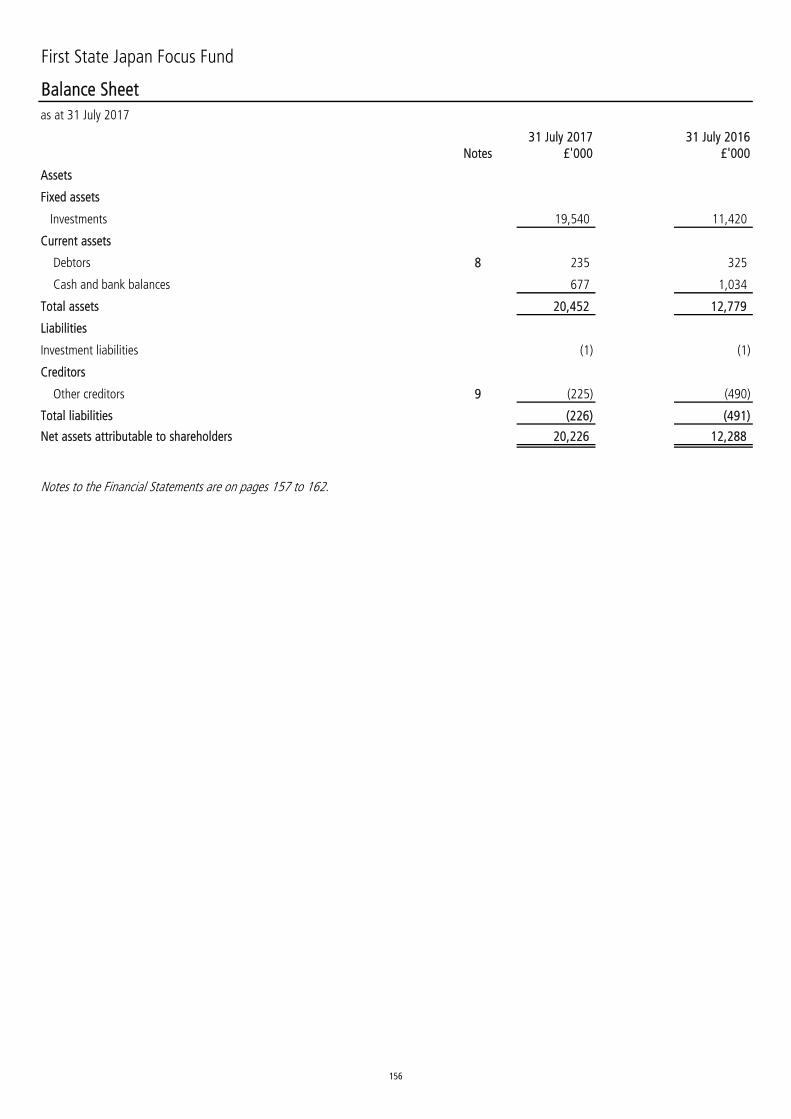
First State Japan Focus Fund
31 July 2017 31 July 2016Notes £'000 £'000
Investments 19,540 11,420
Current assets
8 235 325
677 1,034
20,452 12,779
(1) (1)
Creditors
Other creditors 9 (225) (490)
(226) (491)
20,226 12,288
Investment liabilities
Balance Sheetas at 31 July 2017
Assets
Fixed assets
Debtors
Cash and bank balances
Total assets
Liabilities
Notes to the Financial Statements are on pages 157 to 162.
Total liabilities
Net assets attributable to shareholders
156
1.
2.
31 July 2017 31 July 2016£'000 £'0001,986 2,467
4 (2)(8) (31)
1,982 2,434
3.
31 July 2017 31 July 2016£'000 £'000
(1) -212 56
- 1
211 57
4.
31 July 2017 31 July 2016£'000 £'000
146 47(11) (44)
135 3
3 2
4 92 22 1
33 40
41 52
179 57
Accounting basis and policies
Please see pages 9 to 11 for accounting basis and policies.
Net capital gains
The net capital gains during the year comprise:
Non-derivative securities
Notes to the Financial Statementsas at 31 July 2017
First State Japan Focus Fund
Net capital gains
Revenue
Forward foreign exchange currency contractsCurrency losses
Overseas taxable revenueOverseas non-taxable revenueInterest from bank deposits
Total revenue
ACD's periodic charge rebate
Payable to the Depositary, associates of the Depositary, and agents of either of them:Depositary's fees
Expenses
Payable to the ACD, associates of the ACD, and agents of either of them:ACD's periodic charge
Audit fee*Registrar feesSafe custody chargesOther expenses
Other expenses:
Total expenses
* The audit fee for the year to 31 July 2017 is £10,533 net of VAT. The figure above includes an adjustment for the over accrual of the prioryear fees.
157
Notes to the Financial Statements (continued)
as at 31 July 2017
First State Japan Focus Fund
5.
31 July 2017 31 July 2016£'000 £'000
(a)22 5
(b)
31 -
6 -
(42) (11)36 1122 5
22 5
(c)
(d)
6.
31 July 2017 31 July 2016£'000 £'000
17 -
17 -1 -
(9) -
9 -
7.
31 July 2017 31 July 2016£'000 £'000
9 (5)- 5
9 -
Taxation
Irrecoverable overseas taxAnalysis of charge in year:
Net revenue before taxation
Corporation tax of 20% (2016: 20%)
Effects of:
Factors affecting current tax charge for the year:
The tax assessed for the year is higher than (2016: higher than) the standard rate of corporation tax in the UK for an open-ended investmentcompany of 20% (2016: 20%). The differences are explained below:
Movement in excess management expensesIrrecoverable overseas tax
Overseas non-taxable revenue*
Deferred taxation:
There is no provision required for deferred taxation at the balance sheet date in the current or prior year.
Total tax charge for year (note 5a)
OEICs are exempt from tax on capital gains. Therefore, any capital return is not included in the above reconciliation.
* As an authorised OEIC, these items are not subject to corporation tax.
Factors that may affect future tax charges:
At the year end, after offset against revenue taxable on receipt, there is a potential deferred tax asset of £47,667 (31/07/16: £11,368); thisrelates to surplus management expenses. No deferred tax asset was recognised in the current and prior year as it was considered unlikely theFund would generate sufficient taxable profits in the future to utilise these amounts.
Distribution/Equalisation
The distribution/equalisation takes account of revenue received on the issue of shares and revenue deducted on the cancellation of shares andcomprise:
Add: revenue deducted on cancellation of sharesDeduct: revenue received on issue of shares
Net distribution/equalisation for the year
Final distribution
Details of the distribution per share are set out in the Distribution Tables on pages 163 to 164.
Movement between net revenue/(expenses) and net distribution/equalisation
Net revenue/(expenses) after taxationRevenue deficit
Net distribution/equalisation for the year
158
Notes to the Financial Statements (continued)
as at 31 July 2017
First State Japan Focus Fund
8.
31 July 2017 31 July 2016£'000 £'000
221 40- 273
14 5- 7
235 325
9.
31 July 2017 31 July 2016£'000 £'000
157 34513 10655 39
225 490
10.
31 July 2017 31 July 2016 31 July 2017 31 July 2016£'000 £'000 £'000 £'000
14,627 10,615 8,512 1,673
14,627 10,615 8,512 1,673
11 6 (6) (2)
- - - -
11 6 (6) (2)
14,638 10,621 8,506 1,671
31 July 2017 31 July 2016 31 July 2017 31 July 2016% % % %
0.08 0.06 0.07 0.12
- - - -
Amounts receivable for issue of sharesAccrued revenue
Debtors
Sales awaiting settlement
Accrued ACD's periodic charge rebate
Total debtors
Creditors
Purchases awaiting settlementAmounts payable for cancellation of sharesAccrued expenses
Analysis of total trade costs:
Purchases Sales
Equities
Total creditors
Portfolio transaction costs
Trades in the year before transaction costs
CommissionsEquities
TaxesEquities
Total costs
Total net trades in the year after transaction costs
CommissionsEquities
Total transaction cost expressed as a percentage of asset type cost:
Purchases Sales
EquitiesTaxes
159
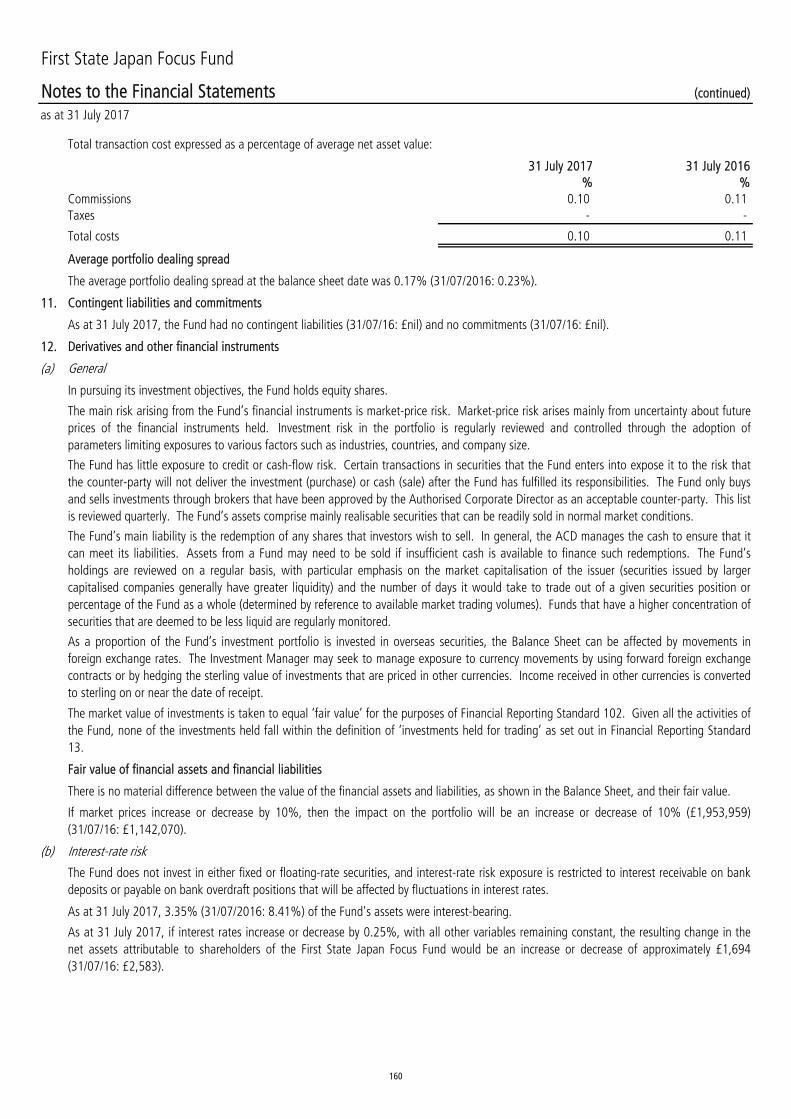
Notes to the Financial Statements (continued)
as at 31 July 2017
First State Japan Focus Fund
11.
12.
(a)
(b)
Commissions 0.10 0.11Taxes - -
Total transaction cost expressed as a percentage of average net asset value:
31 July 2017 31 July 2016% %
Total costs 0.10 0.11
Average portfolio dealing spread
Contingent liabilities and commitments
As at 31 July 2017, the Fund had no contingent liabilities (31/07/16: £nil) and no commitments (31/07/16: £nil).
The average portfolio dealing spread at the balance sheet date was 0.17% (31/07/2016: 0.23%).
The Fund’s main liability is the redemption of any shares that investors wish to sell. In general, the ACD manages the cash to ensure that itcan meet its liabilities. Assets from a Fund may need to be sold if insufficient cash is available to finance such redemptions. The Fund’sholdings are reviewed on a regular basis, with particular emphasis on the market capitalisation of the issuer (securities issued by largercapitalised companies generally have greater liquidity) and the number of days it would take to trade out of a given securities position orpercentage of the Fund as a whole (determined by reference to available market trading volumes). Funds that have a higher concentration ofsecurities that are deemed to be less liquid are regularly monitored.
As a proportion of the Fund’s investment portfolio is invested in overseas securities, the Balance Sheet can be affected by movements inforeign exchange rates. The Investment Manager may seek to manage exposure to currency movements by using forward foreign exchangecontracts or by hedging the sterling value of investments that are priced in other currencies. Income received in other currencies is convertedto sterling on or near the date of receipt.
The market value of investments is taken to equal ‘fair value’ for the purposes of Financial Reporting Standard 102. Given all the activities ofthe Fund, none of the investments held fall within the definition of ‘investments held for trading’ as set out in Financial Reporting Standard13.
Fair value of financial assets and financial liabilities
Derivatives and other financial instruments
General
In pursuing its investment objectives, the Fund holds equity shares.
The main risk arising from the Fund’s financial instruments is market-price risk. Market-price risk arises mainly from uncertainty about futureprices of the financial instruments held. Investment risk in the portfolio is regularly reviewed and controlled through the adoption ofparameters limiting exposures to various factors such as industries, countries, and company size.
The Fund has little exposure to credit or cash-flow risk. Certain transactions in securities that the Fund enters into expose it to the risk thatthe counter-party will not deliver the investment (purchase) or cash (sale) after the Fund has fulfilled its responsibilities. The Fund only buysand sells investments through brokers that have been approved by the Authorised Corporate Director as an acceptable counter-party. This listis reviewed quarterly. The Fund’s assets comprise mainly realisable securities that can be readily sold in normal market conditions.
As at 31 July 2017, 3.35% (31/07/2016: 8.41%) of the Fund's assets were interest-bearing.
As at 31 July 2017, if interest rates increase or decrease by 0.25%, with all other variables remaining constant, the resulting change in thenet assets attributable to shareholders of the First State Japan Focus Fund would be an increase or decrease of approximately £1,694(31/07/16: £2,583).
There is no material difference between the value of the financial assets and liabilities, as shown in the Balance Sheet, and their fair value.
If market prices increase or decrease by 10%, then the impact on the portfolio will be an increase or decrease of 10% (£1,953,959)(31/07/16: £1,142,070).
Interest-rate risk
The Fund does not invest in either fixed or floating-rate securities, and interest-rate risk exposure is restricted to interest receivable on bankdeposits or payable on bank overdraft positions that will be affected by fluctuations in interest rates.
160
Notes to the Financial Statements (continued)
as at 31 July 2017
First State Japan Focus Fund
(c)
Total TotalCurrency £'000 £'000Euro 49 76Japanese yen 19,678 11,683
Total 19,727 11,759
(d)
Financial derivative instruments exposure as at 31 July 2017 Value (£)Forward foreign currency contracts (hedging) (543)Total financial derivative instruments exposure (543)
Value (£)State Street Bank and Trust Company (543)
13.
Close family members of the Directors of the ACD had a combined holding in share class B Hedged Accumulation of 18.4%.
Material Shareholders
Close family members of the Directors of the ACD had a combined holding in share class B Hedged Accumulation of 18.4%.
Amounts paid to First State Investments (UK) Limited in respect of ACD fees are disclosed in note 4, with £14,289 (31/07/16: £7,571) due atthe year end.
As at 31 July 2017, RBC, as trustee for First State Investment Services (UK) Limited Employee Benefits Trust, a related party of the ACD,owned 35.52% (31/07/16: 36.02%) of the net asset value of the Fund.
HSBC Global Custody Nominee (UK) Limited and Fund Settle EOC Nominees Limited held material shareholdings in the Fund during the yearto 31 July 2017, and at the year end held 32.1% and 15.7% of the Fund’s shares in issue respectively.
Related parties
First State Investments (UK) Limited ("the ACD") is a related party to the Fund as defined by Financial Reporting Standard 8 ‘Related PartyDisclosures’ and FRS 102 Section 33 'Related Party Disclosures'. By virtue of the regulations governing Open-Ended Investment Companies,the ACD is party to every transaction in respect of shares of the Fund, which are summarised in the ‘Statement of Change in Net AssetsAttributable to Shareholders’. Amounts due at the year end in respect of issues and cancellations are included in the Balance Sheet.
Effective Portfolio Management
Counterparties to financial derivative instruments and efficient portfolio management techniques as at 31 July 2017
Derivative riskThe Manager may enter into derivatives transactions for investment purposes and for efficient portfolio management purposes. A relativelysmall market movement may have a potentially larger impact on derivatives than on the underlying assets, and the use of derivatives cantherefore increase the volatility of the value of units in the Scheme. However, it is not anticipated that the use of derivatives will have asignificant effect on the risk profile of the Scheme.
Exposure to the various markets may be balanced through tactical asset allocation of futures contracts. Tactical asset allocation is a techniquethat allows the ACD to undertake a switch in the Fund's exposure by the use of derivatives rather than through the sale and purchase by theFund of transferable securities.Due to the use of derivatives, the percentage movements in the value of the Fund will be different from the percentage movements in themarkets. At the period end, as the sensitivity analysis or value at risk are not significant, no additional disclosure has been shown.
If foreign exchange rates increase or decrease by 5%, then the impact on the NAV will be an increase or decrease of 4.88% (£986,310)(31/07/16: 4.78% (£587,942)).
The following summarises the sterling value of currencies of the Fund in which the investments, including cash, debtors and creditors, aredenominated.
As at 31 July 2017, the Fund had the following net currency exposure (excluding sterling):
Net foreign currency assets Net foreign currency assets31 July 2017 31 July 2016
Analysis of the Fund's currency exposure
161
Notes to the Financial Statements (continued)
as at 31 July 2017
First State Japan Focus Fund
14.
%0.850.850.85
31 July 2016 31 July 2017
Opening shares in issue Creations Cancellations
Shares converted
Closing shares in issue
8,850,593 3,654,310 (345,838) - 12,159,06559,692 94,358 (78,293) - 75,758
149,746 1,174,365 (25,058) - 1,299,053
15.
Assets Liabilities Assets Liabilities
£'000 £'000 £'000 £'00019,540 - 11,420 -
- (1) - (1)- - - -
19,540 (1) 11,420 (1)
Share classes
The Fund has three share classes in issue.
The ACD's periodic charge on each share class is as follows:
Share class B Accumulation (Institutional):Share class B Hedged Accumulation (Institutional):Share class B Accumulation (EUR share class) (Institutional):
All share classes have the same rights on winding up.
Reconciliation of the shares movement in the year:
Share class B Accumulation (Institutional)Share class B Hedged Accumulation (Institutional)Share class B Accumulation (EUR share class) (Institutional)
The net asset value of each share class, the net asset value per share and the number of shares in each class are given in the ComparativeTable on pages 152 to 154.
The distribution per share class is given in the Distribution Tables on pages 163 to 164.
Fair value
Valuation technique
31 July 2017 31 July 2016
Level 3: inputs are unobservable (i.e. market data is unavailable) for the asset or liability. Over the Counter (OTC) derivatives (including equityswaps) are held at fair value, which is determined by valuation techniques or single broker quotes.
Level 1Level 2Level 3
Total fair value
Level 1: the unadjusted quoted price in an active market for identical assets or liabilities that the entity can access at the measurement date. Level 2: inputs other than quoted prices included within Level 1 that are observable (i.e. developed using market data) for the asset or liability,either directly or indirectly.
162
Share class B Accumulation
Netrevenue Equalisation
Distributions paid to/payable
30/09/2017
Distributions paid
30/09/2016Group 1 (p) (p) (p) (p)Interim - - - -Final 0.1247 - 0.1247 -Group 2 (p) (p) (p) (p)Interim - - - -Final - 0.1247 0.1247 -
Share class B Hedged Accumulation
Netrevenue Equalisation
Distributions paid to/payable
30/09/2017
Distributions paid
30/09/2016Group 1 (p) (p) (p) (p)Interim - - - -Final 0.1185 - 0.1185 -Group 2 (p) (p) (p) (p)Interim - - - -Final 0.0165 0.1020 0.1185 -
Share class B Accumulation (EUR share class)
Netrevenue Equalisation
Distributions paid to/payable
30/09/2017
Distributions paid
30/09/2016Group 1 (c) (c) (c) (c)Interim - - - -Final 0.1124 - 0.1124 0.0112Group 2 (c) (c) (c) (c)Interim - - - -Final - 0.1124 0.1124 0.0112
First State Japan Focus Fund
Distribution Tablesfor the year ended 31 July 2017
Group 1 Interim - Shares purchased prior to 1 August 2016
Distribution in pence and cents per share
Group 2 Interim - Shares purchased between 1 August 2016 and 31 January 2017
Final - Shares purchased prior to 1 February 2017
Final - Shares purchased between 1 February 2017 and 31 July 2017
163
First State Japan Focus Fund
Distribution Tables (continued)
for the year ended 31 July 2017
Corporate tax for all share classes (unaudited)
A shareholder liable to corporation tax receives this distribution, excluding equalisation, as follows:
Interim - 100.00% of the dividend is received as franked investment income.
Interim - 0.00% of the dividend is received as an annual payment (non-foreign element) received after the deduction of income tax at the lowerrate and is liable to corporation tax. The tax deemed to be deducted is treated as income tax.
Interim - 0.00% of the dividend is received as an annual payment (foreign element) received after the deduction of income tax at the lower rate andis liable to corporation tax. It is treated as foreign income in the hands of the corporate investor and is liable to corporation tax. The associateddeemed tax is treated as foreign tax in the hands of the investor, who may be able to claim double tax relief. Investors cannot reclaim any of thisdeemed tax on the foreign element from HM Revenue & Customs.
Shareholders should consult their professional advisers for any advice regarding their tax position.
Final - 100.00% of the dividend is received as franked investment income.
Final - 0.00% of the dividend is received as an annual payment (non-foreign element) received after the deduction of income tax at the lower rateand is liable to corporation tax. The tax deemed to be deducted is treated as income tax.
Final - 0.00% of the dividend is received as an annual payment (foreign element) received after the deduction of income tax at the lower rate and isliable to corporation tax. It is treated as foreign income in the hands of the corporate investor and is liable to corporation tax. The associateddeemed tax is treated as foreign tax in the hands of the investor, who may be able to claim double tax relief. Investors cannot reclaim any of thisdeemed tax on the foreign element from HM Revenue & Customs.
164
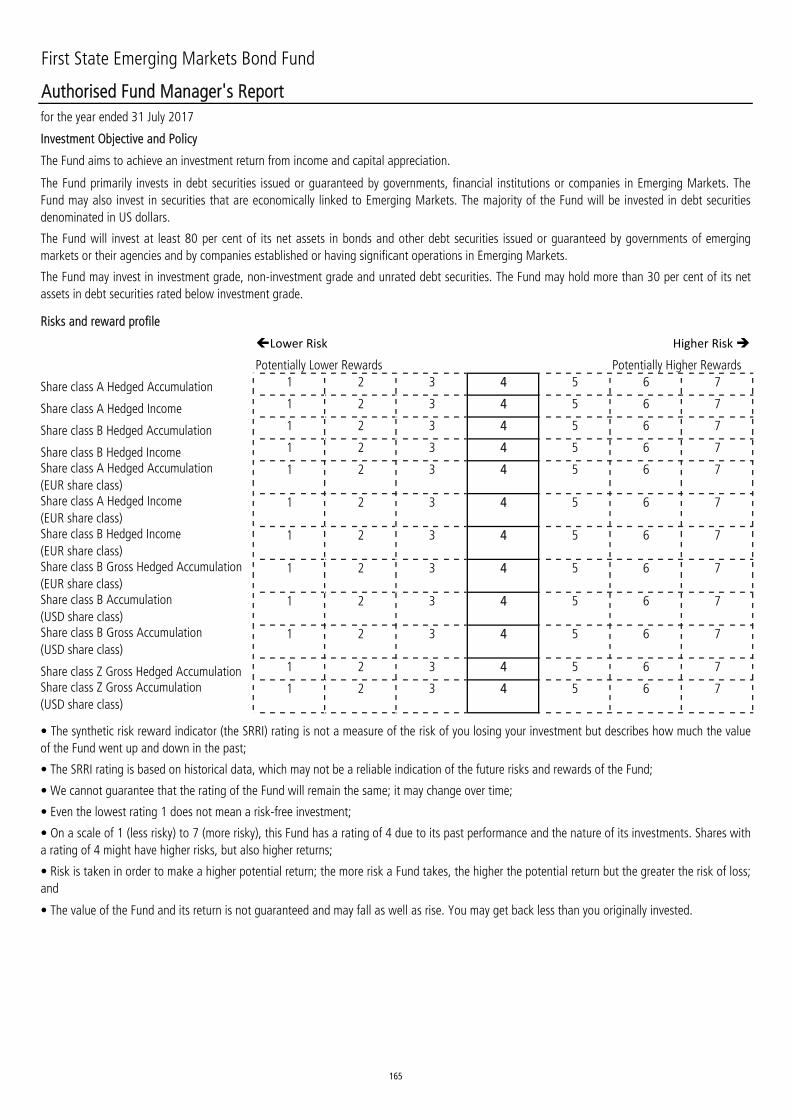
Risks and reward profile
Lower Risk Higher Risk
Potentially Lower Rewards Potentially Higher Rewards1 2 3 4 5 6 7
1 2 3 4 5 6 7
1 2 3 4 5 6 7
1 2 3 4 5 6 7
1 2 3 4 5 6 7
1 2 3 4 5 6 7
1 2 3 4 5 6 7
1 2 3 4 5 6 7
1 2 3 4 5 6 7
1 2 3 4 5 6 7
1 2 3 4 5 6 7
1 2 3 4 5 6 7
First State Emerging Markets Bond Fund
Authorised Fund Manager's Reportfor the year ended 31 July 2017
Investment Objective and Policy
The Fund may invest in investment grade, non-investment grade and unrated debt securities. The Fund may hold more than 30 per cent of its netassets in debt securities rated below investment grade.
The Fund aims to achieve an investment return from income and capital appreciation.
The Fund primarily invests in debt securities issued or guaranteed by governments, financial institutions or companies in Emerging Markets. TheFund may also invest in securities that are economically linked to Emerging Markets. The majority of the Fund will be invested in debt securitiesdenominated in US dollars.
The Fund will invest at least 80 per cent of its net assets in bonds and other debt securities issued or guaranteed by governments of emergingmarkets or their agencies and by companies established or having significant operations in Emerging Markets.
Share class A Hedged Accumulation
Share class A Hedged Income
Share class B Hedged Accumulation
Share class B Hedged Income
Share class Z Gross Hedged AccumulationShare class Z Gross Accumulation(USD share class)
Share class A Hedged Accumulation (EUR share class)Share class A Hedged Income (EUR share class)Share class B Hedged Income(EUR share class)Share class B Gross Hedged Accumulation (EUR share class)Share class B Accumulation(USD share class)Share class B Gross Accumulation(USD share class)
• The synthetic risk reward indicator (the SRRI) rating is not a measure of the risk of you losing your investment but describes how much the valueof the Fund went up and down in the past;
• The SRRI rating is based on historical data, which may not be a reliable indication of the future risks and rewards of the Fund;
• We cannot guarantee that the rating of the Fund will remain the same; it may change over time;
• Even the lowest rating 1 does not mean a risk-free investment;
• On a scale of 1 (less risky) to 7 (more risky), this Fund has a rating of 4 due to its past performance and the nature of its investments. Shares witha rating of 4 might have higher risks, but also higher returns;
• Risk is taken in order to make a higher potential return; the more risk a Fund takes, the higher the potential return but the greater the risk of loss;and
• The value of the Fund and its return is not guaranteed and may fall as well as rise. You may get back less than you originally invested.
165
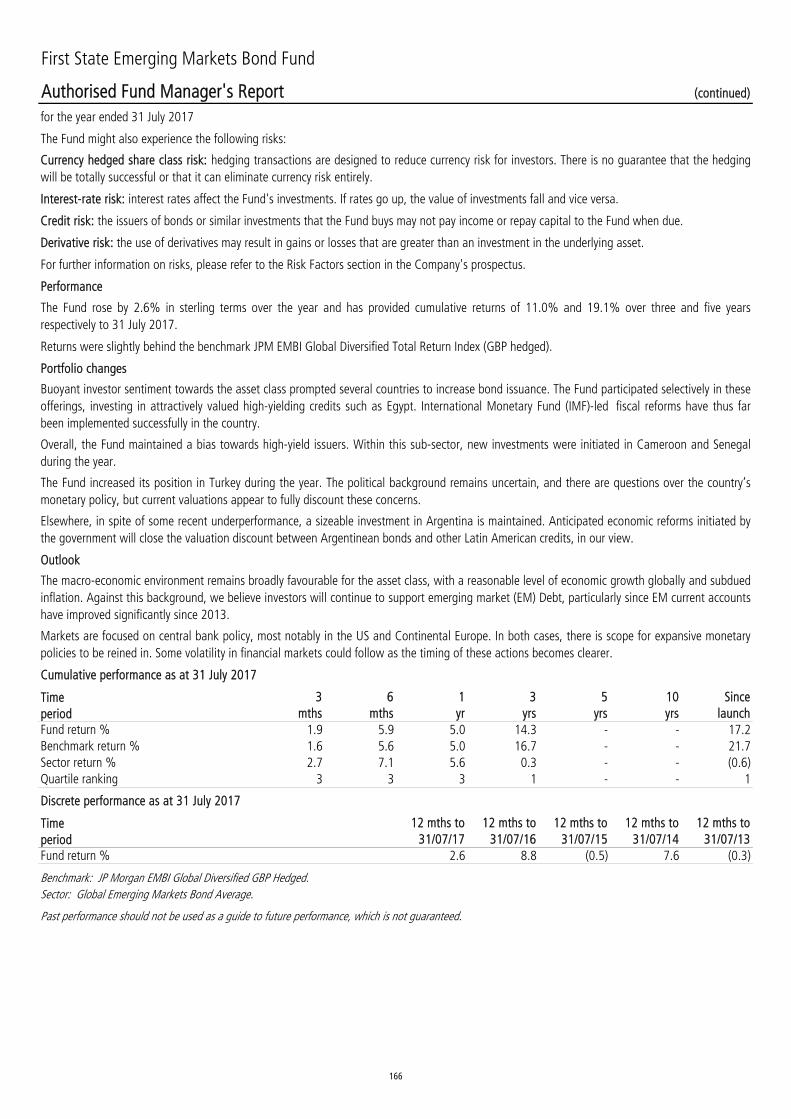
(continued)
First State Emerging Markets Bond Fund
Authorised Fund Manager's Reportfor the year ended 31 July 2017
Time 3 6 1 3 5 10 Sinceperiod mths mths yr yrs yrs yrs launch
1.9 5.9 5.0 14.3 - - 17.2 1.6 5.6 5.0 16.7 - - 21.7 2.7 7.1 5.6 0.3 - - (0.6)
3 3 3 1 - - 1
12 mths to 12 mths to 12 mths to 12 mths to 12 mths to31/07/17 31/07/16 31/07/15 31/07/14 31/07/13
2.6 8.8 (0.5) 7.6 (0.3)
Currency hedged share class risk: hedging transactions are designed to reduce currency risk for investors. There is no guarantee that the hedgingwill be totally successful or that it can eliminate currency risk entirely.
Interest-rate risk: interest rates affect the Fund's investments. If rates go up, the value of investments fall and vice versa.
Credit risk: the issuers of bonds or similar investments that the Fund buys may not pay income or repay capital to the Fund when due.
Derivative risk: the use of derivatives may result in gains or losses that are greater than an investment in the underlying asset.
The Fund might also experience the following risks:
For further information on risks, please refer to the Risk Factors section in the Company's prospectus.
Performance
The Fund rose by 2.6% in sterling terms over the year and has provided cumulative returns of 11.0% and 19.1% over three and five yearsrespectively to 31 July 2017.
Returns were slightly behind the benchmark JPM EMBI Global Diversified Total Return Index (GBP hedged).
Elsewhere, in spite of some recent underperformance, a sizeable investment in Argentina is maintained. Anticipated economic reforms initiated bythe government will close the valuation discount between Argentinean bonds and other Latin American credits, in our view.
Portfolio changes
Buoyant investor sentiment towards the asset class prompted several countries to increase bond issuance. The Fund participated selectively in theseofferings, investing in attractively valued high-yielding credits such as Egypt. International Monetary Fund (IMF)-led fiscal reforms have thus farbeen implemented successfully in the country.
Overall, the Fund maintained a bias towards high-yield issuers. Within this sub-sector, new investments were initiated in Cameroon and Senegalduring the year.
The Fund increased its position in Turkey during the year. The political background remains uncertain, and there are questions over the country’smonetary policy, but current valuations appear to fully discount these concerns.
Outlook
The macro-economic environment remains broadly favourable for the asset class, with a reasonable level of economic growth globally and subduedinflation. Against this background, we believe investors will continue to support emerging market (EM) Debt, particularly since EM current accountshave improved significantly since 2013.
Markets are focused on central bank policy, most notably in the US and Continental Europe. In both cases, there is scope for expansive monetarypolicies to be reined in. Some volatility in financial markets could follow as the timing of these actions becomes clearer.
Cumulative performance as at 31 July 2017
Fund return %
TimeperiodFund return %
Benchmark: JP Morgan EMBI Global Diversified GBP Hedged.Sector: Global Emerging Markets Bond Average.
Benchmark return %Sector return %Quartile ranking
Discrete performance as at 31 July 2017
Past performance should not be used as a guide to future performance, which is not guaranteed.
166
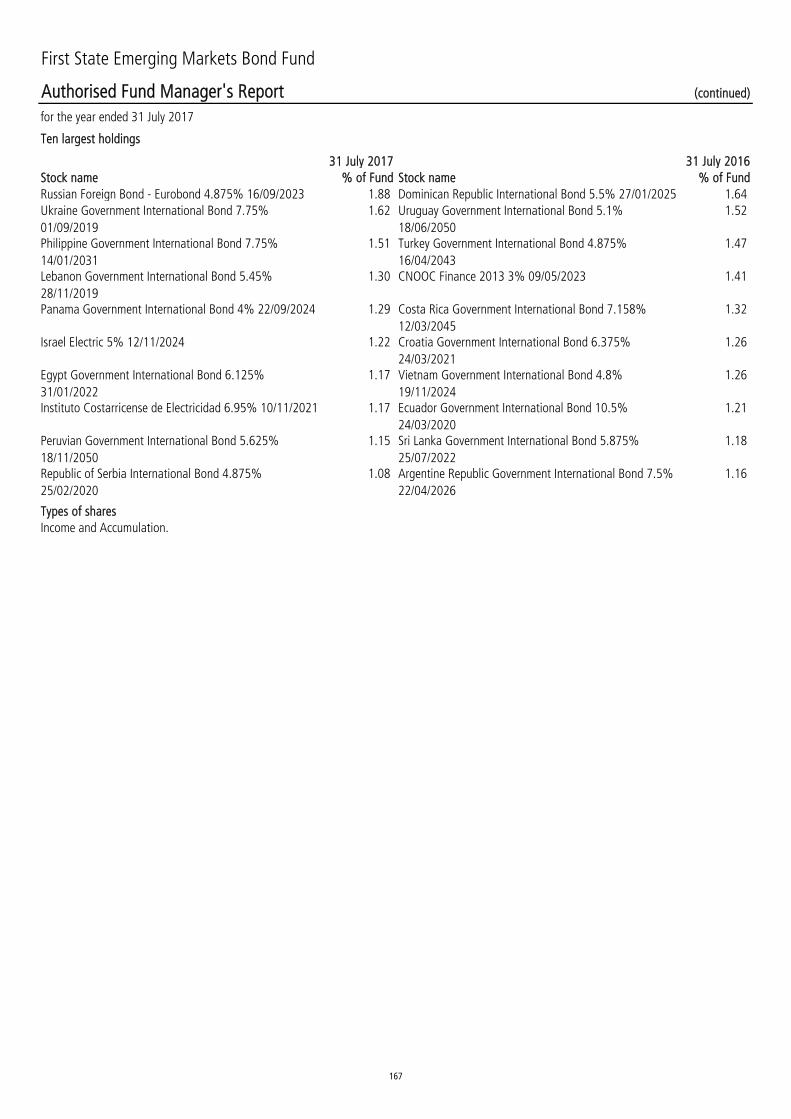
(continued)
First State Emerging Markets Bond Fund
Authorised Fund Manager's Reportfor the year ended 31 July 2017
31 July 2017 31 July 2016% of Fund % of Fund
Russian Foreign Bond - Eurobond 4.875% 16/09/2023 1.88 1.641.62 1.52
1.51 1.47
1.30 1.41
1.29 1.32
1.22 1.26
1.17 1.26
1.17 1.21
1.15 1.18
1.08 1.16
Dominican Republic International Bond 5.5% 27/01/2025Stock name Stock name
Ten largest holdings
Panama Government International Bond 4% 22/09/2024 Costa Rica Government International Bond 7.158% 12/03/2045
Israel Electric 5% 12/11/2024 Croatia Government International Bond 6.375% 24/03/2021
Egypt Government International Bond 6.125% 31/01/2022
Vietnam Government International Bond 4.8% 19/11/2024
Ukraine Government International Bond 7.75% 01/09/2019
Uruguay Government International Bond 5.1% 18/06/2050
Philippine Government International Bond 7.75% 14/01/2031
Turkey Government International Bond 4.875% 16/04/2043
Lebanon Government International Bond 5.45% 28/11/2019
CNOOC Finance 2013 3% 09/05/2023
Types of sharesIncome and Accumulation.
Instituto Costarricense de Electricidad 6.95% 10/11/2021 Ecuador Government International Bond 10.5% 24/03/2020
Peruvian Government International Bond 5.625% 18/11/2050
Sri Lanka Government International Bond 5.875% 25/07/2022
Republic of Serbia International Bond 4.875% 25/02/2020
Argentine Republic Government International Bond 7.5% 22/04/2026
167
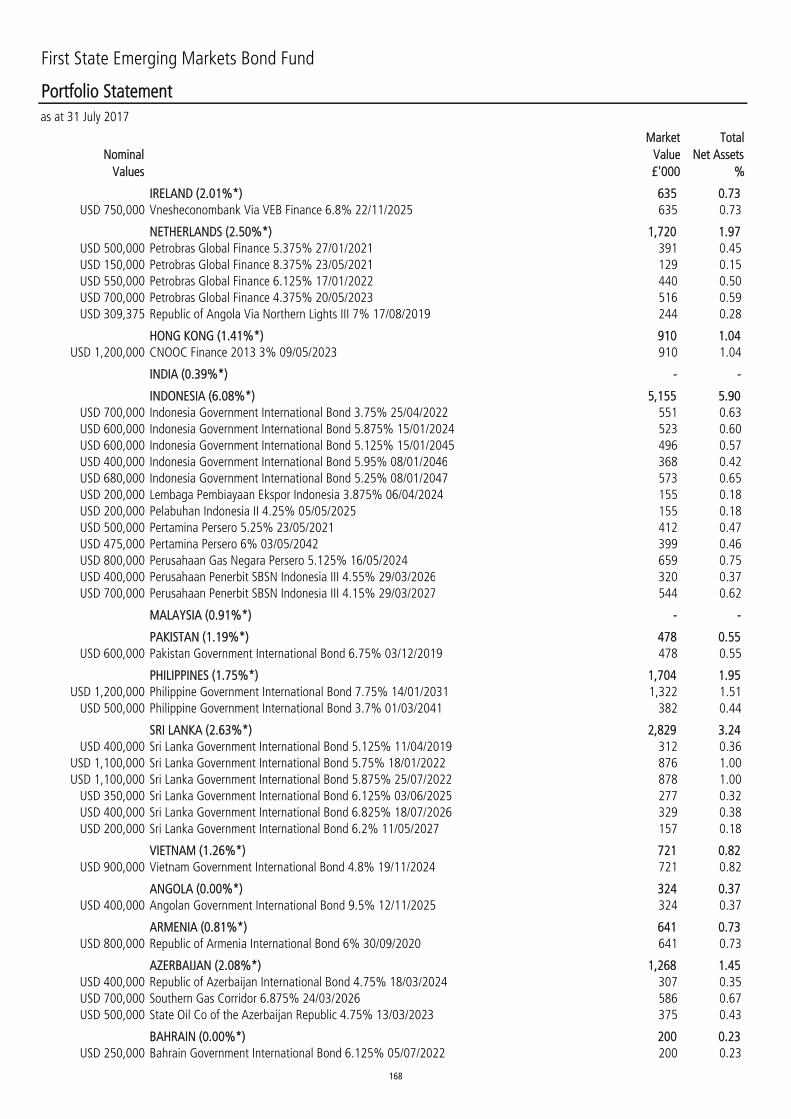
NominalValues
MarketValue£'000
TotalNet Assets
%
IRELAND (2.01%*) 635 0.73USD 750,000 Vnesheconombank Via VEB Finance 6.8% 22/11/2025 635 0.73
NETHERLANDS (2.50%*) 1,720 1.97USD 500,000 Petrobras Global Finance 5.375% 27/01/2021 391 0.45USD 150,000 Petrobras Global Finance 8.375% 23/05/2021 129 0.15USD 550,000 Petrobras Global Finance 6.125% 17/01/2022 440 0.50USD 700,000 Petrobras Global Finance 4.375% 20/05/2023 516 0.59USD 309,375 Republic of Angola Via Northern Lights III 7% 17/08/2019 244 0.28
HONG KONG (1.41%*) 910 1.04USD 1,200,000 CNOOC Finance 2013 3% 09/05/2023 910 1.04
INDIA (0.39%*) - -
INDONESIA (6.08%*) 5,155 5.90USD 700,000 Indonesia Government International Bond 3.75% 25/04/2022 551 0.63USD 600,000 Indonesia Government International Bond 5.875% 15/01/2024 523 0.60USD 600,000 Indonesia Government International Bond 5.125% 15/01/2045 496 0.57USD 400,000 Indonesia Government International Bond 5.95% 08/01/2046 368 0.42USD 680,000 Indonesia Government International Bond 5.25% 08/01/2047 573 0.65USD 200,000 Lembaga Pembiayaan Ekspor Indonesia 3.875% 06/04/2024 155 0.18USD 200,000 Pelabuhan Indonesia II 4.25% 05/05/2025 155 0.18USD 500,000 Pertamina Persero 5.25% 23/05/2021 412 0.47USD 475,000 Pertamina Persero 6% 03/05/2042 399 0.46USD 800,000 Perusahaan Gas Negara Persero 5.125% 16/05/2024 659 0.75USD 400,000 Perusahaan Penerbit SBSN Indonesia III 4.55% 29/03/2026 320 0.37USD 700,000 Perusahaan Penerbit SBSN Indonesia III 4.15% 29/03/2027 544 0.62
MALAYSIA (0.91%*) - -
PAKISTAN (1.19%*) 478 0.55USD 600,000 Pakistan Government International Bond 6.75% 03/12/2019 478 0.55
PHILIPPINES (1.75%*) 1,704 1.95USD 1,200,000 Philippine Government International Bond 7.75% 14/01/2031 1,322 1.51
USD 500,000 Philippine Government International Bond 3.7% 01/03/2041 382 0.44
SRI LANKA (2.63%*) 2,829 3.24USD 400,000 Sri Lanka Government International Bond 5.125% 11/04/2019 312 0.36
USD 1,100,000 Sri Lanka Government International Bond 5.75% 18/01/2022 876 1.00USD 1,100,000 Sri Lanka Government International Bond 5.875% 25/07/2022 878 1.00
USD 350,000 Sri Lanka Government International Bond 6.125% 03/06/2025 277 0.32USD 400,000 Sri Lanka Government International Bond 6.825% 18/07/2026 329 0.38USD 200,000 Sri Lanka Government International Bond 6.2% 11/05/2027 157 0.18
VIETNAM (1.26%*) 721 0.82USD 900,000 Vietnam Government International Bond 4.8% 19/11/2024 721 0.82
ANGOLA (0.00%*) 324 0.37USD 400,000 Angolan Government International Bond 9.5% 12/11/2025 324 0.37
ARMENIA (0.81%*) 641 0.73USD 800,000 Republic of Armenia International Bond 6% 30/09/2020 641 0.73
AZERBAIJAN (2.08%*) 1,268 1.45USD 400,000 Republic of Azerbaijan International Bond 4.75% 18/03/2024 307 0.35USD 700,000 Southern Gas Corridor 6.875% 24/03/2026 586 0.67USD 500,000 State Oil Co of the Azerbaijan Republic 4.75% 13/03/2023 375 0.43
BAHRAIN (0.00%*) 200 0.23USD 250,000 Bahrain Government International Bond 6.125% 05/07/2022 200 0.23
First State Emerging Markets Bond Fund
Portfolio Statementas at 31 July 2017
168
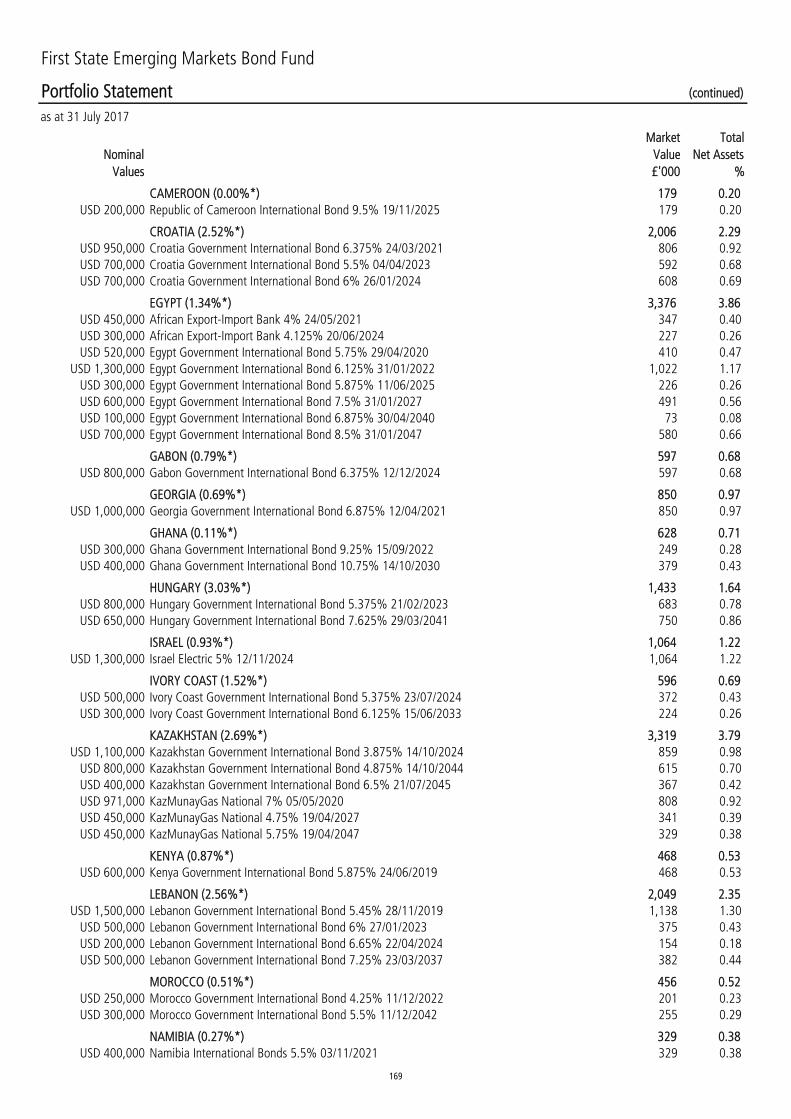
NominalValues
MarketValue£'000
TotalNet Assets
%
First State Emerging Markets Bond Fund
Portfolio Statement (continued)
as at 31 July 2017
CAMEROON (0.00%*) 179 0.20USD 200,000 Republic of Cameroon International Bond 9.5% 19/11/2025 179 0.20
CROATIA (2.52%*) 2,006 2.29USD 950,000 Croatia Government International Bond 6.375% 24/03/2021 806 0.92USD 700,000 Croatia Government International Bond 5.5% 04/04/2023 592 0.68USD 700,000 Croatia Government International Bond 6% 26/01/2024 608 0.69
EGYPT (1.34%*) 3,376 3.86USD 450,000 African Export-Import Bank 4% 24/05/2021 347 0.40USD 300,000 African Export-Import Bank 4.125% 20/06/2024 227 0.26USD 520,000 Egypt Government International Bond 5.75% 29/04/2020 410 0.47
USD 1,300,000 Egypt Government International Bond 6.125% 31/01/2022 1,022 1.17USD 300,000 Egypt Government International Bond 5.875% 11/06/2025 226 0.26USD 600,000 Egypt Government International Bond 7.5% 31/01/2027 491 0.56USD 100,000 Egypt Government International Bond 6.875% 30/04/2040 73 0.08USD 700,000 Egypt Government International Bond 8.5% 31/01/2047 580 0.66
GABON (0.79%*) 597 0.68USD 800,000 Gabon Government International Bond 6.375% 12/12/2024 597 0.68
GEORGIA (0.69%*) 850 0.97USD 1,000,000 Georgia Government International Bond 6.875% 12/04/2021 850 0.97
GHANA (0.11%*) 628 0.71USD 300,000 Ghana Government International Bond 9.25% 15/09/2022 249 0.28USD 400,000 Ghana Government International Bond 10.75% 14/10/2030 379 0.43
HUNGARY (3.03%*) 1,433 1.64USD 800,000 Hungary Government International Bond 5.375% 21/02/2023 683 0.78USD 650,000 Hungary Government International Bond 7.625% 29/03/2041 750 0.86
ISRAEL (0.93%*) 1,064 1.22USD 1,300,000 Israel Electric 5% 12/11/2024 1,064 1.22
IVORY COAST (1.52%*) 596 0.69USD 500,000 Ivory Coast Government International Bond 5.375% 23/07/2024 372 0.43USD 300,000 Ivory Coast Government International Bond 6.125% 15/06/2033 224 0.26
KAZAKHSTAN (2.69%*) 3,319 3.79USD 1,100,000 Kazakhstan Government International Bond 3.875% 14/10/2024 859 0.98
USD 800,000 Kazakhstan Government International Bond 4.875% 14/10/2044 615 0.70USD 400,000 Kazakhstan Government International Bond 6.5% 21/07/2045 367 0.42USD 971,000 KazMunayGas National 7% 05/05/2020 808 0.92USD 450,000 KazMunayGas National 4.75% 19/04/2027 341 0.39USD 450,000 KazMunayGas National 5.75% 19/04/2047 329 0.38
KENYA (0.87%*) 468 0.53USD 600,000 Kenya Government International Bond 5.875% 24/06/2019 468 0.53
LEBANON (2.56%*) 2,049 2.35USD 1,500,000 Lebanon Government International Bond 5.45% 28/11/2019 1,138 1.30
USD 500,000 Lebanon Government International Bond 6% 27/01/2023 375 0.43USD 200,000 Lebanon Government International Bond 6.65% 22/04/2024 154 0.18USD 500,000 Lebanon Government International Bond 7.25% 23/03/2037 382 0.44
MOROCCO (0.51%*) 456 0.52USD 250,000 Morocco Government International Bond 4.25% 11/12/2022 201 0.23USD 300,000 Morocco Government International Bond 5.5% 11/12/2042 255 0.29
NAMIBIA (0.27%*) 329 0.38USD 400,000 Namibia International Bonds 5.5% 03/11/2021 329 0.38
169
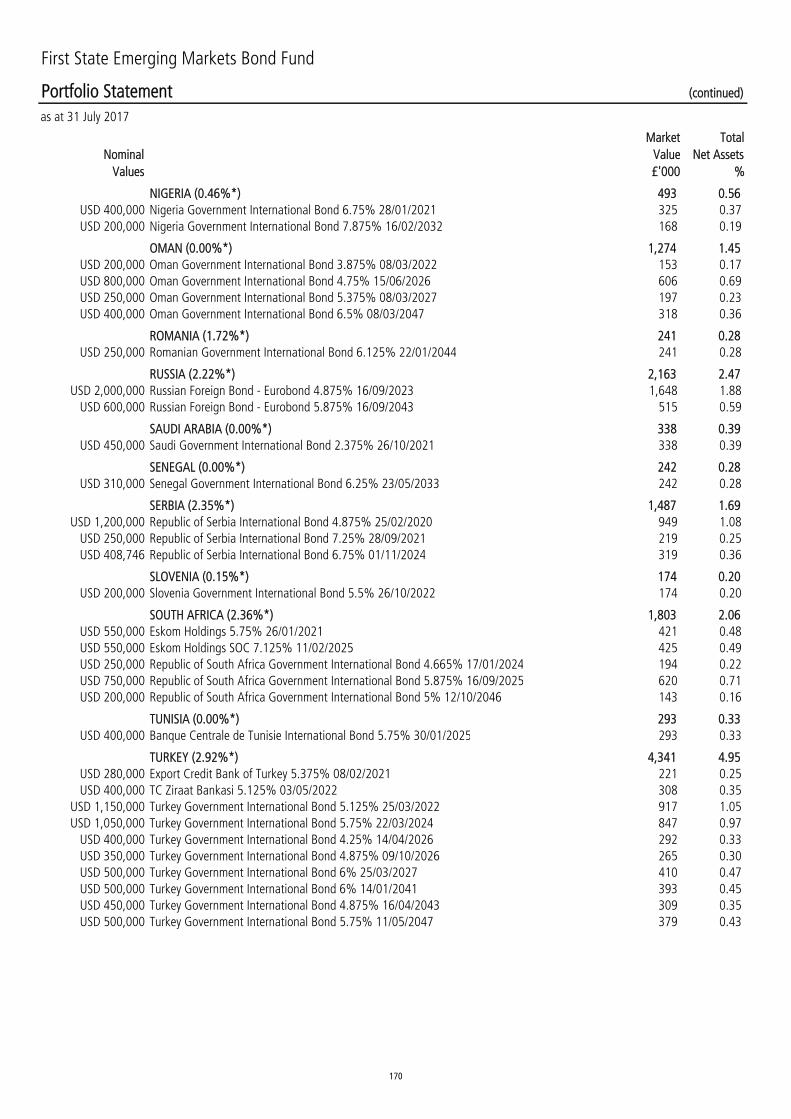
NominalValues
MarketValue£'000
TotalNet Assets
%
First State Emerging Markets Bond Fund
Portfolio Statement (continued)
as at 31 July 2017
NIGERIA (0.46%*) 493 0.56USD 400,000 Nigeria Government International Bond 6.75% 28/01/2021 325 0.37USD 200,000 Nigeria Government International Bond 7.875% 16/02/2032 168 0.19
OMAN (0.00%*) 1,274 1.45USD 200,000 Oman Government International Bond 3.875% 08/03/2022 153 0.17USD 800,000 Oman Government International Bond 4.75% 15/06/2026 606 0.69USD 250,000 Oman Government International Bond 5.375% 08/03/2027 197 0.23USD 400,000 Oman Government International Bond 6.5% 08/03/2047 318 0.36
ROMANIA (1.72%*) 241 0.28USD 250,000 Romanian Government International Bond 6.125% 22/01/2044 241 0.28
RUSSIA (2.22%*) 2,163 2.47USD 2,000,000 Russian Foreign Bond - Eurobond 4.875% 16/09/2023 1,648 1.88
USD 600,000 Russian Foreign Bond - Eurobond 5.875% 16/09/2043 515 0.59
SAUDI ARABIA (0.00%*) 338 0.39USD 450,000 Saudi Government International Bond 2.375% 26/10/2021 338 0.39
SENEGAL (0.00%*) 242 0.28USD 310,000 Senegal Government International Bond 6.25% 23/05/2033 242 0.28
SERBIA (2.35%*) 1,487 1.69USD 1,200,000 Republic of Serbia International Bond 4.875% 25/02/2020 949 1.08
USD 250,000 Republic of Serbia International Bond 7.25% 28/09/2021 219 0.25USD 408,746 Republic of Serbia International Bond 6.75% 01/11/2024 319 0.36
SLOVENIA (0.15%*) 174 0.20USD 200,000 Slovenia Government International Bond 5.5% 26/10/2022 174 0.20
SOUTH AFRICA (2.36%*) 1,803 2.06USD 550,000 Eskom Holdings 5.75% 26/01/2021 421 0.48USD 550,000 Eskom Holdings SOC 7.125% 11/02/2025 425 0.49USD 250,000 Republic of South Africa Government International Bond 4.665% 17/01/2024 194 0.22USD 750,000 Republic of South Africa Government International Bond 5.875% 16/09/2025 620 0.71USD 200,000 Republic of South Africa Government International Bond 5% 12/10/2046 143 0.16
TUNISIA (0.00%*) 293 0.33USD 400,000 Banque Centrale de Tunisie International Bond 5.75% 30/01/2025 293 0.33
TURKEY (2.92%*) 4,341 4.95USD 280,000 Export Credit Bank of Turkey 5.375% 08/02/2021 221 0.25USD 400,000 TC Ziraat Bankasi 5.125% 03/05/2022 308 0.35
USD 1,150,000 Turkey Government International Bond 5.125% 25/03/2022 917 1.05USD 1,050,000 Turkey Government International Bond 5.75% 22/03/2024 847 0.97
USD 400,000 Turkey Government International Bond 4.25% 14/04/2026 292 0.33USD 350,000 Turkey Government International Bond 4.875% 09/10/2026 265 0.30USD 500,000 Turkey Government International Bond 6% 25/03/2027 410 0.47USD 500,000 Turkey Government International Bond 6% 14/01/2041 393 0.45USD 450,000 Turkey Government International Bond 4.875% 16/04/2043 309 0.35USD 500,000 Turkey Government International Bond 5.75% 11/05/2047 379 0.43
170
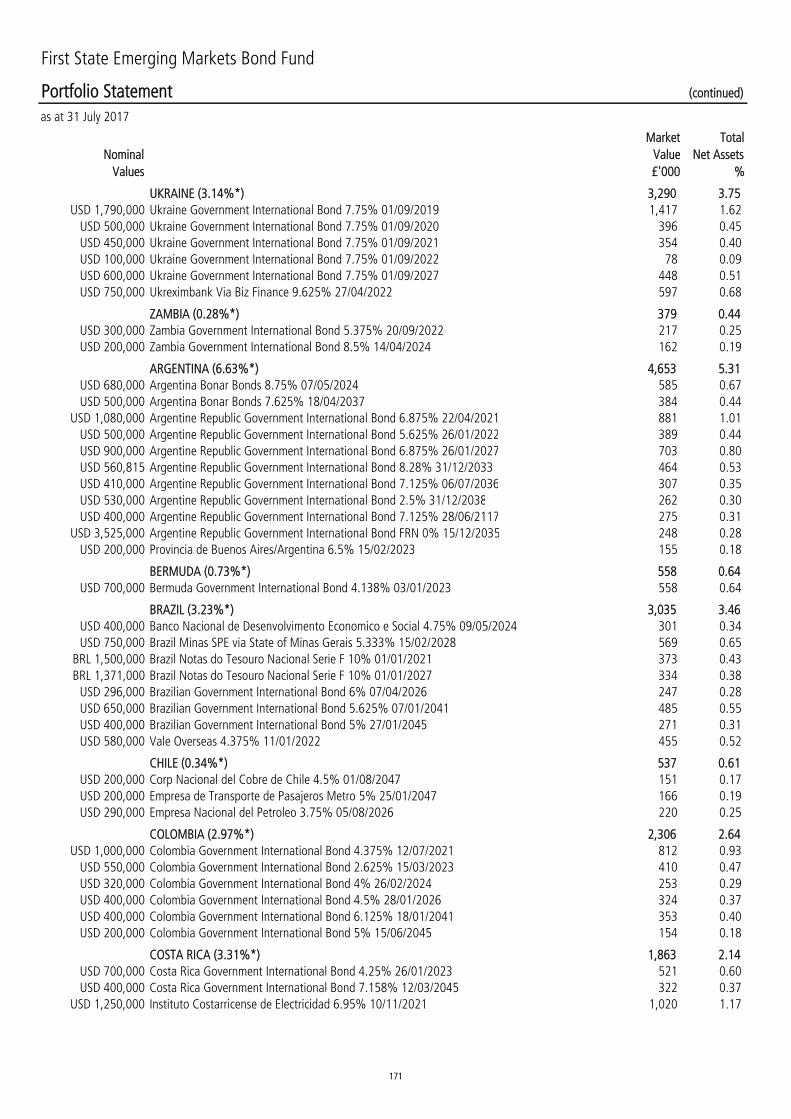
NominalValues
MarketValue£'000
TotalNet Assets
%
First State Emerging Markets Bond Fund
Portfolio Statement (continued)
as at 31 July 2017
UKRAINE (3.14%*) 3,290 3.75USD 1,790,000 Ukraine Government International Bond 7.75% 01/09/2019 1,417 1.62
USD 500,000 Ukraine Government International Bond 7.75% 01/09/2020 396 0.45USD 450,000 Ukraine Government International Bond 7.75% 01/09/2021 354 0.40USD 100,000 Ukraine Government International Bond 7.75% 01/09/2022 78 0.09USD 600,000 Ukraine Government International Bond 7.75% 01/09/2027 448 0.51USD 750,000 Ukreximbank Via Biz Finance 9.625% 27/04/2022 597 0.68
ZAMBIA (0.28%*) 379 0.44USD 300,000 Zambia Government International Bond 5.375% 20/09/2022 217 0.25USD 200,000 Zambia Government International Bond 8.5% 14/04/2024 162 0.19
ARGENTINA (6.63%*) 4,653 5.31USD 680,000 Argentina Bonar Bonds 8.75% 07/05/2024 585 0.67USD 500,000 Argentina Bonar Bonds 7.625% 18/04/2037 384 0.44
USD 1,080,000 Argentine Republic Government International Bond 6.875% 22/04/2021 881 1.01USD 500,000 Argentine Republic Government International Bond 5.625% 26/01/2022 389 0.44USD 900,000 Argentine Republic Government International Bond 6.875% 26/01/2027 703 0.80USD 560,815 Argentine Republic Government International Bond 8.28% 31/12/2033 464 0.53USD 410,000 Argentine Republic Government International Bond 7.125% 06/07/2036 307 0.35USD 530,000 Argentine Republic Government International Bond 2.5% 31/12/2038 262 0.30USD 400,000 Argentine Republic Government International Bond 7.125% 28/06/2117 275 0.31
USD 3,525,000 Argentine Republic Government International Bond FRN 0% 15/12/2035 248 0.28USD 200,000 Provincia de Buenos Aires/Argentina 6.5% 15/02/2023 155 0.18
BERMUDA (0.73%*) 558 0.64USD 700,000 Bermuda Government International Bond 4.138% 03/01/2023 558 0.64
BRAZIL (3.23%*) 3,035 3.46USD 400,000 Banco Nacional de Desenvolvimento Economico e Social 4.75% 09/05/2024 301 0.34USD 750,000 Brazil Minas SPE via State of Minas Gerais 5.333% 15/02/2028 569 0.65
BRL 1,500,000 Brazil Notas do Tesouro Nacional Serie F 10% 01/01/2021 373 0.43BRL 1,371,000 Brazil Notas do Tesouro Nacional Serie F 10% 01/01/2027 334 0.38
USD 296,000 Brazilian Government International Bond 6% 07/04/2026 247 0.28USD 650,000 Brazilian Government International Bond 5.625% 07/01/2041 485 0.55USD 400,000 Brazilian Government International Bond 5% 27/01/2045 271 0.31USD 580,000 Vale Overseas 4.375% 11/01/2022 455 0.52
CHILE (0.34%*) 537 0.61USD 200,000 Corp Nacional del Cobre de Chile 4.5% 01/08/2047 151 0.17USD 200,000 Empresa de Transporte de Pasajeros Metro 5% 25/01/2047 166 0.19USD 290,000 Empresa Nacional del Petroleo 3.75% 05/08/2026 220 0.25
COLOMBIA (2.97%*) 2,306 2.64USD 1,000,000 Colombia Government International Bond 4.375% 12/07/2021 812 0.93
USD 550,000 Colombia Government International Bond 2.625% 15/03/2023 410 0.47USD 320,000 Colombia Government International Bond 4% 26/02/2024 253 0.29USD 400,000 Colombia Government International Bond 4.5% 28/01/2026 324 0.37USD 400,000 Colombia Government International Bond 6.125% 18/01/2041 353 0.40USD 200,000 Colombia Government International Bond 5% 15/06/2045 154 0.18
COSTA RICA (3.31%*) 1,863 2.14USD 700,000 Costa Rica Government International Bond 4.25% 26/01/2023 521 0.60USD 400,000 Costa Rica Government International Bond 7.158% 12/03/2045 322 0.37
USD 1,250,000 Instituto Costarricense de Electricidad 6.95% 10/11/2021 1,020 1.17
171
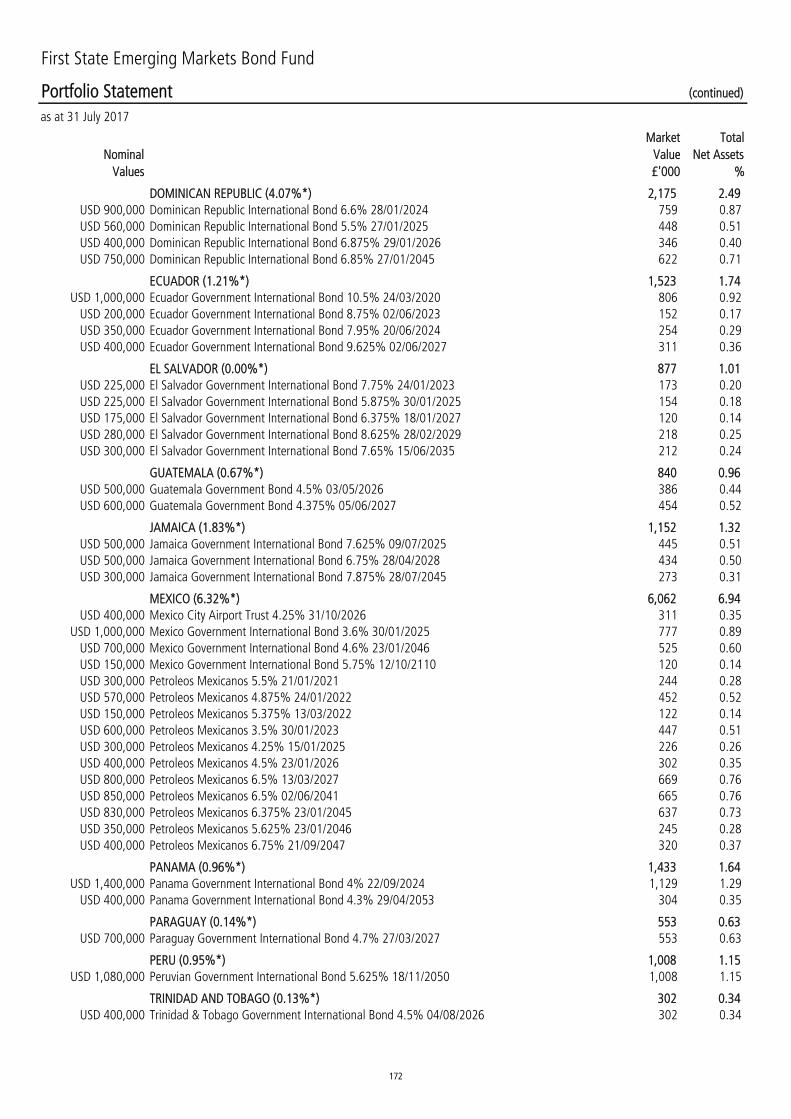
NominalValues
MarketValue£'000
TotalNet Assets
%
First State Emerging Markets Bond Fund
Portfolio Statement (continued)
as at 31 July 2017
DOMINICAN REPUBLIC (4.07%*) 2,175 2.49USD 900,000 Dominican Republic International Bond 6.6% 28/01/2024 759 0.87USD 560,000 Dominican Republic International Bond 5.5% 27/01/2025 448 0.51USD 400,000 Dominican Republic International Bond 6.875% 29/01/2026 346 0.40USD 750,000 Dominican Republic International Bond 6.85% 27/01/2045 622 0.71
ECUADOR (1.21%*) 1,523 1.74USD 1,000,000 Ecuador Government International Bond 10.5% 24/03/2020 806 0.92
USD 200,000 Ecuador Government International Bond 8.75% 02/06/2023 152 0.17USD 350,000 Ecuador Government International Bond 7.95% 20/06/2024 254 0.29USD 400,000 Ecuador Government International Bond 9.625% 02/06/2027 311 0.36
EL SALVADOR (0.00%*) 877 1.01USD 225,000 El Salvador Government International Bond 7.75% 24/01/2023 173 0.20USD 225,000 El Salvador Government International Bond 5.875% 30/01/2025 154 0.18USD 175,000 El Salvador Government International Bond 6.375% 18/01/2027 120 0.14USD 280,000 El Salvador Government International Bond 8.625% 28/02/2029 218 0.25USD 300,000 El Salvador Government International Bond 7.65% 15/06/2035 212 0.24
GUATEMALA (0.67%*) 840 0.96USD 500,000 Guatemala Government Bond 4.5% 03/05/2026 386 0.44USD 600,000 Guatemala Government Bond 4.375% 05/06/2027 454 0.52
JAMAICA (1.83%*) 1,152 1.32USD 500,000 Jamaica Government International Bond 7.625% 09/07/2025 445 0.51USD 500,000 Jamaica Government International Bond 6.75% 28/04/2028 434 0.50USD 300,000 Jamaica Government International Bond 7.875% 28/07/2045 273 0.31
MEXICO (6.32%*) 6,062 6.94USD 400,000 Mexico City Airport Trust 4.25% 31/10/2026 311 0.35
USD 1,000,000 Mexico Government International Bond 3.6% 30/01/2025 777 0.89USD 700,000 Mexico Government International Bond 4.6% 23/01/2046 525 0.60USD 150,000 Mexico Government International Bond 5.75% 12/10/2110 120 0.14USD 300,000 Petroleos Mexicanos 5.5% 21/01/2021 244 0.28USD 570,000 Petroleos Mexicanos 4.875% 24/01/2022 452 0.52USD 150,000 Petroleos Mexicanos 5.375% 13/03/2022 122 0.14USD 600,000 Petroleos Mexicanos 3.5% 30/01/2023 447 0.51USD 300,000 Petroleos Mexicanos 4.25% 15/01/2025 226 0.26USD 400,000 Petroleos Mexicanos 4.5% 23/01/2026 302 0.35USD 800,000 Petroleos Mexicanos 6.5% 13/03/2027 669 0.76USD 850,000 Petroleos Mexicanos 6.5% 02/06/2041 665 0.76USD 830,000 Petroleos Mexicanos 6.375% 23/01/2045 637 0.73USD 350,000 Petroleos Mexicanos 5.625% 23/01/2046 245 0.28USD 400,000 Petroleos Mexicanos 6.75% 21/09/2047 320 0.37
PANAMA (0.96%*) 1,433 1.64USD 1,400,000 Panama Government International Bond 4% 22/09/2024 1,129 1.29
USD 400,000 Panama Government International Bond 4.3% 29/04/2053 304 0.35
PARAGUAY (0.14%*) 553 0.63USD 700,000 Paraguay Government International Bond 4.7% 27/03/2027 553 0.63
PERU (0.95%*) 1,008 1.15USD 1,080,000 Peruvian Government International Bond 5.625% 18/11/2050 1,008 1.15
TRINIDAD AND TOBAGO (0.13%*) 302 0.34USD 400,000 Trinidad & Tobago Government International Bond 4.5% 04/08/2026 302 0.34
172
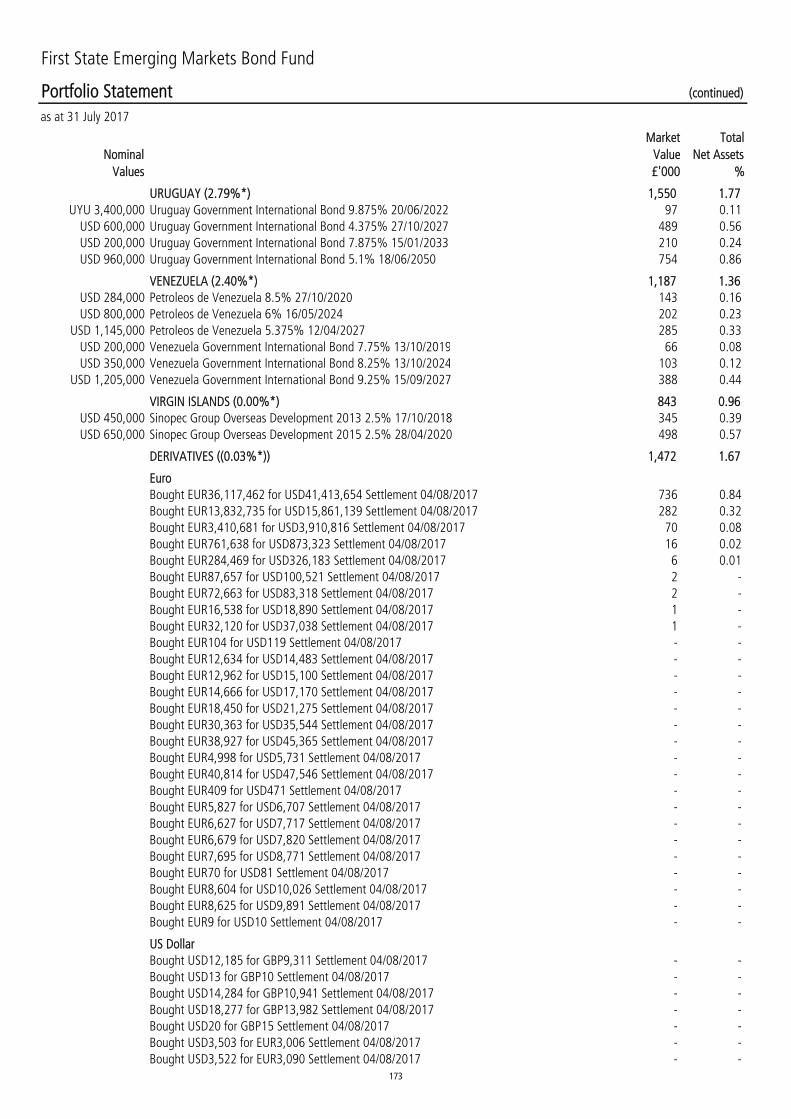
NominalValues
MarketValue£'000
TotalNet Assets
%
First State Emerging Markets Bond Fund
Portfolio Statement (continued)
as at 31 July 2017
URUGUAY (2.79%*) 1,550 1.77UYU 3,400,000 Uruguay Government International Bond 9.875% 20/06/2022 97 0.11
USD 600,000 Uruguay Government International Bond 4.375% 27/10/2027 489 0.56USD 200,000 Uruguay Government International Bond 7.875% 15/01/2033 210 0.24USD 960,000 Uruguay Government International Bond 5.1% 18/06/2050 754 0.86
VENEZUELA (2.40%*) 1,187 1.36USD 284,000 Petroleos de Venezuela 8.5% 27/10/2020 143 0.16USD 800,000 Petroleos de Venezuela 6% 16/05/2024 202 0.23
USD 1,145,000 Petroleos de Venezuela 5.375% 12/04/2027 285 0.33USD 200,000 Venezuela Government International Bond 7.75% 13/10/2019 66 0.08USD 350,000 Venezuela Government International Bond 8.25% 13/10/2024 103 0.12
USD 1,205,000 Venezuela Government International Bond 9.25% 15/09/2027 388 0.44
VIRGIN ISLANDS (0.00%*) 843 0.96USD 450,000 Sinopec Group Overseas Development 2013 2.5% 17/10/2018 345 0.39USD 650,000 Sinopec Group Overseas Development 2015 2.5% 28/04/2020 498 0.57
DERIVATIVES ((0.03%*)) 1,472 1.67
EuroBought EUR36,117,462 for USD41,413,654 Settlement 04/08/2017 736 0.84Bought EUR13,832,735 for USD15,861,139 Settlement 04/08/2017 282 0.32Bought EUR3,410,681 for USD3,910,816 Settlement 04/08/2017 70 0.08Bought EUR761,638 for USD873,323 Settlement 04/08/2017 16 0.02Bought EUR284,469 for USD326,183 Settlement 04/08/2017 6 0.01Bought EUR87,657 for USD100,521 Settlement 04/08/2017 2 -Bought EUR72,663 for USD83,318 Settlement 04/08/2017 2 -Bought EUR16,538 for USD18,890 Settlement 04/08/2017 1 -Bought EUR32,120 for USD37,038 Settlement 04/08/2017 1 -Bought EUR104 for USD119 Settlement 04/08/2017 - -Bought EUR12,634 for USD14,483 Settlement 04/08/2017 - -Bought EUR12,962 for USD15,100 Settlement 04/08/2017 - -Bought EUR14,666 for USD17,170 Settlement 04/08/2017 - -Bought EUR18,450 for USD21,275 Settlement 04/08/2017 - -Bought EUR30,363 for USD35,544 Settlement 04/08/2017 - -Bought EUR38,927 for USD45,365 Settlement 04/08/2017 - -Bought EUR4,998 for USD5,731 Settlement 04/08/2017 - -Bought EUR40,814 for USD47,546 Settlement 04/08/2017 - -Bought EUR409 for USD471 Settlement 04/08/2017 - -Bought EUR5,827 for USD6,707 Settlement 04/08/2017 - -Bought EUR6,627 for USD7,717 Settlement 04/08/2017 - -Bought EUR6,679 for USD7,820 Settlement 04/08/2017 - -Bought EUR7,695 for USD8,771 Settlement 04/08/2017 - -Bought EUR70 for USD81 Settlement 04/08/2017 - -Bought EUR8,604 for USD10,026 Settlement 04/08/2017 - -Bought EUR8,625 for USD9,891 Settlement 04/08/2017 - -Bought EUR9 for USD10 Settlement 04/08/2017 - -
US DollarBought USD12,185 for GBP9,311 Settlement 04/08/2017 - -Bought USD13 for GBP10 Settlement 04/08/2017 - -Bought USD14,284 for GBP10,941 Settlement 04/08/2017 - -Bought USD18,277 for GBP13,982 Settlement 04/08/2017 - -Bought USD20 for GBP15 Settlement 04/08/2017 - -Bought USD3,503 for EUR3,006 Settlement 04/08/2017 - -Bought USD3,522 for EUR3,090 Settlement 04/08/2017 - -
173

MarketValue£'000
TotalNet Assets
%
First State Emerging Markets Bond Fund
Portfolio Statement (continued)
as at 31 July 2017
Bought USD5,005 for GBP3,857 Settlement 04/08/2017 - -Bought USD6,149 for GBP4,677 Settlement 04/08/2017 - -Bought USD70 for GBP55 Settlement 04/08/2017 - -Bought USD705 for GBP536 Settlement 04/08/2017 - -Bought USD83 for GBP64 Settlement 04/08/2017 - -Bought USD27,450 for EUR23,736 Settlement 04/08/2017 (1) -Sold USD14,842,215 for GBP11,534,474 Settlement 04/08/2017 226 0.26Sold USD7,547,684 for GBP5,865,605 Settlement 04/08/2017 115 0.13Sold USD612,207 for GBP475,770 Settlement 04/08/2017 9 0.01Sold USD114,940 for GBP89,325 Settlement 04/08/2017 2 -Sold USD149,640 for GBP116,291 Settlement 04/08/2017 2 -Sold USD45,867 for GBP35,434 Settlement 04/08/2017 1 -Sold USD56,075 for GBP43,578 Settlement 04/08/2017 1 -Sold USD228,337 for GBP174,483 Settlement 04/08/2017 1 -Sold USD1 for GBP0 Settlement 04/08/2017 - -Sold USD1,172 for GBP911 Settlement 04/08/2017 - -Sold USD11,101 for GBP8,585 Settlement 04/08/2017 - -Sold USD12,029 for GBP9,228 Settlement 04/08/2017 - -Sold USD13 for GBP10 Settlement 04/08/2017 - -Sold USD13,588 for GBP10,446 Settlement 04/08/2017 - -Sold USD13,670 for GBP10,488 Settlement 04/08/2017 - -Sold USD14,344 for GBP11,081 Settlement 04/08/2017 - -Sold USD14,680 for GBP11,244 Settlement 04/08/2017 - -Sold USD15,914 for GBP12,369 Settlement 04/08/2017 - -Sold USD2,459 for GBP1,900 Settlement 04/08/2017 - -Sold USD3,603 for GBP2,740 Settlement 04/08/2017 - -Sold USD3,870 for GBP2,993 Settlement 04/08/2017 - -Sold USD32,086 for GBP24,667 Settlement 04/08/2017 - -Sold USD4,048 for GBP3,120 Settlement 04/08/2017 - -Sold USD4,759 for GBP3,698 Settlement 04/08/2017 - -Sold USD48,366 for GBP37,101 Settlement 04/08/2017 - -Sold USD5,261 for GBP4,029 Settlement 04/08/2017 - -Sold USD5,566 for GBP4,326 Settlement 04/08/2017 - -Sold USD50,367 for GBP38,579 Settlement 04/08/2017 - -Sold USD54 for GBP41 Settlement 04/08/2017 - -Sold USD58,661 for GBP45,022 Settlement 04/08/2017 - -Sold USD65 for GBP50 Settlement 04/08/2017 - -Sold USD7,442 for GBP5,700 Settlement 04/08/2017 - -Sold USD7,488 for GBP5,745 Settlement 04/08/2017 - -Sold USD74 for GBP57 Settlement 04/08/2017 - -Sold USD8,113 for GBP6,227 Settlement 04/08/2017 - -Sold USD9,706 for GBP7,480 Settlement 04/08/2017 - -
Portfolio of investments^ 84,382 96.44
Net other assets 3,117 3.56
Total net assets 87,499 100.00
* Comparative figures shown in brackets relate to 31 July 2016.
For the purposes of the portfolio holdings analysis, securities are shown based on their country of listing.Stocks shown as FRNs represent Floating-Rate Notes - debt instruments that pay a floating-rate of interest, usually based on an accepted marketbenchmark rate such as LIBOR.
All holdings represent securities quoted on a Listed Securities Market, unless otherwise stated.
^ Including derivative liabilities.
174
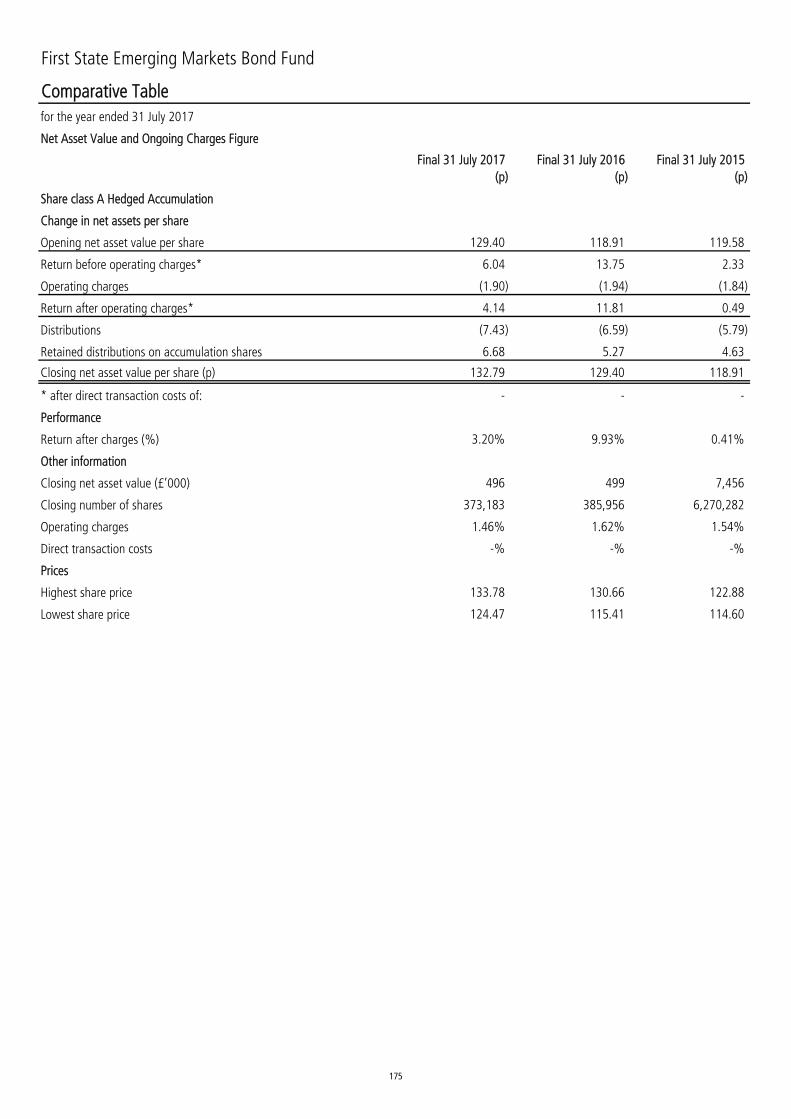
Share class A Hedged Accumulation
Change in net assets per share
Opening net asset value per share
Return before operating charges*
Operating charges
Return after operating charges*
Distributions
Retained distributions on accumulation shares
Closing net asset value per share (p)
* after direct transaction costs of:
Performance
Return after charges (%)
Other information
Closing net asset value (£’000)
Closing number of shares
Operating charges
Direct transaction costs
Prices
Highest share price
Lowest share price
First State Emerging Markets Bond Fund
Comparative Tablefor the year ended 31 July 2017
Net Asset Value and Ongoing Charges Figure
Final 31 July 2017(p)
Final 31 July 2016(p)
Final 31 July 2015(p)
129.40 118.91 119.58
4.14 11.81 0.49
(7.43) (6.59) (5.79)
6.04 13.75 2.33
(1.90) (1.94) (1.84)
132.79 129.40 118.91
- - -
6.68 5.27 4.63
496 499 7,456
373,183 385,956 6,270,282
3.20% 9.93% 0.41%
-% -% -%
133.78 130.66 122.88
1.46% 1.62% 1.54%
124.47 115.41 114.60
175

First State Emerging Markets Bond Fund
Comparative Table (continued)
for the year ended 31 July 2017
Net Asset Value and Ongoing Charges Figure
Share class A Hedged Income
Change in net assets per share
Opening net asset value per share
Return before operating charges*
Operating charges
Return after operating charges*
Distributions
Closing net asset value per share (p)
* after direct transaction costs of:
Performance
Return after charges (%)
Other information
Closing net asset value (£’000)
Closing number of shares
Operating charges
Direct transaction costs
Prices
Highest share price
Lowest share price
Final 31 July 2017(p)
Final 31 July 2016(p)
Final 31 July 2015(p)
107.48 103.19 107.93
3.92 8.80 (0.60)
(6.13) (4.51) (4.14)
5.54 10.36 0.98
(1.62) (1.56) (1.58)
105.27 107.48 103.19
- - -
131 130 7,158
124,660 121,172 6,936,157
3.65% 8.53% (0.56)%
-% -% -%
111.54 111.12 108.99
1.51% 1.50% 1.48%
103.89 98.92 103.41
176

First State Emerging Markets Bond Fund
Comparative Table (continued)
for the year ended 31 July 2017
Net Asset Value and Ongoing Charges Figure
Share class B Hedged Accumulation
Change in net assets per share
Opening net asset value per share
Return before operating charges*
Operating charges
Return after operating charges*
Distributions
Retained distributions on accumulation shares
Closing net asset value per share (p)
* after direct transaction costs of:
Performance
Return after charges (%)
Other information
Closing net asset value (£’000)
Closing number of shares
Operating charges
Direct transaction costs
Prices
Highest share price
Lowest share price
Final 31 July 2017(p)
Final 31 July 2016(p)
Final 31 July 2015(p)
112.54 102.75 102.80
3.85 10.93 0.94
(6.46) (5.71) (4.98)
4.97 12.03 1.95
(1.12) (1.10) (1.01)
115.74 112.54 102.75
- - -
5.81 4.57 3.98
12,110 7,504 11,898
10,463,080 6,667,484 11,580,050
3.42% 10.64% 0.91%
-% -% -%
116.52 113.63 106.02
0.99% 1.06% 0.98%
108.16 100.05 98.72
177
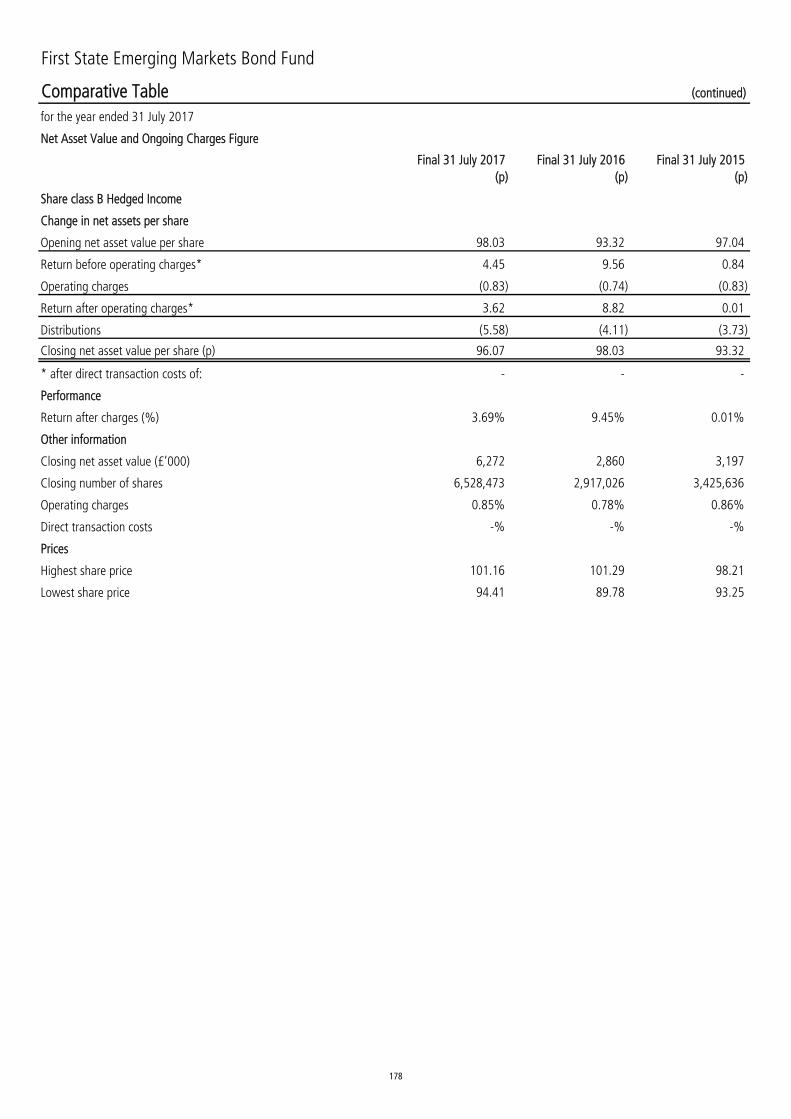
First State Emerging Markets Bond Fund
Comparative Table (continued)
for the year ended 31 July 2017
Net Asset Value and Ongoing Charges Figure
Share class B Hedged Income
Change in net assets per share
Opening net asset value per share
Return before operating charges*
Operating charges
Return after operating charges*
Distributions
Closing net asset value per share (p)
* after direct transaction costs of:
Performance
Return after charges (%)
Other information
Closing net asset value (£’000)
Closing number of shares
Operating charges
Direct transaction costs
Prices
Highest share price
Lowest share price
Final 31 July 2017(p)
Final 31 July 2016(p)
Final 31 July 2015(p)
98.03 93.32 97.04
3.62 8.82 0.01
(5.58) (4.11) (3.73)
4.45 9.56 0.84
(0.83) (0.74) (0.83)
96.07 98.03 93.32
- - -
6,272 2,860 3,197
6,528,473 2,917,026 3,425,636
3.69% 9.45% 0.01%
-% -% -%
101.16 101.29 98.21
0.85% 0.78% 0.86%
94.41 89.78 93.25
178
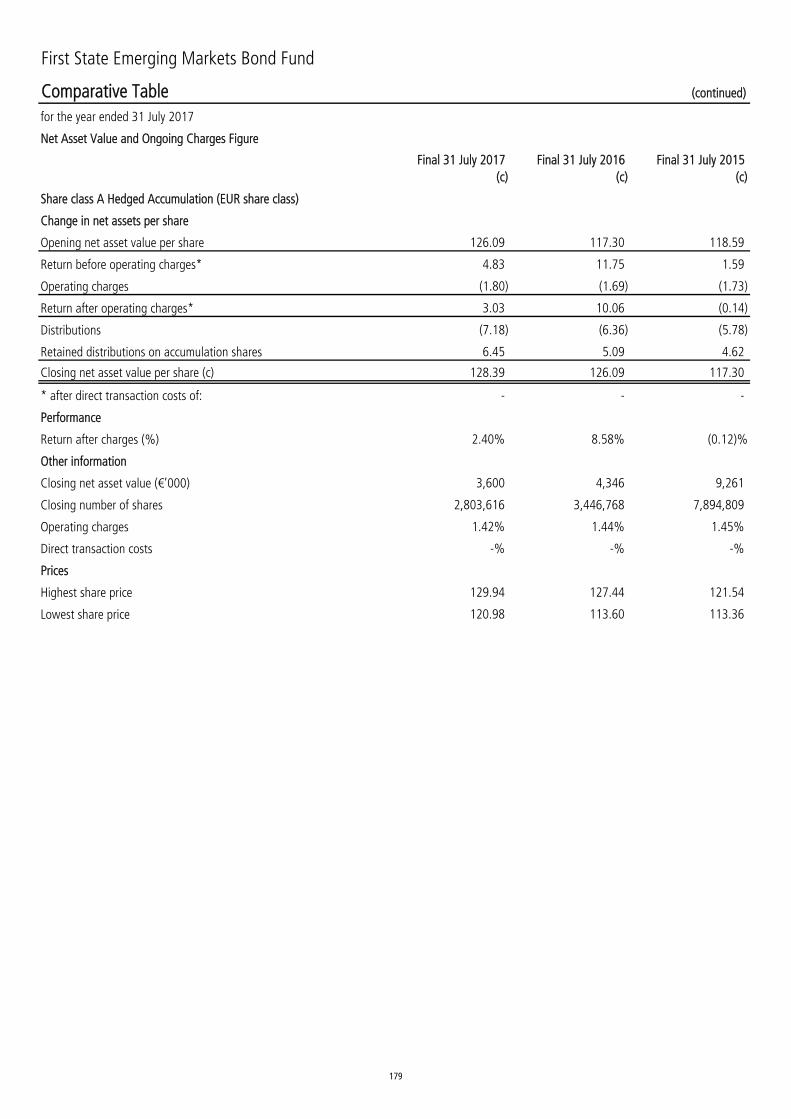
First State Emerging Markets Bond Fund
Comparative Table (continued)
for the year ended 31 July 2017
Net Asset Value and Ongoing Charges Figure
Share class A Hedged Accumulation (EUR share class)
Change in net assets per share
Opening net asset value per share
Return before operating charges*
Operating charges
Return after operating charges*
Distributions
Retained distributions on accumulation shares
Closing net asset value per share (c)
* after direct transaction costs of:
Performance
Return after charges (%)
Other information
Closing net asset value (€’000)
Closing number of shares
Operating charges
Direct transaction costs
Prices
Highest share price
Lowest share price
Final 31 July 2017(c)
Final 31 July 2016(c)
Final 31 July 2015(c)
126.09 117.30 118.59
3.03 10.06 (0.14)
(7.18) (6.36) (5.78)
4.83 11.75 1.59
(1.80) (1.69) (1.73)
128.39 126.09 117.30
- - -
6.45 5.09 4.62
3,600 4,346 9,261
2,803,616 3,446,768 7,894,809
2.40% 8.58% (0.12)%
-% -% -%
129.94 127.44 121.54
1.42% 1.44% 1.45%
120.98 113.60 113.36
179
First State Emerging Markets Bond Fund
Comparative Table (continued)
for the year ended 31 July 2017
Net Asset Value and Ongoing Charges Figure
Share class A Hedged Income (EUR share class)
Change in net assets per share
Opening net asset value per share
Return before operating charges*
Operating charges
Return after operating charges*
Distributions
Closing net asset value per share (c)
* after direct transaction costs of:
Performance
Return after charges (%)
Other information
Closing net asset value (€’000)
Closing number of shares
Operating charges
Direct transaction costs
Prices
Highest share price
Lowest share price
Final 31 July 2017(c)
Final 31 July 2016(c)
Final 31 July 2015(c)
101.04 101.88 107.00
2.37 6.45 (0.99)
(5.70) (7.29) (4.13)
3.79 7.85 0.52
(1.42) (1.40) (1.51)
97.71 101.04 101.88
- - -
5 1 7,378
5,309 1,380 7,241,956
2.35% 6.33% (0.93)%
-% -% -%
104.21 107.22 108.05
1.42% 1.43% 1.42%
97.04 97.39 102.33
180

First State Emerging Markets Bond Fund
Comparative Table (continued)
for the year ended 31 July 2017
Net Asset Value and Ongoing Charges Figure
Share class B Hedged Income (EUR share class)
Change in net assets per share
Opening net asset value per share
Return before operating charges*
Operating charges
Return after operating charges*
Distributions
Closing net asset value per share (c)
* after direct transaction costs of:
Performance
Return after charges (%)
Other information
Closing net asset value (€’000)
Closing number of shares
Operating charges
Direct transaction costs
Prices
Highest share price
Lowest share price
Final 31 July 2017(c)
Final 31 July 2016(c)
Final 31 July 2015(c)
104.49 100.71 105.11
3.05 8.12 (0.33)
(5.90) (4.34) (4.07)
3.86 8.92 0.45
(0.81) (0.80) (0.78)
101.64 104.49 100.71
- - -
36,936 22,409 17,459
36,341,459 21,447,097 17,335,793
2.92% 8.06% (0.31)%
-% -% -%
107.76 108.06 106.21
0.78% 0.78% 0.77%
100.49 96.59 100.79
181

First State Emerging Markets Bond Fund
Comparative Table (continued)
for the year ended 31 July 2017
Net Asset Value and Ongoing Charges Figure
Share class B Gross Hedged Accumulation (EUR share class)
Change in net assets per share
Opening net asset value per share
Return before operating charges*
Operating charges
Return after operating charges*
Distributions
Retained distributions on accumulation shares
Closing net asset value per share (c)
* after direct transaction costs of:
Performance
Return after charges (%)
Other information
Closing net asset value (€’000)
Closing number of shares
Operating charges
Direct transaction costs
Prices
Highest share price
Lowest share price
Final 31 July 2017(c)
Final 31 July 2016(c)
110.92 100.00
3.36 10.92
(6.35) (4.78)
4.23 11.59
(0.87) (0.67)
114.28 110.92
- -
6.35 4.78
14,387 8,616
12,590,050 7,768,227
3.03% 10.92%
-% -%
115.16 112.02
0.77% 0.77%
Share class B Gross Hedged Accumulation (EUR share class) was launched on 1 October 2015.
107.10 98.75
182

First State Emerging Markets Bond Fund
Comparative Table (continued)
for the year ended 31 July 2017
Net Asset Value and Ongoing Charges Figure
Share class B Accumulation (USD share class)
Change in net assets per share
Opening net asset value per share
Return before operating charges*
Operating charges
Return after operating charges*
Distributions
Retained distributions on accumulation shares
Closing net asset value per share (c)
* after direct transaction costs of:
Performance
Return after charges (%)
Other information
Closing net asset value ($’000)
Closing number of shares
Operating charges
Direct transaction costs
Prices
Highest share price
Lowest share price
Final 31 July 2017(c)
Final 31 July 2016(c)
Final 31 July 2015(c)
111.24 101.99 102.24
6.27 10.37 0.74
(9.10) (5.62) (4.94)
7.06 11.08 1.47
(0.79) (0.71) (0.73)
116.87 111.24 101.99
- - -
8.46 4.50 3.95
- 3,264 34,779
50 2,934,087 34,101,037
5.64% 10.17% 0.72%
-% -% -%
117.35 112.34 105.13
0.70% 0.71% 0.71%
92.77 99.34 98.01
183

First State Emerging Markets Bond Fund
Comparative Table (continued)
for the year ended 31 July 2017
Net Asset Value and Ongoing Charges Figure
Share class B Gross Accumulation (USD share class)
Change in net assets per share
Opening net asset value per share
Return before operating charges*
Operating charges
Return after operating charges*
Distributions
Retained distributions on accumulation shares
Closing net asset value per share (c)
* after direct transaction costs of:
Performance
Return after charges (%)
Other information
Closing net asset value ($’000)
Closing number of shares
Operating charges
Direct transaction costs
Prices
Highest share price
Lowest share price
Final 31 July 2017(c)
Final 31 July 2016(c)
Final 31 July 2015(c)
108.39 98.44 100.00
5.47 9.95 (1.56)
(6.26) (5.40) (1.00)
6.24 10.66 (1.40)
(0.77) (0.71) (0.16)
0.70% 0.69% 0.72%
113.86 108.39 98.44
- - -
6.26 5.40 1.00
25,443 100,154 29,548
105.18 96.25 98.14
22,346,517 92,402,104 30,016,931
5.05% 10.11% (1.56)%
-% -% -%
114.33 109.43 100.46
184
First State Emerging Markets Bond Fund
Comparative Table (continued)
for the year ended 31 July 2017
Net Asset Value and Ongoing Charges Figure
Share class Z Gross Hedged Accumulation
Change in net assets per share
Opening net asset value per share
Return before operating charges*
Operating charges
Return after operating charges*
Distributions
Retained distributions on accumulation shares
Closing net asset value per share (p)
* after direct transaction costs of:
Performance
Return after charges (%)
Other information
Closing net asset value (£’000)
Closing number of shares
Operating charges
Direct transaction costs
Prices
Highest share price
Lowest share price 109.52 98.71 95.75
0.16% 0.17% 0.15%
-% -% -%
119.06 113.94 103.33
- - 101
50 50 100,295
- - -
5.10% 12.10% 0.67%
7.04 2.38 3.66
118.60 112.85 100.67
(0.15) (0.18) (0.11)
5.75 12.18 0.67
(7.04) (2.38) (3.66)
112.85 100.67 100.00
5.90 12.36 0.78
Final 31 July 2017(p)
Final 31 July 2016(p)
Final 31 July 2015(p)
185
First State Emerging Markets Bond Fund
Comparative Table (continued)
for the year ended 31 July 2017
Net Asset Value and Ongoing Charges Figure
Share class Z Gross Accumulation (USD share class)
Change in net assets per share
Opening net asset value per share
Return before operating charges*
Operating charges
Return after operating charges*
Distributions
Retained distributions on accumulation shares
Closing net asset value per share (c)
* after direct transaction costs of:
Performance
Return after charges (%)
Other information
Closing net asset value ($’000)
Closing number of shares
Operating charges
Direct transaction costs
Prices
Highest share price
Lowest share price
120.17 113.00 103.13
109.20 98.49 95.67
0.10% 0.11% 0.09%
-% -% -%
- - 160
50 50 160,035
119.69 112.03 100.51
- - -
6.84% 11.46% 0.51%
(7.97) (18.39) (3.66)
7.97 18.39 3.66
7.81 11.63 0.58
(0.15) (0.11) (0.07)
7.66 11.52 0.51
112.03 100.51 100.00
Final 31 July 2017(c)
Final 31 July 2016(c)
Final 31 July 2015(c)
186

Notes £'000 £'000 £'000 £'000
Net capital gains 2 1,794 19,222
Revenue 3 5,221 5,496
4 (729) (791)
Interest payable and similar charges (4) (4)
4,488 4,701
5 - (1)
4,488 4,700
6,282 23,922
6 (5,217) (5,491)
1,065 18,431
£'000 £'000 £'000 £'000
119,298 95,253
36,580 69,013
(72,134) (67,685)
(35,554) 1,328
260 132
1,065 18,431
2,430 4,154
87,499 119,298
31 July 2017 31 July 2016
First State Emerging Markets Bond Fund
Statement of Total Returnfor the year ended 31 July 2017
Statement of Change in Net Assets Attributable to Shareholders
Income
Expenses
Net revenue before taxation
Taxation
Net revenue after taxation
Total return before distributions
Distribution
Change in net assets attributable to shareholders from investment activities
Amounts receivable on issue of shares
for the year ended 31 July 2017
31 July 2017 31 July 2016
Opening net assets attributable to shareholders
Less: Amounts payable on cancellation of shares
Dilution adjustment
Change in net assets attributable to shareholders from investment activities
Retained distribution on accumulation shares
Closing net assets attributable to shareholders
Notes to the Financial Statements are on pages 189 to 196.
187
First State Emerging Markets Bond Fund
31 July 2017 31 July 2016Notes £'000 £'000
Investments 84,383 113,612
Current assets
8 1,467 2,328
3,956 4,582
89,806 120,522
(1) (110)
Creditors
- (6)
(1,118) (730)
Other creditors 9 (1,188) (378)
(2,307) (1,224)
87,499 119,298
Investment liabilities
Balance Sheetas at 31 July 2017
Assets
Fixed assets
Debtors
Cash and bank balances
Total assets
Liabilities
Notes to the Financial Statements are on pages 189 to 196.
Bank overdrafts
Distribution payable
Total liabilities
Net assets attributable to shareholders
188
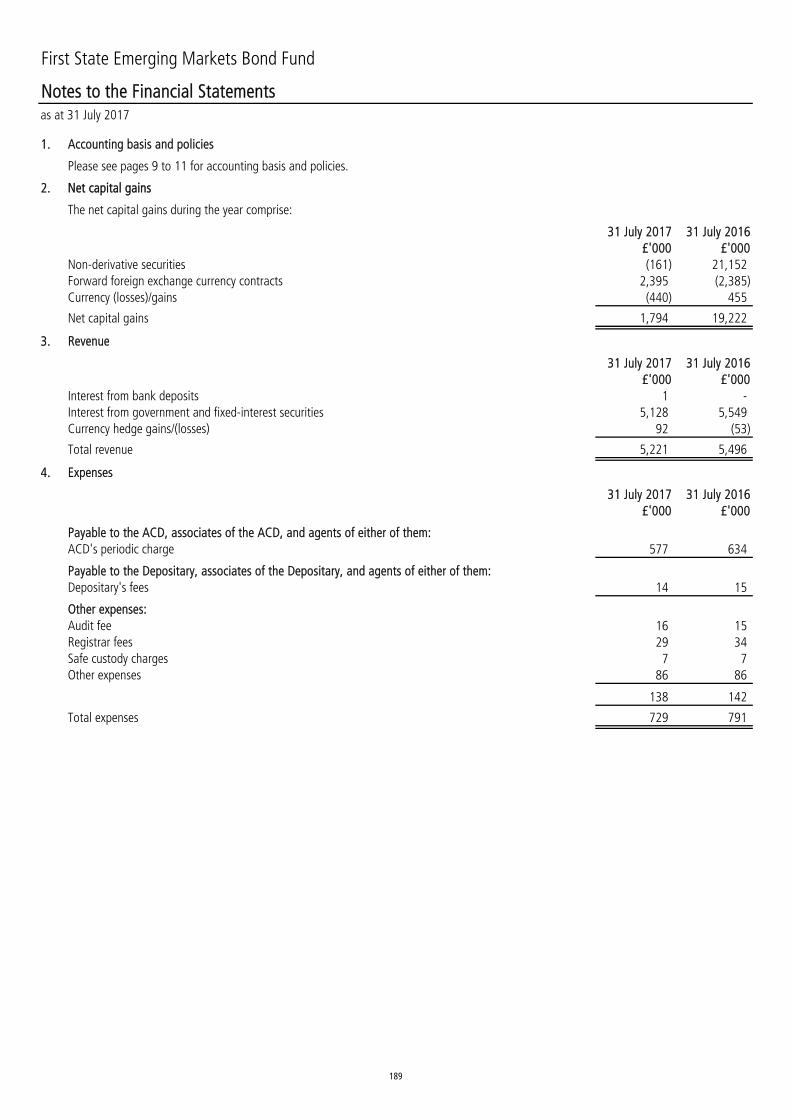
1.
2.
31 July 2017 31 July 2016£'000 £'000(161) 21,152
2,395 (2,385)(440) 455
1,794 19,222
3.
31 July 2017 31 July 2016£'000 £'000
1 -5,128 5,549
92 (53)
5,221 5,496
4.
31 July 2017 31 July 2016£'000 £'000
577 634
14 15
16 1529 34
7 786 86
138 142
729 791
Accounting basis and policies
Please see pages 9 to 11 for accounting basis and policies.
Net capital gains
The net capital gains during the year comprise:
Non-derivative securities
Notes to the Financial Statementsas at 31 July 2017
First State Emerging Markets Bond Fund
Net capital gains
Revenue
Forward foreign exchange currency contractsCurrency (losses)/gains
Interest from bank depositsInterest from government and fixed-interest securitiesCurrency hedge gains/(losses)
Total revenue
Payable to the Depositary, associates of the Depositary, and agents of either of them:Depositary's fees
Expenses
Payable to the ACD, associates of the ACD, and agents of either of them:ACD's periodic charge
Audit feeRegistrar feesSafe custody chargesOther expenses
Other expenses:
Total expenses
189
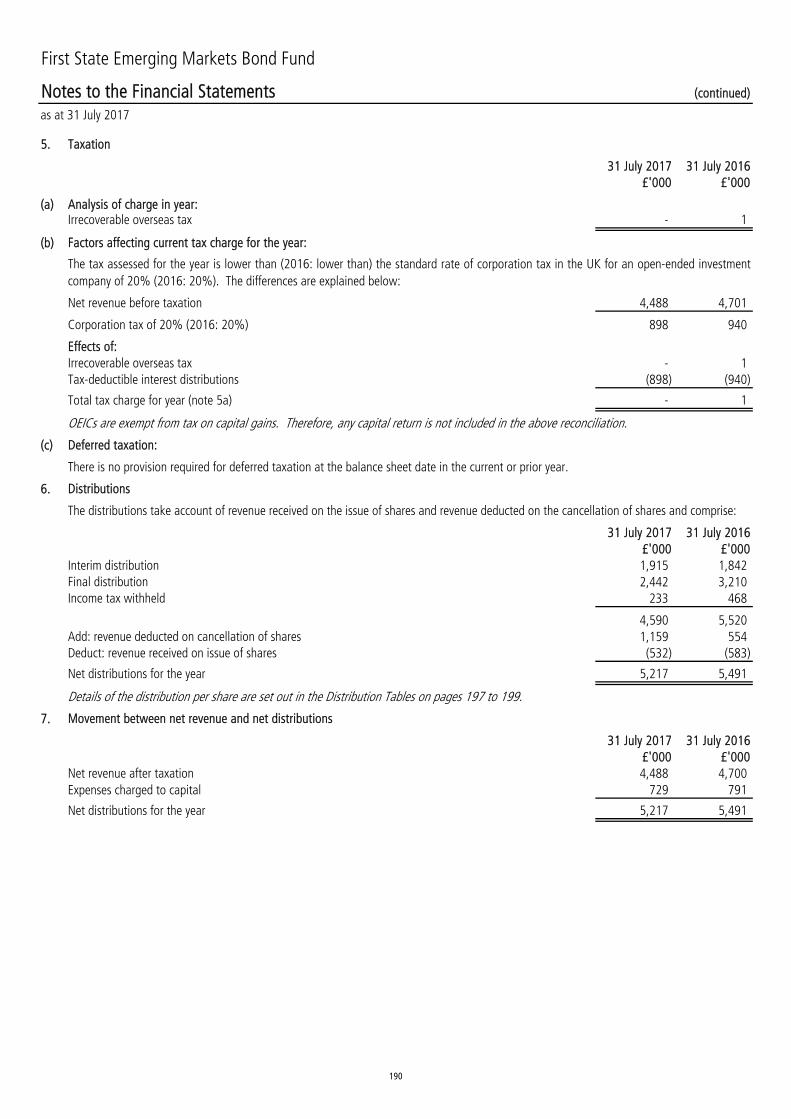
Notes to the Financial Statements (continued)
as at 31 July 2017
First State Emerging Markets Bond Fund
5.
31 July 2017 31 July 2016£'000 £'000
(a)- 1
(b)
4,488 4,701
898 940
- 1(898) (940)
- 1
(c)
6.
31 July 2017 31 July 2016£'000 £'0001,915 1,8422,442 3,210
233 468
4,590 5,5201,159 554(532) (583)
5,217 5,491
7.
31 July 2017 31 July 2016£'000 £'0004,488 4,700
Expenses charged to capital 729 791
5,217 5,491
Taxation
Irrecoverable overseas taxAnalysis of charge in year:
Net revenue before taxation
Corporation tax of 20% (2016: 20%)
Effects of:
Factors affecting current tax charge for the year:
The tax assessed for the year is lower than (2016: lower than) the standard rate of corporation tax in the UK for an open-ended investmentcompany of 20% (2016: 20%). The differences are explained below:
Irrecoverable overseas taxTax-deductible interest distributions
Deferred taxation:
There is no provision required for deferred taxation at the balance sheet date in the current or prior year.
Total tax charge for year (note 5a)
OEICs are exempt from tax on capital gains. Therefore, any capital return is not included in the above reconciliation.
Interim distribution
Distributions
The distributions take account of revenue received on the issue of shares and revenue deducted on the cancellation of shares and comprise:
Add: revenue deducted on cancellation of sharesDeduct: revenue received on issue of shares
Net distributions for the year
Final distributionIncome tax withheld
Details of the distribution per share are set out in the Distribution Tables on pages 197 to 199.
Movement between net revenue and net distributions
Net revenue after taxation
Net distributions for the year
190
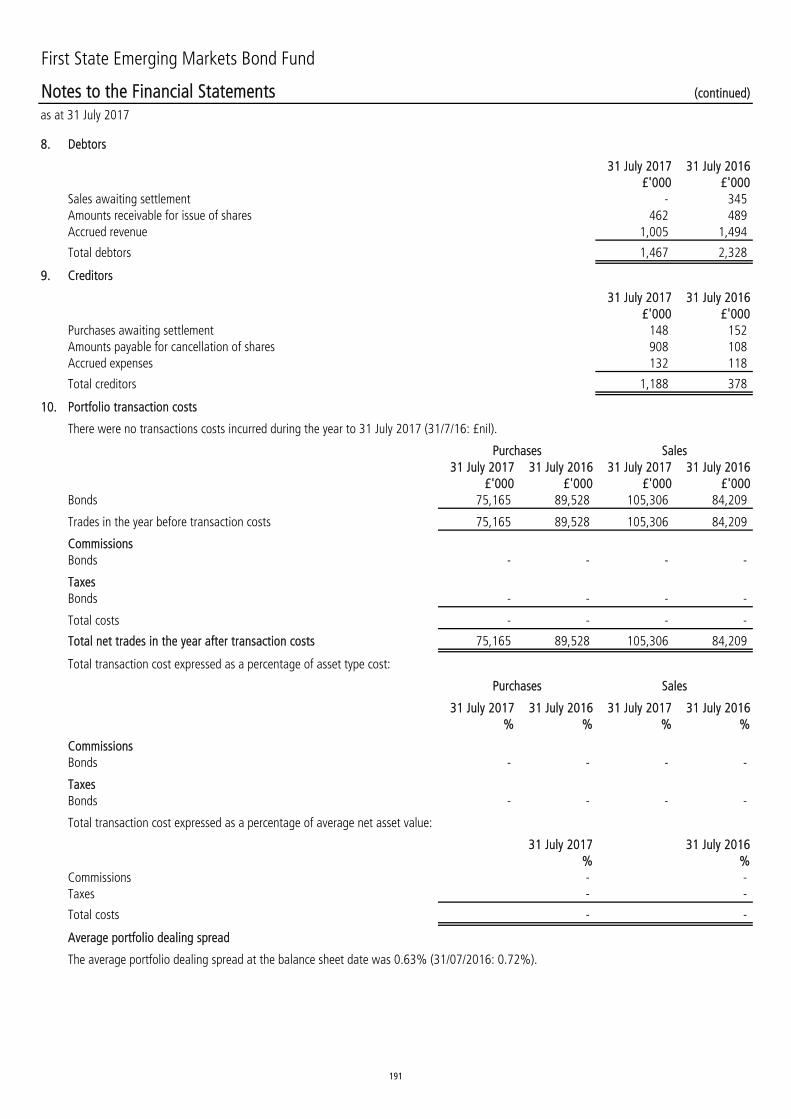
Notes to the Financial Statements (continued)
as at 31 July 2017
First State Emerging Markets Bond Fund
8.
31 July 2017 31 July 2016£'000 £'000
- 345462 489
1,005 1,494
1,467 2,328
9.
31 July 2017 31 July 2016£'000 £'000
148 152908 108132 118
1,188 378
10.
31 July 2017 31 July 2016 31 July 2017 31 July 2016£'000 £'000 £'000 £'000
75,165 89,528 105,306 84,209
75,165 89,528 105,306 84,209
- - - -
- - - -
- - - -
75,165 89,528 105,306 84,209
31 July 2017 31 July 2016 31 July 2017 31 July 2016% % % %
- - - -
- - - -
Amounts receivable for issue of sharesAccrued revenue
Debtors
Sales awaiting settlement
Total debtors
Creditors
Purchases awaiting settlementAmounts payable for cancellation of sharesAccrued expenses
There were no transactions costs incurred during the year to 31 July 2017 (31/7/16: £nil).
Purchases Sales
Bonds
Total creditors
Portfolio transaction costs
Trades in the year before transaction costs
CommissionsBonds
TaxesBonds
Total costs
Total net trades in the year after transaction costs
CommissionsBonds
Total transaction cost expressed as a percentage of asset type cost:
Purchases Sales
BondsTaxes
Commissions - -Taxes - -
Total transaction cost expressed as a percentage of average net asset value:
31 July 2017 31 July 2016% %
Total costs - -
Average portfolio dealing spread
The average portfolio dealing spread at the balance sheet date was 0.63% (31/07/2016: 0.72%).
191
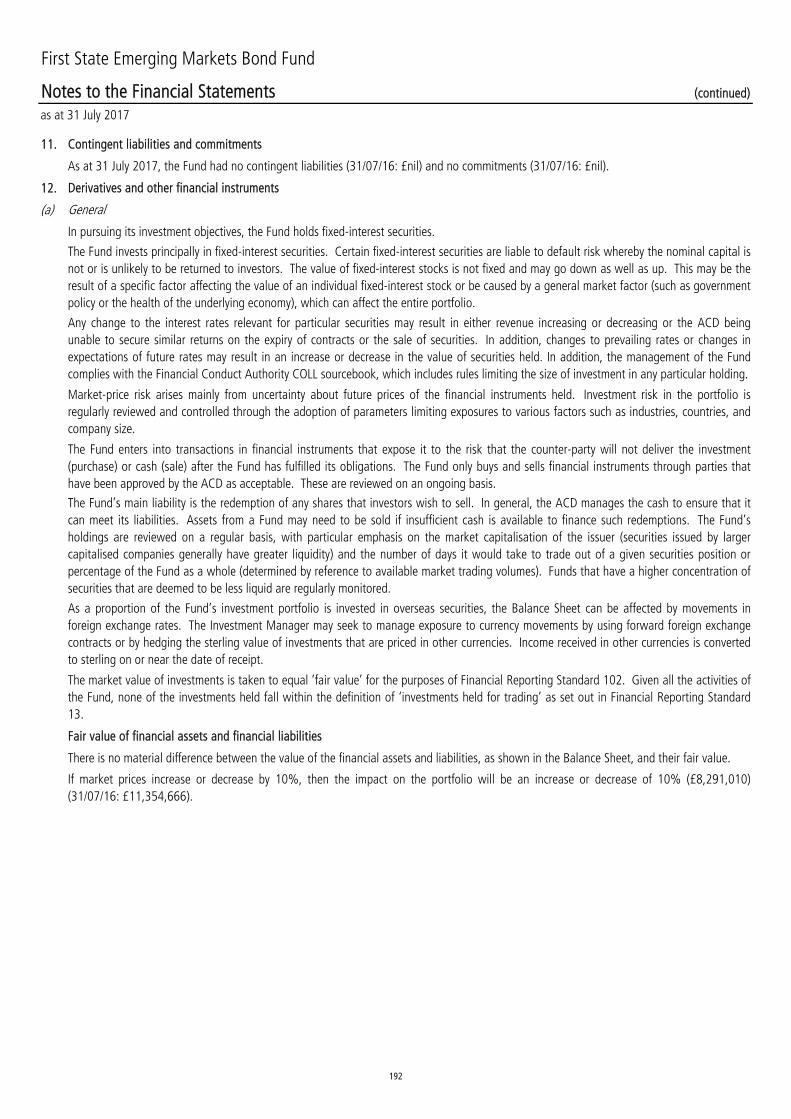
Notes to the Financial Statements (continued)
as at 31 July 2017
First State Emerging Markets Bond Fund
11.
12.
(a)
Contingent liabilities and commitments
As at 31 July 2017, the Fund had no contingent liabilities (31/07/16: £nil) and no commitments (31/07/16: £nil).
Market-price risk arises mainly from uncertainty about future prices of the financial instruments held. Investment risk in the portfolio isregularly reviewed and controlled through the adoption of parameters limiting exposures to various factors such as industries, countries, andcompany size.
The Fund enters into transactions in financial instruments that expose it to the risk that the counter-party will not deliver the investment(purchase) or cash (sale) after the Fund has fulfilled its obligations. The Fund only buys and sells financial instruments through parties thathave been approved by the ACD as acceptable. These are reviewed on an ongoing basis.
The Fund’s main liability is the redemption of any shares that investors wish to sell. In general, the ACD manages the cash to ensure that itcan meet its liabilities. Assets from a Fund may need to be sold if insufficient cash is available to finance such redemptions. The Fund’sholdings are reviewed on a regular basis, with particular emphasis on the market capitalisation of the issuer (securities issued by largercapitalised companies generally have greater liquidity) and the number of days it would take to trade out of a given securities position orpercentage of the Fund as a whole (determined by reference to available market trading volumes). Funds that have a higher concentration ofsecurities that are deemed to be less liquid are regularly monitored.
As a proportion of the Fund’s investment portfolio is invested in overseas securities, the Balance Sheet can be affected by movements inforeign exchange rates. The Investment Manager may seek to manage exposure to currency movements by using forward foreign exchangecontracts or by hedging the sterling value of investments that are priced in other currencies. Income received in other currencies is convertedto sterling on or near the date of receipt.
The market value of investments is taken to equal ‘fair value’ for the purposes of Financial Reporting Standard 102. Given all the activities ofthe Fund, none of the investments held fall within the definition of ‘investments held for trading’ as set out in Financial Reporting Standard13.
Fair value of financial assets and financial liabilities
Derivatives and other financial instruments
General
In pursuing its investment objectives, the Fund holds fixed-interest securities.
The Fund invests principally in fixed-interest securities. Certain fixed-interest securities are liable to default risk whereby the nominal capital isnot or is unlikely to be returned to investors. The value of fixed-interest stocks is not fixed and may go down as well as up. This may be theresult of a specific factor affecting the value of an individual fixed-interest stock or be caused by a general market factor (such as governmentpolicy or the health of the underlying economy), which can affect the entire portfolio.
Any change to the interest rates relevant for particular securities may result in either revenue increasing or decreasing or the ACD beingunable to secure similar returns on the expiry of contracts or the sale of securities. In addition, changes to prevailing rates or changes inexpectations of future rates may result in an increase or decrease in the value of securities held. In addition, the management of the Fundcomplies with the Financial Conduct Authority COLL sourcebook, which includes rules limiting the size of investment in any particular holding.
There is no material difference between the value of the financial assets and liabilities, as shown in the Balance Sheet, and their fair value.
If market prices increase or decrease by 10%, then the impact on the portfolio will be an increase or decrease of 10% (£8,291,010)(31/07/16: £11,354,666).
192
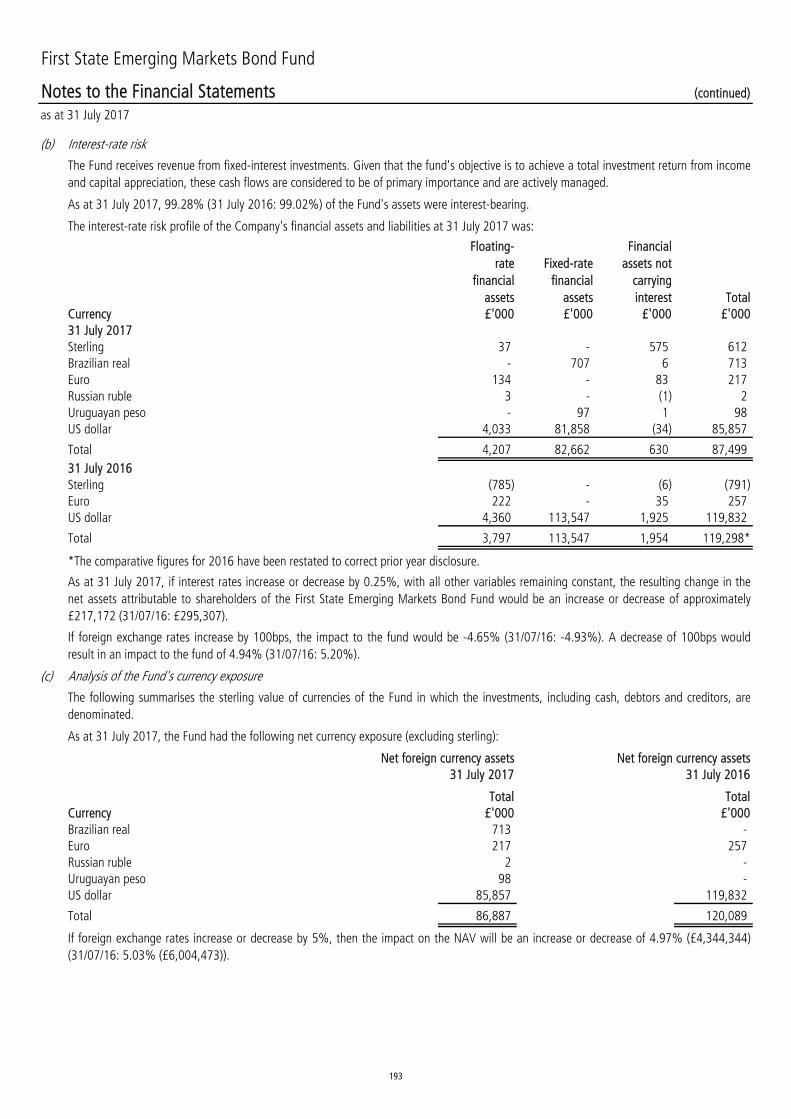
Notes to the Financial Statements (continued)
as at 31 July 2017
First State Emerging Markets Bond Fund
(b)
Floating- rate
financial assets
Fixed-rate financial
assets
Financial assets not
carrying interest Total
Currency £'000 £'000 £'000 £'00031 July 2017Sterling 37 - 575 612Brazilian real - 707 6 713Euro 134 - 83 217Russian ruble 3 - (1) 2Uruguayan peso - 97 1 98US dollar 4,033 81,858 (34) 85,857
Total 4,207 82,662 630 87,49931 July 2016Sterling (785) - (6) (791)Euro 222 - 35 257US dollar 4,360 113,547 1,925 119,832
Total 3,797 113,547 1,954 119,298*
(c)
Total TotalCurrency £'000 £'000Brazilian real 713 -Euro 217 257Russian ruble 2 -Uruguayan peso 98 -US dollar 85,857 119,832
Total 86,887 120,089
As at 31 July 2017, 99.28% (31 July 2016: 99.02%) of the Fund's assets were interest-bearing.
The interest-rate risk profile of the Company's financial assets and liabilities at 31 July 2017 was:
*The comparative figures for 2016 have been restated to correct prior year disclosure.
As at 31 July 2017, if interest rates increase or decrease by 0.25%, with all other variables remaining constant, the resulting change in thenet assets attributable to shareholders of the First State Emerging Markets Bond Fund would be an increase or decrease of approximately£217,172 (31/07/16: £295,307).
Analysis of the Fund's currency exposure
Interest-rate risk
The Fund receives revenue from fixed-interest investments. Given that the fund's objective is to achieve a total investment return from incomeand capital appreciation, these cash flows are considered to be of primary importance and are actively managed.
If foreign exchange rates increase by 100bps, the impact to the fund would be -4.65% (31/07/16: -4.93%). A decrease of 100bps wouldresult in an impact to the fund of 4.94% (31/07/16: 5.20%).
The following summarises the sterling value of currencies of the Fund in which the investments, including cash, debtors and creditors, aredenominated.
As at 31 July 2017, the Fund had the following net currency exposure (excluding sterling):
Net foreign currency assets Net foreign currency assets31 July 2017 31 July 2016
If foreign exchange rates increase or decrease by 5%, then the impact on the NAV will be an increase or decrease of 4.97% (£4,344,344)(31/07/16: 5.03% (£6,004,473)).
193
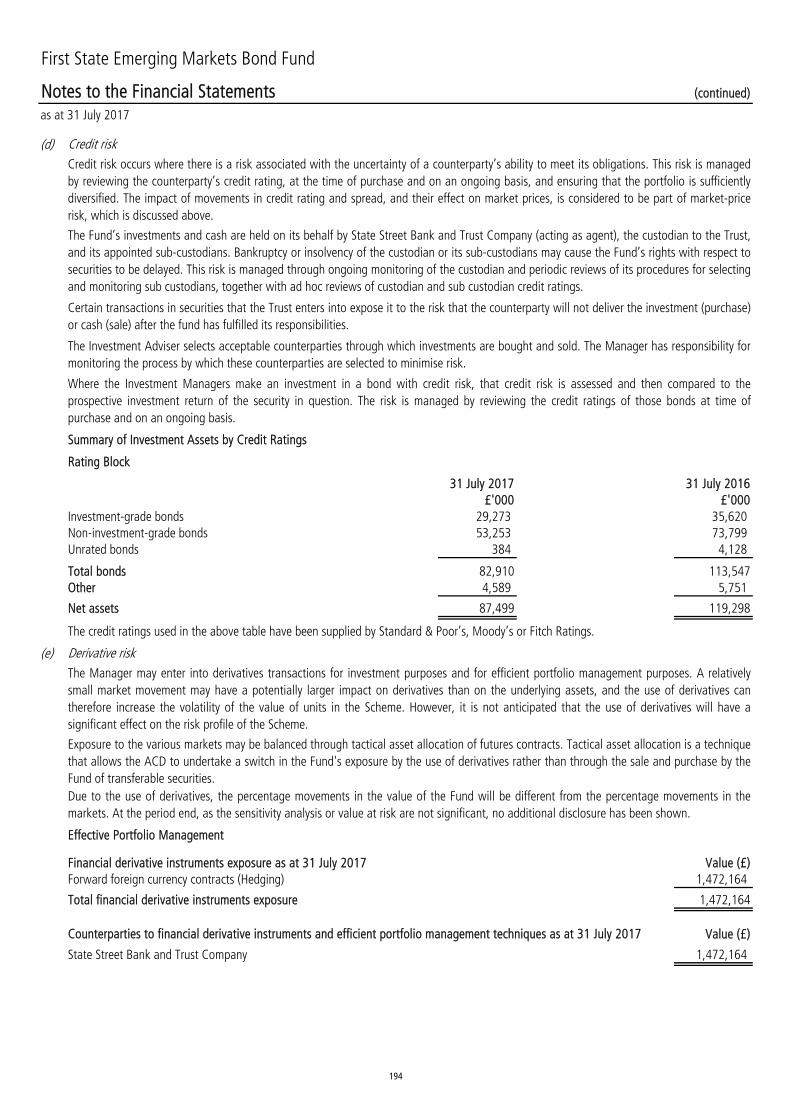
Notes to the Financial Statements (continued)
as at 31 July 2017
First State Emerging Markets Bond Fund
(d)
Rating Block
31 July 2017 31 July 2016£'000 £'000
Investment-grade bonds 29,273 35,620Non-investment-grade bonds 53,253 73,799Unrated bonds 384 4,128
Total bonds 82,910 113,547Other 4,589 5,751
Net assets 87,499 119,298
(e)
Financial derivative instruments exposure as at 31 July 2017 Value (£)Forward foreign currency contracts (Hedging) 1,472,164
Total financial derivative instruments exposure 1,472,164
Value (£)
State Street Bank and Trust Company 1,472,164
Derivative riskThe Manager may enter into derivatives transactions for investment purposes and for efficient portfolio management purposes. A relativelysmall market movement may have a potentially larger impact on derivatives than on the underlying assets, and the use of derivatives cantherefore increase the volatility of the value of units in the Scheme. However, it is not anticipated that the use of derivatives will have asignificant effect on the risk profile of the Scheme.
Exposure to the various markets may be balanced through tactical asset allocation of futures contracts. Tactical asset allocation is a techniquethat allows the ACD to undertake a switch in the Fund's exposure by the use of derivatives rather than through the sale and purchase by theFund of transferable securities.Due to the use of derivatives, the percentage movements in the value of the Fund will be different from the percentage movements in themarkets. At the period end, as the sensitivity analysis or value at risk are not significant, no additional disclosure has been shown.
Credit riskCredit risk occurs where there is a risk associated with the uncertainty of a counterparty’s ability to meet its obligations. This risk is managedby reviewing the counterparty’s credit rating, at the time of purchase and on an ongoing basis, and ensuring that the portfolio is sufficientlydiversified. The impact of movements in credit rating and spread, and their effect on market prices, is considered to be part of market-pricerisk, which is discussed above.
Where the Investment Managers make an investment in a bond with credit risk, that credit risk is assessed and then compared to theprospective investment return of the security in question. The risk is managed by reviewing the credit ratings of those bonds at time ofpurchase and on an ongoing basis.
Summary of Investment Assets by Credit Ratings
The credit ratings used in the above table have been supplied by Standard & Poor’s, Moody’s or Fitch Ratings.
The Fund’s investments and cash are held on its behalf by State Street Bank and Trust Company (acting as agent), the custodian to the Trust,and its appointed sub-custodians. Bankruptcy or insolvency of the custodian or its sub-custodians may cause the Fund’s rights with respect tosecurities to be delayed. This risk is managed through ongoing monitoring of the custodian and periodic reviews of its procedures for selectingand monitoring sub custodians, together with ad hoc reviews of custodian and sub custodian credit ratings.
Certain transactions in securities that the Trust enters into expose it to the risk that the counterparty will not deliver the investment (purchase)or cash (sale) after the fund has fulfilled its responsibilities.
The Investment Adviser selects acceptable counterparties through which investments are bought and sold. The Manager has responsibility formonitoring the process by which these counterparties are selected to minimise risk.
Effective Portfolio Management
Counterparties to financial derivative instruments and efficient portfolio management techniques as at 31 July 2017
194
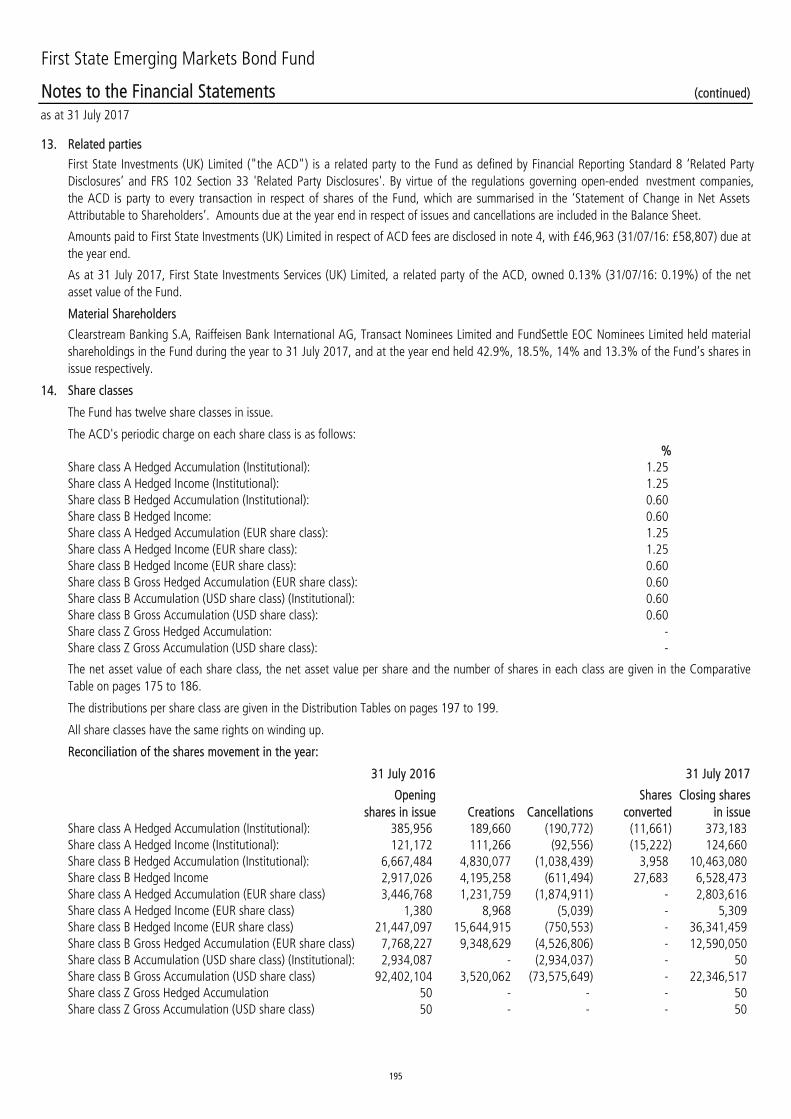
Notes to the Financial Statements (continued)
as at 31 July 2017
First State Emerging Markets Bond Fund
13.
14.
%1.251.250.600.601.251.250.600.600.600.60
--
31 July 2016 31 July 2017
Opening shares in issue Creations Cancellations
Shares converted
Closing shares in issue
385,956 189,660 (190,772) (11,661) 373,183121,172 111,266 (92,556) (15,222) 124,660
6,667,484 4,830,077 (1,038,439) 3,958 10,463,0802,917,026 4,195,258 (611,494) 27,683 6,528,4733,446,768 1,231,759 (1,874,911) - 2,803,616
1,380 8,968 (5,039) - 5,30921,447,097 15,644,915 (750,553) - 36,341,459
7,768,227 9,348,629 (4,526,806) - 12,590,0502,934,087 - (2,934,037) - 50
92,402,104 3,520,062 (73,575,649) - 22,346,51750 - - - 5050 - - - 50
Related parties
First State Investments (UK) Limited ("the ACD") is a related party to the Fund as defined by Financial Reporting Standard 8 ‘Related Party Disclosures’ and FRS 102 Section 33 'Related Party Disclosures'. By virtue of the regulations governing open-ended investment companies, the ACD is party to every transaction in respect of shares of the Fund, which are summarised in the ‘Statement of Change in Net Assets Attributable to Shareholders’. Amounts due at the year end in respect of issues and cancellations are included in the Balance Sheet.
As at 31 July 2017, First State Investments Services (UK) Limited, a related party of the ACD, owned 0.13% (31/07/16: 0.19%) of the netasset value of the Fund.
Material Shareholders
Clearstream Banking S.A, Raiffeisen Bank International AG, Transact Nominees Limited and FundSettle EOC Nominees Limited held materialshareholdings in the Fund during the year to 31 July 2017, and at the year end held 42.9%, 18.5%, 14% and 13.3% of the Fund’s shares inissue respectively.
Share classes
The Fund has twelve share classes in issue.
Amounts paid to First State Investments (UK) Limited in respect of ACD fees are disclosed in note 4, with £46,963 (31/07/16: £58,807) due at the year end.
Share class A Hedged Accumulation (EUR share class):Share class A Hedged Income (EUR share class):Share class B Hedged Income (EUR share class):Share class B Gross Hedged Accumulation (EUR share class):Share class B Accumulation (USD share class) (Institutional):Share class B Gross Accumulation (USD share class):
The ACD's periodic charge on each share class is as follows:
Share class A Hedged Accumulation (Institutional):Share class A Hedged Income (Institutional):Share class B Hedged Accumulation (Institutional):Share class B Hedged Income:
Share class Z Gross Hedged Accumulation:Share class Z Gross Accumulation (USD share class):
All share classes have the same rights on winding up.
Reconciliation of the shares movement in the year:
Share class A Hedged Accumulation (Institutional):Share class A Hedged Income (Institutional):Share class B Hedged Accumulation (Institutional):
The net asset value of each share class, the net asset value per share and the number of shares in each class are given in the ComparativeTable on pages 175 to 186.
The distributions per share class are given in the Distribution Tables on pages 197 to 199.
Share class B Gross Accumulation (USD share class)Share class Z Gross Hedged AccumulationShare class Z Gross Accumulation (USD share class)
Share class B Hedged IncomeShare class A Hedged Accumulation (EUR share class)Share class A Hedged Income (EUR share class)Share class B Hedged Income (EUR share class)Share class B Gross Hedged Accumulation (EUR share class)Share class B Accumulation (USD share class) (Institutional):
195
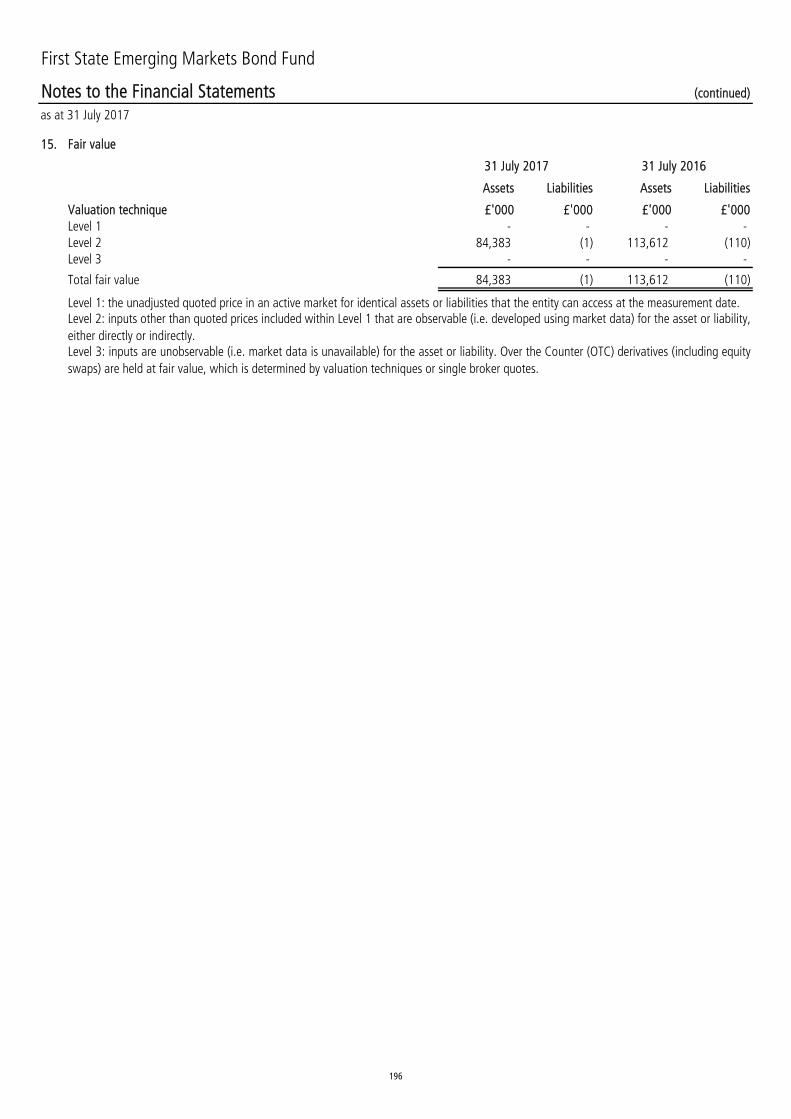
Notes to the Financial Statements (continued)
as at 31 July 2017
First State Emerging Markets Bond Fund
15.
Assets Liabilities Assets Liabilities
£'000 £'000 £'000 £'000- - - -
84,383 (1) 113,612 (110)- - - -
84,383 (1) 113,612 (110)
Fair value
Valuation technique
31 July 2017 31 July 2016
Level 3: inputs are unobservable (i.e. market data is unavailable) for the asset or liability. Over the Counter (OTC) derivatives (including equityswaps) are held at fair value, which is determined by valuation techniques or single broker quotes.
Level 1Level 2Level 3
Total fair value
Level 1: the unadjusted quoted price in an active market for identical assets or liabilities that the entity can access at the measurement date. Level 2: inputs other than quoted prices included within Level 1 that are observable (i.e. developed using market data) for the asset or liability,either directly or indirectly.
196
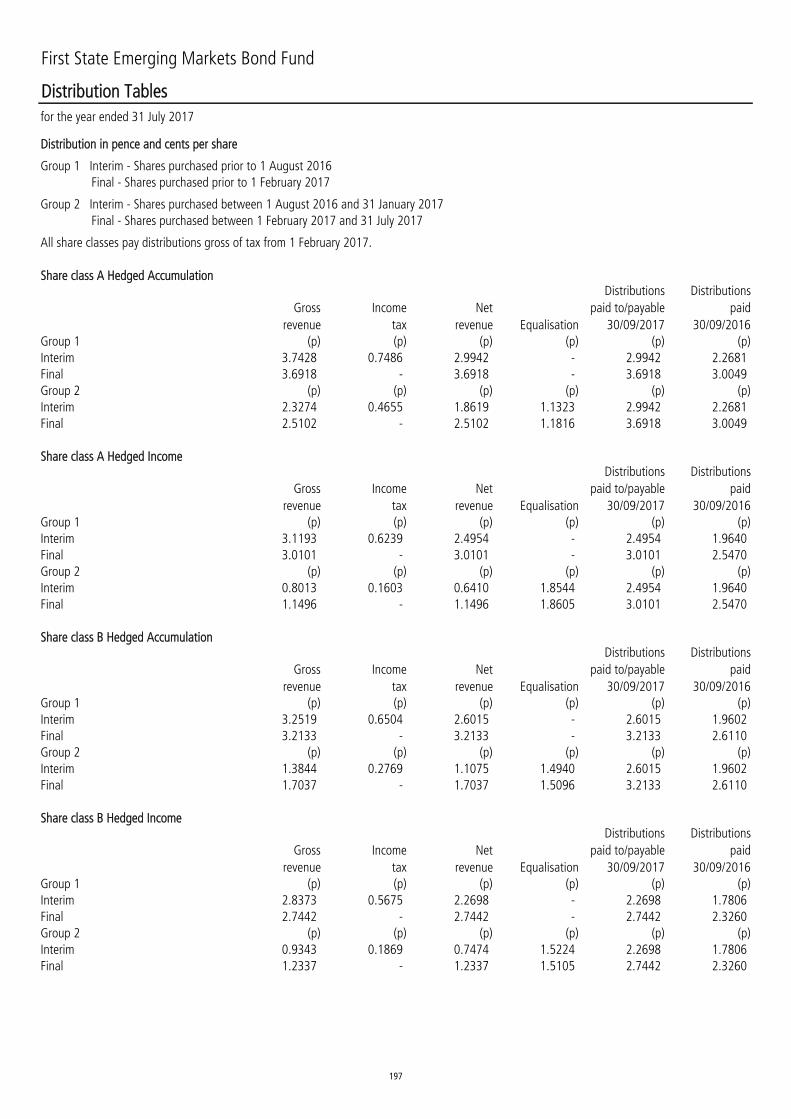
Share class A Hedged Accumulation
Grossrevenue
Incometax
Netrevenue Equalisation
Distributions paid to/payable
30/09/2017
Distributions paid
30/09/2016Group 1 (p) (p) (p) (p) (p) (p)Interim 3.7428 0.7486 2.9942 - 2.9942 2.2681Final 3.6918 - 3.6918 - 3.6918 3.0049Group 2 (p) (p) (p) (p) (p) (p)Interim 2.3274 0.4655 1.8619 1.1323 2.9942 2.2681Final 2.5102 - 2.5102 1.1816 3.6918 3.0049
Share class A Hedged Income
Grossrevenue
Incometax
Netrevenue Equalisation
Distributions paid to/payable
30/09/2017
Distributions paid
30/09/2016Group 1 (p) (p) (p) (p) (p) (p)Interim 3.1193 0.6239 2.4954 - 2.4954 1.9640Final 3.0101 - 3.0101 - 3.0101 2.5470Group 2 (p) (p) (p) (p) (p) (p)Interim 0.8013 0.1603 0.6410 1.8544 2.4954 1.9640Final 1.1496 - 1.1496 1.8605 3.0101 2.5470
Share class B Hedged Accumulation
Grossrevenue
Incometax
Netrevenue Equalisation
Distributions paid to/payable
30/09/2017
Distributions paid
30/09/2016Group 1 (p) (p) (p) (p) (p) (p)Interim 3.2519 0.6504 2.6015 - 2.6015 1.9602Final 3.2133 - 3.2133 - 3.2133 2.6110Group 2 (p) (p) (p) (p) (p) (p)Interim 1.3844 0.2769 1.1075 1.4940 2.6015 1.9602Final 1.7037 - 1.7037 1.5096 3.2133 2.6110
Share class B Hedged Income
Grossrevenue
Incometax
Netrevenue Equalisation
Distributions paid to/payable
30/09/2017
Distributions paid
30/09/2016Group 1 (p) (p) (p) (p) (p) (p)Interim 2.8373 0.5675 2.2698 - 2.2698 1.7806Final 2.7442 - 2.7442 - 2.7442 2.3260Group 2 (p) (p) (p) (p) (p) (p)Interim 0.9343 0.1869 0.7474 1.5224 2.2698 1.7806Final 1.2337 - 1.2337 1.5105 2.7442 2.3260
First State Emerging Markets Bond Fund
Distribution Tablesfor the year ended 31 July 2017
Group 1 Interim - Shares purchased prior to 1 August 2016
Distribution in pence and cents per share
Group 2 Interim - Shares purchased between 1 August 2016 and 31 January 2017
Final - Shares purchased prior to 1 February 2017
Final - Shares purchased between 1 February 2017 and 31 July 2017
All share classes pay distributions gross of tax from 1 February 2017.
197
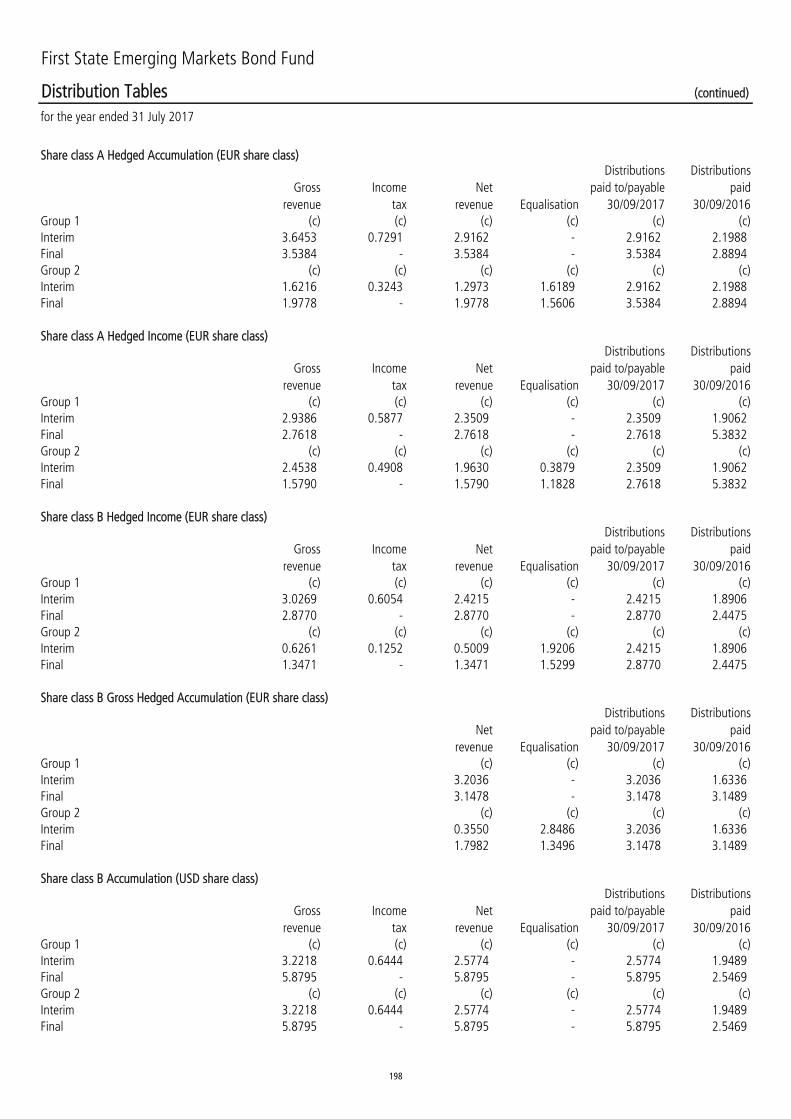
First State Emerging Markets Bond Fund
Distribution Tables (continued)
for the year ended 31 July 2017
Share class A Hedged Accumulation (EUR share class)
Grossrevenue
Incometax
Netrevenue Equalisation
Distributions paid to/payable
30/09/2017
Distributions paid
30/09/2016Group 1 (c) (c) (c) (c) (c) (c)Interim 3.6453 0.7291 2.9162 - 2.9162 2.1988Final 3.5384 - 3.5384 - 3.5384 2.8894Group 2 (c) (c) (c) (c) (c) (c)Interim 1.6216 0.3243 1.2973 1.6189 2.9162 2.1988Final 1.9778 - 1.9778 1.5606 3.5384 2.8894
Share class A Hedged Income (EUR share class)
Grossrevenue
Incometax
Netrevenue Equalisation
Distributions paid to/payable
30/09/2017
Distributions paid
30/09/2016Group 1 (c) (c) (c) (c) (c) (c)Interim 2.9386 0.5877 2.3509 - 2.3509 1.9062Final 2.7618 - 2.7618 - 2.7618 5.3832Group 2 (c) (c) (c) (c) (c) (c)Interim 2.4538 0.4908 1.9630 0.3879 2.3509 1.9062Final 1.5790 - 1.5790 1.1828 2.7618 5.3832
Share class B Hedged Income (EUR share class)
Grossrevenue
Incometax
Netrevenue Equalisation
Distributions paid to/payable
30/09/2017
Distributions paid
30/09/2016Group 1 (c) (c) (c) (c) (c) (c)Interim 3.0269 0.6054 2.4215 - 2.4215 1.8906Final 2.8770 - 2.8770 - 2.8770 2.4475Group 2 (c) (c) (c) (c) (c) (c)Interim 0.6261 0.1252 0.5009 1.9206 2.4215 1.8906Final 1.3471 - 1.3471 1.5299 2.8770 2.4475
Share class B Gross Hedged Accumulation (EUR share class)
Netrevenue Equalisation
Distributions paid to/payable
30/09/2017
Distributions paid
30/09/2016Group 1 (c) (c) (c) (c)Interim 3.2036 - 3.2036 1.6336Final 3.1478 - 3.1478 3.1489Group 2 (c) (c) (c) (c)Interim 0.3550 2.8486 3.2036 1.6336Final 1.7982 1.3496 3.1478 3.1489
Share class B Accumulation (USD share class)
Grossrevenue
Incometax
Netrevenue Equalisation
Distributions paid to/payable
30/09/2017
Distributions paid
30/09/2016Group 1 (c) (c) (c) (c) (c) (c)Interim 3.2218 0.6444 2.5774 - 2.5774 1.9489Final 5.8795 - 5.8795 - 5.8795 2.5469Group 2 (c) (c) (c) (c) (c) (c)Interim 3.2218 0.6444 2.5774 - 2.5774 1.9489Final 5.8795 - 5.8795 - 5.8795 2.5469
198
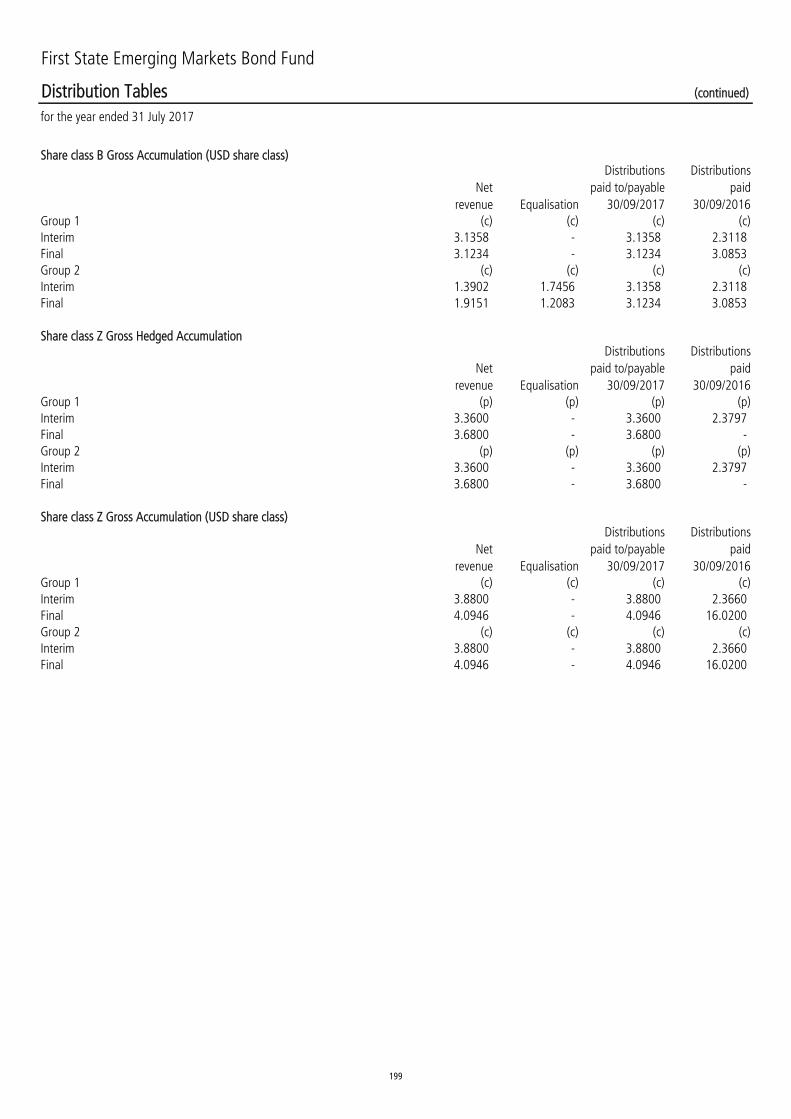
First State Emerging Markets Bond Fund
Distribution Tables (continued)
for the year ended 31 July 2017
Share class B Gross Accumulation (USD share class)
Netrevenue Equalisation
Distributions paid to/payable
30/09/2017
Distributions paid
30/09/2016Group 1 (c) (c) (c) (c)Interim 3.1358 - 3.1358 2.3118Final 3.1234 - 3.1234 3.0853Group 2 (c) (c) (c) (c)Interim 1.3902 1.7456 3.1358 2.3118Final 1.9151 1.2083 3.1234 3.0853
Share class Z Gross Hedged Accumulation
Netrevenue Equalisation
Distributions paid to/payable
30/09/2017
Distributions paid
30/09/2016Group 1 (p) (p) (p) (p)Interim 3.3600 - 3.3600 2.3797Final 3.6800 - 3.6800 -Group 2 (p) (p) (p) (p)Interim 3.3600 - 3.3600 2.3797Final 3.6800 - 3.6800 -
Share class Z Gross Accumulation (USD share class)
Netrevenue Equalisation
Distributions paid to/payable
30/09/2017
Distributions paid
30/09/2016Group 1 (c) (c) (c) (c)Interim 3.8800 - 3.8800 2.3660Final 4.0946 - 4.0946 16.0200Group 2 (c) (c) (c) (c)Interim 3.8800 - 3.8800 2.3660Final 4.0946 - 4.0946 16.0200
199
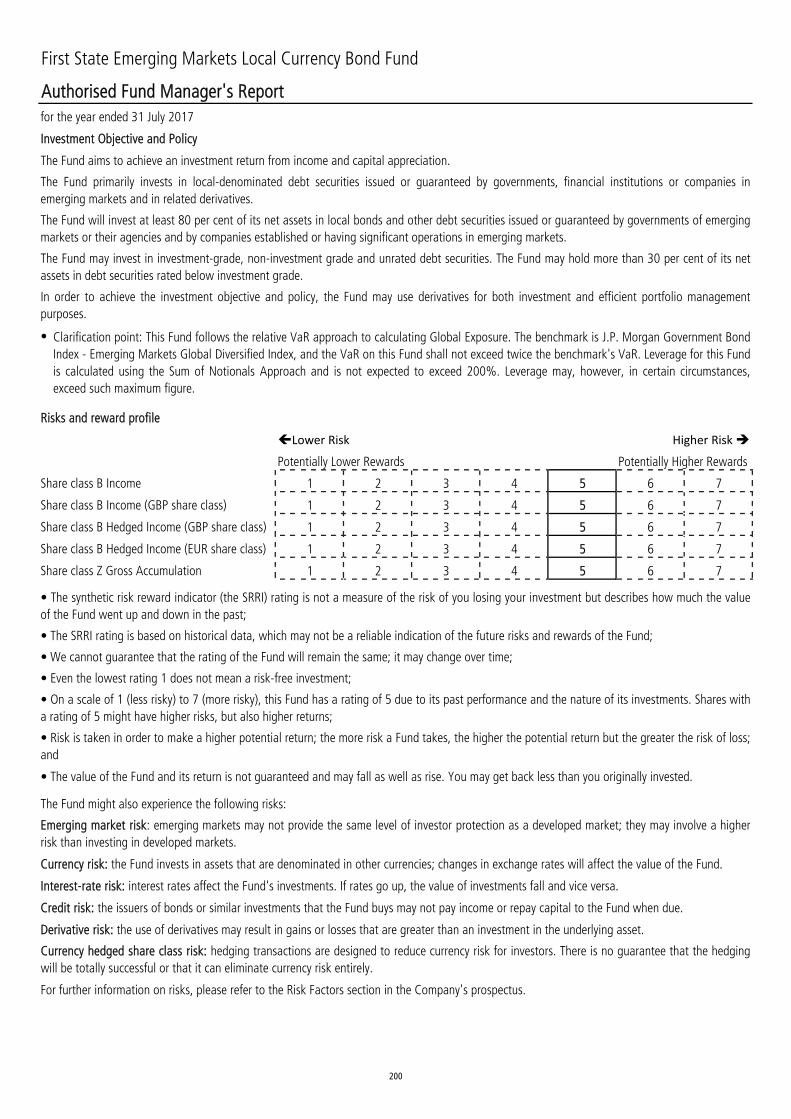
•
Risks and reward profile
Lower Risk Higher Risk
Potentially Lower Rewards Potentially Higher Rewards
1 2 3 4 5 6 7
1 2 3 4 5 6 7
1 2 3 4 5 6 7
1 2 3 4 5 6 7
1 2 3 4 5 6 7
First State Emerging Markets Local Currency Bond Fund
Authorised Fund Manager's Reportfor the year ended 31 July 2017
Investment Objective and Policy
The Fund may invest in investment-grade, non-investment grade and unrated debt securities. The Fund may hold more than 30 per cent of its netassets in debt securities rated below investment grade.
In order to achieve the investment objective and policy, the Fund may use derivatives for both investment and efficient portfolio managementpurposes.
The Fund aims to achieve an investment return from income and capital appreciation.
The Fund primarily invests in local-denominated debt securities issued or guaranteed by governments, financial institutions or companies inemerging markets and in related derivatives.
The Fund will invest at least 80 per cent of its net assets in local bonds and other debt securities issued or guaranteed by governments of emergingmarkets or their agencies and by companies established or having significant operations in emerging markets.
Clarification point: This Fund follows the relative VaR approach to calculating Global Exposure. The benchmark is J.P. Morgan Government BondIndex - Emerging Markets Global Diversified Index, and the VaR on this Fund shall not exceed twice the benchmark's VaR. Leverage for this Fundis calculated using the Sum of Notionals Approach and is not expected to exceed 200%. Leverage may, however, in certain circumstances,exceed such maximum figure.
Share class B Income
Share class B Income (GBP share class)
Share class B Hedged Income (GBP share class)
Share class B Hedged Income (EUR share class)
Share class Z Gross Accumulation
• The synthetic risk reward indicator (the SRRI) rating is not a measure of the risk of you losing your investment but describes how much the valueof the Fund went up and down in the past;
• The SRRI rating is based on historical data, which may not be a reliable indication of the future risks and rewards of the Fund;
• We cannot guarantee that the rating of the Fund will remain the same; it may change over time;
Emerging market risk: emerging markets may not provide the same level of investor protection as a developed market; they may involve a higherrisk than investing in developed markets.
Currency risk: the Fund invests in assets that are denominated in other currencies; changes in exchange rates will affect the value of the Fund.
Interest-rate risk: interest rates affect the Fund's investments. If rates go up, the value of investments fall and vice versa.
Credit risk: the issuers of bonds or similar investments that the Fund buys may not pay income or repay capital to the Fund when due.
Derivative risk: the use of derivatives may result in gains or losses that are greater than an investment in the underlying asset.
• Even the lowest rating 1 does not mean a risk-free investment;
• On a scale of 1 (less risky) to 7 (more risky), this Fund has a rating of 5 due to its past performance and the nature of its investments. Shares witha rating of 5 might have higher risks, but also higher returns;
• Risk is taken in order to make a higher potential return; the more risk a Fund takes, the higher the potential return but the greater the risk of loss;and
• The value of the Fund and its return is not guaranteed and may fall as well as rise. You may get back less than you originally invested.
The Fund might also experience the following risks:
For further information on risks, please refer to the Risk Factors section in the Company's prospectus.
Currency hedged share class risk: hedging transactions are designed to reduce currency risk for investors. There is no guarantee that the hedgingwill be totally successful or that it can eliminate currency risk entirely.
200
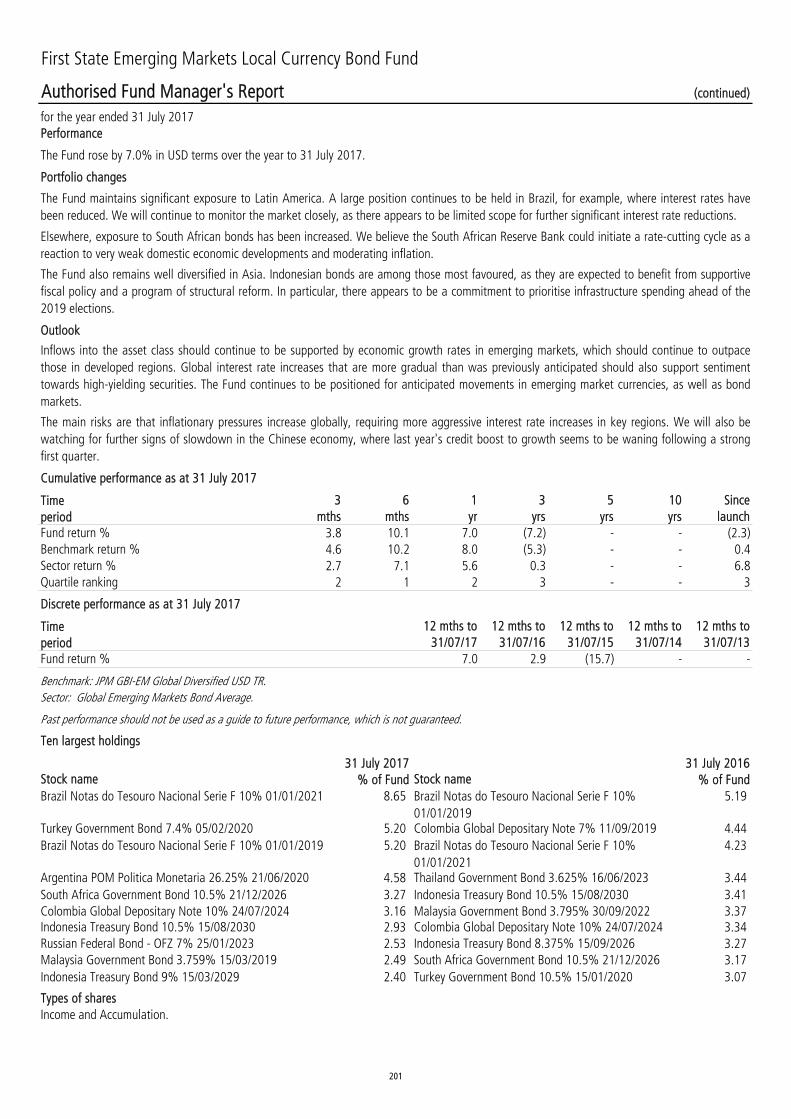
(continued)
First State Emerging Markets Local Currency Bond Fund
Authorised Fund Manager's Reportfor the year ended 31 July 2017
Time 3 6 1 3 5 10 Sinceperiod mths mths yr yrs yrs yrs launch
3.8 10.1 7.0 (7.2) - - (2.3)4.6 10.2 8.0 (5.3) - - 0.4 2.7 7.1 5.6 0.3 - - 6.8
2 1 2 3 - - 3
12 mths to 12 mths to 12 mths to 12 mths to 12 mths to31/07/17 31/07/16 31/07/15 31/07/14 31/07/13
7.0 2.9 (15.7) - -
31 July 2017 31 July 2016% of Fund % of Fund
8.65 5.19
5.20 4.445.20 4.23
4.58 3.443.27 3.413.16 3.372.93 3.342.53 3.272.49 3.172.40 3.07
Performance
The Fund rose by 7.0% in USD terms over the year to 31 July 2017.
Portfolio changes
The Fund maintains significant exposure to Latin America. A large position continues to be held in Brazil, for example, where interest rates havebeen reduced. We will continue to monitor the market closely, as there appears to be limited scope for further significant interest rate reductions.
Elsewhere, exposure to South African bonds has been increased. We believe the South African Reserve Bank could initiate a rate-cutting cycle as areaction to very weak domestic economic developments and moderating inflation.
The Fund also remains well diversified in Asia. Indonesian bonds are among those most favoured, as they are expected to benefit from supportivefiscal policy and a program of structural reform. In particular, there appears to be a commitment to prioritise infrastructure spending ahead of the2019 elections.
Outlook
Inflows into the asset class should continue to be supported by economic growth rates in emerging markets, which should continue to outpacethose in developed regions. Global interest rate increases that are more gradual than was previously anticipated should also support sentimenttowards high-yielding securities. The Fund continues to be positioned for anticipated movements in emerging market currencies, as well as bondmarkets.
The main risks are that inflationary pressures increase globally, requiring more aggressive interest rate increases in key regions. We will also bewatching for further signs of slowdown in the Chinese economy, where last year's credit boost to growth seems to be waning following a strongfirst quarter.
Cumulative performance as at 31 July 2017
Fund return %
TimeperiodFund return %
Benchmark: JPM GBI-EM Global Diversified USD TR.Sector: Global Emerging Markets Bond Average.
Benchmark return %Sector return %Quartile ranking
Discrete performance as at 31 July 2017
Stock name Stock nameBrazil Notas do Tesouro Nacional Serie F 10% 01/01/2021 Brazil Notas do Tesouro Nacional Serie F 10%
01/01/2019
Past performance should not be used as a guide to future performance, which is not guaranteed.
Ten largest holdings
South Africa Government Bond 10.5% 21/12/2026 Indonesia Treasury Bond 10.5% 15/08/2030Colombia Global Depositary Note 10% 24/07/2024 Malaysia Government Bond 3.795% 30/09/2022Indonesia Treasury Bond 10.5% 15/08/2030 Colombia Global Depositary Note 10% 24/07/2024
Turkey Government Bond 7.4% 05/02/2020 Colombia Global Depositary Note 7% 11/09/2019Brazil Notas do Tesouro Nacional Serie F 10% 01/01/2019 Brazil Notas do Tesouro Nacional Serie F 10%
01/01/2021Argentina POM Politica Monetaria 26.25% 21/06/2020 Thailand Government Bond 3.625% 16/06/2023
Types of sharesIncome and Accumulation.
Russian Federal Bond - OFZ 7% 25/01/2023 Indonesia Treasury Bond 8.375% 15/09/2026Malaysia Government Bond 3.759% 15/03/2019 South Africa Government Bond 10.5% 21/12/2026Indonesia Treasury Bond 9% 15/03/2029 Turkey Government Bond 10.5% 15/01/2020
201
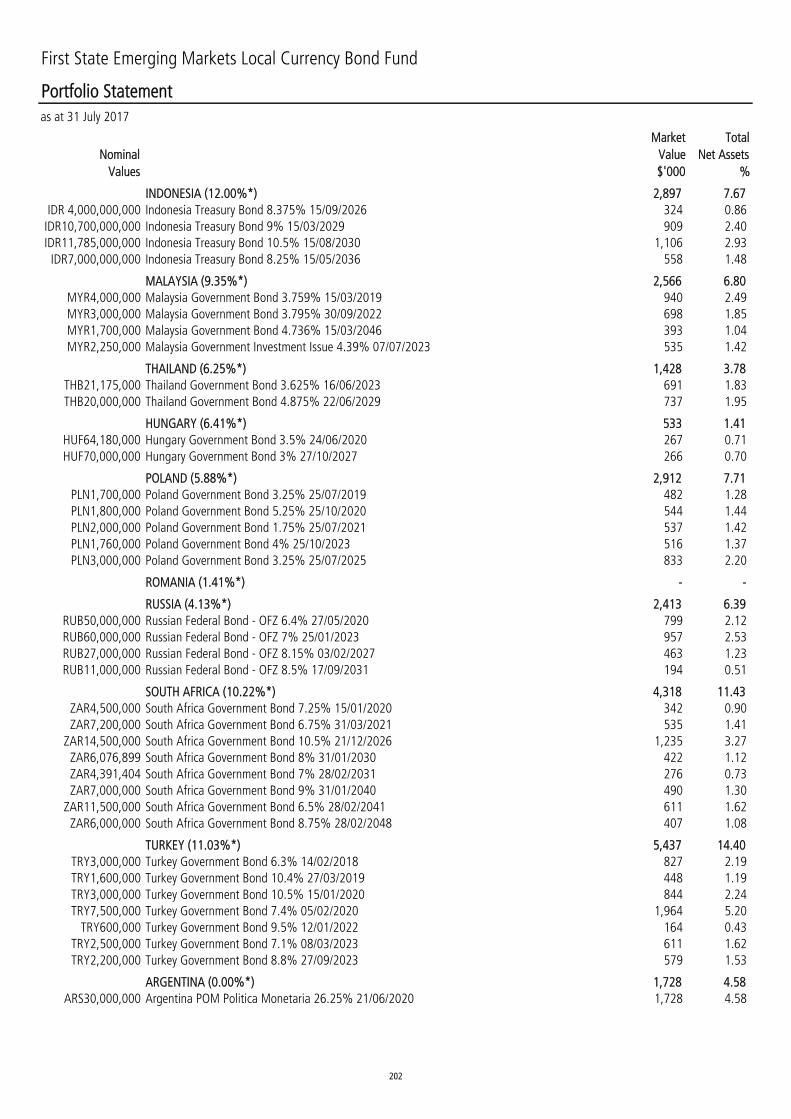
NominalValues
MarketValue$'000
TotalNet Assets
%
INDONESIA (12.00%*) 2,897 7.67IDR 4,000,000,000 Indonesia Treasury Bond 8.375% 15/09/2026 324 0.86
IDR10,700,000,000 Indonesia Treasury Bond 9% 15/03/2029 909 2.40IDR11,785,000,000 Indonesia Treasury Bond 10.5% 15/08/2030 1,106 2.93
IDR7,000,000,000 Indonesia Treasury Bond 8.25% 15/05/2036 558 1.48
MALAYSIA (9.35%*) 2,566 6.80MYR4,000,000 Malaysia Government Bond 3.759% 15/03/2019 940 2.49MYR3,000,000 Malaysia Government Bond 3.795% 30/09/2022 698 1.85MYR1,700,000 Malaysia Government Bond 4.736% 15/03/2046 393 1.04MYR2,250,000 Malaysia Government Investment Issue 4.39% 07/07/2023 535 1.42
THAILAND (6.25%*) 1,428 3.78THB21,175,000 Thailand Government Bond 3.625% 16/06/2023 691 1.83THB20,000,000 Thailand Government Bond 4.875% 22/06/2029 737 1.95
HUNGARY (6.41%*) 533 1.41HUF64,180,000 Hungary Government Bond 3.5% 24/06/2020 267 0.71HUF70,000,000 Hungary Government Bond 3% 27/10/2027 266 0.70
POLAND (5.88%*) 2,912 7.71PLN1,700,000 Poland Government Bond 3.25% 25/07/2019 482 1.28PLN1,800,000 Poland Government Bond 5.25% 25/10/2020 544 1.44PLN2,000,000 Poland Government Bond 1.75% 25/07/2021 537 1.42PLN1,760,000 Poland Government Bond 4% 25/10/2023 516 1.37PLN3,000,000 Poland Government Bond 3.25% 25/07/2025 833 2.20
ROMANIA (1.41%*) - -
RUSSIA (4.13%*) 2,413 6.39RUB50,000,000 Russian Federal Bond - OFZ 6.4% 27/05/2020 799 2.12RUB60,000,000 Russian Federal Bond - OFZ 7% 25/01/2023 957 2.53RUB27,000,000 Russian Federal Bond - OFZ 8.15% 03/02/2027 463 1.23RUB11,000,000 Russian Federal Bond - OFZ 8.5% 17/09/2031 194 0.51
SOUTH AFRICA (10.22%*) 4,318 11.43ZAR4,500,000 South Africa Government Bond 7.25% 15/01/2020 342 0.90ZAR7,200,000 South Africa Government Bond 6.75% 31/03/2021 535 1.41
ZAR14,500,000 South Africa Government Bond 10.5% 21/12/2026 1,235 3.27ZAR6,076,899 South Africa Government Bond 8% 31/01/2030 422 1.12ZAR4,391,404 South Africa Government Bond 7% 28/02/2031 276 0.73ZAR7,000,000 South Africa Government Bond 9% 31/01/2040 490 1.30
ZAR11,500,000 South Africa Government Bond 6.5% 28/02/2041 611 1.62ZAR6,000,000 South Africa Government Bond 8.75% 28/02/2048 407 1.08
TURKEY (11.03%*) 5,437 14.40TRY3,000,000 Turkey Government Bond 6.3% 14/02/2018 827 2.19TRY1,600,000 Turkey Government Bond 10.4% 27/03/2019 448 1.19TRY3,000,000 Turkey Government Bond 10.5% 15/01/2020 844 2.24TRY7,500,000 Turkey Government Bond 7.4% 05/02/2020 1,964 5.20
TRY600,000 Turkey Government Bond 9.5% 12/01/2022 164 0.43TRY2,500,000 Turkey Government Bond 7.1% 08/03/2023 611 1.62TRY2,200,000 Turkey Government Bond 8.8% 27/09/2023 579 1.53
ARGENTINA (0.00%*) 1,728 4.58ARS30,000,000 Argentina POM Politica Monetaria 26.25% 21/06/2020 1,728 4.58
First State Emerging Markets Local Currency Bond Fund
Portfolio Statementas at 31 July 2017
202

NominalValues
MarketValue$'000
TotalNet Assets
%
First State Emerging Markets Local Currency Bond Fund
Portfolio Statement (continued)
as at 31 July 2017
BRAZIL (10.73%*) 6,380 16.90BRL6,000,000 Brazil Notas do Tesouro Nacional Serie F 10% 01/01/2019 1,963 5.20
BRL10,000,000 Brazil Notas do Tesouro Nacional Serie F 10% 01/01/2021 3,266 8.65BRL1,600,000 Brazil Notas do Tesouro Nacional Serie F 10% 01/01/2025 513 1.36BRL2,000,000 Brazil Notas do Tesouro Nacional Serie F 10% 01/01/2027 638 1.69
COLOMBIA (7.78%*) 2,068 5.48COP1,000,000,000 Colombia Global Depositary Note 7% 11/09/2019 342 0.91COP3,000,000,000 Colombia Global Depositary Note 10% 24/07/2024 1,193 3.16COP1,500,000,000 Colombian TES 7.75% 18/09/2030 533 1.41
MEXICO (6.22%*) 1,860 4.93MXN10,000,000 Mexican Bonos 6.5% 09/06/2022 557 1.48
MXN7,000,000 Mexican Bonos 10% 05/12/2024 466 1.24MXN5,000,000 Mexican Bonos 7.75% 29/05/2031 299 0.79MXN9,000,000 Mexican Bonos 7.75% 13/11/2042 538 1.42
PERU (2.48%*) 866 2.29PEN2,543,000 Peru Government Bond 6.95% 12/08/2031 866 2.29
URUGUAY (0.00%*) 176 0.47UYU4,700,000 Uruguay Government International Bond 9.875% 20/06/2022 176 0.47
DERIVATIVES (-0.44%*) 571 1.50
Interest Rate Swap350,000,000 Citibank Interest Rate Swap Pay HUF BUBOR Rec HUF 1.13% 14/07/2021 11 0.03
25,000,000 HSBC Interest Rate Swap Pay MXN TIIE Rec MXN 7.68% 13/07/2020 32 0.087,000,000 HSBC Interest Rate Swap Pay MXN TIIE Rec MXN 6.25% 09/02/2027 (25) (0.07)9,000,000 HSBC Interest Rate Swap Pay MXN TIIE Rec MXN 6.42% 03/03/2027 (25) (0.07)3,500,000 Citibank Interest Rate Swap Rec PLN WIBOR Pay PLN 2.03% 24/04/2020 - -
Forward Currency Contracts
Argentine PesoBought ARS28,000,000 for USD1,680,672 Settlement 08/09/2017 (142) (0.38)Sold ARS28,000,000 for USD1,682,692 Settlement 08/09/2017 144 0.38
Brazilian RealSold BRL5,000,000 for USD1,494,197 Settlement 08/09/2017 (91) (0.24)
Colombian PesoBought COP3,100,000,000 for USD1,028,141 Settlement 08/09/2017 - -Sold COP1,100,000,000 for USD372,124 Settlement 08/09/2017 7 0.02
Czech KorunaBought CZK50,000,000 for EUR1,871,255 Settlement 12/09/2017 55 0.15Bought CZK33,000,000 for EUR1,241,764 Settlement 16/01/2018 33 0.09
Egyptian PoundBought EGP7,420,000 for USD400,000 Settlement 20/09/2017 8 0.02
EuroBought EUR7,121,003 for USD8,165,213 Settlement 04/08/2017 190 0.50Bought EUR3,000,000 for USD3,455,674 Settlement 05/09/2017 70 0.20Bought EUR300,071 for RON1,381,000 Settlement 03/11/2017 (2) (0.01)Bought EUR618,886 for CZK16,500,000 Settlement 16/01/2018 (19) (0.05)
Hungarian ForintBought HUF310,000,000 for EUR1,008,022 Settlement 08/09/2017 12 0.03
Indonesian RupiahBought IDR11,500,000,000 for USD858,478 Settlement 08/09/2017 2 0.01
203
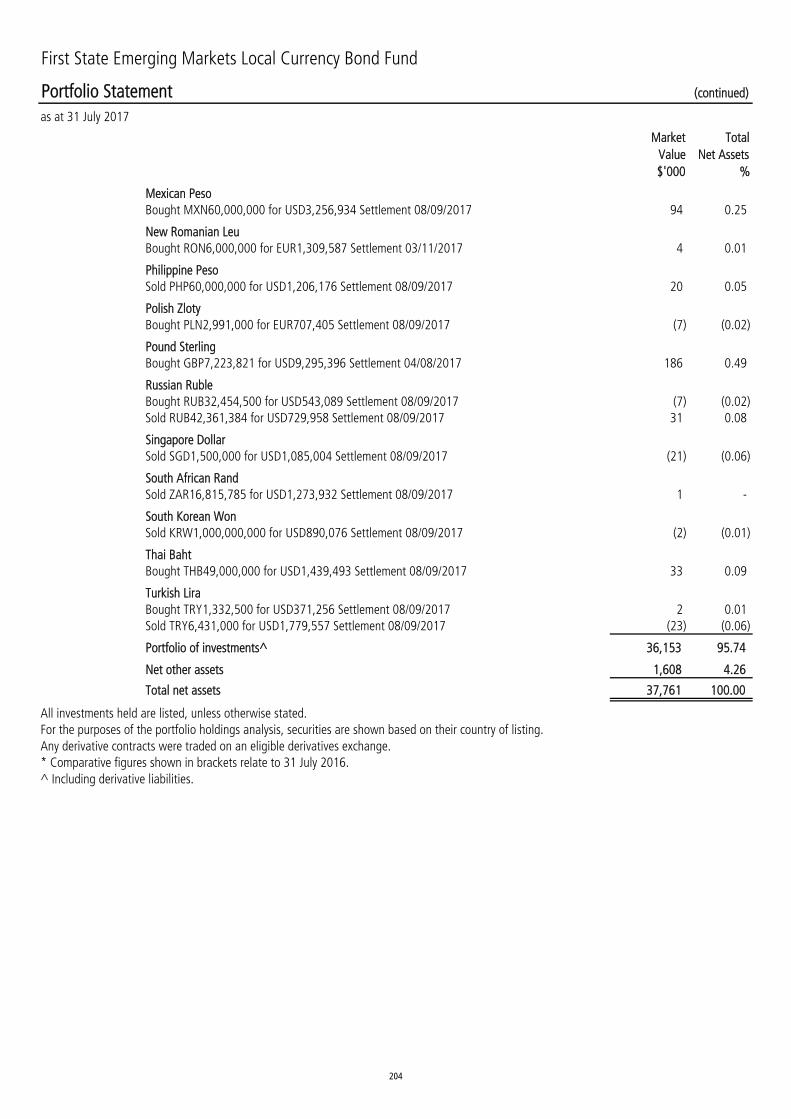
MarketValue$'000
TotalNet Assets
%
First State Emerging Markets Local Currency Bond Fund
Portfolio Statement (continued)
as at 31 July 2017
Mexican PesoBought MXN60,000,000 for USD3,256,934 Settlement 08/09/2017 94 0.25
New Romanian LeuBought RON6,000,000 for EUR1,309,587 Settlement 03/11/2017 4 0.01
Philippine PesoSold PHP60,000,000 for USD1,206,176 Settlement 08/09/2017 20 0.05
Polish ZlotyBought PLN2,991,000 for EUR707,405 Settlement 08/09/2017 (7) (0.02)
Pound SterlingBought GBP7,223,821 for USD9,295,396 Settlement 04/08/2017 186 0.49
Russian RubleBought RUB32,454,500 for USD543,089 Settlement 08/09/2017 (7) (0.02)Sold RUB42,361,384 for USD729,958 Settlement 08/09/2017 31 0.08
Singapore DollarSold SGD1,500,000 for USD1,085,004 Settlement 08/09/2017 (21) (0.06)
South African RandSold ZAR16,815,785 for USD1,273,932 Settlement 08/09/2017 1 -
South Korean WonSold KRW1,000,000,000 for USD890,076 Settlement 08/09/2017 (2) (0.01)
Thai BahtBought THB49,000,000 for USD1,439,493 Settlement 08/09/2017 33 0.09
Turkish LiraBought TRY1,332,500 for USD371,256 Settlement 08/09/2017 2 0.01Sold TRY6,431,000 for USD1,779,557 Settlement 08/09/2017 (23) (0.06)
Portfolio of investments^ 36,153 95.74
Net other assets 1,608 4.26
Total net assets 37,761 100.00
^ Including derivative liabilities.
All investments held are listed, unless otherwise stated.
Any derivative contracts were traded on an eligible derivatives exchange.* Comparative figures shown in brackets relate to 31 July 2016.
For the purposes of the portfolio holdings analysis, securities are shown based on their country of listing.
204
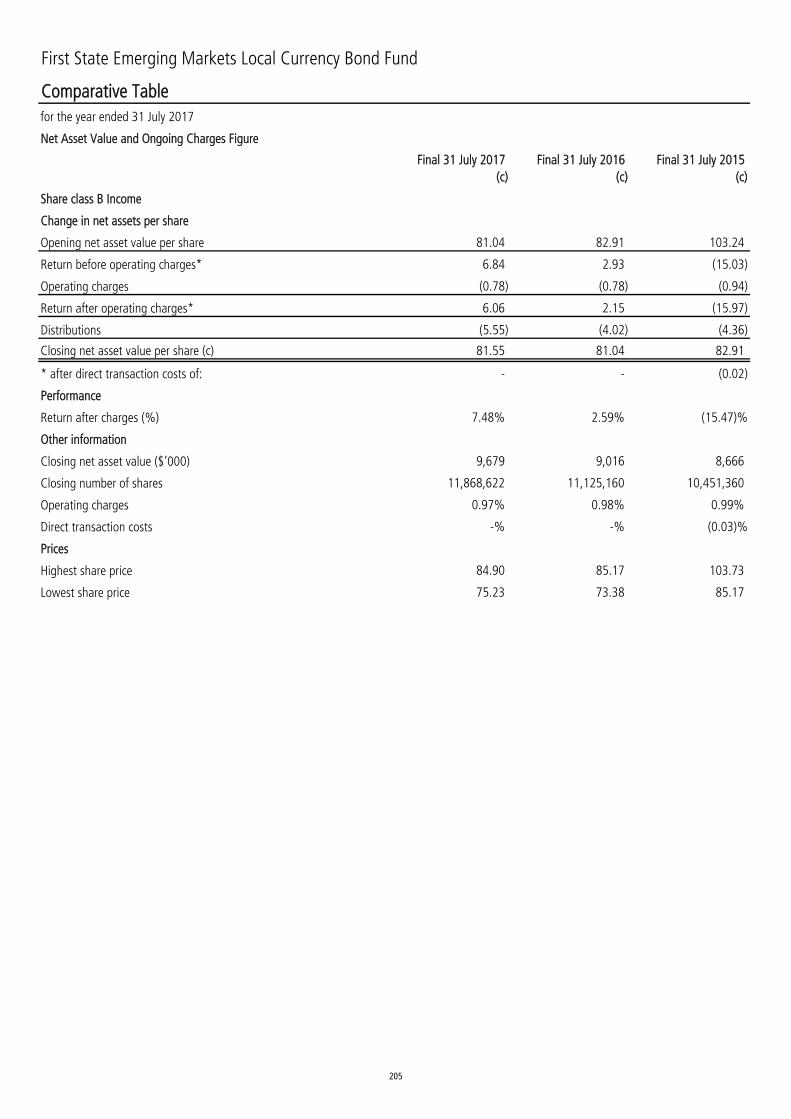
Share class B Income
Change in net assets per share
Opening net asset value per share
Return before operating charges*
Operating charges
Return after operating charges*
Distributions
Closing net asset value per share (c)
* after direct transaction costs of:
Performance
Return after charges (%)
Other information
Closing net asset value ($’000)
Closing number of shares
Operating charges
Direct transaction costs
Prices
Highest share price
Lowest share price
First State Emerging Markets Local Currency Bond Fund
Comparative Tablefor the year ended 31 July 2017
Net Asset Value and Ongoing Charges Figure
Final 31 July 2017(c)
Final 31 July 2016(c)
Final 31 July 2015(c)
81.04 82.91 103.24
6.06 2.15 (15.97)
(5.55) (4.02) (4.36)
6.84 2.93 (15.03)
(0.78) (0.78) (0.94)
81.55 81.04 82.91
- - (0.02)
9,679 9,016 8,666
11,868,622 11,125,160 10,451,360
7.48% 2.59% (15.47)%
-% -% (0.03)%
84.90 85.17 103.73
0.97% 0.98% 0.99%
75.23 73.38 85.17
205

First State Emerging Markets Local Currency Bond Fund
Comparative Table (continued)
for the year ended 31 July 2017
Net Asset Value and Ongoing Charges Figure
Share class B Income (GBP share class)
Change in net assets per share
Opening net asset value per share
Return before operating charges*
Operating charges
Return after operating charges*
Distributions
Closing net asset value per share (p)
* after direct transaction costs of:
Performance
Return after charges (%)
Other information
Closing net asset value (£’000)
Closing number of shares
Operating charges
Direct transaction costs
Prices
Highest share price
Lowest share price
Final 31 July 2017(p)
Final 31 July 2016(p)
Final 31 July 2015(p)
101.41 87.80 100.85
8.22 18.46 (8.36)
(7.15) (4.85) (4.69)
9.24 19.34 (7.36)
(1.02) (0.88) (1.00)
102.48 101.41 87.80
- - (0.02)
7,573 7,144 5,701
7,390,235 7,044,149 6,492,608
8.11% 21.03% (8.29)%
-% -% (0.03)%
112.26 106.95 107.15
0.97% 0.98% 1.00%
98.25 82.21 90.12
206
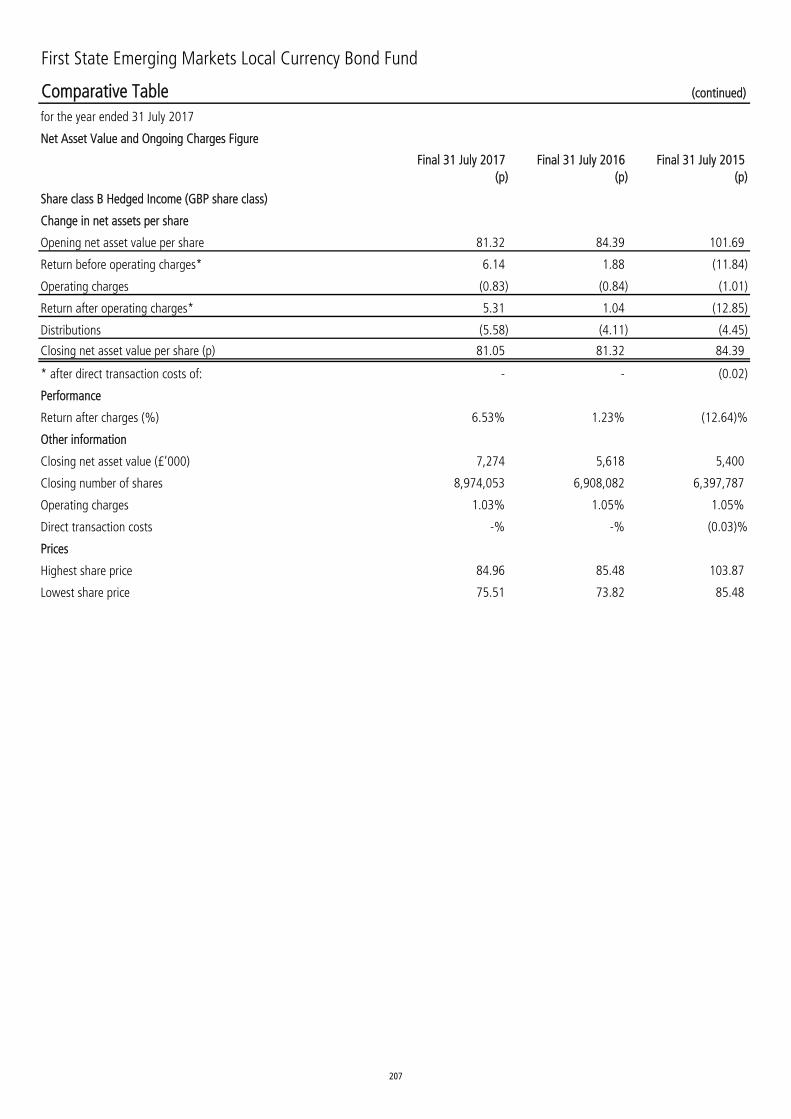
First State Emerging Markets Local Currency Bond Fund
Comparative Table (continued)
for the year ended 31 July 2017
Net Asset Value and Ongoing Charges Figure
Share class B Hedged Income (GBP share class)
Change in net assets per share
Opening net asset value per share
Return before operating charges*
Operating charges
Return after operating charges*
Distributions
Closing net asset value per share (p)
* after direct transaction costs of:
Performance
Return after charges (%)
Other information
Closing net asset value (£’000)
Closing number of shares
Operating charges
Direct transaction costs
Prices
Highest share price
Lowest share price
Final 31 July 2017(p)
Final 31 July 2016(p)
Final 31 July 2015(p)
81.32 84.39 101.69
5.31 1.04 (12.85)
(5.58) (4.11) (4.45)
6.14 1.88 (11.84)
(0.83) (0.84) (1.01)
81.05 81.32 84.39
- - (0.02)
7,274 5,618 5,400
8,974,053 6,908,082 6,397,787
6.53% 1.23% (12.64)%
-% -% (0.03)%
84.96 85.48 103.87
1.03% 1.05% 1.05%
75.51 73.82 85.48
207
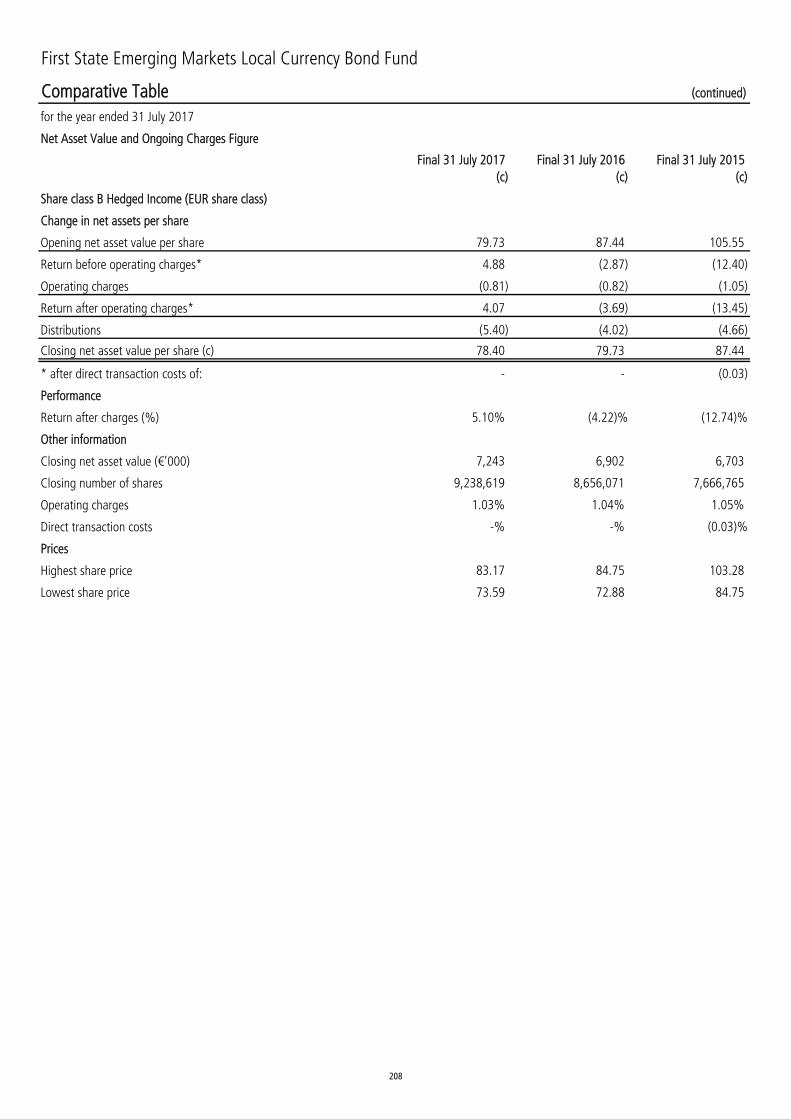
First State Emerging Markets Local Currency Bond Fund
Comparative Table (continued)
for the year ended 31 July 2017
Net Asset Value and Ongoing Charges Figure
Share class B Hedged Income (EUR share class)
Change in net assets per share
Opening net asset value per share
Return before operating charges*
Operating charges
Return after operating charges*
Distributions
Closing net asset value per share (c)
* after direct transaction costs of:
Performance
Return after charges (%)
Other information
Closing net asset value (€’000)
Closing number of shares
Operating charges
Direct transaction costs
Prices
Highest share price
Lowest share price
Final 31 July 2017(c)
Final 31 July 2016(c)
Final 31 July 2015(c)
79.73 87.44 105.55
4.07 (3.69) (13.45)
(5.40) (4.02) (4.66)
4.88 (2.87) (12.40)
(0.81) (0.82) (1.05)
78.40 79.73 87.44
- - (0.03)
7,243 6,902 6,703
9,238,619 8,656,071 7,666,765
5.10% (4.22)% (12.74)%
-% -% (0.03)%
83.17 84.75 103.28
1.03% 1.04% 1.05%
73.59 72.88 84.75
208
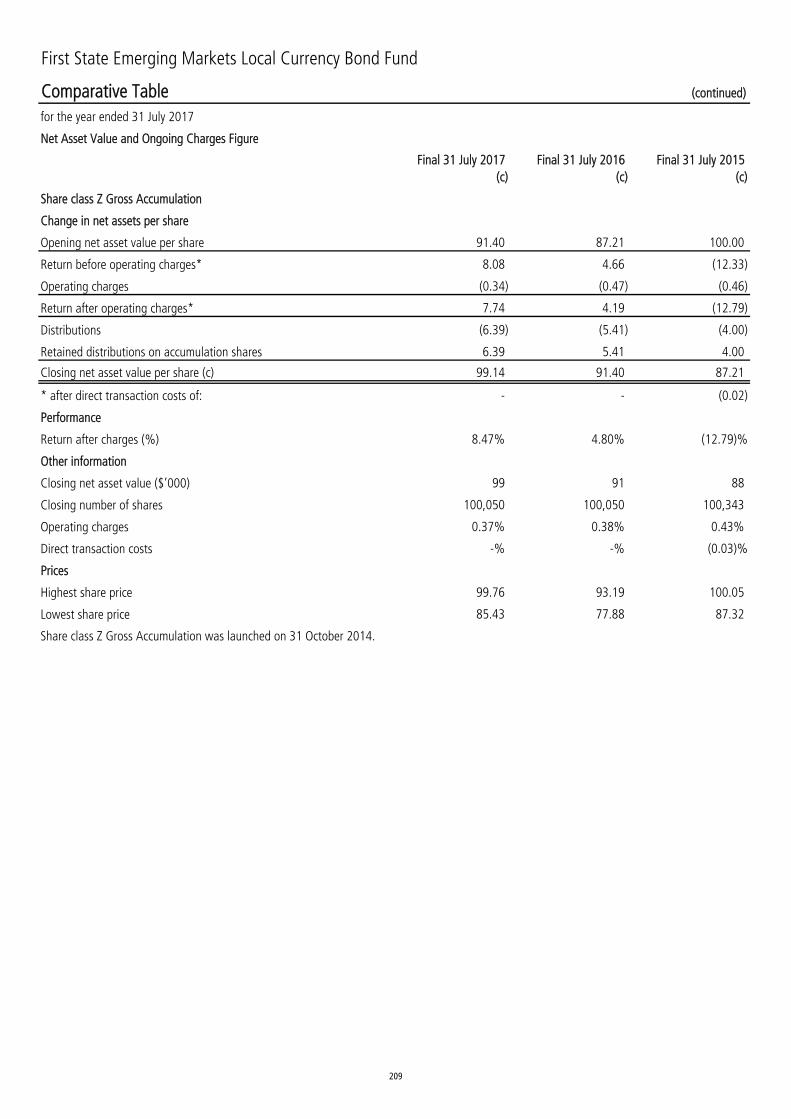
First State Emerging Markets Local Currency Bond Fund
Comparative Table (continued)
for the year ended 31 July 2017
Net Asset Value and Ongoing Charges Figure
Share class Z Gross Accumulation
Change in net assets per share
Opening net asset value per share
Return before operating charges*
Operating charges
Return after operating charges*
Distributions
Retained distributions on accumulation shares
Closing net asset value per share (c)
* after direct transaction costs of:
Performance
Return after charges (%)
Other information
Closing net asset value ($’000)
Closing number of shares
Operating charges
Direct transaction costs
Prices
Highest share price
Lowest share price
Final 31 July 2017(c)
Final 31 July 2016(c)
Final 31 July 2015(c)
91.40 87.21 100.00
7.74 4.19 (12.79)
(6.39) (5.41) (4.00)
8.08 4.66 (12.33)
(0.34) (0.47) (0.46)
99.14 91.40 87.21
- - (0.02)
6.39 5.41 4.00
99 91 88
100,050 100,050 100,343
8.47% 4.80% (12.79)%
-% -% (0.03)%
99.76 93.19 100.05
0.37% 0.38% 0.43%
Share class Z Gross Accumulation was launched on 31 October 2014.
85.43 77.88 87.32
209
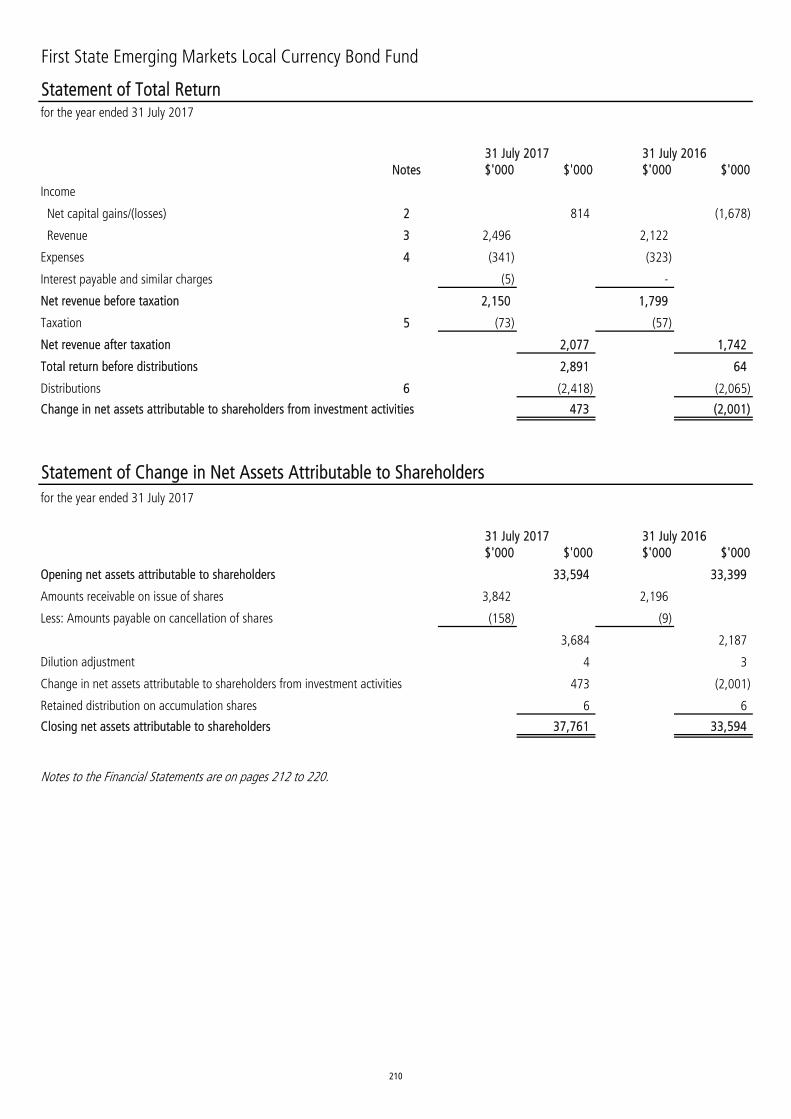
Notes $'000 $'000 $'000 $'000
Net capital gains/(losses) 2 814 (1,678)
Revenue 3 2,496 2,122
4 (341) (323)
Interest payable and similar charges (5) -
2,150 1,799
5 (73) (57)
2,077 1,742
2,891 64
6 (2,418) (2,065)
473 (2,001)
$'000 $'000 $'000 $'000
33,594 33,399
3,842 2,196
(158) (9)
3,684 2,187
4 3
473 (2,001)
6 6
37,761 33,594
31 July 2017 31 July 2016
First State Emerging Markets Local Currency Bond Fund
Statement of Total Returnfor the year ended 31 July 2017
Statement of Change in Net Assets Attributable to Shareholders
Income
Expenses
Net revenue before taxation
Taxation
Net revenue after taxation
Total return before distributions
Distributions
Change in net assets attributable to shareholders from investment activities
Amounts receivable on issue of shares
for the year ended 31 July 2017
31 July 2017 31 July 2016
Opening net assets attributable to shareholders
Less: Amounts payable on cancellation of shares
Dilution adjustment
Change in net assets attributable to shareholders from investment activities
Retained distribution on accumulation shares
Closing net assets attributable to shareholders
Notes to the Financial Statements are on pages 212 to 220.
210
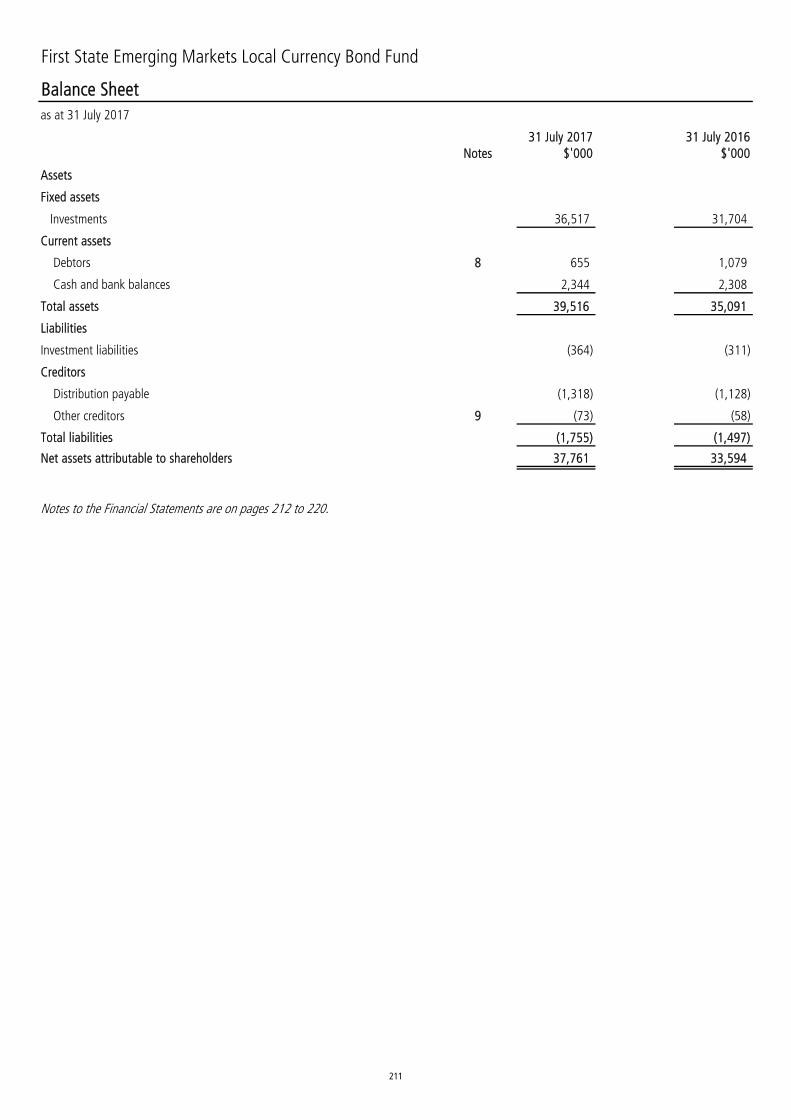
First State Emerging Markets Local Currency Bond Fund
31 July 2017 31 July 2016Notes $'000 $'000
Investments 36,517 31,704
Current assets
8 655 1,079
2,344 2,308
39,516 35,091
(364) (311)
Creditors
(1,318) (1,128)
Other creditors 9 (73) (58)
(1,755) (1,497)
37,761 33,594
Investment liabilities
Balance Sheetas at 31 July 2017
Assets
Fixed assets
Debtors
Cash and bank balances
Total assets
Liabilities
Notes to the Financial Statements are on pages 212 to 220.
Distribution payable
Total liabilities
Net assets attributable to shareholders
211
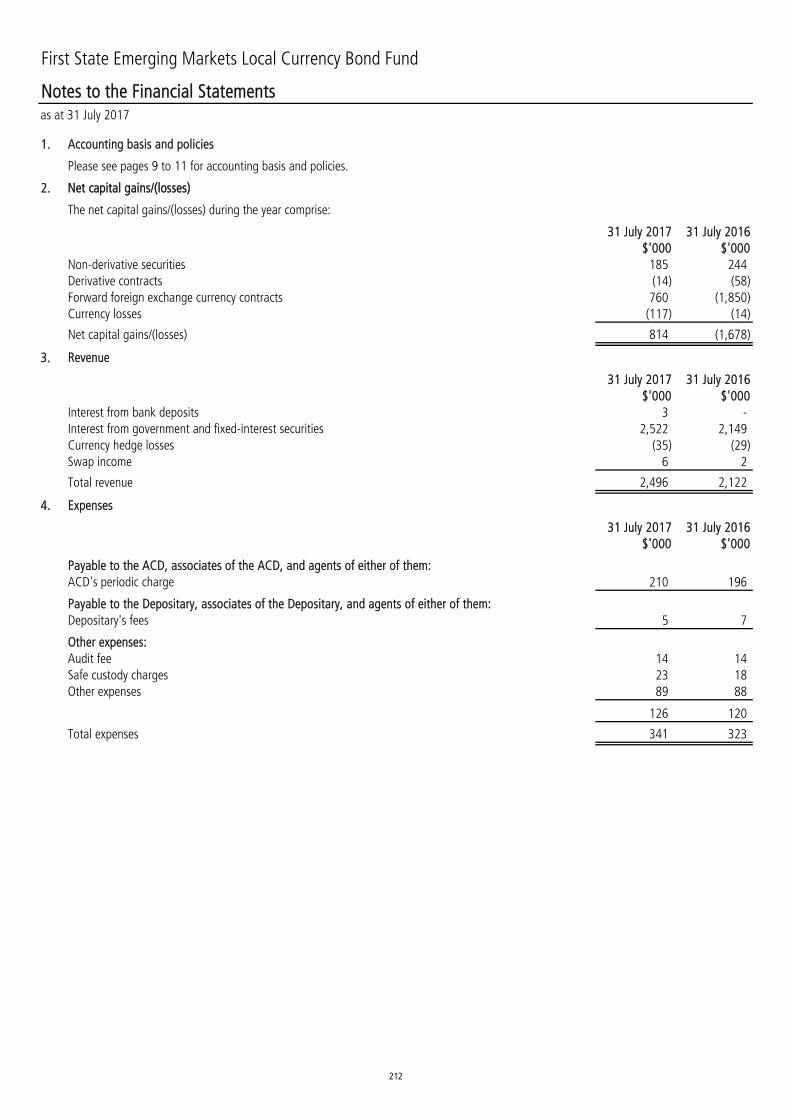
1.
2.
31 July 2017 31 July 2016$'000 $'000
185 244(14) (58)760 (1,850)
(117) (14)
814 (1,678)
3.
31 July 2017 31 July 2016$'000 $'000
3 -2,522 2,149
(35) (29)6 2
2,496 2,122
4.
31 July 2017 31 July 2016$'000 $'000
210 196
5 7
14 1423 1889 88
126 120
341 323
Accounting basis and policies
Please see pages 9 to 11 for accounting basis and policies.
Net capital gains/(losses)
The net capital gains/(losses) during the year comprise:
Non-derivative securities
Notes to the Financial Statementsas at 31 July 2017
First State Emerging Markets Local Currency Bond Fund
Net capital gains/(losses)
Revenue
Derivative contractsForward foreign exchange currency contractsCurrency losses
Interest from bank depositsInterest from government and fixed-interest securitiesCurrency hedge lossesSwap income
Total revenue
Payable to the Depositary, associates of the Depositary, and agents of either of them:Depositary's fees
Expenses
Payable to the ACD, associates of the ACD, and agents of either of them:ACD's periodic charge
Audit feeSafe custody chargesOther expenses
Other expenses:
Total expenses
212

Notes to the Financial Statements (continued)
as at 31 July 2017
First State Emerging Markets Local Currency Bond Fund
5.
31 July 2017 31 July 2016$'000 $'000
(a)73 57
73 57
(b)
2,150 1,799
430 360
73 57(430) (361)
- 1
73 57
(c)
6.
31 July 2017 31 July 2016$'000 $'000
921 7781,303 891
227 412
2,451 2,0814 -
(37) (16)
2,418 2,065
7.
31 July 2017 31 July 2016$'000 $'0002,077 1,742
Expenses charged to capital 341 323
2,418 2,065
Taxation
Irrecoverable overseas taxAnalysis of charge in year:
Net revenue before taxation
Corporation tax of 20% (2016: 20%)
Effects of:
Total taxation (note 5b)
Factors affecting current tax charge for the year:
The tax assessed for the year is lower than (2016: lower than) the standard rate of corporation tax in the UK for an open-ended investmentcompany of 20% (2016: 20%). The differences are explained below:
Irrecoverable overseas taxTax-deductible interest distributionsExpenses not deductible for tax purposes
Deferred taxation:
There is no provision required for deferred taxation at the balance sheet date in the current or prior year.
Total tax charge for year (note 5a)
OEICs are exempt from tax on capital gains. Therefore, any capital return is not included in the above reconciliation.
* As an authorised OEIC, these items are not subject to corporation tax.
Interim distribution
Distributions
The distributions take account of revenue received on the issue of shares and revenue deducted on the cancellation of shares and comprise:
Add: revenue deducted on cancellation of sharesDeduct: revenue received on issue of shares
Net distributions for the year
Final distributionIncome tax withheld
Details of the distribution per share are set out in the Distribution Tables on pages 221 to 222.
Movement between net revenue and net distributions
Net revenue after taxation
Net distributions for the year
213
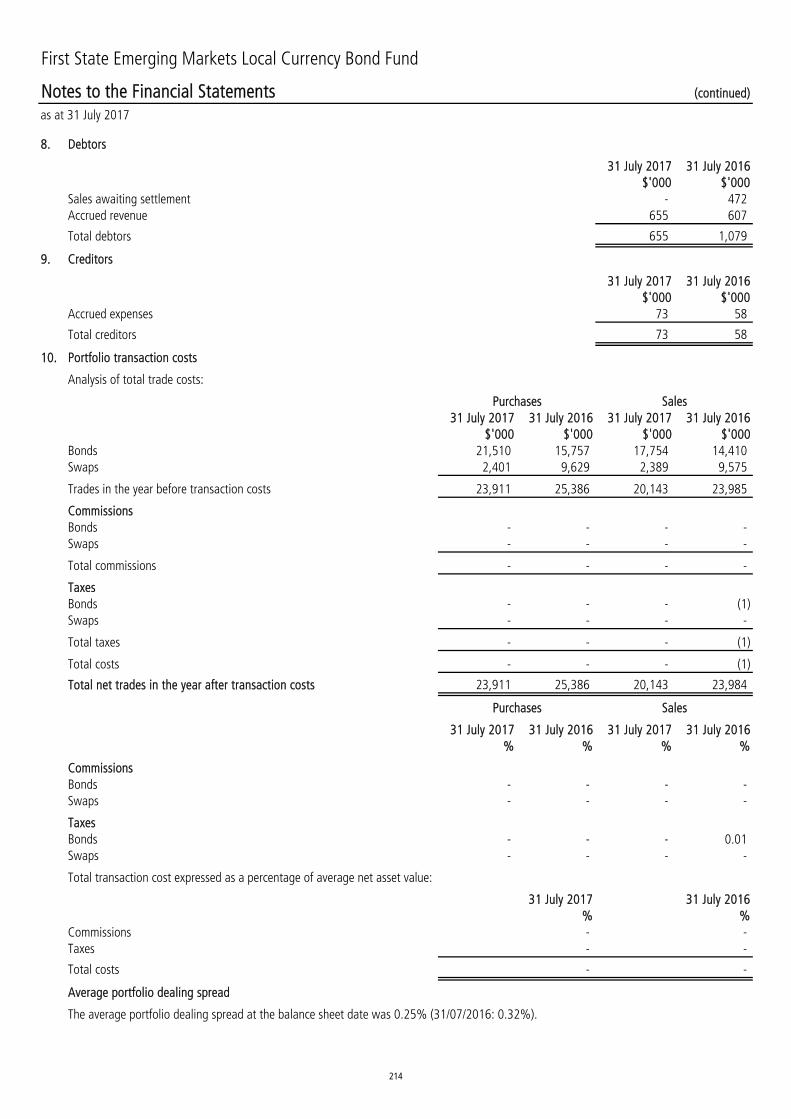
Notes to the Financial Statements (continued)
as at 31 July 2017
First State Emerging Markets Local Currency Bond Fund
8.
31 July 2017 31 July 2016$'000 $'000
- 472655 607
655 1,079
9.
31 July 2017 31 July 2016$'000 $'000
73 58
73 58
10.
31 July 2017 31 July 2016 31 July 2017 31 July 2016$'000 $'000 $'000 $'000
21,510 15,757 17,754 14,4102,401 9,629 2,389 9,575
23,911 25,386 20,143 23,985
- - - -- - - -
- - - -
- - - (1)- - - -
- - - (1)
- - - (1)
23,911 25,386 20,143 23,984
31 July 2017 31 July 2016 31 July 2017 31 July 2016% % % %
- - - -- - - -
- - - 0.01- - - -
Accrued revenue
Debtors
Sales awaiting settlement
Total debtors
Creditors
Accrued expenses
Analysis of total trade costs:
Purchases Sales
Bonds
Total creditors
Portfolio transaction costs
Trades in the year before transaction costs
CommissionsBonds
Swaps
Total commissions
TaxesBonds
Swaps
Total taxes
Total costs
Total net trades in the year after transaction costs
Swaps
CommissionsBonds
Purchases Sales
BondsSwaps
Swaps
Taxes
Commissions - -Taxes - -
Total transaction cost expressed as a percentage of average net asset value:
31 July 2017 31 July 2016% %
Total costs - -
Average portfolio dealing spread
The average portfolio dealing spread at the balance sheet date was 0.25% (31/07/2016: 0.32%).
214
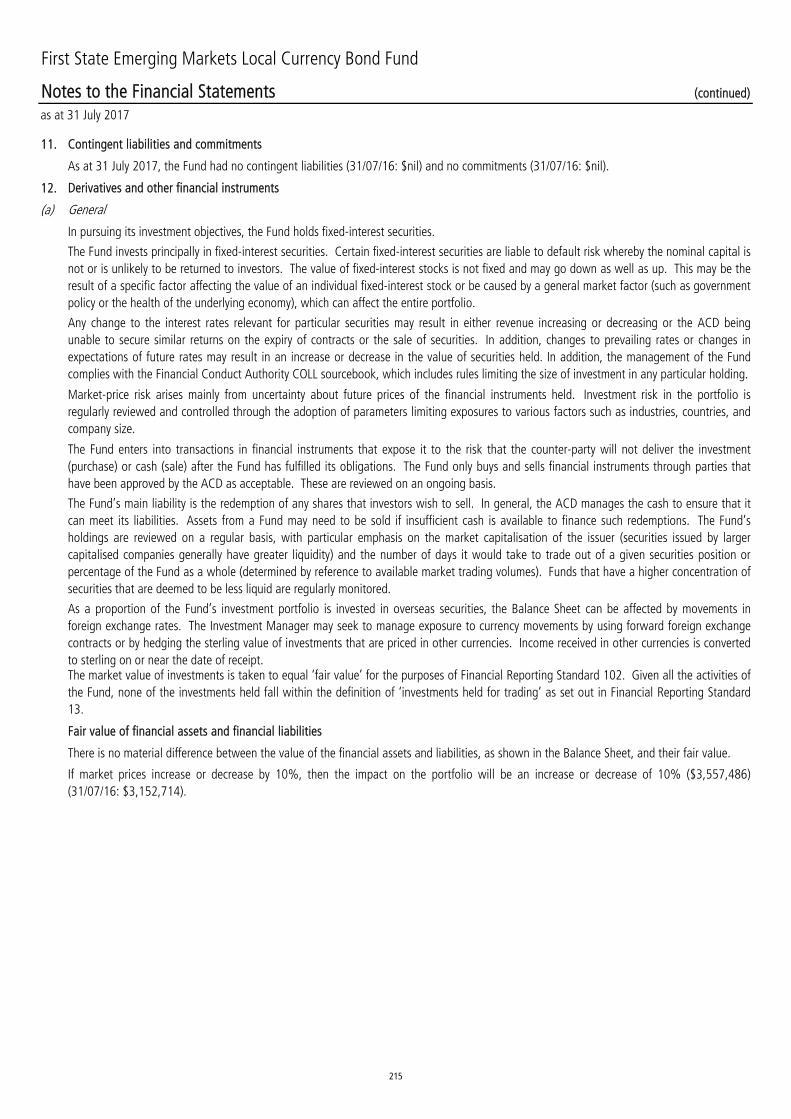
Notes to the Financial Statements (continued)
as at 31 July 2017
First State Emerging Markets Local Currency Bond Fund
11.
12.
(a)
Contingent liabilities and commitments
As at 31 July 2017, the Fund had no contingent liabilities (31/07/16: $nil) and no commitments (31/07/16: $nil).
Market-price risk arises mainly from uncertainty about future prices of the financial instruments held. Investment risk in the portfolio isregularly reviewed and controlled through the adoption of parameters limiting exposures to various factors such as industries, countries, andcompany size.
The Fund enters into transactions in financial instruments that expose it to the risk that the counter-party will not deliver the investment(purchase) or cash (sale) after the Fund has fulfilled its obligations. The Fund only buys and sells financial instruments through parties thathave been approved by the ACD as acceptable. These are reviewed on an ongoing basis.
The Fund’s main liability is the redemption of any shares that investors wish to sell. In general, the ACD manages the cash to ensure that itcan meet its liabilities. Assets from a Fund may need to be sold if insufficient cash is available to finance such redemptions. The Fund’sholdings are reviewed on a regular basis, with particular emphasis on the market capitalisation of the issuer (securities issued by largercapitalised companies generally have greater liquidity) and the number of days it would take to trade out of a given securities position orpercentage of the Fund as a whole (determined by reference to available market trading volumes). Funds that have a higher concentration ofsecurities that are deemed to be less liquid are regularly monitored.
As a proportion of the Fund’s investment portfolio is invested in overseas securities, the Balance Sheet can be affected by movements inforeign exchange rates. The Investment Manager may seek to manage exposure to currency movements by using forward foreign exchangecontracts or by hedging the sterling value of investments that are priced in other currencies. Income received in other currencies is convertedto sterling on or near the date of receipt.The market value of investments is taken to equal ‘fair value’ for the purposes of Financial Reporting Standard 102. Given all the activities ofthe Fund, none of the investments held fall within the definition of ‘investments held for trading’ as set out in Financial Reporting Standard13.
Fair value of financial assets and financial liabilities
Derivatives and other financial instruments
General
In pursuing its investment objectives, the Fund holds fixed-interest securities.
The Fund invests principally in fixed-interest securities. Certain fixed-interest securities are liable to default risk whereby the nominal capital isnot or is unlikely to be returned to investors. The value of fixed-interest stocks is not fixed and may go down as well as up. This may be theresult of a specific factor affecting the value of an individual fixed-interest stock or be caused by a general market factor (such as governmentpolicy or the health of the underlying economy), which can affect the entire portfolio.
Any change to the interest rates relevant for particular securities may result in either revenue increasing or decreasing or the ACD beingunable to secure similar returns on the expiry of contracts or the sale of securities. In addition, changes to prevailing rates or changes inexpectations of future rates may result in an increase or decrease in the value of securities held. In addition, the management of the Fundcomplies with the Financial Conduct Authority COLL sourcebook, which includes rules limiting the size of investment in any particular holding.
There is no material difference between the value of the financial assets and liabilities, as shown in the Balance Sheet, and their fair value.
If market prices increase or decrease by 10%, then the impact on the portfolio will be an increase or decrease of 10% ($3,557,486)(31/07/16: $3,152,714).
215
Notes to the Financial Statements (continued)
as at 31 July 2017
First State Emerging Markets Local Currency Bond Fund
(b)
Floating- rate
financial assets
Fixed-rate financial
assets
Financial liabilities not
carrying interest Total
Currency $'000 $'000 $'000 $'00031 July 2017Sterling 68 - 9,145 9,213Argentine peso 1,728 - 49 1,777Brazilian real 4 6,380 (1,534) 4,850Colombian peso 957 2,068 712 3,737Czech Republic koruna - - 3,007 3,007Egyptian pound - - 408 408Euro 30 - 5,444 5,474Hungarian forint 12 533 1,215 1,760Indonesian rupiah - 2,897 941 3,838Korean won - - (892) (892)Malaysian ringgit - 2,566 31 2,597Mexican peso 5 1,860 3,351 5,216Peruvian nuevo sol - 866 25 891Philippine peso - - (1,186) (1,186)Polish zloty - 2,912 860 3,772Romanian new leu - - 1,191 1,191Russian ruble 27 2,413 (98) 2,342Singapore dollar - - (1,106) (1,106)South African rand 78 4,318 (1,196) 3,200Thai baht - 1,428 1,479 2,907Turkish lira - 5,437 (1,271) 4,166Uruguayan peso - 176 3 179US dollar 1,163 - (20,743) (19,580)
Total 4,072 33,854 (165) 37,761
As at 31 July 2017, 10.78% (31/07/16: 6.87%) of the Fund's assets were interest-bearing.
The interest-rate risk profile of the Company's financial assets and liabilities at 31 July 2017 was:
Interest-rate risk
The Fund receives revenue from fixed-interest investments. Given that the fund's objective is to achieve a total investment return from incomeand capital appreciation, these cash flows are considered to be of primary importance and are actively managed.
216
Notes to the Financial Statements (continued)
as at 31 July 2017
First State Emerging Markets Local Currency Bond Fund
Floating- rate
financial assets
Fixed-rate financial
assets
Financial liabilities not
carrying interest Total
Currency $'000 $'000 $'000 $'00031 July 2016Sterling 71 - (308) (237)Brazilian real 3 3,608 29 3,640Colombian peso 1 2,613 (263) 2,351Euro 1 - (158) (157)Hungarian forint 2 2,150 (293) 1,859Indian rupee - - 637 637Indonesian rupiah - 4,027 126 4,153Malaysian ringgit - 3,141 758 3,899Mexican peso - 2,087 1,883 3,970Peruvian nuevo sol - 833 (154) 679Philippine peso - - 127 127Polish zloty 1 1,976 1,399 3,376Romanian new leu - 473 702 1,175Russian ruble 156 1,387 (69) 1,474Singapore dollar - - (1,480) (1,480)South African rand 34 3,431 85 3,550Thai baht - 2,100 697 2,797Turkish lira 34 3,706 (1,045) 2,695US dollar 2,004 - (2,918) (914)
Total 2,307 31,532 (245) 33,594
217
Notes to the Financial Statements (continued)
as at 31 July 2017
First State Emerging Markets Local Currency Bond Fund
(c)
Total TotalCurrency $'000 $'000Sterling 9,213 (237)Argentine peso 1,777 -Brazilian real 4,850 3,640Colombian peso 3,737 2,351Czech Republic koruna 3,007 -Egyptian pound 408 -Euro 5,474 (157)Hungarian forint 1,760 1,859Indian rupee - 637Indonesian rupiah 3,838 4,153Korean won (892) -Malaysian ringgit 2,597 3,899Mexican peso 5,216 3,970Peruvian nuevo sol 891 679Philippine peso (1,186) 127Polish zloty 3,772 3,376Romanian new leu 1,191 1,175Russian ruble 2,342 1,474Singapore dollar (1,106) (1,480)South African rand 3,200 3,550Thai baht 2,907 2,797Turkish lira 4,166 2,695Uruguayan peso 179 -
Total 57,341 34,508
(d)
Analysis of the Fund's currency exposure
The following summarises the sterling value of currencies of the Fund in which the investments, including cash, debtors and creditors, aredenominated.
As at 31 July 2017, the Fund had the following net currency exposure (excluding US dollar):
Net foreign currency assets Net foreign currency assets31 July 2017 31 July 2016
Credit risk occurs where there is a risk associated with the uncertainty of a counterparty’s ability to meet its obligations. This risk is managedby reviewing the counterparty’s credit rating, at the time of purchase and on an ongoing basis, and ensuring that the portfolio is sufficientlydiversified. The impact of movements in credit rating and spread, and their effect on market prices, is considered to be part of market-pricerisk, which is discussed above.
The Fund’s investments and cash are held on its behalf by State Street Bank and Trust Company (acting as agent), the custodian to the Trust,and its appointed sub custodians. Bankruptcy or insolvency of the custodian or its sub custodians may cause the Fund’s rights with respect tosecurities to be delayed. This risk is managed through ongoing monitoring of the custodian and periodic reviews of its procedures forselecting and monitoring sub custodians, together with ad hoc reviews of custodian and sub custodian credit ratings.Certain transactions in securities that the Trust enters into expose it to the risk that the counterparty will not deliver the investment (purchase)or cash (sale) after the fund has fulfilled its responsibilities.
The Investment Adviser selects acceptable counterparties through which investments are bought and sold. The Manager has responsibility formonitoring the process by which these counterparties are selected to minimise risk. Where the Investment Managers make an investment in a bond with credit risk, that credit risk is assessed and then compared to theprospective investment return of the security in question. The risk is managed by reviewing the credit ratings of those bonds at the time ofpurchase and on an ongoing basis.
Credit risk
218
Notes to the Financial Statements (continued)
as at 31 July 2017
First State Emerging Markets Local Currency Bond Fund
Rating Block
31 July 2017 31 July 2016$'000 $'000
Investment-grade bonds 27,474 25,774Non-investment-grade bonds 6,380 5,758Unrated bonds 1,728 -Total bonds 35,582 31,532Other 2,179 2,062Net assets 37,761 33,594
(e)
Relative VaR Utilisation 01 August 2016 to 31 July 2017Low 47.19%High 60.05%Average 52.24%
Financial derivative instruments exposure as at 31 July 2017 Value ($)Forward foreign currency contracts (hedging) 23,229,526 Total financial derivative instruments exposure 23,229,526
Efficient portfolio management techniques as at 31 July 2017 Value ($)Underlying exposure obtained through efficient portfolio management techniques 23,229,526
Value ($)104,444
80,987(32,342)45,155
4,063
Derivative riskThe Manager may enter into derivatives transactions for investment purposes and for efficient portfolio management purposes. A relativelysmall market movement may have a potentially larger impact on derivatives than on the underlying assets, and the use of derivatives cantherefore increase the volatility of the value of units in the Scheme. However, it is not anticipated that the use of derivatives will have asignificant effect on the risk profile of the Scheme.
Exposure to the various markets may be balanced through tactical asset allocation of futures contracts. Tactical asset allocation is a techniquethat allows the ACD to undertake a switch in the Fund's exposure by the use of derivatives rather than through the sale and purchase by theFund of transferable securities.
Due to the use of derivatives, the percentage movements in the value of the Fund will be different from the percentage movements in themarkets.
Summary of Investment Assets by Credit Ratings
The credit ratings used in the above table have been supplied by Standard & Poor’s, Moody’s or Fitch Ratings.
Due to the level of investment in derivatives, the First State Emerging Market Local Currency Bond Fund is considered to be a sophisticatedfund; for this reason, further numerical analysis has been provided in the form of a ‘Value at Risk’ (VaR) analysis, shown below.
It is important to note that VaR is calculated on an ex ante basis. This means that the calculations are based on the current portfolio holdings and not by reference to the volatility of the historical portfolio returns.
Effective Portfolio Management
Counterparties to financial derivative instruments and efficient portfolio management techniques as at 31 July 2017
The counterparty exposure represents the unrealised profit or loss on the derivative contract. It is therefore a different amount to the value of the sum of the notionals.
The financial derivative instruments exposure represents the value of what is "economically commanded" by the instrument and is calculatedas the sum of the notional value of the instrument, i.e. the number of contracts multiplied by the relevant index or spot price.
BNP ParibasHSBC BankJP Morgan SecuritiesStandard CharteredUBS London
219

Notes to the Financial Statements (continued)
as at 31 July 2017
First State Emerging Markets Local Currency Bond Fund
13.
14.
%0.600.600.600.60
-
31 July 2016 31 July 2017
Opening shares in issue Creations Cancellations
Shares converted
Closing shares in issue
11,125,160 743,462 - - 11,868,6227,044,149 464,642 (118,556) - 7,390,2356,908,082 2,065,971 - - 8,974,0538,656,071 582,548 - - 9,238,619
100,050 - - - 100,050
15.
16.
Assets Liabilities Assets Liabilities
$'000 $'000 $'000 $'000- - - -
36,517 (364) 31,704 (311)- - - -
36,517 (364) 31,704 (311)
Related parties
First State Investments (UK) Limited ("the ACD") is a related party to the Fund as defined by Financial Reporting Standard 8 ‘Related Party Disclosures’ and FRS 102 Section 33 'Related Party Disclosures'. By virtue of the regulations governing open-ended investment companies, the ACD is party to every transaction in respect of shares of the Fund, which are summarised in the ‘Statement of Change in Net Assets Attributable to Shareholders’. Amounts due at the year end in respect of issues and cancellations are included in the Balance Sheet.
As at 31 July 2017, Colonial First State Managed Infrastructure Limited, a related party of the ACD, owned 75.00% (31/07/16: 77.37%) ofthe net asset value of the Fund.
As at 31 July 2017, First State Investments Services (UK) Limited, a related party of the ACD, owned 0.38% (31/07/16: 0.75%) of the netasset value of the Fund.
Share classes
The Fund has five share classes in issue.
Amounts paid to First State Investments (UK) Limited in respect of ACD fees are disclosed in note 4, with $19,525 (31/07/16: $16,460) dueat the year end.
Share class B Hedged Income (EUR share class):Share class Z Gross Accumulation:
The ACD's periodic charge on each share class is as follows:
Share class B Income (Institutional):Share class B Income (GBP share class):Share class B Hedged Income (GBP share class):
All share classes have the same rights on winding up.
Reconciliation of the shares movement in the year:
Share class B IncomeShare class B Income (GBP share class)
The net asset value of each share class, the net asset value per share and the number of shares in each class are given in the ComparativeTable on pages 205 to 209.
The distributions per share class are given in the Distribution Tables on pages 221 to 222.
Share class B Hedged Income (GBP share class)Share class B Hedged Income (EUR share class)Share class Z Gross Accumulation
Level 3: inputs are unobservable (i.e. market data is unavailable) for the asset or liability. Over the Counter (OTC) derivatives (including equityswaps) are held at fair value, which is determined by valuation techniques or single broker quotes.
* The comparative figures for 2016 have been restated to correct prior year disclosure.
Level 1Level 2*Level 3
Total fair value
Level 1: the unadjusted quoted price in an active market for identical assets or liabilities that the entity can access at the measurement date. Level 2: inputs other than quoted prices included within Level 1 that are observable (i.e. developed using market data) for the asset or liability,either directly or indirectly.
Fair value
Valuation technique
31 July 2017 31 July 2016
Post Balance Sheet events
The Authorised Corporate Director intends to terminate this fund within one year of the date of approval of the financial statements.
220
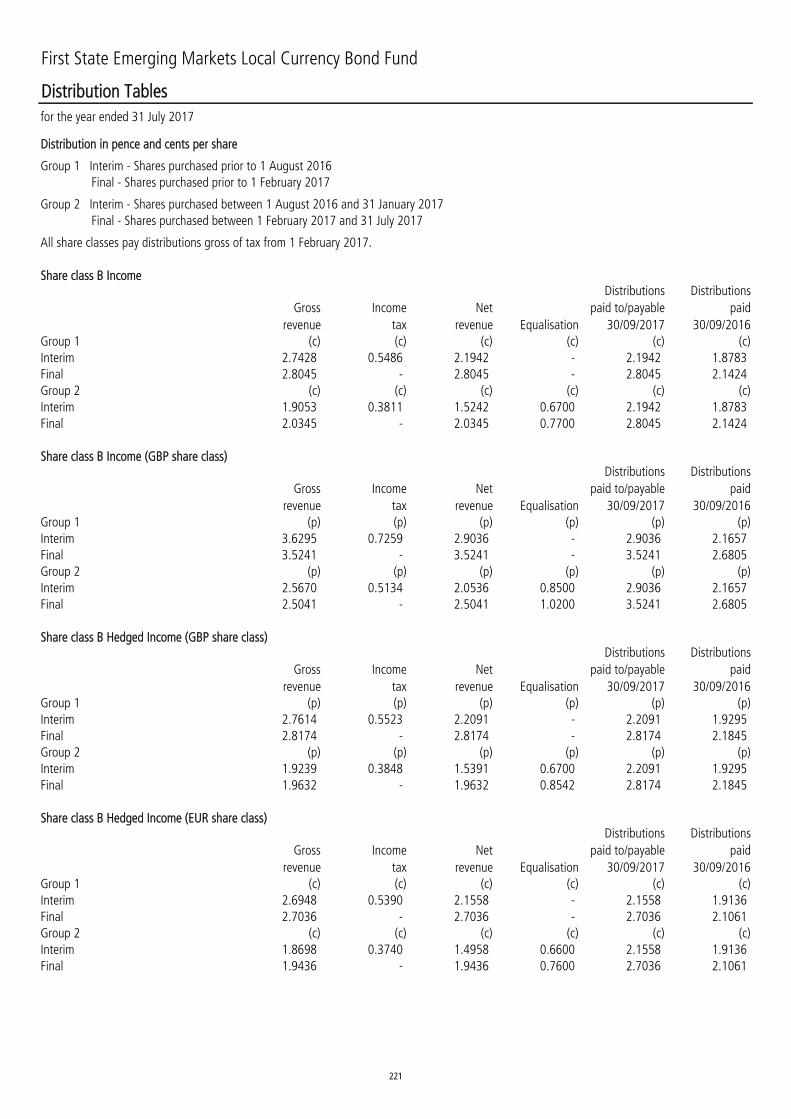
Share class B Income
Grossrevenue
Incometax
Netrevenue Equalisation
Distributions paid to/payable
30/09/2017
Distributions paid
30/09/2016Group 1 (c) (c) (c) (c) (c) (c)Interim 2.7428 0.5486 2.1942 - 2.1942 1.8783Final 2.8045 - 2.8045 - 2.8045 2.1424Group 2 (c) (c) (c) (c) (c) (c)Interim 1.9053 0.3811 1.5242 0.6700 2.1942 1.8783Final 2.0345 - 2.0345 0.7700 2.8045 2.1424
Share class B Income (GBP share class)
Grossrevenue
Incometax
Netrevenue Equalisation
Distributions paid to/payable
30/09/2017
Distributions paid
30/09/2016Group 1 (p) (p) (p) (p) (p) (p)Interim 3.6295 0.7259 2.9036 - 2.9036 2.1657Final 3.5241 - 3.5241 - 3.5241 2.6805Group 2 (p) (p) (p) (p) (p) (p)Interim 2.5670 0.5134 2.0536 0.8500 2.9036 2.1657Final 2.5041 - 2.5041 1.0200 3.5241 2.6805
Share class B Hedged Income (GBP share class)
Grossrevenue
Incometax
Netrevenue Equalisation
Distributions paid to/payable
30/09/2017
Distributions paid
30/09/2016Group 1 (p) (p) (p) (p) (p) (p)Interim 2.7614 0.5523 2.2091 - 2.2091 1.9295Final 2.8174 - 2.8174 - 2.8174 2.1845Group 2 (p) (p) (p) (p) (p) (p)Interim 1.9239 0.3848 1.5391 0.6700 2.2091 1.9295Final 1.9632 - 1.9632 0.8542 2.8174 2.1845
Share class B Hedged Income (EUR share class)
Grossrevenue
Incometax
Netrevenue Equalisation
Distributions paid to/payable
30/09/2017
Distributions paid
30/09/2016Group 1 (c) (c) (c) (c) (c) (c)Interim 2.6948 0.5390 2.1558 - 2.1558 1.9136Final 2.7036 - 2.7036 - 2.7036 2.1061Group 2 (c) (c) (c) (c) (c) (c)Interim 1.8698 0.3740 1.4958 0.6600 2.1558 1.9136Final 1.9436 - 1.9436 0.7600 2.7036 2.1061
First State Emerging Markets Local Currency Bond Fund
Distribution Tablesfor the year ended 31 July 2017
Group 1 Interim - Shares purchased prior to 1 August 2016
Distribution in pence and cents per share
Group 2 Interim - Shares purchased between 1 August 2016 and 31 January 2017
Final - Shares purchased prior to 1 February 2017
Final - Shares purchased between 1 February 2017 and 31 July 2017
All share classes pay distributions gross of tax from 1 February 2017.
221
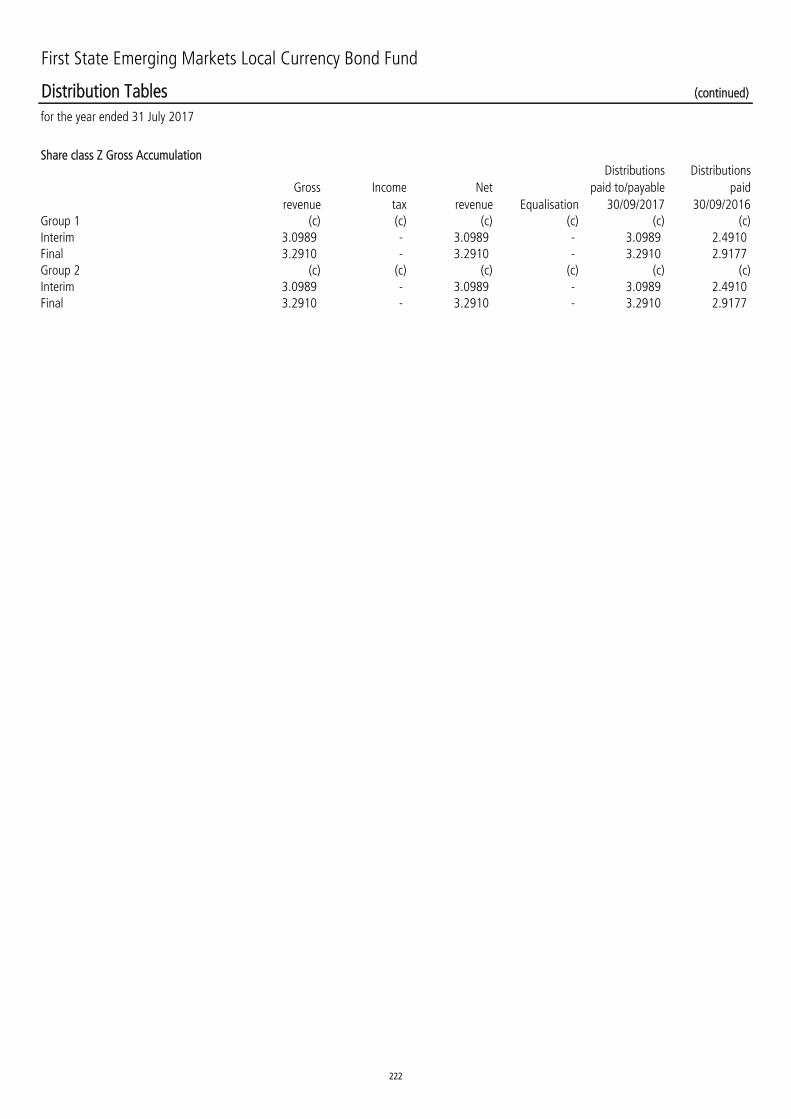
First State Emerging Markets Local Currency Bond Fund
Distribution Tables (continued)
for the year ended 31 July 2017
Share class Z Gross Accumulation
Grossrevenue
Incometax
Netrevenue Equalisation
Distributions paid to/payable
30/09/2017
Distributions paid
30/09/2016Group 1 (c) (c) (c) (c) (c) (c)Interim 3.0989 - 3.0989 - 3.0989 2.4910Final 3.2910 - 3.2910 - 3.2910 2.9177Group 2 (c) (c) (c) (c) (c) (c)Interim 3.0989 - 3.0989 - 3.0989 2.4910Final 3.2910 - 3.2910 - 3.2910 2.9177
222
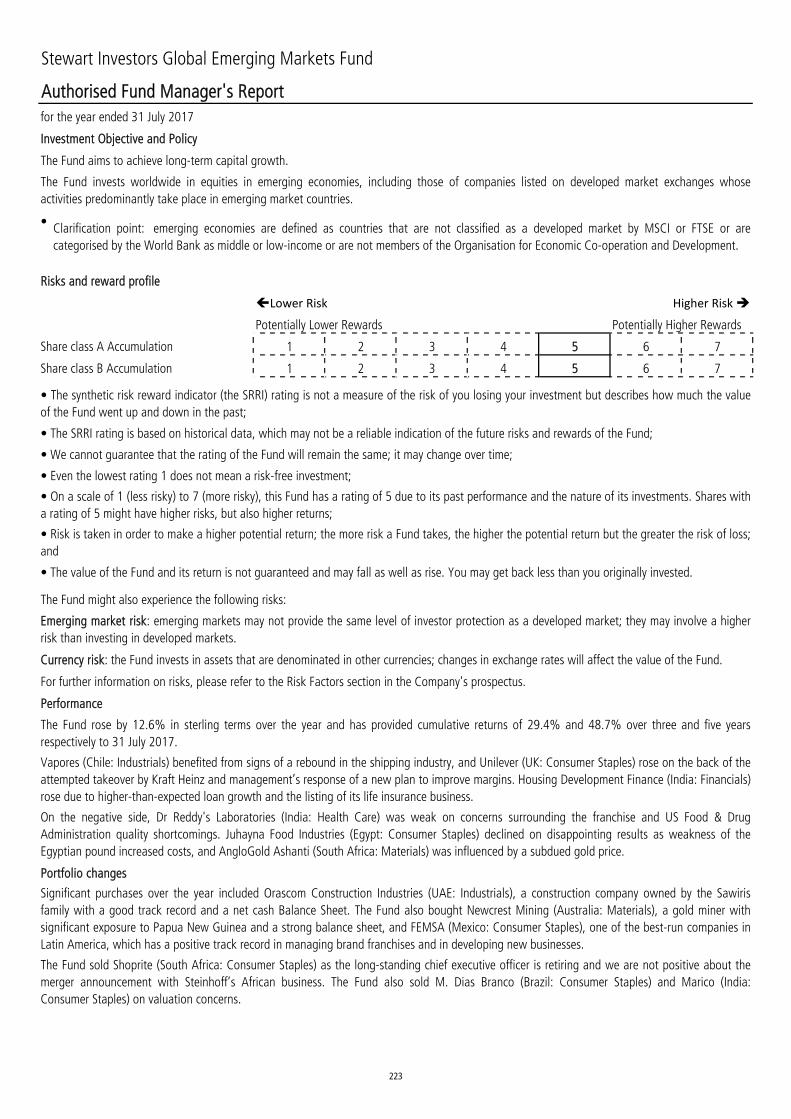
•
Risks and reward profile
Lower Risk Higher Risk
Potentially Lower Rewards Potentially Higher Rewards
1 2 3 4 5 6 7
1 2 3 4 5 6 7
Stewart Investors Global Emerging Markets Fund
Authorised Fund Manager's Reportfor the year ended 31 July 2017
Investment Objective and Policy
The Fund aims to achieve long-term capital growth.
The Fund invests worldwide in equities in emerging economies, including those of companies listed on developed market exchanges whoseactivities predominantly take place in emerging market countries.
Clarification point: emerging economies are defined as countries that are not classified as a developed market by MSCI or FTSE or arecategorised by the World Bank as middle or low-income or are not members of the Organisation for Economic Co-operation and Development.
Share class A Accumulation
Share class B Accumulation
• The synthetic risk reward indicator (the SRRI) rating is not a measure of the risk of you losing your investment but describes how much the valueof the Fund went up and down in the past;
• The SRRI rating is based on historical data, which may not be a reliable indication of the future risks and rewards of the Fund;
• We cannot guarantee that the rating of the Fund will remain the same; it may change over time;
Emerging market risk: emerging markets may not provide the same level of investor protection as a developed market; they may involve a higherrisk than investing in developed markets.
Currency risk: the Fund invests in assets that are denominated in other currencies; changes in exchange rates will affect the value of the Fund.
• Even the lowest rating 1 does not mean a risk-free investment;
• On a scale of 1 (less risky) to 7 (more risky), this Fund has a rating of 5 due to its past performance and the nature of its investments. Shares witha rating of 5 might have higher risks, but also higher returns;
• Risk is taken in order to make a higher potential return; the more risk a Fund takes, the higher the potential return but the greater the risk of loss;and
• The value of the Fund and its return is not guaranteed and may fall as well as rise. You may get back less than you originally invested.
The Fund might also experience the following risks:
For further information on risks, please refer to the Risk Factors section in the Company's prospectus.
Performance
The Fund rose by 12.6% in sterling terms over the year and has provided cumulative returns of 29.4% and 48.7% over three and five yearsrespectively to 31 July 2017.
Vapores (Chile: Industrials) benefited from signs of a rebound in the shipping industry, and Unilever (UK: Consumer Staples) rose on the back of theattempted takeover by Kraft Heinz and management’s response of a new plan to improve margins. Housing Development Finance (India: Financials)rose due to higher-than-expected loan growth and the listing of its life insurance business.
On the negative side, Dr Reddy's Laboratories (India: Health Care) was weak on concerns surrounding the franchise and US Food & DrugAdministration quality shortcomings. Juhayna Food Industries (Egypt: Consumer Staples) declined on disappointing results as weakness of theEgyptian pound increased costs, and AngloGold Ashanti (South Africa: Materials) was influenced by a subdued gold price.
Portfolio changes
Significant purchases over the year included Orascom Construction Industries (UAE: Industrials), a construction company owned by the Sawirisfamily with a good track record and a net cash Balance Sheet. The Fund also bought Newcrest Mining (Australia: Materials), a gold miner withsignificant exposure to Papua New Guinea and a strong balance sheet, and FEMSA (Mexico: Consumer Staples), one of the best-run companies inLatin America, which has a positive track record in managing brand franchises and in developing new businesses.
The Fund sold Shoprite (South Africa: Consumer Staples) as the long-standing chief executive officer is retiring and we are not positive about themerger announcement with Steinhoff’s African business. The Fund also sold M. Dias Branco (Brazil: Consumer Staples) and Marico (India:Consumer Staples) on valuation concerns.
223

(continued)
Stewart Investors Global Emerging Markets Fund
Authorised Fund Manager's Reportfor the year ended 31 July 2017
Time 3 6 1 3 5 10 Sinceperiod mths mths yr yrs yrs yrs launch
2.2 6.6 12.6 29.4 48.7 156.0 1,312.8 8.1 13.5 25.7 37.4 50.0 87.5 568.6 2.1 3.5 9.8 23.3 43.2 65.2 958.6
2 2 2 2 2 1 2
12 mths to 12 mths to 12 mths to 12 mths to 12 mths to31/07/17 31/07/16 31/07/15 31/07/14 31/07/13
12.6 21.5 (5.4) 0.3 14.5
31 July 2017 31 July 2016% of Fund % of Fund
5.95 5.583.51 3.543.50 2.743.48 2.572.48 2.482.25 2.262.13 2.232.12 2.172.00 2.171.91 1.97
Outlook
Valuations across emerging markets are fair or full for many of the companies the Manager admires. Areas of comparatively better value, especiallywith quality in mind, include Indian IT outsourcing companies and some domestic-focused South African companies. Some areas of the universethat provided a brief opportunity to build positions – Mexico towards the end of 2016, for example – are once again more fully valued.
Cumulative performance as at 31 July 2017
Fund return %
TimeperiodFund return %
Benchmark: MSCI Emerging Markets Index.Sector: IA Global Emerging Markets.
Benchmark return %Sector return %Quartile ranking
Discrete performance as at 31 July 2017
Stock name Stock nameUnited States Treasury Bill 0% 21/09/2017 Unilever
Past performance should not be used as a guide to future performance, which is not guaranteed.
Ten largest holdings
Tata Consultancy Services Coca-Cola HBCEnka Insaat ve Sanayi Tiger BrandsPZ Cussons Tech Mahindra
Housing Development Finance Uni-President EnterprisesUnilever Housing Development FinanceUni-President Enterprises Standard Bank Group
Types of sharesAccumulation.
Fomento Economico Mexicano ADR DuratexStandard Bank Group Shoprite HoldingsGrupo Financiero Santander Mexico ADR Inversiones Aguas Metropolitanas
224
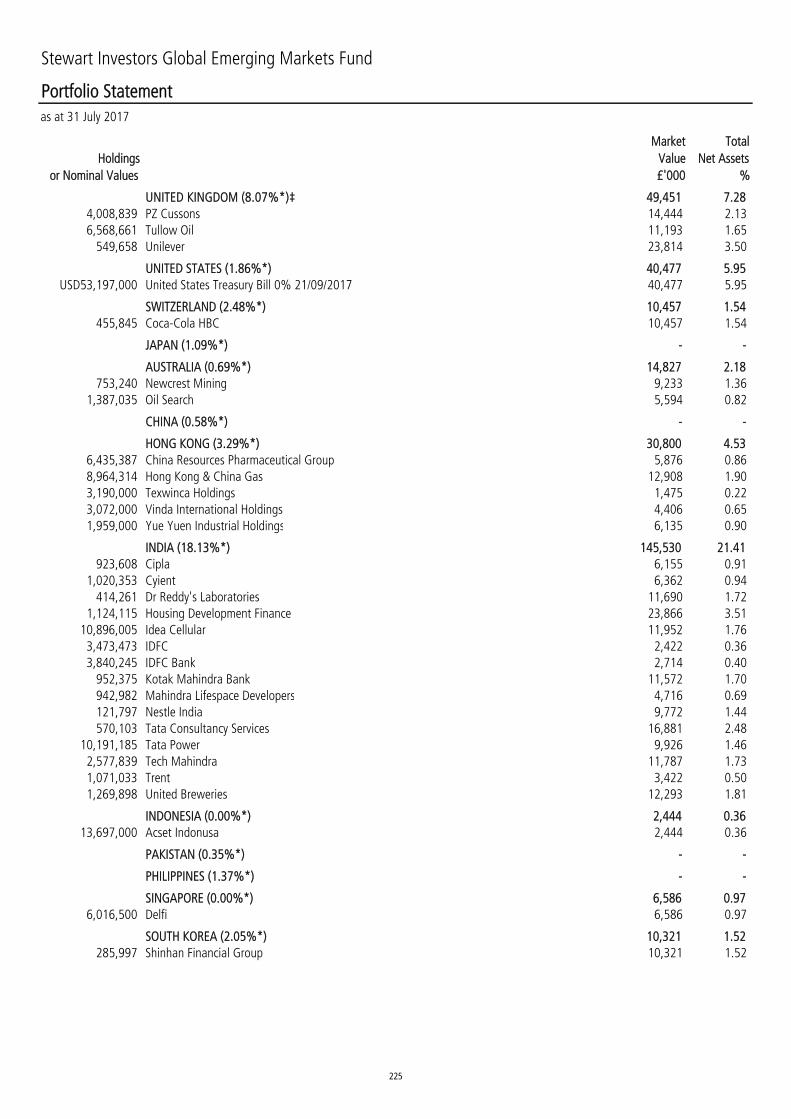
Holdingsor Nominal Values
MarketValue£'000
TotalNet Assets
%
UNITED KINGDOM (8.07%*)‡ 49,451 7.284,008,839 PZ Cussons 14,444 2.136,568,661 Tullow Oil 11,193 1.65
549,658 Unilever 23,814 3.50
UNITED STATES (1.86%*) 40,477 5.95USD53,197,000 United States Treasury Bill 0% 21/09/2017 40,477 5.95
SWITZERLAND (2.48%*) 10,457 1.54455,845 Coca-Cola HBC 10,457 1.54
JAPAN (1.09%*) - -
AUSTRALIA (0.69%*) 14,827 2.18753,240 Newcrest Mining 9,233 1.36
1,387,035 Oil Search 5,594 0.82
CHINA (0.58%*) - -
HONG KONG (3.29%*) 30,800 4.536,435,387 China Resources Pharmaceutical Group 5,876 0.868,964,314 Hong Kong & China Gas 12,908 1.903,190,000 Texwinca Holdings 1,475 0.223,072,000 Vinda International Holdings 4,406 0.651,959,000 Yue Yuen Industrial Holdings 6,135 0.90
INDIA (18.13%*) 145,530 21.41923,608 Cipla 6,155 0.91
1,020,353 Cyient 6,362 0.94414,261 Dr Reddy's Laboratories 11,690 1.72
1,124,115 Housing Development Finance 23,866 3.5110,896,005 Idea Cellular 11,952 1.76
3,473,473 IDFC 2,422 0.363,840,245 IDFC Bank 2,714 0.40
952,375 Kotak Mahindra Bank 11,572 1.70942,982 Mahindra Lifespace Developers 4,716 0.69121,797 Nestle India 9,772 1.44570,103 Tata Consultancy Services 16,881 2.48
10,191,185 Tata Power 9,926 1.462,577,839 Tech Mahindra 11,787 1.731,071,033 Trent 3,422 0.501,269,898 United Breweries 12,293 1.81
INDONESIA (0.00%*) 2,444 0.3613,697,000 Acset Indonusa 2,444 0.36
PAKISTAN (0.35%*) - -
PHILIPPINES (1.37%*) - -
SINGAPORE (0.00%*) 6,586 0.976,016,500 Delfi 6,586 0.97
SOUTH KOREA (2.05%*) 10,321 1.52285,997 Shinhan Financial Group 10,321 1.52
Stewart Investors Global Emerging Markets Fund
Portfolio Statementas at 31 July 2017
225

Holdingsor Nominal Values
MarketValue£'000
TotalNet Assets
%
Stewart Investors Global Emerging Markets Fund
Portfolio Statement (continued)
as at 31 July 2017
TAIWAN (6.12%*) 47,235 6.952,256,000 Chroma ATE 5,437 0.802,987,000 Merida Industry 10,892 1.601,122,776 President Chain Store 7,253 1.07
16,245,104 Uni-President Enterprises 23,653 3.48
EGYPT (1.34%*) 5,194 0.7617,936,021 Juhayna Food Industries 5,194 0.76
KENYA (0.00%*) 3,951 0.5813,315,800 KCB Group 3,951 0.58
NIGERIA (2.38%*) 25,842 3.80125,779,941 Guaranty Trust Bank 10,239 1.51
709,429 Guaranty Trust Bank GDR 2,898 0.433,153,943 Guinness Nigeria 428 0.062,037,436 Guinness Nigeria Rights Expiry 30/08/2017 - -
15,706,810 Lafarge Africa 1,933 0.289,558,151 Nigerian Breweries 3,275 0.48
41,313,903 UAC of Nigeria 1,428 0.2168,409,096 Unilever Nigeria 5,641 0.8335,471,383 Unilever Nigeria Rights Expiry 08/09/2017 - -
OMAN (0.30%*) - -
POLAND (1.25%*) - -
RUSSIA (0.50%*) - -
SOUTH AFRICA (12.87%*) 63,849 9.402,375,995 Adcock Ingram Holdings 8,789 1.28
132,514 Adcock Ingram Holdings Warrants Expiry 26/07/2019 67 0.015,399,089 African Oxygen 5,835 0.87
862,909 AngloGold Ashanti 6,637 0.987,252,678 Grindrod 5,166 0.761,171,140 Impala Platinum Holdings 2,448 0.367,734,435 Nampak 8,628 1.271,428,417 Standard Bank Group 13,594 2.00
546,248 Tiger Brands 12,685 1.87
TURKEY (3.29%*) 28,444 4.181,660,429 Anadolu Efes Biracilik Ve Malt Sanayii 7,494 1.10
12,854,466 Enka Insaat ve Sanayi 15,280 2.251,012,131 Yazicilar Holdings 5,670 0.83
UAE (0.00%*) 9,855 1.451,930,401 Orascom Construction 9,855 1.45
BRAZIL (10.05%*) 51,300 7.551,372,932 Banco Bradesco 9,885 1.454,882,191 Duratex 9,275 1.372,418,200 Klabin 9,458 1.401,642,260 Natura Cosmeticos 9,871 1.45
852,992 Porto Seguro 6,462 0.95394,820 WEG 1,798 0.26535,808 Wilson Sons BDR 4,551 0.67
226
Holdingsor Nominal Values
MarketValue£'000
TotalNet Assets
%
Stewart Investors Global Emerging Markets Fund
Portfolio Statement (continued)
as at 31 July 2017
CHILE (10.56%*)‡ 72,161 10.6212,869,258 Aguas Andinas 'A' Shares 6,090 0.90
940,438 Antofagasta 8,948 1.321,199,205 Cia Cervecerias Unidas 12,049 1.77
253,765,516 Cia Sud Americana de Vapores 8,891 1.319,676,378 Inversiones Aguas Metropolitanas 12,666 1.865,137,064 Quinenco 10,958 1.61
72,353,698 Sociedad Matriz SAAM 5,769 0.854,716,133 SONDA 6,790 1.00
COLOMBIA (1.19%*) - -
MEXICO (1.82%*) 36,113 5.31186,819 Fomento Economico Mexicano ADR 14,420 2.12
1,694,539 Grupo Financiero Santander Mexico ADR 13,002 1.915,133,281 Grupo Herdez 8,691 1.28
Portfolio of investments 654,837 96.34
Net other assets 24,895 3.66
Total net assets 679,732 100.00
‡ Since the previous report, the Country Sector Classification headings have been updated by data providers. The current holdings and comparativeholdings have been restated as appropriate.
Stock shown as ADRs, GDRs and BDRs represent American Depositary Receipts, Global Depositary Receipts and Brazilian Depositary Receipts,respectively.
All investments held are listed, unless otherwise stated.
* Comparative figures shown in brackets relate to 31 July 2016.For the purposes of the portfolio holdings analysis, securities are shown based on their country of listing.
227

Share class A Accumulation
Change in net assets per share
Opening net asset value per share
Return before operating charges*
Operating charges
Return after operating charges*
Distributions
Retained distributions on accumulation shares
Closing net asset value per share (p)
* after direct transaction costs of:
Performance
Return after charges (%)
Other information
Closing net asset value (£’000)
Closing number of shares
Operating charges
Direct transaction costs
Prices
Highest share price
Lowest share price
Stewart Investors Global Emerging Markets Fund
Comparative Tablefor the year ended 31 July 2017
Net Asset Value and Ongoing Charges Figure
Final 31 July 2017(p)
Final 31 July 2016(p)
Final 31 July 2015(p)
702.30 578.00 611.19
88.60 124.30 (33.19)
(1.98) (1.94) (3.58)
102.79 135.32 (21.45)
(14.19) (11.02) (11.74)
790.90 702.30 578.00
0.91 0.60 0.54
1.98 1.94 3.58
47,696 48,051 56,939
6,030,570 6,841,976 9,850,975
12.62% 21.51% (5.43)%
0.12% 0.10% 0.09%
803.40 710.10 663.38
1.89% 1.89% 1.89%
686.02 517.46 576.35
228

Stewart Investors Global Emerging Markets Fund
Comparative Table (continued)
for the year ended 31 July 2017
Net Asset Value and Ongoing Charges Figure
Share class B Accumulation
Change in net assets per share
Opening net asset value per share
Return before operating charges*
Operating charges
Return after operating charges*
Distributions
Retained distributions on accumulation shares
Closing net asset value per share (p)
* after direct transaction costs of:
Performance
Return after charges (%)
Other information
Closing net asset value (£’000)
Closing number of shares
Operating charges
Direct transaction costs
Prices
Highest share price
Lowest share price
Final 31 July 2017(p)
Final 31 July 2016(p)
Final 31 July 2015(p)
784.78 641.03 673.78
105.58 143.75 (32.75)
(8.49) (7.21) (8.12)
114.84 150.83 (25.34)
(9.26) (7.08) (7.41)
890.36 784.78 641.03
1.02 0.67 0.60
8.49 7.21 8.12
632,036 831,725 642,041
70,986,300 105,982,561 100,157,728
13.45% 22.42% (4.86)%
0.12% 0.10% 0.09%
904.23 793.43 734.24
1.09% 1.09% 1.08%
768.59 575.96 636.77
229
Notes £'000 £'000 £'000 £'000
Net capital gains 2 83,139 152,183
Revenue 3 15,746 17,177
4 (8,063) (8,133)
Interest payable and similar charges (5) -
7,678 9,044
5 (1,943) (1,429)
5,735 7,615
88,874 159,798
6 (6,911) (7,666)
81,963 152,132
£'000 £'000 £'000 £'000
879,776 698,980
- 7,919
23,376 34,901
(312,921) (21,996)
(289,545) 12,905
1,270 152
81,963 152,132
6,268 7,688
679,732 879,776
31 July 2017 31 July 2016
Stewart Investors Global Emerging Markets Fund
Statement of Total Returnfor the year ended 31 July 2017
Statement of Change in Net Assets Attributable to Shareholders
Income
Expenses
Net revenue before taxation
Taxation
Net revenue after taxation
Total return before distributions
Distribution
Change in net assets attributable to shareholders from investment activities
Amounts receivable on issue of shares
for the year ended 31 July 2017
31 July 2017 31 July 2016
Opening net assets attributable to shareholders
Assets transferred from other Funds*
Less: Amounts payable on cancellation of shares
Dilution adjustment
Change in net assets attributable to shareholders from investment activities
Retained distribution on accumulation shares
Closing net assets attributable to shareholders
*Relating to the transfer of assets from an external party.
Notes to the Financial Statements are on pages 232 to 237.
230
Stewart Investors Global Emerging Markets Fund
31 July 2017 31 July 2016Notes £'000 £'000
Investments 654,837 806,150
Current assets
8 812 6,044
25,715 70,494
681,364 882,688
Creditors
Other creditors 9 (1,632) (2,912)
(1,632) (2,912)
679,732 879,776
Balance Sheetas at 31 July 2017
Assets
Fixed assets
Debtors
Cash and bank balances
Total assets
Liabilities
Notes to the Financial Statements are on pages 232 to 237.
Total liabilities
Net assets attributable to shareholders
231
1.
2.
31 July 2017 31 July 2016£'000 £'000
84,223 149,321(3) (2)
(1,081) 2,864
83,139 152,183
3.
31 July 2017 31 July 2016£'000 £'0001,538 1,761(172) 173
12,888 13,82156 113
6 13115 42
1,218 1,18297 72
15,746 17,177
4.
31 July 2017 31 July 2016£'000 £'000
7,352 7,463
105 94
11 947 58
380 370168 139
606 576
8,063 8,133
Accounting basis and policies
Please see pages 9 to 11 for accounting basis and policies.
Net capital gains
The net capital gains during the year comprise:
Non-derivative securities
Notes to the Financial Statementsas at 31 July 2017
Stewart Investors Global Emerging Markets Fund
Net capital gains
Revenue
Forward foreign exchange currency contractsCurrency (losses)/gains
Overseas scrip dividends
Dividends from UK companiesOverseas taxable revenueOverseas non-taxable revenue
Interest from bank depositsInterest from government and fixed-interest securities
Initial Charge Revenue
Total revenue
Interest on capital revenue from Brazilian companies
Payable to the Depositary, associates of the Depositary, and agents of either of them:Depositary's fees
Expenses
Payable to the ACD, associates of the ACD, and agents of either of them:ACD's periodic charge
Audit feeRegistrar feesSafe custody chargesOther expenses
Other expenses:
Total expenses
232
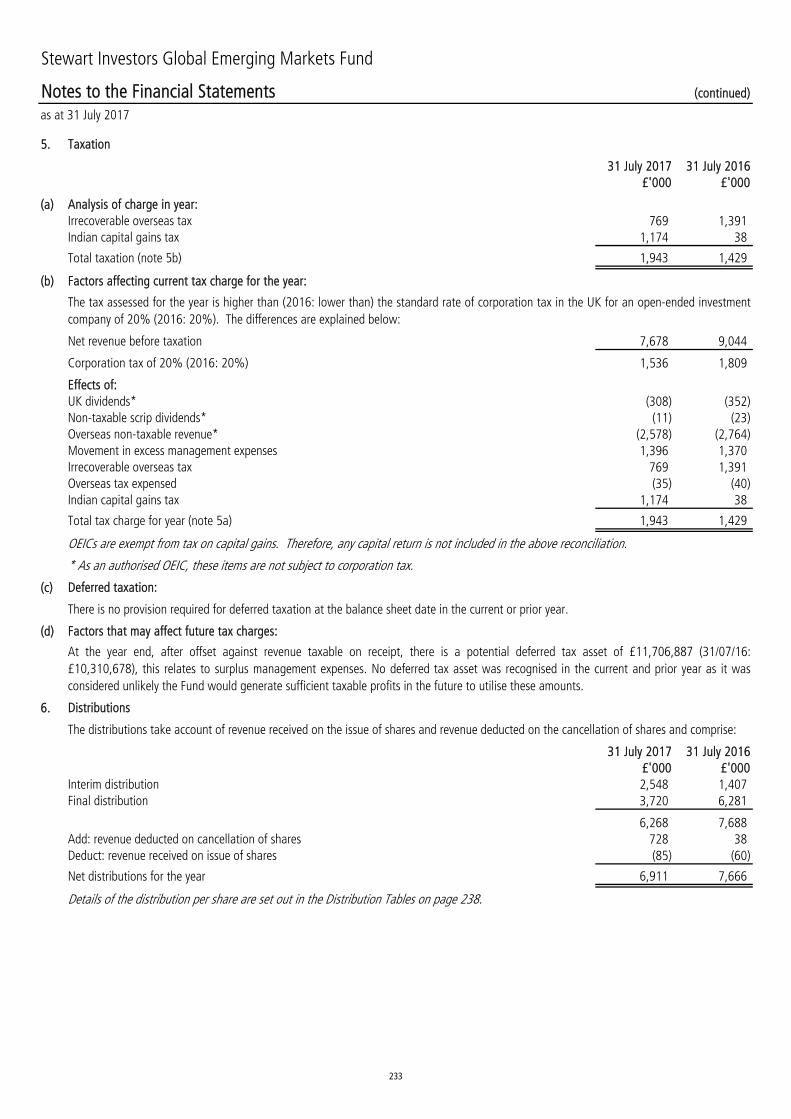
Notes to the Financial Statements (continued)
as at 31 July 2017
Stewart Investors Global Emerging Markets Fund
5.
31 July 2017 31 July 2016£'000 £'000
(a)769 1,391
1,174 38
1,943 1,429
(b)
7,678 9,044
1,536 1,809
(308) (352)(11) (23)
(2,578) (2,764)1,396 1,370
769 1,391(35) (40)
1,174 38
1,943 1,429
(c)
(d)
6.
31 July 2017 31 July 2016£'000 £'0002,548 1,4073,720 6,281
6,268 7,688728 38(85) (60)
6,911 7,666
Taxation
Irrecoverable overseas taxAnalysis of charge in year:
Indian capital gains tax
Net revenue before taxation
Corporation tax of 20% (2016: 20%)
Effects of:
Total taxation (note 5b)
Factors affecting current tax charge for the year:
The tax assessed for the year is higher than (2016: lower than) the standard rate of corporation tax in the UK for an open-ended investmentcompany of 20% (2016: 20%). The differences are explained below:
Movement in excess management expensesIrrecoverable overseas tax
UK dividends*Non-taxable scrip dividends*Overseas non-taxable revenue*
Indian capital gains taxOverseas tax expensed
Deferred taxation:
There is no provision required for deferred taxation at the balance sheet date in the current or prior year.
Total tax charge for year (note 5a)
OEICs are exempt from tax on capital gains. Therefore, any capital return is not included in the above reconciliation.
* As an authorised OEIC, these items are not subject to corporation tax.
Factors that may affect future tax charges:
At the year end, after offset against revenue taxable on receipt, there is a potential deferred tax asset of £11,706,887 (31/07/16:£10,310,678), this relates to surplus management expenses. No deferred tax asset was recognised in the current and prior year as it wasconsidered unlikely the Fund would generate sufficient taxable profits in the future to utilise these amounts.
Interim distribution
Distributions
The distributions take account of revenue received on the issue of shares and revenue deducted on the cancellation of shares and comprise:
Add: revenue deducted on cancellation of sharesDeduct: revenue received on issue of shares
Net distributions for the year
Final distribution
Details of the distribution per share are set out in the Distribution Tables on page 238.
233

Notes to the Financial Statements (continued)
as at 31 July 2017
Stewart Investors Global Emerging Markets Fund
7.
31 July 2017 31 July 2016£'000 £'0005,735 7,615
2 19Expenses charged to capital - (6)Indian capital gains tax 1,174 38
6,911 7,666
8.
31 July 2017 31 July 2016£'000 £'000
- 5,03137 12
775 1,001
812 6,044
9.
31 July 2017 31 July 2016£'000 £'000
746 1,80285 222
801 888
1,632 2,912
10.
31 July 2017 31 July 2016 31 July 2017 31 July 2016£'000 £'000 £'000 £'000
118,019 190,838 380,470 184,45776,701 48,115 50,588 34,093
194,720 238,953 431,058 218,550
126 195 (370) (181)- - - (1)
87 215 (255) (141)- - - -
213 410 (625) (323)
194,933 239,363 430,433 218,227
Movement between net revenue and net distributions
Net revenue after taxationMovement in net income as a result of conversions
Net distributions for the year
Amounts receivable for issue of sharesAccrued revenue
Debtors
Sales awaiting settlement
Total debtors
Creditors
Purchases awaiting settlementAmounts payable for cancellation of sharesAccrued expenses
Analysis of total trade costs:
Purchases Sales
EquitiesBonds
Total creditors
Portfolio transaction costs
Trades in the year before transaction costs
CommissionsEquitiesBonds
TaxesEquitiesBonds
Total costs
Total net trades in the year after transaction costs
234
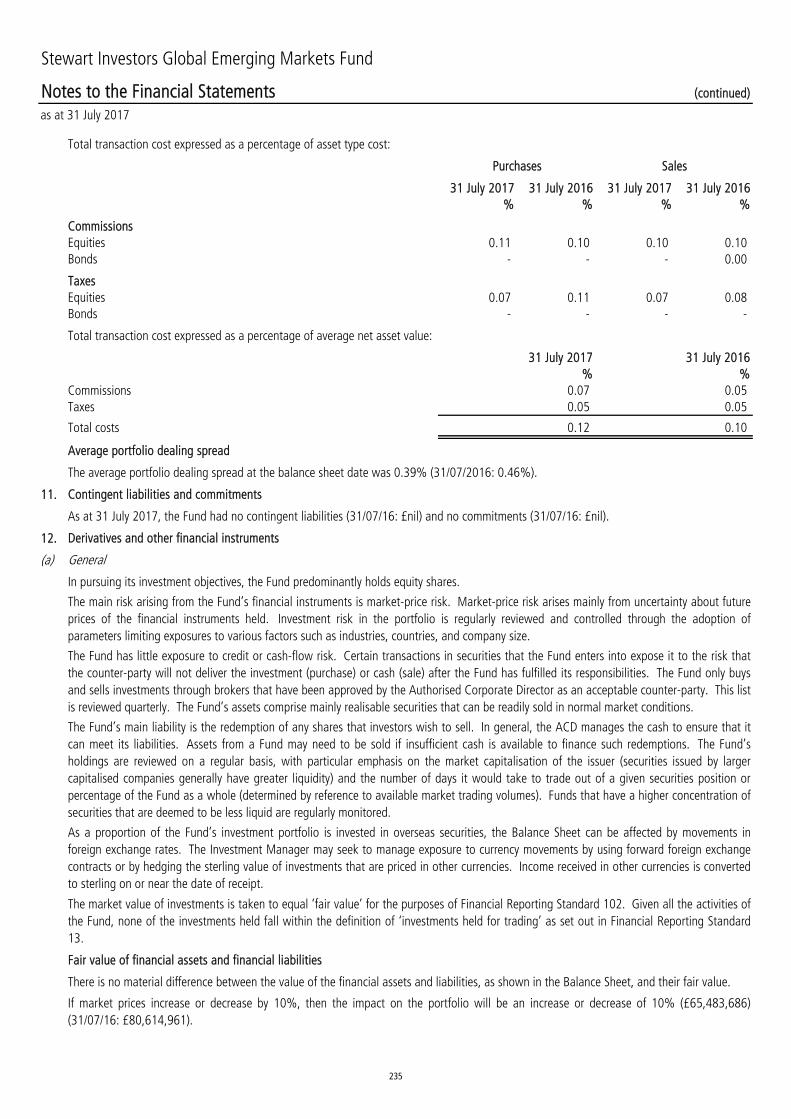
Notes to the Financial Statements (continued)
as at 31 July 2017
Stewart Investors Global Emerging Markets Fund
31 July 2017 31 July 2016 31 July 2017 31 July 2016% % % %
0.11 0.10 0.10 0.10- - - 0.00
0.07 0.11 0.07 0.08- - - -
11.
12.
(a)
CommissionsEquitiesBonds
Total transaction cost expressed as a percentage of asset type cost:
Purchases Sales
EquitiesBonds
Taxes
Commissions 0.07 0.05Taxes 0.05 0.05
Total transaction cost expressed as a percentage of average net asset value:
31 July 2017 31 July 2016% %
Total costs 0.12 0.10
Average portfolio dealing spread
Contingent liabilities and commitments
As at 31 July 2017, the Fund had no contingent liabilities (31/07/16: £nil) and no commitments (31/07/16: £nil).
The average portfolio dealing spread at the balance sheet date was 0.39% (31/07/2016: 0.46%).
The Fund’s main liability is the redemption of any shares that investors wish to sell. In general, the ACD manages the cash to ensure that itcan meet its liabilities. Assets from a Fund may need to be sold if insufficient cash is available to finance such redemptions. The Fund’sholdings are reviewed on a regular basis, with particular emphasis on the market capitalisation of the issuer (securities issued by largercapitalised companies generally have greater liquidity) and the number of days it would take to trade out of a given securities position orpercentage of the Fund as a whole (determined by reference to available market trading volumes). Funds that have a higher concentration ofsecurities that are deemed to be less liquid are regularly monitored.
As a proportion of the Fund’s investment portfolio is invested in overseas securities, the Balance Sheet can be affected by movements inforeign exchange rates. The Investment Manager may seek to manage exposure to currency movements by using forward foreign exchangecontracts or by hedging the sterling value of investments that are priced in other currencies. Income received in other currencies is convertedto sterling on or near the date of receipt.
The market value of investments is taken to equal ‘fair value’ for the purposes of Financial Reporting Standard 102. Given all the activities ofthe Fund, none of the investments held fall within the definition of ‘investments held for trading’ as set out in Financial Reporting Standard13.
Fair value of financial assets and financial liabilities
Derivatives and other financial instruments
General
In pursuing its investment objectives, the Fund predominantly holds equity shares.
The main risk arising from the Fund’s financial instruments is market-price risk. Market-price risk arises mainly from uncertainty about futureprices of the financial instruments held. Investment risk in the portfolio is regularly reviewed and controlled through the adoption ofparameters limiting exposures to various factors such as industries, countries, and company size.
The Fund has little exposure to credit or cash-flow risk. Certain transactions in securities that the Fund enters into expose it to the risk thatthe counter-party will not deliver the investment (purchase) or cash (sale) after the Fund has fulfilled its responsibilities. The Fund only buysand sells investments through brokers that have been approved by the Authorised Corporate Director as an acceptable counter-party. This listis reviewed quarterly. The Fund’s assets comprise mainly realisable securities that can be readily sold in normal market conditions.
There is no material difference between the value of the financial assets and liabilities, as shown in the Balance Sheet, and their fair value.
If market prices increase or decrease by 10%, then the impact on the portfolio will be an increase or decrease of 10% (£65,483,686)(31/07/16: £80,614,961).
235

Notes to the Financial Statements (continued)
as at 31 July 2017
Stewart Investors Global Emerging Markets Fund
(b)
(c)
Total TotalCurrency £'000 £'000Australian dollar 14,827 6,049Brazilian real 51,454 88,762Chilean peso 63,662 86,186Colombian peso - 10,462Egyptian pound 5,194 7,328Hong Kong dollar 30,800 34,281Indian rupee 146,030 171,124Indonesian rupiah 2,444 -Japanese yen - 9,062Kenyan shilling 3,951 -Mexican peso 8,691 6,679Nigerian naira 22,945 18,691Omani rial - 3,168Philippine peso - 12,035Polish zloty - 11,010Singapore dollar 6,586 -South African rand 63,095 113,331South Korean won 10,321 18,010Taiwanese dollar 47,427 54,612Turkish lira 28,444 28,907US dollar 98,985 53,888Pakistan rupee - 3,083
Total 604,856 736,668
As at 31 July 2017, 9.74% (31/07/16: 9.90%) of the Fund's assets were interest bearing.As at 31 July 2017, if interest rates increase or decrease by 0.25%, with all other variables remaining constant, the resulting change in thenet assets attributable to shareholders of the Stewart Investors Global Emerging Markets Fund would be an increase or decrease ofapproximately £165,505 (31/07/16: £217,657).
Analysis of the Fund's currency exposure
Interest-rate risk
The Fund significantly invests in either fixed or floating-rate securities, and interest-rate risk exposure is predominantly restricted to interestreceivable.
The following summarises the sterling value of currencies of the Fund in which the investments, including cash, debtors and creditors, aredenominated.
As at 31 July 2017, the Fund had the following net currency exposure (excluding sterling):
Net foreign currency assets Net foreign currency assets31 July 2017 31 July 2016
If foreign exchange rates increase or decrease by 5%, then the impact on the NAV will be an increase or decrease of 4.45% (£30,242,810)(31/07/16: 4.19% (£36,833,405)).
236
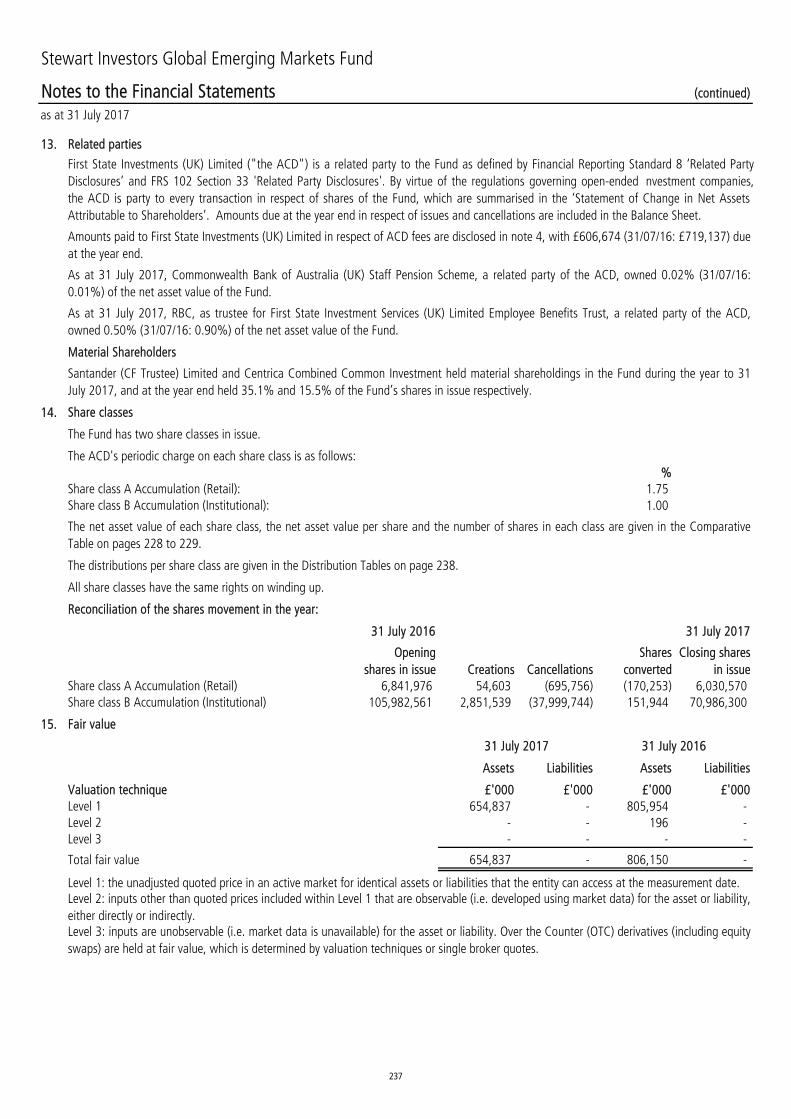
Notes to the Financial Statements (continued)
as at 31 July 2017
Stewart Investors Global Emerging Markets Fund
13.
14.
%1.751.00
31 July 2016 31 July 2017
Opening shares in issue Creations Cancellations
Shares converted
Closing shares in issue
6,841,976 54,603 (695,756) (170,253) 6,030,570105,982,561 2,851,539 (37,999,744) 151,944 70,986,300
15.
Assets Liabilities Assets Liabilities
£'000 £'000 £'000 £'000654,837 - 805,954 -
- - 196 -- - - -
654,837 - 806,150 -
Related parties
First State Investments (UK) Limited ("the ACD") is a related party to the Fund as defined by Financial Reporting Standard 8 ‘Related Party Disclosures’ and FRS 102 Section 33 'Related Party Disclosures'. By virtue of the regulations governing open-ended investment companies, the ACD is party to every transaction in respect of shares of the Fund, which are summarised in the ‘Statement of Change in Net Assets Attributable to Shareholders’. Amounts due at the year end in respect of issues and cancellations are included in the Balance Sheet.
Material Shareholders
Santander (CF Trustee) Limited and Centrica Combined Common Investment held material shareholdings in the Fund during the year to 31July 2017, and at the year end held 35.1% and 15.5% of the Fund’s shares in issue respectively.
Share classes
The Fund has two share classes in issue.
Amounts paid to First State Investments (UK) Limited in respect of ACD fees are disclosed in note 4, with £606,674 (31/07/16: £719,137) due at the year end.
As at 31 July 2017, Commonwealth Bank of Australia (UK) Staff Pension Scheme, a related party of the ACD, owned 0.02% (31/07/16:0.01%) of the net asset value of the Fund.
As at 31 July 2017, RBC, as trustee for First State Investment Services (UK) Limited Employee Benefits Trust, a related party of the ACD,owned 0.50% (31/07/16: 0.90%) of the net asset value of the Fund.
The ACD's periodic charge on each share class is as follows:
Share class A Accumulation (Retail):Share class B Accumulation (Institutional):
All share classes have the same rights on winding up.
Reconciliation of the shares movement in the year:
Share class A Accumulation (Retail)Share class B Accumulation (Institutional)
The net asset value of each share class, the net asset value per share and the number of shares in each class are given in the ComparativeTable on pages 228 to 229.
The distributions per share class are given in the Distribution Tables on page 238.
Fair value
Valuation technique
31 July 2017 31 July 2016
Level 3: inputs are unobservable (i.e. market data is unavailable) for the asset or liability. Over the Counter (OTC) derivatives (including equityswaps) are held at fair value, which is determined by valuation techniques or single broker quotes.
Level 1Level 2Level 3
Total fair value
Level 1: the unadjusted quoted price in an active market for identical assets or liabilities that the entity can access at the measurement date. Level 2: inputs other than quoted prices included within Level 1 that are observable (i.e. developed using market data) for the asset or liability,either directly or indirectly.
237
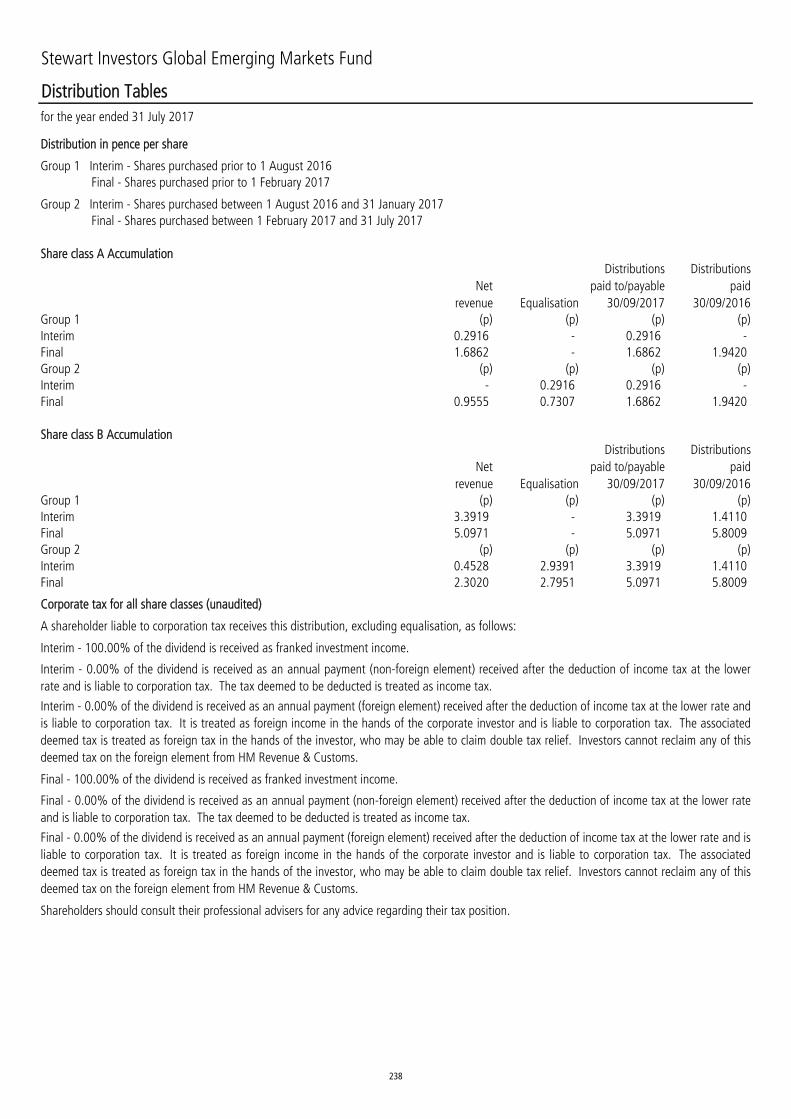
Share class A Accumulation
Netrevenue Equalisation
Distributions paid to/payable
30/09/2017
Distributions paid
30/09/2016Group 1 (p) (p) (p) (p)Interim 0.2916 - 0.2916 -Final 1.6862 - 1.6862 1.9420Group 2 (p) (p) (p) (p)Interim - 0.2916 0.2916 -Final 0.9555 0.7307 1.6862 1.9420
Share class B Accumulation
Netrevenue Equalisation
Distributions paid to/payable
30/09/2017
Distributions paid
30/09/2016Group 1 (p) (p) (p) (p)Interim 3.3919 - 3.3919 1.4110Final 5.0971 - 5.0971 5.8009Group 2 (p) (p) (p) (p)Interim 0.4528 2.9391 3.3919 1.4110Final 2.3020 2.7951 5.0971 5.8009
Stewart Investors Global Emerging Markets Fund
Distribution Tablesfor the year ended 31 July 2017
Group 1 Interim - Shares purchased prior to 1 August 2016
Distribution in pence per share
Group 2 Interim - Shares purchased between 1 August 2016 and 31 January 2017
Final - Shares purchased prior to 1 February 2017
Final - Shares purchased between 1 February 2017 and 31 July 2017
Corporate tax for all share classes (unaudited)
A shareholder liable to corporation tax receives this distribution, excluding equalisation, as follows:
Interim - 100.00% of the dividend is received as franked investment income.
Interim - 0.00% of the dividend is received as an annual payment (non-foreign element) received after the deduction of income tax at the lowerrate and is liable to corporation tax. The tax deemed to be deducted is treated as income tax.
Interim - 0.00% of the dividend is received as an annual payment (foreign element) received after the deduction of income tax at the lower rate andis liable to corporation tax. It is treated as foreign income in the hands of the corporate investor and is liable to corporation tax. The associateddeemed tax is treated as foreign tax in the hands of the investor, who may be able to claim double tax relief. Investors cannot reclaim any of thisdeemed tax on the foreign element from HM Revenue & Customs.
Shareholders should consult their professional advisers for any advice regarding their tax position.
Final - 100.00% of the dividend is received as franked investment income.
Final - 0.00% of the dividend is received as an annual payment (non-foreign element) received after the deduction of income tax at the lower rateand is liable to corporation tax. The tax deemed to be deducted is treated as income tax.
Final - 0.00% of the dividend is received as an annual payment (foreign element) received after the deduction of income tax at the lower rate and isliable to corporation tax. It is treated as foreign income in the hands of the corporate investor and is liable to corporation tax. The associateddeemed tax is treated as foreign tax in the hands of the investor, who may be able to claim double tax relief. Investors cannot reclaim any of thisdeemed tax on the foreign element from HM Revenue & Customs.
238
•
Risks and reward profile
Lower Risk Higher Risk
Potentially Lower Rewards Potentially Higher Rewards
1 2 3 4 5 6 7
1 2 3 4 5 6 7
1 2 3 4 5 6 7
1 2 3 4 5 6 7
1 2 3 4 5 6 7
• The synthetic risk reward indicator (the SRRI) rating is not a measure of the risk of you losing your investment but describes how much the valueof the Fund went up and down in the past;
• The SRRI rating is based on historical data, which may not be a reliable indication of the future risks and rewards of the Fund;
• On a scale of 1 (less risky) to 7 (more risky), this Fund has a rating of 5 due to its past performance and the nature of its investments. Shares witha rating of 5 might have higher risks, but also higher returns;
Currency risk: the Fund invests in assets that are denominated in other currencies; changes in exchange rates will affect the value of the Fund.
Emerging market risk: emerging markets may not provide the same level of investor protection as a developed market; they may involve a higherrisk than investing in developed markets.
The Fund might also experience the following risks:
• The value of the Fund and its return is not guaranteed and may fall as well as rise. You may get back less than you originally invested.
• Even the lowest rating 1 does not mean a risk-free investment;
Stewart Investors Global Emerging Markets Leaders Fund
Investment Objective and Policy
The Fund aims to achieve long-term capital growth.
for the year ended 31 July 2017
Authorised Fund Manager's Report
The Fund invests worldwide in large and mid-capitalisation equities in emerging economies, including those companies listed on developed marketexchanges whose activities predominantly take place in emerging market countries.
The Fund rose by 11.9% in sterling terms over the year and has provided cumulative returns of 32.9% and 49.8% over three and five yearsrespectively to 31 July 2017.
On the negative side, Dr Reddy's Laboratories Cosmeticos (India: Health Care) was weak on concerns surrounding the franchise and US Food &Drug Administration quality shortcomings, while Natura Cosmeticos (Brazil: Consumer Staples) experienced a difficult environment with theevolution of its business model, changes in management and a subdued consumer. Li & Fung (Hong Kong: Consumer Discretionary) declined onconcerns about the impact of the internet on its franchise as its customers are increasingly losing market share to e-commerce.
• We cannot guarantee that the rating of the Fund will remain the same; it may change over time;
For further information on risks, please refer to the Risk Factors section in the Company's prospectus.
• Risk is taken in order to make a higher potential return; the more risk a Fund takes, the higher the potential return but the greater the risk of loss;and
Performance
Antofagasta (UK: Materials) rose on increasing copper prices and strong results as production was ahead of expectations, and Unilever (UK:Consumer Staples) rose on the back of the attempted takeover by Kraft Heinz and management’s response of a new plan to improve margins.Housing Development Finance (India: Financials) climbed on higher-than-expected loan growth and the listing of its life insurance business.
Clarification point: Large and mid-capitalisation typically refers to equities with a minimum market capitalisation of US$1 billion and a minimum
free float of US$500 million. Emerging economies are defined as countries that are not classified as a developed market by MSCI or FTSE or are
categorised by the World Bank as middle or low-income or are not members of the Organisation for Economic Co-operation and Development.
Share class A Accumulation
Share class B Accumulation
Share class B Income
Share class A Accumulation (EUR share class)
Share class B Accumulation (EUR share class)
239
(continued)
Stewart Investors Global Emerging Markets Leaders Fund
for the year ended 31 July 2017
Authorised Fund Manager's Report
Time 3 6 1 3 5 10 Sinceperiod mths mths yr yrs yrs yrs launch
2.5 6.2 11.9 32.9 49.8 164.3 466.5 8.1 13.5 25.7 37.4 50.0 87.5 360.0 2.1 3.5 9.8 23.3 43.2 65.2 234.7
2 2 2 2 2 1 1
12 mths to 12 mths to 12 mths to 12 mths to 12 mths to31/07/17 31/07/16 31/07/15 31/07/14 31/07/13
11.9 20.3 (1.3) 0.2 12.5
31 July 2017 31 July 2016% of Fund % of Fund
4.57 6.28Unilever 4.06 Housing Development Finance 4.93Housing Development Finance 4.06 Tiger Brands 4.87Tata Consultancy Services 4.05 Uni-President Enterprises 4.11Tata Power 3.40 Standard Bank Group 3.81Cia Cervecerias Unidas 3.15 Banco Bradesco 3.45Remgro 2.77 Bank Pekao 2.84Grupo Financiero Santander Mexico ADR 2.72 Tata Power 2.83MediaTek 2.66 Cia Cervecerias Unidas 2.63Cipla 2.65 Infosys 2.60
Quartile rankingSector return %
Outlook
periodFund return %
Sector: IA Global Emerging Markets.
Significant purchases over the year included Cipla (India: Health Care), one of India’s oldest family-owned pharmaceutical companies, which hasproven manufacturing capabilities in generic drugs. The Fund bought Heineken (Netherlands: Consumer Staples), a global brewer with attractivelong-term growth opportunities in Nigeria, India and elsewhere in Asia, backed by a family who exhibit strong stewardship. The Fund also boughtNewcrest Mining (Australia: Materials), a gold miner with significant exposure to Papua New Guinea and a strong Balance Sheet.
Portfolio changes
Time
Income and Accumulation.
The Fund sold China Resources Beer (China: Consumer Staples) following an ownership change, as SABMiller, which we were backing, sold itsstake as part of the ABI/SABMiller deal. The Fund also sold Nestlé India (Consumer Staples) and Entel (Chile: Telecom Services) on valuationconcerns.
Discrete performance as at 31 July 2017
Fund return %Benchmark return %
Cumulative performance as at 31 July 2017
Valuations across emerging markets are fair or full for many of the companies the Manager admires. Areas of comparatively better value, especiallywith quality in mind, include Indian IT outsourcing companies and some domestic-focused South African companies. Some areas of the universethat provided a brief opportunity to build positions – Mexico towards the end of 2016, for example – are once again more fully valued.
Past performance should not be used as a guide to future performance, which is not guaranteed.
Benchmark: MSCI Emerging Markets Index.
Ten largest holdings
Stock name Stock nameUni-President Enterprises Unilever
Types of shares
240
Holdings
MarketValue£'000
TotalNet Assets
%
UNITED KINGDOM (7.15%*)‡ 153,272 5.4422,800,343 Tullow Oil 38,852 1.38
2,640,964 Unilever 114,420 4.06
NETHERLANDS (0.00%*) 54,195 1.92726,286 Heineken Holding 54,195 1.92
SWITZERLAND (2.36%*) 59,751 2.122,604,668 Coca-Cola HBC 59,751 2.12
JAPAN (1.53%*) 26,765 0.951,373,200 Unicharm 26,765 0.95
AUSTRALIA (0.00%*) 58,195 2.073,537,889 Newcrest Mining 43,365 1.543,677,005 Oil Search 14,830 0.53
CHINA (3.88%*) 53,265 1.8935,920,000 China Mengniu Dairy 53,265 1.89
HONG KONG (4.85%*) 162,475 5.7726,926,679 China Resources Pharmaceutical Group 24,588 0.8732,383,175 Hong Kong & China Gas 46,630 1.66
136,334,000 Li & Fung 37,906 1.3517,036,500 Yue Yuen Industrial Holdings 53,351 1.89
INDIA (20.41%*) 738,498 26.2311,193,580 Cipla 74,600 2.65
1,992,571 Colgate-Palmolive India 25,583 0.911,947,863 Dr Reddy's Laboratories 54,965 1.95
10,124,358 Federal Bank 13,871 0.495,386,658 Housing Development Finance 114,365 4.06
46,318,210 Idea Cellular 50,806 1.815,719,602 Infosys 68,954 2.453,035,454 Mahindra & Mahindra 50,692 1.803,855,451 Tata Consultancy Services 114,159 4.05
98,366,871 Tata Power 95,806 3.408,348,907 Tech Mahindra 38,173 1.363,773,024 United Breweries 36,524 1.30
MALAYSIA (1.04%*) 42,096 1.4951,088,113 Axiata Group 42,096 1.49
PHILIPPINES (0.99%*) - -
SINGAPORE (1.16%*) 59,632 2.129,733,900 Dairy Farm International Holdings 59,632 2.12
SOUTH KOREA (2.65%*) 110,132 3.91301,898 AMOREPACIFIC Group 24,873 0.88
12,840 KT 304 0.014,497,162 KT ADR 63,702 2.26
588,919 Shinhan Financial Group 21,253 0.76
TAIWAN (9.38%*) 267,759 9.518,351,000 Asustek Computer 59,110 2.101,363,000 Giant Manufacturing 5,090 0.18
11,166,000 MediaTek 74,950 2.6688,329,338 Uni-President Enterprises 128,609 4.57
Stewart Investors Global Emerging Markets Leaders Fund
as at 31 July 2017
Portfolio Statement
241
Holdings
MarketValue£'000
TotalNet Assets
%
Stewart Investors Global Emerging Markets Leaders Fund
as at 31 July 2017
(continued)Portfolio Statement
HUNGARY (1.03%*) - -
NIGERIA (0.44%*) 39,989 1.42287,923,554 Guaranty Trust Bank 23,438 0.83
48,300,299 Nigerian Breweries 16,551 0.59
OMAN (0.14%*) - -
POLAND (2.84%*) 58,541 2.082,157,526 Bank Pekao 58,541 2.08
RUSSIA (0.00%) 13,168 0.47475,050 Magnit GDR 13,168 0.47
SOUTH AFRICA (11.87%*) 222,221 7.89548,738 AngloGold Ashanti 4,221 0.15
6,301,958 Remgro 78,099 2.77222,511 SPAR Group 2,133 0.08
7,439,388 Standard Bank Group 70,799 2.512,883,966 Tiger Brands 66,969 2.38
TURKEY (2.88%*) 83,371 2.9612,965,749 Akbank 29,144 1.0312,016,105 Anadolu Efes Biracilik Ve Malt Sanayii 54,227 1.93
BRAZIL (8.07%*) 177,521 6.315,896,801 Banco Bradesco 42,456 1.511,254,730 Engie Brasil Energia 10,661 0.38
17,584,700 Klabin 68,778 2.449,255,031 Natura Cosmeticos 55,626 1.98
CHILE (8.03%*)‡ 142,140 5.0572,933,178 Aguas Andinas 'A' Shares 34,516 1.23
1,993,921 Antofagasta 18,972 0.678,823,165 Cia Cervecerias Unidas 88,652 3.15
MEXICO (1.93%*) 93,642 3.339,984,011 Grupo Financiero Santander Mexico ADR 76,607 2.72
11,069,047 Kimberly-Clark de Mexico 'A' Shares 17,035 0.61
Portfolio of investments 2,616,628 92.93
Net other assets 199,203 7.07
Total net assets 2,815,831 100.00
* Comparative figures shown in brackets relate to 31 July 2016.
All investments held are listed, unless otherwise stated.For the purposes of the portfolio holdings analysis, securities are shown based on their country of listing.
‡ Since the previous report, the Country Sector Classification headings have been updated by data providers. The current holdings and comparativeholdings have been restated as appropriate.
Stocks shown as ADRs and GDRs represent American Depositary Receipts and Global Depositary Receipts, respectively.
242

Share class A Accumulation
Change in net assets per share
Opening net asset value per share
Return before operating charges*
Operating charges
Return after operating charges*
Distributions
Retained distributions on accumulation shares
Closing net asset value per share (p)
* after direct transaction costs of:
Performance
Return after charges (%)
Other information
Closing net asset value (£’000)
Closing number of shares
Operating charges
Direct transaction costs
Prices
Highest share price
Lowest share price
Stewart Investors Global Emerging Markets Leaders Fund
Comparative Tablefor the year ended 31 July 2017
Net Asset Value and Ongoing Charges Figure
Final 31 July 2017(p)
Final 31 July 2016(p)
Final 31 July 2015(p)
505.40 420.35 425.81
60.37 85.05 (5.46)
(4.24) (3.36) (2.77)
68.88 91.65 1.45
(8.51) (6.60) (6.91)
565.77 505.40 420.35
0.54 0.44 0.59
4.24 3.36 2.77
585,054 580,447 814,299
103,407,899 114,849,251 193,718,833
11.94% 20.23% (1.28)%
0.10% 0.10% 0.13%
577.51 511.92 472.73
1.58% 1.57% 1.57%
491.10 376.97 408.79
243
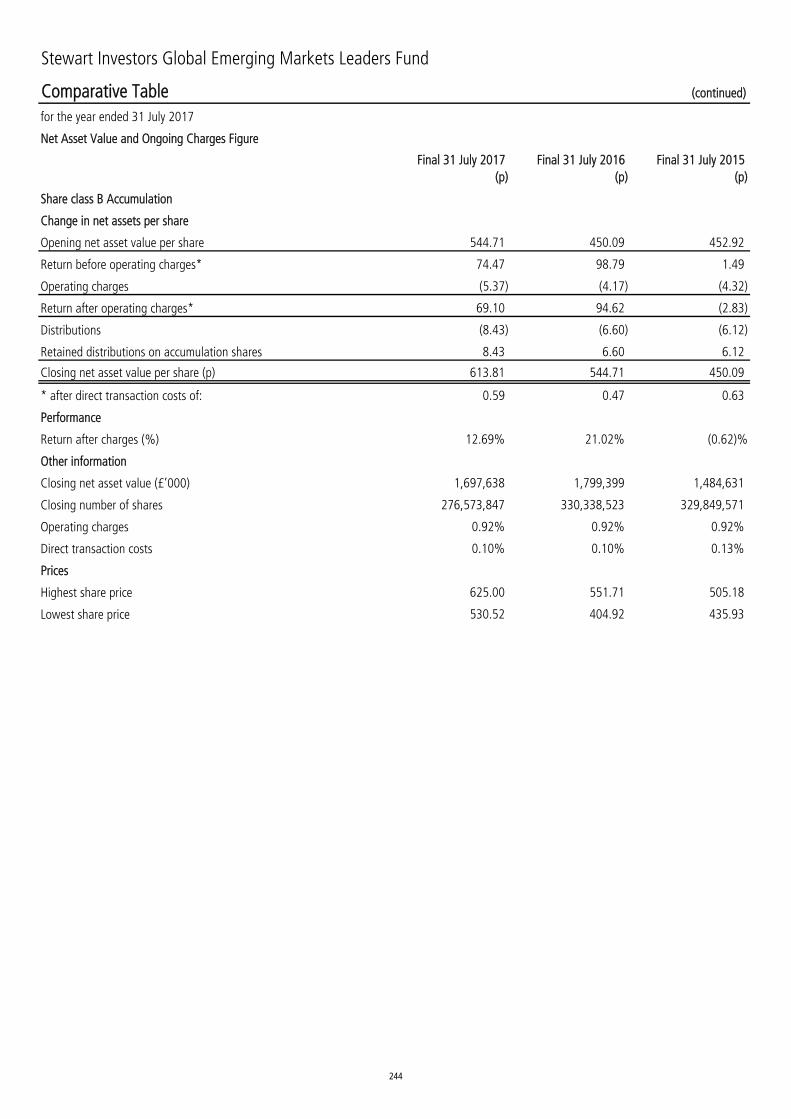
Stewart Investors Global Emerging Markets Leaders Fund
Comparative Table (continued)
for the year ended 31 July 2017
Net Asset Value and Ongoing Charges Figure
Share class B Accumulation
Change in net assets per share
Opening net asset value per share
Return before operating charges*
Operating charges
Return after operating charges*
Distributions
Retained distributions on accumulation shares
Closing net asset value per share (p)
* after direct transaction costs of:
Performance
Return after charges (%)
Other information
Closing net asset value (£’000)
Closing number of shares
Operating charges
Direct transaction costs
Prices
Highest share price
Lowest share price
Final 31 July 2017(p)
Final 31 July 2016(p)
Final 31 July 2015(p)
544.71 450.09 452.92
69.10 94.62 (2.83)
(8.43) (6.60) (6.12)
74.47 98.79 1.49
(5.37) (4.17) (4.32)
613.81 544.71 450.09
0.59 0.47 0.63
8.43 6.60 6.12
1,697,638 1,799,399 1,484,631
276,573,847 330,338,523 329,849,571
12.69% 21.02% (0.62)%
0.10% 0.10% 0.13%
625.00 551.71 505.18
0.92% 0.92% 0.92%
530.52 404.92 435.93
244
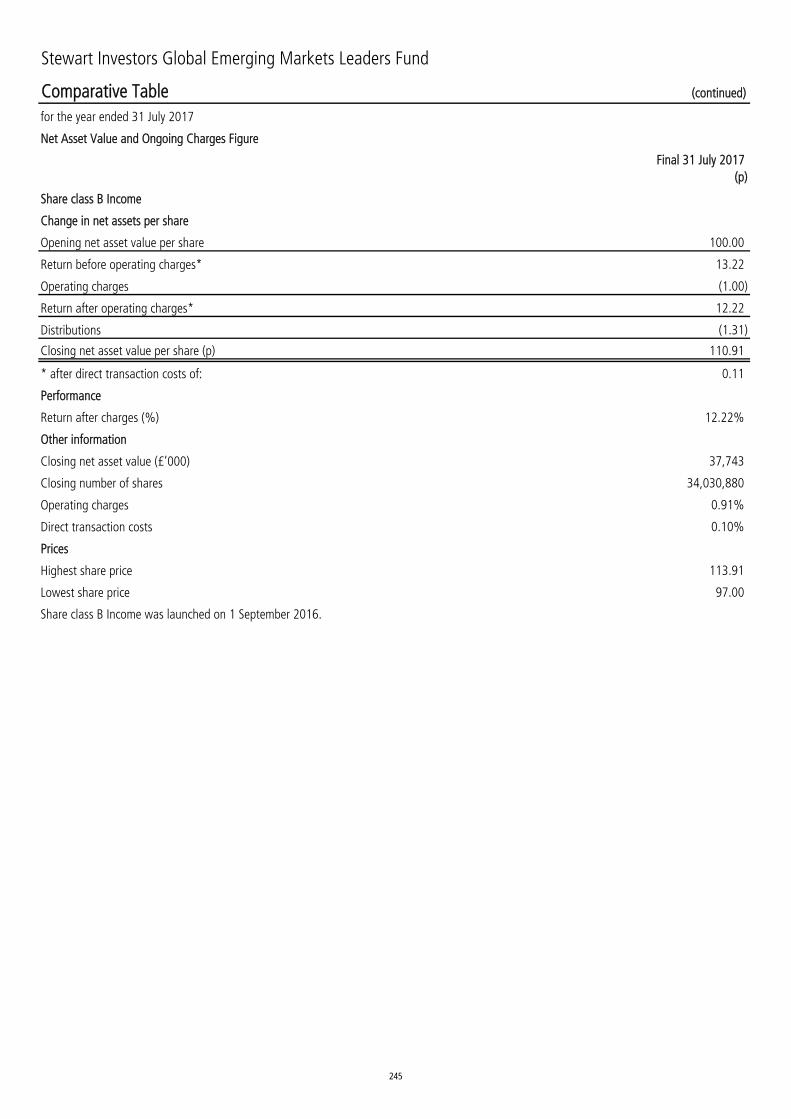
Stewart Investors Global Emerging Markets Leaders Fund
Comparative Table (continued)
for the year ended 31 July 2017
Net Asset Value and Ongoing Charges Figure
Share class B Income
Change in net assets per share
Opening net asset value per share
Return before operating charges*
Operating charges
Return after operating charges*
Distributions
Closing net asset value per share (p)
* after direct transaction costs of:
Performance
Return after charges (%)
Other information
Closing net asset value (£’000)
Closing number of shares
Operating charges
Direct transaction costs
Prices
Highest share price
Lowest share price
Final 31 July 2017(p)
100.00
12.22
(1.31)
13.22
(1.00)
110.91
0.11
37,743
34,030,880
12.22%
0.10%
113.91
0.91%
Share class B Income was launched on 1 September 2016.
97.00
245
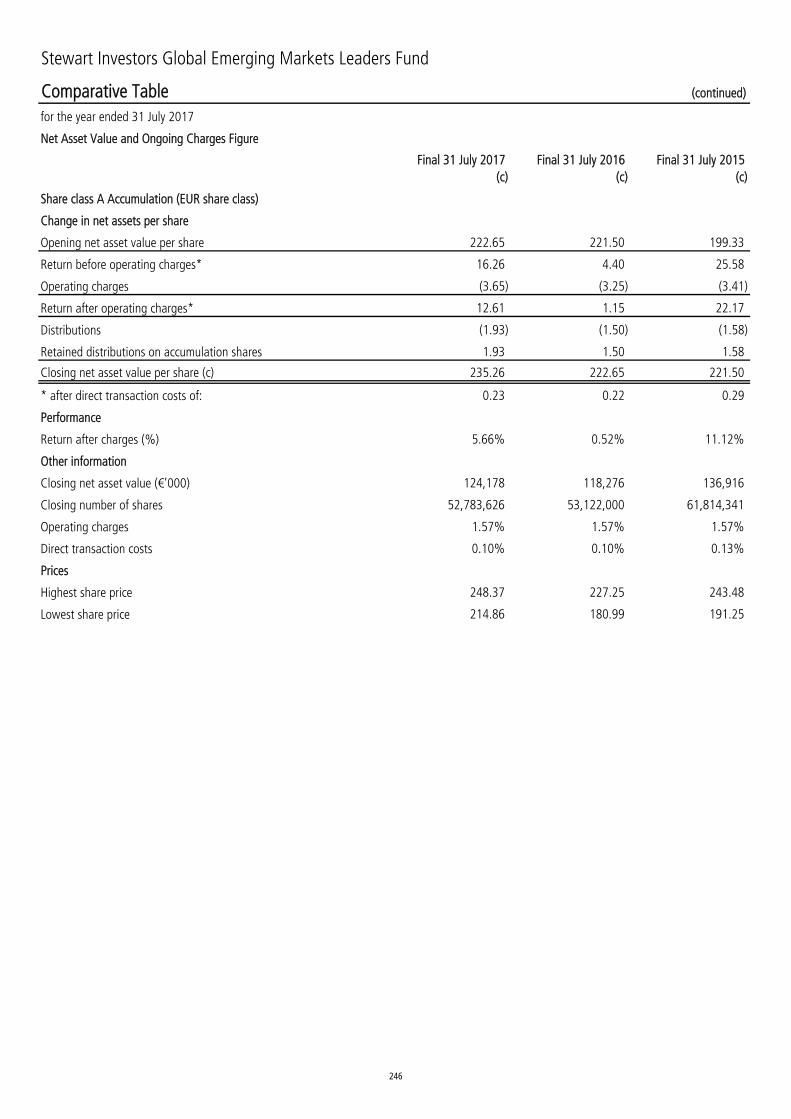
Stewart Investors Global Emerging Markets Leaders Fund
Comparative Table (continued)
for the year ended 31 July 2017
Net Asset Value and Ongoing Charges Figure
Share class A Accumulation (EUR share class)
Change in net assets per share
Opening net asset value per share
Return before operating charges*
Operating charges
Return after operating charges*
Distributions
Retained distributions on accumulation shares
Closing net asset value per share (c)
* after direct transaction costs of:
Performance
Return after charges (%)
Other information
Closing net asset value (€’000)
Closing number of shares
Operating charges
Direct transaction costs
Prices
Highest share price
Lowest share price
Final 31 July 2017(c)
Final 31 July 2016(c)
Final 31 July 2015(c)
222.65 221.50 199.33
12.61 1.15 22.17
(1.93) (1.50) (1.58)
16.26 4.40 25.58
(3.65) (3.25) (3.41)
235.26 222.65 221.50
0.23 0.22 0.29
1.93 1.50 1.58
124,178 118,276 136,916
52,783,626 53,122,000 61,814,341
5.66% 0.52% 11.12%
0.10% 0.10% 0.13%
248.37 227.25 243.48
1.57% 1.57% 1.57%
214.86 180.99 191.25
246
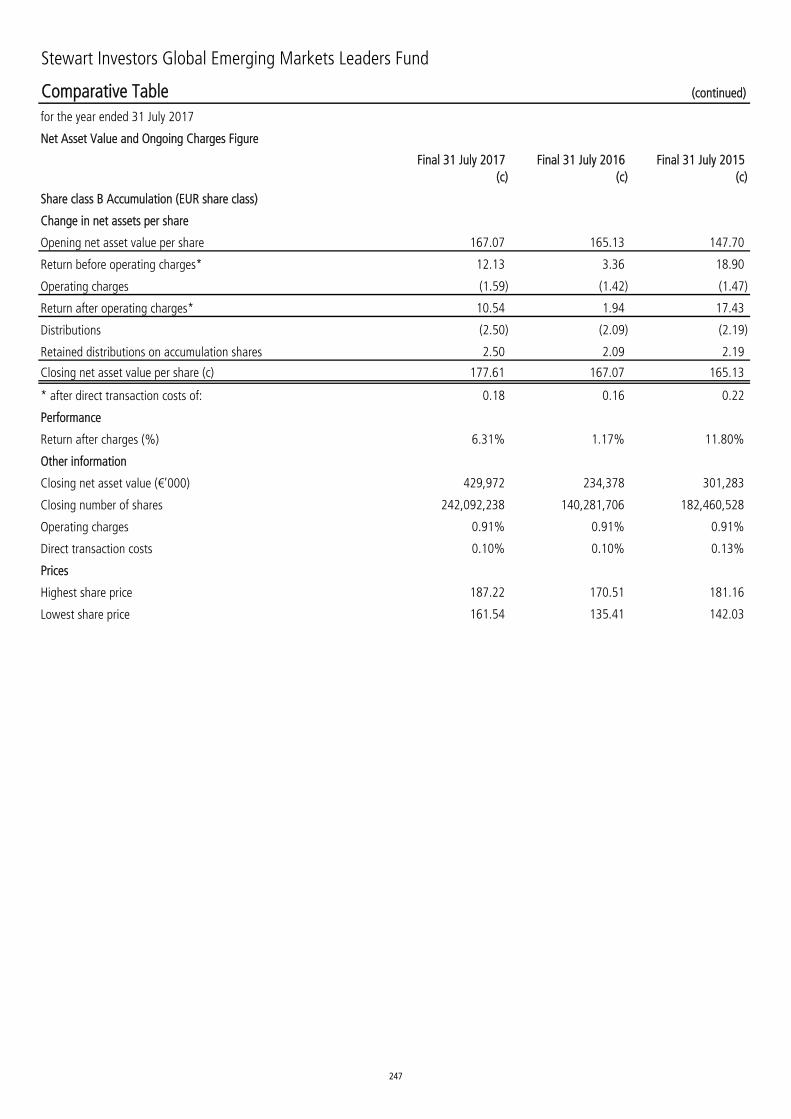
Stewart Investors Global Emerging Markets Leaders Fund
Comparative Table (continued)
for the year ended 31 July 2017
Net Asset Value and Ongoing Charges Figure
Share class B Accumulation (EUR share class)
Change in net assets per share
Opening net asset value per share
Return before operating charges*
Operating charges
Return after operating charges*
Distributions
Retained distributions on accumulation shares
Closing net asset value per share (c)
* after direct transaction costs of:
Performance
Return after charges (%)
Other information
Closing net asset value (€’000)
Closing number of shares
Operating charges
Direct transaction costs
Prices
Highest share price
Lowest share price
Final 31 July 2017(c)
Final 31 July 2016(c)
Final 31 July 2015(c)
167.07 165.13 147.70
10.54 1.94 17.43
(2.50) (2.09) (2.19)
12.13 3.36 18.90
(1.59) (1.42) (1.47)
177.61 167.07 165.13
0.18 0.16 0.22
2.50 2.09 2.19
429,972 234,378 301,283
242,092,238 140,281,706 182,460,528
6.31% 1.17% 11.80%
0.10% 0.10% 0.13%
187.22 170.51 181.16
0.91% 0.91% 0.91%
161.54 135.41 142.03
247

Notes £'000 £'000 £'000 £'000
Net capital gains 2 288,498 426,072
Revenue 3 70,097 57,514
4 (30,950) (26,549)
Interest payable and similar charges (30) (10)
39,117 30,955
5 (3,228) (1,644)
35,889 29,311
324,387 455,383
6 (35,861) (29,656)
288,526 425,727
£'000 £'000 £'000 £'000
2,677,211 2,607,823
278,354 48,521
(463,129) (433,747)
(184,775) (385,226)
344 -
288,526 425,727
34,525 28,887
2,815,831 2,677,211
Stewart Investors Global Emerging Markets Leaders Fund
Statement of Total Returnfor the year ended 31 July 2017
Total return before distributions
Change in net assets attributable to shareholders from investment activities
31 July 2017
Income
Retained distribution on accumulation shares
Change in net assets attributable to shareholders from investment activities
31 July 2016
Net revenue before taxation
Net revenue after taxation
Statement of Change in Net Assets Attributable to Shareholders
Taxation
Distributions
Expenses
for the year ended 31 July 2017
31 July 2016
Opening net assets attributable to shareholders
31 July 2017
Dilution adjustment
Less: Amounts payable on cancellation of shares
Amounts receivable on issue of shares
Closing net assets attributable to shareholders
Notes to the Financial Statements are on pages 250 to 255.
248
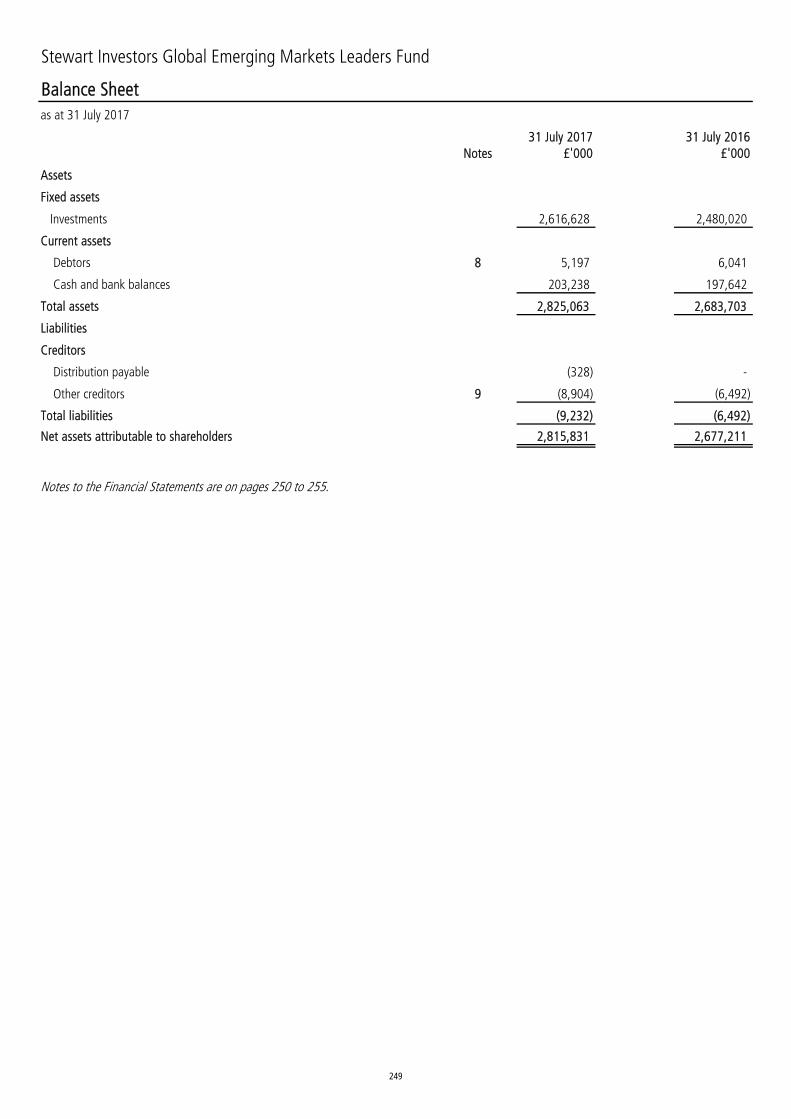
Stewart Investors Global Emerging Markets Leaders Fund
31 July 2017 31 July 2016Notes £'000 £'000
Investments 2,616,628 2,480,020
Current assets
8 5,197 6,041
203,238 197,642
2,825,063 2,683,703
Creditors
(328) -
Other creditors 9 (8,904) (6,492)
(9,232) (6,492)
2,815,831 2,677,211
Notes to the Financial Statements are on pages 250 to 255.
Fixed assets
Total assets
Liabilities
Debtors
Assets
Net assets attributable to shareholders
Distribution payable
Cash and bank balances
Total liabilities
Balance Sheetas at 31 July 2017
249
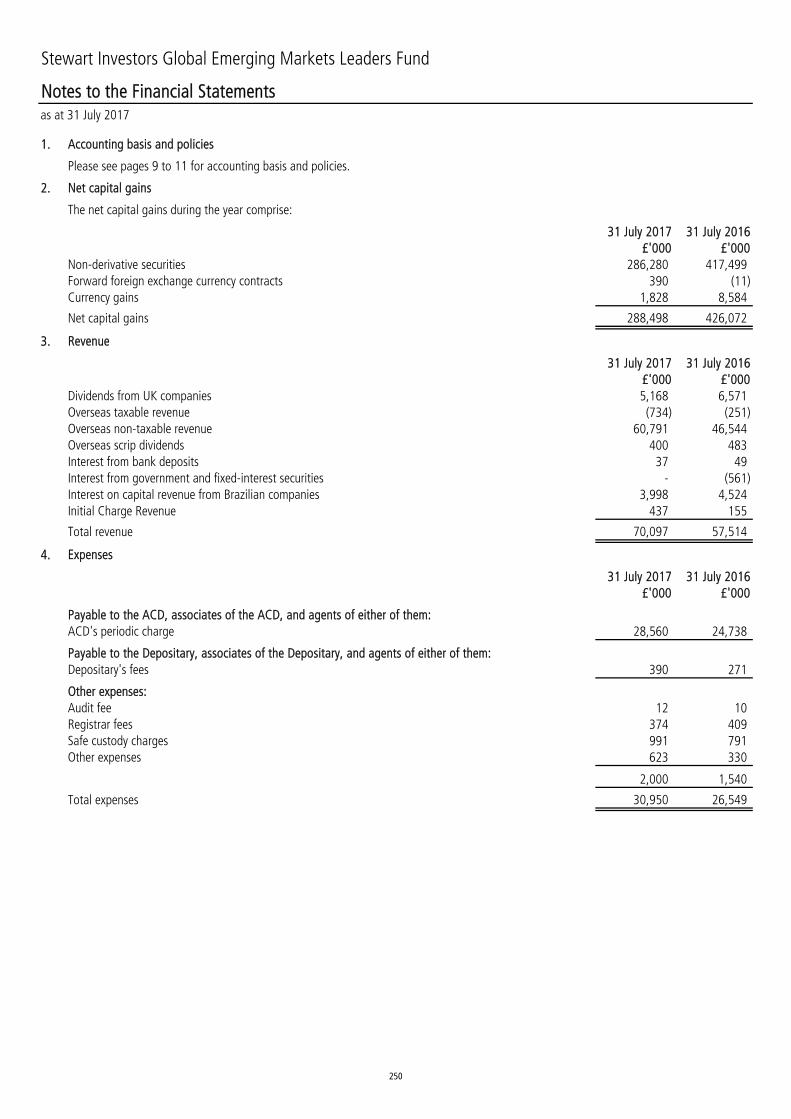
1.
2.
31 July 2017 31 July 2016£'000 £'000
286,280 417,499390 (11)
1,828 8,584
288,498 426,072
3.
31 July 2017 31 July 2016£'000 £'0005,168 6,571(734) (251)
60,791 46,544400 483
37 49- (561)
3,998 4,524437 155
70,097 57,514
4.
31 July 2017 31 July 2016£'000 £'000
28,560 24,738
390 271
12 10374 409991 791623 330
2,000 1,540
30,950 26,549
Currency gains
Safe custody charges
Payable to the Depositary, associates of the Depositary, and agents of either of them:
Initial Charge Revenue
Depositary's fees
Interest from government and fixed-interest securities
Audit fee
Total revenue
Interest on capital revenue from Brazilian companies
Interest from bank deposits
ACD's periodic charge
Total expenses
Other expenses
Registrar fees
Other expenses:
Payable to the ACD, associates of the ACD, and agents of either of them:
Please see pages 9 to 11 for accounting basis and policies.
The net capital gains during the year comprise:
Non-derivative securities
Stewart Investors Global Emerging Markets Leaders Fund
Notes to the Financial Statements
Net capital gains
Accounting basis and policies
as at 31 July 2017
Forward foreign exchange currency contracts
Net capital gains
Revenue
Expenses
Dividends from UK companies
Overseas non-taxable revenueOverseas taxable revenue
Overseas scrip dividends
250
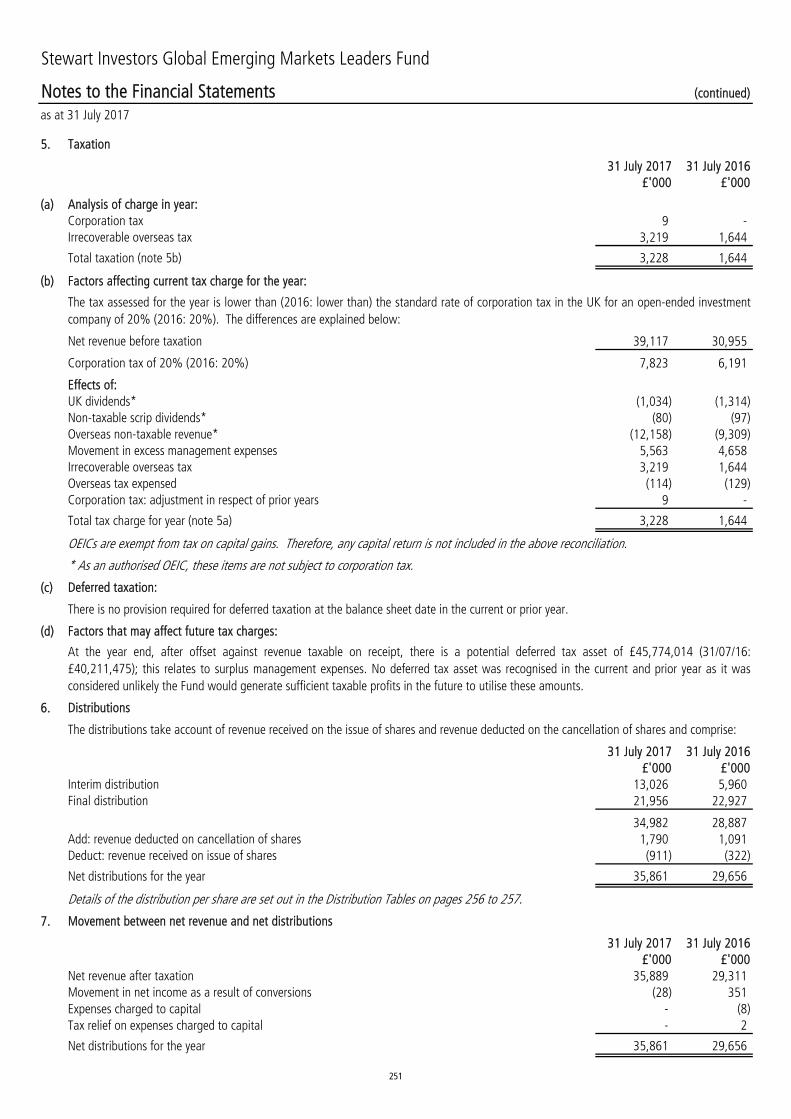
Stewart Investors Global Emerging Markets Leaders Fund
(continued)Notes to the Financial Statementsas at 31 July 2017
5.
31 July 2017 31 July 2016£'000 £'000
(a)9 -
3,219 1,644
3,228 1,644
(b)
39,117 30,955
7,823 6,191
(1,034) (1,314)(80) (97)
(12,158) (9,309)5,563 4,6583,219 1,644(114) (129)
9 -
3,228 1,644
(c)
(d)
6.
31 July 2017 31 July 2016£'000 £'000
13,026 5,96021,956 22,927
34,982 28,8871,790 1,091(911) (322)
35,861 29,656
7.
31 July 2017 31 July 2016£'000 £'000
35,889 29,311(28) 351
Expenses charged to capital - (8)Tax relief on expenses charged to capital - 2
35,861 29,656
Net revenue after taxation
Corporation tax of 20% (2016: 20%)
Effects of:
Non-taxable scrip dividends*Overseas non-taxable revenue*
UK dividends*
Total tax charge for year (note 5a)
Deferred taxation:
* As an authorised OEIC, these items are not subject to corporation tax.
The distributions take account of revenue received on the issue of shares and revenue deducted on the cancellation of shares and comprise:
Analysis of charge in year:Corporation tax
Taxation
Net revenue before taxation
Irrecoverable overseas tax
The tax assessed for the year is lower than (2016: lower than) the standard rate of corporation tax in the UK for an open-ended investmentcompany of 20% (2016: 20%). The differences are explained below:
Total taxation (note 5b)
Factors affecting current tax charge for the year:
There is no provision required for deferred taxation at the balance sheet date in the current or prior year.
At the year end, after offset against revenue taxable on receipt, there is a potential deferred tax asset of £45,774,014 (31/07/16:£40,211,475); this relates to surplus management expenses. No deferred tax asset was recognised in the current and prior year as it wasconsidered unlikely the Fund would generate sufficient taxable profits in the future to utilise these amounts.
Factors that may affect future tax charges:
Net distributions for the year
Details of the distribution per share are set out in the Distribution Tables on pages 256 to 257.
Net distributions for the year
Deduct: revenue received on issue of shares
Final distribution
Add: revenue deducted on cancellation of shares
OEICs are exempt from tax on capital gains. Therefore, any capital return is not included in the above reconciliation.
Overseas tax expensedCorporation tax: adjustment in respect of prior years
Irrecoverable overseas taxMovement in excess management expenses
Interim distribution
Movement in net income as a result of conversions
Movement between net revenue and net distributions
Distributions
251
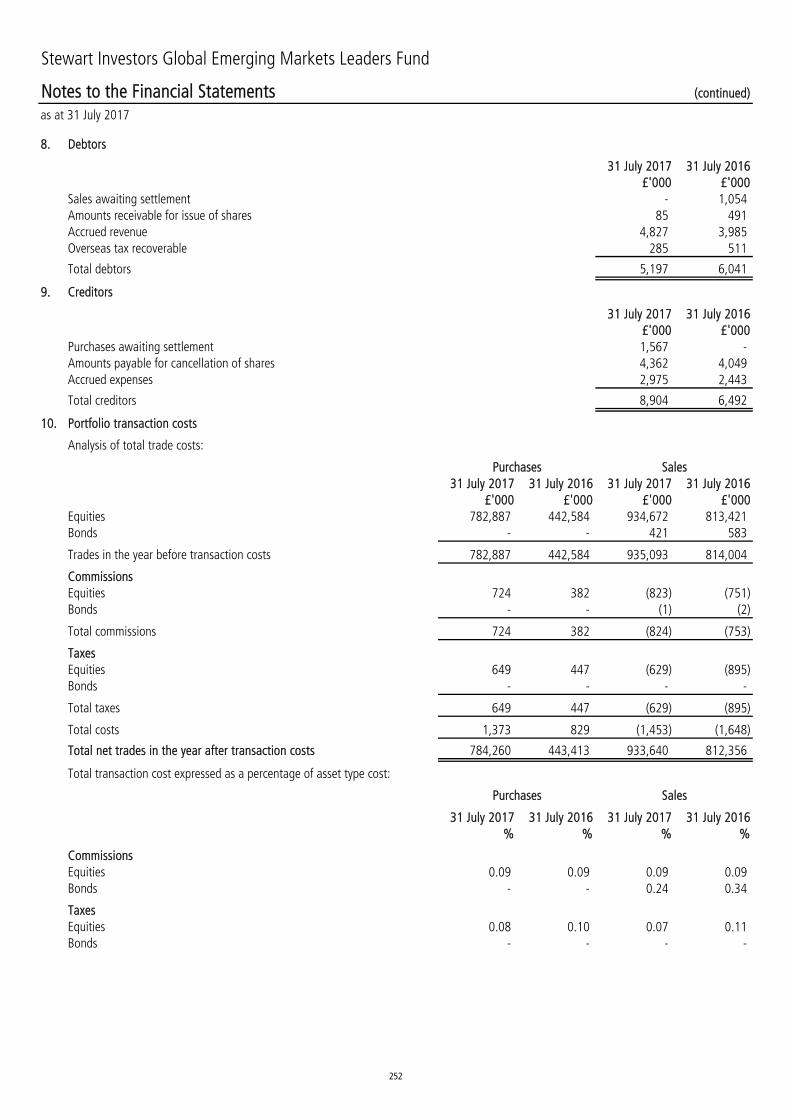
Stewart Investors Global Emerging Markets Leaders Fund
(continued)Notes to the Financial Statementsas at 31 July 2017
8.
31 July 2017 31 July 2016£'000 £'000
- 1,05485 491
4,827 3,985285 511
5,197 6,041
9.
31 July 2017 31 July 2016£'000 £'0001,567 -4,362 4,0492,975 2,443
8,904 6,492
10.
31 July 2017 31 July 2016 31 July 2017 31 July 2016£'000 £'000 £'000 £'000
782,887 442,584 934,672 813,421- - 421 583
782,887 442,584 935,093 814,004
724 382 (823) (751)- - (1) (2)
724 382 (824) (753)
649 447 (629) (895)- - - -
649 447 (629) (895)
1,373 829 (1,453) (1,648)
784,260 443,413 933,640 812,356
31 July 2017 31 July 2016 31 July 2017 31 July 2016% % % %
0.09 0.09 0.09 0.09- - 0.24 0.34
0.08 0.10 0.07 0.11- - - -
Sales
Sales awaiting settlement
Debtors
Accrued revenueAmounts receivable for issue of shares
Analysis of total trade costs:
Total debtors
Overseas tax recoverable
Accrued expenses
EquitiesBonds
Total commissions
Equities
EquitiesBonds
Total transaction cost expressed as a percentage of asset type cost:
Purchases Sales
CommissionsEquitiesBonds
Total taxes
Total creditors
Portfolio transaction costs
Total costs
Purchases awaiting settlement
Trades in the year before transaction costs
Creditors
Purchases
Amounts payable for cancellation of shares
Bonds
Commissions
Taxes
Total net trades in the year after transaction costs
Equities
Taxes
Bonds
252
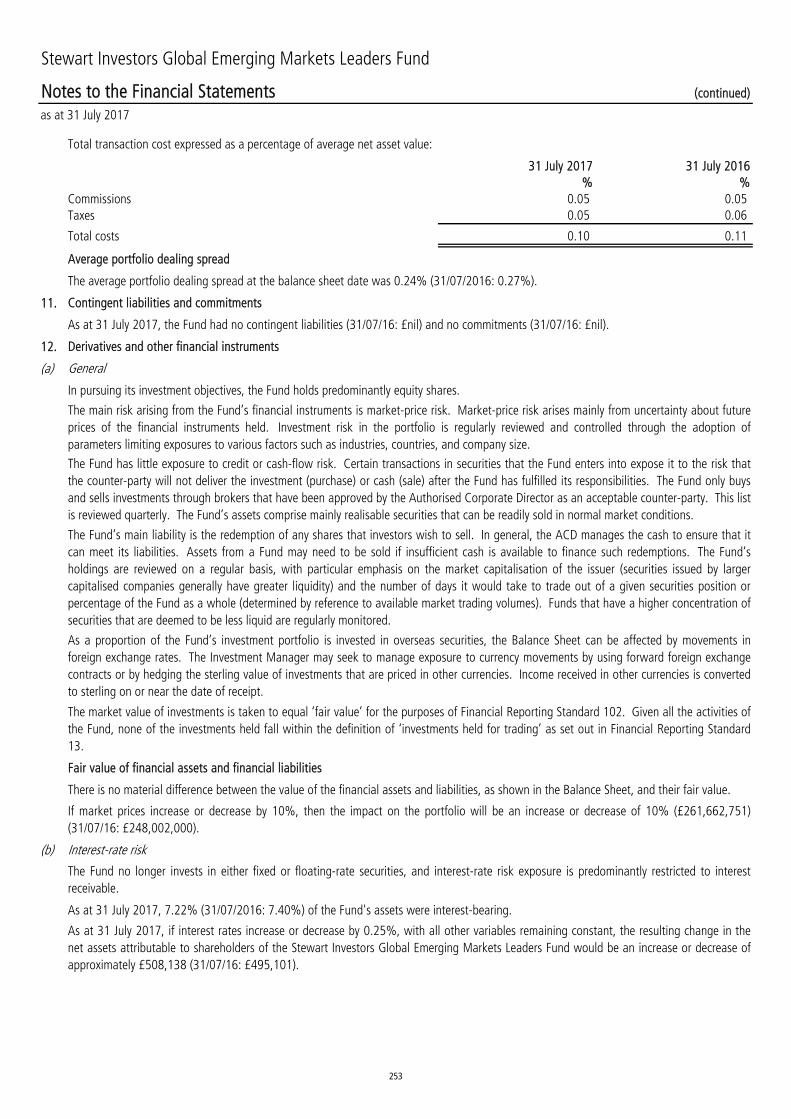
Stewart Investors Global Emerging Markets Leaders Fund
(continued)Notes to the Financial Statementsas at 31 July 2017
11.
12.
(a)
(b)
Commissions 0.05 0.05
As at 31 July 2017, if interest rates increase or decrease by 0.25%, with all other variables remaining constant, the resulting change in thenet assets attributable to shareholders of the Stewart Investors Global Emerging Markets Leaders Fund would be an increase or decrease ofapproximately £508,138 (31/07/16: £495,101).
Contingent liabilities and commitments
Taxes
General
Fair value of financial assets and financial liabilities
The market value of investments is taken to equal ‘fair value’ for the purposes of Financial Reporting Standard 102. Given all the activities ofthe Fund, none of the investments held fall within the definition of ‘investments held for trading’ as set out in Financial Reporting Standard13.
There is no material difference between the value of the financial assets and liabilities, as shown in the Balance Sheet, and their fair value.
Interest-rate risk
As at 31 July 2017, 7.22% (31/07/2016: 7.40%) of the Fund's assets were interest-bearing.
The Fund no longer invests in either fixed or floating-rate securities, and interest-rate risk exposure is predominantly restricted to interestreceivable.
If market prices increase or decrease by 10%, then the impact on the portfolio will be an increase or decrease of 10% (£261,662,751)(31/07/16: £248,002,000).
0.11
The average portfolio dealing spread at the balance sheet date was 0.24% (31/07/2016: 0.27%).
31 July 2016% %
In pursuing its investment objectives, the Fund holds predominantly equity shares.
The main risk arising from the Fund’s financial instruments is market-price risk. Market-price risk arises mainly from uncertainty about futureprices of the financial instruments held. Investment risk in the portfolio is regularly reviewed and controlled through the adoption ofparameters limiting exposures to various factors such as industries, countries, and company size.
The Fund has little exposure to credit or cash-flow risk. Certain transactions in securities that the Fund enters into expose it to the risk thatthe counter-party will not deliver the investment (purchase) or cash (sale) after the Fund has fulfilled its responsibilities. The Fund only buysand sells investments through brokers that have been approved by the Authorised Corporate Director as an acceptable counter-party. This listis reviewed quarterly. The Fund’s assets comprise mainly realisable securities that can be readily sold in normal market conditions.
The Fund’s main liability is the redemption of any shares that investors wish to sell. In general, the ACD manages the cash to ensure that itcan meet its liabilities. Assets from a Fund may need to be sold if insufficient cash is available to finance such redemptions. The Fund’sholdings are reviewed on a regular basis, with particular emphasis on the market capitalisation of the issuer (securities issued by largercapitalised companies generally have greater liquidity) and the number of days it would take to trade out of a given securities position orpercentage of the Fund as a whole (determined by reference to available market trading volumes). Funds that have a higher concentration ofsecurities that are deemed to be less liquid are regularly monitored.
As a proportion of the Fund’s investment portfolio is invested in overseas securities, the Balance Sheet can be affected by movements inforeign exchange rates. The Investment Manager may seek to manage exposure to currency movements by using forward foreign exchangecontracts or by hedging the sterling value of investments that are priced in other currencies. Income received in other currencies is convertedto sterling on or near the date of receipt.
Average portfolio dealing spread
Derivatives and other financial instruments
As at 31 July 2017, the Fund had no contingent liabilities (31/07/16: £nil) and no commitments (31/07/16: £nil).
0.10
31 July 2017
Total transaction cost expressed as a percentage of average net asset value:
0.06
Total costs
0.05
253
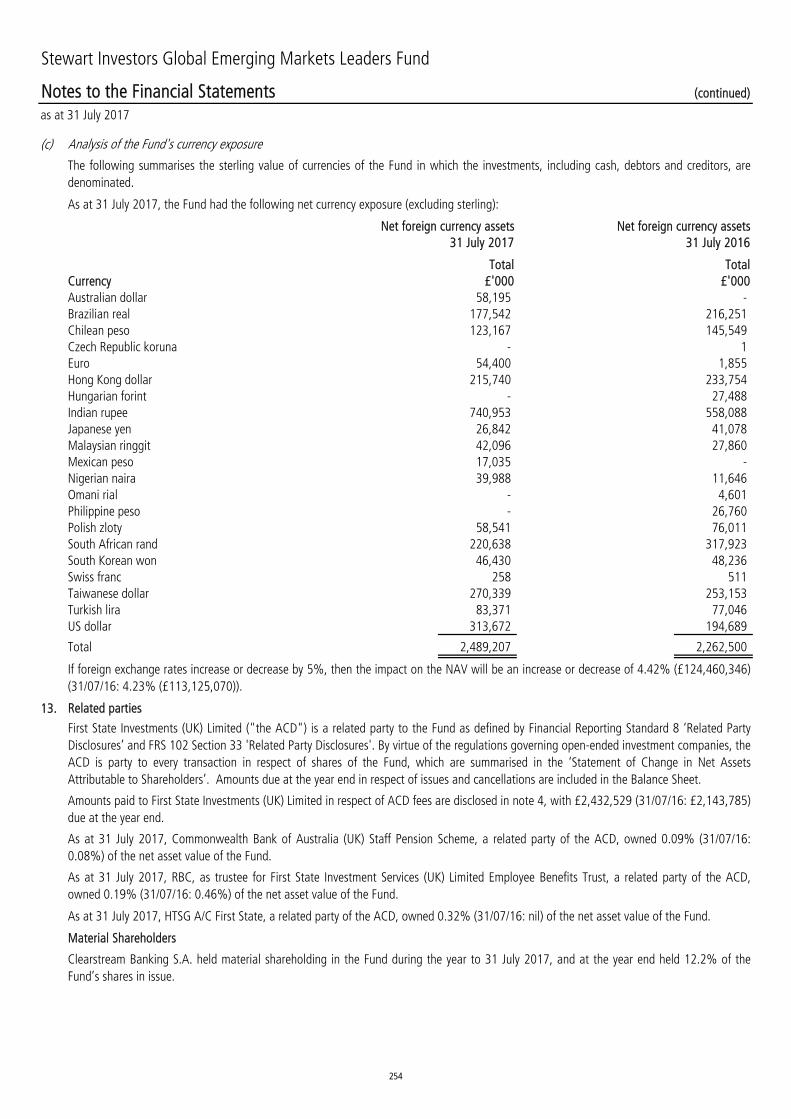
Stewart Investors Global Emerging Markets Leaders Fund
(continued)Notes to the Financial Statementsas at 31 July 2017
(c)
Total TotalCurrency £'000 £'000Australian dollar 58,195 -Brazilian real 177,542 216,251Chilean peso 123,167 145,549Czech Republic koruna - 1Euro 54,400 1,855Hong Kong dollar 215,740 233,754Hungarian forint - 27,488Indian rupee 740,953 558,088Japanese yen 26,842 41,078Malaysian ringgit 42,096 27,860Mexican peso 17,035 -Nigerian naira 39,988 11,646Omani rial - 4,601Philippine peso - 26,760Polish zloty 58,541 76,011South African rand 220,638 317,923South Korean won 46,430 48,236Swiss franc 258 511Taiwanese dollar 270,339 253,153Turkish lira 83,371 77,046US dollar 313,672 194,689
Total 2,489,207 2,262,500
13.
Material Shareholders
Amounts paid to First State Investments (UK) Limited in respect of ACD fees are disclosed in note 4, with £2,432,529 (31/07/16: £2,143,785)due at the year end.
As at 31 July 2017, Commonwealth Bank of Australia (UK) Staff Pension Scheme, a related party of the ACD, owned 0.09% (31/07/16:0.08%) of the net asset value of the Fund.
Net foreign currency assets
The following summarises the sterling value of currencies of the Fund in which the investments, including cash, debtors and creditors, aredenominated.
If foreign exchange rates increase or decrease by 5%, then the impact on the NAV will be an increase or decrease of 4.42% (£124,460,346)(31/07/16: 4.23% (£113,125,070)).
31 July 2016
As at 31 July 2017, RBC, as trustee for First State Investment Services (UK) Limited Employee Benefits Trust, a related party of the ACD,owned 0.19% (31/07/16: 0.46%) of the net asset value of the Fund.
31 July 2017
As at 31 July 2017, the Fund had the following net currency exposure (excluding sterling):
Clearstream Banking S.A. held material shareholding in the Fund during the year to 31 July 2017, and at the year end held 12.2% of theFund’s shares in issue.
Analysis of the Fund's currency exposure
Related parties
As at 31 July 2017, HTSG A/C First State, a related party of the ACD, owned 0.32% (31/07/16: nil) of the net asset value of the Fund.
Net foreign currency assets
First State Investments (UK) Limited ("the ACD") is a related party to the Fund as defined by Financial Reporting Standard 8 ‘Related PartyDisclosures’ and FRS 102 Section 33 'Related Party Disclosures'. By virtue of the regulations governing open-ended investment companies, theACD is party to every transaction in respect of shares of the Fund, which are summarised in the ‘Statement of Change in Net AssetsAttributable to Shareholders’. Amounts due at the year end in respect of issues and cancellations are included in the Balance Sheet.
254
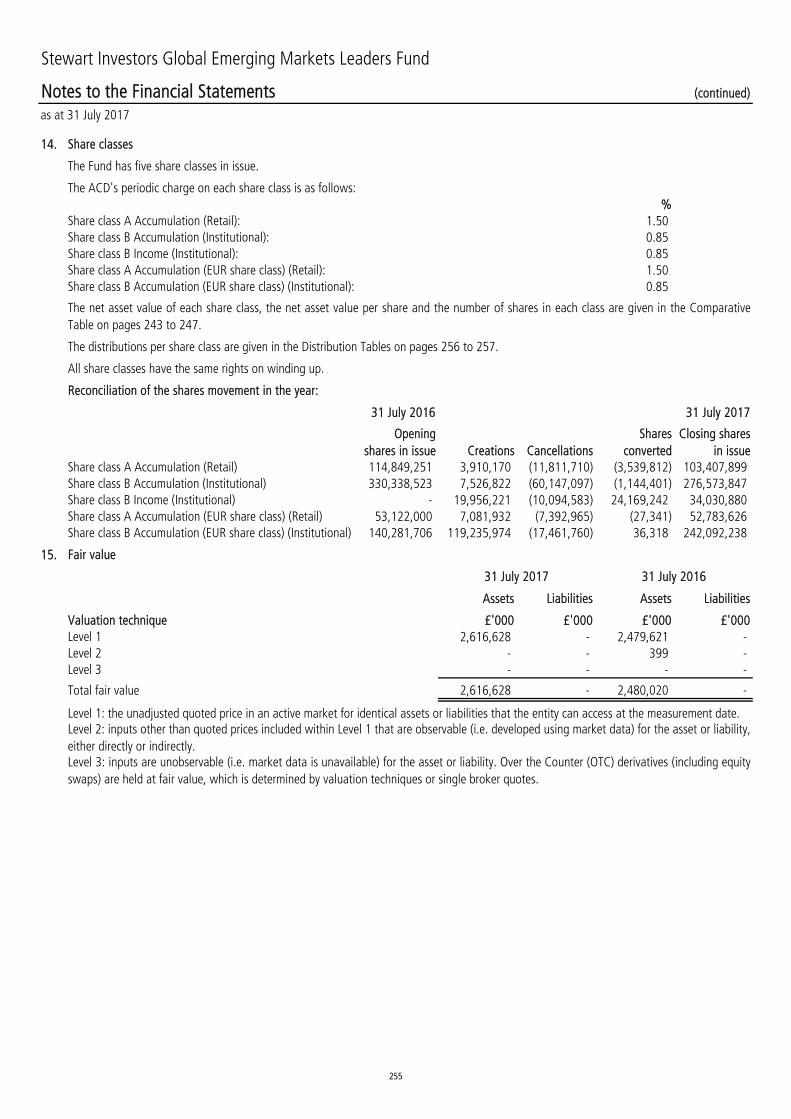
Stewart Investors Global Emerging Markets Leaders Fund
(continued)Notes to the Financial Statementsas at 31 July 2017
14.
%1.500.850.851.500.85
31 July 2016 31 July 2017
Opening shares in issue Creations Cancellations
Shares converted
Closing shares in issue
114,849,251 3,910,170 (11,811,710) (3,539,812) 103,407,899330,338,523 7,526,822 (60,147,097) (1,144,401) 276,573,847
- 19,956,221 (10,094,583) 24,169,242 34,030,88053,122,000 7,081,932 (7,392,965) (27,341) 52,783,626
140,281,706 119,235,974 (17,461,760) 36,318 242,092,238
15.
Assets Liabilities Assets Liabilities
£'000 £'000 £'000 £'0002,616,628 - 2,479,621 -
- - 399 -- - - -
2,616,628 - 2,480,020 -
The Fund has five share classes in issue.
The net asset value of each share class, the net asset value per share and the number of shares in each class are given in the ComparativeTable on pages 243 to 247.
The distributions per share class are given in the Distribution Tables on pages 256 to 257.
Share class B Income (Institutional):
Share class B Accumulation (EUR share class) (Institutional):
Share class A Accumulation (Retail):
The ACD's periodic charge on each share class is as follows:
Share class A Accumulation (EUR share class) (Retail):
Share class B Accumulation (Institutional):
Share classes
Reconciliation of the shares movement in the year:
Share class A Accumulation (Retail)Share class B Accumulation (Institutional)
All share classes have the same rights on winding up.
Level 3: inputs are unobservable (i.e. market data is unavailable) for the asset or liability. Over the Counter (OTC) derivatives (including equityswaps) are held at fair value, which is determined by valuation techniques or single broker quotes.
Level 1Level 2Level 3
Total fair value
Fair value
Valuation technique
31 July 2017 31 July 2016
Level 1: the unadjusted quoted price in an active market for identical assets or liabilities that the entity can access at the measurement date. Level 2: inputs other than quoted prices included within Level 1 that are observable (i.e. developed using market data) for the asset or liability,either directly or indirectly.
Share class B Income (Institutional)Share class A Accumulation (EUR share class) (Retail)Share class B Accumulation (EUR share class) (Institutional)
255
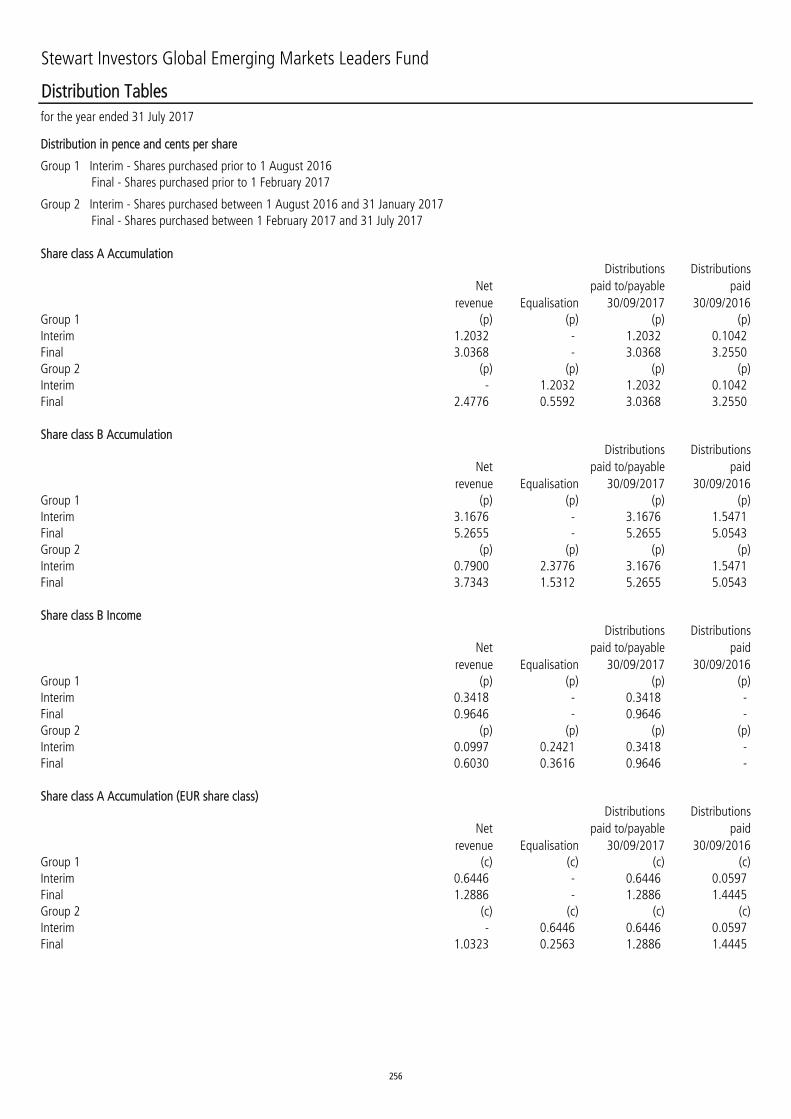
Share class A Accumulation
Netrevenue Equalisation
Distributions paid to/payable
30/09/2017
Distributions paid
30/09/2016Group 1 (p) (p) (p) (p)Interim 1.2032 - 1.2032 0.1042Final 3.0368 - 3.0368 3.2550Group 2 (p) (p) (p) (p)Interim - 1.2032 1.2032 0.1042Final 2.4776 0.5592 3.0368 3.2550
Share class B Accumulation
Netrevenue Equalisation
Distributions paid to/payable
30/09/2017
Distributions paid
30/09/2016Group 1 (p) (p) (p) (p)Interim 3.1676 - 3.1676 1.5471Final 5.2655 - 5.2655 5.0543Group 2 (p) (p) (p) (p)Interim 0.7900 2.3776 3.1676 1.5471Final 3.7343 1.5312 5.2655 5.0543
Share class B Income
Netrevenue Equalisation
Distributions paid to/payable
30/09/2017
Distributions paid
30/09/2016Group 1 (p) (p) (p) (p)Interim 0.3418 - 0.3418 -Final 0.9646 - 0.9646 -Group 2 (p) (p) (p) (p)Interim 0.0997 0.2421 0.3418 -Final 0.6030 0.3616 0.9646 -
Share class A Accumulation (EUR share class)
Netrevenue Equalisation
Distributions paid to/payable
30/09/2017
Distributions paid
30/09/2016Group 1 (c) (c) (c) (c)Interim 0.6446 - 0.6446 0.0597Final 1.2886 - 1.2886 1.4445Group 2 (c) (c) (c) (c)Interim - 0.6446 0.6446 0.0597Final 1.0323 0.2563 1.2886 1.4445
Stewart Investors Global Emerging Markets Leaders Fund
Distribution Tablesfor the year ended 31 July 2017
Group 1 Interim - Shares purchased prior to 1 August 2016
Distribution in pence and cents per share
Group 2 Interim - Shares purchased between 1 August 2016 and 31 January 2017
Final - Shares purchased prior to 1 February 2017
Final - Shares purchased between 1 February 2017 and 31 July 2017
256
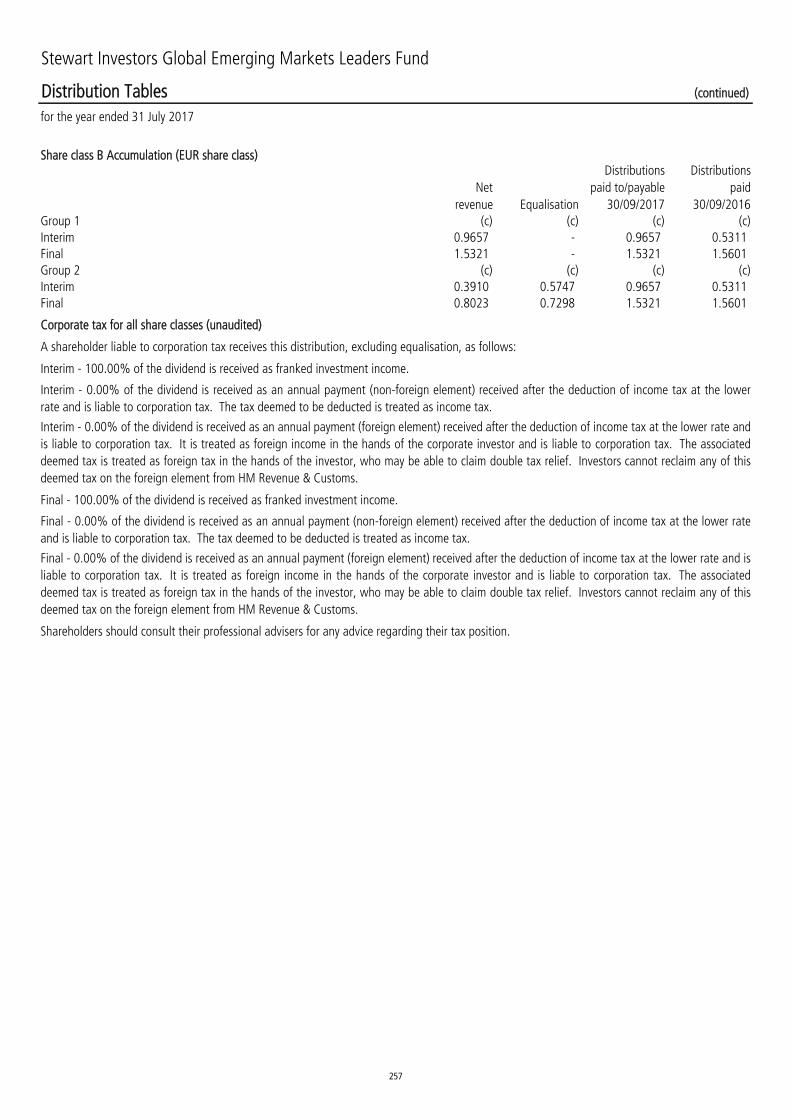
Stewart Investors Global Emerging Markets Leaders Fund
Distribution Tables (continued)
for the year ended 31 July 2017
Share class B Accumulation (EUR share class)
Netrevenue Equalisation
Distributions paid to/payable
30/09/2017
Distributions paid
30/09/2016Group 1 (c) (c) (c) (c)Interim 0.9657 - 0.9657 0.5311Final 1.5321 - 1.5321 1.5601Group 2 (c) (c) (c) (c)Interim 0.3910 0.5747 0.9657 0.5311Final 0.8023 0.7298 1.5321 1.5601
Corporate tax for all share classes (unaudited)
A shareholder liable to corporation tax receives this distribution, excluding equalisation, as follows:
Interim - 100.00% of the dividend is received as franked investment income.
Interim - 0.00% of the dividend is received as an annual payment (non-foreign element) received after the deduction of income tax at the lowerrate and is liable to corporation tax. The tax deemed to be deducted is treated as income tax.
Interim - 0.00% of the dividend is received as an annual payment (foreign element) received after the deduction of income tax at the lower rate andis liable to corporation tax. It is treated as foreign income in the hands of the corporate investor and is liable to corporation tax. The associateddeemed tax is treated as foreign tax in the hands of the investor, who may be able to claim double tax relief. Investors cannot reclaim any of thisdeemed tax on the foreign element from HM Revenue & Customs.
Shareholders should consult their professional advisers for any advice regarding their tax position.
Final - 100.00% of the dividend is received as franked investment income.
Final - 0.00% of the dividend is received as an annual payment (non-foreign element) received after the deduction of income tax at the lower rateand is liable to corporation tax. The tax deemed to be deducted is treated as income tax.
Final - 0.00% of the dividend is received as an annual payment (foreign element) received after the deduction of income tax at the lower rate and isliable to corporation tax. It is treated as foreign income in the hands of the corporate investor and is liable to corporation tax. The associateddeemed tax is treated as foreign tax in the hands of the investor, who may be able to claim double tax relief. Investors cannot reclaim any of thisdeemed tax on the foreign element from HM Revenue & Customs.
257
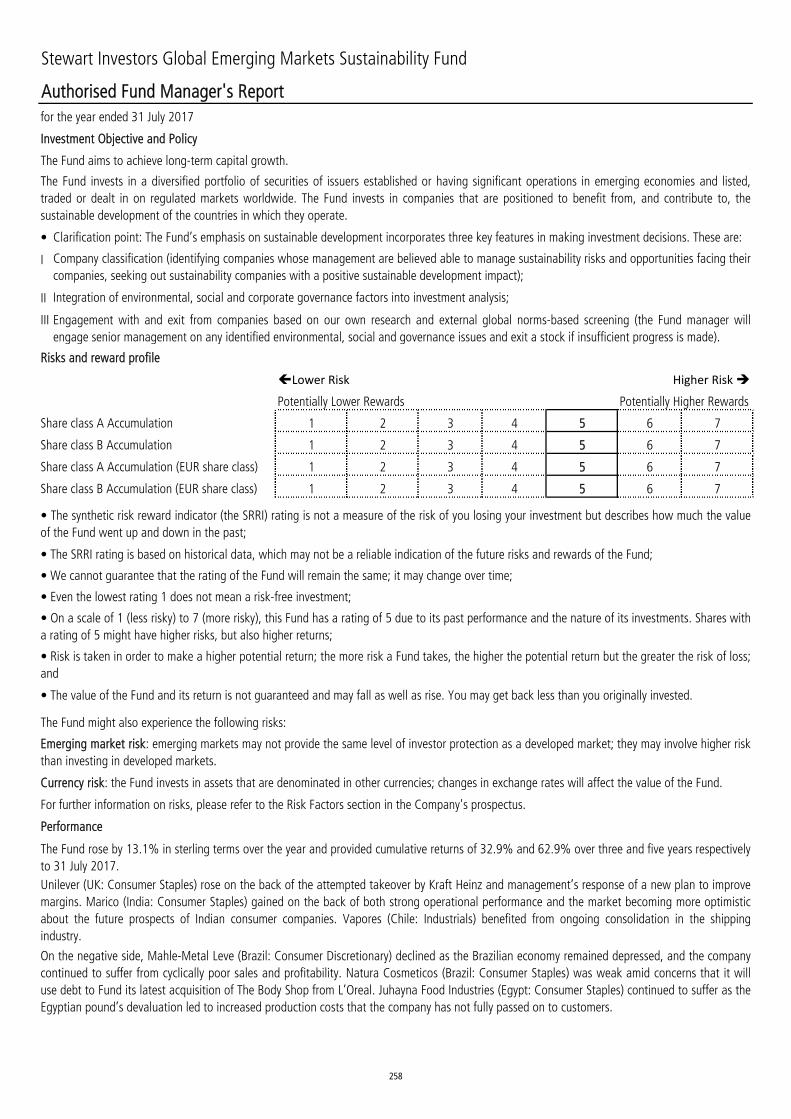
•
I
II
III
Risks and reward profile
Lower Risk Higher Risk
Potentially Lower Rewards Potentially Higher Rewards
1 2 3 4 5 6 7
1 2 3 4 5 6 7
1 2 3 4 5 6 7
1 2 3 4 5 6 7
Performance
The Fund rose by 13.1% in sterling terms over the year and provided cumulative returns of 32.9% and 62.9% over three and five years respectivelyto 31 July 2017. Unilever (UK: Consumer Staples) rose on the back of the attempted takeover by Kraft Heinz and management’s response of a new plan to improvemargins. Marico (India: Consumer Staples) gained on the back of both strong operational performance and the market becoming more optimisticabout the future prospects of Indian consumer companies. Vapores (Chile: Industrials) benefited from ongoing consolidation in the shippingindustry.
On the negative side, Mahle-Metal Leve (Brazil: Consumer Discretionary) declined as the Brazilian economy remained depressed, and the companycontinued to suffer from cyclically poor sales and profitability. Natura Cosmeticos (Brazil: Consumer Staples) was weak amid concerns that it willuse debt to Fund its latest acquisition of The Body Shop from L’Oreal. Juhayna Food Industries (Egypt: Consumer Staples) continued to suffer as theEgyptian pound’s devaluation led to increased production costs that the company has not fully passed on to customers.
For further information on risks, please refer to the Risk Factors section in the Company's prospectus.
Emerging market risk: emerging markets may not provide the same level of investor protection as a developed market; they may involve higher riskthan investing in developed markets.
Currency risk: the Fund invests in assets that are denominated in other currencies; changes in exchange rates will affect the value of the Fund.
• Even the lowest rating 1 does not mean a risk-free investment;
• On a scale of 1 (less risky) to 7 (more risky), this Fund has a rating of 5 due to its past performance and the nature of its investments. Shares witha rating of 5 might have higher risks, but also higher returns;
• Risk is taken in order to make a higher potential return; the more risk a Fund takes, the higher the potential return but the greater the risk of loss;and
• The value of the Fund and its return is not guaranteed and may fall as well as rise. You may get back less than you originally invested.
The Fund might also experience the following risks:
• The synthetic risk reward indicator (the SRRI) rating is not a measure of the risk of you losing your investment but describes how much the valueof the Fund went up and down in the past;
• The SRRI rating is based on historical data, which may not be a reliable indication of the future risks and rewards of the Fund;
• We cannot guarantee that the rating of the Fund will remain the same; it may change over time;
Share class A Accumulation
Share class B Accumulation
Share class A Accumulation (EUR share class)
Share class B Accumulation (EUR share class)
Company classification (identifying companies whose management are believed able to manage sustainability risks and opportunities facing theircompanies, seeking out sustainability companies with a positive sustainable development impact);
Integration of environmental, social and corporate governance factors into investment analysis;
Engagement with and exit from companies based on our own research and external global norms-based screening (the Fund manager willengage senior management on any identified environmental, social and governance issues and exit a stock if insufficient progress is made).
The Fund aims to achieve long-term capital growth.
The Fund invests in a diversified portfolio of securities of issuers established or having significant operations in emerging economies and listed,traded or dealt in on regulated markets worldwide. The Fund invests in companies that are positioned to benefit from, and contribute to, thesustainable development of the countries in which they operate.
Stewart Investors Global Emerging Markets Sustainability Fund
Authorised Fund Manager's Reportfor the year ended 31 July 2017
Investment Objective and Policy
Clarification point: The Fund’s emphasis on sustainable development incorporates three key features in making investment decisions. These are:
258

(continued)
Stewart Investors Global Emerging Markets Sustainability Fund
Authorised Fund Manager's Reportfor the year ended 31 July 2017
Time 3 6 1 3 5 10 Sinceperiod mths mths yr yrs yrs yrs launch
2.9 8.3 13.1 32.9 62.9 - 205.5 8.1 13.5 25.7 37.4 50.0 - 137.8 2.1 3.5 9.8 23.3 43.2 - 109.4
2 1 2 2 2 - 1
12 mths to 12 mths to 12 mths to 12 mths to 12 mths to31/07/17 31/07/16 31/07/15 31/07/14 31/07/13
13.1 16.5 0.9 3.3 18.6
31 July 2017 31 July 2016% of Fund % of Fund
7.34 6.004.90 5.743.57 5.053.41 4.653.27 3.682.86 3.342.59 3.082.58 2.832.51 2.572.46 2.51
Types of sharesAccumulation.
TOTVS Dr Reddy's LaboratoriesHousing Development Finance WEGManila Water Inversiones Aguas Metropolitanas
Tata Consultancy Services Banco BradescoStandard Foods Standard FoodsVitasoy International Holdings Manila Water
Marico Natura CosmeticosNatura Cosmeticos UnileverTech Mahindra Tech Mahindra
Stock name Stock nameUnilever Marico
Past performance should not be used as a guide to future performance, which is not guaranteed.
Ten largest holdings
TimeperiodFund return %
Benchmark: MSCI Emerging Markets Index.Sector: IA Global Emerging Markets.
Benchmark return %Sector return %Quartile ranking
Discrete performance as at 31 July 2017
Cumulative performance as at 31 July 2017
Fund return %
Outlook
The Fund remains defensively positioned and focused on companies with good quality management teams, conservative balance sheets andgrowing, but predictable cash flows. The Manager continues to look for companies that should benefit from and contribute to the sustainabledevelopment of global emerging markets over the long term.
Portfolio changes
Significant purchases over the year included Mahindra & Mahindra (India: Consumer Discretionary), the holding company of one of the mostrespected and highest-quality family groups in India. The Fund bought Clicks (South Africa: Consumer Discretionary) and Corporativo Fragua(Mexico: Consumer Staples). Both are drug retail businesses with strong management teams that should benefit from the continued formalisation ofthe pharmaceutical retail market in South Africa and Mexico respectively.
The Fund sold Entel (Chile: Telecom Services) on concerns about the franchise and China Mengniu Dairy (Consumer Staples) on the belief that thecompany’s quality deteriorated after it made poor capital allocation decisions. The Fund also sold Infosys Technologies (India: InformationTechnology) on governance concerns.
259

Holdings
MarketValue£'000
TotalNet Assets
%
UNITED KINGDOM (6.40%*) 33,871 8.591,364,732 PZ Cussons 4,917 1.25
668,286 Unilever 28,954 7.34
PORTUGAL (0.56%*) 2,267 0.57152,459 Jeronimo Martins 2,267 0.57
SWITZERLAND (1.08%*) 1,792 0.451,057 SGS 1,792 0.45
JAPAN (2.88%*) 13,545 3.44287,000 Kansai Paint 5,004 1.27438,200 Unicharm 8,541 2.17
BANGLADESH (0.67%*) 3,771 0.964,586,492 BRAC Bank 3,771 0.96
CHINA (1.03%*) - -
HONG KONG (2.37%*) 10,200 2.596,276,000 Vitasoy International Holdings 10,200 2.59
INDIA (23.39%*) 86,654 21.971,284,323 Dabur India 4,713 1.20
280,997 Dr Reddy's Laboratories 7,929 2.01466,195 Housing Development Finance 9,898 2.51
2,308,660 Idea Cellular 2,532 0.64460,369 Kotak Mahindra Bank 5,594 1.42236,660 Mahindra & Mahindra 3,952 1.00
4,880,981 Marico 19,309 4.90435,981 Tata Consultancy Services 12,909 3.27
2,941,892 Tech Mahindra 13,451 3.41693,483 Tube Investments of India 6,367 1.61
PHILIPPINES (6.18%*) 19,932 5.05409,002 Ayala 5,342 1.35
3,088,189 Bank of the Philippine Islands 4,878 1.2420,099,720 Manila Water 9,712 2.46
SRI LANKA (0.45%*) 3,674 0.935,036,288 Hemas Holdings 3,674 0.93
TAIWAN (7.57%*) 33,271 8.443,609,772 Chroma ATE 8,699 2.211,427,757 Delta Electronics 5,765 1.465,567,735 Standard Foods 11,268 2.861,396,154 Taiwan Semiconductor Manufacturing 7,539 1.91
THAILAND (1.62%*) 5,244 1.332,595,200 Delta Electronics Thailand 5,244 1.33
BOTSWANA (0.57%*) 2,666 0.686,883,673 Choppies Enterprises BSE 1,317 0.348,014,220 Choppies Enterprises JSE 1,349 0.34
EGYPT (1.56%*) 5,515 1.40514,027 Commercial International Bank Egypt GDR 1,821 0.46
12,757,497 Juhayna Food Industries 3,694 0.94
GHANA (0.20%*) 801 0.20512,072 Unilever Ghana 801 0.20
Stewart Investors Global Emerging Markets Sustainability Fund
Portfolio Statementas at 31 July 2017
260
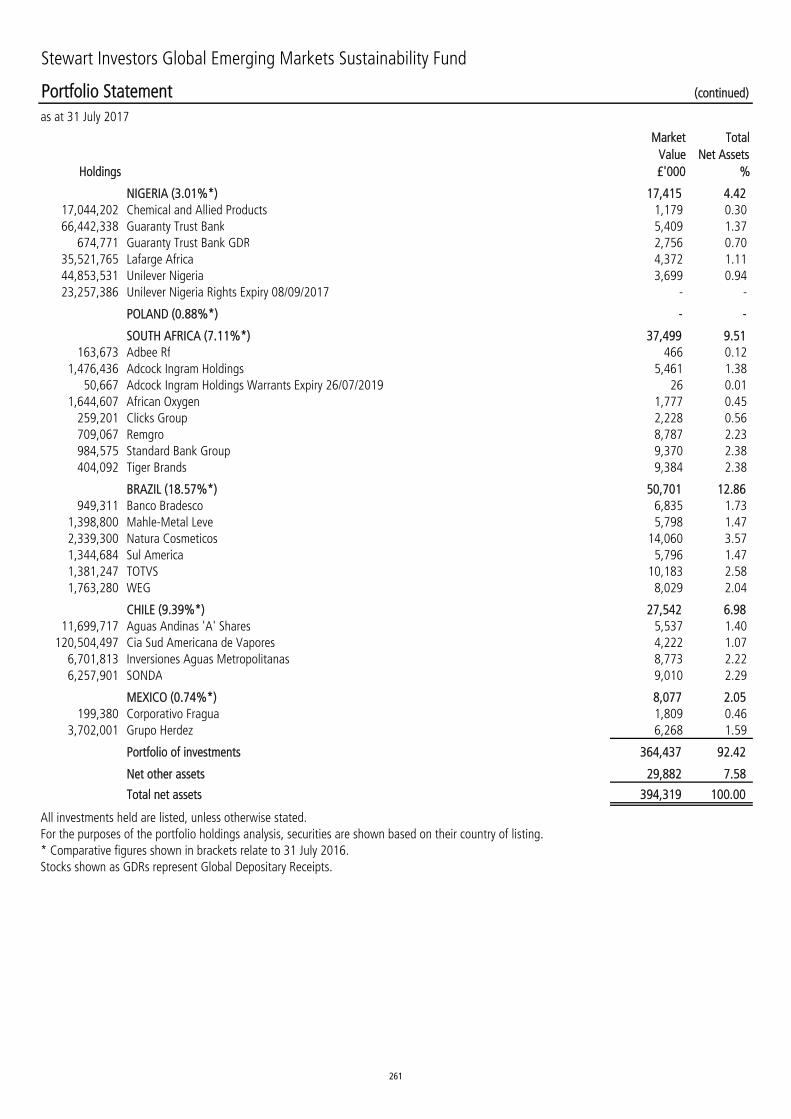
Holdings
MarketValue£'000
TotalNet Assets
%
Stewart Investors Global Emerging Markets Sustainability Fund
Portfolio Statement (continued)
as at 31 July 2017
NIGERIA (3.01%*) 17,415 4.4217,044,202 Chemical and Allied Products 1,179 0.3066,442,338 Guaranty Trust Bank 5,409 1.37
674,771 Guaranty Trust Bank GDR 2,756 0.7035,521,765 Lafarge Africa 4,372 1.1144,853,531 Unilever Nigeria 3,699 0.9423,257,386 Unilever Nigeria Rights Expiry 08/09/2017 - -
POLAND (0.88%*) - -
SOUTH AFRICA (7.11%*) 37,499 9.51163,673 Adbee Rf 466 0.12
1,476,436 Adcock Ingram Holdings 5,461 1.3850,667 Adcock Ingram Holdings Warrants Expiry 26/07/2019 26 0.01
1,644,607 African Oxygen 1,777 0.45259,201 Clicks Group 2,228 0.56709,067 Remgro 8,787 2.23984,575 Standard Bank Group 9,370 2.38404,092 Tiger Brands 9,384 2.38
BRAZIL (18.57%*) 50,701 12.86949,311 Banco Bradesco 6,835 1.73
1,398,800 Mahle-Metal Leve 5,798 1.472,339,300 Natura Cosmeticos 14,060 3.571,344,684 Sul America 5,796 1.471,381,247 TOTVS 10,183 2.581,763,280 WEG 8,029 2.04
CHILE (9.39%*) 27,542 6.9811,699,717 Aguas Andinas 'A' Shares 5,537 1.40
120,504,497 Cia Sud Americana de Vapores 4,222 1.076,701,813 Inversiones Aguas Metropolitanas 8,773 2.226,257,901 SONDA 9,010 2.29
MEXICO (0.74%*) 8,077 2.05199,380 Corporativo Fragua 1,809 0.46
3,702,001 Grupo Herdez 6,268 1.59
Portfolio of investments 364,437 92.42
Net other assets 29,882 7.58
Total net assets 394,319 100.00
Stocks shown as GDRs represent Global Depositary Receipts.
All investments held are listed, unless otherwise stated.
* Comparative figures shown in brackets relate to 31 July 2016.For the purposes of the portfolio holdings analysis, securities are shown based on their country of listing.
261

Share class A Accumulation
Change in net assets per share
Opening net asset value per share
Return before operating charges*
Operating charges
Return after operating charges*
Distributions
Retained distributions on accumulation shares
Closing net asset value per share (p)
* after direct transaction costs of:
Performance
Return after charges (%)
Other information
Closing net asset value (£’000)
Closing number of shares
Operating charges
Direct transaction costs
Prices
Highest share price
Lowest share price 262.12 205.10 223.94
0.09% 0.11% 0.15%
310.63 272.76 262.55
1.76% 1.78% 1.72%
7,914 7,826 20,010
2,594,640 2,903,231 8,652,497
13.15% 16.56% 0.86%
305.02 269.56 231.27
0.27 0.26 0.36
0.61 1.08 1.89
35.46 38.29 1.97
(0.61) (1.08) (1.89)
40.57 42.29 6.12
(5.11) (4.00) (4.15)
269.56 231.27 229.30
Stewart Investors Global Emerging Markets Sustainability Fund
Comparative Tablefor the year ended 31 July 2017
Net Asset Value and Ongoing Charges Figure
Final 31 July 2017(p)
Final 31 July 2016(p)
Final 31 July 2015(p)
262
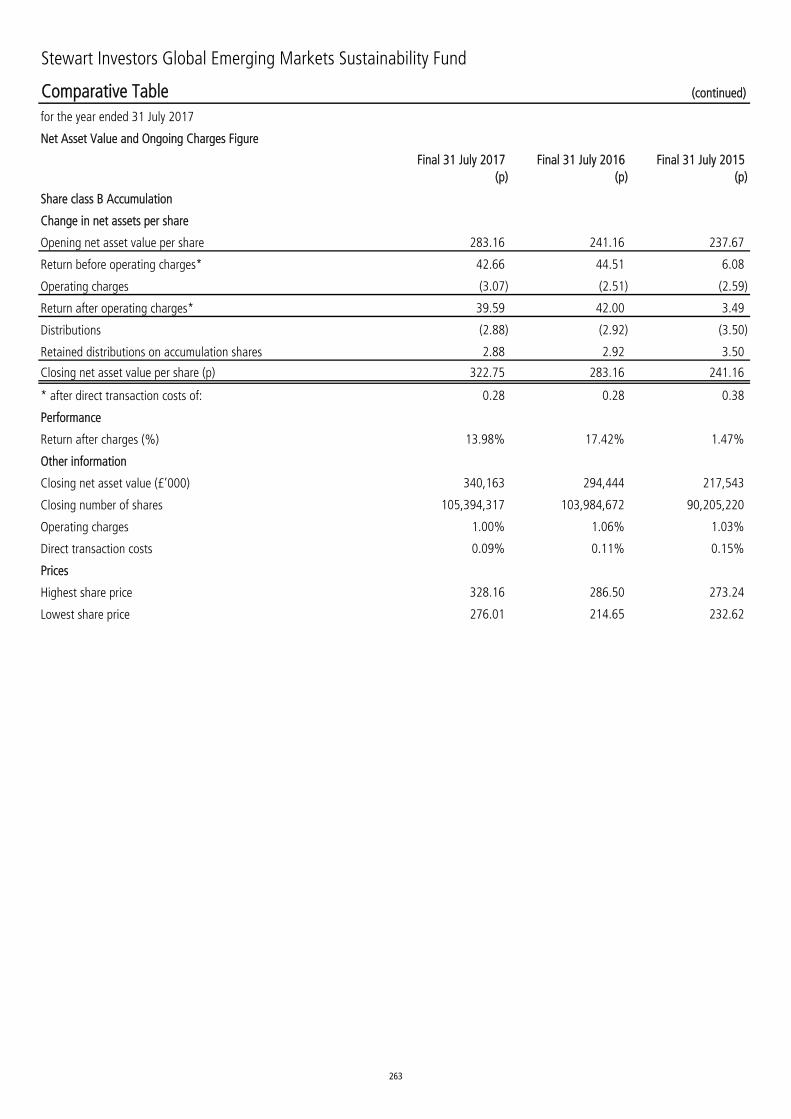
Stewart Investors Global Emerging Markets Sustainability Fund
Comparative Table (continued)
for the year ended 31 July 2017
Net Asset Value and Ongoing Charges Figure
Share class B Accumulation
Change in net assets per share
Opening net asset value per share
Return before operating charges*
Operating charges
Return after operating charges*
Distributions
Retained distributions on accumulation shares
Closing net asset value per share (p)
* after direct transaction costs of:
Performance
Return after charges (%)
Other information
Closing net asset value (£’000)
Closing number of shares
Operating charges
Direct transaction costs
Prices
Highest share price
Lowest share price 276.01 214.65 232.62
0.09% 0.11% 0.15%
328.16 286.50 273.24
1.00% 1.06% 1.03%
340,163 294,444 217,543
105,394,317 103,984,672 90,205,220
13.98% 17.42% 1.47%
322.75 283.16 241.16
0.28 0.28 0.38
2.88 2.92 3.50
39.59 42.00 3.49
(2.88) (2.92) (3.50)
42.66 44.51 6.08
(3.07) (2.51) (2.59)
283.16 241.16 237.67
Final 31 July 2017(p)
Final 31 July 2016(p)
Final 31 July 2015(p)
263
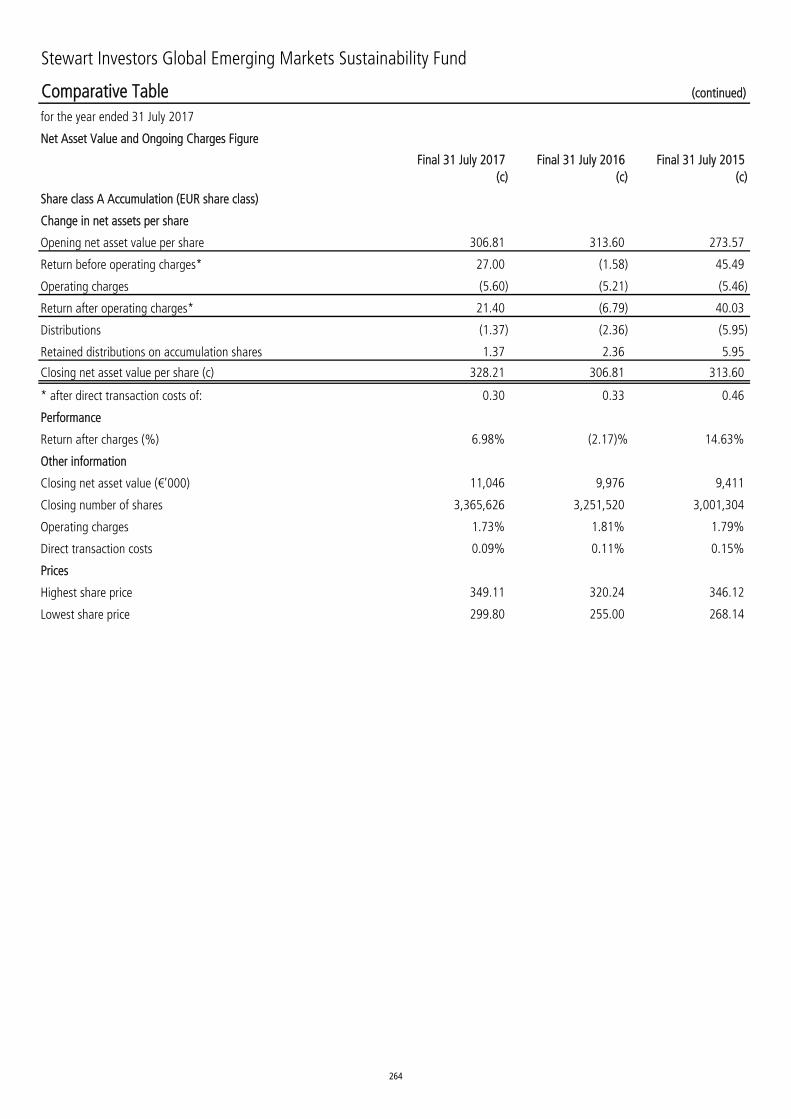
Stewart Investors Global Emerging Markets Sustainability Fund
Comparative Table (continued)
for the year ended 31 July 2017
Net Asset Value and Ongoing Charges Figure
Share class A Accumulation (EUR share class)
Change in net assets per share
Opening net asset value per share
Return before operating charges*
Operating charges
Return after operating charges*
Distributions
Retained distributions on accumulation shares
Closing net asset value per share (c)
* after direct transaction costs of:
Performance
Return after charges (%)
Other information
Closing net asset value (€’000)
Closing number of shares
Operating charges
Direct transaction costs
Prices
Highest share price
Lowest share price 299.80 255.00 268.14
0.09% 0.11% 0.15%
349.11 320.24 346.12
1.73% 1.81% 1.79%
11,046 9,976 9,411
3,365,626 3,251,520 3,001,304
6.98% (2.17)% 14.63%
328.21 306.81 313.60
0.30 0.33 0.46
1.37 2.36 5.95
21.40 (6.79) 40.03
(1.37) (2.36) (5.95)
27.00 (1.58) 45.49
(5.60) (5.21) (5.46)
306.81 313.60 273.57
Final 31 July 2017(c)
Final 31 July 2016(c)
Final 31 July 2015(c)
264
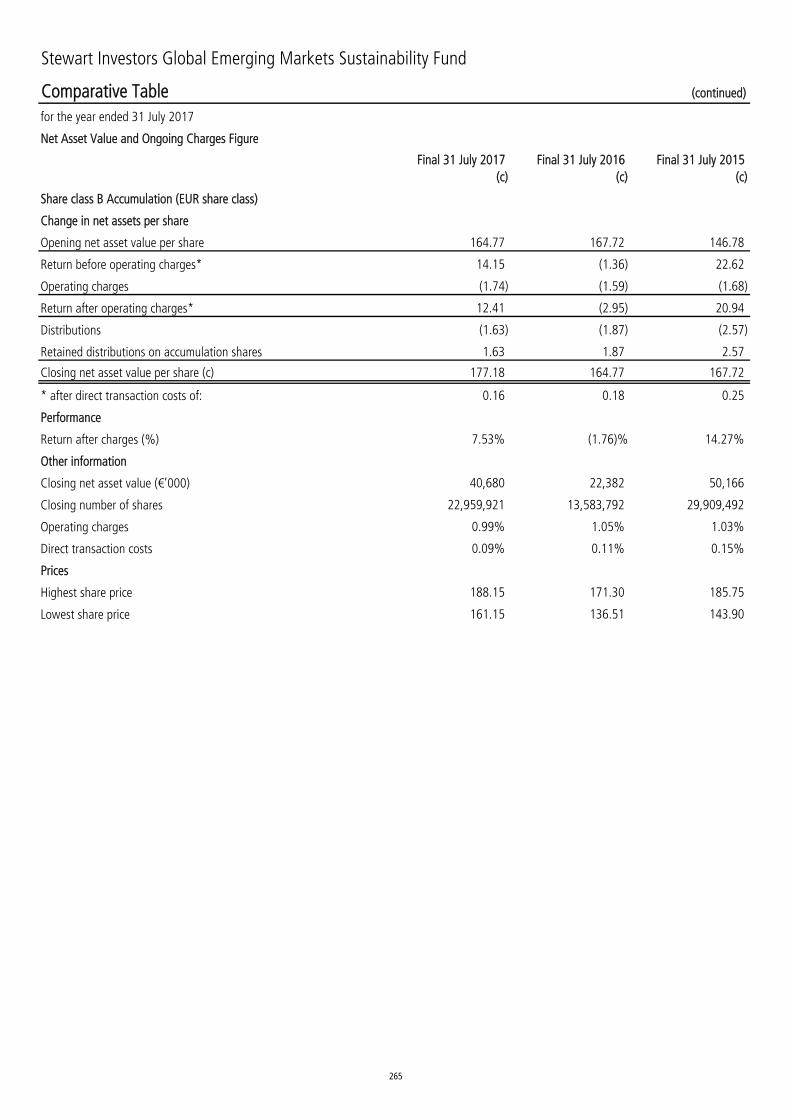
Stewart Investors Global Emerging Markets Sustainability Fund
Comparative Table (continued)
for the year ended 31 July 2017
Net Asset Value and Ongoing Charges Figure
Share class B Accumulation (EUR share class)
Change in net assets per share
Opening net asset value per share
Return before operating charges*
Operating charges
Return after operating charges*
Distributions
Retained distributions on accumulation shares
Closing net asset value per share (c)
* after direct transaction costs of:
Performance
Return after charges (%)
Other information
Closing net asset value (€’000)
Closing number of shares
Operating charges
Direct transaction costs
Prices
Highest share price
Lowest share price 161.15 136.51 143.90
0.09% 0.11% 0.15%
188.15 171.30 185.75
0.99% 1.05% 1.03%
40,680 22,382 50,166
22,959,921 13,583,792 29,909,492
7.53% (1.76)% 14.27%
177.18 164.77 167.72
0.16 0.18 0.25
1.63 1.87 2.57
12.41 (2.95) 20.94
(1.63) (1.87) (2.57)
14.15 (1.36) 22.62
(1.74) (1.59) (1.68)
164.77 167.72 146.78
Final 31 July 2017(c)
Final 31 July 2016(c)
Final 31 July 2015(c)
265
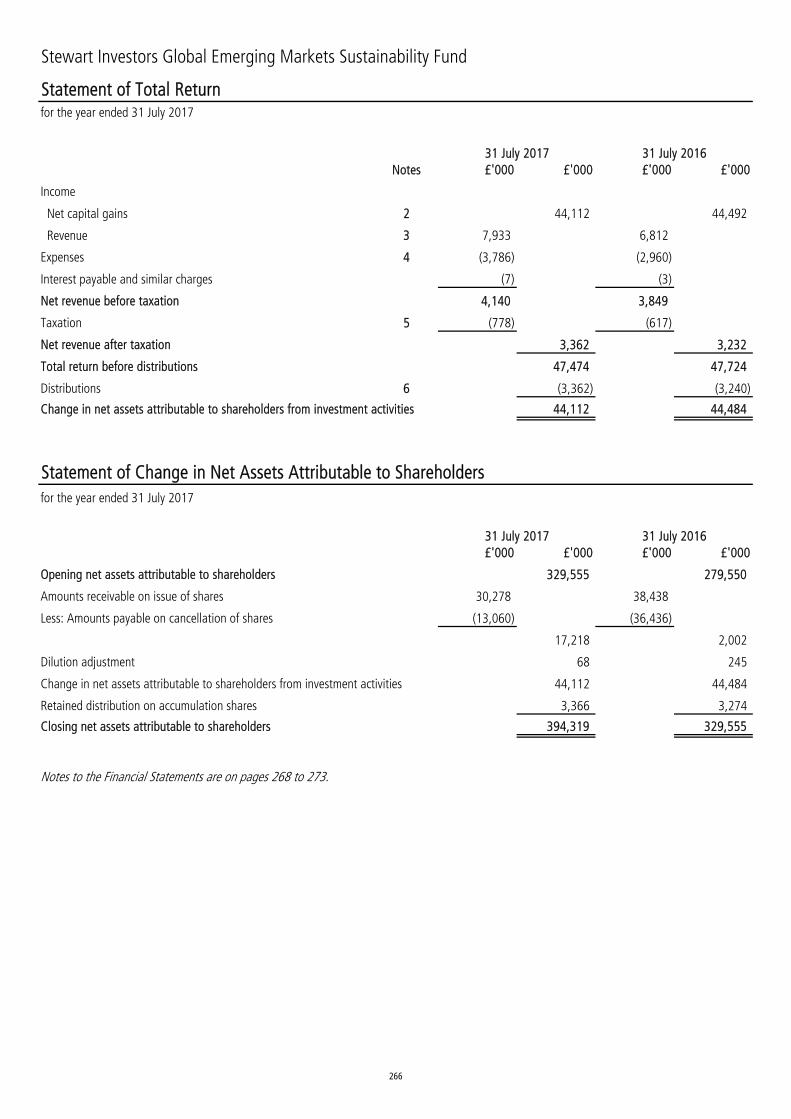
Notes £'000 £'000 £'000 £'000
Net capital gains 2 44,112 44,492
Revenue 3 7,933 6,812
4 (3,786) (2,960)
Interest payable and similar charges (7) (3)
4,140 3,849
5 (778) (617)
3,362 3,232
47,474 47,724
6 (3,362) (3,240)
44,112 44,484
£'000 £'000 £'000 £'000
329,555 279,550
30,278 38,438
(13,060) (36,436)
17,218 2,002
68 245
44,112 44,484
3,366 3,274
394,319 329,555
Less: Amounts payable on cancellation of shares
Dilution adjustment
Change in net assets attributable to shareholders from investment activities
Retained distribution on accumulation shares
Closing net assets attributable to shareholders
Notes to the Financial Statements are on pages 268 to 273.
Amounts receivable on issue of shares
for the year ended 31 July 2017
31 July 2017 31 July 2016
Opening net assets attributable to shareholders
Statement of Change in Net Assets Attributable to Shareholders
Income
Expenses
Net revenue before taxation
Taxation
Net revenue after taxation
Total return before distributions
Distributions
Change in net assets attributable to shareholders from investment activities
31 July 2017 31 July 2016
Stewart Investors Global Emerging Markets Sustainability Fund
Statement of Total Returnfor the year ended 31 July 2017
266
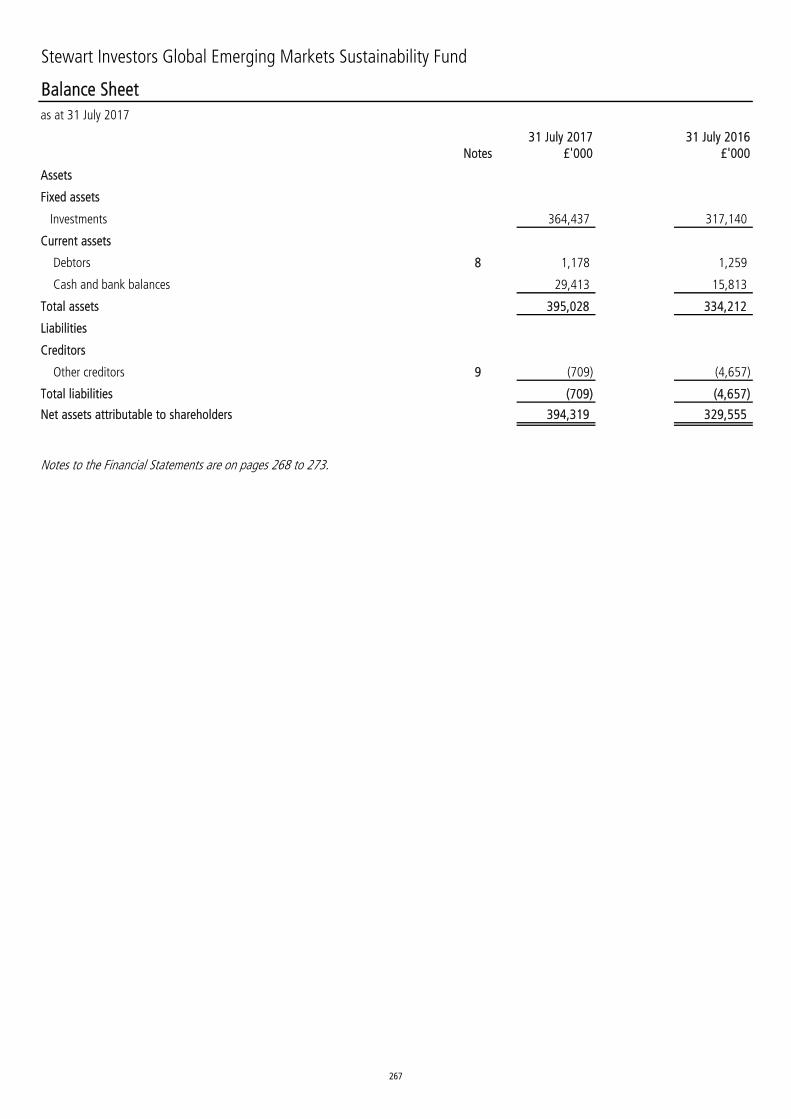
Stewart Investors Global Emerging Markets Sustainability Fund
31 July 2017 31 July 2016Notes £'000 £'000
Investments 364,437 317,140
Current assets
8 1,178 1,259
29,413 15,813
395,028 334,212
Creditors
Other creditors 9 (709) (4,657)
(709) (4,657)
394,319 329,555
Notes to the Financial Statements are on pages 268 to 273.
Total liabilities
Net assets attributable to shareholders
Balance Sheetas at 31 July 2017
Assets
Fixed assets
Debtors
Cash and bank balances
Total assets
Liabilities
267
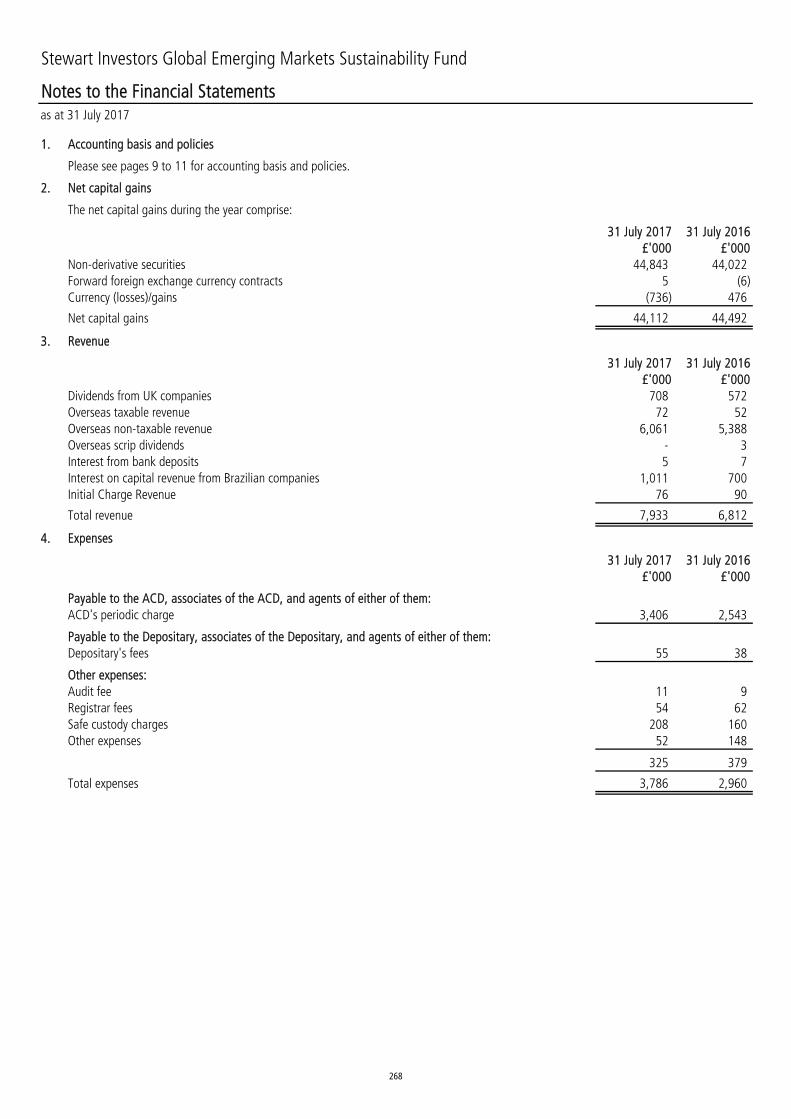
1.
2.
31 July 2017 31 July 2016£'000 £'000
44,843 44,0225 (6)
(736) 476
44,112 44,492
3.
31 July 2017 31 July 2016£'000 £'000
708 57272 52
6,061 5,388- 35 7
1,011 70076 90
7,933 6,812
4.
31 July 2017 31 July 2016£'000 £'000
3,406 2,543
55 38
11 954 62
208 16052 148
325 379
3,786 2,960Total expenses
Audit feeRegistrar feesSafe custody chargesOther expenses
Other expenses:
Payable to the Depositary, associates of the Depositary, and agents of either of them:Depositary's fees
Expenses
Payable to the ACD, associates of the ACD, and agents of either of them:ACD's periodic charge
Initial Charge Revenue
Total revenue
Interest on capital revenue from Brazilian companiesInterest from bank depositsOverseas scrip dividends
Dividends from UK companiesOverseas taxable revenueOverseas non-taxable revenue
Net capital gains
Revenue
Forward foreign exchange currency contractsCurrency (losses)/gains
Accounting basis and policies
Please see pages 9 to 11 for accounting basis and policies.
Net capital gains
The net capital gains during the year comprise:
Non-derivative securities
Notes to the Financial Statementsas at 31 July 2017
Stewart Investors Global Emerging Markets Sustainability Fund
268
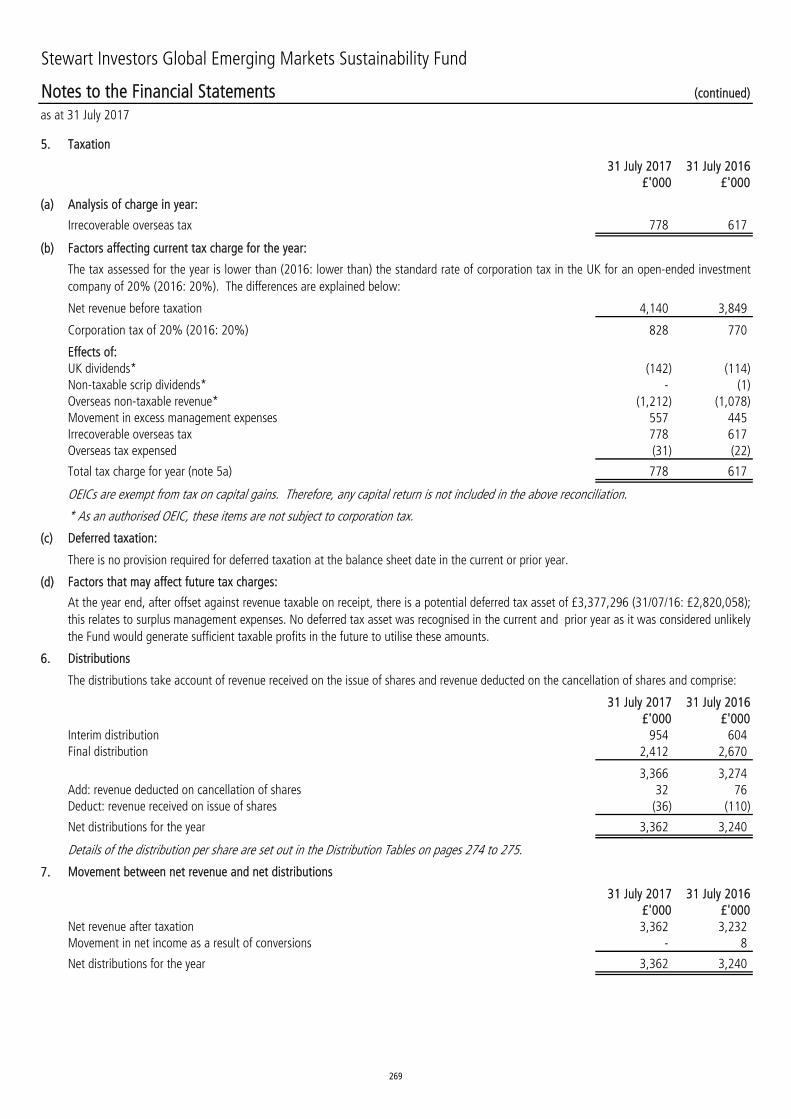
Notes to the Financial Statements (continued)
as at 31 July 2017
Stewart Investors Global Emerging Markets Sustainability Fund
5.
31 July 2017 31 July 2016£'000 £'000
(a)
778 617
(b)
4,140 3,849
828 770
(142) (114)- (1)
(1,212) (1,078)557 445778 617(31) (22)
778 617
(c)
(d)
6.
31 July 2017 31 July 2016£'000 £'000
954 6042,412 2,670
3,366 3,27432 76
(36) (110)
3,362 3,240
7.
31 July 2017 31 July 2016£'000 £'0003,362 3,232
- 8
3,362 3,240
Movement in net income as a result of conversions
Net distributions for the year
Details of the distribution per share are set out in the Distribution Tables on pages 274 to 275.
Movement between net revenue and net distributions
Net revenue after taxation
Add: revenue deducted on cancellation of sharesDeduct: revenue received on issue of shares
Net distributions for the year
Final distributionInterim distribution
Distributions
The distributions take account of revenue received on the issue of shares and revenue deducted on the cancellation of shares and comprise:
Factors that may affect future tax charges:
At the year end, after offset against revenue taxable on receipt, there is a potential deferred tax asset of £3,377,296 (31/07/16: £2,820,058);this relates to surplus management expenses. No deferred tax asset was recognised in the current and prior year as it was considered unlikelythe Fund would generate sufficient taxable profits in the future to utilise these amounts.
Deferred taxation:
There is no provision required for deferred taxation at the balance sheet date in the current or prior year.
Total tax charge for year (note 5a)
OEICs are exempt from tax on capital gains. Therefore, any capital return is not included in the above reconciliation.
* As an authorised OEIC, these items are not subject to corporation tax.
Overseas tax expensed
Movement in excess management expensesIrrecoverable overseas tax
UK dividends*Non-taxable scrip dividends*Overseas non-taxable revenue*
Net revenue before taxation
Corporation tax of 20% (2016: 20%)
Effects of:
Factors affecting current tax charge for the year:
The tax assessed for the year is lower than (2016: lower than) the standard rate of corporation tax in the UK for an open-ended investmentcompany of 20% (2016: 20%). The differences are explained below:
Irrecoverable overseas tax
Analysis of charge in year:
Taxation
269
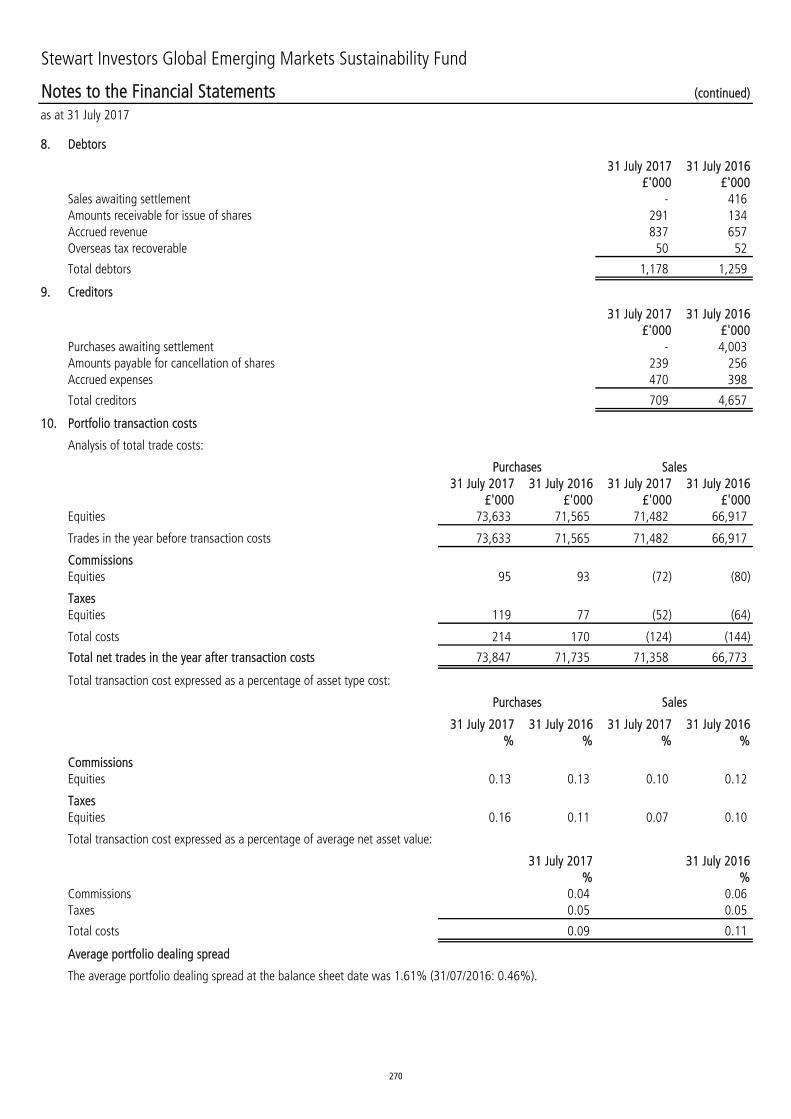
Notes to the Financial Statements (continued)
as at 31 July 2017
Stewart Investors Global Emerging Markets Sustainability Fund
8.
31 July 2017 31 July 2016£'000 £'000
- 416291 134837 657
50 52
1,178 1,259
9.
31 July 2017 31 July 2016£'000 £'000
- 4,003239 256470 398
709 4,657
10.
31 July 2017 31 July 2016 31 July 2017 31 July 2016£'000 £'000 £'000 £'000
73,633 71,565 71,482 66,917
73,633 71,565 71,482 66,917
95 93 (72) (80)
119 77 (52) (64)
214 170 (124) (144)
73,847 71,735 71,358 66,773
31 July 2017 31 July 2016 31 July 2017 31 July 2016% % % %
0.13 0.13 0.10 0.12
0.16 0.11 0.07 0.10
The average portfolio dealing spread at the balance sheet date was 1.61% (31/07/2016: 0.46%).
Total costs 0.09 0.11
Average portfolio dealing spread
Commissions 0.04 0.06Taxes 0.05 0.05
Total transaction cost expressed as a percentage of average net asset value:
31 July 2017 31 July 2016% %
EquitiesTaxes
CommissionsEquities
Total transaction cost expressed as a percentage of asset type cost:
Purchases Sales
Total costs
Total net trades in the year after transaction costs
TaxesEquities
Trades in the year before transaction costs
CommissionsEquities
Analysis of total trade costs:
Purchases Sales
Equities
Total creditors
Portfolio transaction costs
Purchases awaiting settlementAmounts payable for cancellation of sharesAccrued expenses
Creditors
Total debtors
Overseas tax recoverable
Amounts receivable for issue of sharesAccrued revenue
Debtors
Sales awaiting settlement
270
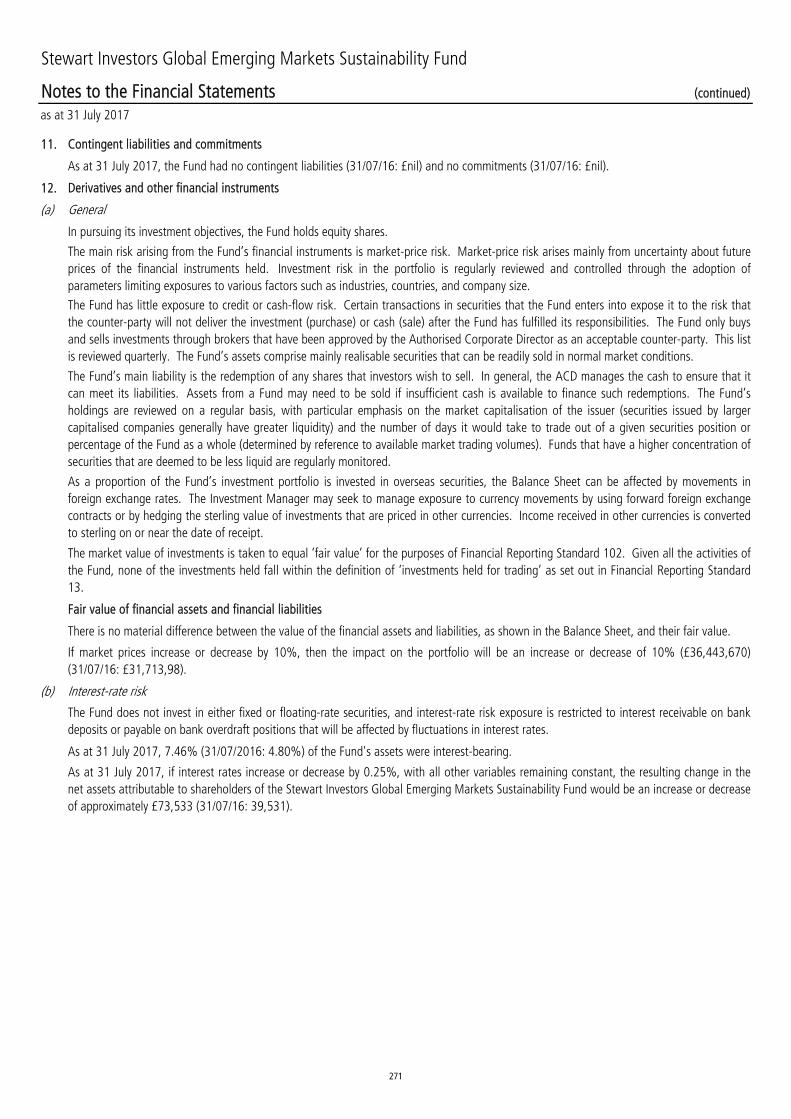
Notes to the Financial Statements (continued)
as at 31 July 2017
Stewart Investors Global Emerging Markets Sustainability Fund
11.
12.
(a)
(b)
As at 31 July 2017, 7.46% (31/07/2016: 4.80%) of the Fund's assets were interest-bearing.
As at 31 July 2017, if interest rates increase or decrease by 0.25%, with all other variables remaining constant, the resulting change in thenet assets attributable to shareholders of the Stewart Investors Global Emerging Markets Sustainability Fund would be an increase or decreaseof approximately £73,533 (31/07/16: 39,531).
There is no material difference between the value of the financial assets and liabilities, as shown in the Balance Sheet, and their fair value.
If market prices increase or decrease by 10%, then the impact on the portfolio will be an increase or decrease of 10% (£36,443,670)(31/07/16: £31,713,98).
Interest-rate risk
The Fund does not invest in either fixed or floating-rate securities, and interest-rate risk exposure is restricted to interest receivable on bankdeposits or payable on bank overdraft positions that will be affected by fluctuations in interest rates.
The Fund’s main liability is the redemption of any shares that investors wish to sell. In general, the ACD manages the cash to ensure that itcan meet its liabilities. Assets from a Fund may need to be sold if insufficient cash is available to finance such redemptions. The Fund’sholdings are reviewed on a regular basis, with particular emphasis on the market capitalisation of the issuer (securities issued by largercapitalised companies generally have greater liquidity) and the number of days it would take to trade out of a given securities position orpercentage of the Fund as a whole (determined by reference to available market trading volumes). Funds that have a higher concentration ofsecurities that are deemed to be less liquid are regularly monitored.
As a proportion of the Fund’s investment portfolio is invested in overseas securities, the Balance Sheet can be affected by movements inforeign exchange rates. The Investment Manager may seek to manage exposure to currency movements by using forward foreign exchangecontracts or by hedging the sterling value of investments that are priced in other currencies. Income received in other currencies is convertedto sterling on or near the date of receipt.
The market value of investments is taken to equal ‘fair value’ for the purposes of Financial Reporting Standard 102. Given all the activities ofthe Fund, none of the investments held fall within the definition of ‘investments held for trading’ as set out in Financial Reporting Standard13.
Fair value of financial assets and financial liabilities
Derivatives and other financial instruments
General
In pursuing its investment objectives, the Fund holds equity shares.
The main risk arising from the Fund’s financial instruments is market-price risk. Market-price risk arises mainly from uncertainty about futureprices of the financial instruments held. Investment risk in the portfolio is regularly reviewed and controlled through the adoption ofparameters limiting exposures to various factors such as industries, countries, and company size.
The Fund has little exposure to credit or cash-flow risk. Certain transactions in securities that the Fund enters into expose it to the risk thatthe counter-party will not deliver the investment (purchase) or cash (sale) after the Fund has fulfilled its responsibilities. The Fund only buysand sells investments through brokers that have been approved by the Authorised Corporate Director as an acceptable counter-party. This listis reviewed quarterly. The Fund’s assets comprise mainly realisable securities that can be readily sold in normal market conditions.
Contingent liabilities and commitments
As at 31 July 2017, the Fund had no contingent liabilities (31/07/16: £nil) and no commitments (31/07/16: £nil).
271
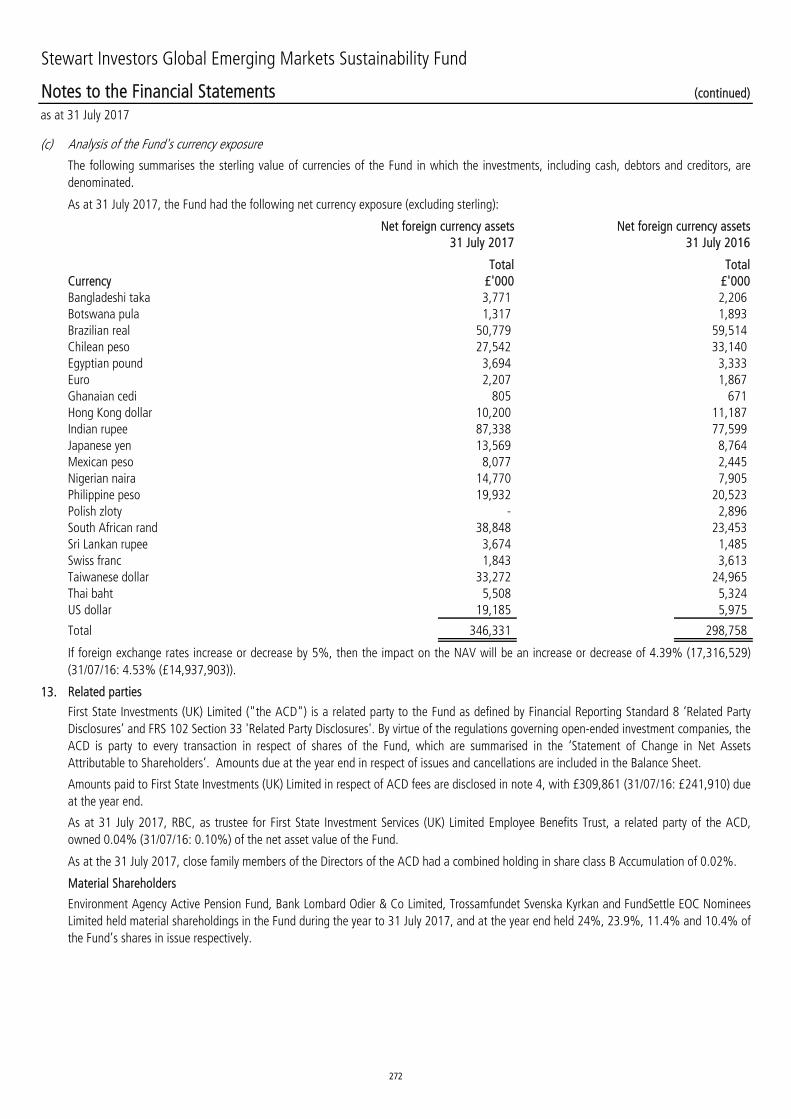
Notes to the Financial Statements (continued)
as at 31 July 2017
Stewart Investors Global Emerging Markets Sustainability Fund
(c)
Total TotalCurrency £'000 £'000Bangladeshi taka 3,771 2,206Botswana pula 1,317 1,893Brazilian real 50,779 59,514Chilean peso 27,542 33,140Egyptian pound 3,694 3,333Euro 2,207 1,867Ghanaian cedi 805 671Hong Kong dollar 10,200 11,187Indian rupee 87,338 77,599Japanese yen 13,569 8,764Mexican peso 8,077 2,445Nigerian naira 14,770 7,905Philippine peso 19,932 20,523Polish zloty - 2,896South African rand 38,848 23,453Sri Lankan rupee 3,674 1,485Swiss franc 1,843 3,613Taiwanese dollar 33,272 24,965Thai baht 5,508 5,324US dollar 19,185 5,975
Total 346,331 298,758
13.
Material Shareholders
Environment Agency Active Pension Fund, Bank Lombard Odier & Co Limited, Trossamfundet Svenska Kyrkan and FundSettle EOC NomineesLimited held material shareholdings in the Fund during the year to 31 July 2017, and at the year end held 24%, 23.9%, 11.4% and 10.4% ofthe Fund’s shares in issue respectively.
Amounts paid to First State Investments (UK) Limited in respect of ACD fees are disclosed in note 4, with £309,861 (31/07/16: £241,910) due at the year end.
As at 31 July 2017, RBC, as trustee for First State Investment Services (UK) Limited Employee Benefits Trust, a related party of the ACD,owned 0.04% (31/07/16: 0.10%) of the net asset value of the Fund.
As at the 31 July 2017, close family members of the Directors of the ACD had a combined holding in share class B Accumulation of 0.02%.
Related parties
First State Investments (UK) Limited ("the ACD") is a related party to the Fund as defined by Financial Reporting Standard 8 ‘Related PartyDisclosures’ and FRS 102 Section 33 'Related Party Disclosures'. By virtue of the regulations governing open-ended investment companies, theACD is party to every transaction in respect of shares of the Fund, which are summarised in the ‘Statement of Change in Net AssetsAttributable to Shareholders’. Amounts due at the year end in respect of issues and cancellations are included in the Balance Sheet.
If foreign exchange rates increase or decrease by 5%, then the impact on the NAV will be an increase or decrease of 4.39% (17,316,529)(31/07/16: 4.53% (£14,937,903)).
The following summarises the sterling value of currencies of the Fund in which the investments, including cash, debtors and creditors, aredenominated.
As at 31 July 2017, the Fund had the following net currency exposure (excluding sterling):
Net foreign currency assets Net foreign currency assets31 July 2017 31 July 2016
Analysis of the Fund's currency exposure
272
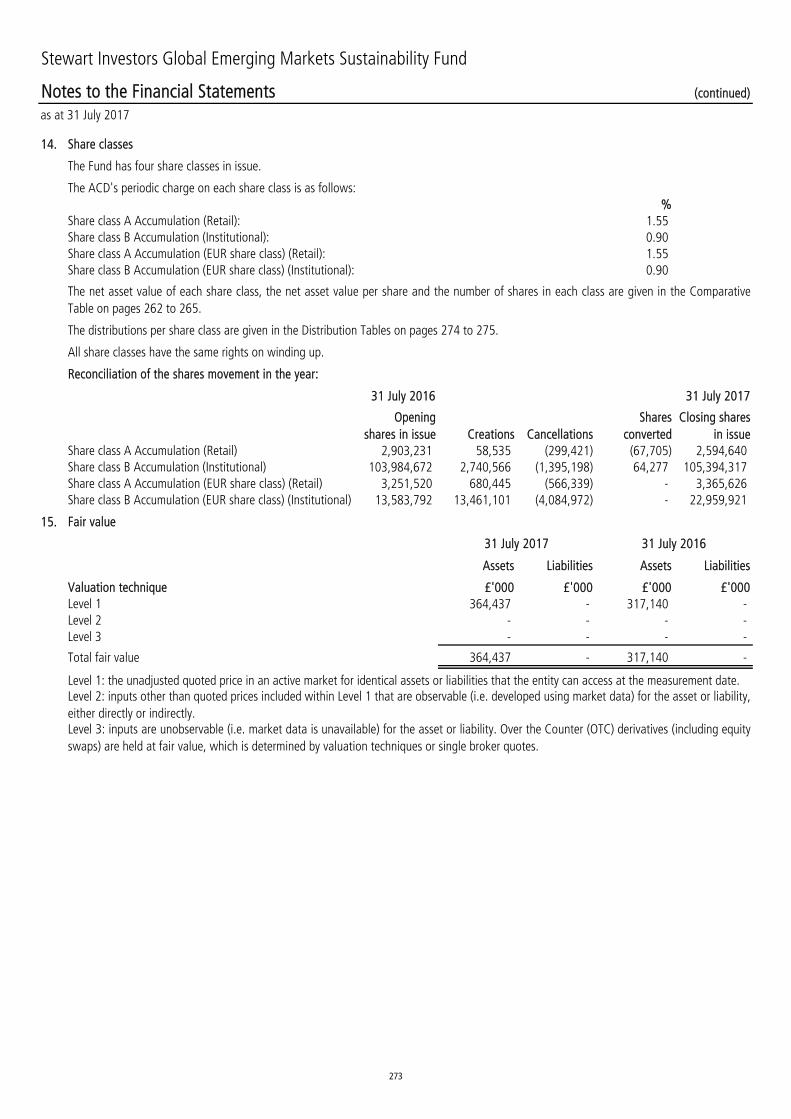
Notes to the Financial Statements (continued)
as at 31 July 2017
Stewart Investors Global Emerging Markets Sustainability Fund
14.
%1.550.901.550.90
31 July 2016 31 July 2017
Opening shares in issue Creations Cancellations
Shares converted
Closing shares in issue
2,903,231 58,535 (299,421) (67,705) 2,594,640103,984,672 2,740,566 (1,395,198) 64,277 105,394,317
3,251,520 680,445 (566,339) - 3,365,62613,583,792 13,461,101 (4,084,972) - 22,959,921
15.
Assets Liabilities Assets Liabilities
£'000 £'000 £'000 £'000364,437 - 317,140 -
- - - -- - - -
364,437 - 317,140 -
Level 3: inputs are unobservable (i.e. market data is unavailable) for the asset or liability. Over the Counter (OTC) derivatives (including equityswaps) are held at fair value, which is determined by valuation techniques or single broker quotes.
Level 1Level 2Level 3
Total fair value
Level 1: the unadjusted quoted price in an active market for identical assets or liabilities that the entity can access at the measurement date. Level 2: inputs other than quoted prices included within Level 1 that are observable (i.e. developed using market data) for the asset or liability,either directly or indirectly.
Fair value
Valuation technique
31 July 2017 31 July 2016
Share class B Accumulation (EUR share class) (Institutional)
All share classes have the same rights on winding up.
Reconciliation of the shares movement in the year:
Share class A Accumulation (Retail)Share class B Accumulation (Institutional)Share class A Accumulation (EUR share class) (Retail)
The net asset value of each share class, the net asset value per share and the number of shares in each class are given in the ComparativeTable on pages 262 to 265.
The distributions per share class are given in the Distribution Tables on pages 274 to 275.
The ACD's periodic charge on each share class is as follows:
Share class A Accumulation (Retail):Share class B Accumulation (Institutional):Share class A Accumulation (EUR share class) (Retail):Share class B Accumulation (EUR share class) (Institutional):
Share classes
The Fund has four share classes in issue.
273
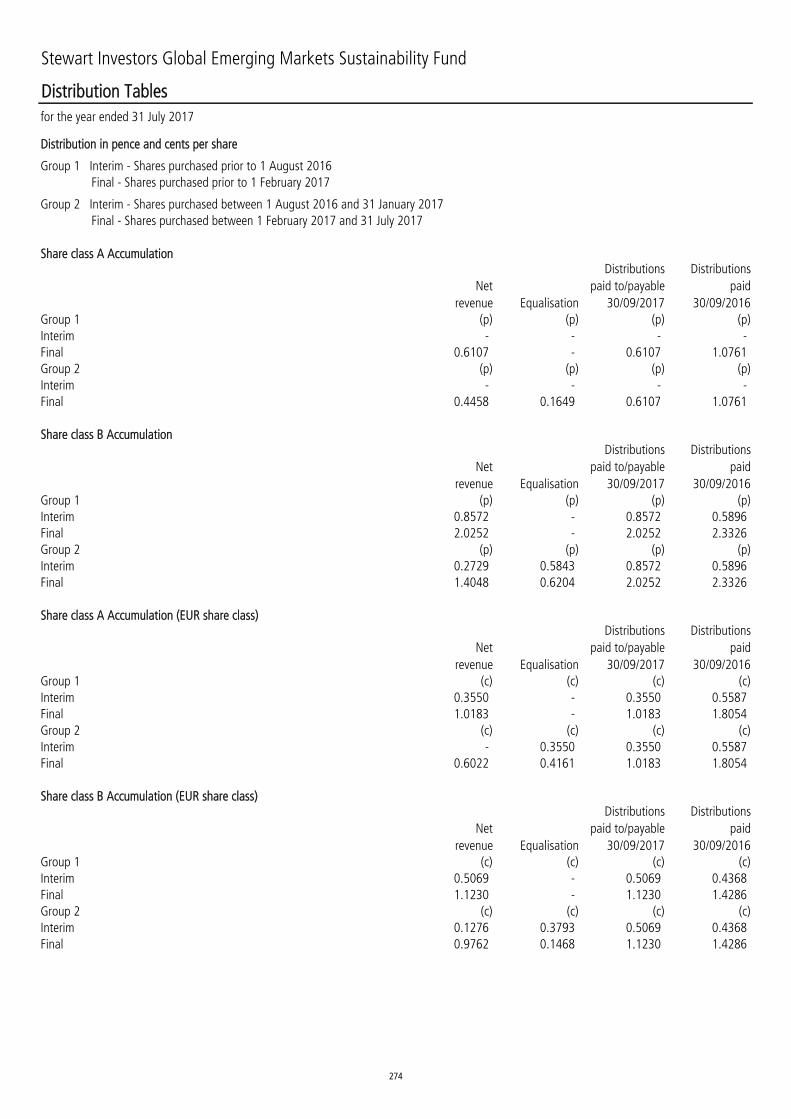
Share class A Accumulation
Netrevenue Equalisation
Distributions paid to/payable
30/09/2017
Distributions paid
30/09/2016Group 1 (p) (p) (p) (p)Interim - - - -Final 0.6107 - 0.6107 1.0761Group 2 (p) (p) (p) (p)Interim - - - -Final 0.4458 0.1649 0.6107 1.0761
Share class B Accumulation
Netrevenue Equalisation
Distributions paid to/payable
30/09/2017
Distributions paid
30/09/2016Group 1 (p) (p) (p) (p)Interim 0.8572 - 0.8572 0.5896Final 2.0252 - 2.0252 2.3326Group 2 (p) (p) (p) (p)Interim 0.2729 0.5843 0.8572 0.5896Final 1.4048 0.6204 2.0252 2.3326
Share class A Accumulation (EUR share class)
Netrevenue Equalisation
Distributions paid to/payable
30/09/2017
Distributions paid
30/09/2016Group 1 (c) (c) (c) (c)Interim 0.3550 - 0.3550 0.5587Final 1.0183 - 1.0183 1.8054Group 2 (c) (c) (c) (c)Interim - 0.3550 0.3550 0.5587Final 0.6022 0.4161 1.0183 1.8054
Share class B Accumulation (EUR share class)
Netrevenue Equalisation
Distributions paid to/payable
30/09/2017
Distributions paid
30/09/2016Group 1 (c) (c) (c) (c)Interim 0.5069 - 0.5069 0.4368Final 1.1230 - 1.1230 1.4286Group 2 (c) (c) (c) (c)Interim 0.1276 0.3793 0.5069 0.4368Final 0.9762 0.1468 1.1230 1.4286
Final - Shares purchased between 1 February 2017 and 31 July 2017Group 2 Interim - Shares purchased between 1 August 2016 and 31 January 2017
Final - Shares purchased prior to 1 February 2017
Distribution in pence and cents per share
Stewart Investors Global Emerging Markets Sustainability Fund
Distribution Tablesfor the year ended 31 July 2017
Group 1 Interim - Shares purchased prior to 1 August 2016
274

Stewart Investors Global Emerging Markets Sustainability Fund
Distribution Tables (continued)
for the year ended 31 July 2017
Shareholders should consult their professional advisers for any advice regarding their tax position.
Final - 100.00% of the dividend is received as franked investment income.
Final - 0.00% of the dividend is received as an annual payment (non-foreign element) received after the deduction of income tax at the lower rateand is liable to corporation tax. The tax deemed to be deducted is treated as income tax.
Final - 0.00% of the dividend is received as an annual payment (foreign element) received after the deduction of income tax at the lower rate and isliable to corporation tax. It is treated as foreign income in the hands of the corporate investor and is liable to corporation tax. The associateddeemed tax is treated as foreign tax in the hands of the investor, who may be able to claim double tax relief. Investors cannot reclaim any of thisdeemed tax on the foreign element from HM Revenue & Customs.
Interim - 100.00% of the dividend is received as franked investment income.
Interim - 0.00% of the dividend is received as an annual payment (non-foreign element) received after the deduction of income tax at the lowerrate and is liable to corporation tax. The tax deemed to be deducted is treated as income tax.
Interim - 0.00% of the dividend is received as an annual payment (foreign element) received after the deduction of income tax at the lower rate andis liable to corporation tax. It is treated as foreign income in the hands of the corporate investor and is liable to corporation tax. The associateddeemed tax is treated as foreign tax in the hands of the investor, who may be able to claim double tax relief. Investors cannot reclaim any of thisdeemed tax on the foreign element from HM Revenue & Customs.
Corporate tax for all share classes (unaudited)
A shareholder liable to corporation tax receives this distribution, excluding equalisation, as follows:
275
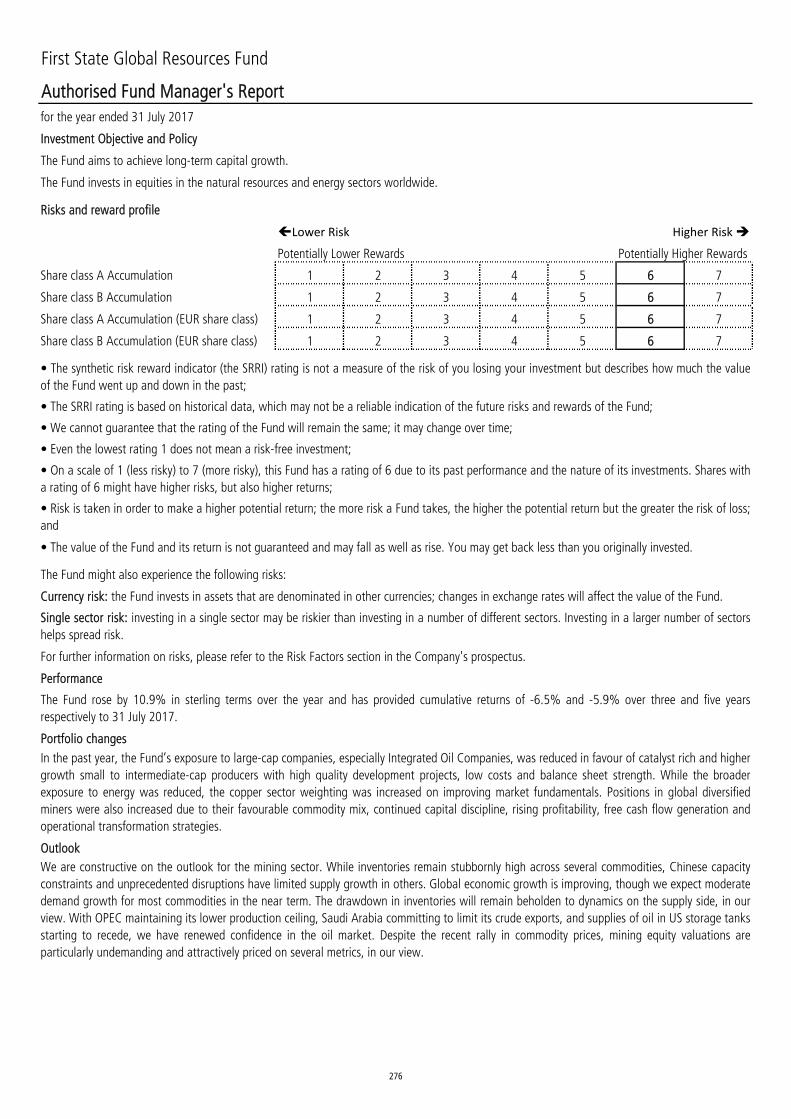
Risks and reward profile
Lower Risk Higher Risk
Potentially Lower Rewards Potentially Higher Rewards
1 2 3 4 5 6 7
1 2 3 4 5 6 7
1 2 3 4 5 6 7
1 2 3 4 5 6 7
OutlookWe are constructive on the outlook for the mining sector. While inventories remain stubbornly high across several commodities, Chinese capacityconstraints and unprecedented disruptions have limited supply growth in others. Global economic growth is improving, though we expect moderatedemand growth for most commodities in the near term. The drawdown in inventories will remain beholden to dynamics on the supply side, in ourview. With OPEC maintaining its lower production ceiling, Saudi Arabia committing to limit its crude exports, and supplies of oil in US storage tanksstarting to recede, we have renewed confidence in the oil market. Despite the recent rally in commodity prices, mining equity valuations areparticularly undemanding and attractively priced on several metrics, in our view.
Portfolio changes
In the past year, the Fund’s exposure to large-cap companies, especially Integrated Oil Companies, was reduced in favour of catalyst rich and highergrowth small to intermediate-cap producers with high quality development projects, low costs and balance sheet strength. While the broaderexposure to energy was reduced, the copper sector weighting was increased on improving market fundamentals. Positions in global diversifiedminers were also increased due to their favourable commodity mix, continued capital discipline, rising profitability, free cash flow generation andoperational transformation strategies.
Performance
The Fund rose by 10.9% in sterling terms over the year and has provided cumulative returns of -6.5% and -5.9% over three and five yearsrespectively to 31 July 2017.
For further information on risks, please refer to the Risk Factors section in the Company's prospectus.
Single sector risk: investing in a single sector may be riskier than investing in a number of different sectors. Investing in a larger number of sectorshelps spread risk.
Currency risk: the Fund invests in assets that are denominated in other currencies; changes in exchange rates will affect the value of the Fund.
• Even the lowest rating 1 does not mean a risk-free investment;
• On a scale of 1 (less risky) to 7 (more risky), this Fund has a rating of 6 due to its past performance and the nature of its investments. Shares witha rating of 6 might have higher risks, but also higher returns;
• Risk is taken in order to make a higher potential return; the more risk a Fund takes, the higher the potential return but the greater the risk of loss;and
• The value of the Fund and its return is not guaranteed and may fall as well as rise. You may get back less than you originally invested.
The Fund might also experience the following risks:
• The synthetic risk reward indicator (the SRRI) rating is not a measure of the risk of you losing your investment but describes how much the valueof the Fund went up and down in the past;
• The SRRI rating is based on historical data, which may not be a reliable indication of the future risks and rewards of the Fund;
• We cannot guarantee that the rating of the Fund will remain the same; it may change over time;
Share class A Accumulation
Share class B Accumulation
Share class A Accumulation (EUR share class)
Share class B Accumulation (EUR share class)
The Fund aims to achieve long-term capital growth.
The Fund invests in equities in the natural resources and energy sectors worldwide.
First State Global Resources Fund
Authorised Fund Manager's Reportfor the year ended 31 July 2017
Investment Objective and Policy
276
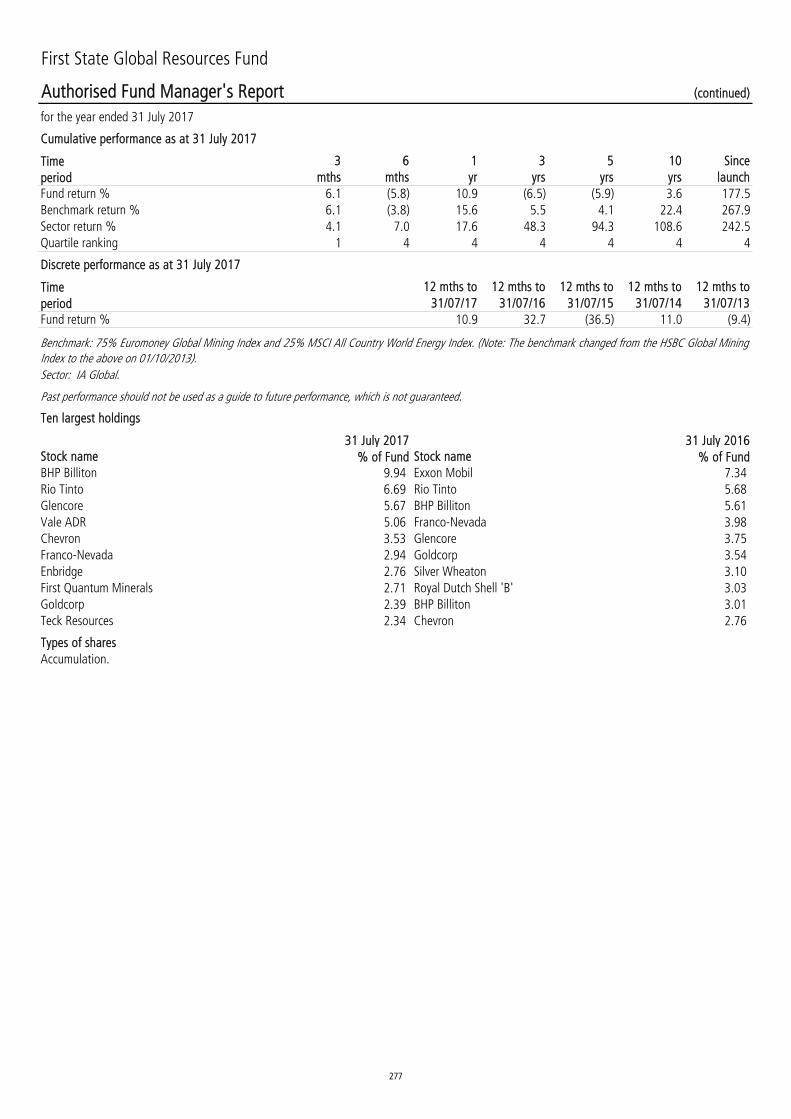
(continued)
First State Global Resources Fund
Authorised Fund Manager's Reportfor the year ended 31 July 2017
Time 3 6 1 3 5 10 Sinceperiod mths mths yr yrs yrs yrs launch
6.1 (5.8) 10.9 (6.5) (5.9) 3.6 177.5 6.1 (3.8) 15.6 5.5 4.1 22.4 267.9 4.1 7.0 17.6 48.3 94.3 108.6 242.5
1 4 4 4 4 4 4
12 mths to 12 mths to 12 mths to 12 mths to 12 mths to31/07/17 31/07/16 31/07/15 31/07/14 31/07/13
10.9 32.7 (36.5) 11.0 (9.4)
31 July 2017 31 July 2016% of Fund % of Fund
9.94 7.346.69 5.685.67 5.615.06 3.983.53 3.752.94 3.542.76 3.102.71 3.032.39 3.012.34 2.76
Types of sharesAccumulation.
First Quantum Minerals Royal Dutch Shell 'B'Goldcorp BHP BillitonTeck Resources Chevron
Chevron GlencoreFranco-Nevada GoldcorpEnbridge Silver Wheaton
Rio Tinto Rio TintoGlencore BHP BillitonVale ADR Franco-Nevada
Stock name Stock nameBHP Billiton Exxon Mobil
Past performance should not be used as a guide to future performance, which is not guaranteed.
Ten largest holdings
TimeperiodFund return %
Benchmark: 75% Euromoney Global Mining Index and 25% MSCI All Country World Energy Index. (Note: The benchmark changed from the HSBC Global MiningIndex to the above on 01/10/2013).Sector: IA Global.
Benchmark return %Sector return %Quartile ranking
Discrete performance as at 31 July 2017
Cumulative performance as at 31 July 2017
Fund return %
277
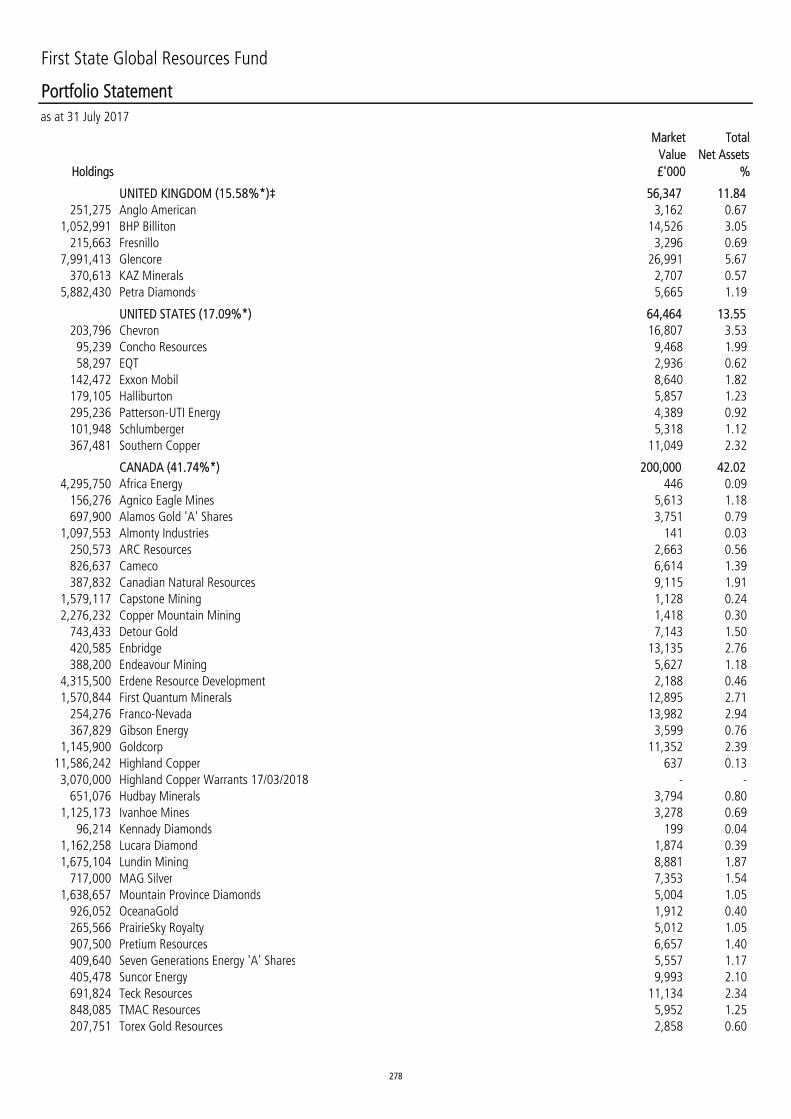
Holdings
MarketValue£'000
TotalNet Assets
%
UNITED KINGDOM (15.58%*)‡ 56,347 11.84251,275 Anglo American 3,162 0.67
1,052,991 BHP Billiton 14,526 3.05215,663 Fresnillo 3,296 0.69
7,991,413 Glencore 26,991 5.67370,613 KAZ Minerals 2,707 0.57
5,882,430 Petra Diamonds 5,665 1.19
UNITED STATES (17.09%*) 64,464 13.55203,796 Chevron 16,807 3.53
95,239 Concho Resources 9,468 1.9958,297 EQT 2,936 0.62
142,472 Exxon Mobil 8,640 1.82179,105 Halliburton 5,857 1.23295,236 Patterson-UTI Energy 4,389 0.92101,948 Schlumberger 5,318 1.12367,481 Southern Copper 11,049 2.32
CANADA (41.74%*) 200,000 42.024,295,750 Africa Energy 446 0.09
156,276 Agnico Eagle Mines 5,613 1.18697,900 Alamos Gold 'A' Shares 3,751 0.79
1,097,553 Almonty Industries 141 0.03250,573 ARC Resources 2,663 0.56826,637 Cameco 6,614 1.39387,832 Canadian Natural Resources 9,115 1.91
1,579,117 Capstone Mining 1,128 0.242,276,232 Copper Mountain Mining 1,418 0.30
743,433 Detour Gold 7,143 1.50420,585 Enbridge 13,135 2.76388,200 Endeavour Mining 5,627 1.18
4,315,500 Erdene Resource Development 2,188 0.461,570,844 First Quantum Minerals 12,895 2.71
254,276 Franco-Nevada 13,982 2.94367,829 Gibson Energy 3,599 0.76
1,145,900 Goldcorp 11,352 2.3911,586,242 Highland Copper 637 0.13
3,070,000 Highland Copper Warrants 17/03/2018 - -651,076 Hudbay Minerals 3,794 0.80
1,125,173 Ivanhoe Mines 3,278 0.6996,214 Kennady Diamonds 199 0.04
1,162,258 Lucara Diamond 1,874 0.391,675,104 Lundin Mining 8,881 1.87
717,000 MAG Silver 7,353 1.541,638,657 Mountain Province Diamonds 5,004 1.05
926,052 OceanaGold 1,912 0.40265,566 PrairieSky Royalty 5,012 1.05907,500 Pretium Resources 6,657 1.40409,640 Seven Generations Energy 'A' Shares 5,557 1.17405,478 Suncor Energy 9,993 2.10691,824 Teck Resources 11,134 2.34848,085 TMAC Resources 5,952 1.25207,751 Torex Gold Resources 2,858 0.60
First State Global Resources Fund
Portfolio Statementas at 31 July 2017
278
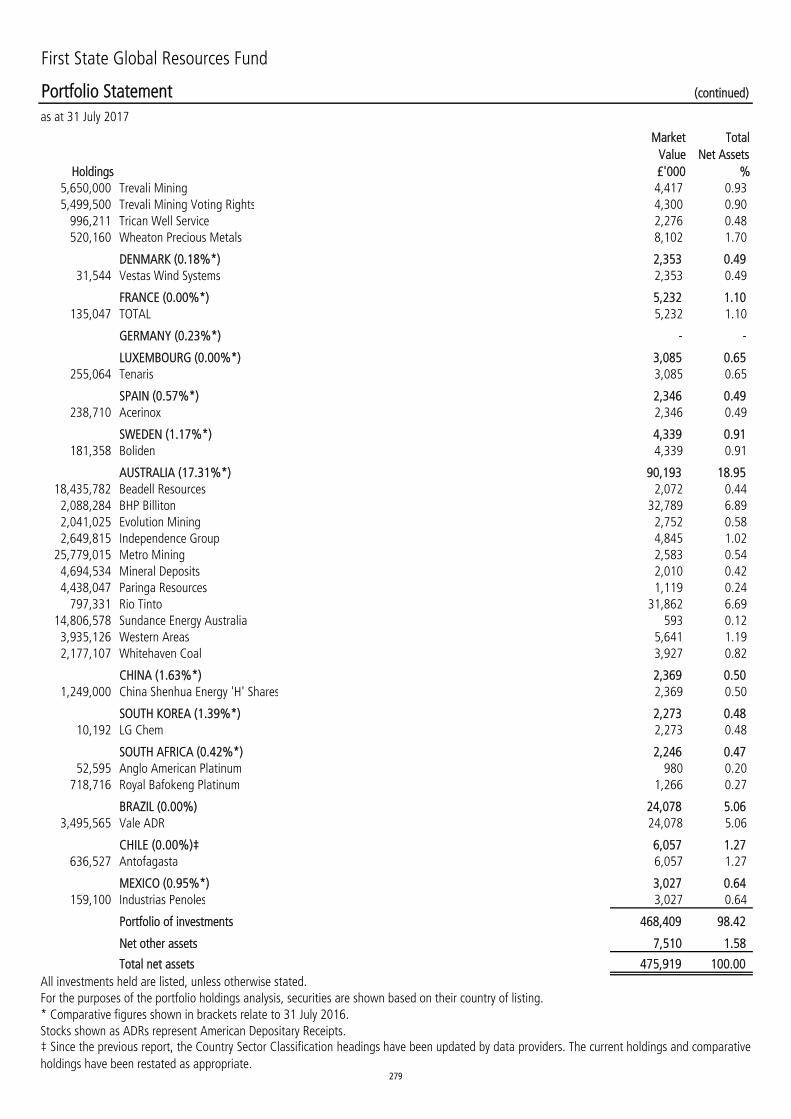
Holdings
MarketValue£'000
TotalNet Assets
%
First State Global Resources Fund
Portfolio Statement (continued)
as at 31 July 2017
5,650,000 Trevali Mining 4,417 0.935,499,500 Trevali Mining Voting Rights 4,300 0.90
996,211 Trican Well Service 2,276 0.48520,160 Wheaton Precious Metals 8,102 1.70
DENMARK (0.18%*) 2,353 0.4931,544 Vestas Wind Systems 2,353 0.49
FRANCE (0.00%*) 5,232 1.10135,047 TOTAL 5,232 1.10
GERMANY (0.23%*) - -
LUXEMBOURG (0.00%*) 3,085 0.65255,064 Tenaris 3,085 0.65
SPAIN (0.57%*) 2,346 0.49238,710 Acerinox 2,346 0.49
SWEDEN (1.17%*) 4,339 0.91181,358 Boliden 4,339 0.91
AUSTRALIA (17.31%*) 90,193 18.9518,435,782 Beadell Resources 2,072 0.44
2,088,284 BHP Billiton 32,789 6.892,041,025 Evolution Mining 2,752 0.582,649,815 Independence Group 4,845 1.02
25,779,015 Metro Mining 2,583 0.544,694,534 Mineral Deposits 2,010 0.424,438,047 Paringa Resources 1,119 0.24
797,331 Rio Tinto 31,862 6.6914,806,578 Sundance Energy Australia 593 0.12
3,935,126 Western Areas 5,641 1.192,177,107 Whitehaven Coal 3,927 0.82
CHINA (1.63%*) 2,369 0.501,249,000 China Shenhua Energy 'H' Shares 2,369 0.50
SOUTH KOREA (1.39%*) 2,273 0.4810,192 LG Chem 2,273 0.48
SOUTH AFRICA (0.42%*) 2,246 0.4752,595 Anglo American Platinum 980 0.20
718,716 Royal Bafokeng Platinum 1,266 0.27
BRAZIL (0.00%) 24,078 5.063,495,565 Vale ADR 24,078 5.06
CHILE (0.00%)‡ 6,057 1.27636,527 Antofagasta 6,057 1.27
MEXICO (0.95%*) 3,027 0.64159,100 Industrias Penoles 3,027 0.64
Portfolio of investments 468,409 98.42
Net other assets 7,510 1.58
Total net assets 475,919 100.00
‡ Since the previous report, the Country Sector Classification headings have been updated by data providers. The current holdings and comparativeholdings have been restated as appropriate.
Stocks shown as ADRs represent American Depositary Receipts.
All investments held are listed, unless otherwise stated.
* Comparative figures shown in brackets relate to 31 July 2016.For the purposes of the portfolio holdings analysis, securities are shown based on their country of listing.
279
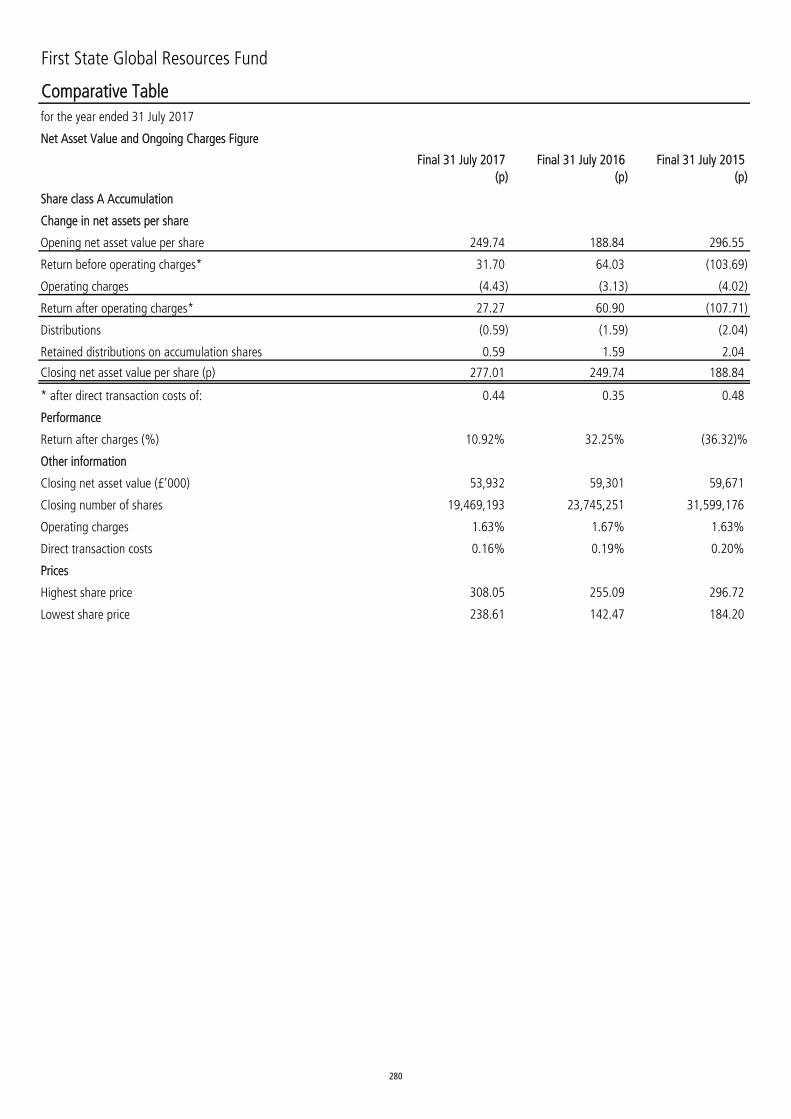
Share class A Accumulation
Change in net assets per share
Opening net asset value per share
Return before operating charges*
Operating charges
Return after operating charges*
Distributions
Retained distributions on accumulation shares
Closing net asset value per share (p)
* after direct transaction costs of:
Performance
Return after charges (%)
Other information
Closing net asset value (£’000)
Closing number of shares
Operating charges
Direct transaction costs
Prices
Highest share price
Lowest share price 238.61 142.47 184.20
0.16% 0.19% 0.20%
308.05 255.09 296.72
1.63% 1.67% 1.63%
53,932 59,301 59,671
19,469,193 23,745,251 31,599,176
10.92% 32.25% (36.32)%
277.01 249.74 188.84
0.44 0.35 0.48
0.59 1.59 2.04
27.27 60.90 (107.71)
(0.59) (1.59) (2.04)
31.70 64.03 (103.69)
(4.43) (3.13) (4.02)
249.74 188.84 296.55
First State Global Resources Fund
Comparative Tablefor the year ended 31 July 2017
Net Asset Value and Ongoing Charges Figure
Final 31 July 2017(p)
Final 31 July 2016(p)
Final 31 July 2015(p)
280
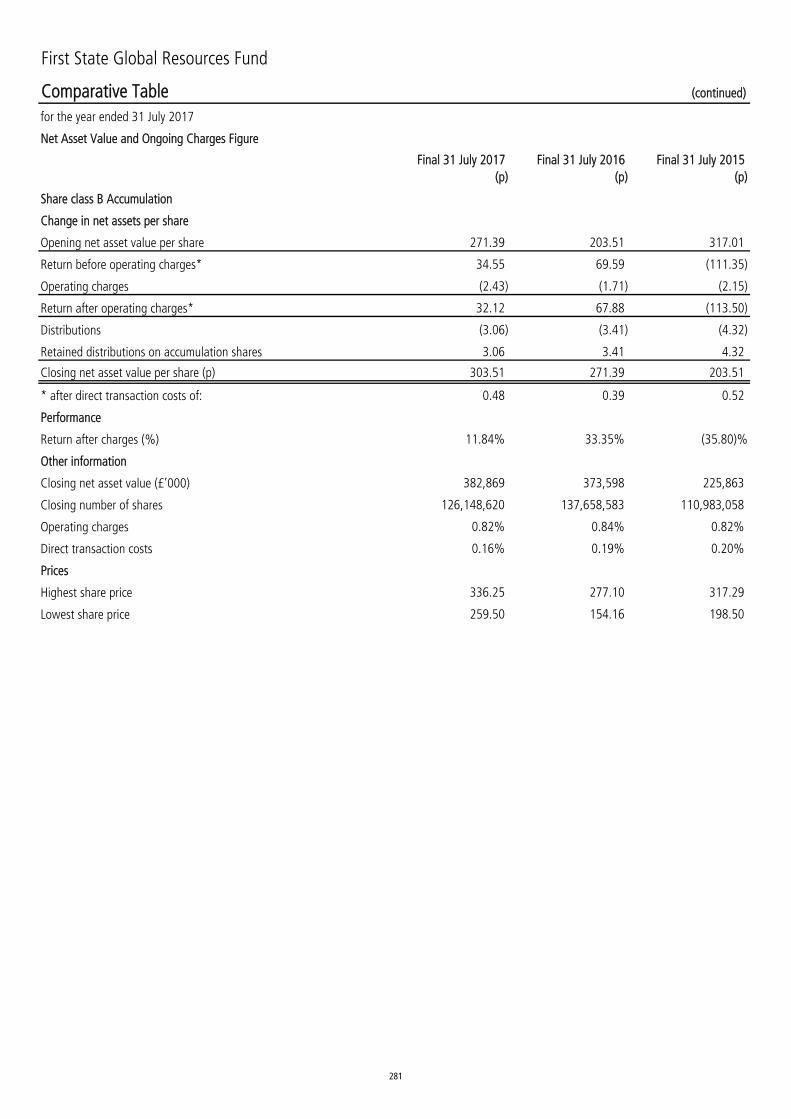
First State Global Resources Fund
Comparative Table (continued)
for the year ended 31 July 2017
Net Asset Value and Ongoing Charges Figure
Share class B Accumulation
Change in net assets per share
Opening net asset value per share
Return before operating charges*
Operating charges
Return after operating charges*
Distributions
Retained distributions on accumulation shares
Closing net asset value per share (p)
* after direct transaction costs of:
Performance
Return after charges (%)
Other information
Closing net asset value (£’000)
Closing number of shares
Operating charges
Direct transaction costs
Prices
Highest share price
Lowest share price 259.50 154.16 198.50
0.16% 0.19% 0.20%
336.25 277.10 317.29
0.82% 0.84% 0.82%
382,869 373,598 225,863
126,148,620 137,658,583 110,983,058
11.84% 33.35% (35.80)%
303.51 271.39 203.51
0.48 0.39 0.52
3.06 3.41 4.32
32.12 67.88 (113.50)
(3.06) (3.41) (4.32)
34.55 69.59 (111.35)
(2.43) (1.71) (2.15)
271.39 203.51 317.01
Final 31 July 2017(p)
Final 31 July 2016(p)
Final 31 July 2015(p)
281

First State Global Resources Fund
Comparative Table (continued)
for the year ended 31 July 2017
Net Asset Value and Ongoing Charges Figure
Share class A Accumulation (EUR share class)
Change in net assets per share
Opening net asset value per share
Return before operating charges*
Operating charges
Return after operating charges*
Distributions
Retained distributions on accumulation shares
Closing net asset value per share (c)
* after direct transaction costs of:
Performance
Return after charges (%)
Other information
Closing net asset value (€’000)
Closing number of shares
Operating charges
Direct transaction costs
Prices
Highest share price
Lowest share price 63.49 41.29 58.29
0.16% 0.19% 0.20%
81.22 68.54 83.29
1.59% 1.63% 1.58%
26,342 28,119 17,446
37,935,896 42,385,769 29,087,540
4.67% 10.60% (28.32)%
69.44 66.34 59.98
0.12 0.11 0.14
0.18 0.48 0.66
3.10 6.36 (23.70)
(0.18) (0.48) (0.66)
4.23 7.28 (22.54)
(1.13) (0.92) (1.16)
66.34 59.98 83.68
Final 31 July 2017(c)
Final 31 July 2016(c)
Final 31 July 2015(c)
282
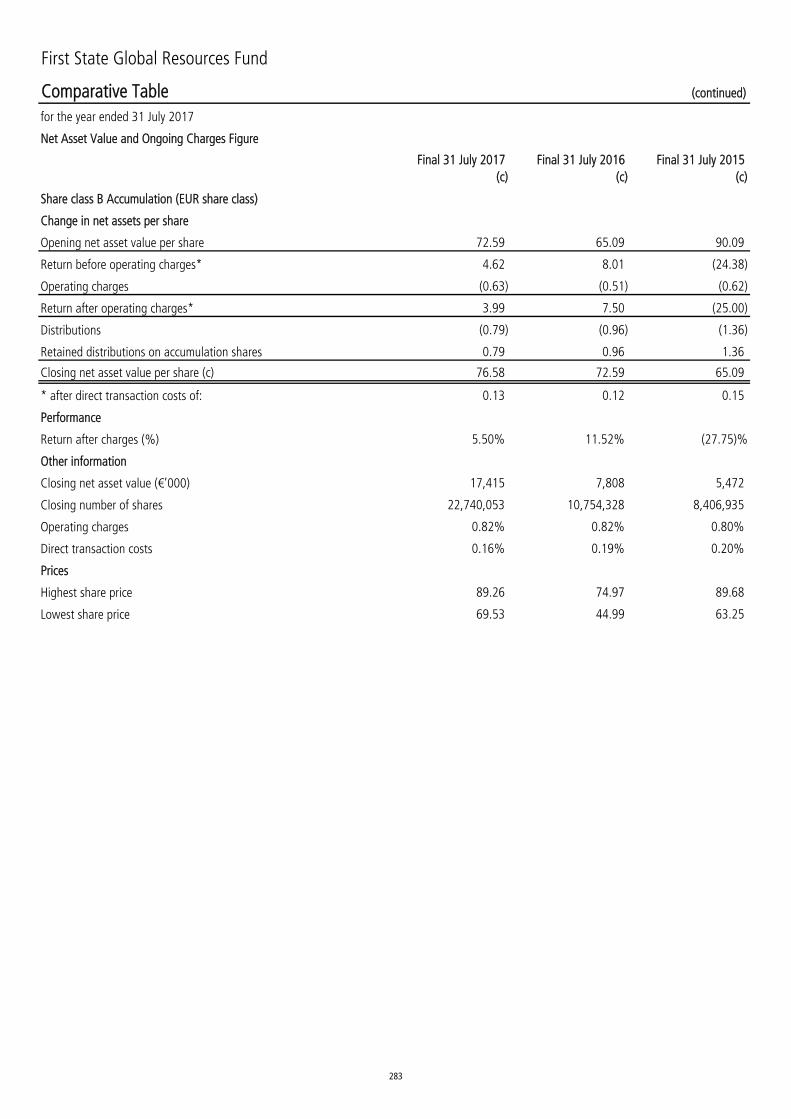
First State Global Resources Fund
Comparative Table (continued)
for the year ended 31 July 2017
Net Asset Value and Ongoing Charges Figure
Share class B Accumulation (EUR share class)
Change in net assets per share
Opening net asset value per share
Return before operating charges*
Operating charges
Return after operating charges*
Distributions
Retained distributions on accumulation shares
Closing net asset value per share (c)
* after direct transaction costs of:
Performance
Return after charges (%)
Other information
Closing net asset value (€’000)
Closing number of shares
Operating charges
Direct transaction costs
Prices
Highest share price
Lowest share price 69.53 44.99 63.25
0.16% 0.19% 0.20%
89.26 74.97 89.68
0.82% 0.82% 0.80%
17,415 7,808 5,472
22,740,053 10,754,328 8,406,935
5.50% 11.52% (27.75)%
76.58 72.59 65.09
0.13 0.12 0.15
0.79 0.96 1.36
3.99 7.50 (25.00)
(0.79) (0.96) (1.36)
4.62 8.01 (24.38)
(0.63) (0.51) (0.62)
72.59 65.09 90.09
Final 31 July 2017(c)
Final 31 July 2016(c)
Final 31 July 2015(c)
283

Notes £'000 £'000 £'000 £'000
Net capital gains 2 49,222 119,064
Revenue 3 10,395 8,963
4 (4,784) (3,336)
Interest payable and similar charges (20) (8)
5,591 5,619
5 (1,155) (706)
4,436 4,913
53,658 123,977
6 (4,440) (4,944)
49,218 119,033
£'000 £'000 £'000 £'000
463,194 301,689
75,934 138,081
(116,760) (101,303)
(40,826) 36,778
25 294
49,218 119,033
4,308 5,400
475,919 463,194
Less: Amounts payable on cancellation of shares
Dilution adjustment
Change in net assets attributable to shareholders from investment activities
Retained distribution on accumulation shares
Closing net assets attributable to shareholders
Notes to the Financial Statements are on pages 286 to 291.
Amounts receivable on issue of shares
for the year ended 31 July 2017
31 July 2017 31 July 2016
Opening net assets attributable to shareholders
Statement of Change in Net Assets Attributable to Shareholders
Income
Expenses
Net revenue before taxation
Taxation
Net revenue after taxation
Total return before distributions
Distribution
Change in net assets attributable to shareholders from investment activities
31 July 2017 31 July 2016
First State Global Resources Fund
Statement of Total Returnfor the year ended 31 July 2017
284
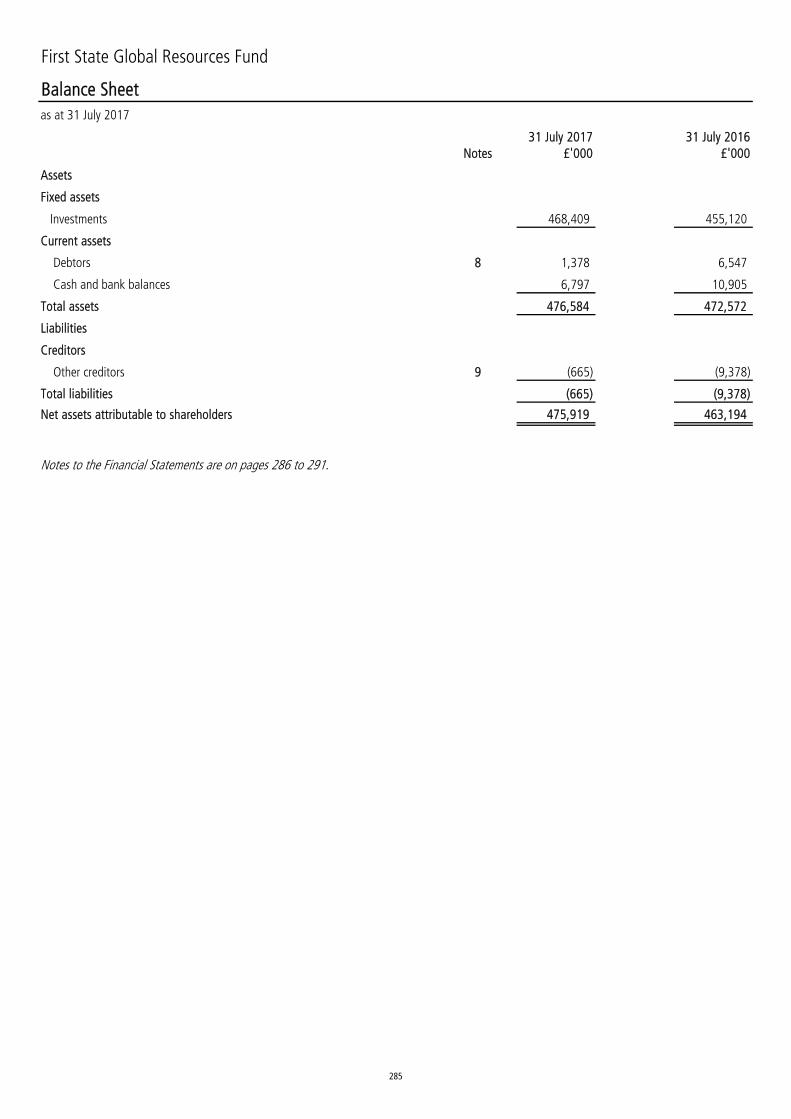
First State Global Resources Fund
31 July 2017 31 July 2016Notes £'000 £'000
Investments 468,409 455,120
Current assets
8 1,378 6,547
6,797 10,905
476,584 472,572
Creditors
Other creditors 9 (665) (9,378)
(665) (9,378)
475,919 463,194
Notes to the Financial Statements are on pages 286 to 291.
Total liabilities
Net assets attributable to shareholders
Balance Sheetas at 31 July 2017
Assets
Fixed assets
Debtors
Cash and bank balances
Total assets
Liabilities
285
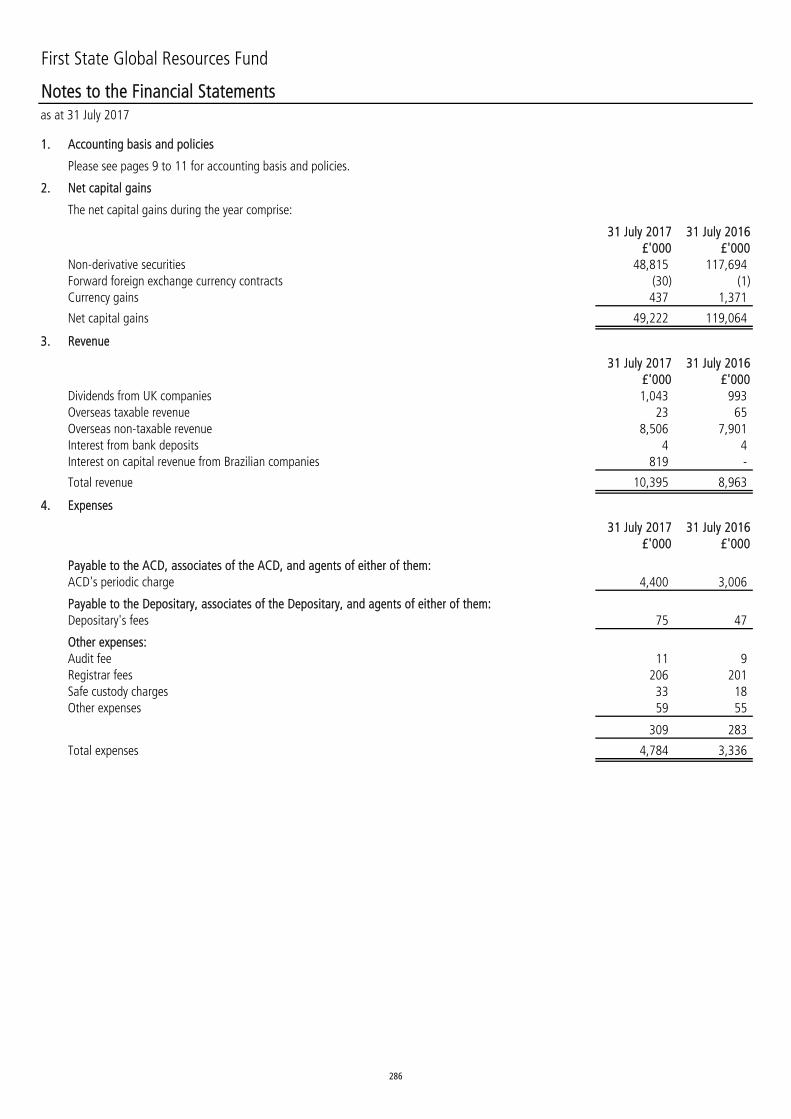
1.
2.
31 July 2017 31 July 2016£'000 £'000
48,815 117,694(30) (1)437 1,371
49,222 119,064
3.
31 July 2017 31 July 2016£'000 £'0001,043 993
23 658,506 7,901
4 4819 -
10,395 8,963
4.
31 July 2017 31 July 2016£'000 £'000
4,400 3,006
75 47
11 9206 201
33 1859 55
309 283
4,784 3,336Total expenses
Audit feeRegistrar feesSafe custody chargesOther expenses
Other expenses:
Payable to the Depositary, associates of the Depositary, and agents of either of them:Depositary's fees
Expenses
Payable to the ACD, associates of the ACD, and agents of either of them:ACD's periodic charge
Total revenue
Interest on capital revenue from Brazilian companiesInterest from bank deposits
Dividends from UK companiesOverseas taxable revenueOverseas non-taxable revenue
Net capital gains
Revenue
Forward foreign exchange currency contractsCurrency gains
Accounting basis and policies
Please see pages 9 to 11 for accounting basis and policies.
Net capital gains
The net capital gains during the year comprise:
Non-derivative securities
Notes to the Financial Statementsas at 31 July 2017
First State Global Resources Fund
286
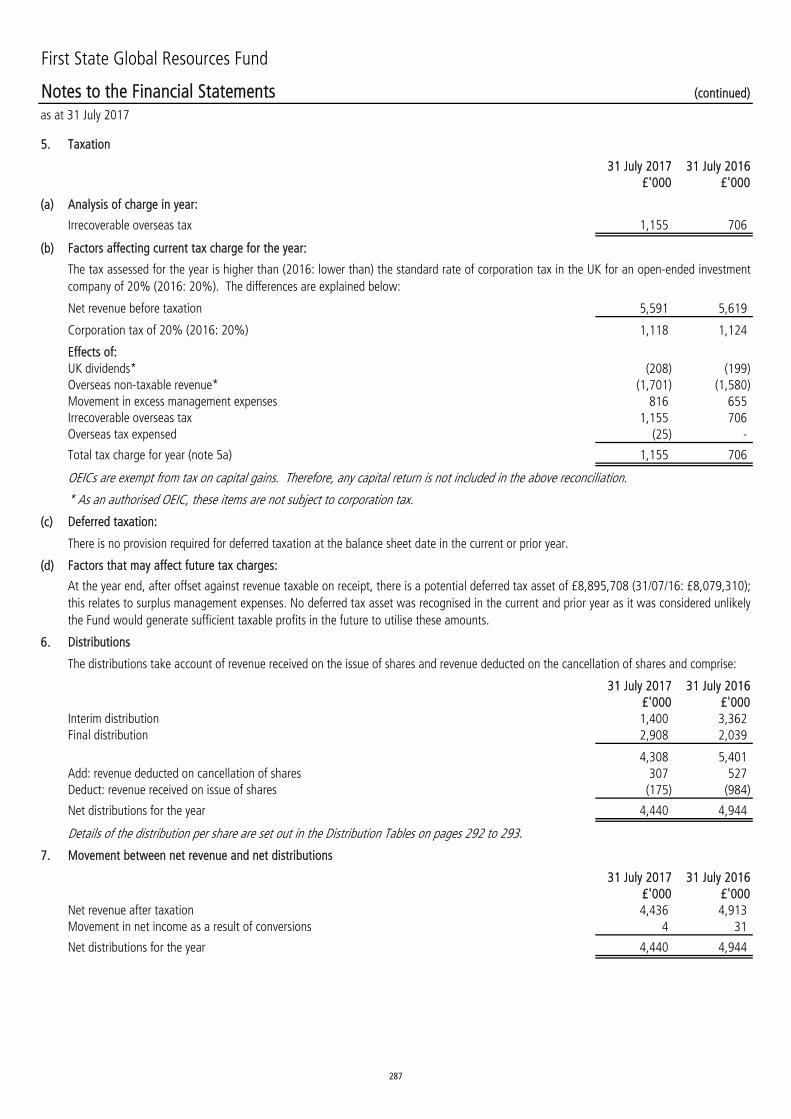
Notes to the Financial Statements (continued)
as at 31 July 2017
First State Global Resources Fund
5.
31 July 2017 31 July 2016£'000 £'000
(a)
1,155 706
(b)
5,591 5,619
1,118 1,124
(208) (199)(1,701) (1,580)
816 6551,155 706
(25) -
1,155 706
(c)
(d)
6.
31 July 2017 31 July 2016£'000 £'0001,400 3,3622,908 2,039
4,308 5,401307 527
(175) (984)
4,440 4,944
7.
31 July 2017 31 July 2016£'000 £'0004,436 4,913
4 31
4,440 4,944
Movement in net income as a result of conversions
Net distributions for the year
Details of the distribution per share are set out in the Distribution Tables on pages 292 to 293.
Movement between net revenue and net distributions
Net revenue after taxation
Add: revenue deducted on cancellation of sharesDeduct: revenue received on issue of shares
Net distributions for the year
Final distributionInterim distribution
Distributions
The distributions take account of revenue received on the issue of shares and revenue deducted on the cancellation of shares and comprise:
Factors that may affect future tax charges:
At the year end, after offset against revenue taxable on receipt, there is a potential deferred tax asset of £8,895,708 (31/07/16: £8,079,310);this relates to surplus management expenses. No deferred tax asset was recognised in the current and prior year as it was considered unlikelythe Fund would generate sufficient taxable profits in the future to utilise these amounts.
Deferred taxation:
There is no provision required for deferred taxation at the balance sheet date in the current or prior year.
Total tax charge for year (note 5a)
OEICs are exempt from tax on capital gains. Therefore, any capital return is not included in the above reconciliation.
* As an authorised OEIC, these items are not subject to corporation tax.
Overseas tax expensed
Movement in excess management expensesIrrecoverable overseas tax
UK dividends*Overseas non-taxable revenue*
Net revenue before taxation
Corporation tax of 20% (2016: 20%)
Effects of:
Factors affecting current tax charge for the year:
The tax assessed for the year is higher than (2016: lower than) the standard rate of corporation tax in the UK for an open-ended investmentcompany of 20% (2016: 20%). The differences are explained below:
Irrecoverable overseas tax
Analysis of charge in year:
Taxation
287
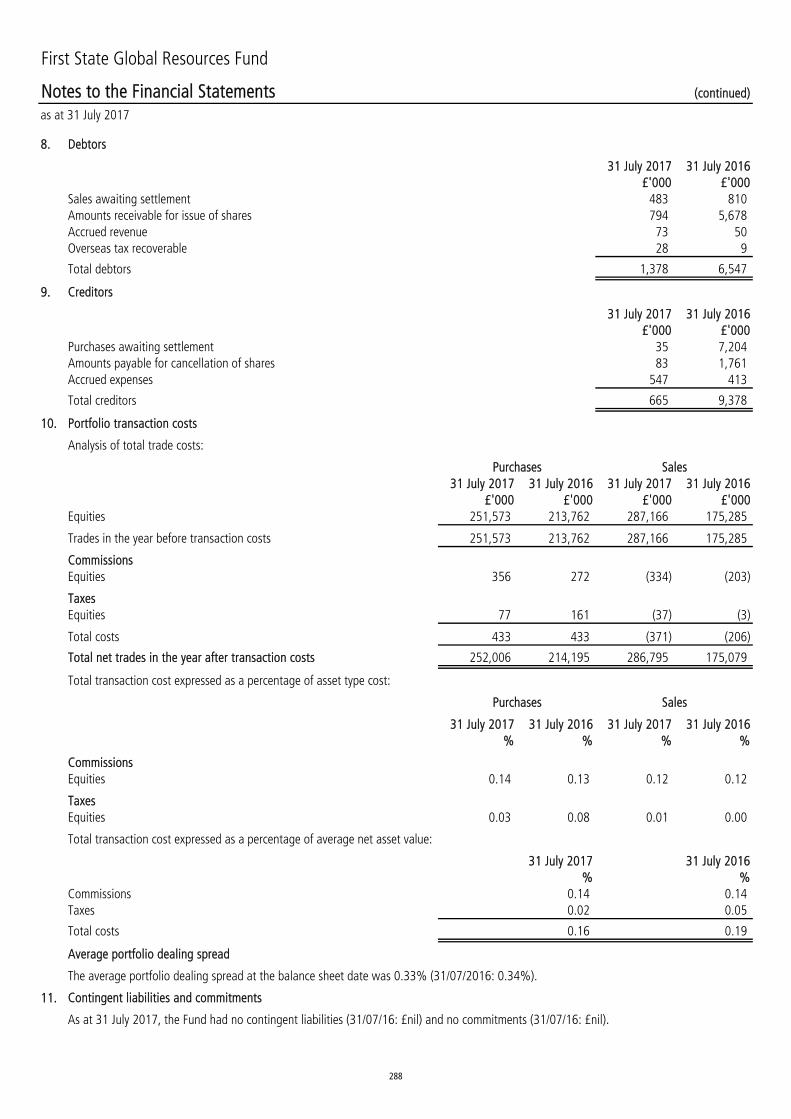
Notes to the Financial Statements (continued)
as at 31 July 2017
First State Global Resources Fund
8.
31 July 2017 31 July 2016£'000 £'000
483 810794 5,678
73 5028 9
1,378 6,547
9.
31 July 2017 31 July 2016£'000 £'000
35 7,20483 1,761
547 413
665 9,378
10.
31 July 2017 31 July 2016 31 July 2017 31 July 2016£'000 £'000 £'000 £'000
251,573 213,762 287,166 175,285
251,573 213,762 287,166 175,285
356 272 (334) (203)
77 161 (37) (3)
433 433 (371) (206)
252,006 214,195 286,795 175,079
31 July 2017 31 July 2016 31 July 2017 31 July 2016% % % %
0.14 0.13 0.12 0.12
0.03 0.08 0.01 0.00
11. Contingent liabilities and commitments
As at 31 July 2017, the Fund had no contingent liabilities (31/07/16: £nil) and no commitments (31/07/16: £nil).
The average portfolio dealing spread at the balance sheet date was 0.33% (31/07/2016: 0.34%).
Total costs 0.16 0.19
Average portfolio dealing spread
Commissions 0.14 0.14Taxes 0.02 0.05
Total transaction cost expressed as a percentage of average net asset value:
31 July 2017 31 July 2016% %
EquitiesTaxes
CommissionsEquities
Total transaction cost expressed as a percentage of asset type cost:
Purchases Sales
Total costs
Total net trades in the year after transaction costs
TaxesEquities
Trades in the year before transaction costs
CommissionsEquities
Analysis of total trade costs:
Purchases Sales
Equities
Total creditors
Portfolio transaction costs
Purchases awaiting settlementAmounts payable for cancellation of sharesAccrued expenses
Creditors
Total debtors
Overseas tax recoverable
Amounts receivable for issue of sharesAccrued revenue
Debtors
Sales awaiting settlement
288
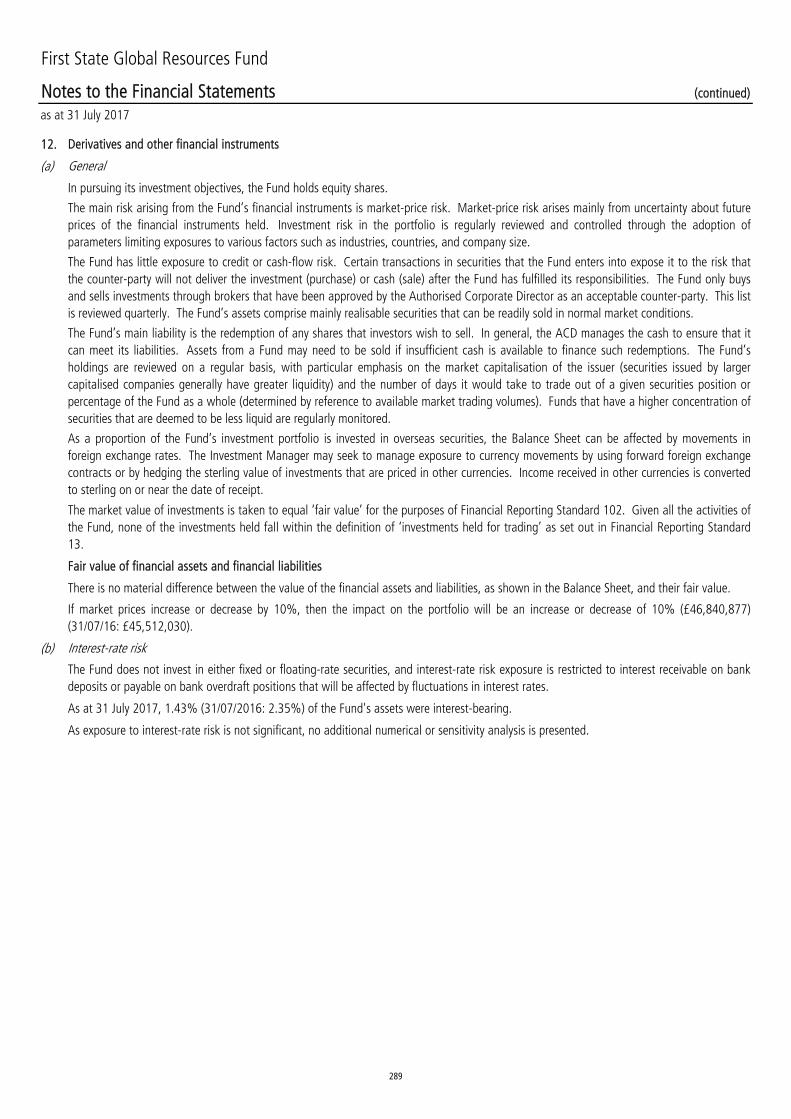
Notes to the Financial Statements (continued)
as at 31 July 2017
First State Global Resources Fund
12.
(a)
(b)
As at 31 July 2017, 1.43% (31/07/2016: 2.35%) of the Fund's assets were interest-bearing.
As exposure to interest-rate risk is not significant, no additional numerical or sensitivity analysis is presented.
There is no material difference between the value of the financial assets and liabilities, as shown in the Balance Sheet, and their fair value.
If market prices increase or decrease by 10%, then the impact on the portfolio will be an increase or decrease of 10% (£46,840,877)(31/07/16: £45,512,030).
Interest-rate risk
The Fund does not invest in either fixed or floating-rate securities, and interest-rate risk exposure is restricted to interest receivable on bankdeposits or payable on bank overdraft positions that will be affected by fluctuations in interest rates.
The Fund’s main liability is the redemption of any shares that investors wish to sell. In general, the ACD manages the cash to ensure that itcan meet its liabilities. Assets from a Fund may need to be sold if insufficient cash is available to finance such redemptions. The Fund’sholdings are reviewed on a regular basis, with particular emphasis on the market capitalisation of the issuer (securities issued by largercapitalised companies generally have greater liquidity) and the number of days it would take to trade out of a given securities position orpercentage of the Fund as a whole (determined by reference to available market trading volumes). Funds that have a higher concentration ofsecurities that are deemed to be less liquid are regularly monitored.
As a proportion of the Fund’s investment portfolio is invested in overseas securities, the Balance Sheet can be affected by movements inforeign exchange rates. The Investment Manager may seek to manage exposure to currency movements by using forward foreign exchangecontracts or by hedging the sterling value of investments that are priced in other currencies. Income received in other currencies is convertedto sterling on or near the date of receipt.
The market value of investments is taken to equal ‘fair value’ for the purposes of Financial Reporting Standard 102. Given all the activities ofthe Fund, none of the investments held fall within the definition of ‘investments held for trading’ as set out in Financial Reporting Standard13.
Fair value of financial assets and financial liabilities
Derivatives and other financial instruments
General
In pursuing its investment objectives, the Fund holds equity shares.
The main risk arising from the Fund’s financial instruments is market-price risk. Market-price risk arises mainly from uncertainty about futureprices of the financial instruments held. Investment risk in the portfolio is regularly reviewed and controlled through the adoption ofparameters limiting exposures to various factors such as industries, countries, and company size.
The Fund has little exposure to credit or cash-flow risk. Certain transactions in securities that the Fund enters into expose it to the risk thatthe counter-party will not deliver the investment (purchase) or cash (sale) after the Fund has fulfilled its responsibilities. The Fund only buysand sells investments through brokers that have been approved by the Authorised Corporate Director as an acceptable counter-party. This listis reviewed quarterly. The Fund’s assets comprise mainly realisable securities that can be readily sold in normal market conditions.
289
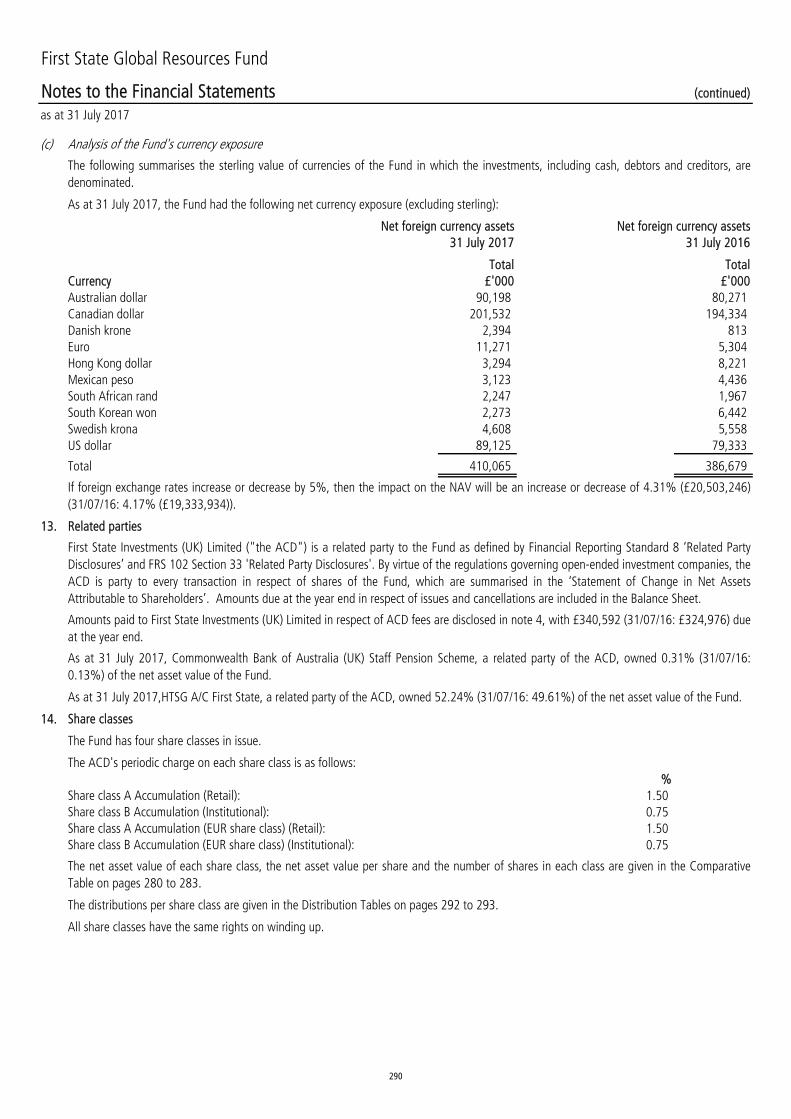
Notes to the Financial Statements (continued)
as at 31 July 2017
First State Global Resources Fund
(c)
Total TotalCurrency £'000 £'000Australian dollar 90,198 80,271Canadian dollar 201,532 194,334Danish krone 2,394 813Euro 11,271 5,304Hong Kong dollar 3,294 8,221Mexican peso 3,123 4,436South African rand 2,247 1,967South Korean won 2,273 6,442Swedish krona 4,608 5,558US dollar 89,125 79,333
Total 410,065 386,679
13.
14.
%1.500.751.500.75
All share classes have the same rights on winding up.
The net asset value of each share class, the net asset value per share and the number of shares in each class are given in the ComparativeTable on pages 280 to 283.
The distributions per share class are given in the Distribution Tables on pages 292 to 293.
The ACD's periodic charge on each share class is as follows:
Share class A Accumulation (Retail):Share class B Accumulation (Institutional):Share class A Accumulation (EUR share class) (Retail):Share class B Accumulation (EUR share class) (Institutional):
As at 31 July 2017,HTSG A/C First State, a related party of the ACD, owned 52.24% (31/07/16: 49.61%) of the net asset value of the Fund.
Share classes
The Fund has four share classes in issue.
Amounts paid to First State Investments (UK) Limited in respect of ACD fees are disclosed in note 4, with £340,592 (31/07/16: £324,976) due at the year end.
As at 31 July 2017, Commonwealth Bank of Australia (UK) Staff Pension Scheme, a related party of the ACD, owned 0.31% (31/07/16:0.13%) of the net asset value of the Fund.
Related parties
First State Investments (UK) Limited ("the ACD") is a related party to the Fund as defined by Financial Reporting Standard 8 ‘Related PartyDisclosures’ and FRS 102 Section 33 'Related Party Disclosures'. By virtue of the regulations governing open-ended investment companies, theACD is party to every transaction in respect of shares of the Fund, which are summarised in the ‘Statement of Change in Net AssetsAttributable to Shareholders’. Amounts due at the year end in respect of issues and cancellations are included in the Balance Sheet.
If foreign exchange rates increase or decrease by 5%, then the impact on the NAV will be an increase or decrease of 4.31% (£20,503,246)(31/07/16: 4.17% (£19,333,934)).
The following summarises the sterling value of currencies of the Fund in which the investments, including cash, debtors and creditors, aredenominated.
As at 31 July 2017, the Fund had the following net currency exposure (excluding sterling):
Net foreign currency assets Net foreign currency assets31 July 2017 31 July 2016
Analysis of the Fund's currency exposure
290
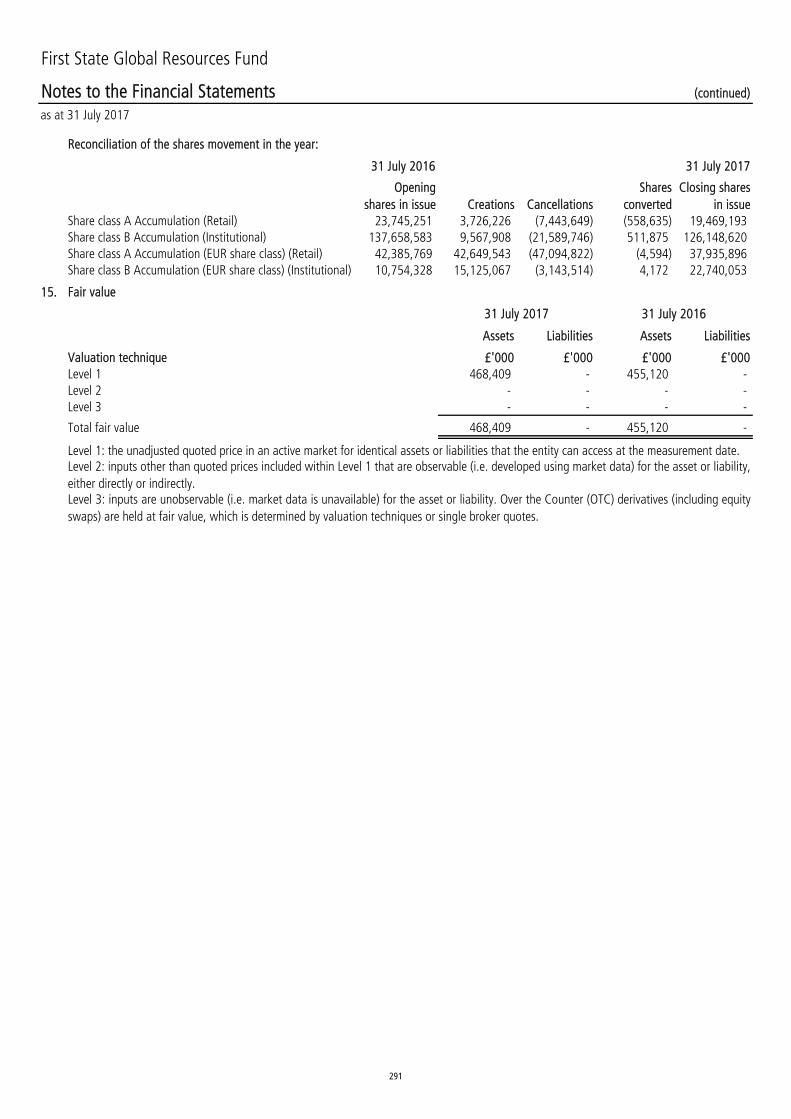
Notes to the Financial Statements (continued)
as at 31 July 2017
First State Global Resources Fund
31 July 2016 31 July 2017
Opening shares in issue Creations Cancellations
Shares converted
Closing shares in issue
23,745,251 3,726,226 (7,443,649) (558,635) 19,469,193137,658,583 9,567,908 (21,589,746) 511,875 126,148,620
42,385,769 42,649,543 (47,094,822) (4,594) 37,935,89610,754,328 15,125,067 (3,143,514) 4,172 22,740,053
15.
Assets Liabilities Assets Liabilities
£'000 £'000 £'000 £'000468,409 - 455,120 -
- - - -- - - -
468,409 - 455,120 -
Level 3: inputs are unobservable (i.e. market data is unavailable) for the asset or liability. Over the Counter (OTC) derivatives (including equityswaps) are held at fair value, which is determined by valuation techniques or single broker quotes.
Level 1Level 2Level 3
Total fair value
Level 1: the unadjusted quoted price in an active market for identical assets or liabilities that the entity can access at the measurement date. Level 2: inputs other than quoted prices included within Level 1 that are observable (i.e. developed using market data) for the asset or liability,either directly or indirectly.
Fair value
Valuation technique
31 July 2017 31 July 2016
Share class B Accumulation (EUR share class) (Institutional)
Reconciliation of the shares movement in the year:
Share class A Accumulation (Retail)Share class B Accumulation (Institutional)Share class A Accumulation (EUR share class) (Retail)
291
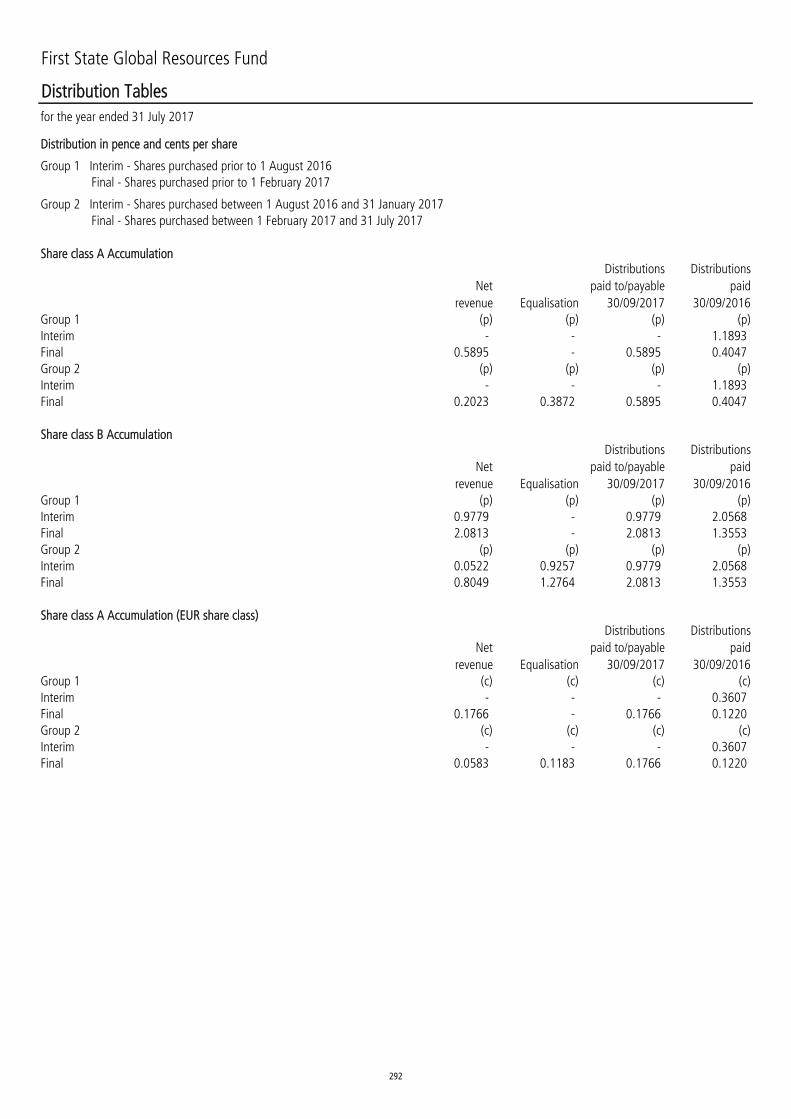
Share class A Accumulation
Netrevenue Equalisation
Distributions paid to/payable
30/09/2017
Distributions paid
30/09/2016Group 1 (p) (p) (p) (p)Interim - - - 1.1893Final 0.5895 - 0.5895 0.4047Group 2 (p) (p) (p) (p)Interim - - - 1.1893Final 0.2023 0.3872 0.5895 0.4047
Share class B Accumulation
Netrevenue Equalisation
Distributions paid to/payable
30/09/2017
Distributions paid
30/09/2016Group 1 (p) (p) (p) (p)Interim 0.9779 - 0.9779 2.0568Final 2.0813 - 2.0813 1.3553Group 2 (p) (p) (p) (p)Interim 0.0522 0.9257 0.9779 2.0568Final 0.8049 1.2764 2.0813 1.3553
Share class A Accumulation (EUR share class)
Netrevenue Equalisation
Distributions paid to/payable
30/09/2017
Distributions paid
30/09/2016Group 1 (c) (c) (c) (c)Interim - - - 0.3607Final 0.1766 - 0.1766 0.1220Group 2 (c) (c) (c) (c)Interim - - - 0.3607Final 0.0583 0.1183 0.1766 0.1220
Final - Shares purchased between 1 February 2017 and 31 July 2017Group 2 Interim - Shares purchased between 1 August 2016 and 31 January 2017
Final - Shares purchased prior to 1 February 2017
Distribution in pence and cents per share
First State Global Resources Fund
Distribution Tablesfor the year ended 31 July 2017
Group 1 Interim - Shares purchased prior to 1 August 2016
292
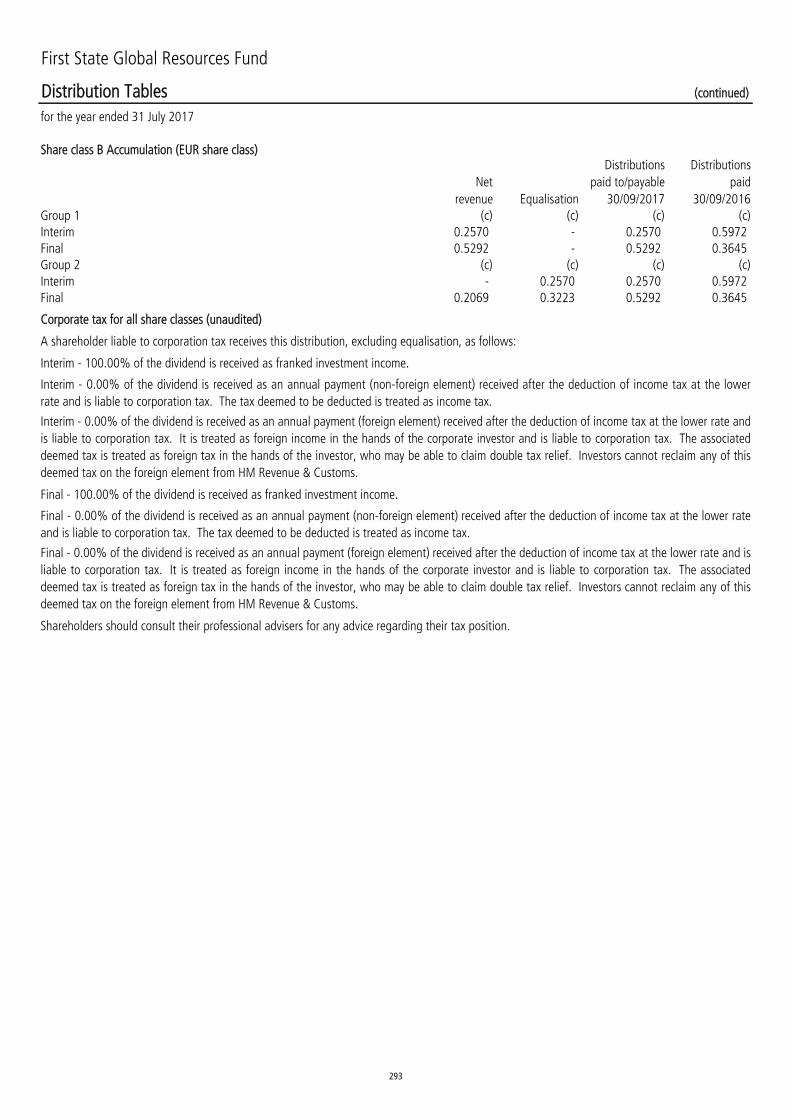
First State Global Resources Fund
Distribution Tables (continued)
for the year ended 31 July 2017
Share class B Accumulation (EUR share class)
Netrevenue Equalisation
Distributions paid to/payable
30/09/2017
Distributions paid
30/09/2016Group 1 (c) (c) (c) (c)Interim 0.2570 - 0.2570 0.5972Final 0.5292 - 0.5292 0.3645Group 2 (c) (c) (c) (c)Interim - 0.2570 0.2570 0.5972Final 0.2069 0.3223 0.5292 0.3645
Shareholders should consult their professional advisers for any advice regarding their tax position.
Final - 100.00% of the dividend is received as franked investment income.
Final - 0.00% of the dividend is received as an annual payment (non-foreign element) received after the deduction of income tax at the lower rateand is liable to corporation tax. The tax deemed to be deducted is treated as income tax.
Final - 0.00% of the dividend is received as an annual payment (foreign element) received after the deduction of income tax at the lower rate and isliable to corporation tax. It is treated as foreign income in the hands of the corporate investor and is liable to corporation tax. The associateddeemed tax is treated as foreign tax in the hands of the investor, who may be able to claim double tax relief. Investors cannot reclaim any of thisdeemed tax on the foreign element from HM Revenue & Customs.
Interim - 100.00% of the dividend is received as franked investment income.
Interim - 0.00% of the dividend is received as an annual payment (non-foreign element) received after the deduction of income tax at the lowerrate and is liable to corporation tax. The tax deemed to be deducted is treated as income tax.
Interim - 0.00% of the dividend is received as an annual payment (foreign element) received after the deduction of income tax at the lower rate andis liable to corporation tax. It is treated as foreign income in the hands of the corporate investor and is liable to corporation tax. The associateddeemed tax is treated as foreign tax in the hands of the investor, who may be able to claim double tax relief. Investors cannot reclaim any of thisdeemed tax on the foreign element from HM Revenue & Customs.
Corporate tax for all share classes (unaudited)
A shareholder liable to corporation tax receives this distribution, excluding equalisation, as follows:
293
Risks and reward profile
Lower Risk Higher Risk
Potentially Lower Rewards Potentially Higher Rewards
1 2 3 4 5 6 7
1 2 3 4 5 6 7
1 2 3 4 5 6 7
1 2 3 4 5 6 7
1 2 3 4 5 6 7
1 2 3 4* 5 6 7
Performance
The Fund rose by 13.7% in sterling terms over the year and has provided cumulative returns of 55.4% and 79.7% over three and five yearsrespectively to 31 July 2017.
Berkshire Hathaway (US: Financials) gained as the market anticipated less regulation for financials, friendlier policies towards oil and coal, and agreater infrastructure spend after Donald Trump's election victory - all policies that should benefit Berkshire's investments. Unilever (UK: ConsumerStaples) rose on the back of the attempted takeover by Kraft Heinz and management’s response of a new plan to improve margins, and Henkel(Germany: Consumer Staples) climbed on margin improvement.
On the negative side, Natura Cosmeticos (Brazil: Consumer Staples) experienced a difficult environment with the evolution of its business model,changes in management and a subdued consumer. Brambles (Australia: Industrials) declined due to competitive pressures in the US and NewcrestMining (Australia: Materials) because of the subdued gold price.
• Even the lowest rating 1 does not mean a risk-free investment;
• On a scale of 1 (less risky) to 7 (more risky), this Fund has a rating of 5 due to its past performance and the nature of its investments. Shares witha rating of 5 might have higher risks, but also higher returns;
• Risk is taken in order to make a higher potential return; the more risk a Fund takes, the higher the potential return but the greater the risk ofloss; and
• The value of the Fund and its return is not guaranteed and may fall as well as rise. You may get back less than you originally invested.
The Fund might also experience the following risks:
* The SRRI changed from 5 to 4 on 24 March 2017.
For further information on risks, please refer to the Risk Factors section in the Company's prospectus.
• The synthetic risk reward indicator (the SRRI) rating is not a measure of the risk of you losing your investment but describes how much the valueof the Fund went up and down in the past;
• The SRRI rating is based on historical data, which may not be a reliable indication of the future risks and rewards of the Fund;
• We cannot guarantee that the rating of the Fund will remain the same; it may change over time;
Emerging market risk: emerging markets may not provide the same level of investor protection as a developed market; they may involve a higherrisk than investing in developed markets.
Currency risk: the Fund invests in assets that are denominated in other currencies; changes in exchange rates will affect the value of the Fund.
Share class A Accumulation
Share class A Income
Share class B Accumulation
Share class B Income
Share class B Accumulation (EUR share class)
Share class B Accumulation (USD share class)
Stewart Investors Worldwide Equity Fund
Authorised Fund Manager's Reportfor the year ended 31 July 2017
Investment Objective and Policy
The Fund may invest in any industry.
The Fund aims to achieve long-term capital growth.
The Fund will seek to invest in a diverse portfolio of equity securities that are listed, traded or dealt in on any of the Regulated Markets worldwide.
The Fund is not managed to a benchmark and may have exposure to developed or emerging markets whilst maintaining its geographical diversity.
294
(continued)
Stewart Investors Worldwide Equity Fund
Authorised Fund Manager's Reportfor the year ended 31 July 2017
Time 3 6 1 3 5 10 Sinceperiod mths mths yr yrs yrs yrs launch
2.9 7.7 13.7 55.4 79.7 - 82.7 3.6 6.4 17.9 53.5 98.9 - 100.3 4.1 7.0 17.6 48.3 94.3 - 92.0
4 2 4 2 4 - 3
12 mths to 12 mths to 12 mths to 12 mths to 12 mths to31/07/17 31/07/16 31/07/15 31/07/14 31/07/13
13.7 23.4 10.8 (2.5) 18.6
31 July 2017 31 July 2016% of Fund % of Fund
9.21 9.227.60 8.955.79 8.434.92 5.624.08 3.553.58 3.393.53 3.073.00 3.042.85 2.952.72 2.36
Types of sharesIncome and Accumulation.
Oversea-Chinese Banking MerckUnicharm UnicharmPZ Cussons Oversea-Chinese Banking
Henkel Henkel
Past performance should not be used as a guide to future performance, which is not guaranteed.
Ten largest holdings
Loews WatersTata Consultancy Services MarkelUnited States Treasury Bill 0% 07/09/2017 Nestle
Unilever United States Treasury Bill 0% 29/09/2016Berkshire Hathaway 'A' UnileverBeiersdorf Berkshire Hathaway 'A'
Cumulative performance as at 31 July 2017
Fund return %
TimeperiodFund return %
Benchmark: MSCI World Index.Sector: IA Global.
Benchmark return %Sector return %Quartile ranking
Discrete performance as at 31 July 2017
Stock name Stock name
Portfolio changes
Significant new positions established during the year included Beiersdorf (Germany: Consumer Staples), a well-run family-owned consumerfranchise with reasonable long-term potential for growth in cash flows, and Tata Consultancy Services (India: Information Technology), a strong ITfranchise backed by a family we have backed for a long period of time, which was reasonably valued. The Fund also bought W. W. Grainger (US:Industrials), a quality US industrial company that is undergoing positive change, spurred on by a new chief executive officer.
The Fund sold Banco Bradesco (Brazil: Financials) and Nestle (Switzerland: Consumer Staples) on valuation concerns. The Fund also sold WatersCorporation (US: Health Care) because of management changes and a high valuation.
Outlook
The Manager perceives many risks in the global economy, including the speed and extent of the increase in credit levels in the Chinese economyand the likely geopolitical disruptions resulting from the gradual shift away from fossil fuels towards renewables. However, the Manager believesthe far greater risk is that the many potential challenges facing companies and society are not sufficiently reflected in asset prices. This is why theManager continues to hold high cash levels on behalf of clients.
295
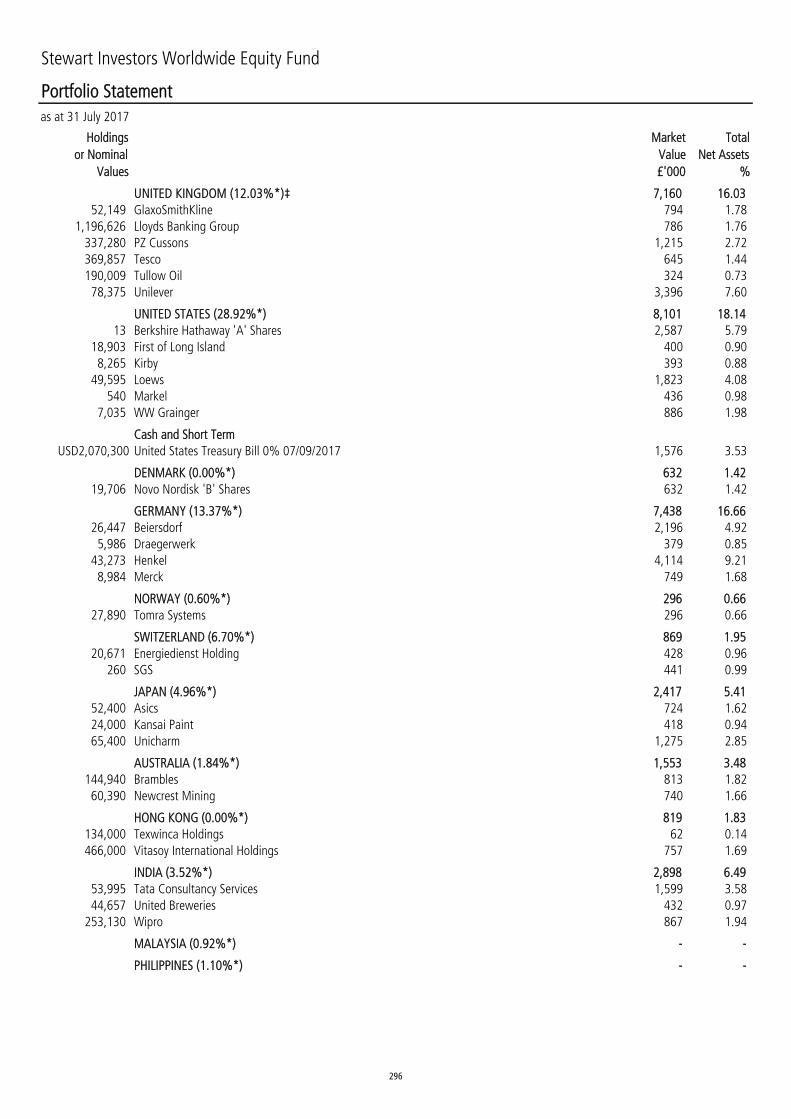
Holdingsor Nominal
Values
MarketValue£'000
TotalNet Assets
%
UNITED KINGDOM (12.03%*)‡ 7,160 16.0352,149 GlaxoSmithKline 794 1.78
1,196,626 Lloyds Banking Group 786 1.76337,280 PZ Cussons 1,215 2.72369,857 Tesco 645 1.44190,009 Tullow Oil 324 0.73
78,375 Unilever 3,396 7.60
UNITED STATES (28.92%*) 8,101 18.1413 Berkshire Hathaway 'A' Shares 2,587 5.79
18,903 First of Long Island 400 0.908,265 Kirby 393 0.88
49,595 Loews 1,823 4.08540 Markel 436 0.98
7,035 WW Grainger 886 1.98
Cash and Short TermUSD2,070,300 United States Treasury Bill 0% 07/09/2017 1,576 3.53
DENMARK (0.00%*) 632 1.4219,706 Novo Nordisk 'B' Shares 632 1.42
GERMANY (13.37%*) 7,438 16.6626,447 Beiersdorf 2,196 4.92
5,986 Draegerwerk 379 0.8543,273 Henkel 4,114 9.21
8,984 Merck 749 1.68
NORWAY (0.60%*) 296 0.6627,890 Tomra Systems 296 0.66
SWITZERLAND (6.70%*) 869 1.9520,671 Energiedienst Holding 428 0.96
260 SGS 441 0.99
JAPAN (4.96%*) 2,417 5.4152,400 Asics 724 1.6224,000 Kansai Paint 418 0.9465,400 Unicharm 1,275 2.85
AUSTRALIA (1.84%*) 1,553 3.48144,940 Brambles 813 1.82
60,390 Newcrest Mining 740 1.66
HONG KONG (0.00%*) 819 1.83134,000 Texwinca Holdings 62 0.14466,000 Vitasoy International Holdings 757 1.69
INDIA (3.52%*) 2,898 6.4953,995 Tata Consultancy Services 1,599 3.5844,657 United Breweries 432 0.97
253,130 Wipro 867 1.94
MALAYSIA (0.92%*) - -
PHILIPPINES (1.10%*) - -
Stewart Investors Worldwide Equity Fund
Portfolio Statementas at 31 July 2017
296
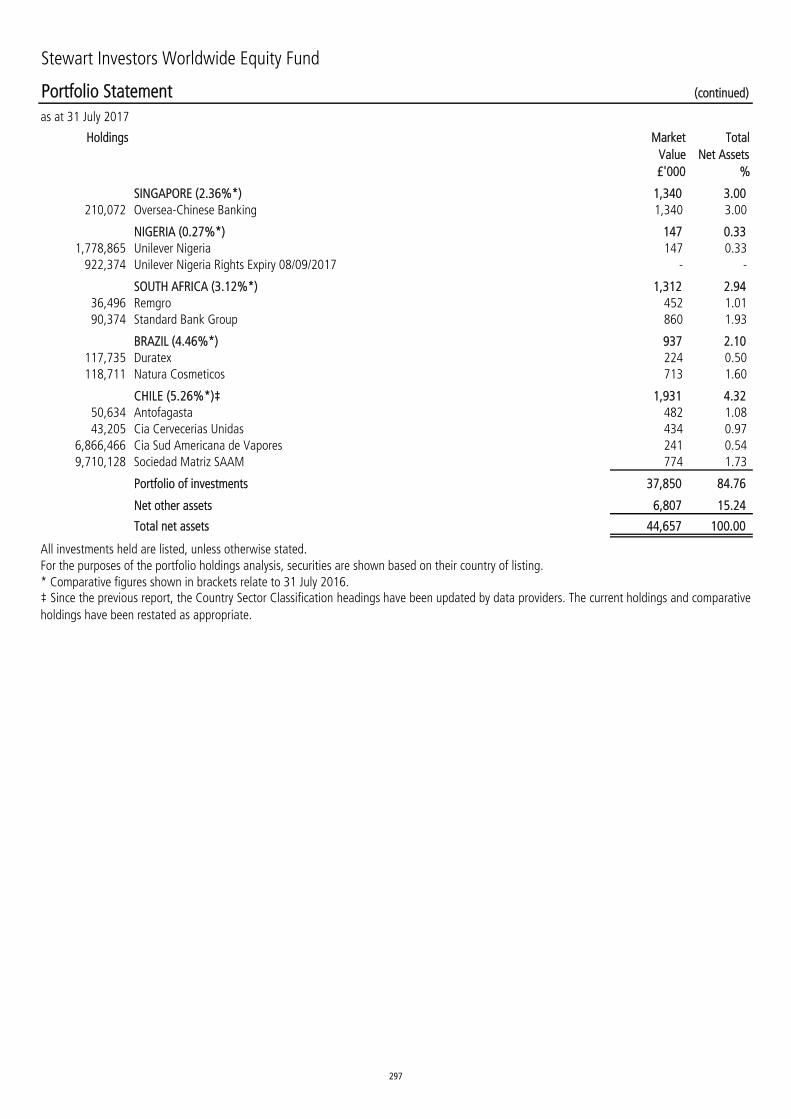
Holdings
MarketValue£'000
TotalNet Assets
%
Stewart Investors Worldwide Equity Fund
Portfolio Statement (continued)
as at 31 July 2017
SINGAPORE (2.36%*) 1,340 3.00210,072 Oversea-Chinese Banking 1,340 3.00
NIGERIA (0.27%*) 147 0.331,778,865 Unilever Nigeria 147 0.33
922,374 Unilever Nigeria Rights Expiry 08/09/2017 - -
SOUTH AFRICA (3.12%*) 1,312 2.9436,496 Remgro 452 1.0190,374 Standard Bank Group 860 1.93
BRAZIL (4.46%*) 937 2.10117,735 Duratex 224 0.50118,711 Natura Cosmeticos 713 1.60
CHILE (5.26%*)‡ 1,931 4.3250,634 Antofagasta 482 1.0843,205 Cia Cervecerias Unidas 434 0.97
6,866,466 Cia Sud Americana de Vapores 241 0.549,710,128 Sociedad Matriz SAAM 774 1.73
Portfolio of investments 37,850 84.76
Net other assets 6,807 15.24
Total net assets 44,657 100.00
‡ Since the previous report, the Country Sector Classification headings have been updated by data providers. The current holdings and comparativeholdings have been restated as appropriate.
All investments held are listed, unless otherwise stated.
* Comparative figures shown in brackets relate to 31 July 2016.For the purposes of the portfolio holdings analysis, securities are shown based on their country of listing.
297

Share class A Accumulation
Change in net assets per share
Opening net asset value per share
Return before operating charges*
Operating charges
Return after operating charges*
Distributions
Retained distributions on accumulation shares
Closing net asset value per share (p)
* after direct transaction costs of:
Performance
Return after charges (%)
Other information
Closing net asset value (£’000)
Closing number of shares
Operating charges
Direct transaction costs
Prices
Highest share price
Lowest share price 159.10 119.55 113.66
0.11% 0.06% 0.09%
186.99 162.09 137.55
1.95% 2.00% 1.96%
3,008 2,438 2,077
1,647,249 1,518,995 1,596,511
13.76% 23.39% 10.79%
182.61 160.52 130.09
0.19 0.08 0.11
- - -
22.09 30.43 12.67
- - -
25.45 33.11 15.13
(3.36) (2.68) (2.46)
160.52 130.09 117.42
Stewart Investors Worldwide Equity Fund
Comparative Tablefor the year ended 31 July 2017
Net Asset Value and Ongoing Charges Figure
Final 31 July 2017(p)
Final 31 July 2016(p)
Final 31 July 2015(p)
298

Stewart Investors Worldwide Equity Fund
Comparative Table (continued)
for the year ended 31 July 2017
Net Asset Value and Ongoing Charges Figure
Share class A Income
Change in net assets per share
Opening net asset value per share
Return before operating charges*
Operating charges
Return after operating charges*
Distributions
Closing net asset value per share (p)
* after direct transaction costs of:
Performance
Return after charges (%)
Other information
Closing net asset value (£’000)
Closing number of shares
Operating charges
Direct transaction costs
Prices
Highest share price
Lowest share price 161.26 121.18 115.30
0.11% 0.06% 0.09%
189.54 164.29 139.55
1.95% 2.03% 1.96%
73 67 107
39,656 40,955 81,220
13.77% 23.39% 10.70%
185.10 162.70 131.86
0.19 0.08 0.11
22.40 30.84 12.74
- - -
25.82 33.56 15.25
(3.42) (2.72) (2.51)
162.70 131.86 119.12
Final 31 July 2017(p)
Final 31 July 2016(p)
Final 31 July 2015(p)
299

Stewart Investors Worldwide Equity Fund
Comparative Table (continued)
for the year ended 31 July 2017
Net Asset Value and Ongoing Charges Figure
Share class B Accumulation
Change in net assets per share
Opening net asset value per share
Return before operating charges*
Operating charges
Return after operating charges*
Distributions
Retained distributions on accumulation shares
Closing net asset value per share (p)
* after direct transaction costs of:
Performance
Return after charges (%)
Other information
Closing net asset value (£’000)
Closing number of shares
Operating charges
Direct transaction costs
Prices
Highest share price
Lowest share price 165.08 123.25 116.49
0.11% 0.06% 0.09%
195.20 168.11 141.45
1.26% 1.31% 1.26%
24,187 15,996 11,449
12,678,242 9,605,466 8,540,782
14.56% 24.23% 11.55%
190.77 166.53 134.05
0.20 0.09 0.12
0.21 0.10 0.87
24.24 32.48 13.88
(0.21) (0.10) (0.87)
26.51 34.31 15.51
(2.27) (1.83) (1.63)
166.53 134.05 120.17
Final 31 July 2017(p)
Final 31 July 2016(p)
Final 31 July 2015(p)
300

Stewart Investors Worldwide Equity Fund
Comparative Table (continued)
for the year ended 31 July 2017
Net Asset Value and Ongoing Charges Figure
Share class B Income
Change in net assets per share
Opening net asset value per share
Return before operating charges*
Operating charges
Return after operating charges*
Distributions
Closing net asset value per share (p)
* after direct transaction costs of:
Performance
Return after charges (%)
Other information
Closing net asset value (£’000)
Closing number of shares
Operating charges
Direct transaction costs
Prices
Highest share price
Lowest share price 143.97 107.53 102.31
0.11% 0.06% 0.09%
170.28 146.75 124.12
1.23% 1.27% 1.20%
9,143 7,870 6,262
5,499,260 5,418,811 5,353,511
14.59% 24.29% 11.63%
166.25 145.24 116.97
0.17 0.08 0.10
21.19 28.41 12.27
(0.18) (0.14) (0.83)
23.13 29.95 13.64
(1.94) (1.54) (1.37)
145.24 116.97 105.53
Final 31 July 2017(p)
Final 31 July 2016(p)
Final 31 July 2015(p)
301

Stewart Investors Worldwide Equity Fund
Comparative Table (continued)
for the year ended 31 July 2017
Net Asset Value and Ongoing Charges Figure
Share class B Accumulation (EUR share class)
Change in net assets per share
Opening net asset value per share
Return before operating charges*
Operating charges
Return after operating charges*
Distributions
Retained distributions on accumulation shares
Closing net asset value per share (c)
* after direct transaction costs of:
Performance
Return after charges (%)
Other information
Closing net asset value (€’000)
Closing number of shares
Operating charges
Direct transaction costs
Prices
Highest share price
Lowest share price 148.67 128.39 111.83
0.11% 0.06% 0.09%
170.90 153.04 150.13
1.20% 1.24% 1.21%
6,331 5,504 4,805
3,870,471 3,637,771 3,300,567
8.12% 3.92% 25.56%
163.57 151.29 145.58
0.17 0.09 0.12
0.22 0.17 1.00
12.28 5.71 29.64
(0.22) (0.17) (1.00)
14.20 7.46 31.22
(1.92) (1.75) (1.58)
151.29 145.58 115.94
Final 31 July 2017(c)
Final 31 July 2016(c)
Final 31 July 2015(c)
302
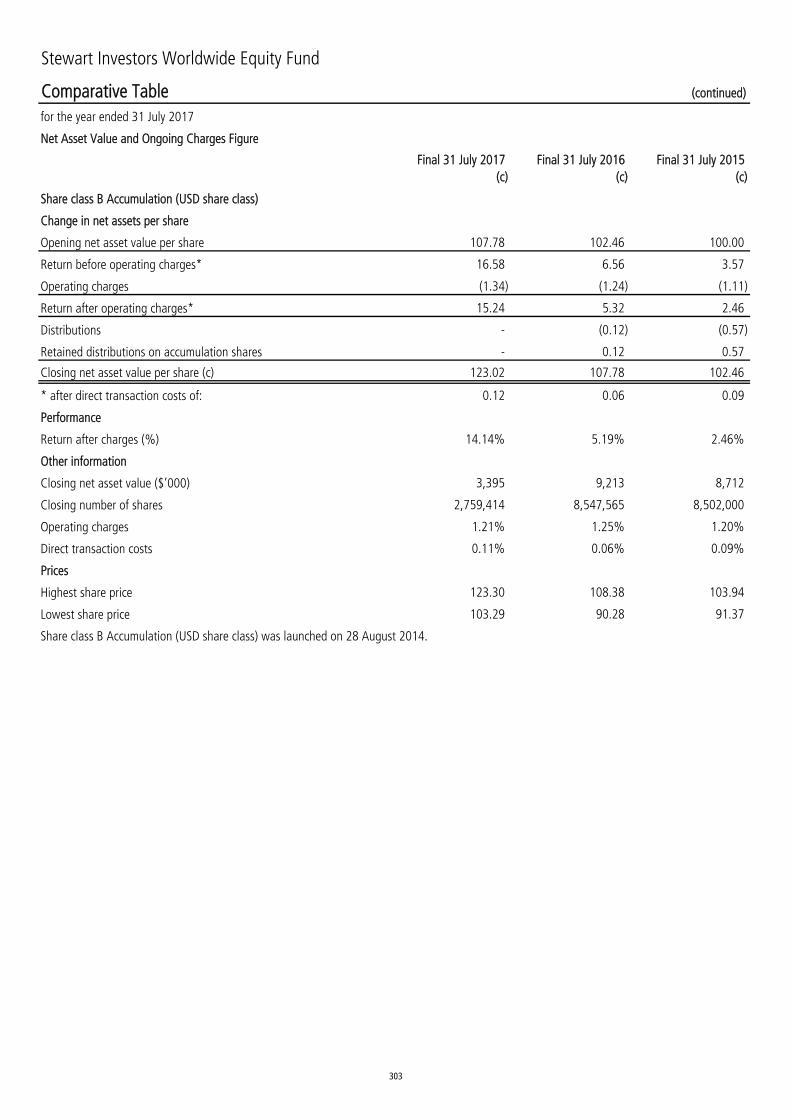
Stewart Investors Worldwide Equity Fund
Comparative Table (continued)
for the year ended 31 July 2017
Net Asset Value and Ongoing Charges Figure
Share class B Accumulation (USD share class)
Change in net assets per share
Opening net asset value per share
Return before operating charges*
Operating charges
Return after operating charges*
Distributions
Retained distributions on accumulation shares
Closing net asset value per share (c)
* after direct transaction costs of:
Performance
Return after charges (%)
Other information
Closing net asset value ($’000)
Closing number of shares
Operating charges
Direct transaction costs
Prices
Highest share price
Lowest share price
Share class B Accumulation (USD share class) was launched on 28 August 2014.
103.29 90.28 91.37
0.11% 0.06% 0.09%
123.30 108.38 103.94
1.21% 1.25% 1.20%
3,395 9,213 8,712
2,759,414 8,547,565 8,502,000
14.14% 5.19% 2.46%
123.02 107.78 102.46
0.12 0.06 0.09
- 0.12 0.57
15.24 5.32 2.46
- (0.12) (0.57)
16.58 6.56 3.57
(1.34) (1.24) (1.11)
107.78 102.46 100.00
Final 31 July 2017(c)
Final 31 July 2016(c)
Final 31 July 2015(c)
303

Notes £'000 £'000 £'000 £'000
Net capital gains 2 5,598 7,234
Revenue 3 625 473
4 (537) (401)
Interest payable and similar charges - -
88 72
5 (81) (95)
7 (23)
5,605 7,211
6 (45) (28)
5,560 7,183
£'000 £'000 £'000 £'000
38,003 28,876
9,849 2,407
(8,807) (487)
1,042 1,920
17 1
5,560 7,183
35 23
44,657 38,003
Less: Amounts payable on cancellation of shares
Dilution adjustment
Change in net assets attributable to shareholders from investment activities
Retained distribution on accumulation shares
Closing net assets attributable to shareholders
Notes to the Financial Statements are on pages 306 to 311.
Amounts receivable on issue of shares
for the year ended 31 July 2017
31 July 2017 31 July 2016
Opening net assets attributable to shareholders
Statement of Change in Net Assets Attributable to Shareholders
Income
Expenses
Net revenue before taxation
Taxation
Net revenue/(expenses) after taxation
Total return before distribution
Distribution
Change in net assets attributable to shareholders from investment activities
31 July 2017 31 July 2016
Stewart Investors Worldwide Equity Fund
Statement of Total Returnfor the year ended 31 July 2017
304

Stewart Investors Worldwide Equity Fund
31 July 2017 31 July 2016Notes £'000 £'000
Investments 37,850 33,987
Current assets
8 71 332
6,849 7,151
44,770 41,470
Creditors
(10) (7)
Other creditors 9 (103) (3,460)
(113) (3,467)
44,657 38,003
Notes to the Financial Statements are on pages 306 to 311.
Distribution payable
Total liabilities
Net assets attributable to shareholders
Balance Sheetas at 31 July 2017
Assets
Fixed assets
Debtors
Cash and bank balances
Total assets
Liabilities
305
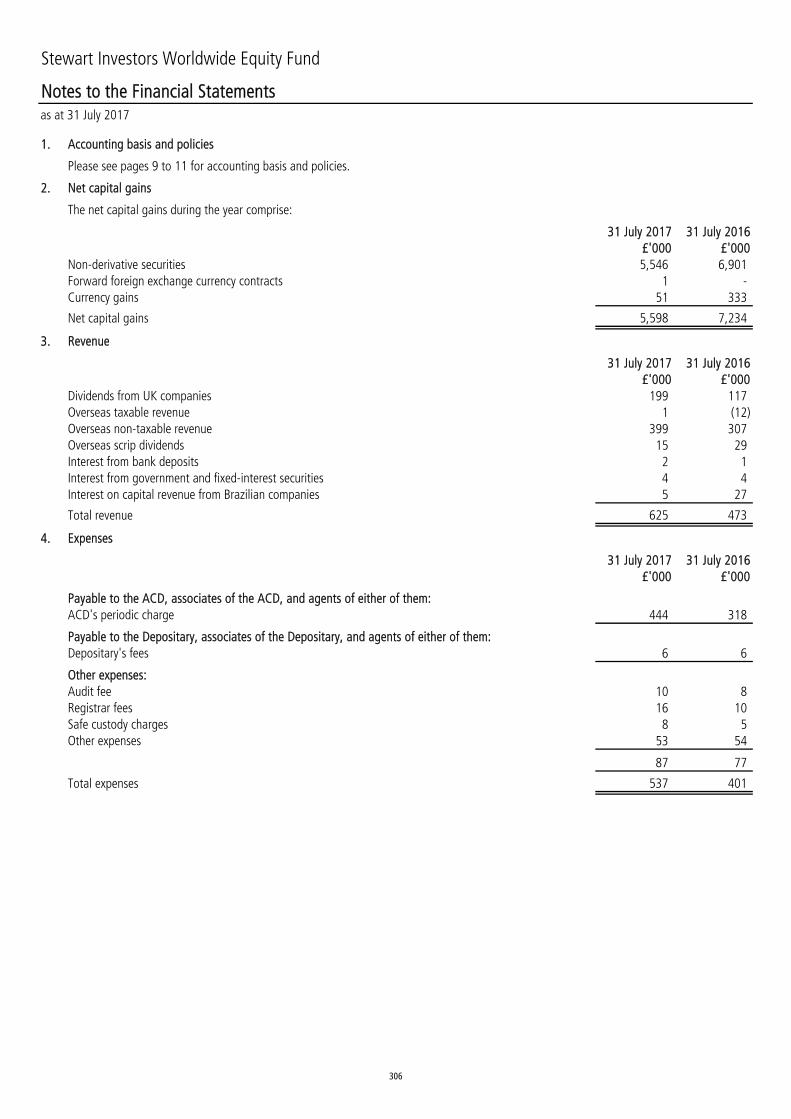
1.
2.
31 July 2017 31 July 2016£'000 £'0005,546 6,901
1 -51 333
5,598 7,234
3.
31 July 2017 31 July 2016£'000 £'000
199 1171 (12)
399 30715 29
2 14 45 27
625 473
4.
31 July 2017 31 July 2016£'000 £'000
444 318
6 6
10 816 10
8 553 54
87 77
537 401Total expenses
Audit feeRegistrar feesSafe custody chargesOther expenses
Other expenses:
Payable to the Depositary, associates of the Depositary, and agents of either of them:Depositary's fees
Expenses
Payable to the ACD, associates of the ACD, and agents of either of them:ACD's periodic charge
Total revenue
Interest on capital revenue from Brazilian companies
Interest from bank depositsInterest from government and fixed-interest securities
Overseas scrip dividends
Dividends from UK companiesOverseas taxable revenueOverseas non-taxable revenue
Net capital gains
Revenue
Forward foreign exchange currency contractsCurrency gains
Accounting basis and policies
Please see pages 9 to 11 for accounting basis and policies.
Net capital gains
The net capital gains during the year comprise:
Non-derivative securities
Notes to the Financial Statementsas at 31 July 2017
Stewart Investors Worldwide Equity Fund
306

Notes to the Financial Statements (continued)
as at 31 July 2017
Stewart Investors Worldwide Equity Fund
5.
31 July 2017 31 July 2016£'000 £'000
(a)64 5817 37
81 95
(b)
88 72
18 14
(40) (23)(3) (6)
(80) (61)105 77
64 58- (1)
17 37
81 95
(c)
(d)
6.
31 July 2017 31 July 2016£'000 £'000
- -45 30
45 302 -
(2) (2)
45 28
7.
31 July 2017 31 July 2016£'000 £'000
7 (23)21 14
Indian capital gains tax 17 37
45 28Net distribution for the year
Details of the distribution per share are set out in the Distribution Tables on pages 312 to 313.
Movement between net revenue/(expenses) and net distribution
Net revenue/(expenses) after taxationRevenue deficit
Add: revenue deducted on cancellation of sharesDeduct: revenue received on issue of shares
Net distribution for the year
Final distributionInterim distribution
Distribution
The distribution takes account of revenue received on the issue of shares and revenue deducted on the cancellation of shares and comprise:
Factors that may affect future tax charges:
At the year end, after offset against revenue taxable on receipt, there is a potential deferred tax asset of £460,402 (31/07/16: £355,163); thisrelates to surplus management expenses. No deferred tax asset was recognised in the current and prior year as it was considered unlikely theFund would generate sufficient taxable profits in the future to utilise these amounts.
Deferred taxation:
There is no provision required for deferred taxation at the balance sheet date in the current or prior year.
Total tax charge for year (note 5a)
OEICs are exempt from tax on capital gains. Therefore, any capital return is not included in the above reconciliation.
* As an authorised OEIC, these items are not subject to corporation tax.
Indian capital gains taxOverseas tax expensed
Movement in excess management expensesIrrecoverable overseas tax
UK dividends*Non-taxable scrip dividends*Overseas non-taxable revenue*
Net revenue before taxation
Corporation tax of 20% (2016: 20%)
Effects of:
Total taxation (note 5b)
Factors affecting current tax charge for the year:
The tax assessed for the year is higher than (2016: higher than) the standard rate of corporation tax in the UK for an open-ended investmentcompany of 20% (2016: 20%). The differences are explained below:
Indian capital gains taxIrrecoverable overseas taxAnalysis of charge in year:
Taxation
307
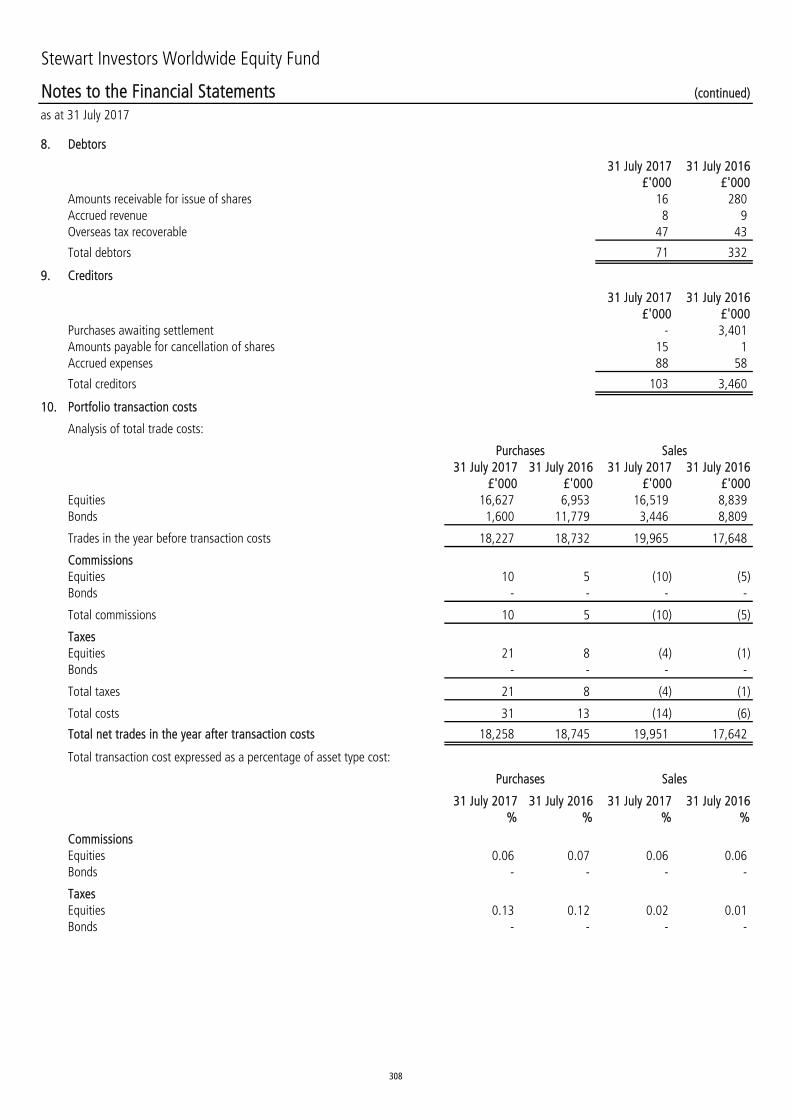
Notes to the Financial Statements (continued)
as at 31 July 2017
Stewart Investors Worldwide Equity Fund
8.
31 July 2017 31 July 2016£'000 £'000
16 2808 9
47 43
71 332
9.
31 July 2017 31 July 2016£'000 £'000
- 3,40115 188 58
103 3,460
10.
31 July 2017 31 July 2016 31 July 2017 31 July 2016£'000 £'000 £'000 £'000
16,627 6,953 16,519 8,8391,600 11,779 3,446 8,809
18,227 18,732 19,965 17,648
10 5 (10) (5)- - - -
10 5 (10) (5)
21 8 (4) (1)- - - -
21 8 (4) (1)
31 13 (14) (6)
18,258 18,745 19,951 17,642
31 July 2017 31 July 2016 31 July 2017 31 July 2016% % % %
0.06 0.07 0.06 0.06- - - -
0.13 0.12 0.02 0.01- - - -
EquitiesBonds
Taxes
CommissionsEquitiesBonds
Total transaction cost expressed as a percentage of asset type cost:
Purchases Sales
Total taxes
Total costs
Total net trades in the year after transaction costs
Total commissions
TaxesEquitiesBonds
Trades in the year before transaction costs
CommissionsEquitiesBonds
Analysis of total trade costs:
Purchases Sales
EquitiesBonds
Total creditors
Portfolio transaction costs
Purchases awaiting settlementAmounts payable for cancellation of sharesAccrued expenses
Creditors
Total debtors
Overseas tax recoverable
Amounts receivable for issue of sharesAccrued revenue
Debtors
308

Notes to the Financial Statements (continued)
as at 31 July 2017
Stewart Investors Worldwide Equity Fund
11.
12.
(a)
(b)
As at 31 July 2017, 18.87% (31/07/2016: 27.77%) of the Fund's assets were interest-bearing.
As at 31 July 2017, if interest rates increase or decrease by 0.25%, with all other variables remaining constant, the resulting change in thenet assets attributable to shareholders of the Stewart Investors Worldwide Equity Fund would be an increase or decrease of approximately£21,062 (31/07/16: £26,382).
There is no material difference between the value of the financial assets and liabilities, as shown in the Balance Sheet, and their fair value.
If market prices increase or decrease by 10%, then the impact on the portfolio will be an increase or decrease of 10% (£3,785,044)(31/07/16: £3,398,709).
Interest-rate risk
The Fund does not significantly invest in either fixed or floating-rate securities, and interest-rate risk exposure is predominantly restricted tointerest receivable.
The Fund’s main liability is the redemption of any shares that investors wish to sell. In general, the ACD manages the cash to ensure that itcan meet its liabilities. Assets from a Fund may need to be sold if insufficient cash is available to finance such redemptions. The Fund’sholdings are reviewed on a regular basis, with particular emphasis on the market capitalisation of the issuer (securities issued by largercapitalised companies generally have greater liquidity) and the number of days it would take to trade out of a given securities position orpercentage of the Fund as a whole (determined by reference to available market trading volumes). Funds that have a higher concentration ofsecurities that are deemed to be less liquid are regularly monitored.
As a proportion of the Fund’s investment portfolio is invested in overseas securities, the Balance Sheet can be affected by movements inforeign exchange rates. The Investment Manager may seek to manage exposure to currency movements by using forward foreign exchangecontracts or by hedging the sterling value of investments that are priced in other currencies. Income received in other currencies is convertedto sterling on or near the date of receipt.
The market value of investments is taken to equal ‘fair value’ for the purposes of Financial Reporting Standard 102. Given all the activities ofthe Fund, none of the investments held fall within the definition of ‘investments held for trading’ as set out in Financial Reporting Standard13.
Fair value of financial assets and financial liabilities
Derivatives and other financial instruments
General
In pursuing its investment objectives, the Fund holds equity shares.
The main risk arising from the Fund’s financial instruments is market-price risk. Market-price risk arises mainly from uncertainty about futureprices of the financial instruments held. Investment risk in the portfolio is regularly reviewed and controlled through the adoption ofparameters limiting exposures to various factors such as industries, countries, and company size.
The Fund has little exposure to credit or cash-flow risk. Certain transactions in securities that the Fund enters into expose it to the risk thatthe counter-party will not deliver the investment (purchase) or cash (sale) after the Fund has fulfilled its responsibilities. The Fund only buysand sells investments through brokers that have been approved by the Authorised Corporate Director as an acceptable counter-party. This listis reviewed quarterly. The Fund’s assets comprise mainly realisable securities that can be readily sold in normal market conditions.
Contingent liabilities and commitments
As at 31 July 2017, the Fund had no contingent liabilities (31/07/16: £nil) and no commitments (31/07/16: £nil).
Average portfolio dealing spread
The average portfolio dealing spread at the balance sheet date was 0.25% (31/07/2016: 0.22%).
Total costs 0.11 0.05
Commissions 0.05 0.03Taxes 0.06 0.02
Total transaction cost expressed as a percentage of average net asset value:
31 July 2017 31 July 2016% %
309
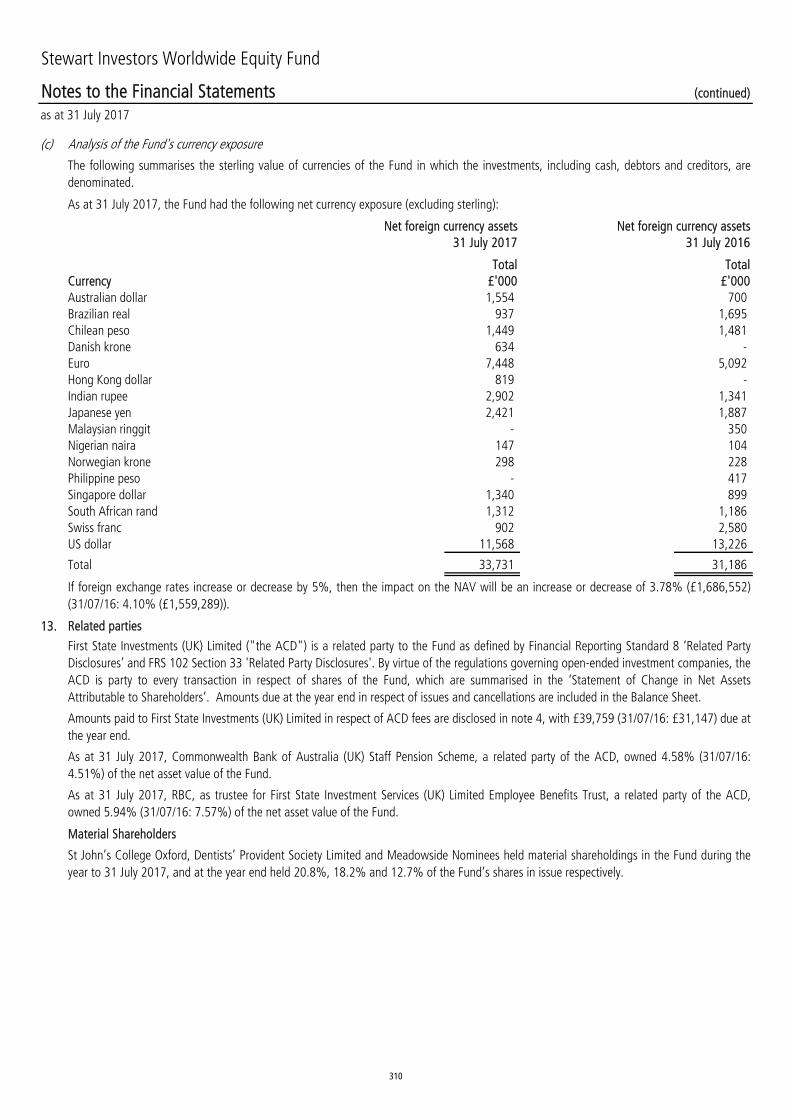
Notes to the Financial Statements (continued)
as at 31 July 2017
Stewart Investors Worldwide Equity Fund
(c)
Total TotalCurrency £'000 £'000Australian dollar 1,554 700Brazilian real 937 1,695Chilean peso 1,449 1,481Danish krone 634 -Euro 7,448 5,092Hong Kong dollar 819 - Indian rupee 2,902 1,341Japanese yen 2,421 1,887Malaysian ringgit - 350Nigerian naira 147 104Norwegian krone 298 228Philippine peso - 417Singapore dollar 1,340 899South African rand 1,312 1,186Swiss franc 902 2,580US dollar 11,568 13,226
Total 33,731 31,186
13.
Material Shareholders
St John’s College Oxford, Dentists’ Provident Society Limited and Meadowside Nominees held material shareholdings in the Fund during theyear to 31 July 2017, and at the year end held 20.8%, 18.2% and 12.7% of the Fund’s shares in issue respectively.
Amounts paid to First State Investments (UK) Limited in respect of ACD fees are disclosed in note 4, with £39,759 (31/07/16: £31,147) due at the year end.
As at 31 July 2017, Commonwealth Bank of Australia (UK) Staff Pension Scheme, a related party of the ACD, owned 4.58% (31/07/16:4.51%) of the net asset value of the Fund.
As at 31 July 2017, RBC, as trustee for First State Investment Services (UK) Limited Employee Benefits Trust, a related party of the ACD,owned 5.94% (31/07/16: 7.57%) of the net asset value of the Fund.
Related parties
First State Investments (UK) Limited ("the ACD") is a related party to the Fund as defined by Financial Reporting Standard 8 ‘Related PartyDisclosures’ and FRS 102 Section 33 'Related Party Disclosures'. By virtue of the regulations governing open-ended investment companies, theACD is party to every transaction in respect of shares of the Fund, which are summarised in the ‘Statement of Change in Net AssetsAttributable to Shareholders’. Amounts due at the year end in respect of issues and cancellations are included in the Balance Sheet.
If foreign exchange rates increase or decrease by 5%, then the impact on the NAV will be an increase or decrease of 3.78% (£1,686,552)(31/07/16: 4.10% (£1,559,289)).
The following summarises the sterling value of currencies of the Fund in which the investments, including cash, debtors and creditors, aredenominated.
As at 31 July 2017, the Fund had the following net currency exposure (excluding sterling):
Net foreign currency assets Net foreign currency assets31 July 2017 31 July 2016
Analysis of the Fund's currency exposure
310
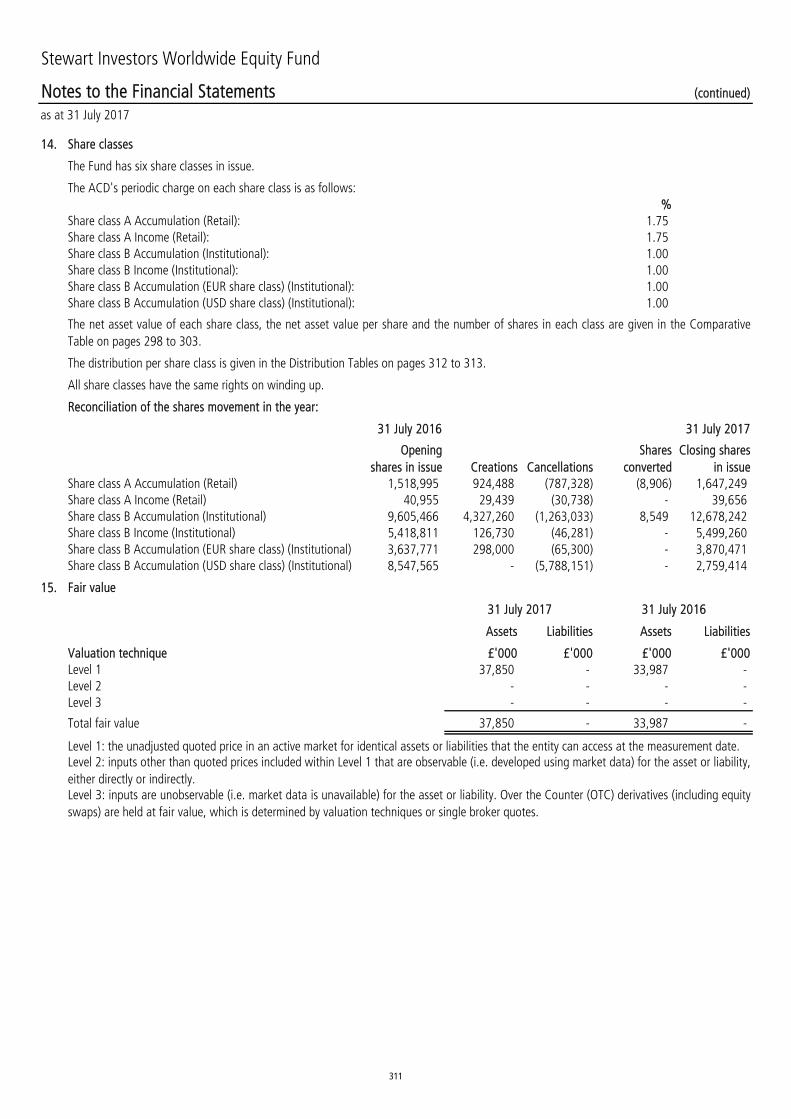
Notes to the Financial Statements (continued)
as at 31 July 2017
Stewart Investors Worldwide Equity Fund
14.
%1.751.751.001.001.001.00
31 July 2016 31 July 2017
Opening shares in issue Creations Cancellations
Shares converted
Closing shares in issue
1,518,995 924,488 (787,328) (8,906) 1,647,24940,955 29,439 (30,738) - 39,656
9,605,466 4,327,260 (1,263,033) 8,549 12,678,2425,418,811 126,730 (46,281) - 5,499,2603,637,771 298,000 (65,300) - 3,870,4718,547,565 - (5,788,151) - 2,759,414
15.
Assets Liabilities Assets Liabilities
£'000 £'000 £'000 £'00037,850 - 33,987 -
- - - -- - - -
37,850 - 33,987 -
Level 3: inputs are unobservable (i.e. market data is unavailable) for the asset or liability. Over the Counter (OTC) derivatives (including equityswaps) are held at fair value, which is determined by valuation techniques or single broker quotes.
Level 1Level 2Level 3
Total fair value
Level 1: the unadjusted quoted price in an active market for identical assets or liabilities that the entity can access at the measurement date. Level 2: inputs other than quoted prices included within Level 1 that are observable (i.e. developed using market data) for the asset or liability,either directly or indirectly.
Fair value
Valuation technique
31 July 2017 31 July 2016
Share class B Income (Institutional)Share class B Accumulation (EUR share class) (Institutional)Share class B Accumulation (USD share class) (Institutional)
All share classes have the same rights on winding up.
Reconciliation of the shares movement in the year:
Share class A Accumulation (Retail)Share class A Income (Retail)Share class B Accumulation (Institutional)
The net asset value of each share class, the net asset value per share and the number of shares in each class are given in the ComparativeTable on pages 298 to 303.
The distribution per share class is given in the Distribution Tables on pages 312 to 313.
Share class B Accumulation (EUR share class) (Institutional):Share class B Accumulation (USD share class) (Institutional):
The ACD's periodic charge on each share class is as follows:
Share class A Accumulation (Retail):Share class A Income (Retail):Share class B Accumulation (Institutional):Share class B Income (Institutional):
Share classes
The Fund has six share classes in issue.
311
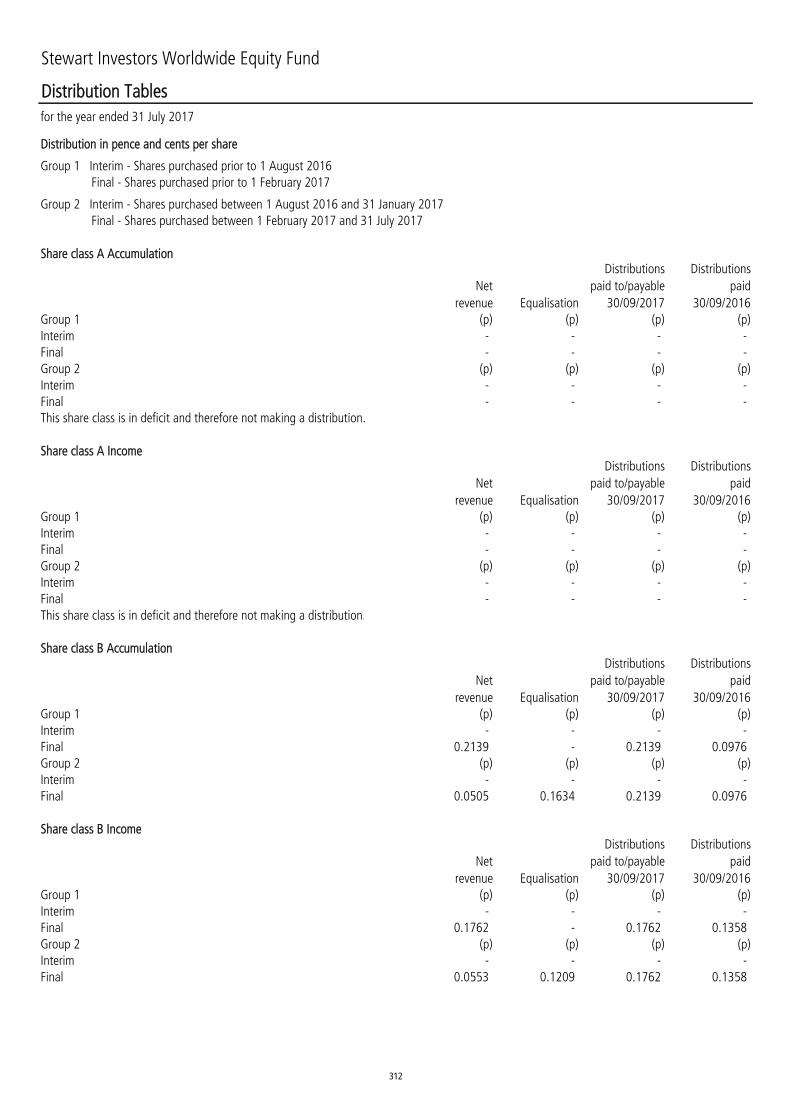
Share class A Accumulation
Netrevenue Equalisation
Distributions paid to/payable
30/09/2017
Distributions paid
30/09/2016Group 1 (p) (p) (p) (p)Interim - - - -Final - - - -Group 2 (p) (p) (p) (p)Interim - - - -Final - - - -
Share class A Income
Netrevenue Equalisation
Distributions paid to/payable
30/09/2017
Distributions paid
30/09/2016Group 1 (p) (p) (p) (p)Interim - - - -Final - - - -Group 2 (p) (p) (p) (p)Interim - - - -Final - - - -This share class is in deficit and therefore not making a distribution.
Share class B Accumulation
Netrevenue Equalisation
Distributions paid to/payable
30/09/2017
Distributions paid
30/09/2016Group 1 (p) (p) (p) (p)Interim - - - -Final 0.2139 - 0.2139 0.0976Group 2 (p) (p) (p) (p)Interim - - - -Final 0.0505 0.1634 0.2139 0.0976
Share class B Income
Netrevenue Equalisation
Distributions paid to/payable
30/09/2017
Distributions paid
30/09/2016Group 1 (p) (p) (p) (p)Interim - - - -Final 0.1762 - 0.1762 0.1358Group 2 (p) (p) (p) (p)Interim - - - -Final 0.0553 0.1209 0.1762 0.1358
Final - Shares purchased between 1 February 2017 and 31 July 2017
This share class is in deficit and therefore not making a distribution.
Group 2 Interim - Shares purchased between 1 August 2016 and 31 January 2017
Final - Shares purchased prior to 1 February 2017
Distribution in pence and cents per share
Stewart Investors Worldwide Equity Fund
Distribution Tablesfor the year ended 31 July 2017
Group 1 Interim - Shares purchased prior to 1 August 2016
312
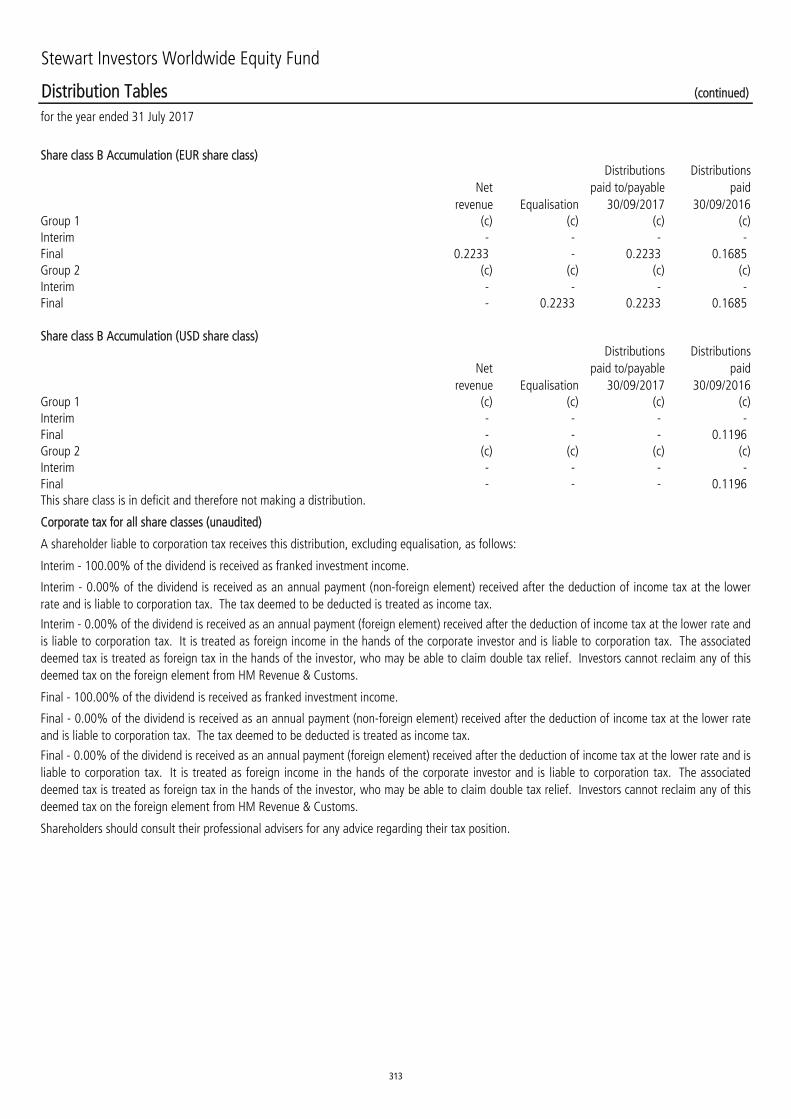
Stewart Investors Worldwide Equity Fund
Distribution Tables (continued)
for the year ended 31 July 2017
Share class B Accumulation (EUR share class)
Netrevenue Equalisation
Distributions paid to/payable
30/09/2017
Distributions paid
30/09/2016Group 1 (c) (c) (c) (c)Interim - - - -Final 0.2233 - 0.2233 0.1685Group 2 (c) (c) (c) (c)Interim - - - -Final - 0.2233 0.2233 0.1685
Share class B Accumulation (USD share class)
Netrevenue Equalisation
Distributions paid to/payable
30/09/2017
Distributions paid
30/09/2016Group 1 (c) (c) (c) (c)Interim - - - -Final - - - 0.1196Group 2 (c) (c) (c) (c)Interim - - - -Final - - - 0.1196
Shareholders should consult their professional advisers for any advice regarding their tax position.
Final - 100.00% of the dividend is received as franked investment income.
Final - 0.00% of the dividend is received as an annual payment (non-foreign element) received after the deduction of income tax at the lower rateand is liable to corporation tax. The tax deemed to be deducted is treated as income tax.
Final - 0.00% of the dividend is received as an annual payment (foreign element) received after the deduction of income tax at the lower rate and isliable to corporation tax. It is treated as foreign income in the hands of the corporate investor and is liable to corporation tax. The associateddeemed tax is treated as foreign tax in the hands of the investor, who may be able to claim double tax relief. Investors cannot reclaim any of thisdeemed tax on the foreign element from HM Revenue & Customs.
Interim - 100.00% of the dividend is received as franked investment income.
Interim - 0.00% of the dividend is received as an annual payment (non-foreign element) received after the deduction of income tax at the lowerrate and is liable to corporation tax. The tax deemed to be deducted is treated as income tax.
Interim - 0.00% of the dividend is received as an annual payment (foreign element) received after the deduction of income tax at the lower rate andis liable to corporation tax. It is treated as foreign income in the hands of the corporate investor and is liable to corporation tax. The associateddeemed tax is treated as foreign tax in the hands of the investor, who may be able to claim double tax relief. Investors cannot reclaim any of thisdeemed tax on the foreign element from HM Revenue & Customs.
Corporate tax for all share classes (unaudited)
A shareholder liable to corporation tax receives this distribution, excluding equalisation, as follows:
This share class is in deficit and therefore not making a distribution.
313
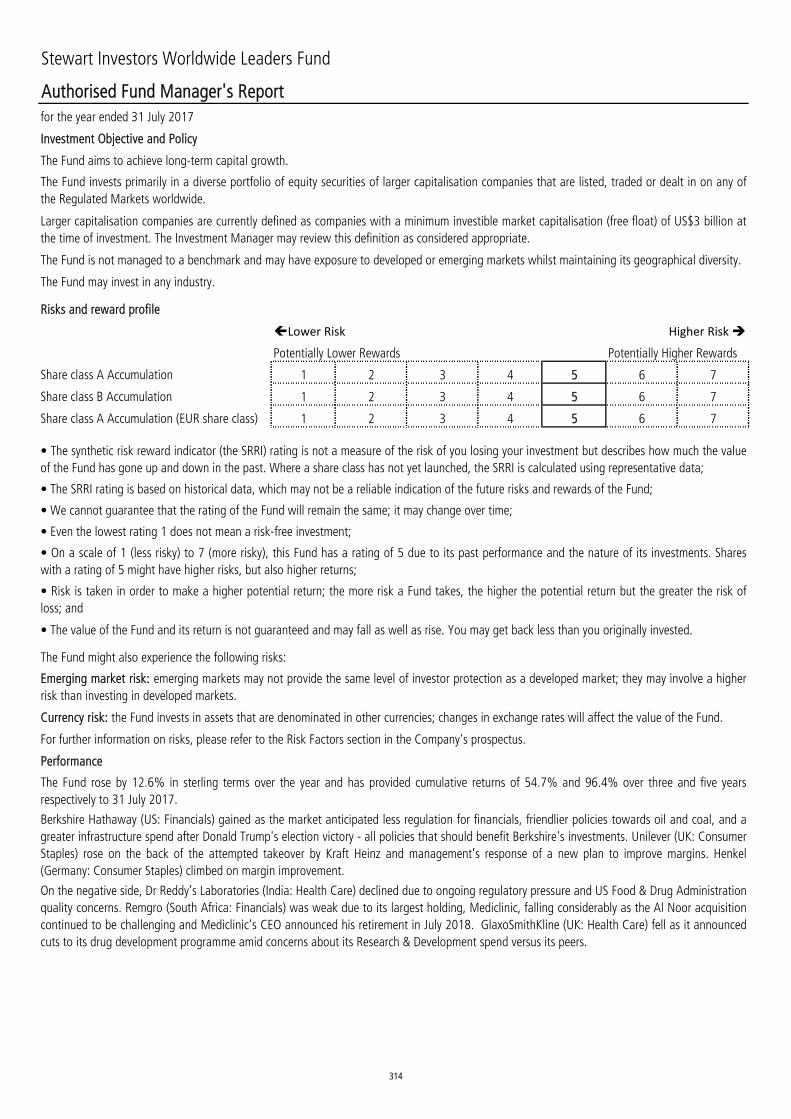
Risks and reward profile
Lower Risk Higher Risk
Potentially Lower Rewards Potentially Higher Rewards
1 2 3 4 5 6 7
1 2 3 4 5 6 7
1 2 3 4 5 6 7
Performance
The Fund rose by 12.6% in sterling terms over the year and has provided cumulative returns of 54.7% and 96.4% over three and five yearsrespectively to 31 July 2017.
Berkshire Hathaway (US: Financials) gained as the market anticipated less regulation for financials, friendlier policies towards oil and coal, and agreater infrastructure spend after Donald Trump's election victory - all policies that should benefit Berkshire's investments. Unilever (UK: ConsumerStaples) rose on the back of the attempted takeover by Kraft Heinz and management’s response of a new plan to improve margins. Henkel(Germany: Consumer Staples) climbed on margin improvement.
On the negative side, Dr Reddy’s Laboratories (India: Health Care) declined due to ongoing regulatory pressure and US Food & Drug Administrationquality concerns. Remgro (South Africa: Financials) was weak due to its largest holding, Mediclinic, falling considerably as the Al Noor acquisitioncontinued to be challenging and Mediclinic’s CEO announced his retirement in July 2018. GlaxoSmithKline (UK: Health Care) fell as it announcedcuts to its drug development programme amid concerns about its Research & Development spend versus its peers.
For further information on risks, please refer to the Risk Factors section in the Company's prospectus.
Emerging market risk: emerging markets may not provide the same level of investor protection as a developed market; they may involve a higherrisk than investing in developed markets.
Currency risk: the Fund invests in assets that are denominated in other currencies; changes in exchange rates will affect the value of the Fund.
• Even the lowest rating 1 does not mean a risk-free investment;
• On a scale of 1 (less risky) to 7 (more risky), this Fund has a rating of 5 due to its past performance and the nature of its investments. Shareswith a rating of 5 might have higher risks, but also higher returns;
• Risk is taken in order to make a higher potential return; the more risk a Fund takes, the higher the potential return but the greater the risk ofloss; and
• The value of the Fund and its return is not guaranteed and may fall as well as rise. You may get back less than you originally invested.
The Fund might also experience the following risks:
• The synthetic risk reward indicator (the SRRI) rating is not a measure of the risk of you losing your investment but describes how much the valueof the Fund has gone up and down in the past. Where a share class has not yet launched, the SRRI is calculated using representative data;
• The SRRI rating is based on historical data, which may not be a reliable indication of the future risks and rewards of the Fund;
• We cannot guarantee that the rating of the Fund will remain the same; it may change over time;
Share class A Accumulation
Share class B Accumulation
Share class A Accumulation (EUR share class)
The Fund aims to achieve long-term capital growth.
The Fund invests primarily in a diverse portfolio of equity securities of larger capitalisation companies that are listed, traded or dealt in on any ofthe Regulated Markets worldwide.
Larger capitalisation companies are currently defined as companies with a minimum investible market capitalisation (free float) of US$3 billion atthe time of investment. The Investment Manager may review this definition as considered appropriate.
Stewart Investors Worldwide Leaders Fund
Authorised Fund Manager's Reportfor the year ended 31 July 2017
Investment Objective and Policy
The Fund is not managed to a benchmark and may have exposure to developed or emerging markets whilst maintaining its geographical diversity.
The Fund may invest in any industry.
314
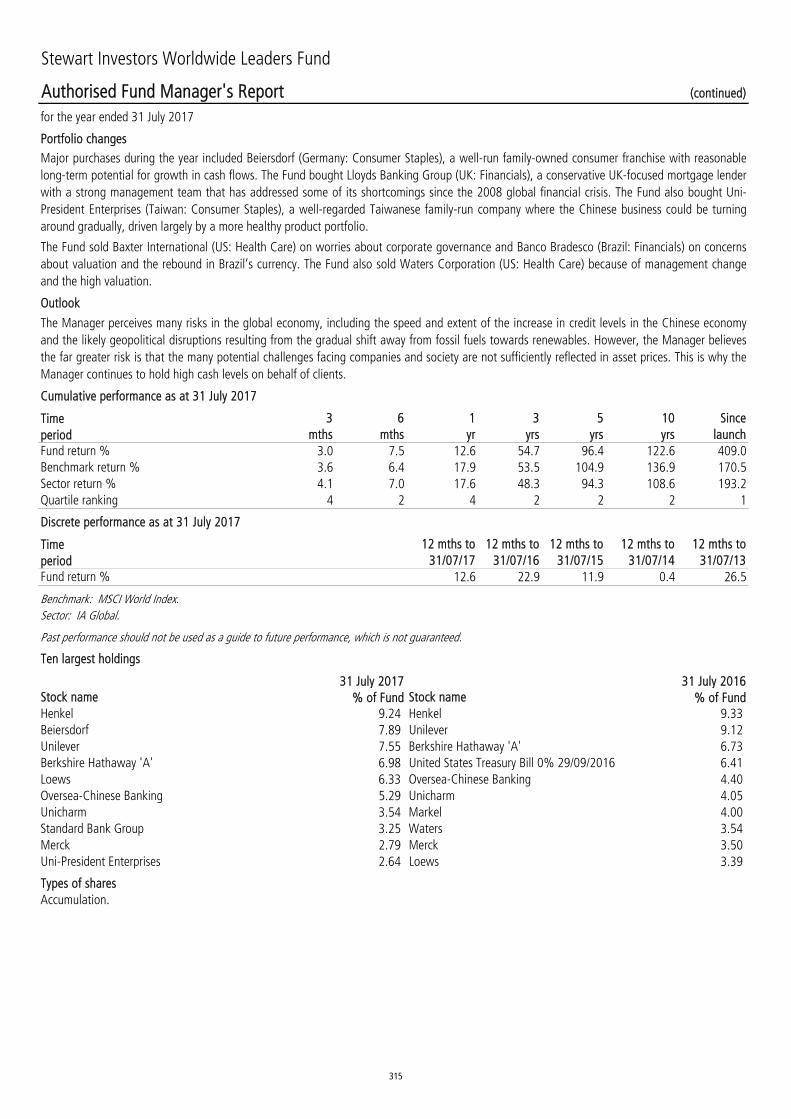
(continued)
Stewart Investors Worldwide Leaders Fund
Authorised Fund Manager's Reportfor the year ended 31 July 2017
Time 3 6 1 3 5 10 Sinceperiod mths mths yr yrs yrs yrs launch
3.0 7.5 12.6 54.7 96.4 122.6 409.0 3.6 6.4 17.9 53.5 104.9 136.9 170.5 4.1 7.0 17.6 48.3 94.3 108.6 193.2
4 2 4 2 2 2 1
12 mths to 12 mths to 12 mths to 12 mths to 12 mths to31/07/17 31/07/16 31/07/15 31/07/14 31/07/13
12.6 22.9 11.9 0.4 26.5
31 July 2017 31 July 2016% of Fund % of Fund
9.24 9.337.89 9.127.55 6.736.98 6.416.33 4.405.29 4.053.54 4.003.25 3.542.79 3.502.64 3.39
Types of sharesAccumulation.
Standard Bank Group WatersMerck MerckUni-President Enterprises Loews
Loews Oversea-Chinese BankingOversea-Chinese Banking UnicharmUnicharm Markel
Beiersdorf UnileverUnilever Berkshire Hathaway 'A' Berkshire Hathaway 'A' United States Treasury Bill 0% 29/09/2016
Stock name Stock nameHenkel Henkel
Past performance should not be used as a guide to future performance, which is not guaranteed.
Ten largest holdings
TimeperiodFund return %
Benchmark: MSCI World Index.Sector: IA Global.
Benchmark return %Sector return %Quartile ranking
Discrete performance as at 31 July 2017
Cumulative performance as at 31 July 2017
Fund return %
Outlook
The Manager perceives many risks in the global economy, including the speed and extent of the increase in credit levels in the Chinese economyand the likely geopolitical disruptions resulting from the gradual shift away from fossil fuels towards renewables. However, the Manager believesthe far greater risk is that the many potential challenges facing companies and society are not sufficiently reflected in asset prices. This is why theManager continues to hold high cash levels on behalf of clients.
Portfolio changes
Major purchases during the year included Beiersdorf (Germany: Consumer Staples), a well-run family-owned consumer franchise with reasonablelong-term potential for growth in cash flows. The Fund bought Lloyds Banking Group (UK: Financials), a conservative UK-focused mortgage lenderwith a strong management team that has addressed some of its shortcomings since the 2008 global financial crisis. The Fund also bought Uni-President Enterprises (Taiwan: Consumer Staples), a well-regarded Taiwanese family-run company where the Chinese business could be turningaround gradually, driven largely by a more healthy product portfolio.
The Fund sold Baxter International (US: Health Care) on worries about corporate governance and Banco Bradesco (Brazil: Financials) on concernsabout valuation and the rebound in Brazil’s currency. The Fund also sold Waters Corporation (US: Health Care) because of management changeand the high valuation.
315
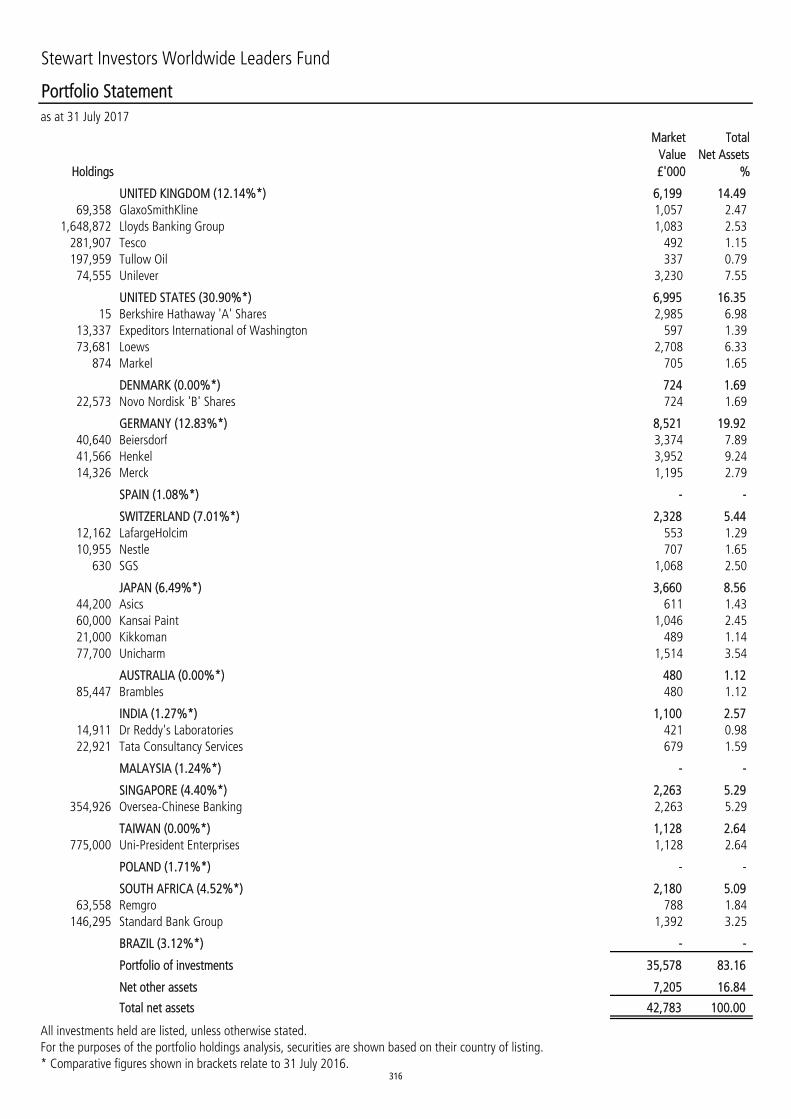
Holdings
MarketValue£'000
TotalNet Assets
%
UNITED KINGDOM (12.14%*) 6,199 14.4969,358 GlaxoSmithKline 1,057 2.47
1,648,872 Lloyds Banking Group 1,083 2.53281,907 Tesco 492 1.15197,959 Tullow Oil 337 0.79
74,555 Unilever 3,230 7.55
UNITED STATES (30.90%*) 6,995 16.3515 Berkshire Hathaway 'A' Shares 2,985 6.98
13,337 Expeditors International of Washington 597 1.3973,681 Loews 2,708 6.33
874 Markel 705 1.65
DENMARK (0.00%*) 724 1.6922,573 Novo Nordisk 'B' Shares 724 1.69
GERMANY (12.83%*) 8,521 19.9240,640 Beiersdorf 3,374 7.8941,566 Henkel 3,952 9.2414,326 Merck 1,195 2.79
SPAIN (1.08%*) - -
SWITZERLAND (7.01%*) 2,328 5.4412,162 LafargeHolcim 553 1.2910,955 Nestle 707 1.65
630 SGS 1,068 2.50
JAPAN (6.49%*) 3,660 8.5644,200 Asics 611 1.4360,000 Kansai Paint 1,046 2.4521,000 Kikkoman 489 1.1477,700 Unicharm 1,514 3.54
AUSTRALIA (0.00%*) 480 1.1285,447 Brambles 480 1.12
INDIA (1.27%*) 1,100 2.5714,911 Dr Reddy's Laboratories 421 0.9822,921 Tata Consultancy Services 679 1.59
MALAYSIA (1.24%*) - -
SINGAPORE (4.40%*) 2,263 5.29354,926 Oversea-Chinese Banking 2,263 5.29
TAIWAN (0.00%*) 1,128 2.64775,000 Uni-President Enterprises 1,128 2.64
POLAND (1.71%*) - -
SOUTH AFRICA (4.52%*) 2,180 5.0963,558 Remgro 788 1.84
146,295 Standard Bank Group 1,392 3.25
BRAZIL (3.12%*) - -
Portfolio of investments 35,578 83.16
Net other assets 7,205 16.84
Total net assets 42,783 100.00
Stewart Investors Worldwide Leaders Fund
Portfolio Statementas at 31 July 2017
All investments held are listed, unless otherwise stated.
* Comparative figures shown in brackets relate to 31 July 2016.For the purposes of the portfolio holdings analysis, securities are shown based on their country of listing.
316
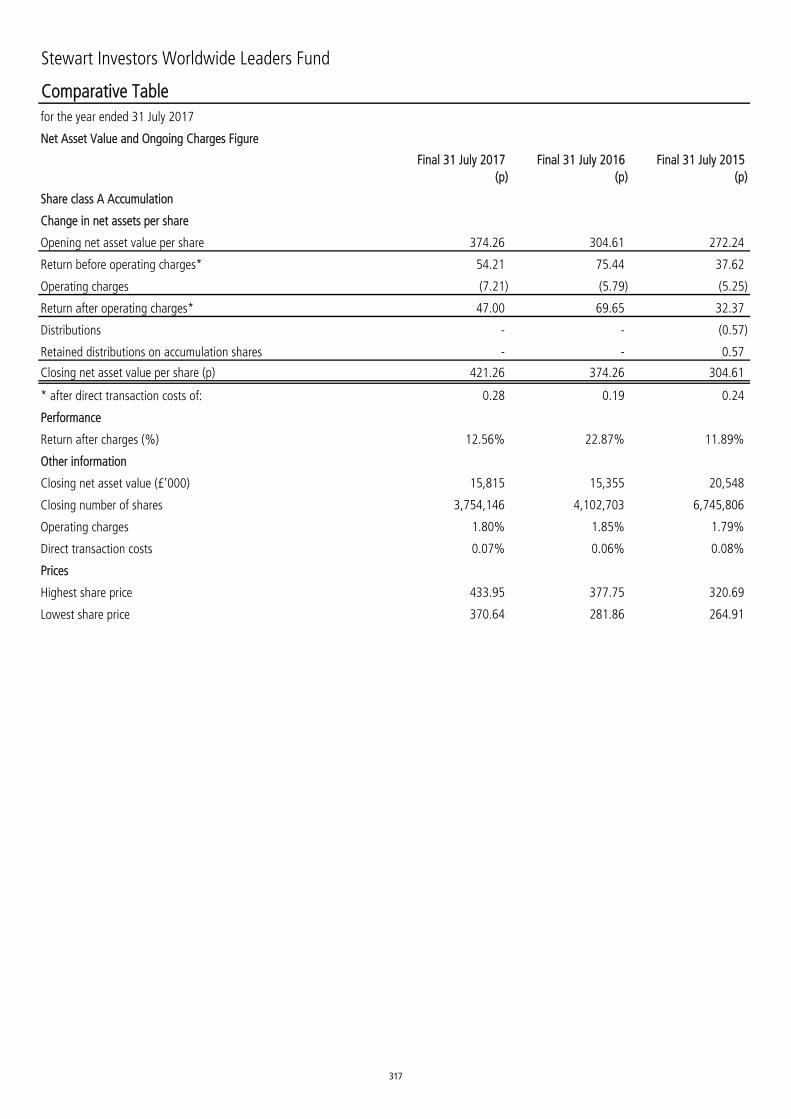
Share class A Accumulation
Change in net assets per share
Opening net asset value per share
Return before operating charges*
Operating charges
Return after operating charges*
Distributions
Retained distributions on accumulation shares
Closing net asset value per share (p)
* after direct transaction costs of:
Performance
Return after charges (%)
Other information
Closing net asset value (£’000)
Closing number of shares
Operating charges
Direct transaction costs
Prices
Highest share price
Lowest share price 370.64 281.86 264.91
0.07% 0.06% 0.08%
433.95 377.75 320.69
1.80% 1.85% 1.79%
15,815 15,355 20,548
3,754,146 4,102,703 6,745,806
12.56% 22.87% 11.89%
421.26 374.26 304.61
0.28 0.19 0.24
- - 0.57
47.00 69.65 32.37
- - (0.57)
54.21 75.44 37.62
(7.21) (5.79) (5.25)
374.26 304.61 272.24
Stewart Investors Worldwide Leaders Fund
Comparative Tablefor the year ended 31 July 2017
Net Asset Value and Ongoing Charges Figure
Final 31 July 2017(p)
Final 31 July 2016(p)
Final 31 July 2015(p)
317

Stewart Investors Worldwide Leaders Fund
Comparative Table (continued)
for the year ended 31 July 2017
Net Asset Value and Ongoing Charges Figure
Share class B Accumulation
Change in net assets per share
Opening net asset value per share
Return before operating charges*
Operating charges
Return after operating charges*
Distributions
Retained distributions on accumulation shares
Closing net asset value per share (p)
* after direct transaction costs of:
Performance
Return after charges (%)
Other information
Closing net asset value (£’000)
Closing number of shares
Operating charges
Direct transaction costs
Prices
Highest share price
Lowest share price 416.60 314.80 293.75
0.07% 0.06% 0.08%
491.04 424.39 356.91
1.04% 1.09% 1.03%
26,964 23,676 15,325
5,651,706 5,628,758 4,509,829
13.43% 23.78% 12.74%
477.09 420.62 339.80
0.31 0.21 0.27
1.69 1.88 3.15
56.47 80.82 38.40
(1.69) (1.88) (3.15)
61.17 84.71 41.76
(4.70) (3.89) (3.36)
420.62 339.80 301.40
Final 31 July 2017(p)
Final 31 July 2016(p)
Final 31 July 2015(p)
318

Stewart Investors Worldwide Leaders Fund
Comparative Table (continued)
for the year ended 31 July 2017
Net Asset Value and Ongoing Charges Figure
Share class A Accumulation (EUR share class)
Change in net assets per share
Opening net asset value per share
Return before operating charges*
Operating charges
Return after operating charges*
Distributions
Retained distributions on accumulation shares
Closing net asset value per share (c)
* after direct transaction costs of:
Performance
Return after charges (%)
Other information
Closing net asset value (€’000)
Closing number of shares
Operating charges
Direct transaction costs
Prices
Highest share price
Lowest share price 139.06 115.32 113.14
0.07% 0.06% 0.08%
158.90 150.74 151.13
1.67% 1.60% 1.55%
5 1 3
3,008 883 2,000
6.57% (3.22)% 26.16%
152.04 142.67 147.42
0.10 0.08 0.11
0.17 - 0.61
9.37 (4.75) 30.57
(0.17) - (0.61)
11.86 (2.57) 32.63
(2.49) (2.18) (2.06)
142.67 147.42 116.85
Final 31 July 2017(c)
Final 31 July 2016(c)
Final 31 July 2015(c)
319
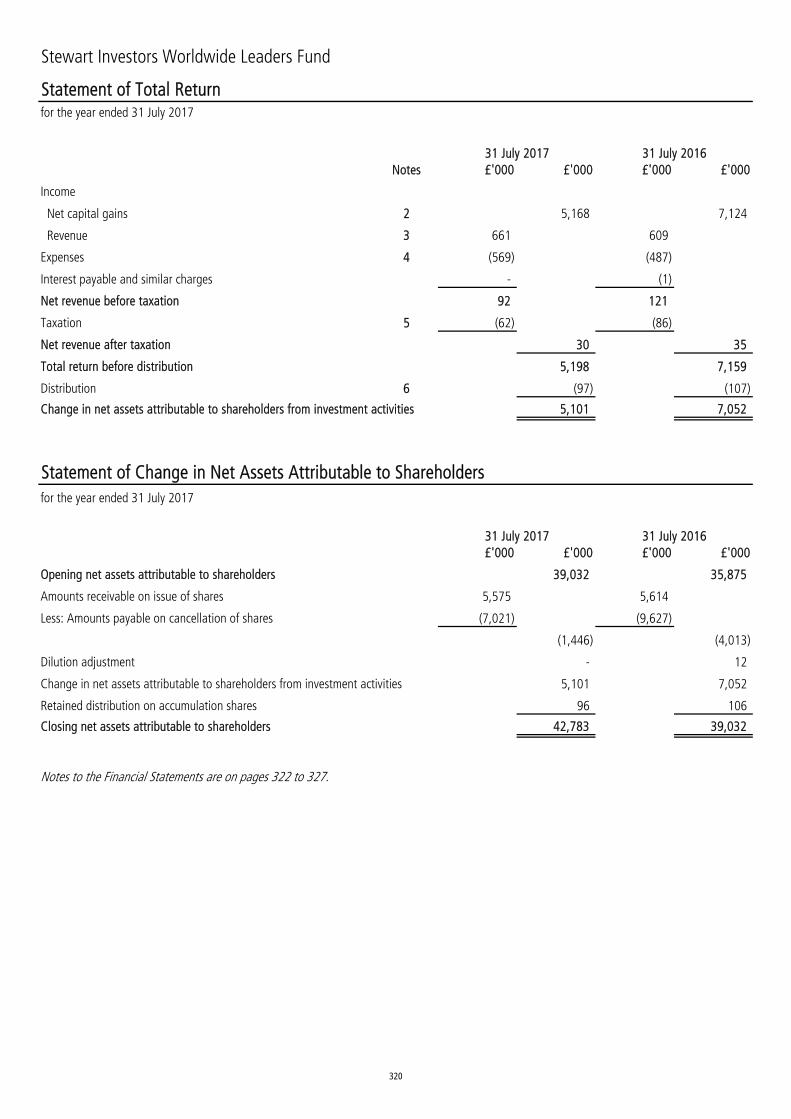
Notes £'000 £'000 £'000 £'000
Net capital gains 2 5,168 7,124
Revenue 3 661 609
4 (569) (487)
Interest payable and similar charges - (1)
92 121
5 (62) (86)
30 35
5,198 7,159
6 (97) (107)
5,101 7,052
£'000 £'000 £'000 £'000
39,032 35,875
5,575 5,614
(7,021) (9,627)
(1,446) (4,013)
- 12
5,101 7,052
96 106
42,783 39,032
Less: Amounts payable on cancellation of shares
Dilution adjustment
Change in net assets attributable to shareholders from investment activities
Retained distribution on accumulation shares
Closing net assets attributable to shareholders
Notes to the Financial Statements are on pages 322 to 327.
Amounts receivable on issue of shares
for the year ended 31 July 2017
31 July 2017 31 July 2016
Opening net assets attributable to shareholders
Statement of Change in Net Assets Attributable to Shareholders
Income
Expenses
Net revenue before taxation
Taxation
Net revenue after taxation
Total return before distribution
Distribution
Change in net assets attributable to shareholders from investment activities
31 July 2017 31 July 2016
Stewart Investors Worldwide Leaders Fund
Statement of Total Returnfor the year ended 31 July 2017
320
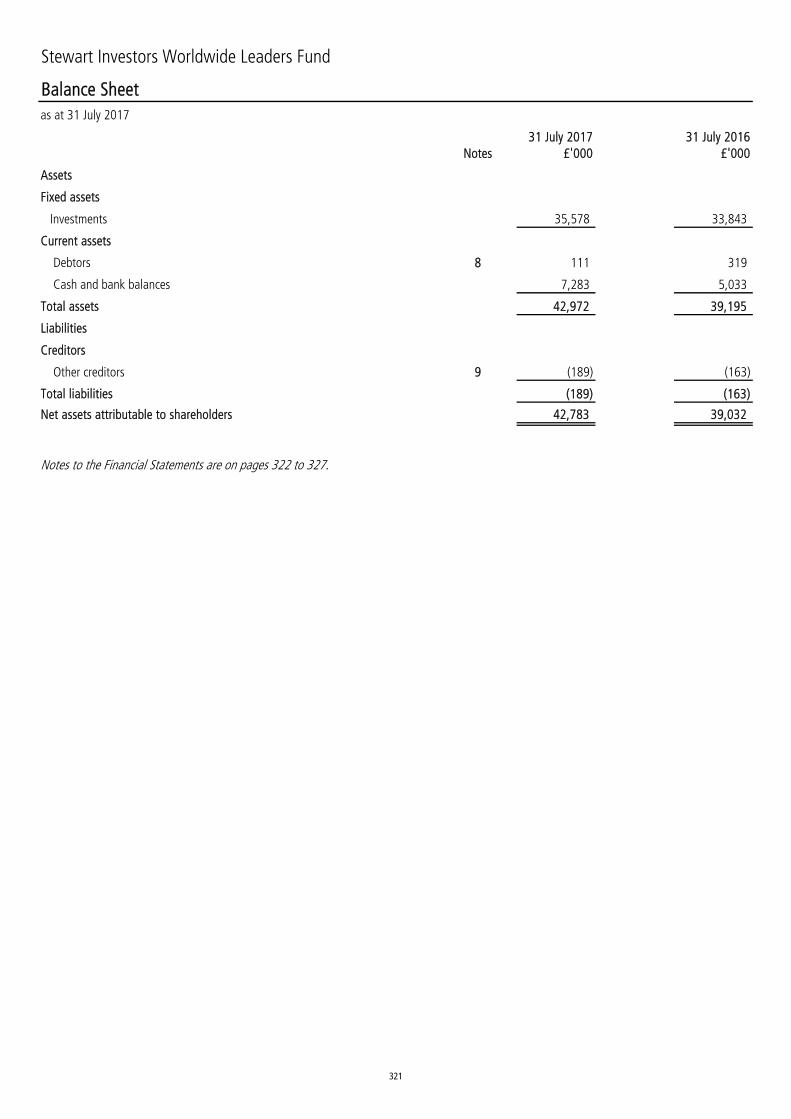
Stewart Investors Worldwide Leaders Fund
31 July 2017 31 July 2016Notes £'000 £'000
Investments 35,578 33,843
Current assets
8 111 319
7,283 5,033
42,972 39,195
Creditors
Other creditors 9 (189) (163)
(189) (163)
42,783 39,032
Notes to the Financial Statements are on pages 322 to 327.
Total liabilities
Net assets attributable to shareholders
Balance Sheetas at 31 July 2017
Assets
Fixed assets
Debtors
Cash and bank balances
Total assets
Liabilities
321

1.
2.
31 July 2017 31 July 2016£'000 £'0005,225 6,615
(57) 509
5,168 7,124
3.
31 July 2017 31 July 2016£'000 £'000
192 1204 -
461 381- 612 11 51 41
661 609
4.
31 July 2017 31 July 2016£'000 £'000
447 372
6 6
9 751 45
4 452 53
116 109
569 487Total expenses
Audit feeRegistrar feesSafe custody chargesOther expenses
Other expenses:
Payable to the Depositary, associates of the Depositary, and agents of either of them:Depositary's fees
Expenses
Payable to the ACD, associates of the ACD, and agents of either of them:ACD's periodic charge
Total revenue
Interest on capital revenue from Brazilian companies
Interest from bank depositsInterest from government and fixed-interest securities
Overseas scrip dividends
Dividends from UK companiesOverseas taxable revenueOverseas non-taxable revenue
Net capital gains
Revenue
Currency (losses)/gains
Accounting basis and policies
Please see pages 9 to 11 for accounting basis and policies.
Net capital gains
The net capital gains during the year comprise:
Non-derivative securities
Notes to the Financial Statementsas at 31 July 2017
Stewart Investors Worldwide Leaders Fund
322

Notes to the Financial Statements (continued)
as at 31 July 2017
Stewart Investors Worldwide Leaders Fund
5.
31 July 2017 31 July 2016£'000 £'000
(a)62 60
- 26
62 86
(b)
92 121
18 24
(38) (24)- (12)
(92) (76)112 89
62 60- (1)- 26
62 86
(c)
(d)
6.
31 July 2017 31 July 2016£'000 £'000
96 106
96 1065 8
(4) (7)
97 107
Details of the distribution per share are set out in the Distribution Tables on pages 328 to 329.
Add: revenue deducted on cancellation of sharesDeduct: revenue received on issue of shares
Net distribution for the year
Final distribution
DistributionThe distribution takes account of revenue received on the issue of shares and revenue deducted on the cancellation of shares and comprise:
Factors that may affect future tax charges:At the year end, after offset against revenue taxable on receipt, there is a potential deferred tax asset of £769,269 (31/07/16: £656,807); thisrelates to surplus management expenses. No deferred tax asset was recognised in the current and prior year as it was considered unlikely theFund would generate sufficient taxable profits in the future to utilise these amounts.
Deferred taxation:
There is no provision required for deferred taxation at the balance sheet date in the current or prior year.
Total tax charge for year (note 5a)
OEICs are exempt from tax on capital gains. Therefore, any capital return is not included in the above reconciliation.
* As an authorised OEIC, these items are not subject to corporation tax.
Indian capital gains taxOverseas tax expensed
Movement in excess management expensesIrrecoverable overseas tax
UK dividends*Non-taxable scrip dividends*Overseas non-taxable revenue*
Net revenue before taxation
Corporation tax of 20% (2016: 20%)
Effects of:
Total taxation (note 5b)
Factors affecting current tax charge for the year:
The tax assessed for the year is higher than (2016: higher than) the standard rate of corporation tax in the UK for an open-ended investmentcompany of 20% (2016: 20%). The differences are explained below:
Indian capital gains taxIrrecoverable overseas taxAnalysis of charge in year:
Taxation
323
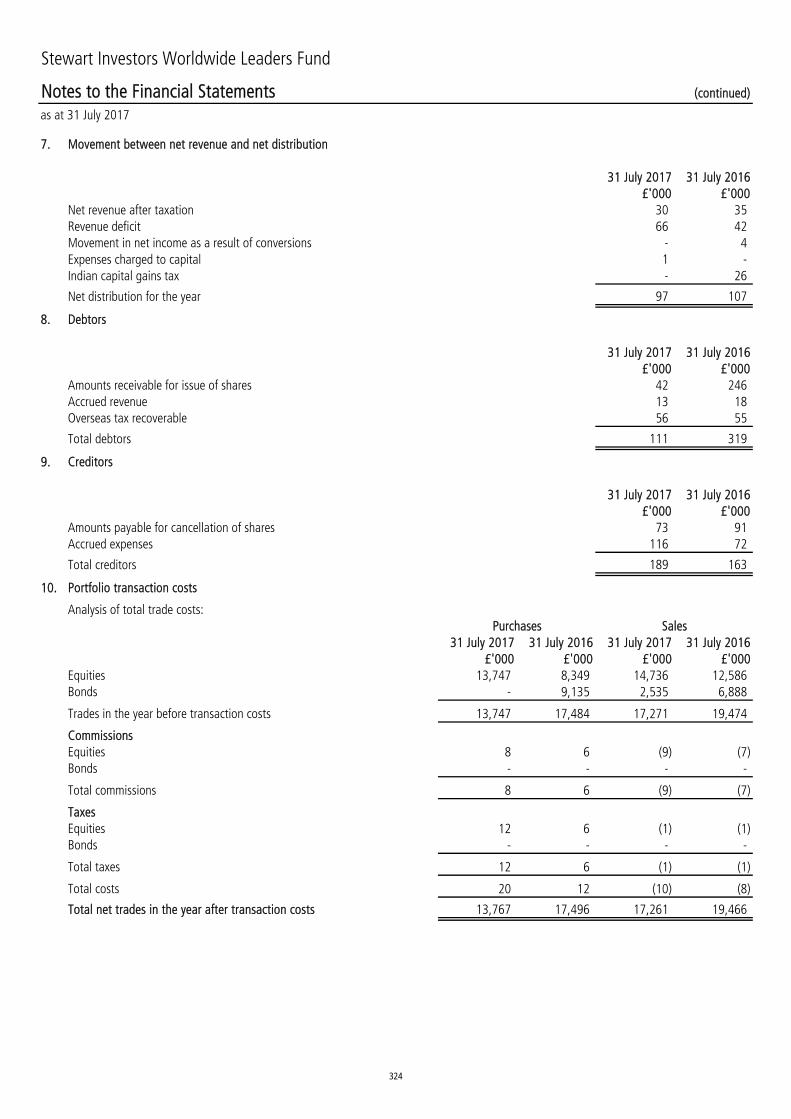
Notes to the Financial Statements (continued)
as at 31 July 2017
Stewart Investors Worldwide Leaders Fund
7.
31 July 2017 31 July 2016£'000 £'000
30 3566 42
- 4Expenses charged to capital 1 -Indian capital gains tax - 26
97 107
8.
31 July 2017 31 July 2016£'000 £'000
42 24613 1856 55
111 319
9.
31 July 2017 31 July 2016£'000 £'000
73 91116 72
189 163
10.
31 July 2017 31 July 2016 31 July 2017 31 July 2016£'000 £'000 £'000 £'000
13,747 8,349 14,736 12,586- 9,135 2,535 6,888
13,747 17,484 17,271 19,474
8 6 (9) (7)- - - -
8 6 (9) (7)
12 6 (1) (1)- - - -
12 6 (1) (1)
20 12 (10) (8)
13,767 17,496 17,261 19,466
Total taxes
Total costs
Total net trades in the year after transaction costs
Total commissions
TaxesEquitiesBonds
Trades in the year before transaction costs
CommissionsEquitiesBonds
Analysis of total trade costs:Purchases Sales
EquitiesBonds
Total creditors
Portfolio transaction costs
Amounts payable for cancellation of sharesAccrued expenses
Creditors
Total debtors
Overseas tax recoverable
Amounts receivable for issue of sharesAccrued revenue
Debtors
Movement in net income as a result of conversions
Net distribution for the year
Movement between net revenue and net distribution
Net revenue after taxationRevenue deficit
324
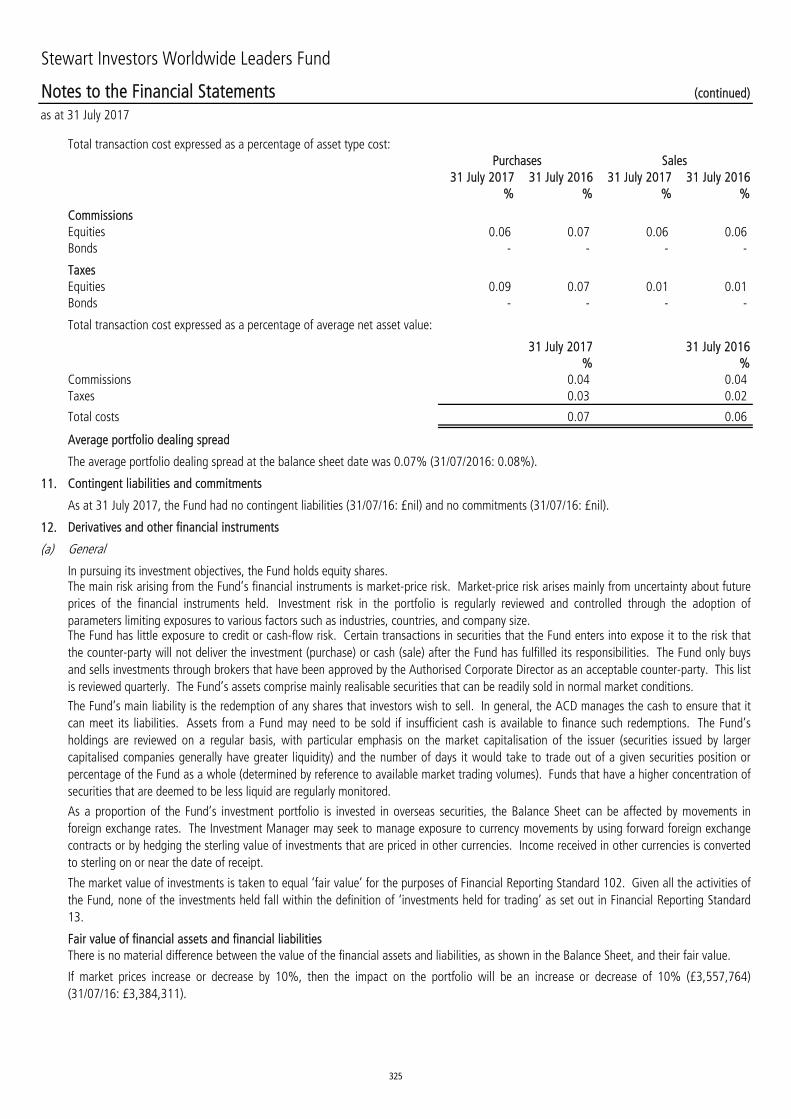
Notes to the Financial Statements (continued)
as at 31 July 2017
Stewart Investors Worldwide Leaders Fund
31 July 2017 31 July 2016 31 July 2017 31 July 2016% % % %
0.06 0.07 0.06 0.06- - - -
0.09 0.07 0.01 0.01- - - -
11.
12.
(a)
There is no material difference between the value of the financial assets and liabilities, as shown in the Balance Sheet, and their fair value.
If market prices increase or decrease by 10%, then the impact on the portfolio will be an increase or decrease of 10% (£3,557,764)(31/07/16: £3,384,311).
The Fund’s main liability is the redemption of any shares that investors wish to sell. In general, the ACD manages the cash to ensure that itcan meet its liabilities. Assets from a Fund may need to be sold if insufficient cash is available to finance such redemptions. The Fund’sholdings are reviewed on a regular basis, with particular emphasis on the market capitalisation of the issuer (securities issued by largercapitalised companies generally have greater liquidity) and the number of days it would take to trade out of a given securities position orpercentage of the Fund as a whole (determined by reference to available market trading volumes). Funds that have a higher concentration ofsecurities that are deemed to be less liquid are regularly monitored.
As a proportion of the Fund’s investment portfolio is invested in overseas securities, the Balance Sheet can be affected by movements inforeign exchange rates. The Investment Manager may seek to manage exposure to currency movements by using forward foreign exchangecontracts or by hedging the sterling value of investments that are priced in other currencies. Income received in other currencies is convertedto sterling on or near the date of receipt.
The market value of investments is taken to equal ‘fair value’ for the purposes of Financial Reporting Standard 102. Given all the activities ofthe Fund, none of the investments held fall within the definition of ‘investments held for trading’ as set out in Financial Reporting Standard13.
Fair value of financial assets and financial liabilities
Derivatives and other financial instruments
General
In pursuing its investment objectives, the Fund holds equity shares.The main risk arising from the Fund’s financial instruments is market-price risk. Market-price risk arises mainly from uncertainty about futureprices of the financial instruments held. Investment risk in the portfolio is regularly reviewed and controlled through the adoption ofparameters limiting exposures to various factors such as industries, countries, and company size.The Fund has little exposure to credit or cash-flow risk. Certain transactions in securities that the Fund enters into expose it to the risk thatthe counter-party will not deliver the investment (purchase) or cash (sale) after the Fund has fulfilled its responsibilities. The Fund only buysand sells investments through brokers that have been approved by the Authorised Corporate Director as an acceptable counter-party. This listis reviewed quarterly. The Fund’s assets comprise mainly realisable securities that can be readily sold in normal market conditions.
Contingent liabilities and commitments
As at 31 July 2017, the Fund had no contingent liabilities (31/07/16: £nil) and no commitments (31/07/16: £nil).
The average portfolio dealing spread at the balance sheet date was 0.07% (31/07/2016: 0.08%).
Total costs 0.07 0.06
Average portfolio dealing spread
Commissions 0.04 0.04Taxes 0.03 0.02
Total transaction cost expressed as a percentage of average net asset value:
31 July 2017 31 July 2016% %
EquitiesBonds
Taxes
CommissionsEquitiesBonds
Total transaction cost expressed as a percentage of asset type cost:Purchases Sales
325
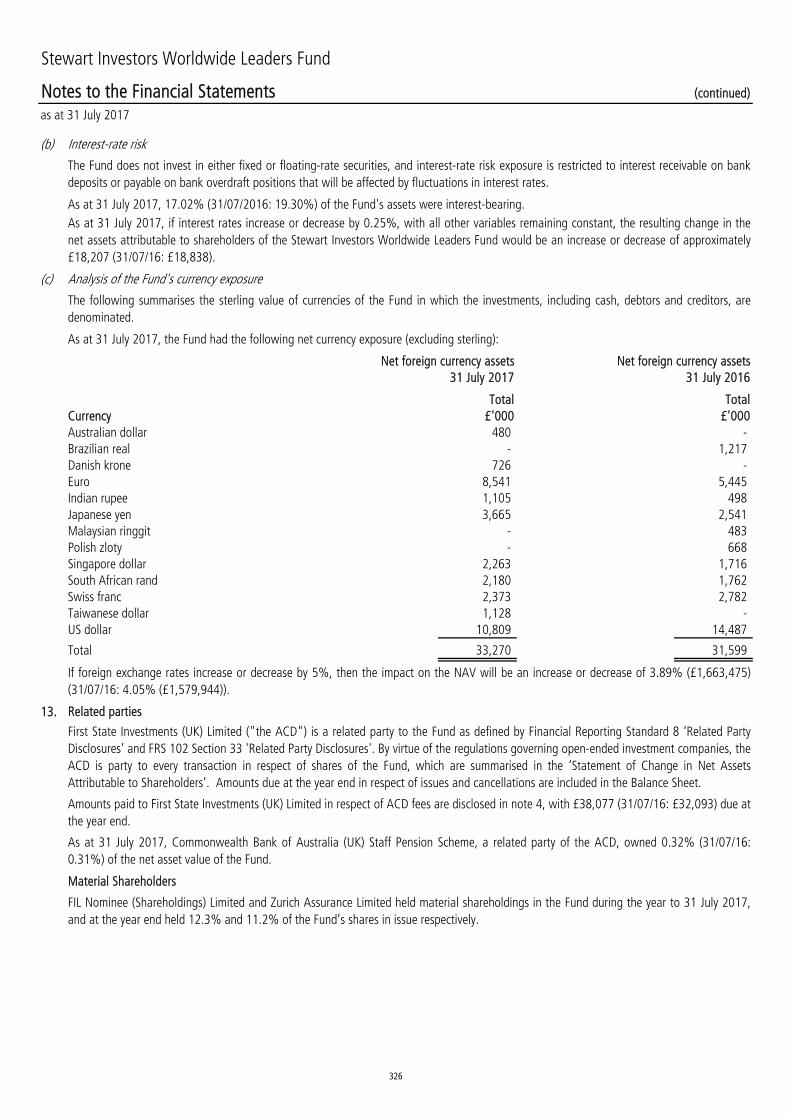
Notes to the Financial Statements (continued)
as at 31 July 2017
Stewart Investors Worldwide Leaders Fund
(b)
(c)
Total TotalCurrency £'000 £'000Australian dollar 480 -Brazilian real - 1,217Danish krone 726 -Euro 8,541 5,445Indian rupee 1,105 498Japanese yen 3,665 2,541Malaysian ringgit - 483Polish zloty - 668Singapore dollar 2,263 1,716South African rand 2,180 1,762Swiss franc 2,373 2,782Taiwanese dollar 1,128 -US dollar 10,809 14,487
Total 33,270 31,599
13.
Material Shareholders
FIL Nominee (Shareholdings) Limited and Zurich Assurance Limited held material shareholdings in the Fund during the year to 31 July 2017,and at the year end held 12.3% and 11.2% of the Fund’s shares in issue respectively.
Amounts paid to First State Investments (UK) Limited in respect of ACD fees are disclosed in note 4, with £38,077 (31/07/16: £32,093) due at the year end.
As at 31 July 2017, Commonwealth Bank of Australia (UK) Staff Pension Scheme, a related party of the ACD, owned 0.32% (31/07/16:0.31%) of the net asset value of the Fund.
Related parties
First State Investments (UK) Limited ("the ACD") is a related party to the Fund as defined by Financial Reporting Standard 8 ‘Related PartyDisclosures’ and FRS 102 Section 33 'Related Party Disclosures'. By virtue of the regulations governing open-ended investment companies, theACD is party to every transaction in respect of shares of the Fund, which are summarised in the ‘Statement of Change in Net AssetsAttributable to Shareholders’. Amounts due at the year end in respect of issues and cancellations are included in the Balance Sheet.
If foreign exchange rates increase or decrease by 5%, then the impact on the NAV will be an increase or decrease of 3.89% (£1,663,475)(31/07/16: 4.05% (£1,579,944)).
The following summarises the sterling value of currencies of the Fund in which the investments, including cash, debtors and creditors, aredenominated.
As at 31 July 2017, the Fund had the following net currency exposure (excluding sterling):
Net foreign currency assets Net foreign currency assets31 July 2017 31 July 2016
As at 31 July 2017, 17.02% (31/07/2016: 19.30%) of the Fund's assets were interest-bearing.As at 31 July 2017, if interest rates increase or decrease by 0.25%, with all other variables remaining constant, the resulting change in thenet assets attributable to shareholders of the Stewart Investors Worldwide Leaders Fund would be an increase or decrease of approximately£18,207 (31/07/16: £18,838).
Analysis of the Fund's currency exposure
Interest-rate risk
The Fund does not invest in either fixed or floating-rate securities, and interest-rate risk exposure is restricted to interest receivable on bankdeposits or payable on bank overdraft positions that will be affected by fluctuations in interest rates.
326
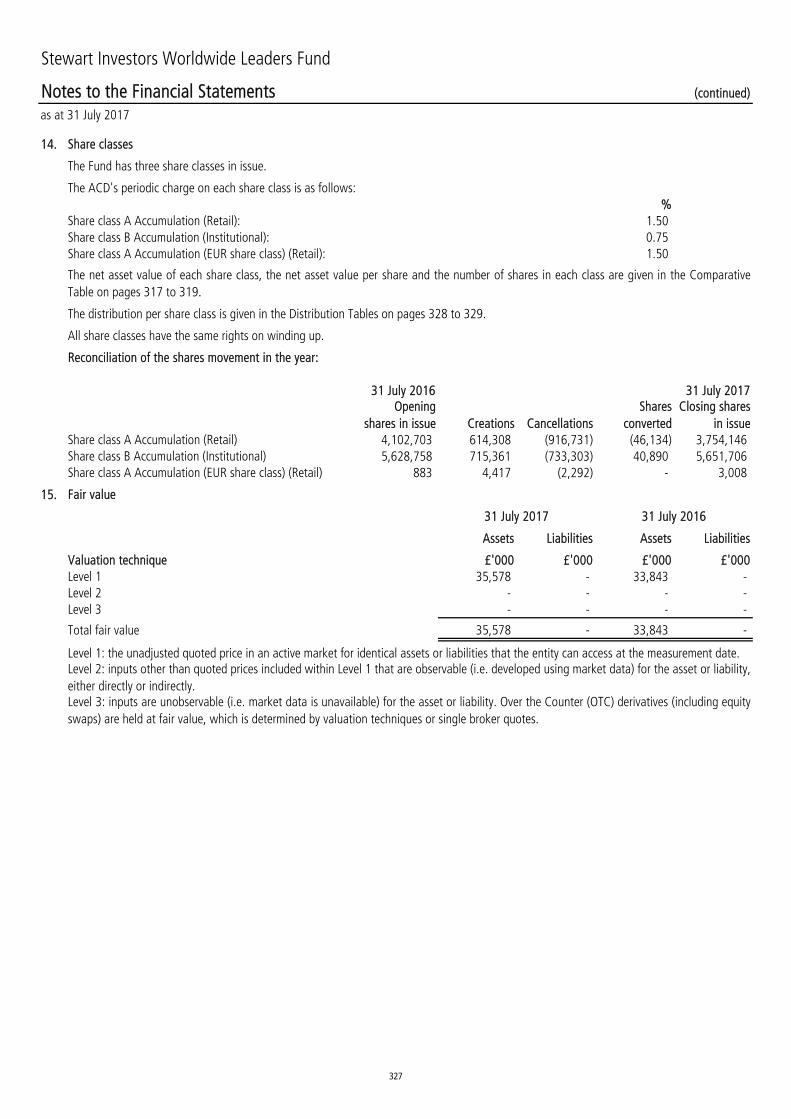
Notes to the Financial Statements (continued)
as at 31 July 2017
Stewart Investors Worldwide Leaders Fund
14.
%1.50
Share class B Accumulation (Institutional): 0.75Share class A Accumulation (EUR share class) (Retail): 1.50
31 July 2016 31 July 2017Opening
shares in issue Creations CancellationsShares
convertedClosing shares
in issue4,102,703 614,308 (916,731) (46,134) 3,754,1465,628,758 715,361 (733,303) 40,890 5,651,706
883 4,417 (2,292) - 3,008
15.
Assets Liabilities Assets Liabilities
£'000 £'000 £'000 £'00035,578 - 33,843 -
- - - -- - - -
35,578 - 33,843 -
Level 3: inputs are unobservable (i.e. market data is unavailable) for the asset or liability. Over the Counter (OTC) derivatives (including equityswaps) are held at fair value, which is determined by valuation techniques or single broker quotes.
Level 1Level 2Level 3
Total fair value
Level 1: the unadjusted quoted price in an active market for identical assets or liabilities that the entity can access at the measurement date. Level 2: inputs other than quoted prices included within Level 1 that are observable (i.e. developed using market data) for the asset or liability,either directly or indirectly.
Fair value
Valuation technique
31 July 2017 31 July 2016
All share classes have the same rights on winding up.
Reconciliation of the shares movement in the year:
Share class A Accumulation (Retail)Share class B Accumulation (Institutional)Share class A Accumulation (EUR share class) (Retail)
The net asset value of each share class, the net asset value per share and the number of shares in each class are given in the ComparativeTable on pages 317 to 319.
The distribution per share class is given in the Distribution Tables on pages 328 to 329.
The ACD's periodic charge on each share class is as follows:
Share class A Accumulation (Retail):
Share classes
The Fund has three share classes in issue.
327
Share class A Accumulation
Netrevenue Equalisation
Distributions paid to/payable
30/09/2017
Distributions paid
30/09/2016Group 1 (p) (p) (p) (p)Interim - - - -Final - - - -Group 2 (p) (p) (p) (p)Interim - - - -Final - - - -
Share class B Accumulation
Netrevenue Equalisation
Distributions paid to/payable
30/09/2017
Distributions paid
30/09/2016Group 1 (p) (p) (p) (p)Interim - - - -Final 1.6886 - 1.6886 1.8769Group 2 (p) (p) (p) (p)Interim - - - -Final 0.7334 0.9552 1.6886 1.8769
Share class A Accumulation (EUR share class)
Netrevenue Equalisation
Distributions paid to/payable
30/09/2017
Distributions paid
30/09/2016Group 1 (c) (c) (c) (c)Interim - - - -Final 0.1682 - 0.1682 -Group 2 (c) (c) (c) (c)Interim - - - -Final - 0.1682 0.1682 -
This share class is in deficit and therefore not making a distribution.
Final - Shares purchased between 1 February 2017 and 31 July 2017Group 2 Interim - Shares purchased between 1 August 2016 and 31 January 2017
Final - Shares purchased prior to 1 February 2017
Distribution in pence and cents per share
Stewart Investors Worldwide Leaders Fund
Distribution Tablesfor the year ended 31 July 2017
Group 1 Interim - Shares purchased prior to 1 August 2016
328

Stewart Investors Worldwide Leaders Fund
Distribution Tables (continued)
for the year ended 31 July 2017
Shareholders should consult their professional advisers for any advice regarding their tax position.
Final - 100.00% of the dividend is received as franked investment income.
Final - 0.00% of the dividend is received as an annual payment (non-foreign element) received after the deduction of income tax at the lower rateand is liable to corporation tax. The tax deemed to be deducted is treated as income tax.
Final - 0.00% of the dividend is received as an annual payment (foreign element) received after the deduction of income tax at the lower rate and isliable to corporation tax. It is treated as foreign income in the hands of the corporate investor and is liable to corporation tax. The associateddeemed tax is treated as foreign tax in the hands of the investor, who may be able to claim double tax relief. Investors cannot reclaim any of thisdeemed tax on the foreign element from HM Revenue & Customs.
Interim - 100.00% of the dividend is received as franked investment income.
Interim - 0.00% of the dividend is received as an annual payment (non-foreign element) received after the deduction of income tax at the lowerrate and is liable to corporation tax. The tax deemed to be deducted is treated as income tax.
Interim - 0.00% of the dividend is received as an annual payment (foreign element) received after the deduction of income tax at the lower rate andis liable to corporation tax. It is treated as foreign income in the hands of the corporate investor and is liable to corporation tax. The associateddeemed tax is treated as foreign tax in the hands of the investor, who may be able to claim double tax relief. Investors cannot reclaim any of thisdeemed tax on the foreign element from HM Revenue & Customs.
Corporate tax for all share classes (unaudited)
A shareholder liable to corporation tax receives this distribution, excluding equalisation, as follows:
329
•
I
II
III
Risks and reward profile
Lower Risk Higher Risk
Potentially Lower Rewards Potentially Higher Rewards
1 2 3 4 5 6 7
1 2 3 4 5 6 7
1 2 3 4 5 6 7
1 2 3 4 5 6 7
1 2 3 4 5 6 7
1 2 3 4 5 6 7
1 2 3 4 5 6 7
1 2 3 4 5 6 7
For further information on risks, please refer to the Risk Factors section in the Company's prospectus.
Emerging market risk: emerging markets may not provide the same level of investor protection as a developed market; they may involve a higherrisk than investing in developed markets.
Currency risk: the Fund invests in assets that are denominated in other currencies; changes in exchange rates will affect the value of the Fund.
• Even the lowest rating 1 does not mean a risk-free investment;
• On a scale of 1 (less risky) to 7 (more risky), this Fund has a rating of 5 due to its past performance and the nature of its investments. Shares witha rating of 5 might have higher risks, but also higher returns;
• Risk is taken in order to make a higher potential return; the more risk a Fund takes, the higher the potential return but the greater the risk of loss;and
• The value of the Fund and its return is not guaranteed and may fall as well as rise. You may get back less than you originally invested.
The Fund might also experience the following risks:
• The synthetic risk reward indicator (the SRRI) rating is not a measure of the risk of you losing your investment but describes how much the valueof the Fund went up and down in the past;
• The SRRI rating is based on historical data, which may not be a reliable indication of the future risks and rewards of the Fund;
• We cannot guarantee that the rating of the Fund will remain the same; it may change over time;
Share class A Accumulation (EUR share class)
Share class B Accumulation (EUR share class)
Share class A Accumulation (USD share class)
Share class B Accumulation (USD share class)
Share class A Accumulation
Share class A Income
Share class B Accumulation
Share class B Income
Company classification (identifying companies whose management are believed able to manage sustainability risks and opportunities facing theircompanies, seeking out sustainability companies with a positive sustainable development impact);
Integration of environmental, social and corporate governance factors into investment analysis;
Engagement with and exit from companies based on in-house ESG research (the Fund manager will engage senior management on any identifiedenvironmental, social and governance issues and exit a stock if insufficient progress is made).
The Fund aims to achieve long-term capital growth.
The Fund will seek to invest in a diverse portfolio of equity securities that are listed, traded or dealt in on any of the Regulated Marketsworldwide.
The Fund is not managed to a benchmark and may have exposure to developed or emerging markets whilst maintaining its geographical diversity.
Clarification point: The Fund’s emphasis on sustainability development incorporates three key features in making investment decisions. These are:
Stewart Investors Worldwide Sustainability Fund
Authorised Fund Manager's Reportfor the year ended 31 July 2017
Investment Objective and Policy
The Fund invests in companies that are positioned to benefit from, and contribute to, the sustainable development of the countries in which theyoperate.
330
(continued)
Stewart Investors Worldwide Sustainability Fund
Authorised Fund Manager's Reportfor the year ended 31 July 2017
Time 3 6 1 3 5 10 Sinceperiod mths mths yr yrs yrs yrs launch
3.8 10.7 14.9 64.3 - - 101.9 3.6 6.4 17.9 53.5 - - 94.1
12 mths to 12 mths to 12 mths to 12 mths to 12 mths to31/07/17 31/07/16 31/07/15 31/07/14 31/07/13
14.9 26.0 13.4 (0.9) -
31 July 2017 31 July 2016% of Fund % of Fund
8.29 7.587.60 6.434.55 6.343.97 3.913.57 3.103.28 2.922.99 2.782.52 2.532.42 2.452.34 2.33
Types of sharesIncome and Accumulation.
Ain Holdings Varian Medical SystemsHousing Development Finance Kansai PaintDistribuidora Internacional de Alimentacion Distribuidora Internacional de Alimentacion
Merck Natura CosmeticosNovo Nordisk 'B' UnicharmTata Consultancy Services CSL
Henkel WatersWaters UnileverANSYS Merck
Stock name Stock nameUnilever Henkel
Past performance should not be used as a guide to future performance, which is not guaranteed.
Ten largest holdings
TimeperiodFund return %
Benchmark: MSCI All Countries World Index.Sector: IA Global.
Benchmark return %
Discrete performance as at 31 July 2017
Cumulative performance as at 31 July 2017
Fund return %
Outlook
Valuations for high-quality companies remain full but acceptable. The Manager prefers to back strong management teams who focus onsustainable development rather than buy lower-quality companies on attractive valuations.
Portfolio changes
Major purchases during the year included Tata Consultancy Services (India: Information Technology), a strong IT franchise with good-qualitystewards that was reasonably valued, and Novozymes (Denmark: Materials), a global biotech company that is seeking to address global resourcechallenges by developing innovative biological solutions to help improve industrial manufacturing processes. The Fund also bought Hoya (Japan:Health Care), an optical technology manufacturer, currently managed by the third generation of the founding family, with a diverse and resilientculture.
The Fund sold Bankinter (Spain: Financials) due to concerns about the bank’s strategic direction, particularly in its wealth management business,and Lenzing (Austria: Materials) as the Manager believed it was fully valued. The Fund also sold Infosys Technologies (India: InformationTechnology) because of cultural drift at the company.
Performance
The Fund rose by 14.9% in sterling terms over the year and has provided cumulative returns of 64.3% over three years to 31 July 2017.
Unilever (UK: Consumer Staples) rose on the back of the attempted takeover by Kraft Heinz and management’s response of a new plan to improvemargins. Henkel (Germany: Consumer Staples) gained on strong revenue and profit margin growth, particularly in emerging markets and in itslaundry and home care divisions. ANSYS (US: Information Technology) climbed as it recorded consistent, strong revenue and profit growth,maintaining high recurring revenue and expanding its net cash position.
On the negative side, Novo Nordisk (Denmark: Health Care) was weak as it continued to come under pricing pressure in the US, which representsabout 50% of its market for insulin products, and Brambles (Australia: Industrials) declined on a profit warning caused by competitive pressures inthe US. Natura Cosmeticos (Brazil: Consumer Staples) fell having experienced challenges around the evolution of its business model, changes inmanagement and a subdued consumer environment.
331
Holdings
MarketValue£'000
TotalNet Assets
%
UNITED KINGDOM (7.60%*) 45,615 10.52241,021 GlaxoSmithKline 3,671 0.85882,263 Sage Group 5,986 1.38829,962 Unilever 35,958 8.29
UNITED STATES (21.00%*) 87,387 20.16176,056 ANSYS 17,226 3.97
73,203 Bio-Techne 6,498 1.5093,462 Colgate-Palmolive 5,167 1.1922,860 Edwards Lifesciences 2,012 0.46
156,444 Expeditors International of Washington 7,007 1.6286,023 Jack Henry & Associates 7,017 1.62
6,909 Markel 5,572 1.2856,929 Navigators Group 2,451 0.57
129,410 Varex Imaging 3,058 0.71121,634 Varian Medical Systems 9,036 2.08148,598 Waters 19,714 4.55
60,606 Xylem 2,629 0.61
AUSTRIA (1.76%*) - -
DENMARK (1.51%*) 20,910 4.82443,098 Novo Nordisk 'B' Shares 14,211 3.28191,226 Novozymes 6,699 1.54
FINLAND (0.35%*) 1,614 0.3731,917 Wartsila 1,614 0.37
GERMANY (14.32%*) 61,460 14.17100,371 Beiersdorf 8,334 1.92
73,759 Draegerwerk 4,666 1.08346,710 Henkel 32,963 7.60185,813 Merck 15,497 3.57
ITALY (1.77%*) 9,450 2.18142,179 DiaSorin 9,450 2.18
NORWAY (0.46%*) 2,079 0.48195,567 Tomra Systems 2,079 0.48
PORTUGAL (0.99%*) 4,011 0.93269,807 Jeronimo Martins 4,011 0.93
SPAIN (3.55%*) 10,154 2.341,937,889 Distribuidora Internacional de Alimentacion 10,154 2.34
SWEDEN (0.62%*) 1,556 0.36137,299 Svenska Handelsbanken 'A' Shares 1,556 0.36
SWITZERLAND (5.32%*) 19,055 4.40196,937 ABB 3,517 0.81
9,997 Bucher Industries 2,543 0.59152,738 Energiedienst Holding 3,165 0.73
42,925 Kuehne + Nagel International 5,695 1.312,439 SGS 4,135 0.96
Stewart Investors Worldwide Sustainability Fund
Portfolio Statementas at 31 July 2017
332
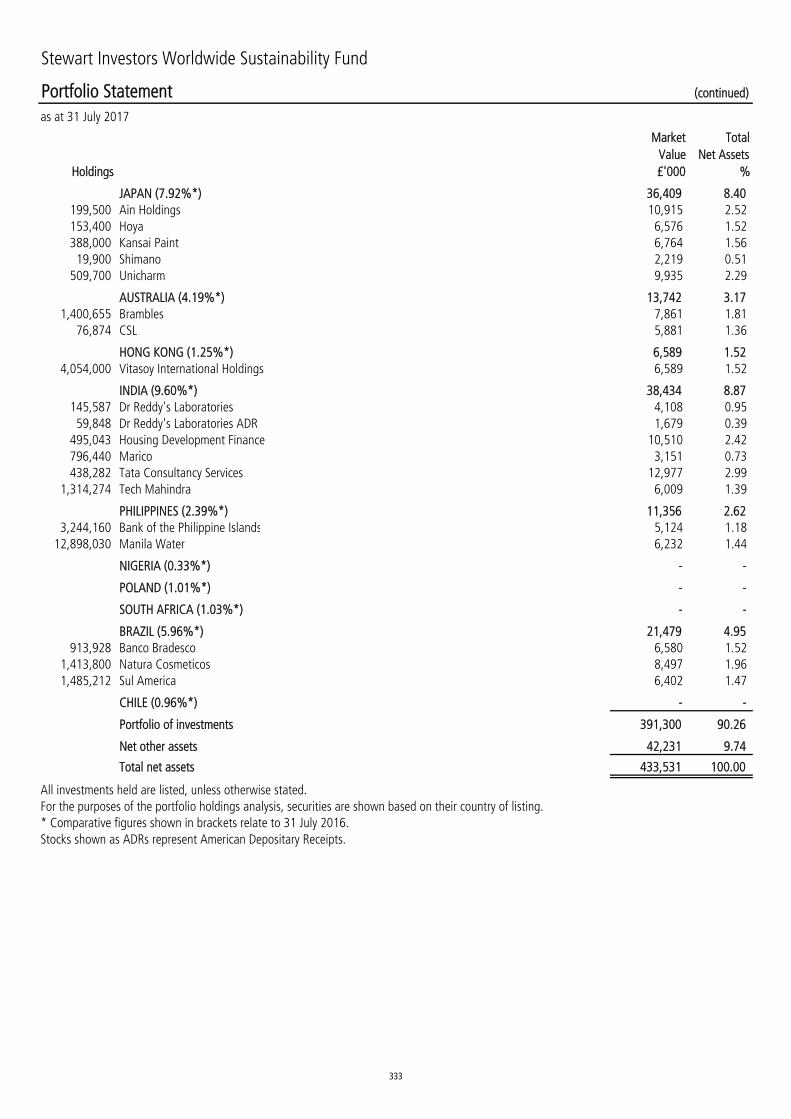
Holdings
MarketValue£'000
TotalNet Assets
%
Stewart Investors Worldwide Sustainability Fund
Portfolio Statement (continued)
as at 31 July 2017
JAPAN (7.92%*) 36,409 8.40199,500 Ain Holdings 10,915 2.52153,400 Hoya 6,576 1.52388,000 Kansai Paint 6,764 1.56
19,900 Shimano 2,219 0.51509,700 Unicharm 9,935 2.29
AUSTRALIA (4.19%*) 13,742 3.171,400,655 Brambles 7,861 1.81
76,874 CSL 5,881 1.36
HONG KONG (1.25%*) 6,589 1.524,054,000 Vitasoy International Holdings 6,589 1.52
INDIA (9.60%*) 38,434 8.87145,587 Dr Reddy's Laboratories 4,108 0.95
59,848 Dr Reddy's Laboratories ADR 1,679 0.39495,043 Housing Development Finance 10,510 2.42796,440 Marico 3,151 0.73438,282 Tata Consultancy Services 12,977 2.99
1,314,274 Tech Mahindra 6,009 1.39
PHILIPPINES (2.39%*) 11,356 2.623,244,160 Bank of the Philippine Islands 5,124 1.18
12,898,030 Manila Water 6,232 1.44
NIGERIA (0.33%*) - -
POLAND (1.01%*) - -
SOUTH AFRICA (1.03%*) - -
BRAZIL (5.96%*) 21,479 4.95913,928 Banco Bradesco 6,580 1.52
1,413,800 Natura Cosmeticos 8,497 1.961,485,212 Sul America 6,402 1.47
CHILE (0.96%*) - -
Portfolio of investments 391,300 90.26
Net other assets 42,231 9.74
Total net assets 433,531 100.00
Stocks shown as ADRs represent American Depositary Receipts.
All investments held are listed, unless otherwise stated.
* Comparative figures shown in brackets relate to 31 July 2016.For the purposes of the portfolio holdings analysis, securities are shown based on their country of listing.
333

Share class A Accumulation
Change in net assets per share
Opening net asset value per share
Return before operating charges*
Operating charges
Return after operating charges*
Distributions
Retained distributions on accumulation shares
Closing net asset value per share (p)
* after direct transaction costs of:
Performance
Return after charges (%)
Other information
Closing net asset value (£’000)
Closing number of shares
Operating charges
Direct transaction costs
Prices
Highest share price
Lowest share price 163.31 124.82 118.03
0.09% 0.05% 0.08%
200.29 169.85 145.73
1.66% 1.82% 1.83%
4,047 2,454 2,079
2,088,026 1,446,252 1,532,784
14.21% 25.14% 12.65%
193.83 169.72 135.62
0.17 0.07 0.11
- - 0.01
24.11 34.10 15.23
- - (0.01)
27.12 36.64 17.64
(3.01) (2.54) (2.41)
169.72 135.62 120.39
Stewart Investors Worldwide Sustainability Fund
Comparative Tablefor the year ended 31 July 2017
Net Asset Value and Ongoing Charges Figure
Final 31 July 2017(p)
Final 31 July 2016(p)
Final 31 July 2015(p)
334

Stewart Investors Worldwide Sustainability Fund
Comparative Table (continued)
for the year ended 31 July 2017
Net Asset Value and Ongoing Charges Figure
Share class A Income
Change in net assets per share
Opening net asset value per share
Return before operating charges*
Operating charges
Return after operating charges*
Distributions
Closing net asset value per share (p)
* after direct transaction costs of:
Performance
Return after charges (%)
Other information
Closing net asset value (£’000)
Closing number of shares
Operating charges
Direct transaction costs
Prices
Highest share price
Lowest share price 157.31 120.22 113.75
0.09% 0.05% 0.08%
192.94 163.59 140.44
1.61% 1.82% 1.83%
799 212 191
427,686 129,706 146,092
14.22% 25.15% 12.65%
186.72 163.47 130.62
0.17 0.07 0.11
23.25 32.85 14.68
- - (0.08)
26.12 35.30 17.00
(2.87) (2.45) (2.32)
163.47 130.62 116.02
Final 31 July 2017(p)
Final 31 July 2016(p)
Final 31 July 2015(p)
335

Stewart Investors Worldwide Sustainability Fund
Comparative Table (continued)
for the year ended 31 July 2017
Net Asset Value and Ongoing Charges Figure
Share class B Accumulation
Change in net assets per share
Opening net asset value per share
Return before operating charges*
Operating charges
Return after operating charges*
Distributions
Retained distributions on accumulation shares
Closing net asset value per share (p)
* after direct transaction costs of:
Performance
Return after charges (%)
Other information
Closing net asset value (£’000)
Closing number of shares
Operating charges
Direct transaction costs
Prices
Highest share price
Lowest share price 169.36 128.25 120.52
0.09% 0.05% 0.08%
208.41 175.68 149.33
0.99% 1.10% 1.11%
181,904 121,434 82,962
90,127,200 69,174,532 59,567,168
14.97% 26.05% 13.47%
201.83 175.55 139.27
0.18 0.08 0.11
0.67 0.81 1.07
26.28 36.28 16.53
(0.67) (0.81) (1.07)
28.16 37.87 18.03
(1.88) (1.59) (1.50)
175.55 139.27 122.74
Final 31 July 2017(p)
Final 31 July 2016(p)
Final 31 July 2015(p)
336
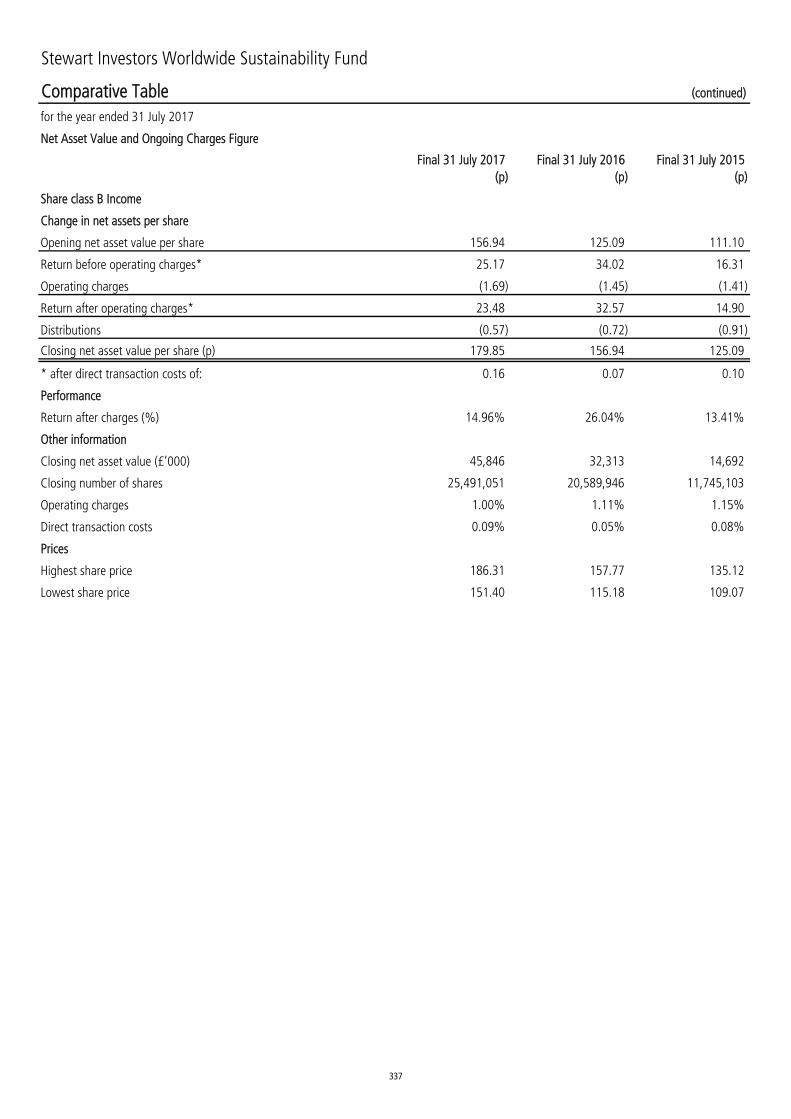
Stewart Investors Worldwide Sustainability Fund
Comparative Table (continued)
for the year ended 31 July 2017
Net Asset Value and Ongoing Charges Figure
Share class B Income
Change in net assets per share
Opening net asset value per share
Return before operating charges*
Operating charges
Return after operating charges*
Distributions
Closing net asset value per share (p)
* after direct transaction costs of:
Performance
Return after charges (%)
Other information
Closing net asset value (£’000)
Closing number of shares
Operating charges
Direct transaction costs
Prices
Highest share price
Lowest share price 151.40 115.18 109.07
0.09% 0.05% 0.08%
186.31 157.77 135.12
1.00% 1.11% 1.15%
45,846 32,313 14,692
25,491,051 20,589,946 11,745,103
14.96% 26.04% 13.41%
179.85 156.94 125.09
0.16 0.07 0.10
23.48 32.57 14.90
(0.57) (0.72) (0.91)
25.17 34.02 16.31
(1.69) (1.45) (1.41)
156.94 125.09 111.10
Final 31 July 2017(p)
Final 31 July 2016(p)
Final 31 July 2015(p)
337

Stewart Investors Worldwide Sustainability Fund
Comparative Table (continued)
for the year ended 31 July 2017
Net Asset Value and Ongoing Charges Figure
Share class A Accumulation (EUR share class)
Change in net assets per share
Opening net asset value per share
Return before operating charges*
Operating charges
Return after operating charges*
Distributions
Retained distributions on accumulation shares
Closing net asset value per share (c)
* after direct transaction costs of:
Performance
Return after charges (%)
Other information
Closing net asset value (€’000)
Closing number of shares
Operating charges
Direct transaction costs
Prices
Highest share price
Lowest share price 143.02 122.74 109.04
0.09% 0.05% 0.08%
168.63 149.41 148.69
1.58% 1.81% 1.82%
925 30 31
578,689 20,050 22,000
7.75% 4.63% 26.74%
159.77 148.28 141.72
0.15 0.07 0.11
0.00 - 0.10
11.49 6.56 29.90
(0.00) - (0.10)
13.98 9.03 32.25
(2.49) (2.47) (2.35)
148.28 141.72 111.82
Final 31 July 2017(c)
Final 31 July 2016(c)
Final 31 July 2015(c)
338
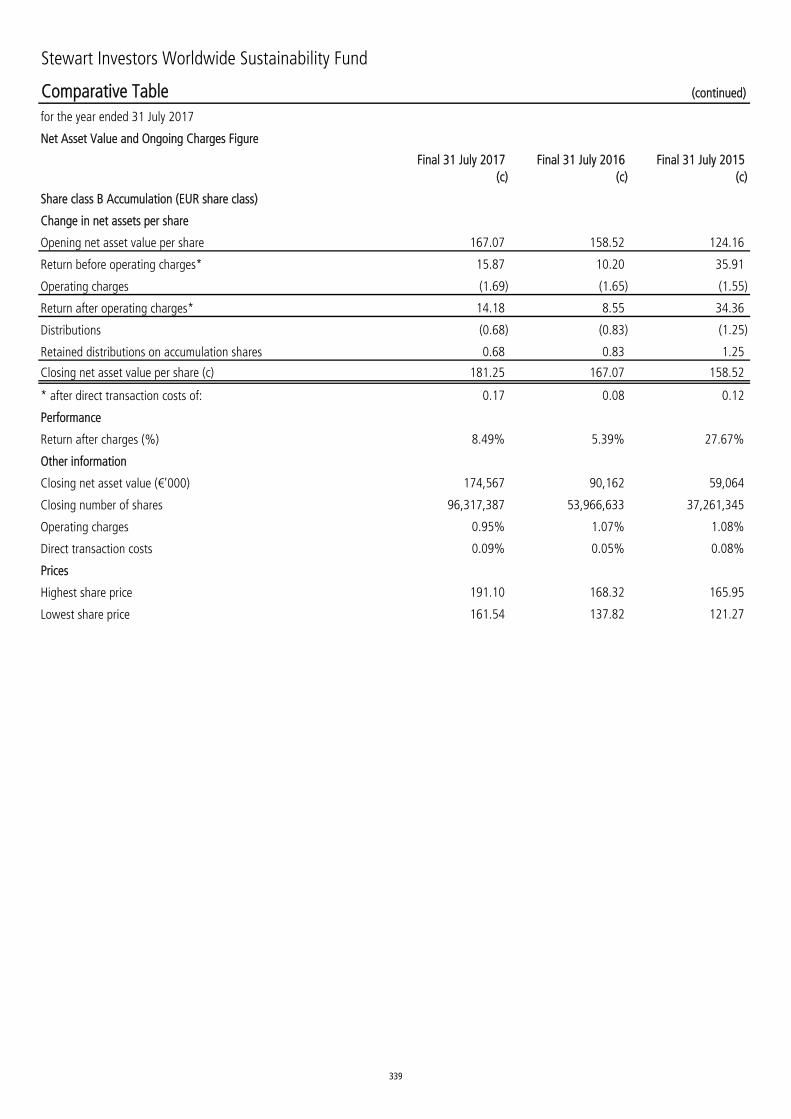
Stewart Investors Worldwide Sustainability Fund
Comparative Table (continued)
for the year ended 31 July 2017
Net Asset Value and Ongoing Charges Figure
Share class B Accumulation (EUR share class)
Change in net assets per share
Opening net asset value per share
Return before operating charges*
Operating charges
Return after operating charges*
Distributions
Retained distributions on accumulation shares
Closing net asset value per share (c)
* after direct transaction costs of:
Performance
Return after charges (%)
Other information
Closing net asset value (€’000)
Closing number of shares
Operating charges
Direct transaction costs
Prices
Highest share price
Lowest share price 161.54 137.82 121.27
0.09% 0.05% 0.08%
191.10 168.32 165.95
0.95% 1.07% 1.08%
174,567 90,162 59,064
96,317,387 53,966,633 37,261,345
8.49% 5.39% 27.67%
181.25 167.07 158.52
0.17 0.08 0.12
0.68 0.83 1.25
14.18 8.55 34.36
(0.68) (0.83) (1.25)
15.87 10.20 35.91
(1.69) (1.65) (1.55)
167.07 158.52 124.16
Final 31 July 2017(c)
Final 31 July 2016(c)
Final 31 July 2015(c)
339
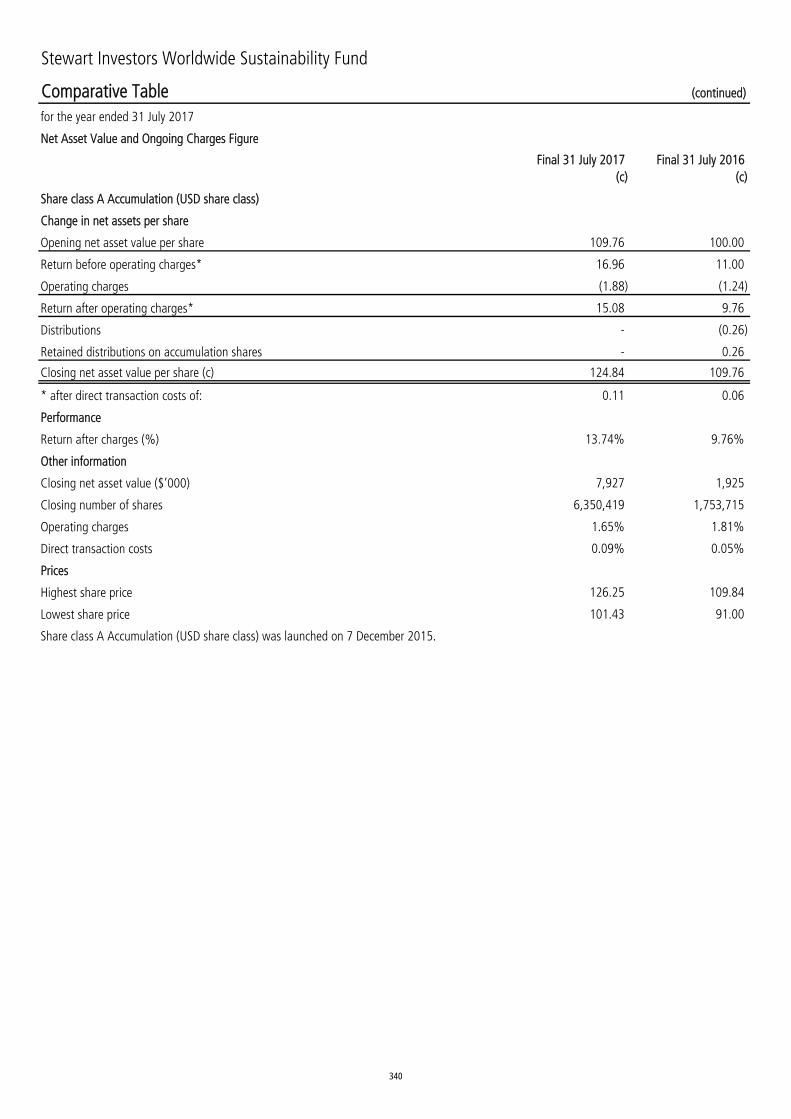
Stewart Investors Worldwide Sustainability Fund
Comparative Table (continued)
for the year ended 31 July 2017
Net Asset Value and Ongoing Charges Figure
Share class A Accumulation (USD share class)
Change in net assets per share
Opening net asset value per share
Return before operating charges*
Operating charges
Return after operating charges*
Distributions
Retained distributions on accumulation shares
Closing net asset value per share (c)
* after direct transaction costs of:
Performance
Return after charges (%)
Other information
Closing net asset value ($’000)
Closing number of shares
Operating charges
Direct transaction costs
Prices
Highest share price
Lowest share price
Share class A Accumulation (USD share class) was launched on 7 December 2015.
101.43 91.00
0.09% 0.05%
126.25 109.84
1.65% 1.81%
7,927 1,925
6,350,419 1,753,715
13.74% 9.76%
124.84 109.76
0.11 0.06
- 0.26
15.08 9.76
- (0.26)
16.96 11.00
(1.88) (1.24)
109.76 100.00
Final 31 July 2017(c)
Final 31 July 2016(c)
340

Stewart Investors Worldwide Sustainability Fund
Comparative Table (continued)
for the year ended 31 July 2017
Net Asset Value and Ongoing Charges Figure
Share class B Accumulation (USD share class)
Change in net assets per share
Opening net asset value per share
Return before operating charges*
Operating charges
Return after operating charges*
Distributions
Retained distributions on accumulation shares
Closing net asset value per share (c)
* after direct transaction costs of:
Performance
Return after charges (%)
Other information
Closing net asset value ($’000)
Closing number of shares
Operating charges
Direct transaction costs
Prices
Highest share price
Lowest share price 100.76 89.83 90.51
0.09% 0.05% 0.08%
125.84 108.82 103.98
0.96% 1.07% 1.08%
49,885 35,080 31,669
40,048,573 32,257,460 31,068,906
14.55% 6.68% 4.69%
124.56 108.74 101.93
0.11 0.05 0.08
0.45 0.53 0.81
15.82 6.81 4.57
(0.45) (0.53) (0.81)
16.90 7.87 5.65
(1.08) (1.06) (1.08)
108.74 101.93 97.36
Final 31 July 2017(c)
Final 31 July 2016(c)
Final 31 July 2015(c)
341

Notes £'000 £'000 £'000 £'000
Net capital gains 2 42,767 51,067
Revenue 3 5,169 3,638
4 (3,278) (2,105)
Interest payable and similar charges (8) (11)
1,883 1,522
5 (558) (343)
1,325 1,179
44,092 52,246
6 (1,344) (1,183)
42,748 51,063
£'000 £'000 £'000 £'000
260,546 161,916
199,275 51,291
(70,604) (4,833)
128,671 46,458
239 41
42,748 51,063
1,327 1,068
433,531 260,546
Less: Amounts payable on cancellation of shares
Dilution adjustment
Change in net assets attributable to shareholders from investment activities
Retained distribution on accumulation shares
Closing net assets attributable to shareholders
Notes to the Financial Statements are on pages 344 to 349.
Amounts receivable on issue of shares
for the year ended 31 July 2017
31 July 2017 31 July 2016
Opening net assets attributable to shareholders
Statement of Change in Net Assets Attributable to Shareholders
Income
Expenses
Net revenue before taxation
Taxation
Net revenue after taxation
Total return before distribution
Distributions
Change in net assets attributable to shareholders from investment activities
31 July 2017 31 July 2016
Stewart Investors Worldwide Sustainability Fund
Statement of Total Returnfor the year ended 31 July 2017
342

Stewart Investors Worldwide Sustainability Fund
31 July 2017 31 July 2016Notes £'000 £'000
Investments 391,300 244,631
Current assets
8 3,707 5,158
39,112 11,321
434,119 261,110
Creditors
(147) (149)
Other creditors 9 (441) (415)
(588) (564)
433,531 260,546
Notes to the Financial Statements are on pages 344 to 349.
Distribution payable
Total liabilities
Net assets attributable to shareholders
Balance Sheetas at 31 July 2017
Assets
Fixed assets
Debtors
Cash and bank balances
Total assets
Liabilities
343
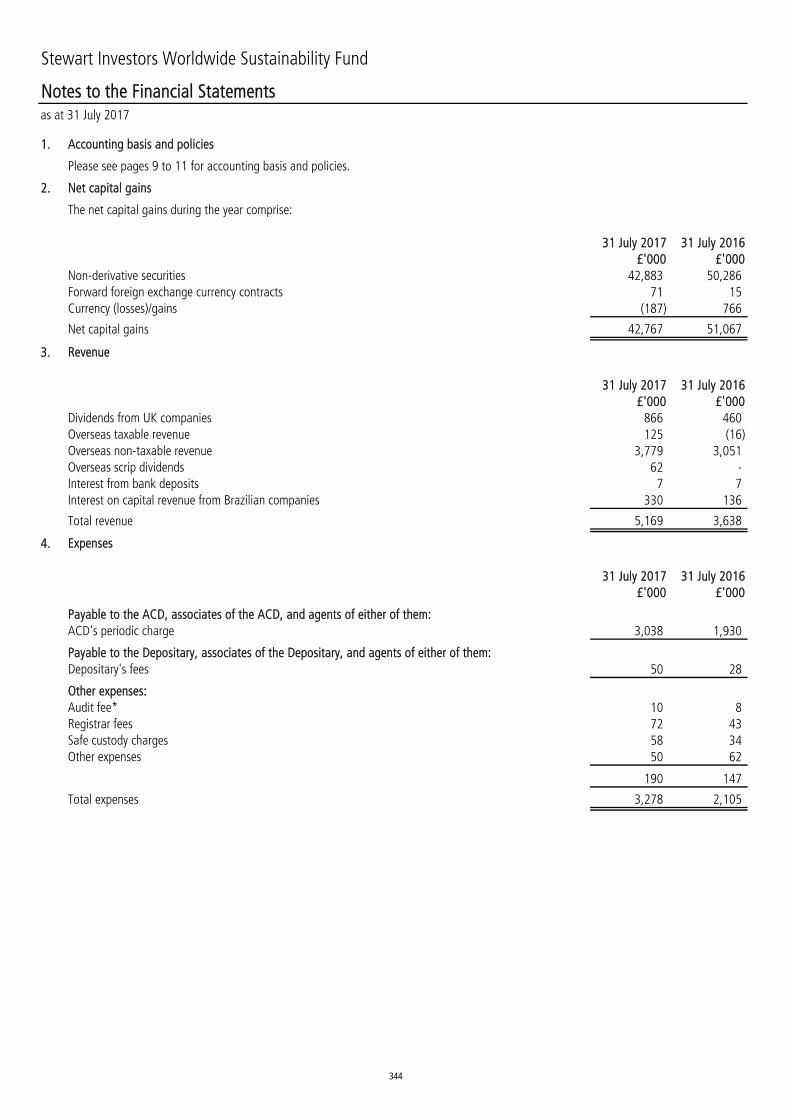
1.
2.
31 July 2017 31 July 2016£'000 £'000
42,883 50,28671 15
(187) 766
42,767 51,067
3.
31 July 2017 31 July 2016£'000 £'000
866 460125 (16)
3,779 3,05162 -
7 7330 136
5,169 3,638
4.
31 July 2017 31 July 2016£'000 £'000
3,038 1,930
50 28
10 872 4358 3450 62
190 147
3,278 2,105Total expenses
Audit fee*Registrar feesSafe custody chargesOther expenses
Other expenses:
Payable to the Depositary, associates of the Depositary, and agents of either of them:Depositary's fees
Expenses
Payable to the ACD, associates of the ACD, and agents of either of them:ACD's periodic charge
Total revenue
Interest on capital revenue from Brazilian companiesInterest from bank depositsOverseas scrip dividends
Dividends from UK companiesOverseas taxable revenueOverseas non-taxable revenue
Net capital gains
Revenue
Forward foreign exchange currency contractsCurrency (losses)/gains
Accounting basis and policies
Please see pages 9 to 11 for accounting basis and policies.
Net capital gains
The net capital gains during the year comprise:
Non-derivative securities
Notes to the Financial Statementsas at 31 July 2017
Stewart Investors Worldwide Sustainability Fund
344
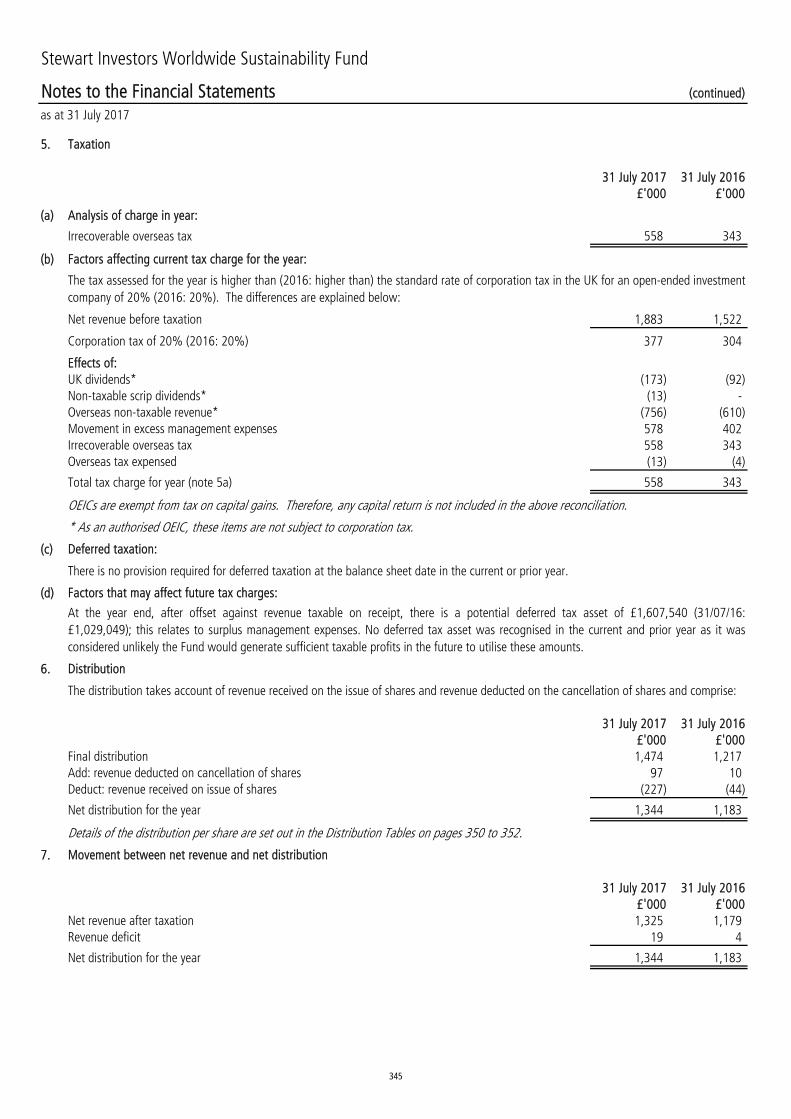
Notes to the Financial Statements (continued)
as at 31 July 2017
Stewart Investors Worldwide Sustainability Fund
5.
31 July 2017 31 July 2016£'000 £'000
(a)
558 343
(b)
1,883 1,522
377 304
(173) (92)(13) -
(756) (610)578 402558 343(13) (4)
558 343
(c)
(d)
6.
31 July 2017 31 July 2016£'000 £'0001,474 1,217
97 10(227) (44)
1,344 1,183
7.
31 July 2017 31 July 2016£'000 £'0001,325 1,179
19 4
1,344 1,183Net distribution for the year
Details of the distribution per share are set out in the Distribution Tables on pages 350 to 352.
Movement between net revenue and net distribution
Net revenue after taxationRevenue deficit
Add: revenue deducted on cancellation of sharesDeduct: revenue received on issue of shares
Net distribution for the year
Final distribution
Distribution
The distribution takes account of revenue received on the issue of shares and revenue deducted on the cancellation of shares and comprise:
Factors that may affect future tax charges:
At the year end, after offset against revenue taxable on receipt, there is a potential deferred tax asset of £1,607,540 (31/07/16:£1,029,049); this relates to surplus management expenses. No deferred tax asset was recognised in the current and prior year as it wasconsidered unlikely the Fund would generate sufficient taxable profits in the future to utilise these amounts.
Deferred taxation:
There is no provision required for deferred taxation at the balance sheet date in the current or prior year.
Total tax charge for year (note 5a)
OEICs are exempt from tax on capital gains. Therefore, any capital return is not included in the above reconciliation.
* As an authorised OEIC, these items are not subject to corporation tax.
Overseas tax expensed
Movement in excess management expensesIrrecoverable overseas tax
UK dividends*Non-taxable scrip dividends*Overseas non-taxable revenue*
Net revenue before taxation
Corporation tax of 20% (2016: 20%)
Effects of:
Factors affecting current tax charge for the year:
The tax assessed for the year is higher than (2016: higher than) the standard rate of corporation tax in the UK for an open-ended investmentcompany of 20% (2016: 20%). The differences are explained below:
Irrecoverable overseas tax
Analysis of charge in year:
Taxation
345
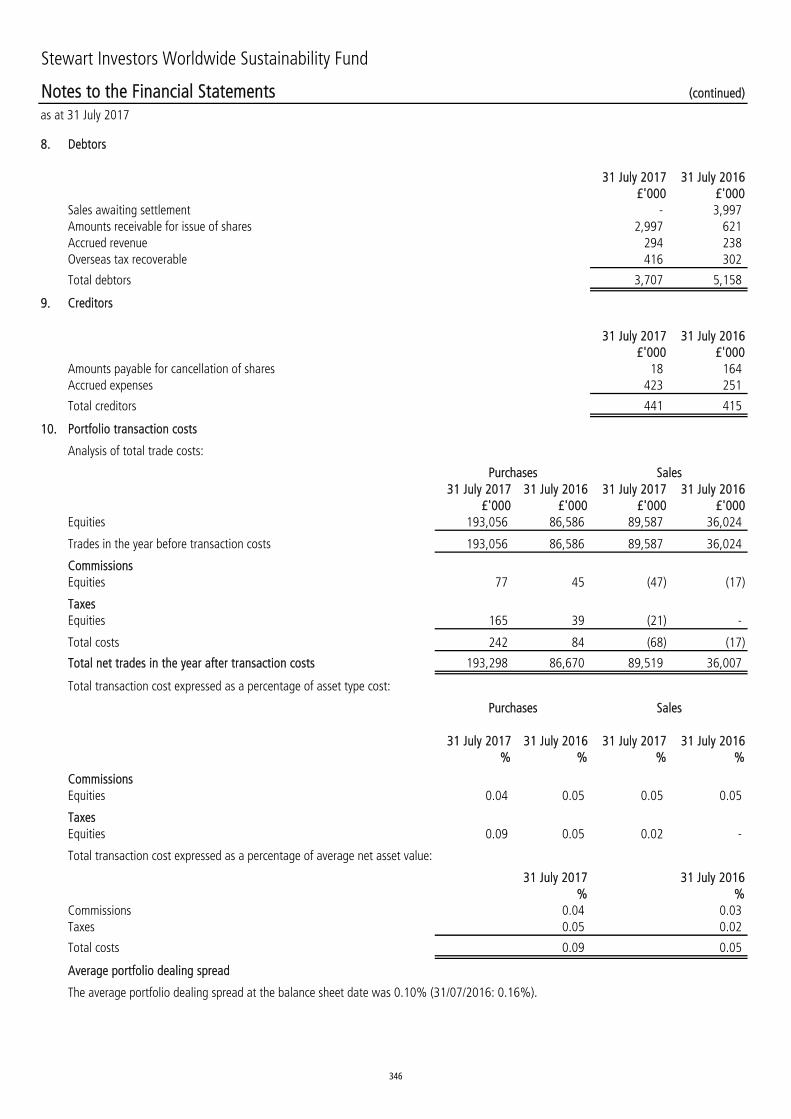
Notes to the Financial Statements (continued)
as at 31 July 2017
Stewart Investors Worldwide Sustainability Fund
8.
31 July 2017 31 July 2016£'000 £'000
- 3,9972,997 621
294 238416 302
3,707 5,158
9.
31 July 2017 31 July 2016£'000 £'000
18 164423 251
441 415
10.
31 July 2017 31 July 2016 31 July 2017 31 July 2016£'000 £'000 £'000 £'000
193,056 86,586 89,587 36,024
193,056 86,586 89,587 36,024
77 45 (47) (17)
165 39 (21) -
242 84 (68) (17)
193,298 86,670 89,519 36,007
31 July 2017 31 July 2016 31 July 2017 31 July 2016% % % %
0.04 0.05 0.05 0.05
0.09 0.05 0.02 -
The average portfolio dealing spread at the balance sheet date was 0.10% (31/07/2016: 0.16%).
Total costs 0.09 0.05
Average portfolio dealing spread
Commissions 0.04 0.03Taxes 0.05 0.02
Total transaction cost expressed as a percentage of average net asset value:
31 July 2017 31 July 2016% %
EquitiesTaxes
CommissionsEquities
Total transaction cost expressed as a percentage of asset type cost:
Purchases Sales
Total costs
Total net trades in the year after transaction costs
TaxesEquities
Trades in the year before transaction costs
CommissionsEquities
Analysis of total trade costs:
Purchases Sales
Equities
Total creditors
Portfolio transaction costs
Amounts payable for cancellation of sharesAccrued expenses
Creditors
Total debtors
Overseas tax recoverable
Amounts receivable for issue of sharesAccrued revenue
Debtors
Sales awaiting settlement
346
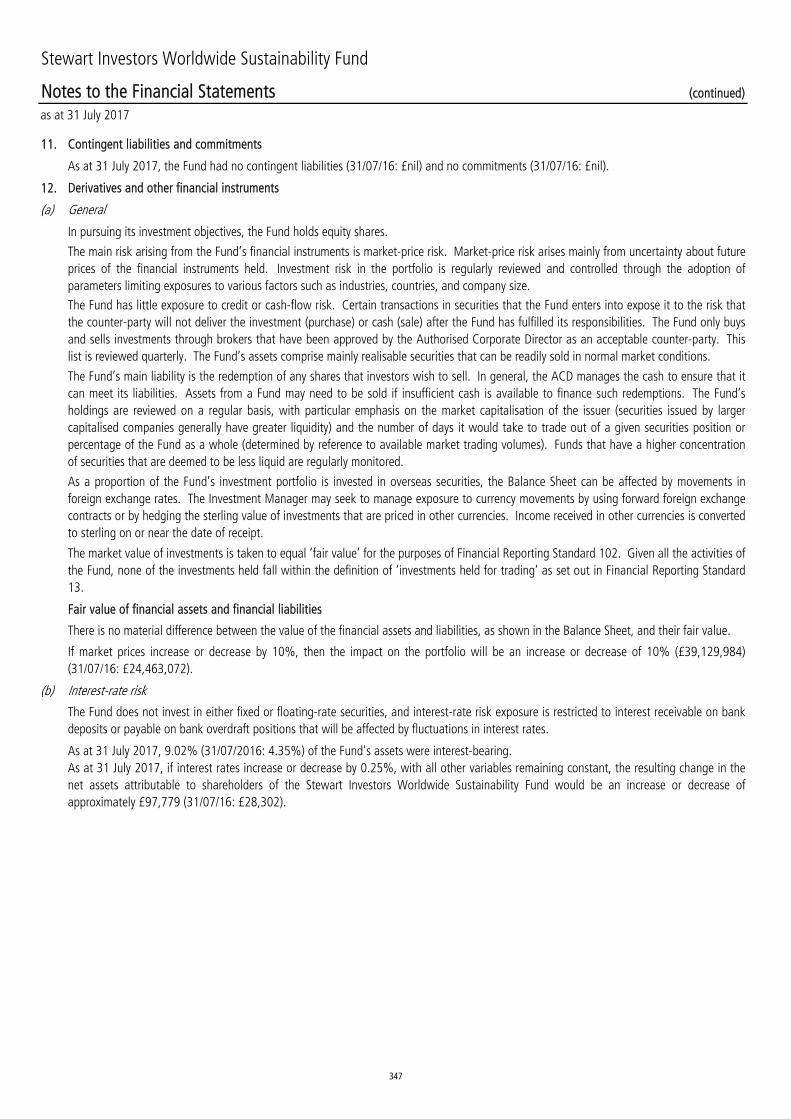
Notes to the Financial Statements (continued)
as at 31 July 2017
Stewart Investors Worldwide Sustainability Fund
11.
12.
(a)
(b)
As at 31 July 2017, 9.02% (31/07/2016: 4.35%) of the Fund's assets were interest-bearing.As at 31 July 2017, if interest rates increase or decrease by 0.25%, with all other variables remaining constant, the resulting change in thenet assets attributable to shareholders of the Stewart Investors Worldwide Sustainability Fund would be an increase or decrease ofapproximately £97,779 (31/07/16: £28,302).
There is no material difference between the value of the financial assets and liabilities, as shown in the Balance Sheet, and their fair value.
If market prices increase or decrease by 10%, then the impact on the portfolio will be an increase or decrease of 10% (£39,129,984)(31/07/16: £24,463,072).
Interest-rate risk
The Fund does not invest in either fixed or floating-rate securities, and interest-rate risk exposure is restricted to interest receivable on bankdeposits or payable on bank overdraft positions that will be affected by fluctuations in interest rates.
The Fund’s main liability is the redemption of any shares that investors wish to sell. In general, the ACD manages the cash to ensure that itcan meet its liabilities. Assets from a Fund may need to be sold if insufficient cash is available to finance such redemptions. The Fund’sholdings are reviewed on a regular basis, with particular emphasis on the market capitalisation of the issuer (securities issued by largercapitalised companies generally have greater liquidity) and the number of days it would take to trade out of a given securities position orpercentage of the Fund as a whole (determined by reference to available market trading volumes). Funds that have a higher concentrationof securities that are deemed to be less liquid are regularly monitored.
As a proportion of the Fund’s investment portfolio is invested in overseas securities, the Balance Sheet can be affected by movements inforeign exchange rates. The Investment Manager may seek to manage exposure to currency movements by using forward foreign exchangecontracts or by hedging the sterling value of investments that are priced in other currencies. Income received in other currencies is convertedto sterling on or near the date of receipt.
The market value of investments is taken to equal ‘fair value’ for the purposes of Financial Reporting Standard 102. Given all the activities ofthe Fund, none of the investments held fall within the definition of ‘investments held for trading’ as set out in Financial Reporting Standard13.
Fair value of financial assets and financial liabilities
Derivatives and other financial instruments
General
In pursuing its investment objectives, the Fund holds equity shares.
The main risk arising from the Fund’s financial instruments is market-price risk. Market-price risk arises mainly from uncertainty about futureprices of the financial instruments held. Investment risk in the portfolio is regularly reviewed and controlled through the adoption ofparameters limiting exposures to various factors such as industries, countries, and company size.
The Fund has little exposure to credit or cash-flow risk. Certain transactions in securities that the Fund enters into expose it to the risk thatthe counter-party will not deliver the investment (purchase) or cash (sale) after the Fund has fulfilled its responsibilities. The Fund only buysand sells investments through brokers that have been approved by the Authorised Corporate Director as an acceptable counter-party. Thislist is reviewed quarterly. The Fund’s assets comprise mainly realisable securities that can be readily sold in normal market conditions.
Contingent liabilities and commitments
As at 31 July 2017, the Fund had no contingent liabilities (31/07/16: £nil) and no commitments (31/07/16: £nil).
347
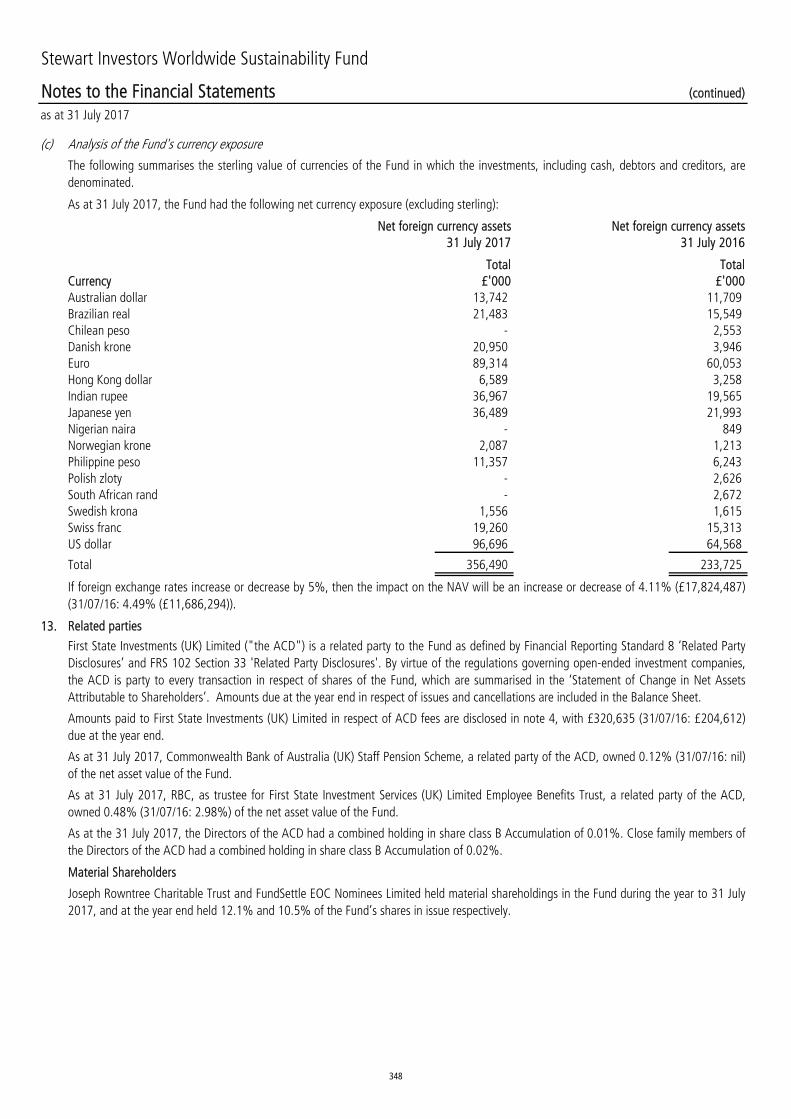
Notes to the Financial Statements (continued)
as at 31 July 2017
Stewart Investors Worldwide Sustainability Fund
(c)
Total TotalCurrency £'000 £'000Australian dollar 13,742 11,709Brazilian real 21,483 15,549Chilean peso - 2,553Danish krone 20,950 3,946Euro 89,314 60,053Hong Kong dollar 6,589 3,258Indian rupee 36,967 19,565Japanese yen 36,489 21,993Nigerian naira - 849Norwegian krone 2,087 1,213Philippine peso 11,357 6,243Polish zloty - 2,626South African rand - 2,672Swedish krona 1,556 1,615Swiss franc 19,260 15,313US dollar 96,696 64,568
Total 356,490 233,725
13.
As at the 31 July 2017, the Directors of the ACD had a combined holding in share class B Accumulation of 0.01%. Close family members ofthe Directors of the ACD had a combined holding in share class B Accumulation of 0.02%.
Material Shareholders
Joseph Rowntree Charitable Trust and FundSettle EOC Nominees Limited held material shareholdings in the Fund during the year to 31 July2017, and at the year end held 12.1% and 10.5% of the Fund’s shares in issue respectively.
Amounts paid to First State Investments (UK) Limited in respect of ACD fees are disclosed in note 4, with £320,635 (31/07/16: £204,612)due at the year end.
As at 31 July 2017, Commonwealth Bank of Australia (UK) Staff Pension Scheme, a related party of the ACD, owned 0.12% (31/07/16: nil)of the net asset value of the Fund.
As at 31 July 2017, RBC, as trustee for First State Investment Services (UK) Limited Employee Benefits Trust, a related party of the ACD,owned 0.48% (31/07/16: 2.98%) of the net asset value of the Fund.
Related parties
First State Investments (UK) Limited ("the ACD") is a related party to the Fund as defined by Financial Reporting Standard 8 ‘Related PartyDisclosures’ and FRS 102 Section 33 'Related Party Disclosures'. By virtue of the regulations governing open-ended investment companies,the ACD is party to every transaction in respect of shares of the Fund, which are summarised in the ‘Statement of Change in Net AssetsAttributable to Shareholders’. Amounts due at the year end in respect of issues and cancellations are included in the Balance Sheet.
If foreign exchange rates increase or decrease by 5%, then the impact on the NAV will be an increase or decrease of 4.11% (£17,824,487)(31/07/16: 4.49% (£11,686,294)).
The following summarises the sterling value of currencies of the Fund in which the investments, including cash, debtors and creditors, aredenominated.
As at 31 July 2017, the Fund had the following net currency exposure (excluding sterling):
Net foreign currency assets Net foreign currency assets31 July 2017 31 July 2016
Analysis of the Fund's currency exposure
348
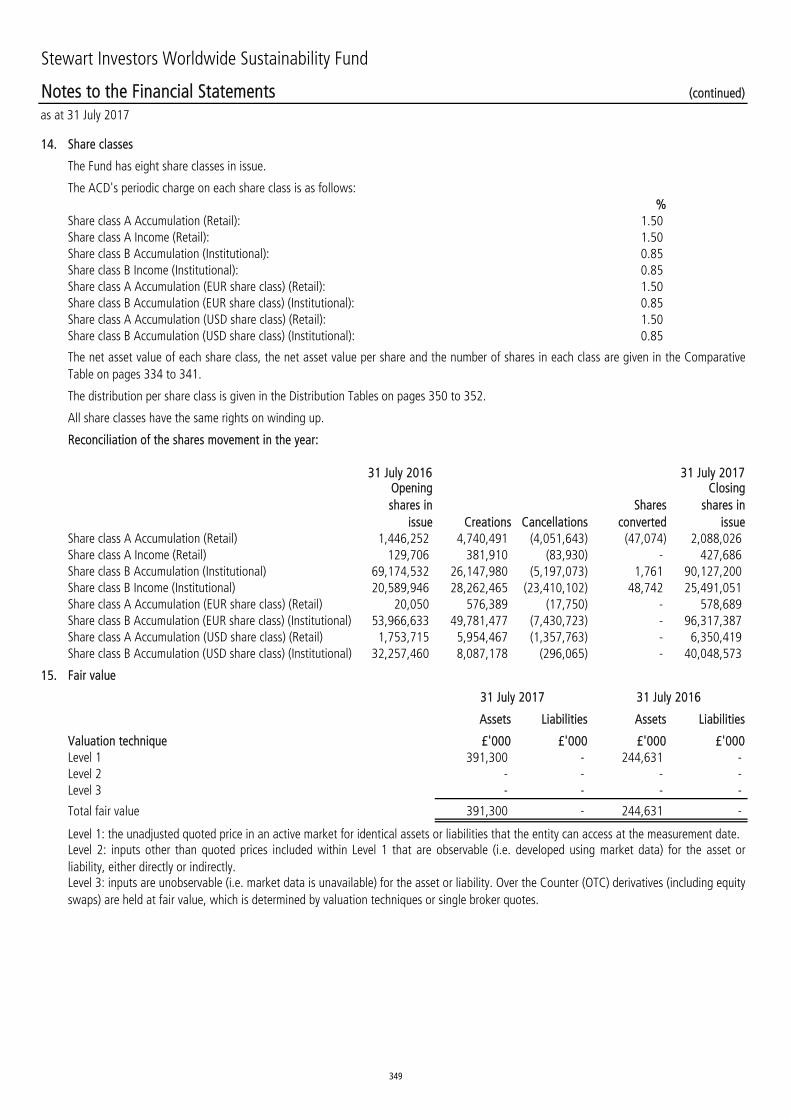
Notes to the Financial Statements (continued)
as at 31 July 2017
Stewart Investors Worldwide Sustainability Fund
14.
%1.501.500.850.851.500.851.500.85
31 July 2016 31 July 2017Opening shares in
issue Creations CancellationsShares
converted
Closingshares in
issue1,446,252 4,740,491 (4,051,643) (47,074) 2,088,026
129,706 381,910 (83,930) - 427,68669,174,532 26,147,980 (5,197,073) 1,761 90,127,20020,589,946 28,262,465 (23,410,102) 48,742 25,491,051
20,050 576,389 (17,750) - 578,68953,966,633 49,781,477 (7,430,723) - 96,317,387
1,753,715 5,954,467 (1,357,763) - 6,350,41932,257,460 8,087,178 (296,065) - 40,048,573
15.
Assets Liabilities Assets Liabilities
£'000 £'000 £'000 £'000391,300 - 244,631 -
- - - -- - - -
391,300 - 244,631 -
Level 3: inputs are unobservable (i.e. market data is unavailable) for the asset or liability. Over the Counter (OTC) derivatives (including equityswaps) are held at fair value, which is determined by valuation techniques or single broker quotes.
Level 1Level 2Level 3
Total fair value
Level 1: the unadjusted quoted price in an active market for identical assets or liabilities that the entity can access at the measurement date. Level 2: inputs other than quoted prices included within Level 1 that are observable (i.e. developed using market data) for the asset orliability, either directly or indirectly.
Fair value
Valuation technique
31 July 2017 31 July 2016
Share class B Income (Institutional)Share class A Accumulation (EUR share class) (Retail)Share class B Accumulation (EUR share class) (Institutional)Share class A Accumulation (USD share class) (Retail)Share class B Accumulation (USD share class) (Institutional)
All share classes have the same rights on winding up.
Reconciliation of the shares movement in the year:
Share class A Accumulation (Retail)Share class A Income (Retail)Share class B Accumulation (Institutional)
The net asset value of each share class, the net asset value per share and the number of shares in each class are given in the ComparativeTable on pages 334 to 341.
The distribution per share class is given in the Distribution Tables on pages 350 to 352.
Share class A Accumulation (EUR share class) (Retail):Share class B Accumulation (EUR share class) (Institutional):Share class A Accumulation (USD share class) (Retail):Share class B Accumulation (USD share class) (Institutional):
The ACD's periodic charge on each share class is as follows:
Share class A Accumulation (Retail):Share class A Income (Retail):Share class B Accumulation (Institutional):Share class B Income (Institutional):
Share classes
The Fund has eight share classes in issue.
349

Share class A Accumulation
Netrevenue Equalisation
Distributions paid to/payable
30/09/2017
Distributions paid
30/09/2016Group 1 (p) (p) (p) (p)Interim - - - -Final - - - -Group 2 (p) (p) (p) (p)Interim - - - -Final - - - -
Share class A Income
Netrevenue Equalisation
Distributions paid to/payable
30/09/2017
Distributions paid
30/09/2016Group 1 (p) (p) (p) (p)Interim - - - -Final - - - -Group 2 (p) (p) (p) (p)Interim - - - -Final - - - -
Share class B Accumulation
Netrevenue Equalisation
Distributions paid to/payable
30/09/2017
Distributions paid
30/09/2016Group 1 (p) (p) (p) (p)Interim - - - -Final 0.6700 - 0.6700 0.8077Group 2 (p) (p) (p) (p)Interim - - - -Final 0.4720 0.1980 0.6700 0.8077
Share class B Income
Netrevenue Equalisation
Distributions paid to/payable
30/09/2017
Distributions paid
30/09/2016Group 1 (p) (p) (p) (p)Interim - - - -Final 0.5739 - 0.5739 0.7220Group 2 (p) (p) (p) (p)Interim - - - -Final 0.3315 0.2424 0.5739 0.7220
This share class is in deficit and therefore not making a distribution.
Final - Shares purchased between 1 February 2017 and 31 July 2017
This share class is in deficit and therefore not making a distribution.
Group 2 Interim - Shares purchased between 1 August 2016 and 31 January 2017
Final - Shares purchased prior to 1 February 2017
Distribution in pence and cents per share
Stewart Investors Worldwide Sustainability Fund
Distribution Tablesfor the year ended 31 July 2017
Group 1 Interim - Shares purchased prior to 1 August 2016
350
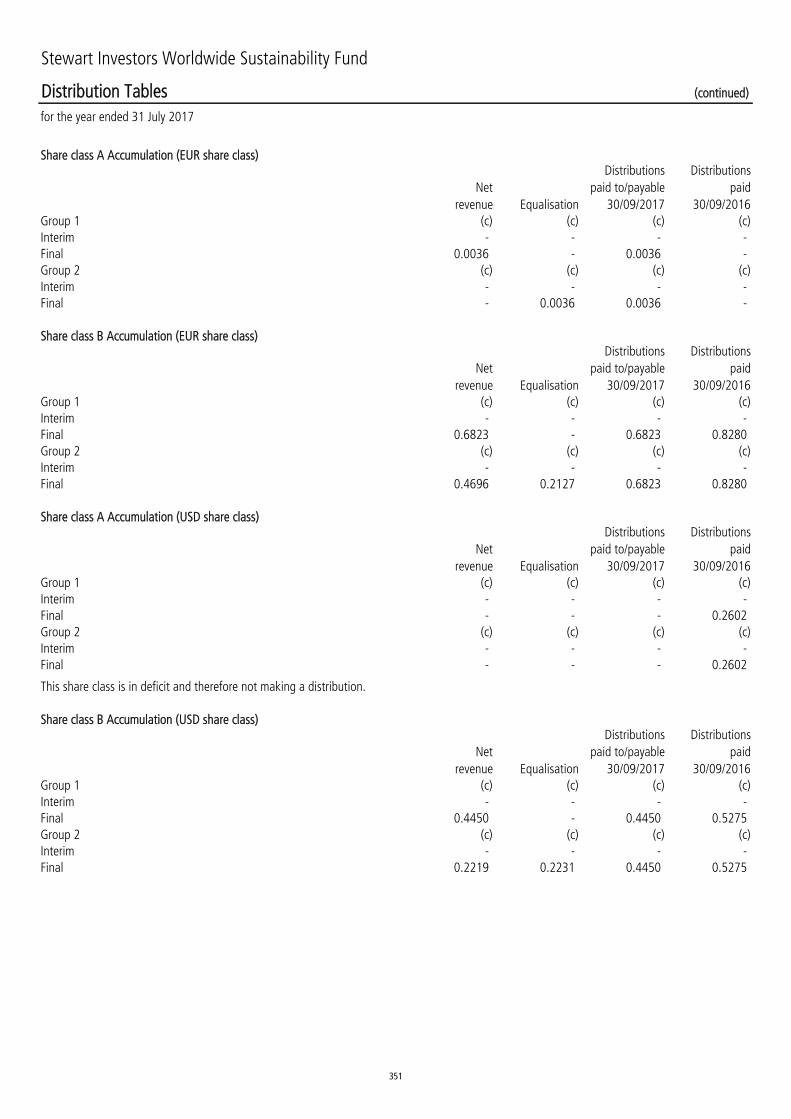
Stewart Investors Worldwide Sustainability Fund
Distribution Tables (continued)
for the year ended 31 July 2017
Share class A Accumulation (EUR share class)
Netrevenue Equalisation
Distributions paid to/payable
30/09/2017
Distributions paid
30/09/2016Group 1 (c) (c) (c) (c)Interim - - - -Final 0.0036 - 0.0036 -Group 2 (c) (c) (c) (c)Interim - - - -Final - 0.0036 0.0036 -
Share class B Accumulation (EUR share class)
Netrevenue Equalisation
Distributions paid to/payable
30/09/2017
Distributions paid
30/09/2016Group 1 (c) (c) (c) (c)Interim - - - -Final 0.6823 - 0.6823 0.8280Group 2 (c) (c) (c) (c)Interim - - - -Final 0.4696 0.2127 0.6823 0.8280
Share class A Accumulation (USD share class)
Netrevenue Equalisation
Distributions paid to/payable
30/09/2017
Distributions paid
30/09/2016Group 1 (c) (c) (c) (c)Interim - - - -Final - - - 0.2602Group 2 (c) (c) (c) (c)Interim - - - -Final - - - 0.2602
Share class B Accumulation (USD share class)
Netrevenue Equalisation
Distributions paid to/payable
30/09/2017
Distributions paid
30/09/2016Group 1 (c) (c) (c) (c)Interim - - - -Final 0.4450 - 0.4450 0.5275Group 2 (c) (c) (c) (c)Interim - - - -Final 0.2219 0.2231 0.4450 0.5275
This share class is in deficit and therefore not making a distribution.
351

Stewart Investors Worldwide Sustainability Fund
Distribution Tables (continued)
for the year ended 31 July 2017
Shareholders should consult their professional advisers for any advice regarding their tax position.
Final - 100.00% of the dividend is received as franked investment income.
Final - 0.00% of the dividend is received as an annual payment (non-foreign element) received after the deduction of income tax at the lower rateand is liable to corporation tax. The tax deemed to be deducted is treated as income tax.Final - 0.00% of the dividend is received as an annual payment (foreign element) received after the deduction of income tax at the lower rate and isliable to corporation tax. It is treated as foreign income in the hands of the corporate investor and is liable to corporation tax. The associateddeemed tax is treated as foreign tax in the hands of the investor, who may be able to claim double tax relief. Investors cannot reclaim any of thisdeemed tax on the foreign element from HM Revenue & Customs.
Interim - 100.00% of the dividend is received as franked investment income.
Interim - 0.00% of the dividend is received as an annual payment (non-foreign element) received after the deduction of income tax at the lowerrate and is liable to corporation tax. The tax deemed to be deducted is treated as income tax.Interim - 0.00% of the dividend is received as an annual payment (foreign element) received after the deduction of income tax at the lower rate andis liable to corporation tax. It is treated as foreign income in the hands of the corporate investor and is liable to corporation tax. The associateddeemed tax is treated as foreign tax in the hands of the investor, who may be able to claim double tax relief. Investors cannot reclaim any of thisdeemed tax on the foreign element from HM Revenue & Customs.
Corporate tax for all share classes (unaudited)A shareholder liable to corporation tax receives this distribution, excluding equalisation, as follows:
352
Risks and reward profile
Lower Risk Higher Risk
Potentially Lower Rewards Potentially Higher Rewards
1 2 3 4 5 6 7
1 2 3 4 5 6 7
1 2 3 4 5 6 7
1 2 3 4 5 6 7
1 2 3 4 5 6 7
1 2 3 4 5 6 7
1 2 3 4 5 6 7
1 2 3 4 5 6 7
1 2 3 4 5 6 7
1 2 3 4 5 6 7
1 2 3 4 5 6 7
1 2 3 4 5 6 7
Share class A Income (EUR share class)
Share class B Accumulation (EUR share class)
Share class B Income (EUR share class)
Share class B Hedged Accumulation (EUR share class)
Share class B Accumulation (USD share class)
Share class A Accumulation
Share class A Income
Share class B Accumulation
Share class B Income
Share class B Hedged Accumulation
Share class B Hedged Income
• Risk is taken in order to make a higher potential return; the more risk a Fund takes, the higher the potential return but the greater the risk ofloss; and
Share class A Accumulation (EUR share class)
• We cannot guarantee that the rating of the Fund will remain the same; it may change over time;
For further information on risks, please refer to the Risk Factors section in the Company's prospectus.
First State Global Listed Infrastructure Fund
Investment Objective and Policy
The Fund aims to achieve an investment return consistent with income and long-term capital growth.
for the year ended 31 July 2017
Authorised Fund Manager's Report
The Fund invests in a diversified portfolio of listed infrastructure and infrastructure-related securities from around the world.
• The synthetic risk reward indicator (the SRRI) rating is not a measure of the risk of you losing your investment but describes how much the valueof the Fund went up and down in the past;
• The SRRI rating is based on historical data, which may not be a reliable indication of the future risks and rewards of the Fund;
• On a scale of 1 (less risky) to 7 (more risky), this Fund has a rating of 5 due to its past performance and the nature of its investments. Shares witha rating of 5 might have higher risks, but also higher returns;
Single-sector risk: investing in a single sector may be riskier than investing in a number of different sectors. Investing in a larger number of sectorshelps spread risk.
The Fund might also experience the following risks:
• The value of the Fund and its return is not guaranteed and may fall as well as rise. You may get back less than you originally invested.
• Even the lowest rating 1 does not mean a risk-free investment;
353
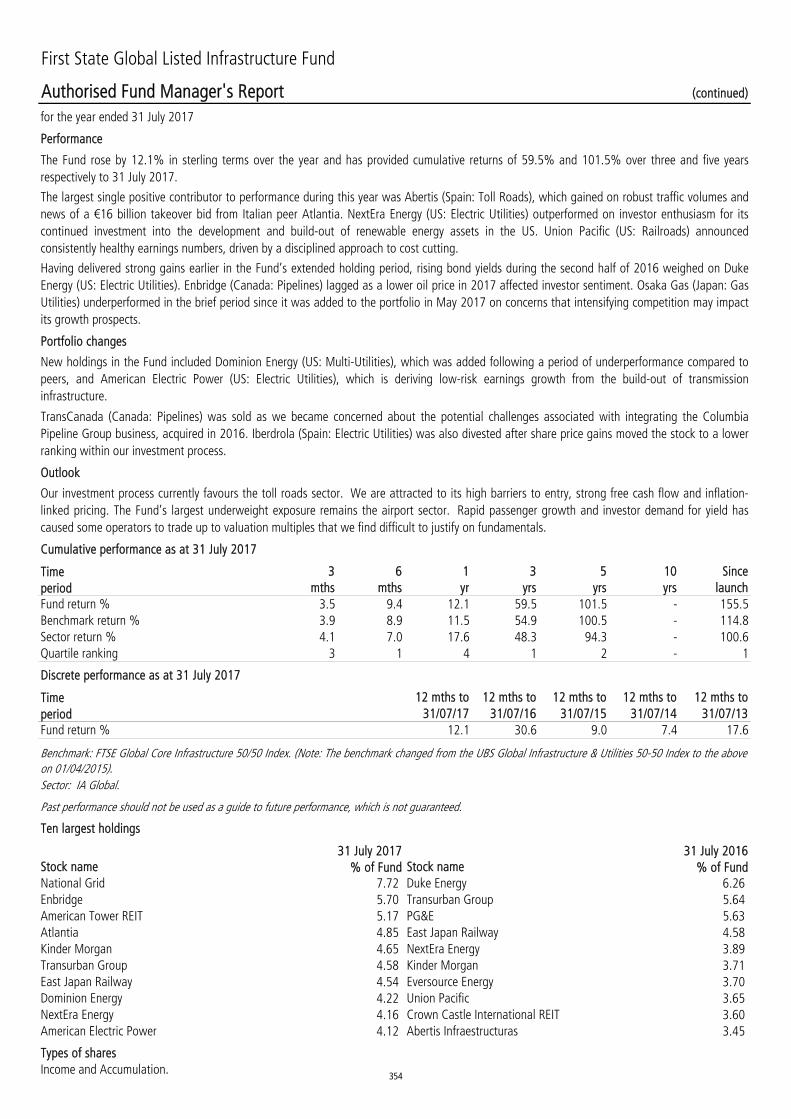
(continued)
First State Global Listed Infrastructure Fund
for the year ended 31 July 2017
Authorised Fund Manager's Report
Time 3 6 1 3 5 10 Sinceperiod mths mths yr yrs yrs yrs launch
3.5 9.4 12.1 59.5 101.5 - 155.5 3.9 8.9 11.5 54.9 100.5 - 114.8 4.1 7.0 17.6 48.3 94.3 - 100.6
3 1 4 1 2 - 1
12 mths to 12 mths to 12 mths to 12 mths to 12 mths to31/07/17 31/07/16 31/07/15 31/07/14 31/07/13
12.1 30.6 9.0 7.4 17.6
31 July 2017 31 July 2016% of Fund % of Fund
7.72 6.265.70 5.645.17 5.634.85 4.584.65 3.894.58 3.714.54 3.704.22 3.654.16 3.604.12 3.45
East Japan Railway
Stock nameNational Grid Duke Energy
Types of shares
Dominion Energy Union PacificNextEra Energy Crown Castle International REITAmerican Electric Power
Kinder Morgan NextEra Energy
Abertis Infraestructuras
Transurban Group Kinder MorganEast Japan Railway Eversource Energy
American Tower REIT PG&EAtlantia
Income and Accumulation.
TransCanada (Canada: Pipelines) was sold as we became concerned about the potential challenges associated with integrating the ColumbiaPipeline Group business, acquired in 2016. Iberdrola (Spain: Electric Utilities) was also divested after share price gains moved the stock to a lowerranking within our investment process.
Discrete performance as at 31 July 2017
Fund return %Benchmark return %
Cumulative performance as at 31 July 2017
Our investment process currently favours the toll roads sector. We are attracted to its high barriers to entry, strong free cash flow and inflation-linked pricing. The Fund’s largest underweight exposure remains the airport sector. Rapid passenger growth and investor demand for yield hascaused some operators to trade up to valuation multiples that we find difficult to justify on fundamentals.
Past performance should not be used as a guide to future performance, which is not guaranteed.
Benchmark: FTSE Global Core Infrastructure 50/50 Index. (Note: The benchmark changed from the UBS Global Infrastructure & Utilities 50-50 Index to the aboveon 01/04/2015).
Enbridge Transurban Group
Ten largest holdings
Stock name
periodFund return %
Sector: IA Global.
New holdings in the Fund included Dominion Energy (US: Multi-Utilities), which was added following a period of underperformance compared topeers, and American Electric Power (US: Electric Utilities), which is deriving low-risk earnings growth from the build-out of transmissioninfrastructure.
Portfolio changes
Performance
The largest single positive contributor to performance during this year was Abertis (Spain: Toll Roads), which gained on robust traffic volumes andnews of a €16 billion takeover bid from Italian peer Atlantia. NextEra Energy (US: Electric Utilities) outperformed on investor enthusiasm for itscontinued investment into the development and build-out of renewable energy assets in the US. Union Pacific (US: Railroads) announcedconsistently healthy earnings numbers, driven by a disciplined approach to cost cutting.
Time
Sector return %
Outlook
The Fund rose by 12.1% in sterling terms over the year and has provided cumulative returns of 59.5% and 101.5% over three and five yearsrespectively to 31 July 2017.
Having delivered strong gains earlier in the Fund’s extended holding period, rising bond yields during the second half of 2016 weighed on DukeEnergy (US: Electric Utilities). Enbridge (Canada: Pipelines) lagged as a lower oil price in 2017 affected investor sentiment. Osaka Gas (Japan: GasUtilities) underperformed in the brief period since it was added to the portfolio in May 2017 on concerns that intensifying competition may impactits growth prospects.
Quartile ranking
354
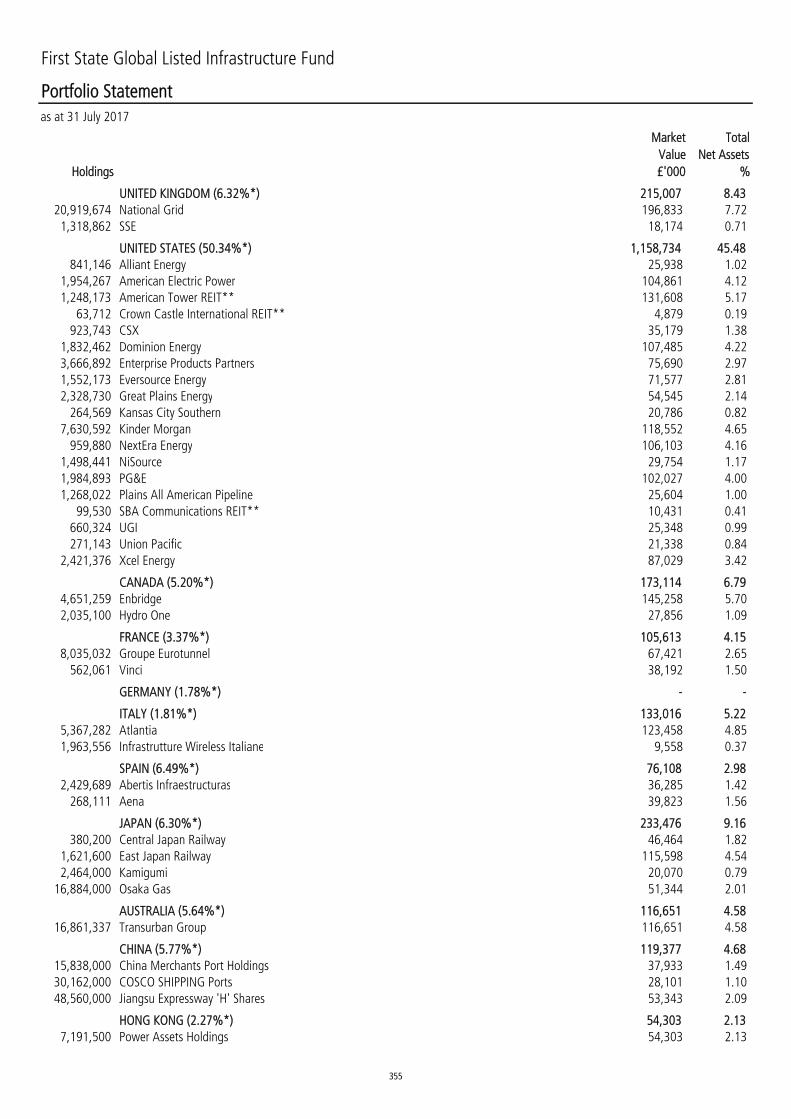
Holdings
MarketValue£'000
TotalNet Assets
%
UNITED KINGDOM (6.32%*) 215,007 8.4320,919,674 National Grid 196,833 7.72
1,318,862 SSE 18,174 0.71
UNITED STATES (50.34%*) 1,158,734 45.48841,146 Alliant Energy 25,938 1.02
1,954,267 American Electric Power 104,861 4.121,248,173 American Tower REIT** 131,608 5.17
63,712 Crown Castle International REIT** 4,879 0.19923,743 CSX 35,179 1.38
1,832,462 Dominion Energy 107,485 4.223,666,892 Enterprise Products Partners 75,690 2.971,552,173 Eversource Energy 71,577 2.812,328,730 Great Plains Energy 54,545 2.14
264,569 Kansas City Southern 20,786 0.827,630,592 Kinder Morgan 118,552 4.65
959,880 NextEra Energy 106,103 4.161,498,441 NiSource 29,754 1.171,984,893 PG&E 102,027 4.001,268,022 Plains All American Pipeline 25,604 1.00
99,530 SBA Communications REIT** 10,431 0.41660,324 UGI 25,348 0.99271,143 Union Pacific 21,338 0.84
2,421,376 Xcel Energy 87,029 3.42
CANADA (5.20%*) 173,114 6.794,651,259 Enbridge 145,258 5.702,035,100 Hydro One 27,856 1.09
FRANCE (3.37%*) 105,613 4.158,035,032 Groupe Eurotunnel 67,421 2.65
562,061 Vinci 38,192 1.50
GERMANY (1.78%*) - -
ITALY (1.81%*) 133,016 5.225,367,282 Atlantia 123,458 4.851,963,556 Infrastrutture Wireless Italiane 9,558 0.37
SPAIN (6.49%*) 76,108 2.982,429,689 Abertis Infraestructuras 36,285 1.42
268,111 Aena 39,823 1.56
JAPAN (6.30%*) 233,476 9.16380,200 Central Japan Railway 46,464 1.82
1,621,600 East Japan Railway 115,598 4.542,464,000 Kamigumi 20,070 0.79
16,884,000 Osaka Gas 51,344 2.01
AUSTRALIA (5.64%*) 116,651 4.5816,861,337 Transurban Group 116,651 4.58
CHINA (5.77%*) 119,377 4.6815,838,000 China Merchants Port Holdings 37,933 1.4930,162,000 COSCO SHIPPING Ports 28,101 1.1048,560,000 Jiangsu Expressway 'H' Shares 53,343 2.09
HONG KONG (2.27%*) 54,303 2.137,191,500 Power Assets Holdings 54,303 2.13
First State Global Listed Infrastructure Fund
as at 31 July 2017
Portfolio Statement
355
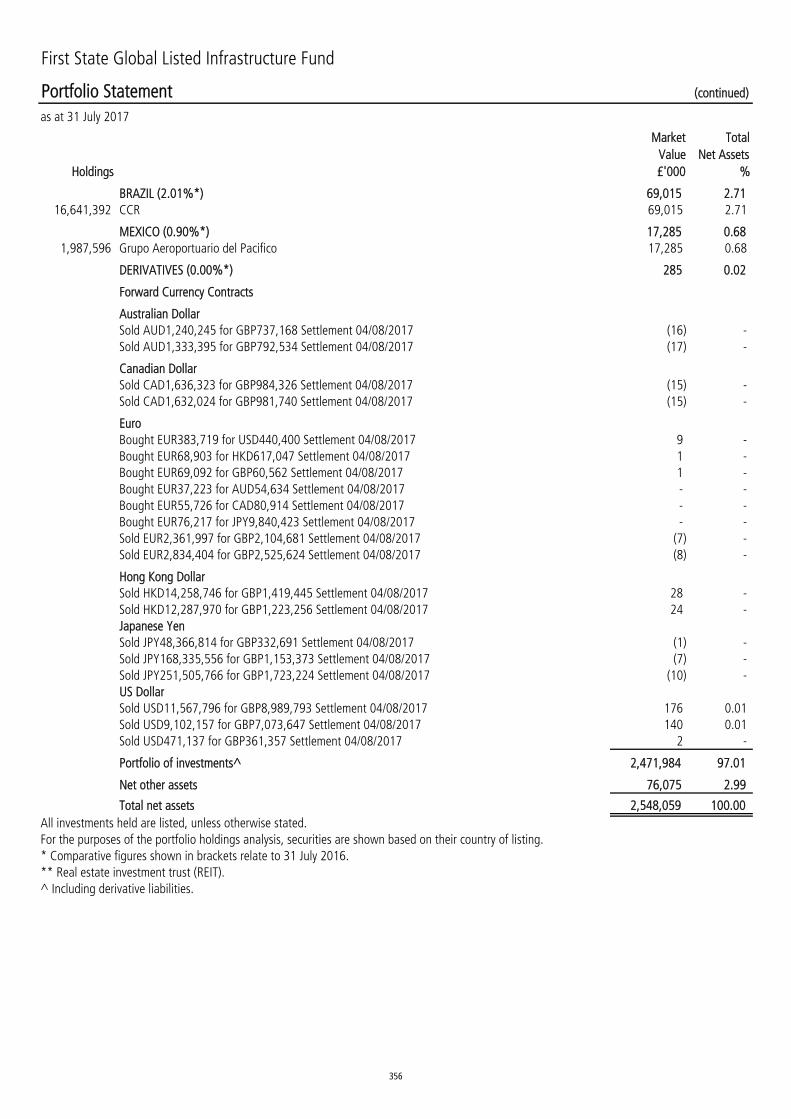
Holdings
MarketValue£'000
TotalNet Assets
%
First State Global Listed Infrastructure Fund
as at 31 July 2017
(continued)Portfolio Statement
BRAZIL (2.01%*) 69,015 2.7116,641,392 CCR 69,015 2.71
MEXICO (0.90%*) 17,285 0.681,987,596 Grupo Aeroportuario del Pacifico 17,285 0.68
DERIVATIVES (0.00%*) 285 0.02
Forward Currency Contracts
Australian DollarSold AUD1,240,245 for GBP737,168 Settlement 04/08/2017 (16) -Sold AUD1,333,395 for GBP792,534 Settlement 04/08/2017 (17) -
Canadian DollarSold CAD1,636,323 for GBP984,326 Settlement 04/08/2017 (15) -Sold CAD1,632,024 for GBP981,740 Settlement 04/08/2017 (15) -
EuroBought EUR383,719 for USD440,400 Settlement 04/08/2017 9 -Bought EUR68,903 for HKD617,047 Settlement 04/08/2017 1 -Bought EUR69,092 for GBP60,562 Settlement 04/08/2017 1 -Bought EUR37,223 for AUD54,634 Settlement 04/08/2017 - -Bought EUR55,726 for CAD80,914 Settlement 04/08/2017 - -Bought EUR76,217 for JPY9,840,423 Settlement 04/08/2017 - -Sold EUR2,361,997 for GBP2,104,681 Settlement 04/08/2017 (7) -Sold EUR2,834,404 for GBP2,525,624 Settlement 04/08/2017 (8) -
Hong Kong DollarSold HKD14,258,746 for GBP1,419,445 Settlement 04/08/2017 28 -Sold HKD12,287,970 for GBP1,223,256 Settlement 04/08/2017 24 -Japanese YenSold JPY48,366,814 for GBP332,691 Settlement 04/08/2017 (1) -Sold JPY168,335,556 for GBP1,153,373 Settlement 04/08/2017 (7) -Sold JPY251,505,766 for GBP1,723,224 Settlement 04/08/2017 (10) -US DollarSold USD11,567,796 for GBP8,989,793 Settlement 04/08/2017 176 0.01Sold USD9,102,157 for GBP7,073,647 Settlement 04/08/2017 140 0.01Sold USD471,137 for GBP361,357 Settlement 04/08/2017 2 -
Portfolio of investments^ 2,471,984 97.01
Net other assets 76,075 2.99
Total net assets 2,548,059 100.00
* Comparative figures shown in brackets relate to 31 July 2016.
All investments held are listed, unless otherwise stated.For the purposes of the portfolio holdings analysis, securities are shown based on their country of listing.
^ Including derivative liabilities.** Real estate investment trust (REIT).
356

Share class A Accumulation
Change in net assets per share
Opening net asset value per share
Return before operating charges*
Operating charges
Return after operating charges*
Distributions
Retained distributions on accumulation shares
Closing net asset value per share (p)
* after direct transaction costs of:
Performance
Return after charges (%)
Other information
Closing net asset value (£’000)
Closing number of shares
Operating charges
Direct transaction costs
Prices
Highest share price
Lowest share price
First State Global Listed Infrastructure Fund
Comparative Tablefor the year ended 31 July 2017
Net Asset Value and Ongoing Charges Figure
Final 31 July 2017(p)
Final 31 July 2016(p)
Final 31 July 2015(p)
31.31 56.35 17.12
(3.80) (2.93) (2.77)
227.93 174.51 160.16
255.44 227.93 174.51
0.77 0.54 0.51
6.75 5.23 4.80
27.51 53.42 14.35
(6.75) (5.23) (4.80)
1.58% 1.59% 1.59%
173,153 141,578 132,234
67,785,263 62,115,286 75,775,544
12.07% 30.61% 8.96%
218.28 161.93 155.45
0.32% 0.30% 0.29%
263.83 230.06 191.51
357

First State Global Listed Infrastructure Fund
Comparative Table (continued)
for the year ended 31 July 2017
Net Asset Value and Ongoing Charges Figure
Share class A Income
Change in net assets per share
Opening net asset value per share
Return before operating charges*
Operating charges
Return after operating charges*
Distributions
Closing net asset value per share (p)
* after direct transaction costs of:
Performance
Return after charges (%)
Other information
Closing net asset value (£’000)
Closing number of shares
Operating charges
Direct transaction costs
Prices
Highest share price
Lowest share price
Final 31 July 2017(p)
Final 31 July 2016(p)
Final 31 July 2015(p)
23.50 43.26 13.75
(2.86) (2.25) (2.20)
172.69 135.72 127.98
188.25 172.69 135.72
0.58 0.42 0.40
20.64 41.01 11.55
(5.08) (4.04) (3.81)
1.58% 1.59% 1.59%
39,301 40,198 40,463
20,877,067 23,277,110 29,813,221
11.95% 30.22% 9.02%
165.38 125.92 124.21
0.32% 0.30% 0.29%
197.44 176.56 151.35
358
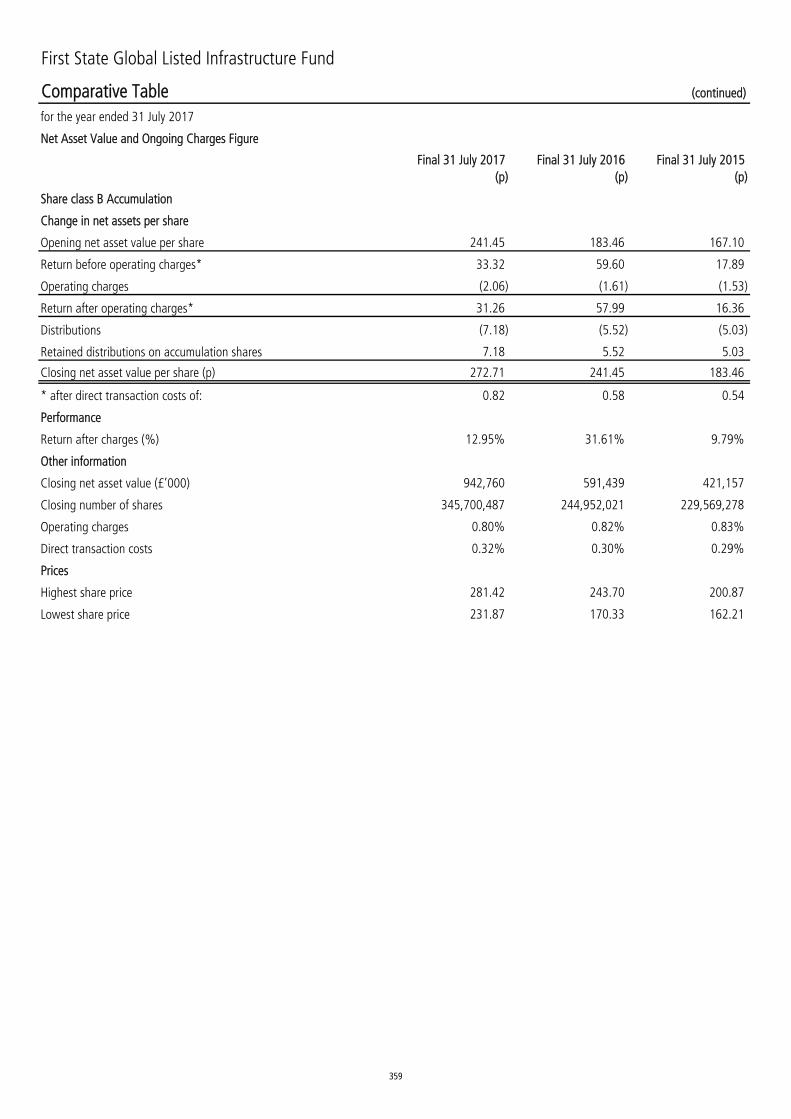
First State Global Listed Infrastructure Fund
Comparative Table (continued)
for the year ended 31 July 2017
Net Asset Value and Ongoing Charges Figure
Share class B Accumulation
Change in net assets per share
Opening net asset value per share
Return before operating charges*
Operating charges
Return after operating charges*
Distributions
Retained distributions on accumulation shares
Closing net asset value per share (p)
* after direct transaction costs of:
Performance
Return after charges (%)
Other information
Closing net asset value (£’000)
Closing number of shares
Operating charges
Direct transaction costs
Prices
Highest share price
Lowest share price
Final 31 July 2017(p)
Final 31 July 2016(p)
Final 31 July 2015(p)
33.32 59.60 17.89
(2.06) (1.61) (1.53)
241.45 183.46 167.10
272.71 241.45 183.46
0.82 0.58 0.54
7.18 5.52 5.03
31.26 57.99 16.36
(7.18) (5.52) (5.03)
0.80% 0.82% 0.83%
942,760 591,439 421,157
345,700,487 244,952,021 229,569,278
12.95% 31.61% 9.79%
231.87 170.33 162.21
0.32% 0.30% 0.29%
281.42 243.70 200.87
359

First State Global Listed Infrastructure Fund
Comparative Table (continued)
for the year ended 31 July 2017
Net Asset Value and Ongoing Charges Figure
Share class B Income
Change in net assets per share
Opening net asset value per share
Return before operating charges*
Operating charges
Return after operating charges*
Distributions
Closing net asset value per share (p)
* after direct transaction costs of:
Performance
Return after charges (%)
Other information
Closing net asset value (£’000)
Closing number of shares
Operating charges
Direct transaction costs
Prices
Highest share price
Lowest share price
Final 31 July 2017(p)
Final 31 July 2016(p)
Final 31 July 2015(p)
25.16 46.05 14.44
(1.58) (1.25) (1.20)
184.08 143.57 134.35
202.23 184.08 143.57
0.62 0.45 0.43
23.58 44.80 13.24
(5.43) (4.29) (4.02)
0.81% 0.82% 0.82%
524,577 403,656 329,257
259,394,583 219,282,133 229,334,741
12.81% 31.20% 9.85%
176.77 133.28 130.41
0.32% 0.30% 0.29%
211.92 188.18 159.72
360
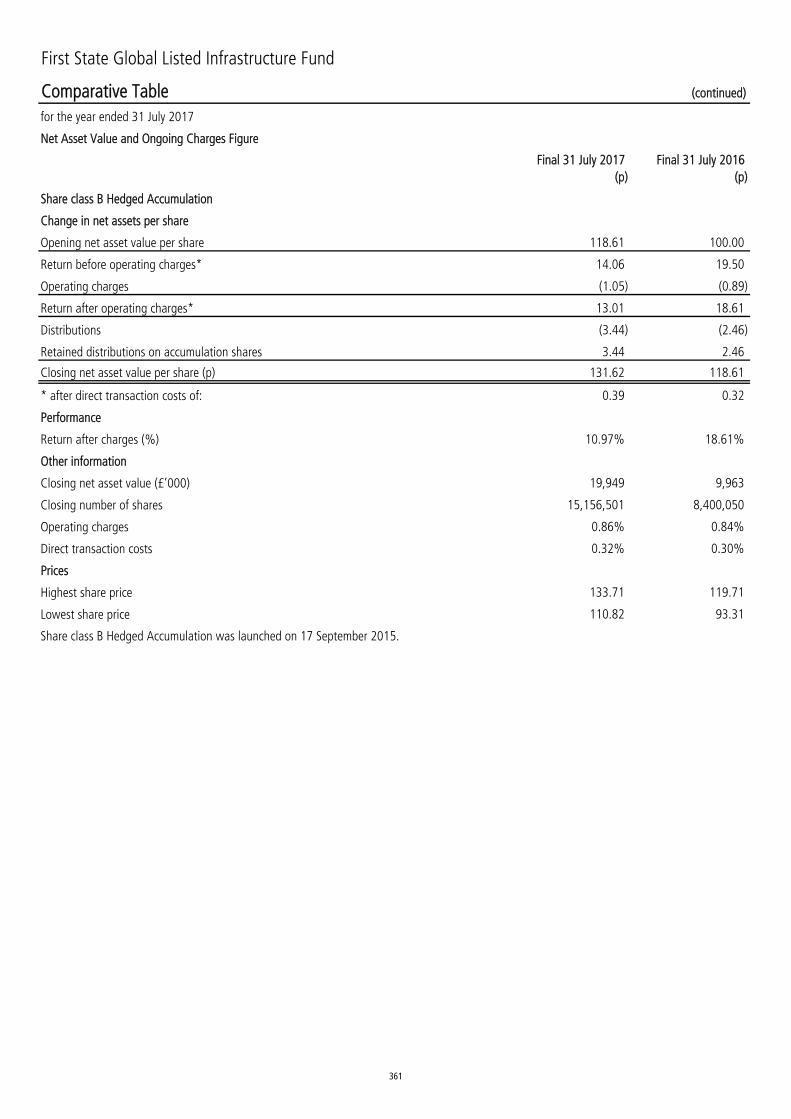
First State Global Listed Infrastructure Fund
Comparative Table (continued)
for the year ended 31 July 2017
Net Asset Value and Ongoing Charges Figure
Share class B Hedged Accumulation
Change in net assets per share
Opening net asset value per share
Return before operating charges*
Operating charges
Return after operating charges*
Distributions
Retained distributions on accumulation shares
Closing net asset value per share (p)
* after direct transaction costs of:
Performance
Return after charges (%)
Other information
Closing net asset value (£’000)
Closing number of shares
Operating charges
Direct transaction costs
Prices
Highest share price
Lowest share price
Final 31 July 2017(p)
Final 31 July 2016(p)
14.06 19.50
(1.05) (0.89)
118.61 100.00
131.62 118.61
0.39 0.32
3.44 2.46
13.01 18.61
(3.44) (2.46)
0.86% 0.84%
19,949 9,963
15,156,501 8,400,050
10.97% 18.61%
Share class B Hedged Accumulation was launched on 17 September 2015.
110.82 93.31
0.32% 0.30%
133.71 119.71
361
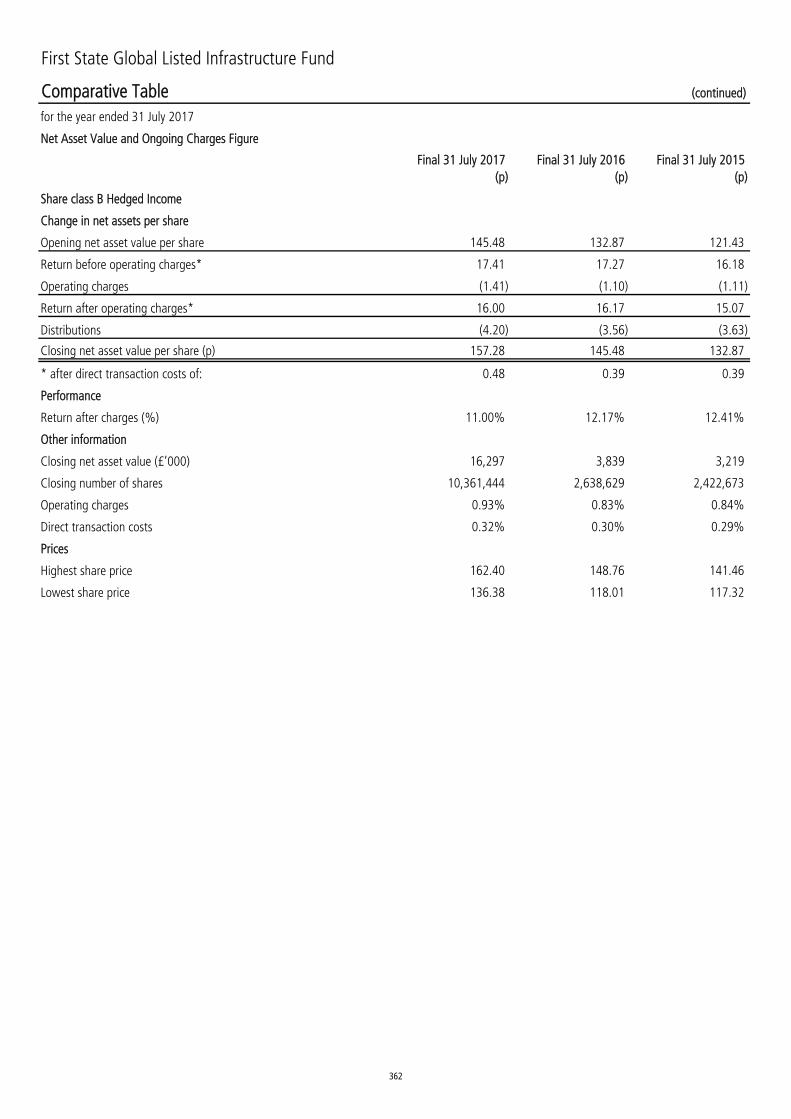
First State Global Listed Infrastructure Fund
Comparative Table (continued)
for the year ended 31 July 2017
Net Asset Value and Ongoing Charges Figure
Share class B Hedged Income
Change in net assets per share
Opening net asset value per share
Return before operating charges*
Operating charges
Return after operating charges*
Distributions
Closing net asset value per share (p)
* after direct transaction costs of:
Performance
Return after charges (%)
Other information
Closing net asset value (£’000)
Closing number of shares
Operating charges
Direct transaction costs
Prices
Highest share price
Lowest share price
Final 31 July 2017(p)
Final 31 July 2016(p)
Final 31 July 2015(p)
17.41 17.27 16.18
(1.41) (1.10) (1.11)
145.48 132.87 121.43
157.28 145.48 132.87
0.48 0.39 0.39
16.00 16.17 15.07
(4.20) (3.56) (3.63)
0.93% 0.83% 0.84%
16,297 3,839 3,219
10,361,444 2,638,629 2,422,673
11.00% 12.17% 12.41%
136.38 118.01 117.32
0.32% 0.30% 0.29%
162.40 148.76 141.46
362

First State Global Listed Infrastructure Fund
Comparative Table (continued)
for the year ended 31 July 2017
Net Asset Value and Ongoing Charges Figure
Share class A Accumulation (EUR share class)
Change in net assets per share
Opening net asset value per share
Return before operating charges*
Operating charges
Return after operating charges*
Distributions
Retained distributions on accumulation shares
Closing net asset value per share (c)
* after direct transaction costs of:
Performance
Return after charges (%)
Other information
Closing net asset value (€’000)
Closing number of shares
Operating charges
Direct transaction costs
Prices
Highest share price
Lowest share price
Final 31 July 2017(c)
Final 31 July 2016(c)
Final 31 July 2015(c)
14.85 19.98 36.84
(3.23) (2.88) (2.69)
202.26 185.16 151.01
213.88 202.26 185.16
0.67 0.55 0.51
5.73 4.86 4.95
11.62 17.10 34.15
(5.73) (4.86) (4.95)
1.54% 1.55% 1.55%
166,769 113,042 55,007
77,972,841 55,890,085 29,706,790
5.75% 9.24% 22.61%
191.62 161.66 145.85
0.32% 0.30% 0.29%
224.35 205.69 198.62
363

First State Global Listed Infrastructure Fund
Comparative Table (continued)
for the year ended 31 July 2017
Net Asset Value and Ongoing Charges Figure
Share class A Income (EUR share class)
Change in net assets per share
Opening net asset value per share
Return before operating charges*
Operating charges
Return after operating charges*
Distributions
Closing net asset value per share (c)
* after direct transaction costs of:
Performance
Return after charges (%)
Other information
Closing net asset value (€’000)
Closing number of shares
Operating charges
Direct transaction costs
Prices
Highest share price
Lowest share price
Final 31 July 2017(c)
Final 31 July 2016(c)
Final 31 July 2015(c)
11.30 15.41 29.85
(2.56) (2.32) (2.21)
155.42 146.15 122.50
159.79 155.42 146.15
0.51 0.43 0.41
8.74 13.09 27.64
(4.37) (3.82) (3.99)
1.59% 1.59% 1.58%
26,712 6,227 8,085
16,716,928 4,007,115 5,531,568
5.62% 8.96% 22.56%
147.24 127.50 118.31
0.32% 0.30% 0.29%
170.20 160.09 159.31
364

First State Global Listed Infrastructure Fund
Comparative Table (continued)
for the year ended 31 July 2017
Net Asset Value and Ongoing Charges Figure
Share class B Accumulation (EUR share class)
Change in net assets per share
Opening net asset value per share
Return before operating charges*
Operating charges
Return after operating charges*
Distributions
Retained distributions on accumulation shares
Closing net asset value per share (c)
* after direct transaction costs of:
Performance
Return after charges (%)
Other information
Closing net asset value (€’000)
Closing number of shares
Operating charges
Direct transaction costs
Prices
Highest share price
Lowest share price
Final 31 July 2017(c)
Final 31 July 2016(c)
Final 31 July 2015(c)
15.45 20.68 37.75
(1.68) (1.47) (1.39)
209.84 190.63 154.27
223.61 209.84 190.63
0.69 0.56 0.52
5.98 5.02 5.08
13.77 19.21 36.36
(5.98) (5.02) (5.08)
0.78% 0.78% 0.78%
448,066 365,949 293,216
200,378,497 174,391,752 153,807,256
6.56% 10.08% 23.57%
199.25 167.05 149.03
0.32% 0.30% 0.29%
234.36 213.40 204.02
365

First State Global Listed Infrastructure Fund
Comparative Table (continued)
for the year ended 31 July 2017
Net Asset Value and Ongoing Charges Figure
Share class B Income (EUR share class)
Change in net assets per share
Opening net asset value per share
Return before operating charges*
Operating charges
Return after operating charges*
Distributions
Closing net asset value per share (c)
* after direct transaction costs of:
Performance
Return after charges (%)
Other information
Closing net asset value (€’000)
Closing number of shares
Operating charges
Direct transaction costs
Prices
Highest share price
Lowest share price
Final 31 July 2017(c)
Final 31 July 2016(c)
Final 31 July 2015(c)
12.29 16.65 31.83
(1.37) (1.19) (1.16)
168.24 156.88 130.48
174.41 168.24 156.88
0.56 0.45 0.43
10.92 15.46 30.67
(4.75) (4.10) (4.27)
0.78% 0.78% 0.78%
208,181 1,832 1,870
119,360,748 1,089,324 1,191,340
6.49% 9.85% 23.51%
159.75 137.48 126.06
0.32% 0.30% 0.29%
185.61 173.28 170.60
366
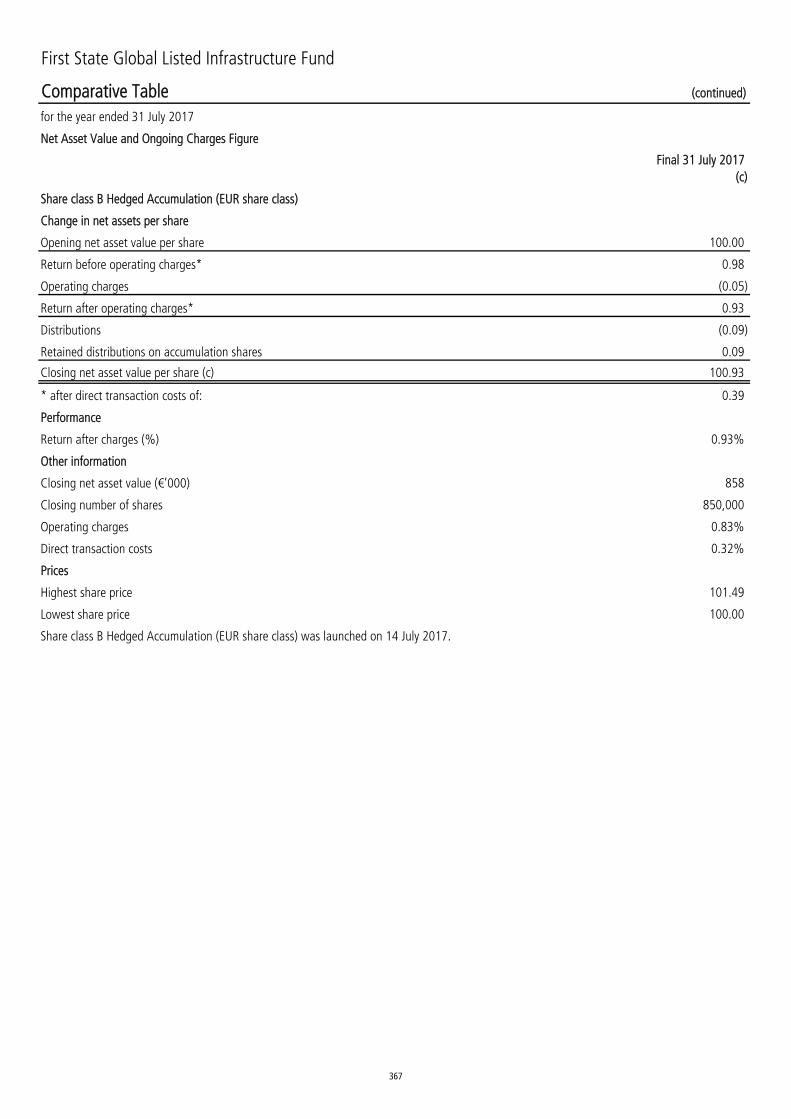
First State Global Listed Infrastructure Fund
Comparative Table (continued)
for the year ended 31 July 2017
Net Asset Value and Ongoing Charges Figure
Share class B Hedged Accumulation (EUR share class)
Change in net assets per share
Opening net asset value per share
Return before operating charges*
Operating charges
Return after operating charges*
Distributions
Retained distributions on accumulation shares
Closing net asset value per share (c)
* after direct transaction costs of:
Performance
Return after charges (%)
Other information
Closing net asset value (€’000)
Closing number of shares
Operating charges
Direct transaction costs
Prices
Highest share price
Lowest share price
Final 31 July 2017(c)
100.00
0.98
858
850,000
100.00
Share class B Hedged Accumulation (EUR share class) was launched on 14 July 2017.
0.83%
0.32%
101.49
(0.05)
0.93
(0.09)
0.09
100.93
0.39
0.93%
367

First State Global Listed Infrastructure Fund
Comparative Table (continued)
for the year ended 31 July 2017
Net Asset Value and Ongoing Charges Figure
Share class B Accumulation (USD share class)
Change in net assets per share
Opening net asset value per share
Return before operating charges*
Operating charges
Return after operating charges*
Distributions
Retained distributions on accumulation shares
Closing net asset value per share (c)
* after direct transaction costs of:
Performance
Return after charges (%)
Other information
Closing net asset value ($’000)
Closing number of shares
Operating charges
Direct transaction costs
Prices
Highest share price
Lowest share price
150.72 135.29 133.54
Final 31 July 2017(c)
Final 31 July 2016(c)
Final 31 July 2015(c)
(4.37) (3.58) (3.66)
4.37 3.58 3.66
20.06 16.54 2.83
(1.20) (1.11) (1.08)
18.86 15.43 1.75
0.30% 0.29%
93,995 61,902 11,965
55,431,185 41,072,320 8,844,839
169.58 150.72 135.29
0.49 0.42 0.39
12.51% 11.41% 1.31%
170.05 151.56 142.63
138.91 117.77 125.85
0.78% 0.78% 0.80%
0.32%
368

Notes £'000 £'000 £'000 £'000
Net capital gains 2 228,418 347,104
Revenue 3 69,201 40,979
4 (19,839) (11,687)
Interest payable and similar charges (78) (22)
49,284 29,270
5 (7,037) (4,778)
42,247 24,492
270,665 371,596
6 (60,945) (35,661)
209,720 335,935
£'000 £'000 £'000 £'000
1,648,342 1,186,497
1,007,533 314,865
(364,694) (214,862)
642,839 100,003
806 63
209,720 335,935
46,352 25,844
2,548,059 1,648,342
First State Global Listed Infrastructure Fund
Statement of Total Returnfor the year ended 31 July 2017
Total return before distributions
Change in net assets attributable to shareholders from investment activities
31 July 2017
Income
Retained distribution on accumulation shares
Change in net assets attributable to shareholders from investment activities
31 July 2016
Net revenue before taxation
Net revenue after taxation
Statement of Change in Net Assets Attributable to Shareholders
Taxation
Distributions
Expenses
for the year ended 31 July 2017
31 July 2016
Opening net assets attributable to shareholders
31 July 2017
Dilution adjustment
Less: Amounts payable on cancellation of shares
Amounts receivable on issue of shares
Closing net assets attributable to shareholders
Notes to the Financial Statements are on pages 371 to 376.
369
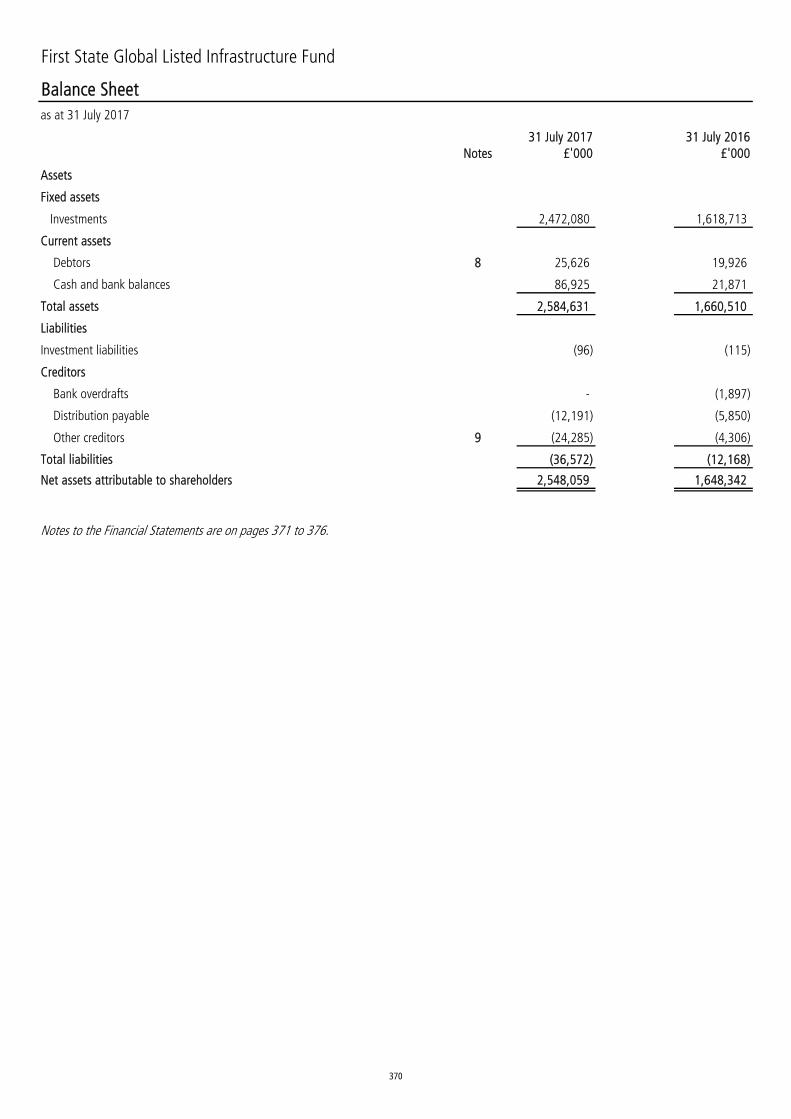
First State Global Listed Infrastructure Fund
31 July 2017 31 July 2016Notes £'000 £'000
Investments 2,472,080 1,618,713
Current assets
8 25,626 19,926
86,925 21,871
2,584,631 1,660,510
(96) (115)
Creditors
- (1,897)
(12,191) (5,850)
Other creditors 9 (24,285) (4,306)
(36,572) (12,168)
2,548,059 1,648,342
Notes to the Financial Statements are on pages 371 to 376.
Fixed assets
Total assets
Investment liabilities
Liabilities
Debtors
Assets
Net assets attributable to shareholders
Bank overdrafts
Distribution payable
Cash and bank balances
Total liabilities
Balance Sheetas at 31 July 2017
370

1.
2.
31 July 2017 31 July 2016£'000 £'000
229,883 348,050(1,842) (1,992)
377 1,046
228,418 347,104
3.
31 July 2017 31 July 2016£'000 £'0007,232 4,8118,943 2,882
49,488 32,3113,528 828
6 41- 1254 (19)
69,201 40,979
4.
31 July 2017 31 July 2016£'000 £'000
18,743 10,921
301 155
14 12538 473147 90
96 36
795 611
19,839 11,687
Currency gains
Safe custody charges
Payable to the Depositary, associates of the Depositary, and agents of either of them:
Currency hedge gains/losses
Depositary's fees
Audit fee
Total revenue
Interest on capital revenue from Brazilian companiesInterest from bank deposits
ACD's periodic charge
Total expenses
Other expenses
Registrar fees
Other expenses:
Payable to the ACD, associates of the ACD, and agents of either of them:
Please see pages 9 to 11 for accounting basis and policies.
Net capital gains
The net capital gains during the year comprise:
Non-derivative securities
First State Global Listed Infrastructure Fund
Notes to the Financial Statements
Accounting basis and policies
as at 31 July 2017
Forward foreign exchange currency contracts
Net capital gains
Revenue
Expenses
Dividends from UK companies
Overseas non-taxable revenueProperty revenue from overseas REITs
Overseas taxable revenue
371
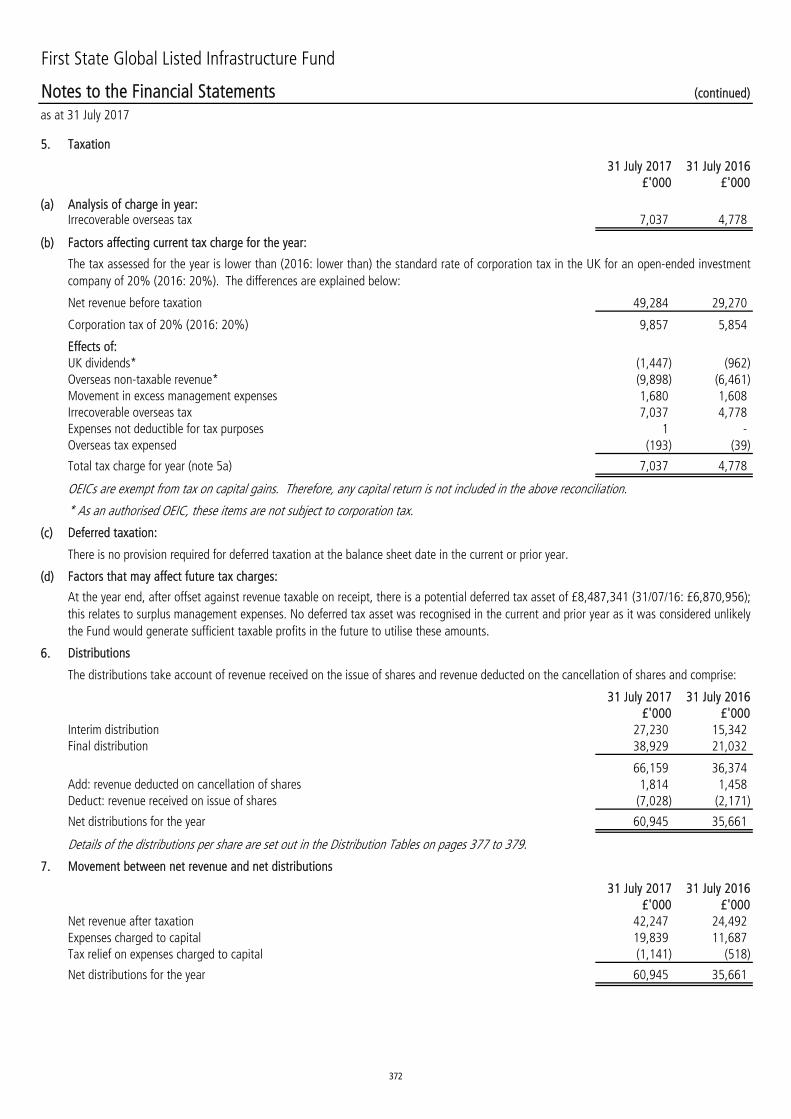
First State Global Listed Infrastructure Fund
(continued)Notes to the Financial Statementsas at 31 July 2017
5.
31 July 2017 31 July 2016£'000 £'000
(a)7,037 4,778
(b)
49,284 29,270
9,857 5,854
(1,447) (962)(9,898) (6,461)1,680 1,6087,037 4,778
1 -(193) (39)
7,037 4,778
(c)
(d)
6.
31 July 2017 31 July 2016£'000 £'000
27,230 15,34238,929 21,032
66,159 36,3741,814 1,458
(7,028) (2,171)
60,945 35,661
7.
31 July 2017 31 July 2016£'000 £'000
42,247 24,492Expenses charged to capital 19,839 11,687Tax relief on expenses charged to capital (1,141) (518)
60,945 35,661
Net revenue after taxation
Corporation tax of 20% (2016: 20%)
Effects of:
Overseas non-taxable revenue*UK dividends*
Total tax charge for year (note 5a)
Deferred taxation:
* As an authorised OEIC, these items are not subject to corporation tax.
The distributions take account of revenue received on the issue of shares and revenue deducted on the cancellation of shares and comprise:
Analysis of charge in year:
Taxation
Net revenue before taxation
Irrecoverable overseas tax
The tax assessed for the year is lower than (2016: lower than) the standard rate of corporation tax in the UK for an open-ended investmentcompany of 20% (2016: 20%). The differences are explained below:
Factors affecting current tax charge for the year:
There is no provision required for deferred taxation at the balance sheet date in the current or prior year.
At the year end, after offset against revenue taxable on receipt, there is a potential deferred tax asset of £8,487,341 (31/07/16: £6,870,956);this relates to surplus management expenses. No deferred tax asset was recognised in the current and prior year as it was considered unlikelythe Fund would generate sufficient taxable profits in the future to utilise these amounts.
Factors that may affect future tax charges:
Net distributions for the year
Details of the distributions per share are set out in the Distribution Tables on pages 377 to 379.
Net distributions for the year
Deduct: revenue received on issue of shares
Final distribution
Add: revenue deducted on cancellation of shares
OEICs are exempt from tax on capital gains. Therefore, any capital return is not included in the above reconciliation.
Overseas tax expensed
Irrecoverable overseas taxExpenses not deductible for tax purposes
Movement in excess management expenses
Interim distribution
Movement between net revenue and net distributions
Distributions
372
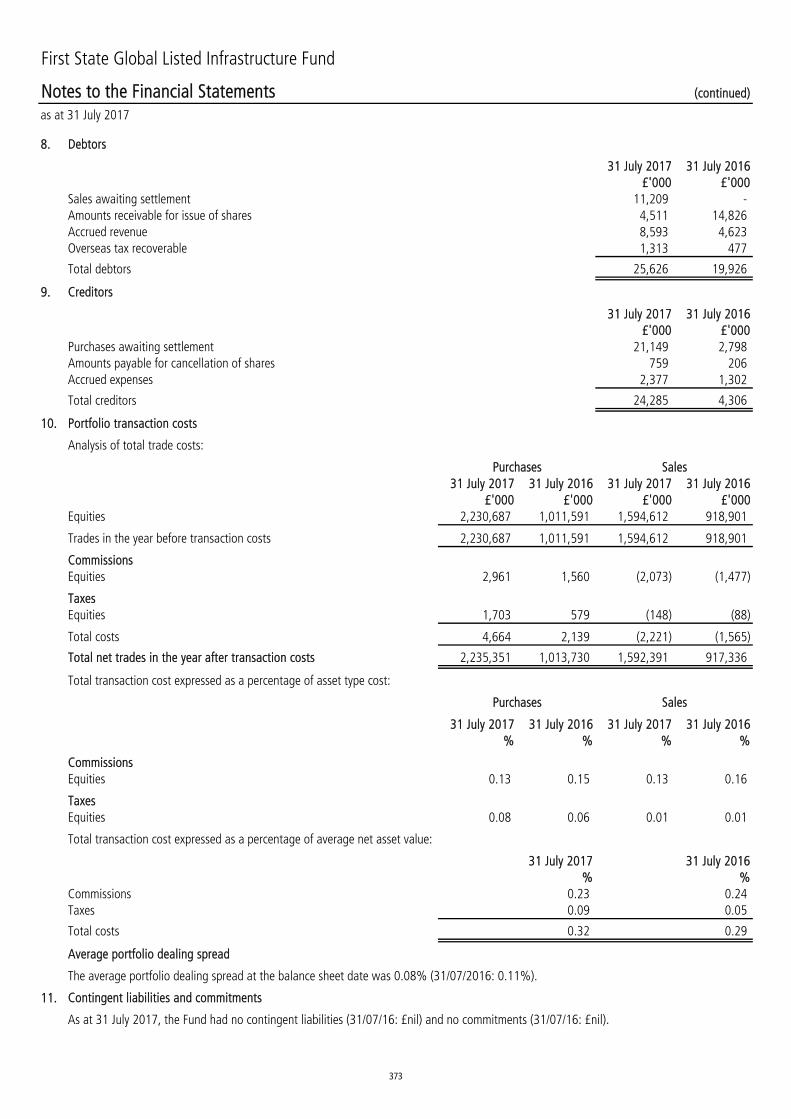
First State Global Listed Infrastructure Fund
(continued)Notes to the Financial Statementsas at 31 July 2017
8.
31 July 2017 31 July 2016£'000 £'000
11,209 -4,511 14,8268,593 4,6231,313 477
25,626 19,926
9.
31 July 2017 31 July 2016£'000 £'000
21,149 2,798759 206
2,377 1,302
24,285 4,306
10.
31 July 2017 31 July 2016 31 July 2017 31 July 2016£'000 £'000 £'000 £'000
2,230,687 1,011,591 1,594,612 918,901
2,230,687 1,011,591 1,594,612 918,901
2,961 1,560 (2,073) (1,477)
1,703 579 (148) (88)
4,664 2,139 (2,221) (1,565)
2,235,351 1,013,730 1,592,391 917,336
31 July 2017 31 July 2016 31 July 2017 31 July 2016% % % %
0.13 0.15 0.13 0.16
0.08 0.06 0.01 0.01
11.
Purchases
Commissions 0.23
Sales awaiting settlement
Debtors
Accrued revenueAmounts receivable for issue of shares
Contingent liabilities and commitments
Analysis of total trade costs:
Total debtors
Overseas tax recoverable
Accrued expenses
Equities
Taxes
Equities
Equities
Total transaction cost expressed as a percentage of asset type cost:
Purchases Sales
CommissionsEquities
Total creditors
Portfolio transaction costs
Total costs
Purchases awaiting settlement
Trades in the year before transaction costs
Creditors
Amounts payable for cancellation of shares
Sales
0.29
The average portfolio dealing spread at the balance sheet date was 0.08% (31/07/2016: 0.11%).
31 July 2016% %
Commissions
Taxes
Total net trades in the year after transaction costs
Equities
Average portfolio dealing spread
As at 31 July 2017, the Fund had no contingent liabilities (31/07/16: £nil) and no commitments (31/07/16: £nil).
0.32
31 July 2017
Total transaction cost expressed as a percentage of average net asset value:
0.05
Total costs
0.090.24
Taxes
373
First State Global Listed Infrastructure Fund
(continued)Notes to the Financial Statementsas at 31 July 2017
12.
(a)
(b)
As exposure to interest-rate risk is not significant, no additional numerical or sensitivity analysis is presented.
General
Fair value of financial assets and financial liabilities
The market value of investments is taken to equal ‘fair value’ for the purposes of Financial Reporting Standard 102. Given all the activities ofthe Fund, none of the investments held fall within the definition of ‘investments held for trading’ as set out in Financial Reporting Standard13.
There is no material difference between the value of the financial assets and liabilities, as shown in the Balance Sheet, and their fair value.
Interest-rate risk
As at 31 July 2017, 3.41% (31/07/2016: 1.21%) of the Fund's assets were interest-bearing.
The Fund does not invest in either fixed or floating-rate securities, and interest-rate risk exposure is restricted to interest receivable on bankdeposits or payable on bank overdraft positions that will be affected by fluctuations in interest rates.
If market prices increase or decrease by 10%, then the impact on the portfolio will be an increase or decrease of 10% (£247,169,891)(31/07/16: £161,870,597).
In pursuing its investment objectives, the Fund holds equity shares.
The main risk arising from the Fund’s financial instruments is market-price risk. Market-price risk arises mainly from uncertainty about futureprices of the financial instruments held. Investment risk in the portfolio is regularly reviewed and controlled through the adoption ofparameters limiting exposures to various factors such as industries, countries, and company size.
The Fund has little exposure to credit or cash-flow risk. Certain transactions in securities that the Fund enters into expose it to the risk thatthe counter-party will not deliver the investment (purchase) or cash (sale) after the Fund has fulfilled its responsibilities. The Fund only buysand sells investments through brokers that have been approved by the Authorised Corporate Director as an acceptable counter-party. This listis reviewed quarterly. The Fund’s assets comprise mainly realisable securities that can be readily sold in normal market conditions.
The Fund’s main liability is the redemption of any shares that investors wish to sell. In general, the ACD manages the cash to ensure that itcan meet its liabilities. Assets from a Fund may need to be sold if insufficient cash is available to finance such redemptions. The Fund’sholdings are reviewed on a regular basis, with particular emphasis on the market capitalisation of the issuer (securities issued by largercapitalised companies generally have greater liquidity) and the number of days it would take to trade out of a given securities position orpercentage of the Fund as a whole (determined by reference to available market trading volumes). Funds that have a higher concentration ofsecurities that are deemed to be less liquid are regularly monitored.
As a proportion of the Fund’s investment portfolio is invested in overseas securities, the Balance Sheet can be affected by movements inforeign exchange rates. The Investment Manager may seek to manage exposure to currency movements by using forward foreign exchangecontracts or by hedging the sterling value of investments that are priced in other currencies. Income received in other currencies is convertedto sterling on or near the date of receipt.
Derivatives and other financial instruments
374
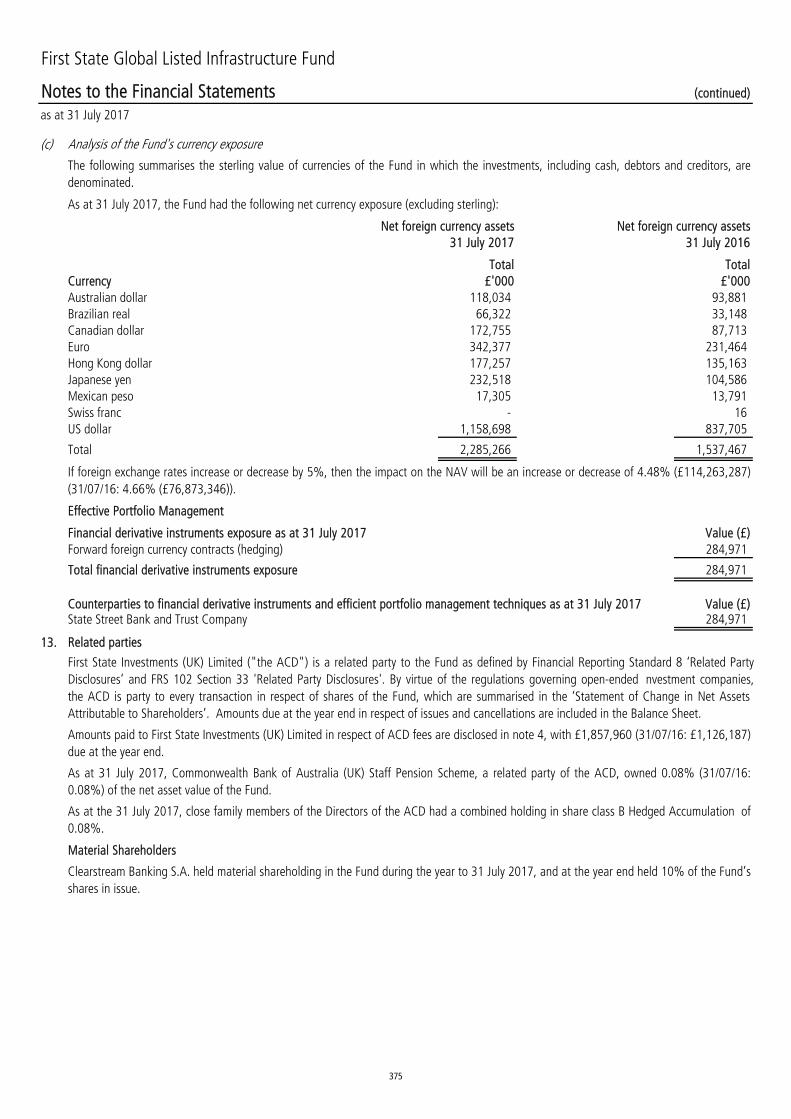
First State Global Listed Infrastructure Fund
(continued)Notes to the Financial Statementsas at 31 July 2017
(c)
Total TotalCurrency £'000 £'000Australian dollar 118,034 93,881Brazilian real 66,322 33,148Canadian dollar 172,755 87,713Euro 342,377 231,464Hong Kong dollar 177,257 135,163Japanese yen 232,518 104,586Mexican peso 17,305 13,791Swiss franc - 16US dollar 1,158,698 837,705
Total 2,285,266 1,537,467
Financial derivative instruments exposure as at 31 July 2017 Value (£)Forward foreign currency contracts (hedging) 284,971
Total financial derivative instruments exposure 284,971
Value (£)State Street Bank and Trust Company 284,971
13.
Amounts paid to First State Investments (UK) Limited in respect of ACD fees are disclosed in note 4, with £1,857,960 (31/07/16: £1,126,187)due at the year end.
As at 31 July 2017, Commonwealth Bank of Australia (UK) Staff Pension Scheme, a related party of the ACD, owned 0.08% (31/07/16:0.08%) of the net asset value of the Fund.
Net foreign currency assets
The following summarises the sterling value of currencies of the Fund in which the investments, including cash, debtors and creditors, aredenominated.
If foreign exchange rates increase or decrease by 5%, then the impact on the NAV will be an increase or decrease of 4.48% (£114,263,287)(31/07/16: 4.66% (£76,873,346)).
31 July 201631 July 2017
As at 31 July 2017, the Fund had the following net currency exposure (excluding sterling):
Effective Portfolio Management
Material Shareholders
As at the 31 July 2017, close family members of the Directors of the ACD had a combined holding in share class B Hedged Accumulation of0.08%.
Counterparties to financial derivative instruments and efficient portfolio management techniques as at 31 July 2017
Analysis of the Fund's currency exposure
Related parties
Clearstream Banking S.A. held material shareholding in the Fund during the year to 31 July 2017, and at the year end held 10% of the Fund’sshares in issue.
Net foreign currency assets
First State Investments (UK) Limited ("the ACD") is a related party to the Fund as defined by Financial Reporting Standard 8 ‘Related Party Disclosures’ and FRS 102 Section 33 'Related Party Disclosures'. By virtue of the regulations governing open-ended investment companies, the ACD is party to every transaction in respect of shares of the Fund, which are summarised in the ‘Statement of Change in Net Assets Attributable to Shareholders’. Amounts due at the year end in respect of issues and cancellations are included in the Balance Sheet.
375

First State Global Listed Infrastructure Fund
(continued)Notes to the Financial Statementsas at 31 July 2017
14.
%1.501.500.750.750.750.751.501.500.750.750.750.75
31 July 2016 31 July 2017
Opening shares in issue Creations Cancellations
Shares converted
Closing shares in issue
62,115,286 18,598,236 (11,474,192) (1,454,067) 67,785,26323,277,110 2,527,200 (3,942,953) (984,290) 20,877,067
244,952,021 118,577,007 (18,633,619) 805,078 345,700,487219,282,133 53,999,341 (15,262,090) 1,375,199 259,394,583
8,400,050 6,662,818 (351,998) 445,631 15,156,5012,638,629 8,373,994 (660,330) 9,151 10,361,444
55,890,085 40,141,466 (18,046,973) (11,737) 77,972,8414,007,115 13,502,532 (792,719) - 16,716,928
174,391,752 126,209,692 (100,234,190) 11,243 200,378,4971,089,324 127,206,795 (8,935,371) - 119,360,748
- 850,000 - - 850,00041,072,320 26,994,690 (12,635,825) - 55,431,185
15.
Assets Liabilities Assets Liabilities
£'000 £'000 £'000 £'0002,471,699 - 1,618,706 -
381 (96) 7 (115)- - - -
2,472,080 (96) 1,618,713 (115)
The Fund has twelve share classes in issue.
Share class B Hedged Accumulation (EUR share class):
The net asset value of each share class, the net asset value per share and the number of shares in each class are given in the ComparativeTable on pages 357 to 368.
Share class B Accumulation (EUR share class) (Institutional):
The distributions per share class are given in the Distribution Tables on pages 377 to 379.
Share class A Accumulation (EUR share class) (Retail):
Share class B Accumulation (Institutional):
Share class B Hedged Accumulation (Institutional):Share class B Hedged Income:
Share class A Accumulation (Retail):
Share class B Accumulation (USD share class) (Institutional):
The ACD's periodic charge on each share class is as follows:
Share class B Income (Institutional):
Share class B Income (EUR share class) (Institutional):
Share class A Income (Retail):
Share class A Income (EUR share class) (Retail):
Share classes
Reconciliation of the shares movement in the year:
Share class A Accumulation (Retail)Share class A Income (Retail)
Share class A Accumulation (EUR share class) (Retail)Share class A Income (EUR share class) (Retail)Share class B Accumulation (EUR share class) (Institutional)Share class B Income (EUR share class) (Institutional)Share class B Hedged Accumulation (EUR share class)
All share classes have the same rights on winding up.
Level 3: inputs are unobservable (i.e. market data is unavailable) for the asset or liability. Over the Counter (OTC) derivatives (including equityswaps) are held at fair value, which is determined by valuation techniques or single broker quotes.
Level 1Level 2Level 3
Total fair value
Fair value
Valuation technique
31 July 2017 31 July 2016
Level 1: the unadjusted quoted price in an active market for identical assets or liabilities that the entity can access at the measurement date. Level 2: inputs other than quoted prices included within Level 1 that are observable (i.e. developed using market data) for the asset or liability,either directly or indirectly.
Share class B Accumulation (USD share class) (Institutional)
Share class B Accumulation (Institutional)Share class B Income (Institutional)Share class B Hedged Accumulation (Institutional)Share class B Hedged Income
376
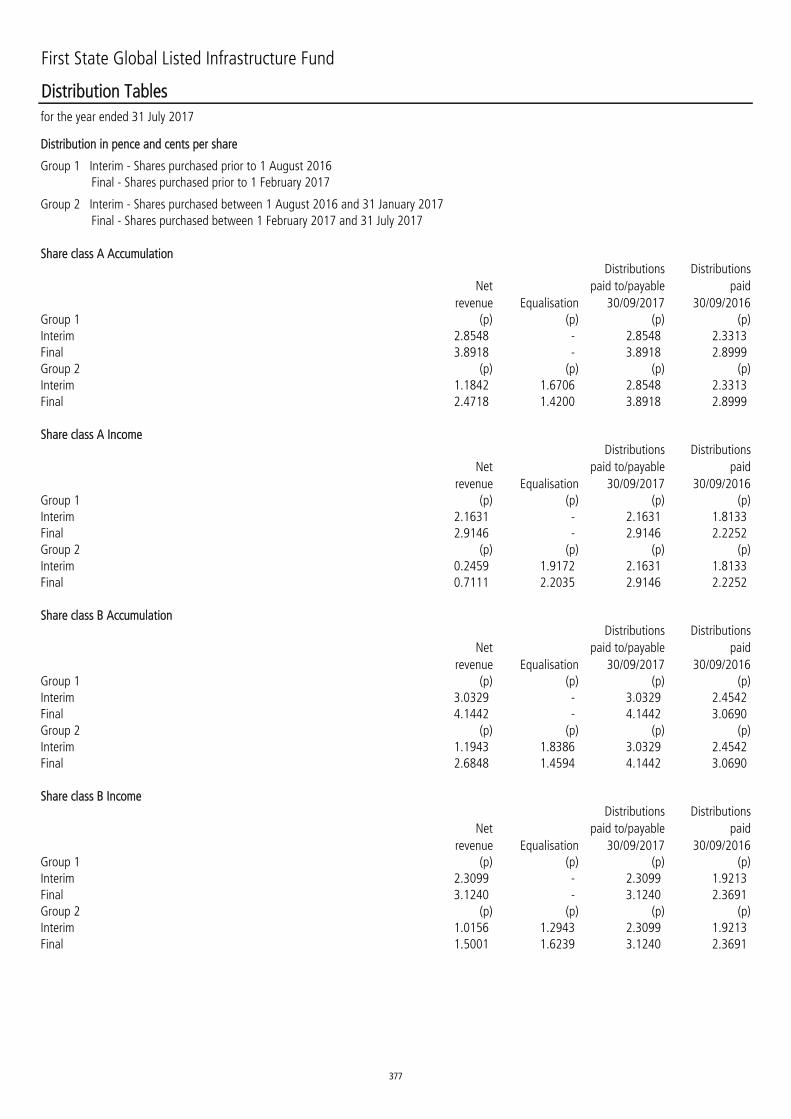
Share class A Accumulation
Netrevenue Equalisation
Distributions paid to/payable
30/09/2017
Distributions paid
30/09/2016Group 1 (p) (p) (p) (p)Interim 2.8548 - 2.8548 2.3313Final 3.8918 - 3.8918 2.8999Group 2 (p) (p) (p) (p)Interim 1.1842 1.6706 2.8548 2.3313Final 2.4718 1.4200 3.8918 2.8999
Share class A Income
Netrevenue Equalisation
Distributions paid to/payable
30/09/2017
Distributions paid
30/09/2016Group 1 (p) (p) (p) (p)Interim 2.1631 - 2.1631 1.8133Final 2.9146 - 2.9146 2.2252Group 2 (p) (p) (p) (p)Interim 0.2459 1.9172 2.1631 1.8133Final 0.7111 2.2035 2.9146 2.2252
Share class B Accumulation
Netrevenue Equalisation
Distributions paid to/payable
30/09/2017
Distributions paid
30/09/2016Group 1 (p) (p) (p) (p)Interim 3.0329 - 3.0329 2.4542Final 4.1442 - 4.1442 3.0690Group 2 (p) (p) (p) (p)Interim 1.1943 1.8386 3.0329 2.4542Final 2.6848 1.4594 4.1442 3.0690
Share class B Income
Netrevenue Equalisation
Distributions paid to/payable
30/09/2017
Distributions paid
30/09/2016Group 1 (p) (p) (p) (p)Interim 2.3099 - 2.3099 1.9213Final 3.1240 - 3.1240 2.3691Group 2 (p) (p) (p) (p)Interim 1.0156 1.2943 2.3099 1.9213Final 1.5001 1.6239 3.1240 2.3691
First State Global Listed Infrastructure Fund
Distribution Tablesfor the year ended 31 July 2017
Group 1 Interim - Shares purchased prior to 1 August 2016
Distribution in pence and cents per share
Group 2 Interim - Shares purchased between 1 August 2016 and 31 January 2017
Final - Shares purchased prior to 1 February 2017
Final - Shares purchased between 1 February 2017 and 31 July 2017
377

First State Global Listed Infrastructure Fund
Distribution Tables (continued)
for the year ended 31 July 2017
Share class B Hedged Accumulation
Netrevenue Equalisation
Distributions paid to/payable
30/09/2017
Distributions paid
30/09/2016Group 1 (p) (p) (p) (p)Interim 1.4306 - 1.4306 0.9404Final 2.0122 - 2.0122 1.5200Group 2 (p) (p) (p) (p)Interim 0.4921 0.9385 1.4306 0.9404Final 1.1375 0.8747 2.0122 1.5200
Share class B Hedged Income
Netrevenue Equalisation
Distributions paid to/payable
30/09/2017
Distributions paid
30/09/2016Group 1 (p) (p) (p) (p)Interim 1.7636 - 1.7636 1.6749Final 2.4336 - 2.4336 1.8897Group 2 (p) (p) (p) (p)Interim 0.8260 0.9376 1.7636 1.6749Final 1.6835 0.7501 2.4336 1.8897
Share class A Accumulation (EUR share class)
Netrevenue Equalisation
Distributions paid to/payable
30/09/2017
Distributions paid
30/09/2016Group 1 (c) (c) (c) (c)Interim 2.4789 - 2.4789 2.2882Final 3.2544 - 3.2544 2.5759Group 2 (c) (c) (c) (c)Interim 0.8319 1.6470 2.4789 2.2882Final 1.6082 1.6462 3.2544 2.5759
Share class A Income (EUR share class)
Netrevenue Equalisation
Distributions paid to/payable
30/09/2017
Distributions paid
30/09/2016Group 1 (c) (c) (c) (c)Interim 1.9108 - 1.9108 1.8116Final 2.4616 - 2.4616 2.0040Group 2 (c) (c) (c) (c)Interim 0.6715 1.2393 1.9108 1.8116Final 1.5656 0.8960 2.4616 2.0040
Share class B Accumulation (EUR share class)
Netrevenue Equalisation
Distributions paid to/payable
30/09/2017
Distributions paid
30/09/2016Group 1 (c) (c) (c) (c)Interim 2.5724 - 2.5724 2.3566Final 3.4110 - 3.4110 2.6676Group 2 (c) (c) (c) (c)Interim 1.4574 1.1150 2.5724 2.3566Final 1.7349 1.6761 3.4110 2.6676
378
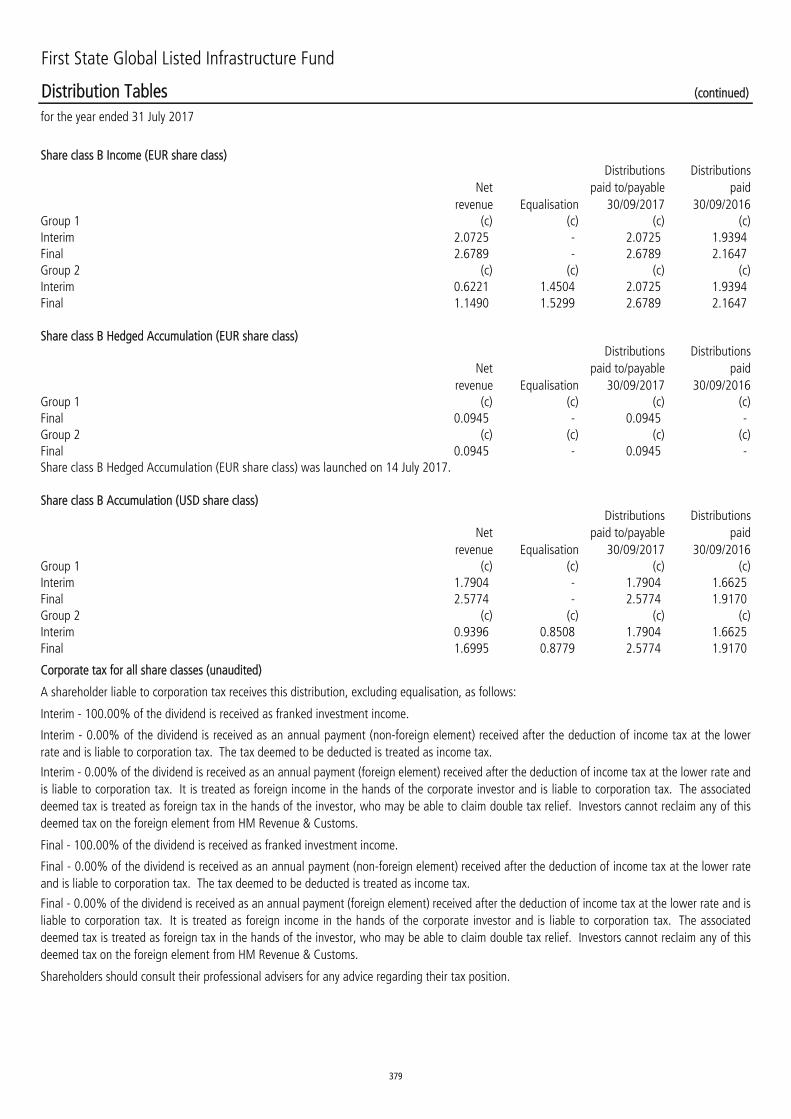
First State Global Listed Infrastructure Fund
Distribution Tables (continued)
for the year ended 31 July 2017
Share class B Income (EUR share class)
Netrevenue Equalisation
Distributions paid to/payable
30/09/2017
Distributions paid
30/09/2016Group 1 (c) (c) (c) (c)Interim 2.0725 - 2.0725 1.9394Final 2.6789 - 2.6789 2.1647Group 2 (c) (c) (c) (c)Interim 0.6221 1.4504 2.0725 1.9394Final 1.1490 1.5299 2.6789 2.1647
Share class B Hedged Accumulation (EUR share class)
Netrevenue Equalisation
Distributions paid to/payable
30/09/2017
Distributions paid
30/09/2016Group 1 (c) (c) (c) (c)Final 0.0945 - 0.0945 -Group 2 (c) (c) (c) (c)Final 0.0945 - 0.0945 -
Share class B Accumulation (USD share class)
Netrevenue Equalisation
Distributions paid to/payable
30/09/2017
Distributions paid
30/09/2016Group 1 (c) (c) (c) (c)Interim 1.7904 - 1.7904 1.6625Final 2.5774 - 2.5774 1.9170Group 2 (c) (c) (c) (c)Interim 0.9396 0.8508 1.7904 1.6625Final 1.6995 0.8779 2.5774 1.9170
Share class B Hedged Accumulation (EUR share class) was launched on 14 July 2017.
Corporate tax for all share classes (unaudited)
A shareholder liable to corporation tax receives this distribution, excluding equalisation, as follows:
Interim - 100.00% of the dividend is received as franked investment income.
Interim - 0.00% of the dividend is received as an annual payment (non-foreign element) received after the deduction of income tax at the lowerrate and is liable to corporation tax. The tax deemed to be deducted is treated as income tax.
Interim - 0.00% of the dividend is received as an annual payment (foreign element) received after the deduction of income tax at the lower rate andis liable to corporation tax. It is treated as foreign income in the hands of the corporate investor and is liable to corporation tax. The associateddeemed tax is treated as foreign tax in the hands of the investor, who may be able to claim double tax relief. Investors cannot reclaim any of thisdeemed tax on the foreign element from HM Revenue & Customs.
Shareholders should consult their professional advisers for any advice regarding their tax position.
Final - 100.00% of the dividend is received as franked investment income.
Final - 0.00% of the dividend is received as an annual payment (non-foreign element) received after the deduction of income tax at the lower rateand is liable to corporation tax. The tax deemed to be deducted is treated as income tax.
Final - 0.00% of the dividend is received as an annual payment (foreign element) received after the deduction of income tax at the lower rate and isliable to corporation tax. It is treated as foreign income in the hands of the corporate investor and is liable to corporation tax. The associateddeemed tax is treated as foreign tax in the hands of the investor, who may be able to claim double tax relief. Investors cannot reclaim any of thisdeemed tax on the foreign element from HM Revenue & Customs.
379

Risks and reward profile
Lower Risk Higher Risk
Potentially Lower Rewards Potentially Higher Rewards
1 2 3 4 5 6 7
1 2 3 4 5 6 7
1 2 3 4 5 6 7
1 2 3 4 5 6 7
Portfolio changes
Significant purchases over the year included America Movil (Mexico: Telecom Services), which was attractively valued given its diversified cashflows. The Fund also bought FEMSA (Mexico: Consumer Staples), a well-run company that has a positive track record in managing brandfranchises, and Valid (Brazil: Industrials), a franchise run by a long-serving management team that has managed to weather technological changesin the past.
The Fund sold Sonae Sierra Brasil (Brazil: Financials), one of the more illiquid companies in Brazil, on questions about the strength of its franchiseand SQM (Chile: Materials) as the company was expensive, having rallied strongly, with governance improvements priced in. The Fund also soldEntel (Chile: Telecom Services) on franchise concerns.
Performance
The Fund rose by 14.5% in sterling terms over the year and has provided cumulative returns of 41.0% and 26.8% over three and five yearsrespectively to 31 July 2017.
Quinenco (Chile: Industrials) gained on the back of positive results, mainly from Banco de Chile and Cia Cervecerias Unidas. Antofagasta (Chile:Materials) rose on increasing copper prices and strong results as production was ahead of expectations. M. Dias Branco (Brazil: Consumer Staples)climbed as increased prices, greater efficiencies, higher volumes and low wheat prices benefitted earnings.
On the negative side, Natura Cosmeticos (Brazil: Consumer Staples) declined as it experienced a difficult environment with the evolution of itsbusiness model, changes in management and a subdued consumer. Duratex (Brazil: Materials) was weak because of the difficult trading conditionsin Brazil, and Mahle-Metal Leve (Brazil: Consumer Discretionary) declined on market weakness as Brazilian President Michel Temer was chargedwith corruption.
For further information on risks, please refer to the Risk Factors section in the Company's prospectus.
Emerging market risk: emerging markets may not provide the same level of investor protection as a developed market; they may involve a higherrisk than investing in developed markets.
Concentration risk: the Fund invests in a relatively small number of companies or countries, which may be riskier than a Fund that invests in alarge number of companies or countries. Investing in a larger number of companies or countries helps spread risk.
• Even the lowest rating 1 does not mean a risk-free investment;
• On a scale of 1 (less risky) to 7 (more risky), this Fund has a rating of 6 due to its past performance and the nature of its investments. Shares witha rating of 6 might have higher risks, but also higher returns;
• Risk is taken in order to make a higher potential return; the more risk a Fund takes, the higher the potential return but the greater the risk ofloss; and
• The value of the Fund and its return is not guaranteed and may fall as well as rise. You may get back less than you originally invested.
The Fund might also experience the following risks:
• The synthetic risk reward indicator (the SRRI) rating is not a measure of the risk of you losing your investment but describes how much the valueof the Fund went up and down in the past;
• The SRRI rating is based on historical data, which may not be a reliable indication of the future risks and rewards of the Fund;
• We cannot guarantee that the rating of the Fund will remain the same; it may change over time;
Share class A Accumulation
Share class B Accumulation
Share class A Accumulation (EUR share class)
Share class B Accumulation (EUR share class)
The Fund aims to achieve long-term capital growth.
The Fund invests primarily in a diversified portfolio of equity and equity-related instruments of issuers established or having significant operations inLatin America and listed, traded or dealt in on regulated markets worldwide.
Stewart Investors Latin America Fund
Authorised Fund Manager's Reportfor the year ended 31 July 2017
Investment Objective and Policy
380
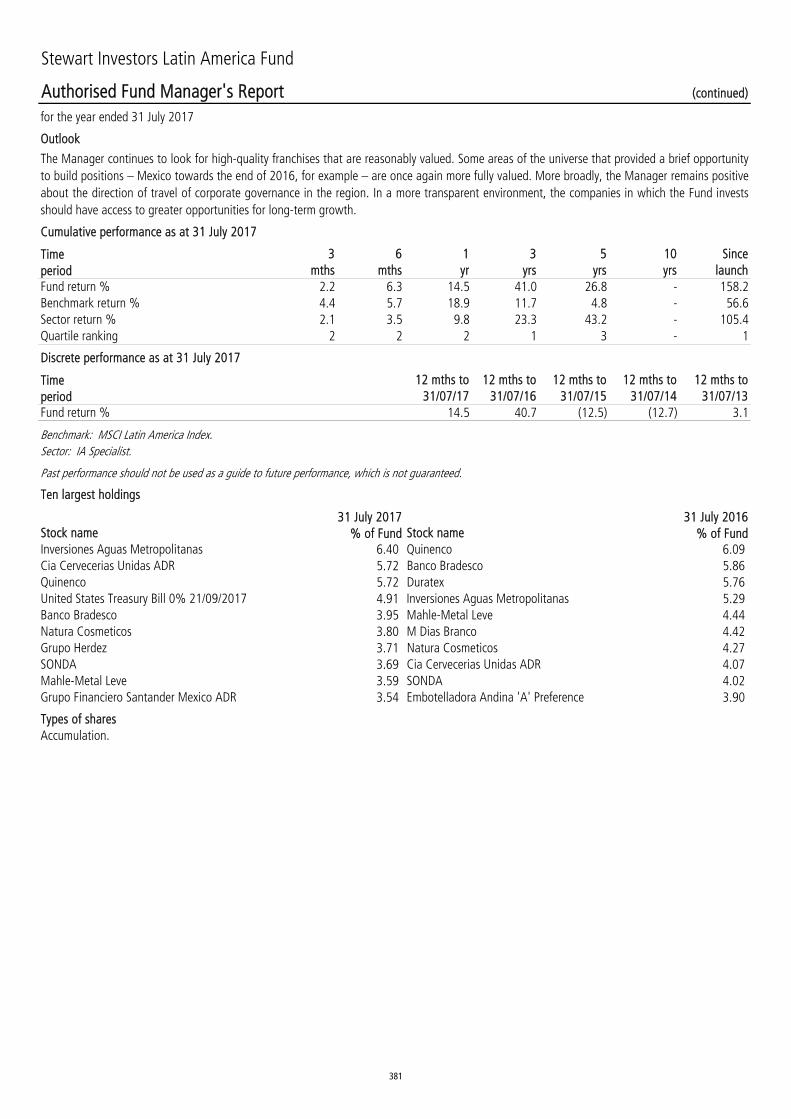
(continued)
Stewart Investors Latin America Fund
Authorised Fund Manager's Reportfor the year ended 31 July 2017
Time 3 6 1 3 5 10 Sinceperiod mths mths yr yrs yrs yrs launch
2.2 6.3 14.5 41.0 26.8 - 158.2 4.4 5.7 18.9 11.7 4.8 - 56.6 2.1 3.5 9.8 23.3 43.2 - 105.4
2 2 2 1 3 - 1
12 mths to 12 mths to 12 mths to 12 mths to 12 mths to31/07/17 31/07/16 31/07/15 31/07/14 31/07/13
14.5 40.7 (12.5) (12.7) 3.1
31 July 2017 31 July 2016% of Fund % of Fund
6.40 6.095.72 5.865.72 5.764.91 5.293.95 4.443.80 4.423.71 4.273.69 4.073.59 4.023.54 3.90
Types of sharesAccumulation.
SONDA Cia Cervecerias Unidas ADRMahle-Metal Leve SONDAGrupo Financiero Santander Mexico ADR Embotelladora Andina 'A' Preference
Banco Bradesco Mahle-Metal LeveNatura Cosmeticos M Dias BrancoGrupo Herdez Natura Cosmeticos
Cia Cervecerias Unidas ADR Banco BradescoQuinenco DuratexUnited States Treasury Bill 0% 21/09/2017 Inversiones Aguas Metropolitanas
Stock name Stock nameInversiones Aguas Metropolitanas Quinenco
Past performance should not be used as a guide to future performance, which is not guaranteed.
Ten largest holdings
TimeperiodFund return %
Benchmark: MSCI Latin America Index.Sector: IA Specialist.
Benchmark return %Sector return %Quartile ranking
Discrete performance as at 31 July 2017
Cumulative performance as at 31 July 2017
Fund return %
Outlook
The Manager continues to look for high-quality franchises that are reasonably valued. Some areas of the universe that provided a brief opportunityto build positions – Mexico towards the end of 2016, for example – are once again more fully valued. More broadly, the Manager remains positiveabout the direction of travel of corporate governance in the region. In a more transparent environment, the companies in which the Fund investsshould have access to greater opportunities for long-term growth.
381
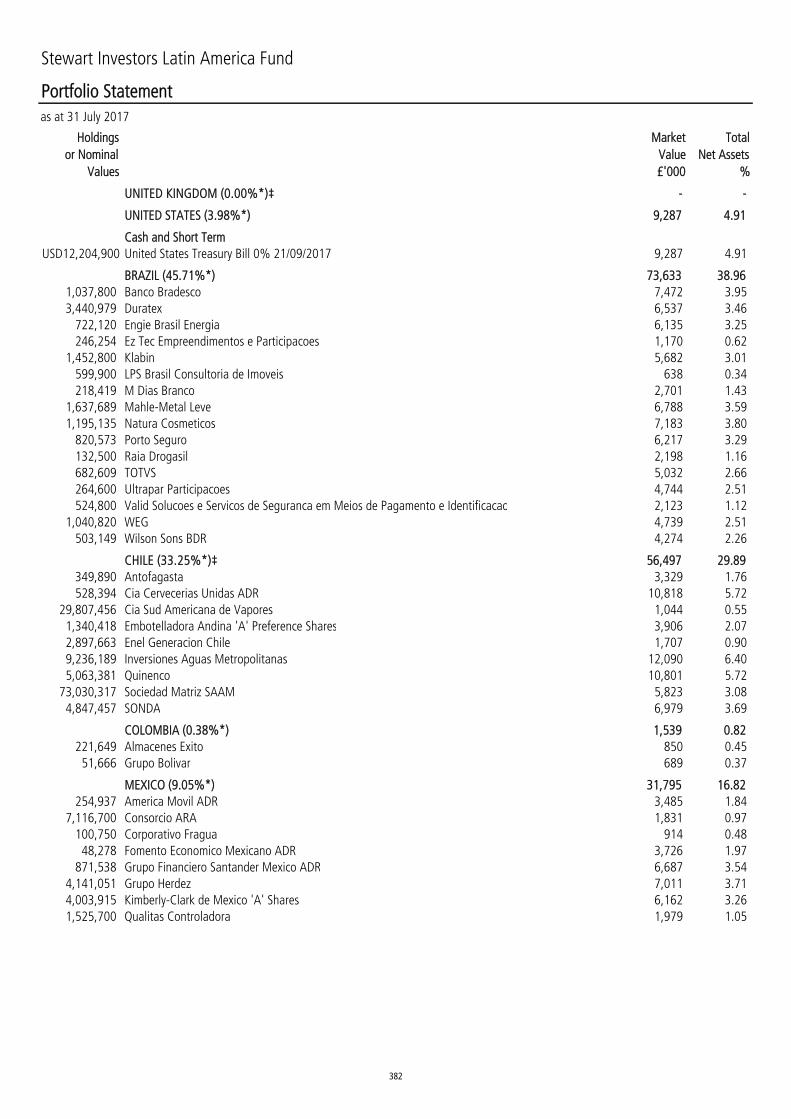
Holdingsor Nominal
Values
MarketValue£'000
TotalNet Assets
%
UNITED KINGDOM (0.00%*)‡ - -
UNITED STATES (3.98%*) 9,287 4.91
Cash and Short TermUSD12,204,900 United States Treasury Bill 0% 21/09/2017 9,287 4.91
BRAZIL (45.71%*) 73,633 38.961,037,800 Banco Bradesco 7,472 3.953,440,979 Duratex 6,537 3.46
722,120 Engie Brasil Energia 6,135 3.25246,254 Ez Tec Empreendimentos e Participacoes 1,170 0.62
1,452,800 Klabin 5,682 3.01599,900 LPS Brasil Consultoria de Imoveis 638 0.34218,419 M Dias Branco 2,701 1.43
1,637,689 Mahle-Metal Leve 6,788 3.591,195,135 Natura Cosmeticos 7,183 3.80
820,573 Porto Seguro 6,217 3.29132,500 Raia Drogasil 2,198 1.16682,609 TOTVS 5,032 2.66264,600 Ultrapar Participacoes 4,744 2.51524,800 Valid Solucoes e Servicos de Seguranca em Meios de Pagamento e Identificacao 2,123 1.12
1,040,820 WEG 4,739 2.51503,149 Wilson Sons BDR 4,274 2.26
CHILE (33.25%*)‡ 56,497 29.89349,890 Antofagasta 3,329 1.76528,394 Cia Cervecerias Unidas ADR 10,818 5.72
29,807,456 Cia Sud Americana de Vapores 1,044 0.551,340,418 Embotelladora Andina 'A' Preference Shares 3,906 2.072,897,663 Enel Generacion Chile 1,707 0.909,236,189 Inversiones Aguas Metropolitanas 12,090 6.405,063,381 Quinenco 10,801 5.72
73,030,317 Sociedad Matriz SAAM 5,823 3.084,847,457 SONDA 6,979 3.69
COLOMBIA (0.38%*) 1,539 0.82221,649 Almacenes Exito 850 0.45
51,666 Grupo Bolivar 689 0.37
MEXICO (9.05%*) 31,795 16.82254,937 America Movil ADR 3,485 1.84
7,116,700 Consorcio ARA 1,831 0.97100,750 Corporativo Fragua 914 0.48
48,278 Fomento Economico Mexicano ADR 3,726 1.97871,538 Grupo Financiero Santander Mexico ADR 6,687 3.54
4,141,051 Grupo Herdez 7,011 3.714,003,915 Kimberly-Clark de Mexico 'A' Shares 6,162 3.261,525,700 Qualitas Controladora 1,979 1.05
Stewart Investors Latin America Fund
Portfolio Statementas at 31 July 2017
382
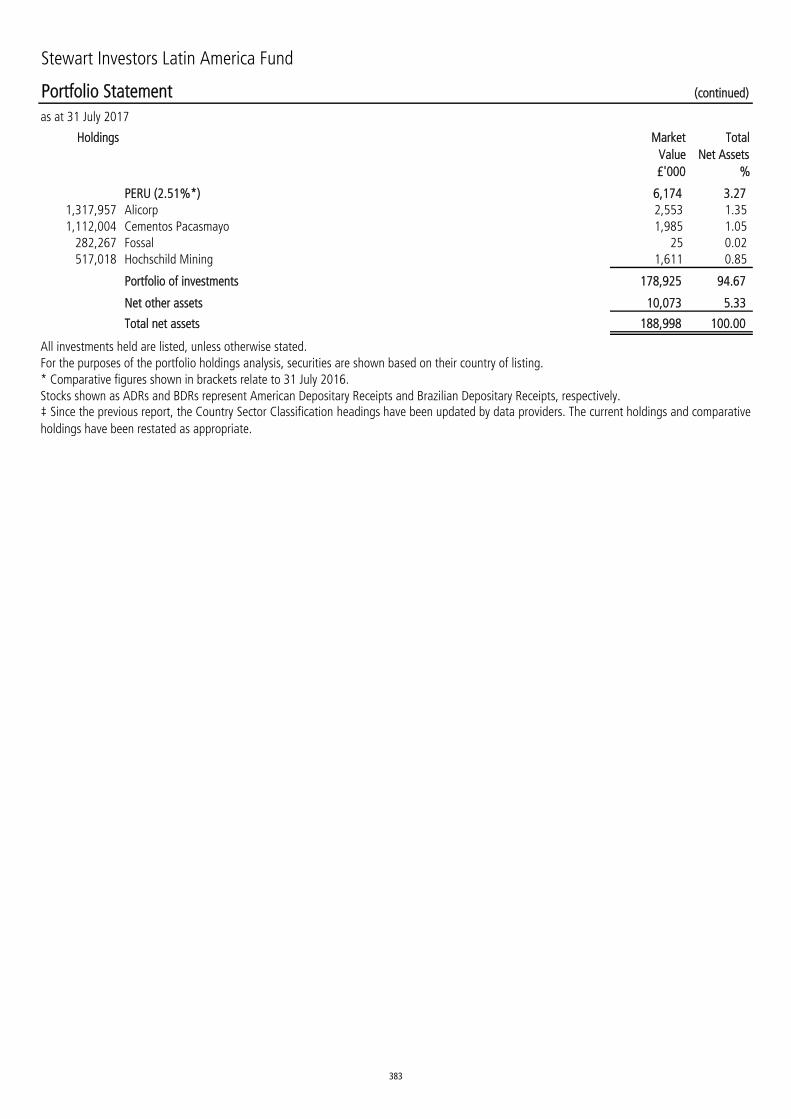
Holdings MarketValue£'000
TotalNet Assets
%
Stewart Investors Latin America Fund
Portfolio Statement (continued)
as at 31 July 2017
PERU (2.51%*) 6,174 3.271,317,957 Alicorp 2,553 1.351,112,004 Cementos Pacasmayo 1,985 1.05
282,267 Fossal 25 0.02517,018 Hochschild Mining 1,611 0.85
Portfolio of investments 178,925 94.67
Net other assets 10,073 5.33
Total net assets 188,998 100.00
‡ Since the previous report, the Country Sector Classification headings have been updated by data providers. The current holdings and comparativeholdings have been restated as appropriate.
Stocks shown as ADRs and BDRs represent American Depositary Receipts and Brazilian Depositary Receipts, respectively.
All investments held are listed, unless otherwise stated.
* Comparative figures shown in brackets relate to 31 July 2016.For the purposes of the portfolio holdings analysis, securities are shown based on their country of listing.
383

Share class A Accumulation
Change in net assets per share
Opening net asset value per share
Return before operating charges*
Operating charges
Return after operating charges*
Distributions
Retained distributions on accumulation shares
Closing net asset value per share (p)
* after direct transaction costs of:
Performance
Return after charges (%)
Other information
Closing net asset value (£’000)
Closing number of shares
Operating charges
Direct transaction costs
Prices
Highest share price
Lowest share price 216.31 142.92 160.26
0.06% 0.07% 0.21%
265.61 228.52 193.09
2.00% 2.06% 2.04%
14,607 14,631 17,123
5,671,016 6,507,755 10,722,169
14.56% 40.79% (12.46)%
257.57 224.83 159.69
0.14 0.12 0.38
1.01 0.37 1.19
32.74 65.14 (22.72)
(1.01) (0.37) (1.19)
37.63 68.58 (19.08)
(4.89) (3.44) (3.64)
224.83 159.69 182.41
Stewart Investors Latin America Fund
Comparative Tablefor the year ended 31 July 2017
Net Asset Value and Ongoing Charges Figure
Final 31 July 2017(p)
Final 31 July 2016(p)
Final 31 July 2015(p)
384
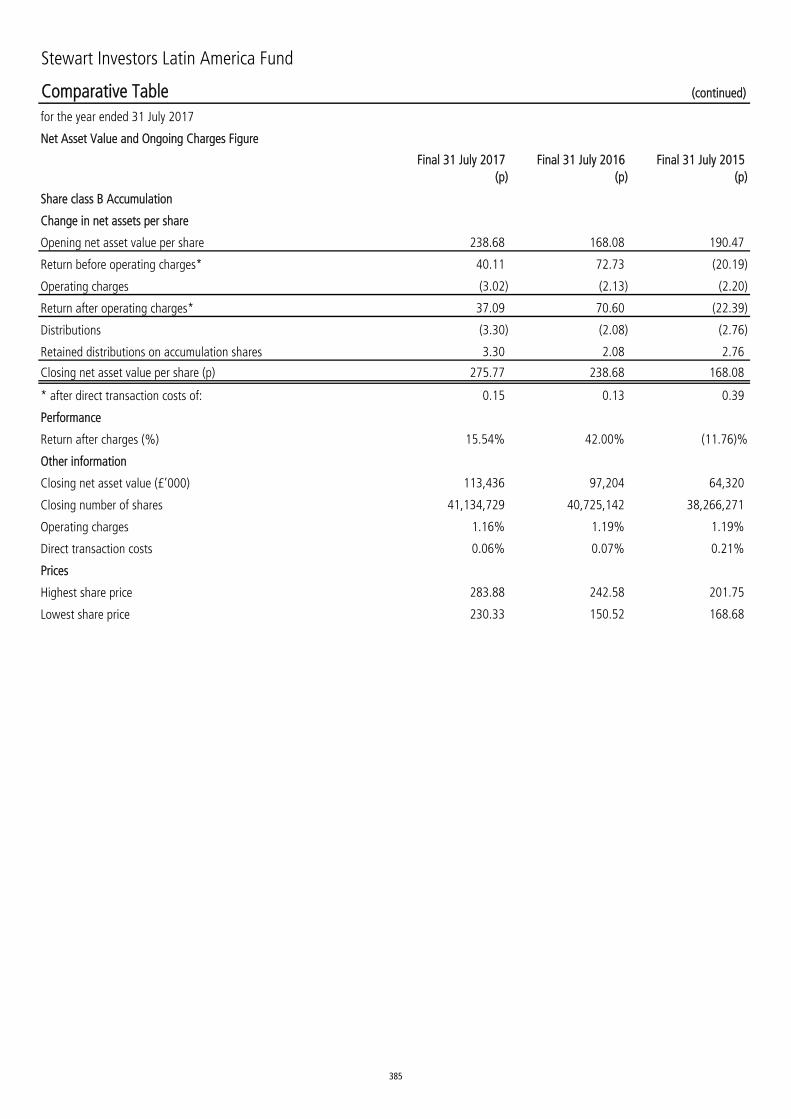
Stewart Investors Latin America Fund
Comparative Table (continued)
for the year ended 31 July 2017
Net Asset Value and Ongoing Charges Figure
Share class B Accumulation
Change in net assets per share
Opening net asset value per share
Return before operating charges*
Operating charges
Return after operating charges*
Distributions
Retained distributions on accumulation shares
Closing net asset value per share (p)
* after direct transaction costs of:
Performance
Return after charges (%)
Other information
Closing net asset value (£’000)
Closing number of shares
Operating charges
Direct transaction costs
Prices
Highest share price
Lowest share price 230.33 150.52 168.68
0.06% 0.07% 0.21%
283.88 242.58 201.75
1.16% 1.19% 1.19%
113,436 97,204 64,320
41,134,729 40,725,142 38,266,271
15.54% 42.00% (11.76)%
275.77 238.68 168.08
0.15 0.13 0.39
3.30 2.08 2.76
37.09 70.60 (22.39)
(3.30) (2.08) (2.76)
40.11 72.73 (20.19)
(3.02) (2.13) (2.20)
238.68 168.08 190.47
Final 31 July 2017(p)
Final 31 July 2016(p)
Final 31 July 2015(p)
385

Stewart Investors Latin America Fund
Comparative Table (continued)
for the year ended 31 July 2017
Net Asset Value and Ongoing Charges Figure
Share class A Accumulation (EUR share class)
Change in net assets per share
Opening net asset value per share
Return before operating charges*
Operating charges
Return after operating charges*
Distributions
Retained distributions on accumulation shares
Closing net asset value per share (c)
* after direct transaction costs of:
Performance
Return after charges (%)
Other information
Closing net asset value (€’000)
Closing number of shares
Operating charges
Direct transaction costs
Prices
Highest share price
Lowest share price 242.36 174.52 193.49
0.06% 0.07% 0.21%
293.28 256.61 242.80
1.89% 1.91% 1.92%
2,989 4,195 3,839
1,098,013 1,673,929 1,814,771
8.66% 18.47% (1.03)%
272.25 250.56 211.49
0.15 0.15 0.47
2.46 1.89 2.72
21.69 39.07 (2.20)
(2.46) (1.89) (2.72)
26.71 43.05 2.03
(5.02) (3.98) (4.23)
250.56 211.49 213.69
Final 31 July 2017(c)
Final 31 July 2016(c)
Final 31 July 2015(c)
386
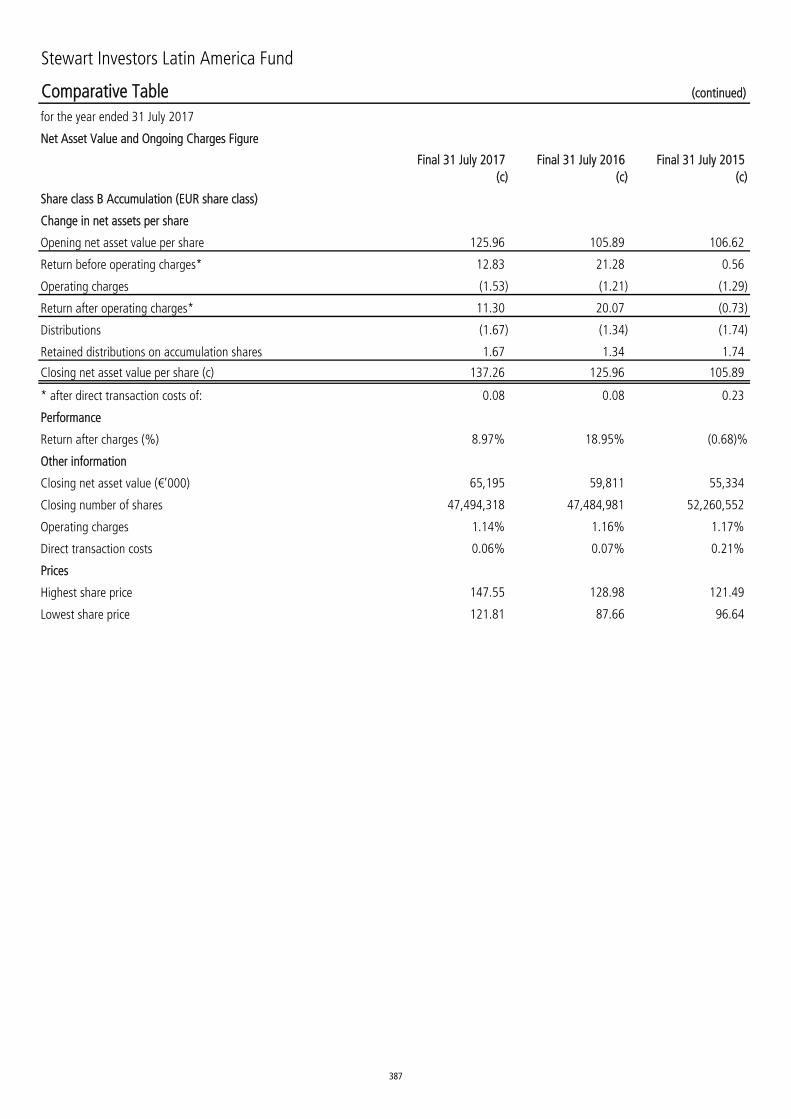
Stewart Investors Latin America Fund
Comparative Table (continued)
for the year ended 31 July 2017
Net Asset Value and Ongoing Charges Figure
Share class B Accumulation (EUR share class)
Change in net assets per share
Opening net asset value per share
Return before operating charges*
Operating charges
Return after operating charges*
Distributions
Retained distributions on accumulation shares
Closing net asset value per share (c)
* after direct transaction costs of:
Performance
Return after charges (%)
Other information
Closing net asset value (€’000)
Closing number of shares
Operating charges
Direct transaction costs
Prices
Highest share price
Lowest share price 121.81 87.66 96.64
0.06% 0.07% 0.21%
147.55 128.98 121.49
1.14% 1.16% 1.17%
65,195 59,811 55,334
47,494,318 47,484,981 52,260,552
8.97% 18.95% (0.68)%
137.26 125.96 105.89
0.08 0.08 0.23
1.67 1.34 1.74
11.30 20.07 (0.73)
(1.67) (1.34) (1.74)
12.83 21.28 0.56
(1.53) (1.21) (1.29)
125.96 105.89 106.62
Final 31 July 2017(c)
Final 31 July 2016(c)
Final 31 July 2015(c)
387

Notes £'000 £'000 £'000 £'000
Net capital gains 2 22,943 47,019
Revenue 3 4,906 3,439
4 (2,251) (1,609)
Interest payable and similar charges (3) (4)
2,652 1,826
5 (529) (439)
2,123 1,387
25,066 48,406
6 (2,124) (1,390)
22,942 47,016
£'000 £'000 £'000 £'000
165,807 123,154
13,337 9,070
(15,275) (14,873)
(1,938) (5,803)
47 39
22,942 47,016
2,140 1,401
188,998 165,807
Less: Amounts payable on cancellation of shares
Dilution adjustment
Change in net assets attributable to shareholders from investment activities
Retained distribution on accumulation shares
Closing net assets attributable to shareholders
Notes to the Financial Statements are on pages 390 to 395.
Amounts receivable on issue of shares
for the year ended 31 July 2017
31 July 2017 31 July 2016
Opening net assets attributable to shareholders
Statement of Change in Net Assets Attributable to Shareholders
Income
Expenses
Net revenue before taxation
Taxation
Net revenue after taxation
Total return before distributions
Distributions
Change in net assets attributable to shareholders from investment activities
31 July 2017 31 July 2016
Stewart Investors Latin America Fund
Statement of Total Returnfor the year ended 31 July 2017
388
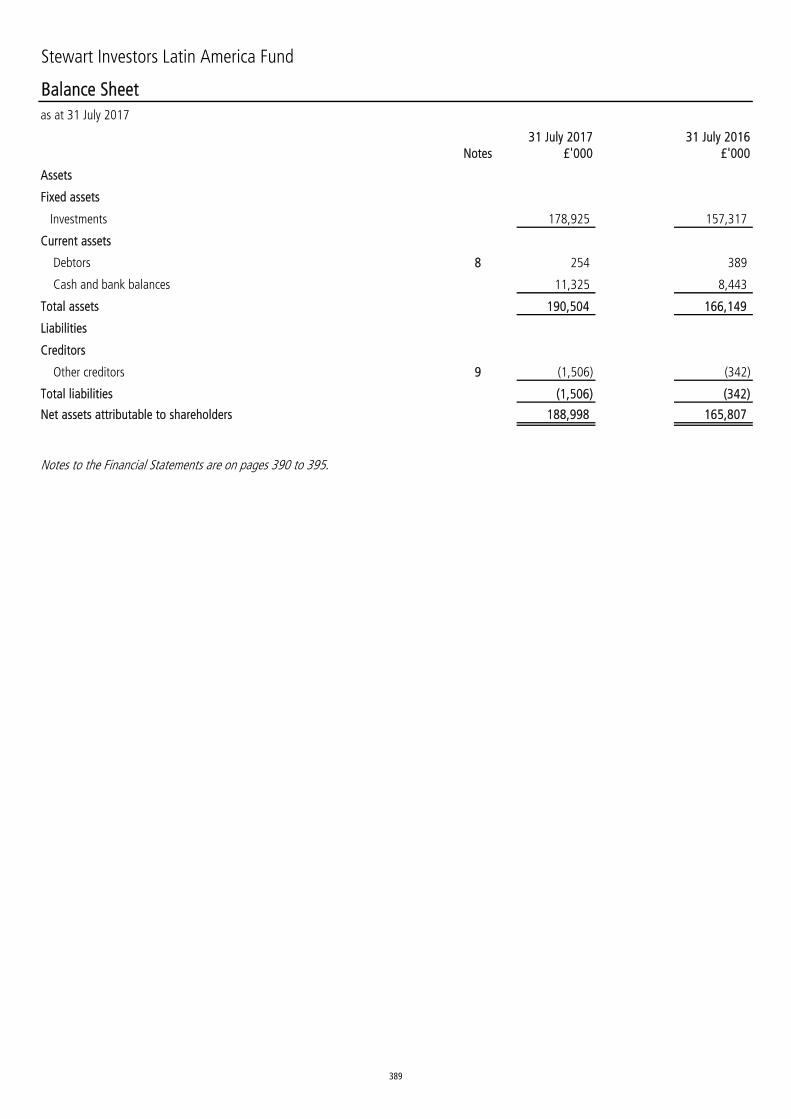
Stewart Investors Latin America Fund
31 July 2017 31 July 2016Notes £'000 £'000
Investments 178,925 157,317
Current assets
8 254 389
11,325 8,443
190,504 166,149
Creditors
Other creditors 9 (1,506) (342)
(1,506) (342)
188,998 165,807
Notes to the Financial Statements are on pages 390 to 395.
Total liabilities
Net assets attributable to shareholders
Balance Sheetas at 31 July 2017
Assets
Fixed assets
Debtors
Cash and bank balances
Total assets
Liabilities
389
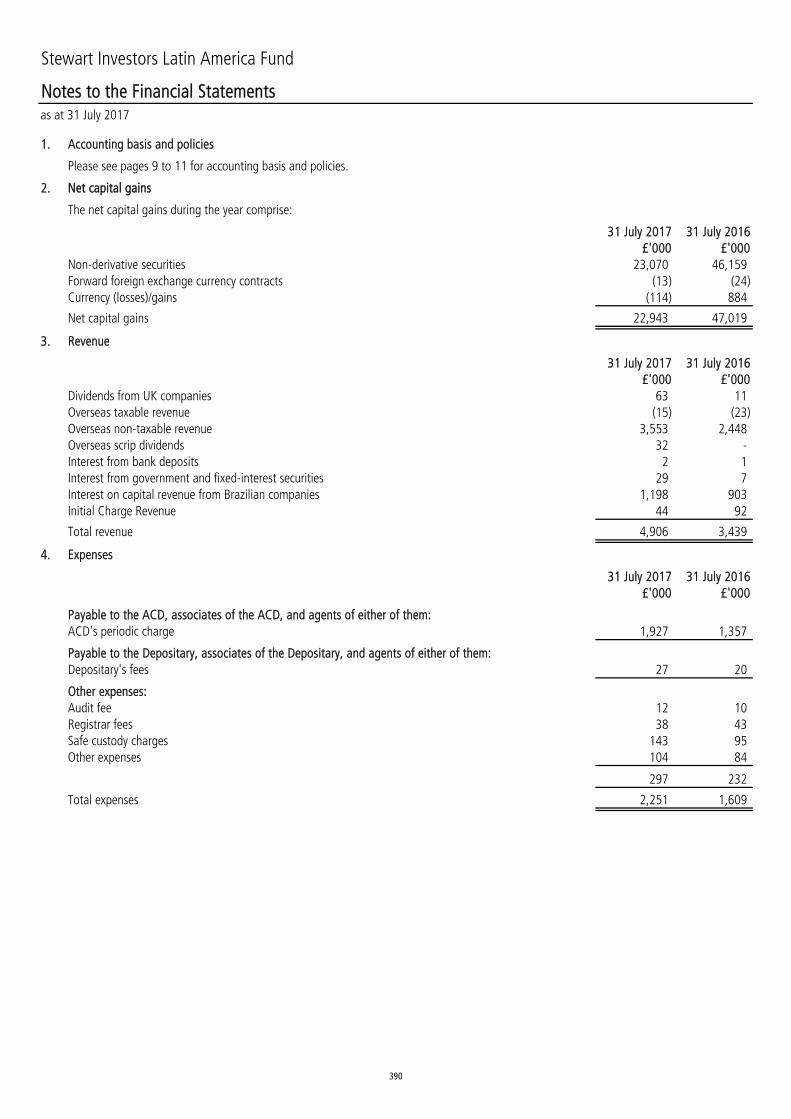
1.
2.
31 July 2017 31 July 2016£'000 £'000
23,070 46,159(13) (24)
(114) 884
22,943 47,019
3.
31 July 2017 31 July 2016£'000 £'000
63 11(15) (23)
3,553 2,44832 -
2 129 7
1,198 90344 92
4,906 3,439
4.
31 July 2017 31 July 2016£'000 £'000
1,927 1,357
27 20
12 1038 43
143 95104 84
297 232
2,251 1,609Total expenses
Audit feeRegistrar feesSafe custody chargesOther expenses
Other expenses:
Payable to the Depositary, associates of the Depositary, and agents of either of them:Depositary's fees
Expenses
Payable to the ACD, associates of the ACD, and agents of either of them:ACD's periodic charge
Initial Charge Revenue
Total revenue
Interest on capital revenue from Brazilian companies
Interest from bank depositsInterest from government and fixed-interest securities
Overseas scrip dividends
Dividends from UK companiesOverseas taxable revenueOverseas non-taxable revenue
Net capital gains
Revenue
Forward foreign exchange currency contractsCurrency (losses)/gains
Accounting basis and policies
Please see pages 9 to 11 for accounting basis and policies.
Net capital gains
The net capital gains during the year comprise:
Non-derivative securities
Notes to the Financial Statementsas at 31 July 2017
Stewart Investors Latin America Fund
390

Notes to the Financial Statements (continued)
as at 31 July 2017
Stewart Investors Latin America Fund
5.
31 July 2017 31 July 2016£'000 £'000
(a)529 439
529 439
(b)
2,652 1,826
530 365
(13) (2)(6) -
(710) (490)234 152529 439(35) (25)
529 439
(c)
(d)
6.
31 July 2017 31 July 2016£'000 £'0001,069 4531,071 948
2,140 1,40126 16
(42) (27)
2,124 1,390
7.
31 July 2017 31 July 2016£'000 £'0002,123 1,387
1 3
2,124 1,390
Movement in net income as a result of conversions
Net distributions for the year
Details of the distributions per share are set out in the Distribution Tables on pages 396 to 397.
Movement between net revenue and net distributions
Net revenue after taxation
Add: revenue deducted on cancellation of sharesDeduct: revenue received on issue of shares
Net distributions for the year
Final distributionInterim distribution
Distributions
The distributions take account of revenue received on the issue of shares and revenue deducted on the cancellation of shares and comprise:
Factors that may affect future tax charges:
At the year end, after offset against revenue taxable on receipt, there is a potential deferred tax asset of £1,695,163 (31/07/16: £1,461,257);this relates to surplus management expenses. No deferred tax asset was recognised in the current and prior year as it was considered unlikelythe Fund would generate sufficient taxable profits in the future to utilise these amounts.
Deferred taxation:
There is no provision required for deferred taxation at the balance sheet date in the current or prior year.
Total tax charge for year (note 5a)
OEICs are exempt from tax on capital gains. Therefore, any capital return is not included in the above reconciliation.
* As an authorised OEIC, these items are not subject to corporation tax.
Overseas tax expensed
Movement in excess management expensesIrrecoverable overseas tax
UK dividends*Non-taxable scrip dividends*Overseas non-taxable revenue*
Net revenue before taxation
Corporation tax of 20% (2016: 20%)
Effects of:
Total taxation (note 5b)
Factors affecting current tax charge for the year:
The tax assessed for the year is lower than (2016: higher than) the standard rate of corporation tax in the UK for an open-ended investmentcompany of 20% (2016: 20%). The differences are explained below:
Irrecoverable overseas taxAnalysis of charge in year:
Taxation
391

Notes to the Financial Statements (continued)
as at 31 July 2017
Stewart Investors Latin America Fund
8.
31 July 2017 31 July 2016£'000 £'000
7 356247 33
254 389
9.
31 July 2017 31 July 2016£'000 £'0001,248 148
258 194
1,506 342
10.
31 July 2017 31 July 2016 31 July 2017 31 July 2016£'000 £'000 £'000 £'000
42,255 54,350 48,800 53,01322,383 - 17,445 -
64,638 54,350 66,245 53,013
35 36 (47) (37)- - - -
35 36 (47) (37)
14 12 (8) (6)- - - -
14 12 (8) (6)
49 48 (55) (43)
64,687 54,398 66,190 52,970
31 July 2017 31 July 2016 31 July 2017 31 July 2016% % % %
0.08 0.07 0.10 0.07- - - -
0.03 0.02 0.02 0.01- - - -
EquitiesBonds
Taxes
CommissionsEquitiesBonds
Total transaction cost expressed as a percentage of asset type cost:
Purchases Sales
Total taxes
Total costs
Total net trades in the year after transaction costs
Total commissions
TaxesEquitiesBonds
Trades in the year before transaction costs
CommissionsEquitiesBonds
Analysis of total trade costs:
Purchases Sales
EquitiesBonds
Total creditors
Portfolio transaction costs
Amounts payable for cancellation of sharesAccrued expenses
Creditors
Total debtors
Amounts receivable for issue of sharesAccrued revenue
Debtors
392
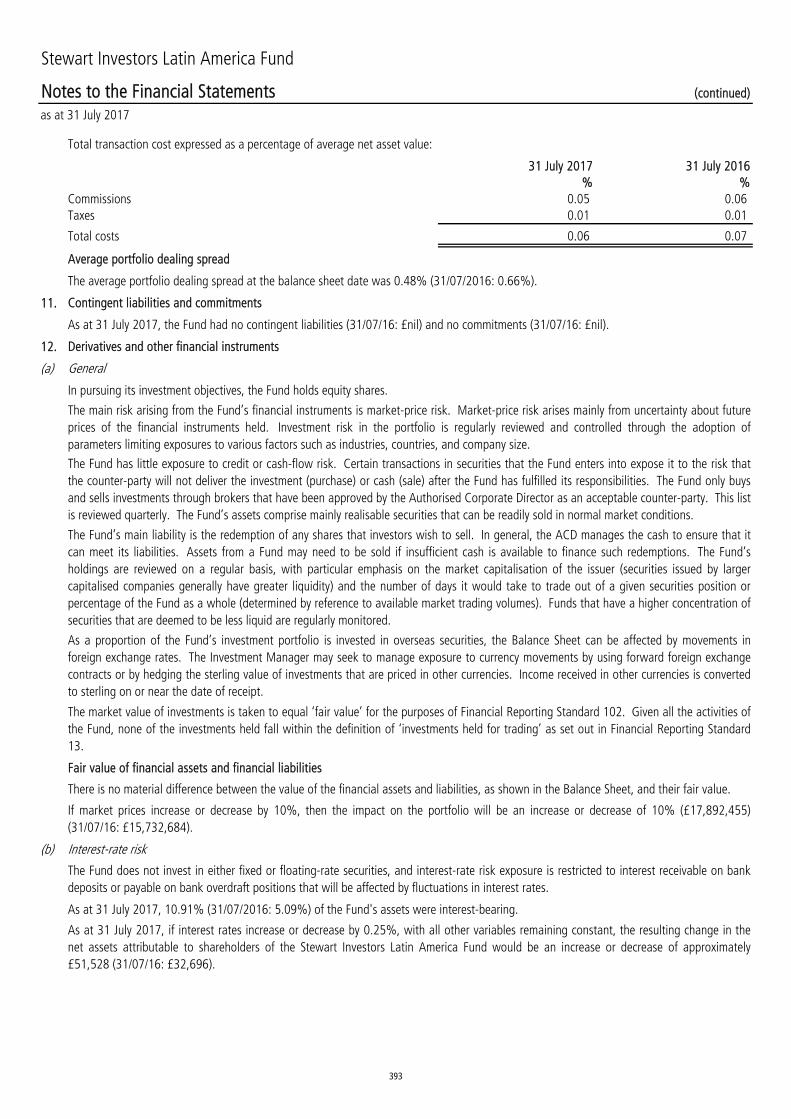
Notes to the Financial Statements (continued)
as at 31 July 2017
Stewart Investors Latin America Fund
11.
12.
(a)
(b)
As at 31 July 2017, 10.91% (31/07/2016: 5.09%) of the Fund's assets were interest-bearing.
As at 31 July 2017, if interest rates increase or decrease by 0.25%, with all other variables remaining constant, the resulting change in thenet assets attributable to shareholders of the Stewart Investors Latin America Fund would be an increase or decrease of approximately£51,528 (31/07/16: £32,696).
There is no material difference between the value of the financial assets and liabilities, as shown in the Balance Sheet, and their fair value.
If market prices increase or decrease by 10%, then the impact on the portfolio will be an increase or decrease of 10% (£17,892,455)(31/07/16: £15,732,684).
Interest-rate risk
The Fund does not invest in either fixed or floating-rate securities, and interest-rate risk exposure is restricted to interest receivable on bankdeposits or payable on bank overdraft positions that will be affected by fluctuations in interest rates.
The Fund’s main liability is the redemption of any shares that investors wish to sell. In general, the ACD manages the cash to ensure that itcan meet its liabilities. Assets from a Fund may need to be sold if insufficient cash is available to finance such redemptions. The Fund’sholdings are reviewed on a regular basis, with particular emphasis on the market capitalisation of the issuer (securities issued by largercapitalised companies generally have greater liquidity) and the number of days it would take to trade out of a given securities position orpercentage of the Fund as a whole (determined by reference to available market trading volumes). Funds that have a higher concentration ofsecurities that are deemed to be less liquid are regularly monitored.
As a proportion of the Fund’s investment portfolio is invested in overseas securities, the Balance Sheet can be affected by movements inforeign exchange rates. The Investment Manager may seek to manage exposure to currency movements by using forward foreign exchangecontracts or by hedging the sterling value of investments that are priced in other currencies. Income received in other currencies is convertedto sterling on or near the date of receipt.
The market value of investments is taken to equal ‘fair value’ for the purposes of Financial Reporting Standard 102. Given all the activities ofthe Fund, none of the investments held fall within the definition of ‘investments held for trading’ as set out in Financial Reporting Standard13.
Fair value of financial assets and financial liabilities
Derivatives and other financial instruments
General
In pursuing its investment objectives, the Fund holds equity shares.
The main risk arising from the Fund’s financial instruments is market-price risk. Market-price risk arises mainly from uncertainty about futureprices of the financial instruments held. Investment risk in the portfolio is regularly reviewed and controlled through the adoption ofparameters limiting exposures to various factors such as industries, countries, and company size.
The Fund has little exposure to credit or cash-flow risk. Certain transactions in securities that the Fund enters into expose it to the risk thatthe counter-party will not deliver the investment (purchase) or cash (sale) after the Fund has fulfilled its responsibilities. The Fund only buysand sells investments through brokers that have been approved by the Authorised Corporate Director as an acceptable counter-party. This listis reviewed quarterly. The Fund’s assets comprise mainly realisable securities that can be readily sold in normal market conditions.
Contingent liabilities and commitments
As at 31 July 2017, the Fund had no contingent liabilities (31/07/16: £nil) and no commitments (31/07/16: £nil).
Average portfolio dealing spread
The average portfolio dealing spread at the balance sheet date was 0.48% (31/07/2016: 0.66%).
Total costs 0.06 0.07
Commissions 0.05 0.06Taxes 0.01 0.01
Total transaction cost expressed as a percentage of average net asset value:
31 July 2017 31 July 2016% %
393

Notes to the Financial Statements (continued)
as at 31 July 2017
Stewart Investors Latin America Fund
(c)
Total TotalCurrency £'000 £'000Brazilian real 73,880 75,827Chilean peso 42,350 45,438Colombian peso 1,539 632Euro (1,069) 161Mexican peso 17,896 10,245Peruvian nuevo sol 4,563 4,157US dollar 42,593 21,271
Total 181,752 157,731
13.
14.
%1.751.001.751.00
31 July 2016 31 July 2017
Opening shares in issue Creations Cancellations
Shares converted
Closing shares in issue
6,507,755 179,984 (821,416) (195,307) 5,671,01640,725,142 1,429,532 (1,203,166) 183,221 41,134,729
1,673,929 204,813 (780,729) - 1,098,01347,484,981 7,250,552 (7,241,215) - 47,494,318Share class B Accumulation (EUR share class) (Institutional)
All share classes have the same rights on winding up.
Reconciliation of the shares movement in the year:
Share class A Accumulation (Retail)Share class B Accumulation (Institutional)Share class A Accumulation (EUR share class) (Retail)
The net asset value of each share class, the net asset value per share and the number of shares in each class are given in the ComparativeTable on pages 384 to 387.
The distributions per share class are given in the Distribution Tables on pages 396 to 397.
The ACD's periodic charge on each share class is as follows:
Share class A Accumulation (Retail):Share class B Accumulation (Institutional):Share class A Accumulation (EUR share class) (Retail):Share class B Accumulation (EUR share class) (Institutional):
Skandia Mutual Life Insurance Company and FundSettle EOC Nominees Limited held material shareholdings in the Fund during the year to 31July 2017, and at the year end held 47.6% and 16.5% of the Fund’s shares in issue respectively.
Share classes
The Fund has four share classes in issue.
Amounts paid to First State Investments (UK) Limited in respect of ACD fees are disclosed in note 4, with £170,246 (31/07/16: £139,313) due at the year end.
As at 31 July 2017, RBC, as trustee for First State Investment Services (UK) Limited Employee Benefits Trust, a related party of the ACD,owned 0.04% (31/07/16: 0.10%) of the net asset value of the Fund.
Material Shareholders
Related parties
First State Investments (UK) Limited ("the ACD") is a related party to the Fund as defined by Financial Reporting Standard 8 ‘Related Party Disclosures’ and FRS 102 Section 33 'Related Party Disclosures'. By virtue of the regulations governing open-ended investment companies, the ACD is party to every transaction in respect of shares of the Fund, which are summarised in the ‘Statement of Change in Net Assets Attributable to Shareholders’. Amounts due at the year end in respect of issues and cancellations are included in the Balance Sheet.
If foreign exchange rates increase or decrease by 5%, then the impact on the NAV will be an increase or decrease of 4.81% (£9,087,587)(31/07/16: 4.76% (£7,886,576)).
The following summarises the sterling value of currencies of the Fund in which the investments, including cash, debtors and creditors, aredenominated.
As at 31 July 2017, the Fund had the following net currency exposure (excluding sterling):
Net foreign currency assets Net foreign currency assets31 July 2017 31 July 2016
Analysis of the Fund's currency exposure
394

Notes to the Financial Statements (continued)
as at 31 July 2017
Stewart Investors Latin America Fund
15.
Assets Liabilities Assets Liabilities
£'000 £'000 £'000 £'000178,925 - 157,317 -
- - - -- - - -
178,925 - 157,317 -
Level 3: inputs are unobservable (i.e. market data is unavailable) for the asset or liability. Over the Counter (OTC) derivatives (including equityswaps) are held at fair value, which is determined by valuation techniques or single broker quotes.
Level 1Level 2Level 3
Total fair value
Level 1: the unadjusted quoted price in an active market for identical assets or liabilities that the entity can access at the measurement date. Level 2: inputs other than quoted prices included within Level 1 that are observable (i.e. developed using market data) for the asset or liability,either directly or indirectly.
Fair value
Valuation technique
31 July 2017 31 July 2016
395
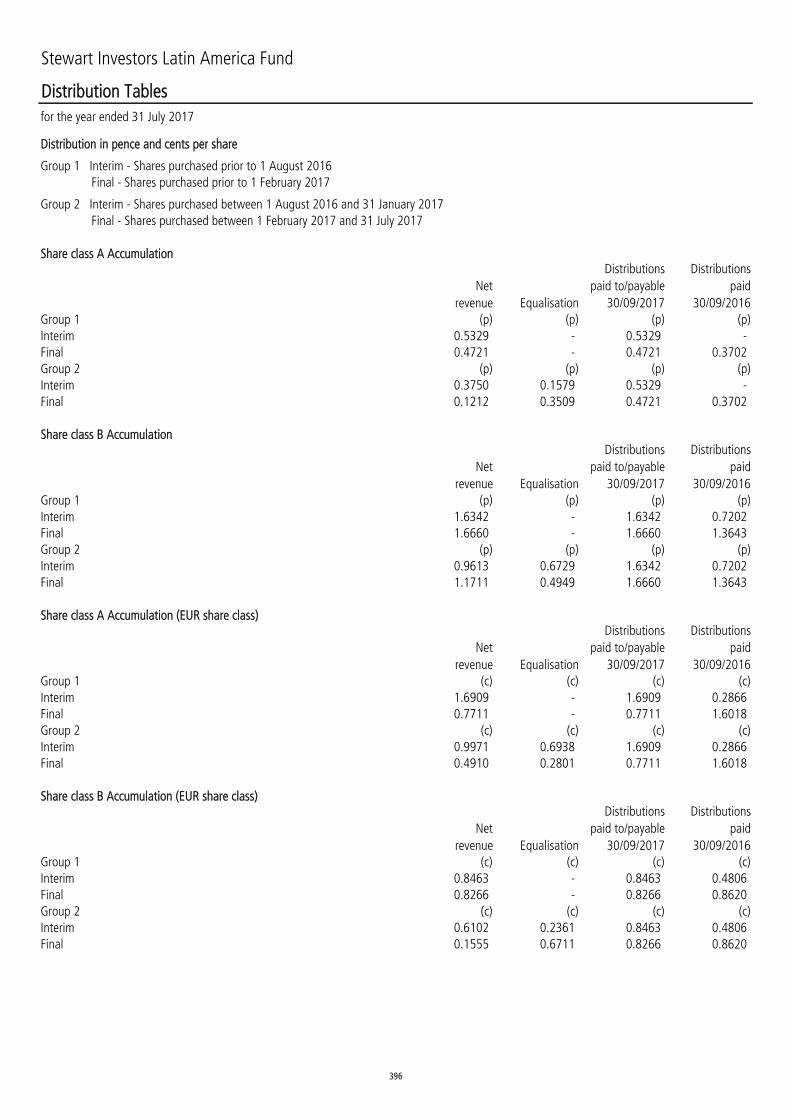
Share class A Accumulation
Netrevenue Equalisation
Distributions paid to/payable
30/09/2017
Distributions paid
30/09/2016Group 1 (p) (p) (p) (p)Interim 0.5329 - 0.5329 -Final 0.4721 - 0.4721 0.3702Group 2 (p) (p) (p) (p)Interim 0.3750 0.1579 0.5329 -Final 0.1212 0.3509 0.4721 0.3702
Share class B Accumulation
Netrevenue Equalisation
Distributions paid to/payable
30/09/2017
Distributions paid
30/09/2016Group 1 (p) (p) (p) (p)Interim 1.6342 - 1.6342 0.7202Final 1.6660 - 1.6660 1.3643Group 2 (p) (p) (p) (p)Interim 0.9613 0.6729 1.6342 0.7202Final 1.1711 0.4949 1.6660 1.3643
Share class A Accumulation (EUR share class)
Netrevenue Equalisation
Distributions paid to/payable
30/09/2017
Distributions paid
30/09/2016Group 1 (c) (c) (c) (c)Interim 1.6909 - 1.6909 0.2866Final 0.7711 - 0.7711 1.6018Group 2 (c) (c) (c) (c)Interim 0.9971 0.6938 1.6909 0.2866Final 0.4910 0.2801 0.7711 1.6018
Share class B Accumulation (EUR share class)
Netrevenue Equalisation
Distributions paid to/payable
30/09/2017
Distributions paid
30/09/2016Group 1 (c) (c) (c) (c)Interim 0.8463 - 0.8463 0.4806Final 0.8266 - 0.8266 0.8620Group 2 (c) (c) (c) (c)Interim 0.6102 0.2361 0.8463 0.4806Final 0.1555 0.6711 0.8266 0.8620
Final - Shares purchased between 1 February 2017 and 31 July 2017Group 2 Interim - Shares purchased between 1 August 2016 and 31 January 2017
Final - Shares purchased prior to 1 February 2017
Distribution in pence and cents per share
Stewart Investors Latin America Fund
Distribution Tablesfor the year ended 31 July 2017
Group 1 Interim - Shares purchased prior to 1 August 2016
396
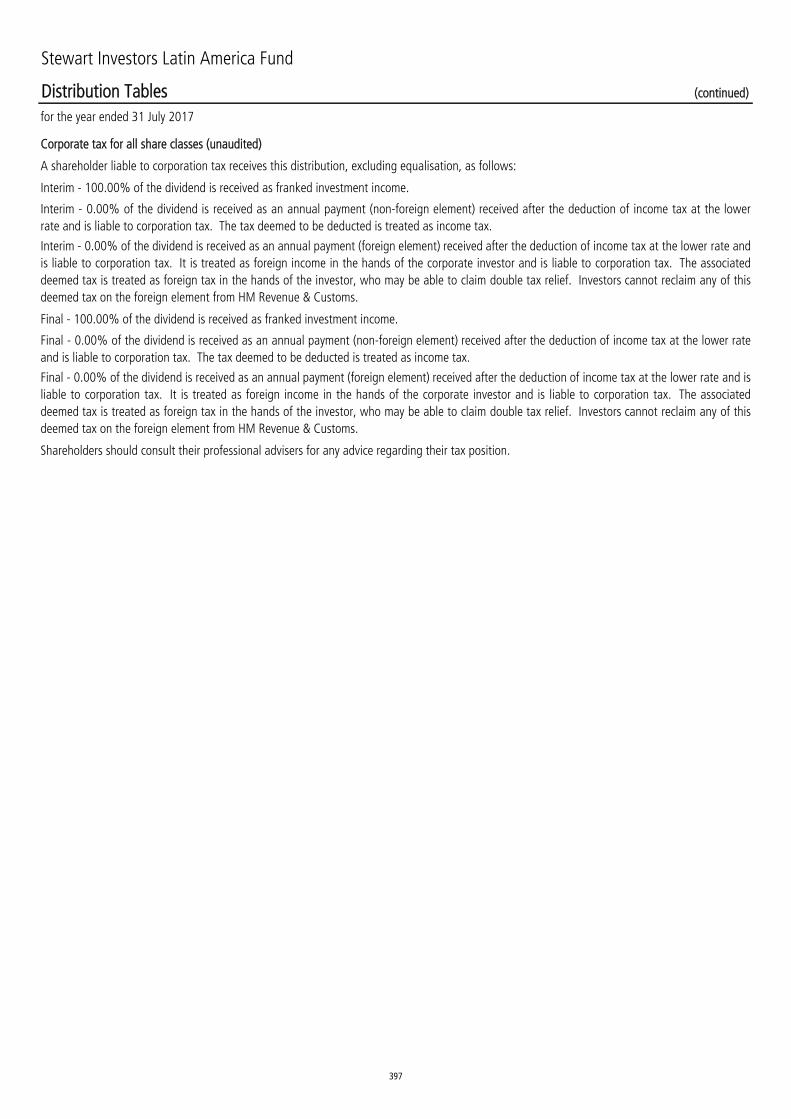
Stewart Investors Latin America Fund
Distribution Tables (continued)
for the year ended 31 July 2017
Shareholders should consult their professional advisers for any advice regarding their tax position.
Final - 100.00% of the dividend is received as franked investment income.
Final - 0.00% of the dividend is received as an annual payment (non-foreign element) received after the deduction of income tax at the lower rateand is liable to corporation tax. The tax deemed to be deducted is treated as income tax.
Final - 0.00% of the dividend is received as an annual payment (foreign element) received after the deduction of income tax at the lower rate and isliable to corporation tax. It is treated as foreign income in the hands of the corporate investor and is liable to corporation tax. The associateddeemed tax is treated as foreign tax in the hands of the investor, who may be able to claim double tax relief. Investors cannot reclaim any of thisdeemed tax on the foreign element from HM Revenue & Customs.
Interim - 100.00% of the dividend is received as franked investment income.
Interim - 0.00% of the dividend is received as an annual payment (non-foreign element) received after the deduction of income tax at the lowerrate and is liable to corporation tax. The tax deemed to be deducted is treated as income tax.
Interim - 0.00% of the dividend is received as an annual payment (foreign element) received after the deduction of income tax at the lower rate andis liable to corporation tax. It is treated as foreign income in the hands of the corporate investor and is liable to corporation tax. The associateddeemed tax is treated as foreign tax in the hands of the investor, who may be able to claim double tax relief. Investors cannot reclaim any of thisdeemed tax on the foreign element from HM Revenue & Customs.
Corporate tax for all share classes (unaudited)
A shareholder liable to corporation tax receives this distribution, excluding equalisation, as follows:
397

Risks and reward profile
Lower Risk Higher Risk
Potentially Lower Rewards Potentially Higher Rewards
1 2 3 4 5 6 7
1 2 3 4 5 6 7
1 2 3 4 5 6 7
1 2 3 4 5 6 7
• Even the lowest rating 1 does not mean a risk-free investment;
• On a scale of 1 (less risky) to 7 (more risky), this Fund has a rating of 5 due to its past performance and the nature of its investments. Shares witha rating of 5 might have higher risks, but also higher returns;
• Risk is taken in order to make a higher potential return; the more risk a Fund takes, the higher the potential return but the greater the risk of loss;and
• The value of the Fund and its return is not guaranteed and may fall as well as rise. You may get back less than you originally invested.
The Fund might also experience the following risks:
• The synthetic risk reward indicator (the SRRI) rating is not a measure of the risk of you losing your investment but describes how much the valueof the Fund went up and down in the past;
• The SRRI rating is based on historical data, which may not be a reliable indication of the future risks and rewards of the Fund;
• We cannot guarantee that the rating of the Fund will remain the same; it may change over time;
Share class B AccumulationShare class B Hedged Accumulation (EUR share class)Share class B Hedged Accumulation (USD share class)
Share class Z Accumulation
• The Fund may use derivatives for the purposes of meeting its investment objective and for efficient portfolio management purposes.
• Clarification point 1: For the avoidance of doubt, if the UK Retail Prices Index is discontinued or is no longer accepted as a relevant marketstandard indicator of UK Inflation, the ACD may substitute a replacement benchmark. It is the intention of the ACD that the replacementbenchmark (if any) will be as close as possible to the UK Retail Prices Index and shall not affect the Fund's investment policy, intended return orrisk profile. Any such change of benchmark will be pre-notified to shareholders.
• Clarification point 2: The Diversified Growth Fund follows the Absolute VaR approach to calculating Global Exposure with a maximum limit of20%. We expect the maximum leverage for this Fund, calculated using the Sum of Notionals Approach, to be 500%. Leverage may, however, incertain circumstances, exceed such maximum figure.
Derivatives may include, but shall not be limited to, foreign exchange forwards, futures, options and swaps.
The Fund aims to protect against UK inflation and provide growth by achieving a positive return of 4% in excess of the UK Retail Price Index over arolling 5-year period.
By investing in the Fund, capital is at risk. There is no guarantee that the Fund will deliver positive returns over this, or any other, period.
The Fund will adopt a total return approach and invest in a broad range of traditional and alternative asset classes globally, which may include butare not limited to inflation-linked bonds, developed and emerging market equities, developed and emerging market debt, and exchange-tradedfunds. In order to gain exposure to these asset classes, the Fund may invest in transferable securities, money market instruments, collectiveinvestment schemes, derivatives and deposits.
First State Diversified Growth Fund
Authorised Fund Manager's Reportfor the year ended 31 July 2017
Investment Objective and Policy
Up to 100% of the net assets of the Fund may be invested in other collective investment schemes, including in collective investment schemesmanaged by the ACD or its associates ("Associated Schemes"), and/or other Funds of the Company ("Second Funds").
Investment may be in cash or near cash.
398
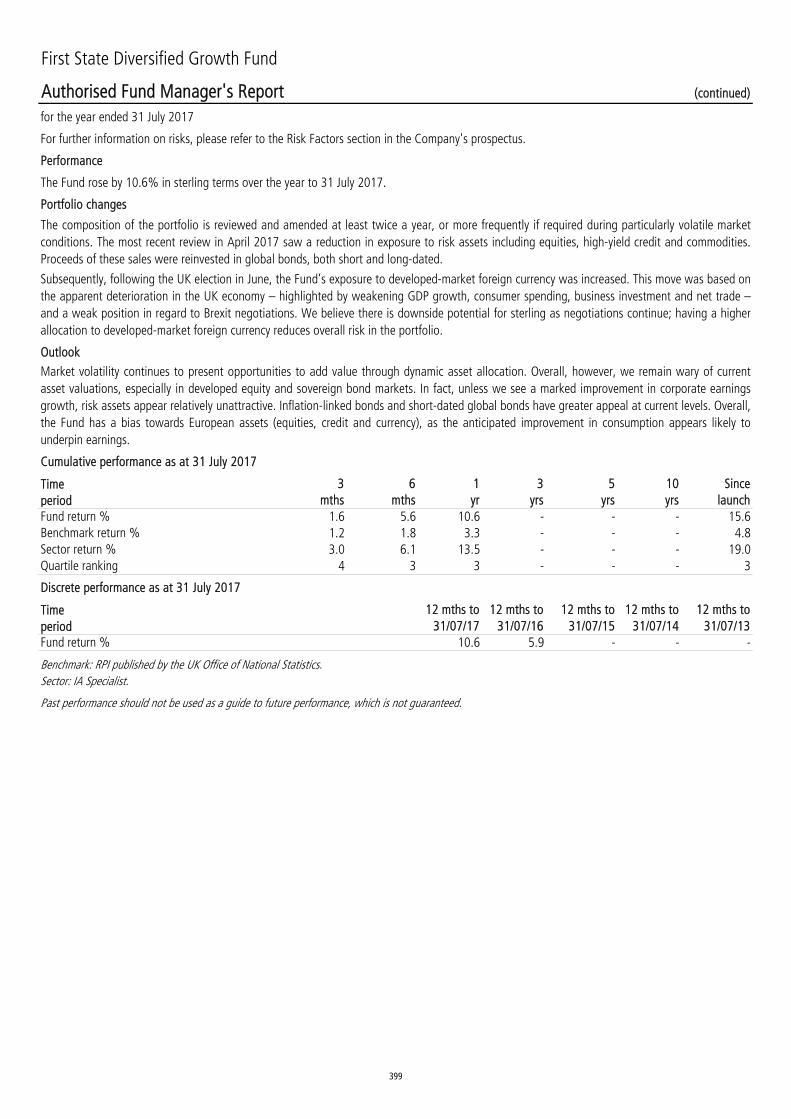
(continued)
First State Diversified Growth Fund
Authorised Fund Manager's Reportfor the year ended 31 July 2017
Time 3 6 1 3 5 10 Sinceperiod mths mths yr yrs yrs yrs launch
1.6 5.6 10.6 - - - 15.6 1.2 1.8 3.3 - - - 4.8 3.0 6.1 13.5 - - - 19.0
4 3 3 - - - 3
12 mths to 12 mths to 12 mths to 12 mths to 12 mths to31/07/17 31/07/16 31/07/15 31/07/14 31/07/13
10.6 5.9 - - -
Past performance should not be used as a guide to future performance, which is not guaranteed.
TimeperiodFund return %
Benchmark: RPI published by the UK Office of National Statistics.Sector: IA Specialist.
Benchmark return %Sector return %Quartile ranking
Discrete performance as at 31 July 2017
Cumulative performance as at 31 July 2017
Fund return %
Outlook
Market volatility continues to present opportunities to add value through dynamic asset allocation. Overall, however, we remain wary of currentasset valuations, especially in developed equity and sovereign bond markets. In fact, unless we see a marked improvement in corporate earningsgrowth, risk assets appear relatively unattractive. Inflation-linked bonds and short-dated global bonds have greater appeal at current levels. Overall,the Fund has a bias towards European assets (equities, credit and currency), as the anticipated improvement in consumption appears likely tounderpin earnings.
Portfolio changes
The composition of the portfolio is reviewed and amended at least twice a year, or more frequently if required during particularly volatile marketconditions. The most recent review in April 2017 saw a reduction in exposure to risk assets including equities, high-yield credit and commodities.Proceeds of these sales were reinvested in global bonds, both short and long-dated.
Subsequently, following the UK election in June, the Fund’s exposure to developed-market foreign currency was increased. This move was based onthe apparent deterioration in the UK economy – highlighted by weakening GDP growth, consumer spending, business investment and net trade –and a weak position in regard to Brexit negotiations. We believe there is downside potential for sterling as negotiations continue; having a higherallocation to developed-market foreign currency reduces overall risk in the portfolio.
Performance
The Fund rose by 10.6% in sterling terms over the year to 31 July 2017.
For further information on risks, please refer to the Risk Factors section in the Company's prospectus.
399
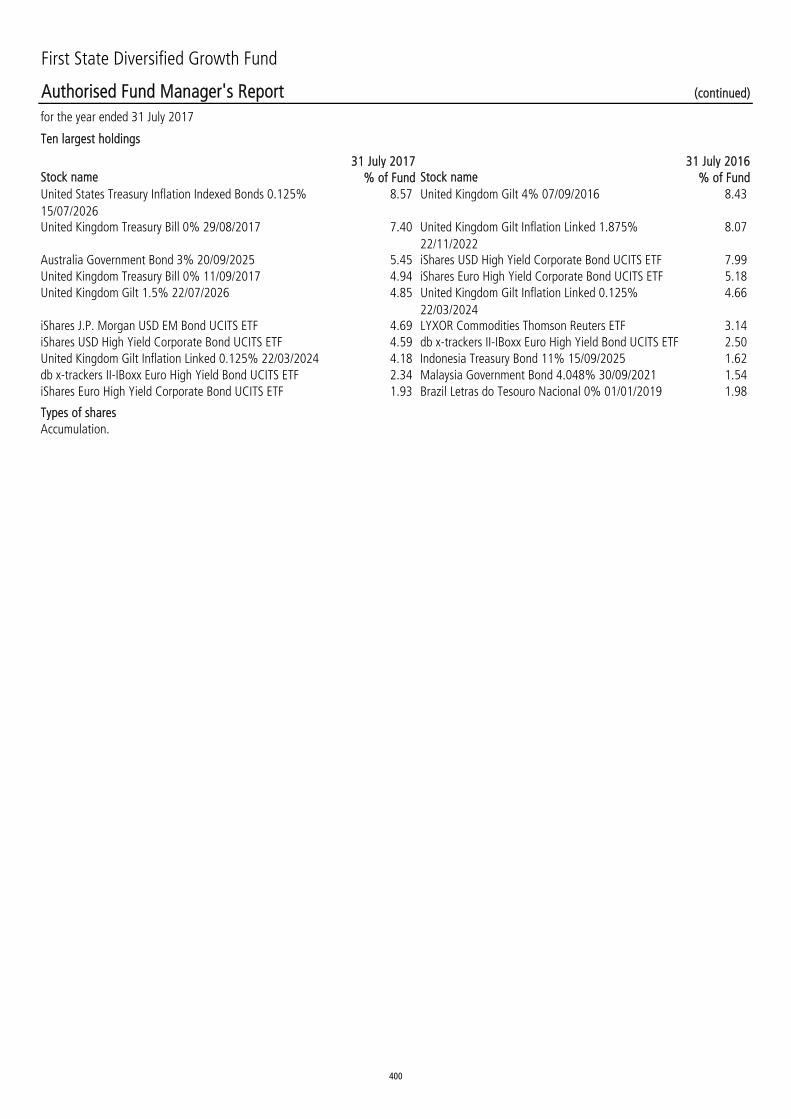
(continued)
First State Diversified Growth Fund
Authorised Fund Manager's Reportfor the year ended 31 July 2017
31 July 2017 31 July 2016% of Fund % of Fund
8.57 8.43
7.40 8.07
5.45 7.994.94 5.184.85 4.66
4.69 3.144.59 2.504.18 1.622.34 1.541.93 1.98
Types of sharesAccumulation.
United Kingdom Gilt Inflation Linked 0.125% 22/03/2024 Indonesia Treasury Bond 11% 15/09/2025db x-trackers II-IBoxx Euro High Yield Bond UCITS ETF Malaysia Government Bond 4.048% 30/09/2021iShares Euro High Yield Corporate Bond UCITS ETF Brazil Letras do Tesouro Nacional 0% 01/01/2019
United Kingdom Gilt 1.5% 22/07/2026 United Kingdom Gilt Inflation Linked 0.125% 22/03/2024
iShares J.P. Morgan USD EM Bond UCITS ETF LYXOR Commodities Thomson Reuters ETFiShares USD High Yield Corporate Bond UCITS ETF db x-trackers II-IBoxx Euro High Yield Bond UCITS ETF
United Kingdom Treasury Bill 0% 29/08/2017 United Kingdom Gilt Inflation Linked 1.875% 22/11/2022
Australia Government Bond 3% 20/09/2025 iShares USD High Yield Corporate Bond UCITS ETFUnited Kingdom Treasury Bill 0% 11/09/2017 iShares Euro High Yield Corporate Bond UCITS ETF
Stock name Stock nameUnited States Treasury Inflation Indexed Bonds 0.125% 15/07/2026
United Kingdom Gilt 4% 07/09/2016
Ten largest holdings
400
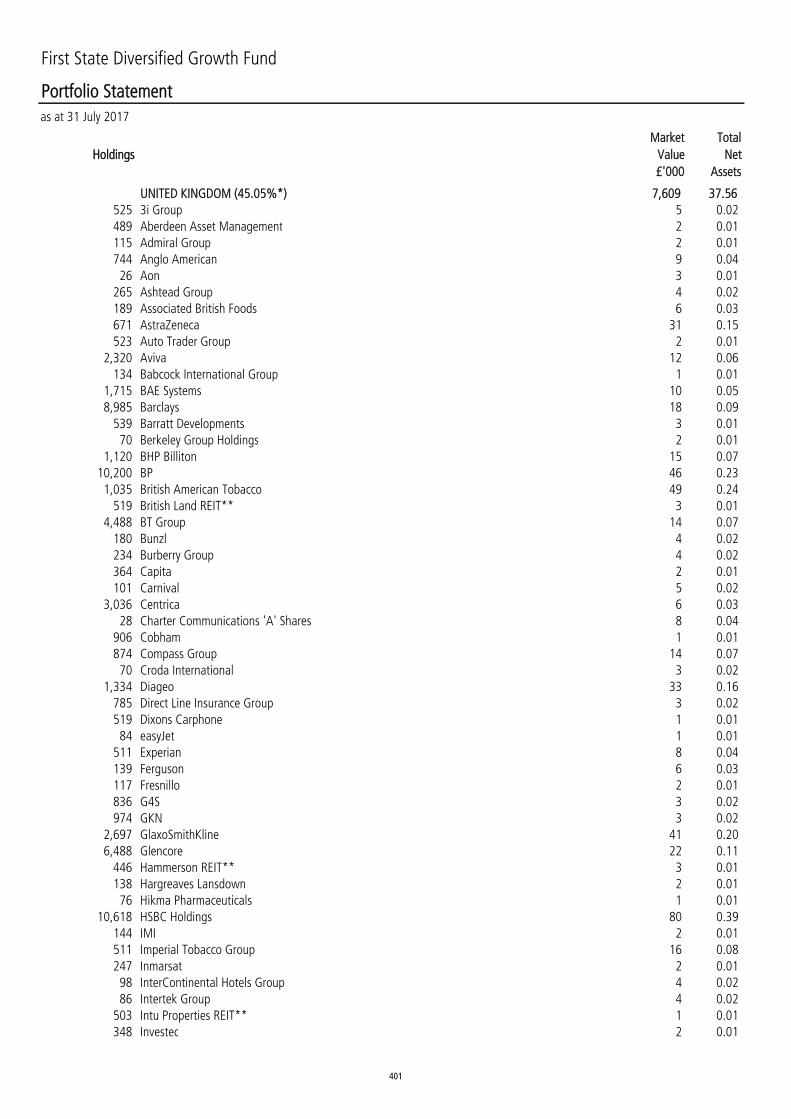
Holdings Market
Value£'000
TotalNet
Assets
UNITED KINGDOM (45.05%*) 7,609 37.56525 3i Group 5 0.02489 Aberdeen Asset Management 2 0.01115 Admiral Group 2 0.01744 Anglo American 9 0.04
26 Aon 3 0.01265 Ashtead Group 4 0.02189 Associated British Foods 6 0.03671 AstraZeneca 31 0.15523 Auto Trader Group 2 0.01
2,320 Aviva 12 0.06134 Babcock International Group 1 0.01
1,715 BAE Systems 10 0.058,985 Barclays 18 0.09
539 Barratt Developments 3 0.0170 Berkeley Group Holdings 2 0.01
1,120 BHP Billiton 15 0.0710,200 BP 46 0.23
1,035 British American Tobacco 49 0.24519 British Land REIT** 3 0.01
4,488 BT Group 14 0.07180 Bunzl 4 0.02234 Burberry Group 4 0.02364 Capita 2 0.01101 Carnival 5 0.02
3,036 Centrica 6 0.0328 Charter Communications 'A' Shares 8 0.04
906 Cobham 1 0.01874 Compass Group 14 0.07
70 Croda International 3 0.021,334 Diageo 33 0.16
785 Direct Line Insurance Group 3 0.02519 Dixons Carphone 1 0.01
84 easyJet 1 0.01511 Experian 8 0.04139 Ferguson 6 0.03117 Fresnillo 2 0.01836 G4S 3 0.02974 GKN 3 0.02
2,697 GlaxoSmithKline 41 0.206,488 Glencore 22 0.11
446 Hammerson REIT** 3 0.01138 Hargreaves Lansdown 2 0.01
76 Hikma Pharmaceuticals 1 0.0110,618 HSBC Holdings 80 0.39
144 IMI 2 0.01511 Imperial Tobacco Group 16 0.08247 Inmarsat 2 0.01
98 InterContinental Hotels Group 4 0.0286 Intertek Group 4 0.02
503 Intu Properties REIT** 1 0.01348 Investec 2 0.01
First State Diversified Growth Fund
Portfolio Statementas at 31 July 2017
401
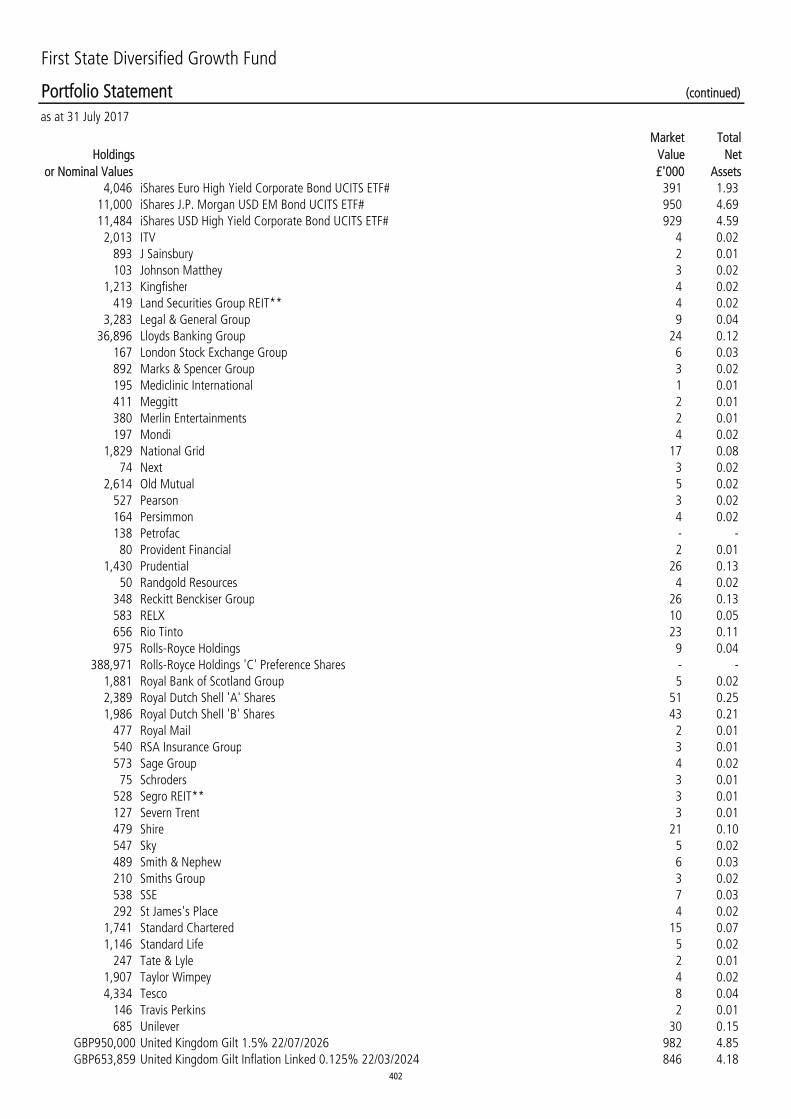
Holdingsor Nominal Values
MarketValue£'000
TotalNet
Assets
First State Diversified Growth Fund
Portfolio Statement (continued)
as at 31 July 2017
4,046 iShares Euro High Yield Corporate Bond UCITS ETF# 391 1.9311,000 iShares J.P. Morgan USD EM Bond UCITS ETF# 950 4.6911,484 iShares USD High Yield Corporate Bond UCITS ETF# 929 4.59
2,013 ITV 4 0.02893 J Sainsbury 2 0.01103 Johnson Matthey 3 0.02
1,213 Kingfisher 4 0.02419 Land Securities Group REIT** 4 0.02
3,283 Legal & General Group 9 0.0436,896 Lloyds Banking Group 24 0.12
167 London Stock Exchange Group 6 0.03892 Marks & Spencer Group 3 0.02195 Mediclinic International 1 0.01411 Meggitt 2 0.01380 Merlin Entertainments 2 0.01197 Mondi 4 0.02
1,829 National Grid 17 0.0874 Next 3 0.02
2,614 Old Mutual 5 0.02527 Pearson 3 0.02164 Persimmon 4 0.02138 Petrofac - -
80 Provident Financial 2 0.011,430 Prudential 26 0.13
50 Randgold Resources 4 0.02348 Reckitt Benckiser Group 26 0.13583 RELX 10 0.05656 Rio Tinto 23 0.11975 Rolls-Royce Holdings 9 0.04
388,971 Rolls-Royce Holdings 'C' Preference Shares - -1,881 Royal Bank of Scotland Group 5 0.022,389 Royal Dutch Shell 'A' Shares 51 0.251,986 Royal Dutch Shell 'B' Shares 43 0.21
477 Royal Mail 2 0.01540 RSA Insurance Group 3 0.01573 Sage Group 4 0.02
75 Schroders 3 0.01528 Segro REIT** 3 0.01127 Severn Trent 3 0.01479 Shire 21 0.10547 Sky 5 0.02489 Smith & Nephew 6 0.03210 Smiths Group 3 0.02538 SSE 7 0.03292 St James's Place 4 0.02
1,741 Standard Chartered 15 0.071,146 Standard Life 5 0.02
247 Tate & Lyle 2 0.011,907 Taylor Wimpey 4 0.024,334 Tesco 8 0.04
146 Travis Perkins 2 0.01685 Unilever 30 0.15
GBP950,000 United Kingdom Gilt 1.5% 22/07/2026 982 4.85GBP653,859 United Kingdom Gilt Inflation Linked 0.125% 22/03/2024 846 4.18
402
Holdingsor Nominal Values
MarketValue£'000
TotalNet
Assets
First State Diversified Growth Fund
Portfolio Statement (continued)
as at 31 July 2017
GBP1,000,000 United Kingdom Treasury Bill 0% 11/09/2017 1,000 4.94GBP1,500,000 United Kingdom Treasury Bill 0% 29/08/2017 1,500 7.40
362 United Utilities Group 3 0.0114,113 Vodafone Group 31 0.15
116 Weir Group 2 0.0198 Whitbread 4 0.02
471 William Hill 1 0.011,194 WM Morrison Supermarkets 3 0.02
954 Worldpay Group 4 0.02678 WPP 10 0.05
UNITED STATES (22.62%*) 3,212 15.8658 3M 9 0.05
163 Abbott Laboratories 6 0.03152 AbbVie 8 0.04
59 Accenture 6 0.0374 Activision Blizzard 3 0.0213 Adient 1 0.0147 Adobe Systems 5 0.03
4 AdvanSix - -32 Aetna 4 0.0256 Aflac 3 0.0248 Agilent Technologies 2 0.0128 Air Products & Chemicals 3 0.0230 Alexion Pharmaceuticals 3 0.0237 Allergan 7 0.0351 Allstate 3 0.0228 Alphabet 'A' Shares 20 0.1030 Alphabet 'C' Shares 22 0.1184 Altaba 4 0.02
184 Altria Group 9 0.0443 Amazon.com 33 0.1647 American Electric Power 3 0.0279 American Express 5 0.02
116 American International Group 6 0.0340 American Tower REIT** 4 0.0225 Ameriprise Financial 3 0.0240 AMETEK 2 0.0171 Amgen 9 0.0445 Amphenol 3 0.0254 Anadarko Petroleum 2 0.0146 Analog Devices 3 0.0224 Anthem 3 0.0254 Apache 2 0.01
518 Apple 59 0.29113 Applied Materials 4 0.02
78 Archer-Daniels-Midland 2 0.01570 AT&T 17 0.08
43 Automatic Data Processing 4 0.024 AutoZone 2 0.01
18 AvalonBay Communities REIT** 3 0.0258 Baker Hughes 2 0.01
100 Ball 3 0.021,101 Bank of America 20 0.10
103 Bank of New York Mellon 4 0.02403
Holdings Market
Value£'000
TotalNet
Assets
First State Diversified Growth Fund
Portfolio Statement (continued)
as at 31 July 2017
70 Baxter International 3 0.0287 BB&T 3 0.0220 Becton Dickinson 3 0.02
111 Berkshire Hathaway 'B' Shares 15 0.0721 Biogen 5 0.0316 Bioverativ 1 0.0112 BlackRock 4 0.0265 Boeing 12 0.0620 Boston Properties REIT** 2 0.01
127 Boston Scientific 3 0.02156 Bristol-Myers Squibb 7 0.04
36 Broadcom 7 0.0450 Capital One Financial 3 0.0243 Cardinal Health 2 0.0159 Carnival 3 0.0255 Caterpillar 5 0.0357 CBS 3 0.0273 Celgene 7 0.0479 CenturyLink 1 0.0145 Cerner 2 0.01
111 Charles Schwab 4 0.0229 Cheniere Energy 1 0.01
176 Chevron 15 0.0843 Chubb 5 0.0324 Cigna 3 0.02
473 Cisco Systems 11 0.06277 Citigroup 14 0.07
19 Clorox 2 0.0135 CME Group 3 0.02
385 Coca-Cola 13 0.0656 Cognizant Technology Solutions 3 0.0280 Colgate-Palmolive 4 0.02
465 Comcast 'A' Shares 14 0.0762 ConAgra Brands 2 0.0119 Concho Resources 2 0.01
116 ConocoPhillips 4 0.0243 Consolidated Edison 3 0.0223 Constellation Brands 'A' Shares 3 0.02
156 Corning 3 0.0241 Costco Wholesale 5 0.0311 CR Bard 3 0.0231 Crown Castle International REIT** 2 0.0191 CSX 3 0.0223 Cummins 3 0.02
105 CVS Health 6 0.0358 Danaher 4 0.0230 Deere 3 0.0231 Dell Technologies 1 0.0141 Delphi Automotive 3 0.0235 Dentsply Sirona 2 0.0170 Devon Energy 2 0.0156 Discover Financial Services 3 0.0245 Dollar General 3 0.0233 Dollar Tree 2 0.01
404

Holdings Market
Value£'000
TotalNet
Assets
First State Diversified Growth Fund
Portfolio Statement (continued)
as at 31 July 2017
56 Dominion Energy 3 0.02105 Dow Chemical 5 0.02
28 Dr Pepper Snapple Group 2 0.0126 DTE Energy 2 0.0163 Duke Energy 4 0.0220 DXC Technology 1 0.0150 Eaton 3 0.02
101 eBay 3 0.0224 Ecolab 2 0.0146 Edison International 3 0.0232 Edwards Lifesciences 3 0.0282 EI du Pont de Nemours & Company 5 0.0232 Electronic Arts 3 0.0294 Eli Lilly & Company 6 0.0362 Emerson Electric 3 0.0251 EOG Resources 4 0.0220 Equifax 2 0.01
8 Equinix REIT** 3 0.0252 Equity Residential REIT** 3 0.02
9 Essex Property Trust REIT** 2 0.0133 Estee Lauder 2 0.0146 Eversource Energy 2 0.0187 Exelon 3 0.0263 Express Scripts Holding 3 0.02
388 Exxon Mobil 24 0.12213 Facebook 28 0.14
25 FedEx 4 0.0241 Fidelity National Information Services 3 0.0130 Fiserv 3 0.01
346 Ford Motor 3 0.0245 Fortive 2 0.0160 Franklin Resources 2 0.0125 General Dynamics 4 0.02
866 General Electric 17 0.0856 General Mills 2 0.01
134 General Motors 4 0.0282 GGP REIT** 1 0.01
136 Gilead Sciences 8 0.0436 Goldman Sachs Group 6 0.0381 Halliburton 3 0.0158 Hartford Financial Services Group 2 0.0143 HCA Holdings 3 0.0266 HCP REIT** 2 0.0141 Hess 1 0.01
168 Hewlett Packard Enterprise 2 0.01119 Home Depot 13 0.06
68 Honeywell International 7 0.03236 HP 3 0.01
20 Humana 4 0.0230 Illinois Tool Works 3 0.0119 Illumina 3 0.0138 Ingersoll-Rand 3 0.01
1 Ingevity - -441 Intel 12 0.06
405
Holdings Market
Value£'000
TotalNet
Assets
First State Diversified Growth Fund
Portfolio Statement (continued)
as at 31 July 2017
56 Intercontinental Exchange 3 0.0187 International Business Machines 10 0.0556 International Paper 2 0.0133 Intuit 3 0.01
4 Intuitive Surgical 3 0.0112 JBG SMITH Properties Registered REIT** - -18 JM Smucker 2 0.01
259 Johnson & Johnson 26 0.1389 Johnson Controls International 3 0.01
344 JPMorgan Chase & Company 24 0.1238 Kellogg 2 0.0154 KeyCorp 1 -34 Kimberly-Clark 3 0.01
178 Kinder Morgan 3 0.0156 Kraft Heinz 4 0.02
123 Kroger 2 0.0136 L Brands 1 0.0120 Lamb Weston Holdings 1 0.0161 Las Vegas Sands 3 0.0144 Level 3 Communications 2 0.0182 Liberty Global 'C' Shares 2 0.0112 Liberty Global 'C Tracking' Shares - -86 Lowe's 5 0.0219 M&T Bank 2 0.0152 Macy's 1 0.0170 Marathon Petroleum 3 0.01
1 Markel 1 0.0149 Marsh & McLennan 3 0.0193 MasterCard 9 0.0499 McDonald's 12 0.0621 McKesson 3 0.01
134 Medtronic 9 0.04262 Merck & Company 13 0.06
90 MetLife 4 0.02805 Microsoft 45 0.22
27 Molson Coors Brewing 'B' Shares 2 0.01150 Mondelez International 'A' Shares 5 0.02
41 Monsanto 4 0.0263 Monster Beverage 3 0.0126 Moody's 3 0.01
137 Morgan Stanley 5 0.0260 Mylan 2 0.0138 Netflix 5 0.0263 Newell Brands 2 0.0176 Newmont Mining 2 0.0143 NextEra Energy 5 0.0250 Nielsen Holdings 2 0.01
128 NIKE 'B' Shares 6 0.0361 Noble Energy 1 0.0128 Norfolk Southern 2 0.0132 Northern Trust 2 0.0120 Northrop Grumman 4 0.0246 Nucor 2 0.0150 NVIDIA 6 0.03
406
Holdings Market
Value£'000
TotalNet
Assets
First State Diversified Growth Fund
Portfolio Statement (continued)
as at 31 July 2017
72 Occidental Petroleum 3 0.0132 Omnicom Group 2 0.01
299 Oracle 11 0.0513 O'Reilly Automotive 2 0.0146 PACCAR 2 0.01
9 Palo Alto Networks 1 0.0118 Parker-Hannifin 2 0.0146 Paychex 2 0.01
104 PayPal Holdings 5 0.02137 PepsiCo 12 0.06572 Pfizer 14 0.07
47 PG&E 2 0.01147 Philip Morris International 13 0.06
50 Phillips 66 3 0.0121 Pioneer Natural Resources 3 0.0148 PNC Financial Services Group 5 0.0236 PPG Industries 3 0.0189 PPL 3 0.0127 Praxair 3 0.01
4 Priceline Group 6 0.03254 Procter & Gamble 17 0.08
77 Progressive 3 0.0178 Prologis REIT** 4 0.0242 Prudential Financial 4 0.0267 Public Service Enterprise Group 2 0.0120 Public Storage REIT** 3 0.01
143 QUALCOMM 6 0.0313 Quality Care Properties REIT** - -29 Raytheon 4 0.0236 Realty Income REIT** 2 0.0110 Regeneron Pharmaceuticals 4 0.0218 Rockwell Automation 2 0.0114 Roper Technologies 2 0.0154 Ross Stores 2 0.0125 S&P Global 3 0.0159 salesforce.com 4 0.02
132 Schlumberger 7 0.0331 Sempra Energy 3 0.0111 Sherwin-Williams 3 0.0130 Simon Property Group REIT** 4 0.0286 Southern 3 0.0122 Stanley Black & Decker 2 0.01
141 Starbucks 6 0.0338 State Street 3 0.0131 Stryker 3 0.0167 SunTrust Banks 3 0.0190 Symantec 2 0.01
111 Synchrony Financial 3 0.0174 Sysco 3 0.0136 T Rowe Price Group 2 0.0177 Target 3 0.0151 TE Connectivity 3 0.0113 Tesla Motors 3 0.0196 Texas Instruments 6 0.03
407
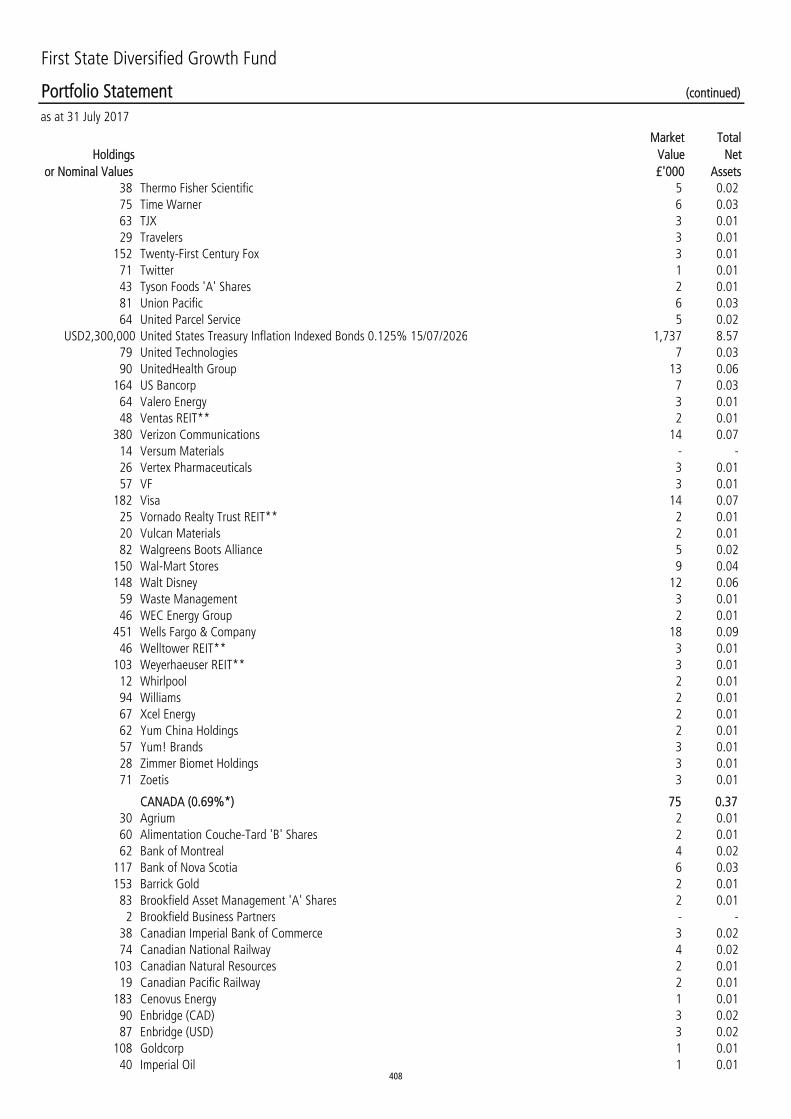
Holdingsor Nominal Values
MarketValue£'000
TotalNet
Assets
First State Diversified Growth Fund
Portfolio Statement (continued)
as at 31 July 2017
38 Thermo Fisher Scientific 5 0.0275 Time Warner 6 0.0363 TJX 3 0.0129 Travelers 3 0.01
152 Twenty-First Century Fox 3 0.0171 Twitter 1 0.0143 Tyson Foods 'A' Shares 2 0.0181 Union Pacific 6 0.0364 United Parcel Service 5 0.02
USD2,300,000 United States Treasury Inflation Indexed Bonds 0.125% 15/07/2026 1,737 8.5779 United Technologies 7 0.0390 UnitedHealth Group 13 0.06
164 US Bancorp 7 0.0364 Valero Energy 3 0.0148 Ventas REIT** 2 0.01
380 Verizon Communications 14 0.0714 Versum Materials - -26 Vertex Pharmaceuticals 3 0.0157 VF 3 0.01
182 Visa 14 0.0725 Vornado Realty Trust REIT** 2 0.0120 Vulcan Materials 2 0.0182 Walgreens Boots Alliance 5 0.02
150 Wal-Mart Stores 9 0.04148 Walt Disney 12 0.06
59 Waste Management 3 0.0146 WEC Energy Group 2 0.01
451 Wells Fargo & Company 18 0.0946 Welltower REIT** 3 0.01
103 Weyerhaeuser REIT** 3 0.0112 Whirlpool 2 0.0194 Williams 2 0.0167 Xcel Energy 2 0.0162 Yum China Holdings 2 0.0157 Yum! Brands 3 0.0128 Zimmer Biomet Holdings 3 0.0171 Zoetis 3 0.01
CANADA (0.69%*) 75 0.3730 Agrium 2 0.0160 Alimentation Couche-Tard 'B' Shares 2 0.0162 Bank of Montreal 4 0.02
117 Bank of Nova Scotia 6 0.03153 Barrick Gold 2 0.01
83 Brookfield Asset Management 'A' Shares 2 0.012 Brookfield Business Partners - -
38 Canadian Imperial Bank of Commerce 3 0.0274 Canadian National Railway 4 0.02
103 Canadian Natural Resources 2 0.0119 Canadian Pacific Railway 2 0.01
183 Cenovus Energy 1 0.0190 Enbridge (CAD) 3 0.0287 Enbridge (USD) 3 0.02
108 Goldcorp 1 0.0140 Imperial Oil 1 0.01
408
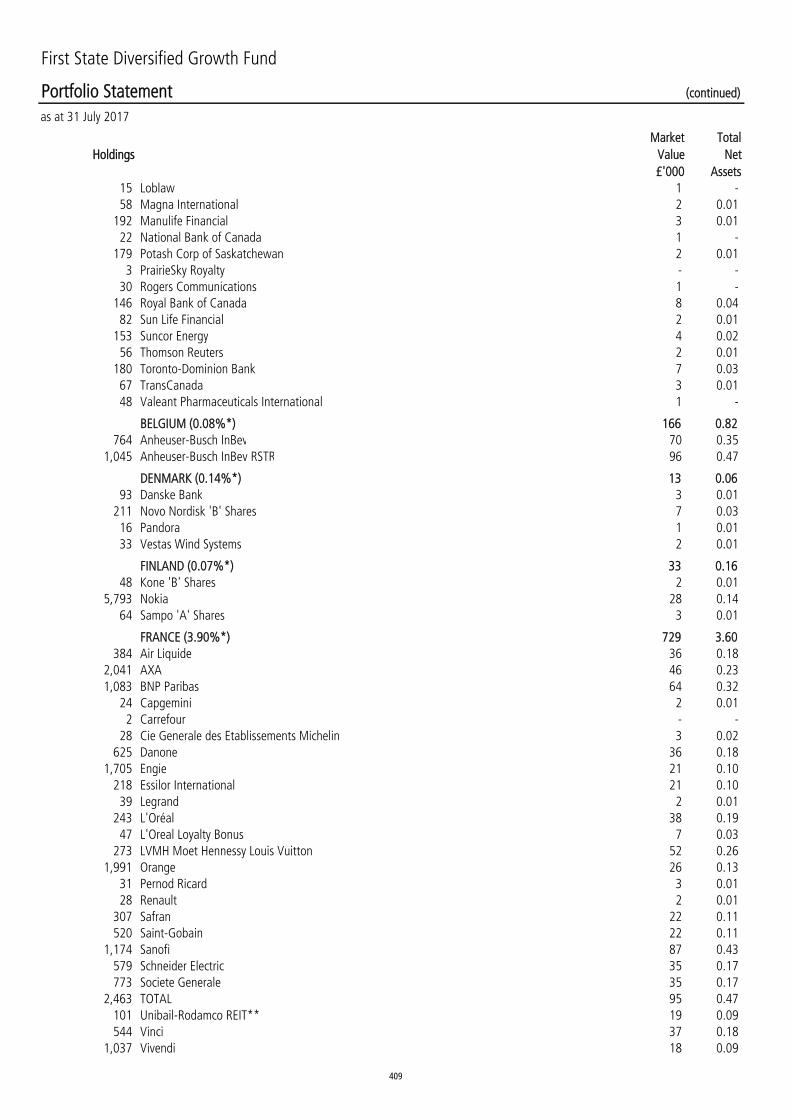
Holdings Market
Value£'000
TotalNet
Assets
First State Diversified Growth Fund
Portfolio Statement (continued)
as at 31 July 2017
15 Loblaw 1 -58 Magna International 2 0.01
192 Manulife Financial 3 0.0122 National Bank of Canada 1 -
179 Potash Corp of Saskatchewan 2 0.013 PrairieSky Royalty - -
30 Rogers Communications 1 -146 Royal Bank of Canada 8 0.04
82 Sun Life Financial 2 0.01153 Suncor Energy 4 0.02
56 Thomson Reuters 2 0.01180 Toronto-Dominion Bank 7 0.03
67 TransCanada 3 0.0148 Valeant Pharmaceuticals International 1 -
BELGIUM (0.08%*) 166 0.82764 Anheuser-Busch InBev 70 0.35
1,045 Anheuser-Busch InBev RSTR 96 0.47
DENMARK (0.14%*) 13 0.0693 Danske Bank 3 0.01
211 Novo Nordisk 'B' Shares 7 0.0316 Pandora 1 0.0133 Vestas Wind Systems 2 0.01
FINLAND (0.07%*) 33 0.1648 Kone 'B' Shares 2 0.01
5,793 Nokia 28 0.1464 Sampo 'A' Shares 3 0.01
FRANCE (3.90%*) 729 3.60384 Air Liquide 36 0.18
2,041 AXA 46 0.231,083 BNP Paribas 64 0.32
24 Capgemini 2 0.012 Carrefour - -
28 Cie Generale des Etablissements Michelin 3 0.02625 Danone 36 0.18
1,705 Engie 21 0.10218 Essilor International 21 0.10
39 Legrand 2 0.01243 L'Oréal 38 0.19
47 L'Oreal Loyalty Bonus 7 0.03273 LVMH Moet Hennessy Louis Vuitton 52 0.26
1,991 Orange 26 0.1331 Pernod Ricard 3 0.0128 Renault 2 0.01
307 Safran 22 0.11520 Saint-Gobain 22 0.11
1,174 Sanofi 87 0.43579 Schneider Electric 35 0.17773 Societe Generale 35 0.17
2,463 TOTAL 95 0.47101 Unibail-Rodamco REIT** 19 0.09544 Vinci 37 0.18
1,037 Vivendi 18 0.09
409
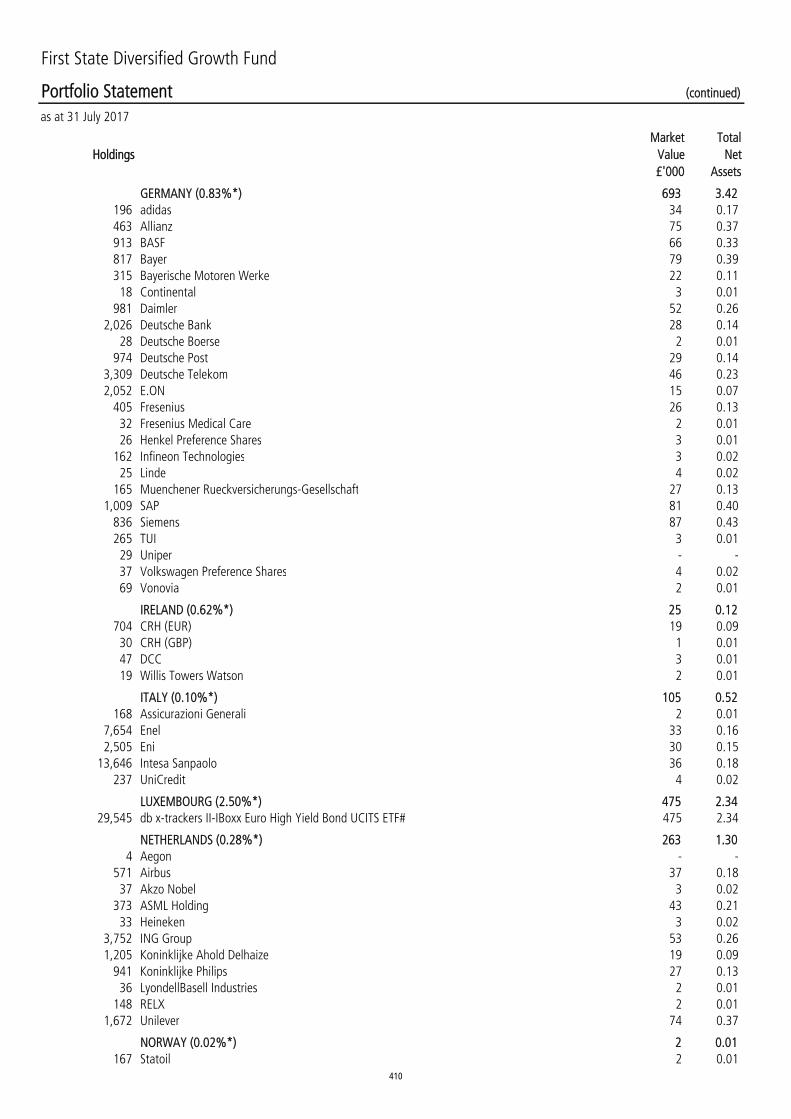
Holdings Market
Value£'000
TotalNet
Assets
First State Diversified Growth Fund
Portfolio Statement (continued)
as at 31 July 2017
GERMANY (0.83%*) 693 3.42196 adidas 34 0.17463 Allianz 75 0.37913 BASF 66 0.33817 Bayer 79 0.39315 Bayerische Motoren Werke 22 0.11
18 Continental 3 0.01981 Daimler 52 0.26
2,026 Deutsche Bank 28 0.1428 Deutsche Boerse 2 0.01
974 Deutsche Post 29 0.143,309 Deutsche Telekom 46 0.232,052 E.ON 15 0.07
405 Fresenius 26 0.1332 Fresenius Medical Care 2 0.0126 Henkel Preference Shares 3 0.01
162 Infineon Technologies 3 0.0225 Linde 4 0.02
165 Muenchener Rueckversicherungs-Gesellschaft 27 0.131,009 SAP 81 0.40
836 Siemens 87 0.43265 TUI 3 0.01
29 Uniper - -37 Volkswagen Preference Shares 4 0.0269 Vonovia 2 0.01
IRELAND (0.62%*) 25 0.12704 CRH (EUR) 19 0.09
30 CRH (GBP) 1 0.0147 DCC 3 0.0119 Willis Towers Watson 2 0.01
ITALY (0.10%*) 105 0.52168 Assicurazioni Generali 2 0.01
7,654 Enel 33 0.162,505 Eni 30 0.15
13,646 Intesa Sanpaolo 36 0.18237 UniCredit 4 0.02
LUXEMBOURG (2.50%*) 475 2.3429,545 db x-trackers II-IBoxx Euro High Yield Bond UCITS ETF# 475 2.34
NETHERLANDS (0.28%*) 263 1.304 Aegon - -
571 Airbus 37 0.1837 Akzo Nobel 3 0.02
373 ASML Holding 43 0.2133 Heineken 3 0.02
3,752 ING Group 53 0.261,205 Koninklijke Ahold Delhaize 19 0.09
941 Koninklijke Philips 27 0.1336 LyondellBasell Industries 2 0.01
148 RELX 2 0.011,672 Unilever 74 0.37
NORWAY (0.02%*) 2 0.01167 Statoil 2 0.01
410
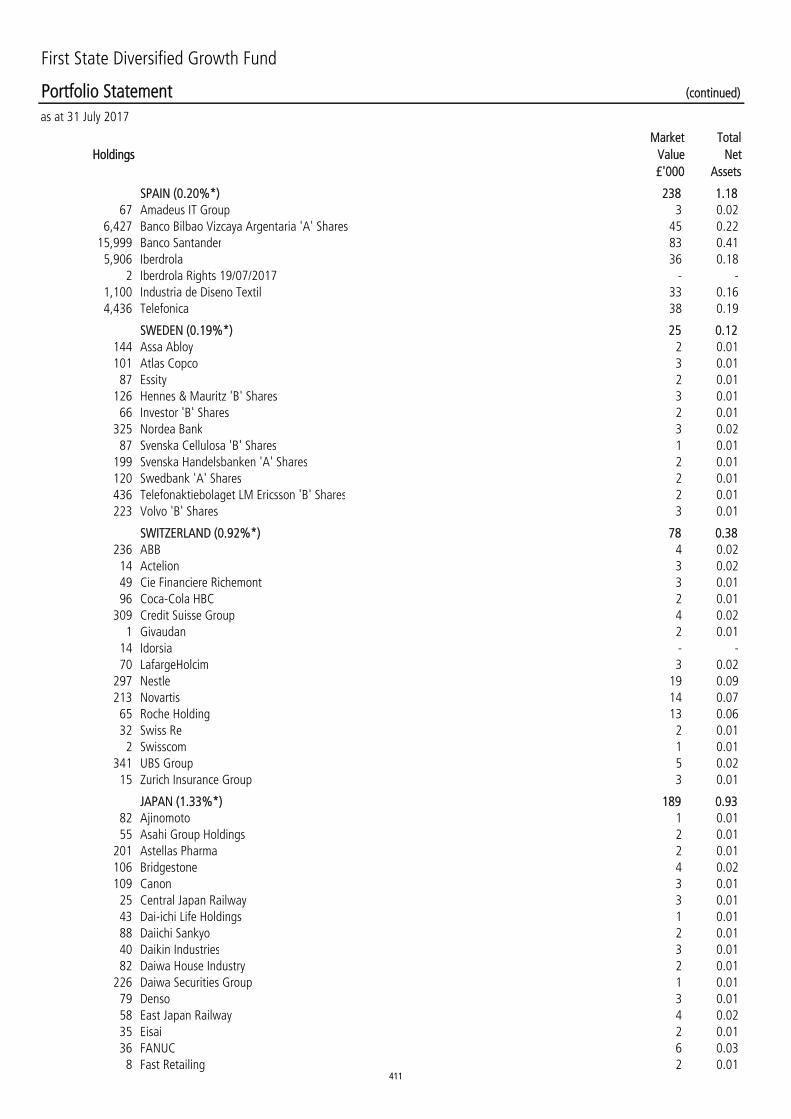
Holdings Market
Value£'000
TotalNet
Assets
First State Diversified Growth Fund
Portfolio Statement (continued)
as at 31 July 2017
SPAIN (0.20%*) 238 1.1867 Amadeus IT Group 3 0.02
6,427 Banco Bilbao Vizcaya Argentaria 'A' Shares 45 0.2215,999 Banco Santander 83 0.41
5,906 Iberdrola 36 0.182 Iberdrola Rights 19/07/2017 - -
1,100 Industria de Diseno Textil 33 0.164,436 Telefonica 38 0.19
SWEDEN (0.19%*) 25 0.12144 Assa Abloy 2 0.01101 Atlas Copco 3 0.01
87 Essity 2 0.01126 Hennes & Mauritz 'B' Shares 3 0.01
66 Investor 'B' Shares 2 0.01325 Nordea Bank 3 0.02
87 Svenska Cellulosa 'B' Shares 1 0.01199 Svenska Handelsbanken 'A' Shares 2 0.01120 Swedbank 'A' Shares 2 0.01436 Telefonaktiebolaget LM Ericsson 'B' Shares 2 0.01223 Volvo 'B' Shares 3 0.01
SWITZERLAND (0.92%*) 78 0.38236 ABB 4 0.02
14 Actelion 3 0.0249 Cie Financiere Richemont 3 0.0196 Coca-Cola HBC 2 0.01
309 Credit Suisse Group 4 0.021 Givaudan 2 0.01
14 Idorsia - -70 LafargeHolcim 3 0.02
297 Nestle 19 0.09213 Novartis 14 0.07
65 Roche Holding 13 0.0632 Swiss Re 2 0.01
2 Swisscom 1 0.01341 UBS Group 5 0.02
15 Zurich Insurance Group 3 0.01
JAPAN (1.33%*) 189 0.9382 Ajinomoto 1 0.0155 Asahi Group Holdings 2 0.01
201 Astellas Pharma 2 0.01106 Bridgestone 4 0.02109 Canon 3 0.01
25 Central Japan Railway 3 0.0143 Dai-ichi Life Holdings 1 0.0188 Daiichi Sankyo 2 0.0140 Daikin Industries 3 0.0182 Daiwa House Industry 2 0.01
226 Daiwa Securities Group 1 0.0179 Denso 3 0.0158 East Japan Railway 4 0.0235 Eisai 2 0.0136 FANUC 6 0.03
8 Fast Retailing 2 0.01411

Holdings Market
Value£'000
TotalNet
Assets
First State Diversified Growth Fund
Portfolio Statement (continued)
as at 31 July 2017
47 FUJIFILM Holdings 1 0.01487 Hitachi 3 0.01164 Honda Motor 4 0.02160 Hoya 7 0.03168 ITOCHU 2 0.01
38 JFE Holdings 1 0.0173 Kao 3 0.01
100 KDDI 2 0.018 Keyence 3 0.02
16 Kirin Holdings - -165 Komatsu 3 0.01
95 Kubota 1 0.0132 Kyocera 2 0.01
139 Mitsubishi 2 0.01130 Mitsubishi Electric 2 0.01172 Mitsubishi Estate 2 0.01521 Mitsubishi Heavy Industries 2 0.01
1,265 Mitsubishi UFJ Financial Group 6 0.03199 Mitsui & Company 2 0.01127 Mitsui Fudosan 2 0.01
2,139 Mizuho Financial Group 3 0.0268 MS&AD Insurance Group Holdings 2 0.0121 Murata Manufacturing 2 0.0138 Nidec 3 0.0110 Nintendo 3 0.02
100 Nippon Steel & Sumitomo Metal 2 0.01100 Nippon Telegraph & Telephone 4 0.02396 Nissan Motor 3 0.01
47 Nitto Denko 3 0.01496 Nomura Holdings 2 0.01100 NTT DOCOMO 2 0.01
32 Oriental Land 2 0.01180 ORIX 2 0.01
56 Otsuka Holdings 2 0.01354 Panasonic 4 0.02
34 Rakuten - -2 Resona Holdings - -
37 Secom 2 0.01111 Seven & i Holdings 3 0.02
18 Shin-Etsu Chemical 1 -9 SMC 2 0.01
100 SoftBank Group 6 0.0345 Sompo Holdings 1 -91 Sony 3 0.0294 Subaru 3 0.0293 Sumitomo 1 -22 Sumitomo Electric Industries - -
176 Sumitomo Mitsui Financial Group 5 0.0246 Sumitomo Mitsui Trust Holdings 1 0.0148 Sumitomo Realty & Development 1 0.0158 Suzuki Motor 2 0.01
412

Holdingsor Nominal Values
MarketValue£'000
TotalNet
Assets
First State Diversified Growth Fund
Portfolio Statement (continued)
as at 31 July 2017
111 Takeda Pharmaceutical 4 0.0296 Tokio Marine Holdings 3 0.01
829 Tokyo Gas 3 0.01412 Toray Industries 3 0.01689 Toshiba 1 0.01337 Toyota Motor 14 0.07
AUSTRALIA (0.56%*) 1,166 5.76168 Amcor 1 0.01479 AMP 1 0.01294 Australia & New Zealand Banking Group 5 0.02
AUD1,300,000 Australia Government Bond 3% 20/09/2025 1,104 5.45299 BHP Billiton 5 0.02351 Brambles 2 0.01168 Commonwealth Bank of Australia 9 0.04
43 CSL 3 0.0244 Macquarie Group 2 0.01
272 National Australia Bank 5 0.0292 Rio Tinto 4 0.02
764 Scentre Group REIT** 2 0.01212 Suncorp Group 2 0.01652 Telstra 2 0.01304 Transurban Group 2 0.01109 Wesfarmers 3 0.01284 Westfield REIT** 1 0.01340 Westpac Banking 7 0.03151 Woodside Petroleum 3 0.02197 Woolworths 3 0.02
HONG KONG (0.56%*) 57 0.281,257 AIA Group 7 0.03
496 BOC Hong Kong Holdings 2 0.01869 Cheung Kong Property Holdings 5 0.02482 CK Hutchison Holdings 5 0.03692 CLP Holdings 6 0.03104 Hang Seng Bank 2 0.01
2,054 Hong Kong & China Gas 3 0.02159 Hong Kong Exchanges and Clearing 3 0.02820 Link REIT** 5 0.02507 Power Assets Holdings 4 0.02
1,234 Sun Hung Kai Properties 15 0.07
INDONESIA (1.62%*) 212 1.05IDR3,000,000,000 Indonesia Treasury Bond 11% 15/09/2025 212 1.05
MALAYSIA (1.54%*) 198 0.98MYR1,100,000 Malaysia Government Bond 4.048% 30/09/2021 198 0.98
SINGAPORE (0.06%*) 6 0.03157 DBS Group Holdings 2 0.01
1,100 Singapore Telecommunications 2 0.01107 United Overseas Bank 2 0.01
THAILAND (0.00%*) 160 0.79THB7,000,000 Thailand Government Bond 1.875% 17/06/2022 160 0.79
HUNGARY (0.00%*) 156 0.77HUF51,000,000 Hungary Government Bond 2.5% 27/10/2021 156 0.77
413
Holdingsor Nominal Values
MarketValue£'000
TotalNet
Assets
First State Diversified Growth Fund
Portfolio Statement (continued)
as at 31 July 2017
ISRAEL (0.05%*) - -
POLAND (0.00%*) 231 1.14PLN1,170,000 Poland Government Bond 2.5% 25/07/2026 231 1.14
RUSSIA (0.81%*) 129 0.64RUB10,300,000 Russian Federal Bond - OFZ 7.6% 14/04/2021 129 0.64
SOUTH AFRICA (1.36%*) 208 1.03ZAR3,200,000 South Africa Government Bond 10.5% 21/12/2026 208 1.03
TURKEY (1.35%*) 200 0.99TRY1,000,000 Turkey Government Bond 7.4% 05/02/2020 200 0.99
BRAZIL (1.98%*) 218 1.08BRL1,000,000 Brazil Letras do Tesouro Nacional 0% 01/01/2019 218 1.08
CHILE (0.00%) 2 0.01209 Antofagasta 2 0.01
MEXICO (1.28%*) 223 1.10MXN4,400,000 Mexican Bonos 10% 05/12/2024 223 1.10
DERIVATIVES (1.15%*) 137 0.67
Interest Rate Swap(12,500,000) Citibank Interest Rate Swap Pay PLN WIBOR Rec PLN 2.015% 26/10/2021 (2) (0.01)30,000,000 Citibank Interest Rate Swap Pay ZAR JIBAR Rec ZAR 8.185% 26/10/2026 56 0.2818,000,000 Citibank Interest Rate Swap Rec CNY LIBOR Pay CNY 3.652% 13/12/2021 - -
800,000,000 JP Morgan Interest Rate Swap Pay HUF BUBOR Rec HUF 1.634% 16/03/2022 74 0.36150,000,000 JP Morgan Interest Rate Swap Pay INR MIBOR Rec INR 6.62% 07/06/2021 32 0.15
24,000,000 JP Morgan Interest Rate Swap Pay NOK NIBOR Rec HUF 1.997% 16/03/2022 3 0.0241,000,000 JP Morgan Interest Rate Swap Pay ZAR JIBAR Rec ZAR 8.25% 15/02/2021 103 0.51
Future Contracts3 Amsterdam Index Futures August 2017 3 0.01
(24) Australian 10-Year Bond Futures September 2017 34 0.1755 Australian 3-Year Bond Futures September 2017 (16) (0.08)
(126) BIST 30 Futures August 2017 (24) (0.12)20 CAC40 10 Euro Futures August 2017 (9) (0.04)53 Canadian 10-Year Bond Futures September 2017 (52) (0.26)(5) DAX Index Future September 2017 62 0.31
(12) EURO STOXX 50 Futures September 2017 10 0.0518 Euro-BTP Futures September 2017 41 0.2018 FTSE 100 Index Futures September 2017 2 0.01
(57) FTSE China A50 Futures August 2017 2 0.0113 FTSE KLCI Futures August 2017 (1) -
(30) FTSE/JSE Top 40 Futures September 2017 (39) (0.19)7 Hang Seng Index Futures August 2017 13 0.06
15 IBEX 35 Index Futures August 2017 (8) (0.04)10 KOSPI2 Index Futures September 2017 (3) (0.01)
(35) Mexican BOLSA Index Futures September 2017 (23) (0.11)(50) MSCI Singapore Index Futures August 2017 (3) (0.01)35 MSCI Taiwan Index Futures August 2017 (6) (0.03)
(261) OBX Index August Future 2017 (18) (0.09)
414

Holdings Market
Value£'000
TotalNet
Assets
First State Diversified Growth Fund
Portfolio Statement (continued)
as at 31 July 2017
(18) OMXS30 Index Futures August 2017 13 0.06(32) SGX Nifty 50 Futures August 2017 (4) (0.02)16 SPI 200 Index Futures September 2017 (4) (0.02)12 Swiss Market Index Futures September 2017 (31) (0.15)
(13) Swiss Market Index Futures September 2017 (8) (0.04)(22) UK Long Gilt Bond Futures September 2017 5 0.02(25) US Treasury Note 10 Year Futures September 2017 1 -(11) S&P 500 E-mini Futures September 2017 (16) (0.08)
Forward Currency Contracts
Australian DollarSold AUD1,830,000 for GBP1,112,447 Settlement 29/08/2017 2 0.01
Brazilian RealBought BRL3,785,000 for USD1,195,477 Settlement 29/08/2017 5 0.02
Canadian DollarBought CAD3,321,000 for GBP2,035,418 Settlement 29/08/2017 (8) (0.04)
Czech KorunaBought CZK35,000,000 for GBP1,205,135 Settlement 29/08/2017 (4) (0.02)
Danish KroneSold DKK4,100,000 for GBP493,874 Settlement 29/08/2017 1 0.01
EuroBought EUR7,645,134 for GBP6,812,274 Settlement 04/08/2017 23 0.11Bought EUR560,000 for GBP501,484 Settlement 29/08/2017 (1) -Sold EUR2,200,000 for GBP1,970,115 Settlement 29/08/2017 2 0.01
Hungarian ForintSold HUF355,000,000 for GBP1,040,060 Settlement 29/08/2017 (3) (0.01)
Japanese YenBought JPY21,000,000 for GBP144,790 Settlement 29/08/2017 - -
Mexican PesoBought MXN12,954,000 for GBP556,536 Settlement 29/08/2017 (5) (0.02)
New Zealand DollarBought NZD1,035,000 for GBP589,288 Settlement 29/08/2017 - -
Norwegian KroneSold NOK10,500,000 for GBP1,008,364 Settlement 29/08/2017 3 0.01
Polish ZlotyBought PLN3,370,000 for GBP707,685 Settlement 29/08/2017 - -
Russian RubleBought RUB28,500,000 for USD473,314 Settlement 29/08/2017 (2) (0.01)
Singapore DollarBought SGD1,405,000 for GBP791,945 Settlement 29/08/2017 (4) (0.02)
South African RandSold ZAR8,300,000 for GBP485,875 Settlement 29/08/2017 7 0.03
Swedish KronaBought SEK2,200,000 for GBP206,244 Settlement 29/08/2017 - -
Swiss FrancSold CHF410,000 for GBP332,439 Settlement 29/08/2017 10 0.05
415
MarketValue£'000
TotalNet
Assets
First State Diversified Growth Fund
Portfolio Statement (continued)
as at 31 July 2017
Taiwan DollarBought TWD12,235,000 for USD404,905 Settlement 29/08/2017 1 -Bought THB9,700,000 for GBP222,424 Settlement 29/08/2017 - -
Turkish LiraSold TRY1,900,000 for GBP405,105 Settlement 29/08/2017 (2) (0.01)
US DollarBought USD1,051,297 for CLP683,650,000 Settlement 29/08/2017 5 0.02Bought USD1,133,054 for IDR15,135,000,000 Settlement 29/08/2017 - -Bought USD1,387,417 for AUD1,750,000 Settlement 29/08/2017 (5) (0.02)Bought USD1,804,243 for INR116,500,000 Settlement 29/08/2017 (4) (0.02)Bought USD8,973,616 for GBP6,973,753 Settlement 04/08/2017 (137) (0.68)Sold USD11,045,000 for GBP8,473,348 Settlement 29/08/2017 65 0.32Sold USD69,498 for GBP54,010 Settlement 04/08/2017 1 0.01
Portfolio of investments^ 17,233 85.07
Net other assets 3,024 14.93
Total net assets 20,257 100.00
# Exchange-traded fund.^ Including derivative liabilities.
All investments held are listed, unless otherwise stated.
Any derivative contracts were traded on an eligible derivatives exchange.* Comparative figures shown in brackets relate to 31 July 2016.** Real estate investment trust (REIT).
For the purposes of the portfolio holdings analysis, securities are shown based on their country of listing.
416
Share class B Accumulation
Change in net assets per share
Opening net asset value per share
Return before operating charges*
Operating charges
Return after operating charges*
Distributions
Retained distributions on accumulation shares
Closing net asset value per share (p)
* after direct transaction costs of:
Performance
Return after charges (%)
Other information
Closing net asset value (£’000)
Closing number of shares
Operating charges
Direct transaction costs
Prices
Highest share price
Lowest share price
Share class B Accumulation was launched on 23 June 2015.
103.67 90.90 98.26
0.27% 0.17% 0.08%
116.74 104.96 100.11
1.16% 1.25% 1.57%
6,202 5,191 4,904
5,364,357 4,966,750 4,968,700
10.63% 5.89% (1.30)%
115.62 104.51 98.70
0.30 0.17 0.08
2.12 1.25 -
11.11 5.81 (1.30)
(2.12) (1.25) -
12.40 7.02 (1.14)
(1.29) (1.21) (0.16)
104.51 98.70 100.00
First State Diversified Growth Fund
Comparative Tablefor the year ended 31 July 2017
Net Asset Value and Ongoing Charges Figure
Final 31 July 2017(p)
Final 31 July 2016(p)
Final 31 July 2015(p)
417
First State Diversified Growth Fund
Comparative Table (continued)
for the year ended 31 July 2017
Net Asset Value and Ongoing Charges Figure
Share class B Hedged Accumulation (EUR share class)
Change in net assets per share
Opening net asset value per share
Return before operating charges*
Operating charges
Return after operating charges*
Distributions
Retained distributions on accumulation shares
Closing net asset value per share (c)
* after direct transaction costs of:
Performance
Return after charges (%)
Other information
Closing net asset value (€’000)
Closing number of shares
Operating charges
Direct transaction costs
Prices
Highest share price
Lowest share price
Share class B Hedged Accumulation (EUR share class) was launched on 23 June 2015.
102.36 90.47 98.22
0.27% 0.17% 0.08%
113.97 103.72 100.11
1.23% 1.32% 1.63%
7,816 7,155 6,842
6,933,350 6,933,350 6,935,300
9.25% 4.60% (1.35)%
112.73 103.19 98.65
0.30 0.16 0.08
2.02 1.16 -
9.54 4.54 (1.35)
(2.02) (1.16) -
10.87 5.81 (1.19)
(1.33) (1.27) (0.16)
103.19 98.65 100.00
Final 31 July 2017(c)
Final 31 July 2016(c)
Final 31 July 2015(c)
418
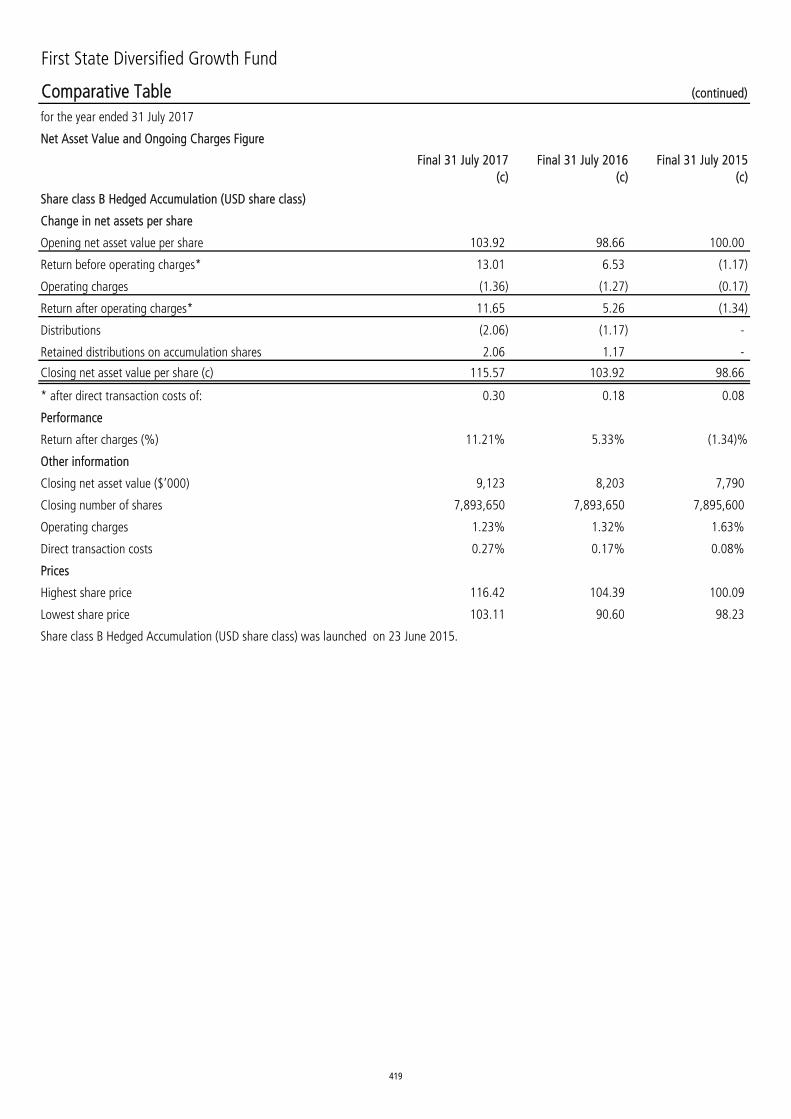
First State Diversified Growth Fund
Comparative Table (continued)
for the year ended 31 July 2017
Net Asset Value and Ongoing Charges Figure
Share class B Hedged Accumulation (USD share class)
Change in net assets per share
Opening net asset value per share
Return before operating charges*
Operating charges
Return after operating charges*
Distributions
Retained distributions on accumulation shares
Closing net asset value per share (c)
* after direct transaction costs of:
Performance
Return after charges (%)
Other information
Closing net asset value ($’000)
Closing number of shares
Operating charges
Direct transaction costs
Prices
Highest share price
Lowest share price
Share class B Hedged Accumulation (USD share class) was launched on 23 June 2015.
103.11 90.60 98.23
0.27% 0.17% 0.08%
116.42 104.39 100.09
1.23% 1.32% 1.63%
9,123 8,203 7,790
7,893,650 7,893,650 7,895,600
11.21% 5.33% (1.34)%
115.57 103.92 98.66
0.30 0.18 0.08
2.06 1.17 -
11.65 5.26 (1.34)
(2.06) (1.17) -
13.01 6.53 (1.17)
(1.36) (1.27) (0.17)
103.92 98.66 100.00
Final 31 July 2017(c)
Final 31 July 2016(c)
Final 31 July 2015(c)
419

First State Diversified Growth Fund
Comparative Table (continued)
for the year ended 31 July 2017
Net Asset Value and Ongoing Charges Figure
Share class Z Accumulation
Change in net assets per share
Opening net asset value per share
Return before operating charges*
Operating charges
Return after operating charges*
Distributions
Retained distributions on accumulation shares
Closing net asset value per share (p)
* after direct transaction costs of:
Performance
Return after charges (%)
Other information
Closing net asset value (£’000)
Closing number of shares
Operating charges
Direct transaction costs
Prices
Highest share price
Lowest share price
Share class Z Accumulation was launched on 23 June 2015.
104.28 91.25 98.32
0.27% 0.17% 0.08%
117.96 105.54 100.15
0.51% 0.60% 0.92%
117 105 101
100,050 100,050 102,000
11.22% 6.44% (1.24)%
116.91 105.12 98.76
0.30 0.17 0.08
2.72 1.76 -
11.79 6.36 (1.24)
(2.72) (1.76) -
12.36 6.94 (1.14)
(0.57) (0.58) (0.10)
105.12 98.76 100.00
Final 31 July 2017(p)
Final 31 July 2016(p)
Final 31 July 2015(p)
420
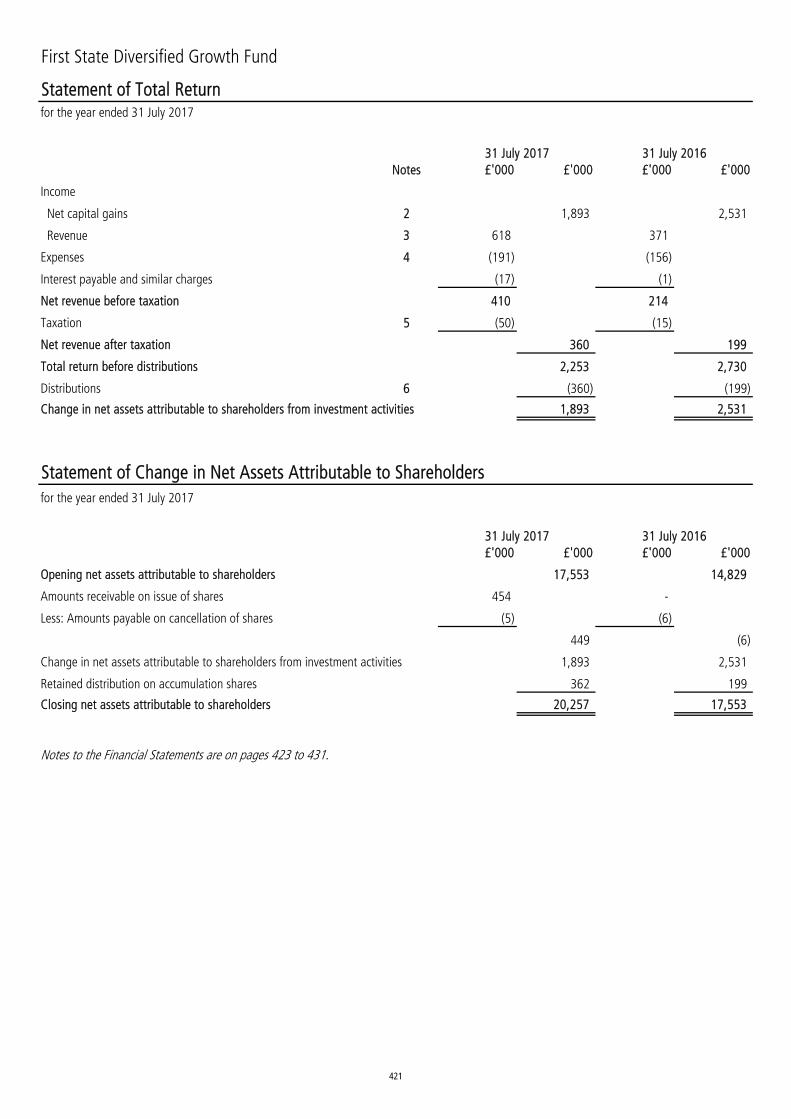
Notes £'000 £'000 £'000 £'000
Net capital gains 2 1,893 2,531
Revenue 3 618 371
4 (191) (156)
Interest payable and similar charges (17) (1)
410 214
5 (50) (15)
360 199
2,253 2,730
6 (360) (199)
1,893 2,531
£'000 £'000 £'000 £'000
17,553 14,829
454 -
(5) (6)
449 (6)
1,893 2,531
362 199
20,257 17,553
Less: Amounts payable on cancellation of shares
Change in net assets attributable to shareholders from investment activities
Retained distribution on accumulation shares
Closing net assets attributable to shareholders
Notes to the Financial Statements are on pages 423 to 431.
Amounts receivable on issue of shares
for the year ended 31 July 2017
31 July 2017 31 July 2016
Opening net assets attributable to shareholders
Statement of Change in Net Assets Attributable to Shareholders
Income
Expenses
Net revenue before taxation
Taxation
Net revenue after taxation
Total return before distributions
Distributions
Change in net assets attributable to shareholders from investment activities
31 July 2017 31 July 2016
First State Diversified Growth Fund
Statement of Total Returnfor the year ended 31 July 2017
421
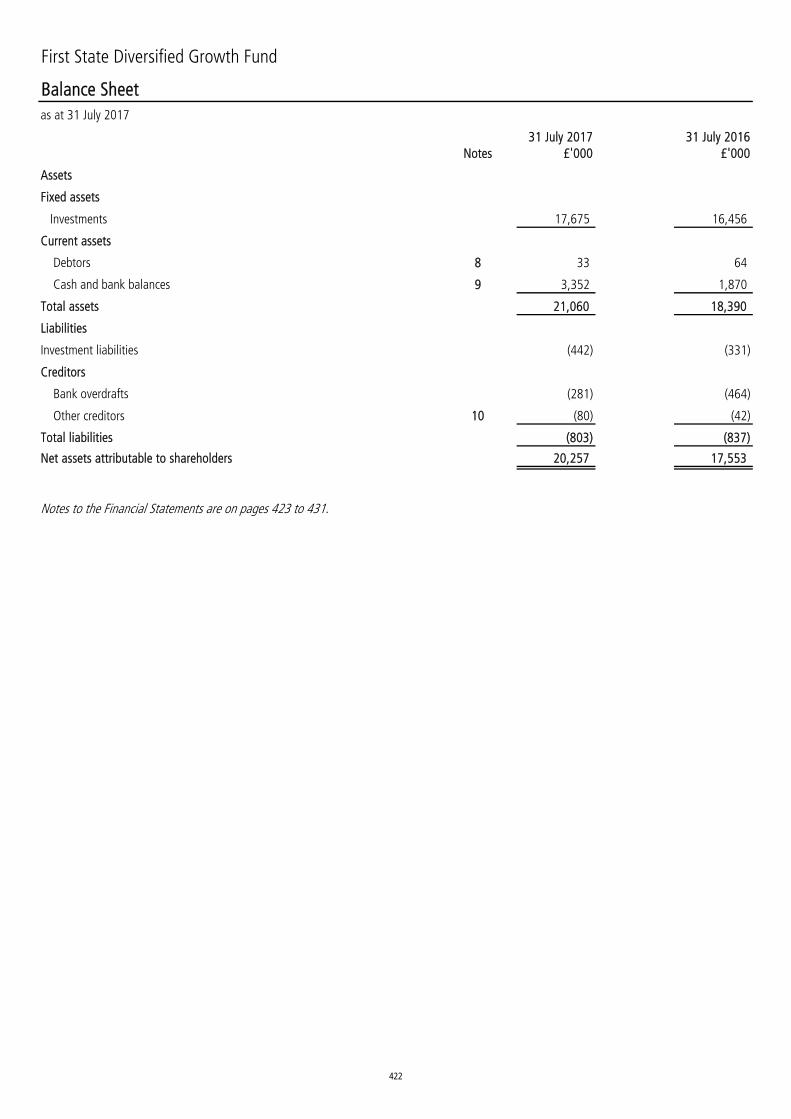
First State Diversified Growth Fund
31 July 2017 31 July 2016Notes £'000 £'000
Investments 17,675 16,456
Current assets
8 33 64
9 3,352 1,870
21,060 18,390
(442) (331)
Creditors
(281) (464)
Other creditors 10 (80) (42)
(803) (837)
20,257 17,553
Notes to the Financial Statements are on pages 423 to 431.
Bank overdrafts
Total liabilities
Net assets attributable to shareholders
Investment liabilities
Balance Sheetas at 31 July 2017
Assets
Fixed assets
Debtors
Cash and bank balances
Total assets
Liabilities
422
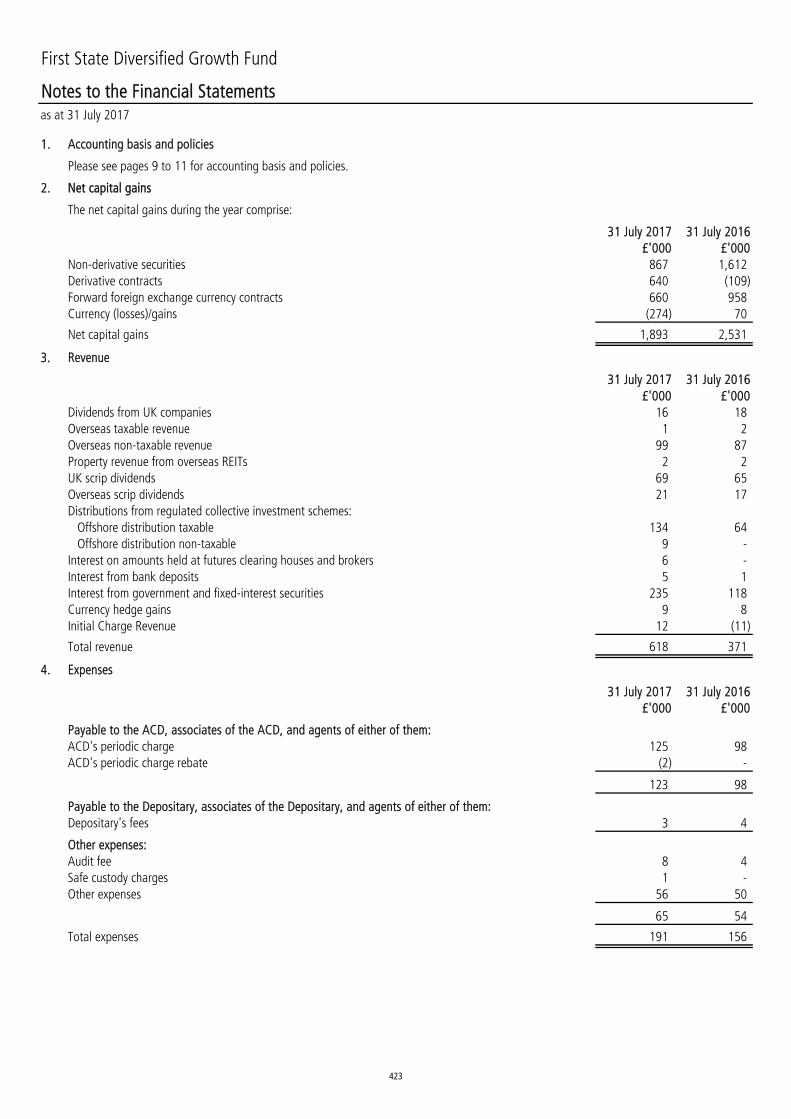
1.
2.
31 July 2017 31 July 2016£'000 £'000
867 1,612640 (109)660 958
(274) 70
1,893 2,531
3.
31 July 2017 31 July 2016£'000 £'000
16 181 2
99 872 2
69 6521 17
134 649 -6 -5 1
235 1189 8
12 (11)
618 371
4.
31 July 2017 31 July 2016£'000 £'000
125 98(2) -
123 98
3 4
8 41 -
56 50
65 54
191 156Total expenses
Audit feeSafe custody chargesOther expenses
Other expenses:
ACD's periodic charge rebate
Payable to the Depositary, associates of the Depositary, and agents of either of them:Depositary's fees
Expenses
Payable to the ACD, associates of the ACD, and agents of either of them:ACD's periodic charge
Currency hedge gainsInitial Charge Revenue
Total revenue
Interest on amounts held at futures clearing houses and brokersInterest from bank depositsInterest from government and fixed-interest securities
Offshore distribution taxable Offshore distribution non-taxable
Overseas scrip dividendsDistributions from regulated collective investment schemes:
Dividends from UK companiesOverseas taxable revenueOverseas non-taxable revenue
Notes to the Financial Statementsas at 31 July 2017
First State Diversified Growth Fund
Accounting basis and policies
Please see pages 9 to 11 for accounting basis and policies.
Net capital gains
The net capital gains during the year comprise:
Non-derivative securities
Net capital gains
Revenue
Derivative contractsForward foreign exchange currency contractsCurrency (losses)/gains
Property revenue from overseas REITsUK scrip dividends
423
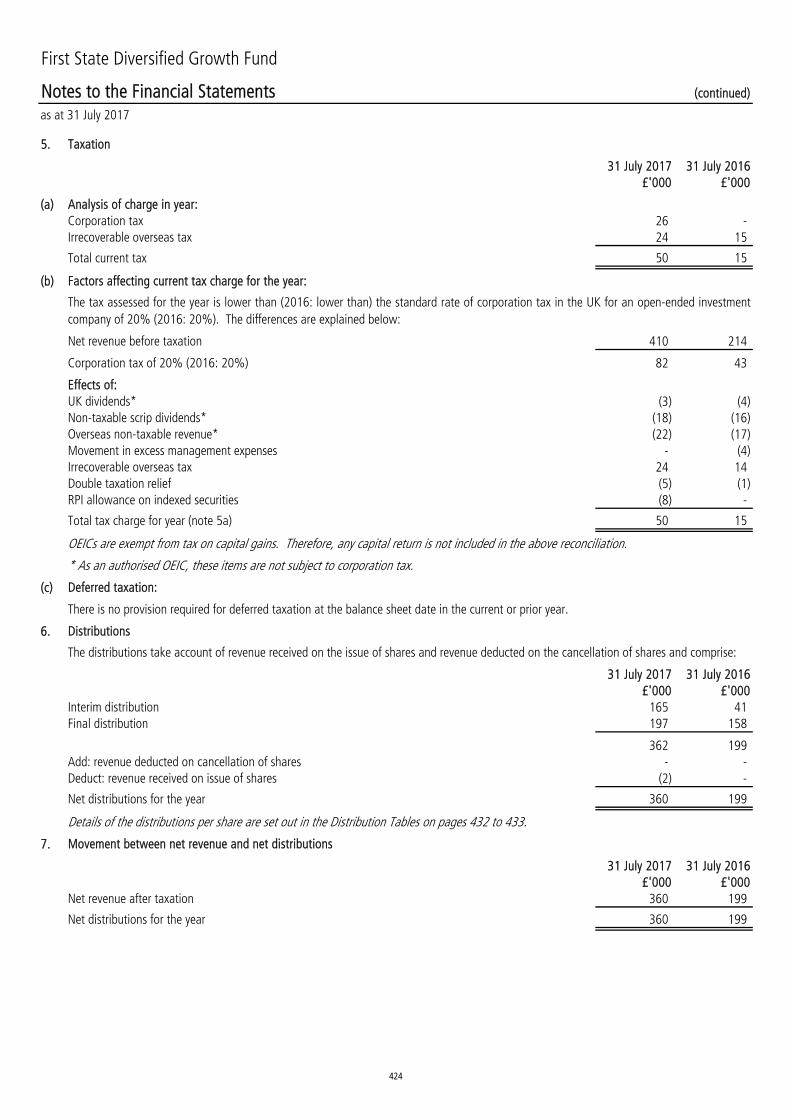
Notes to the Financial Statements (continued)
as at 31 July 2017
First State Diversified Growth Fund
5.
31 July 2017 31 July 2016£'000 £'000
(a)26 -24 15
50 15
(b)
410 214
82 43
(3) (4)(18) (16)(22) (17)
- (4)24 14(5) (1)(8) -
50 15
(c)
6.
31 July 2017 31 July 2016£'000 £'000
165 41197 158
362 199- -
(2) -
360 199
7.
31 July 2017 31 July 2016£'000 £'000
360 199
360 199Net distributions for the year
Details of the distributions per share are set out in the Distribution Tables on pages 432 to 433.
Movement between net revenue and net distributions
Net revenue after taxation
Add: revenue deducted on cancellation of sharesDeduct: revenue received on issue of shares
Net distributions for the year
Final distributionInterim distribution
Distributions
The distributions take account of revenue received on the issue of shares and revenue deducted on the cancellation of shares and comprise:
Deferred taxation:
There is no provision required for deferred taxation at the balance sheet date in the current or prior year.
Total tax charge for year (note 5a)
OEICs are exempt from tax on capital gains. Therefore, any capital return is not included in the above reconciliation.
* As an authorised OEIC, these items are not subject to corporation tax.
Double taxation reliefRPI allowance on indexed securities
Movement in excess management expensesIrrecoverable overseas tax
UK dividends*Non-taxable scrip dividends*Overseas non-taxable revenue*
Net revenue before taxation
Corporation tax of 20% (2016: 20%)
Effects of:
Factors affecting current tax charge for the year:
The tax assessed for the year is lower than (2016: lower than) the standard rate of corporation tax in the UK for an open-ended investmentcompany of 20% (2016: 20%). The differences are explained below:
Total current tax
Irrecoverable overseas tax
Analysis of charge in year:Corporation tax
Taxation
424
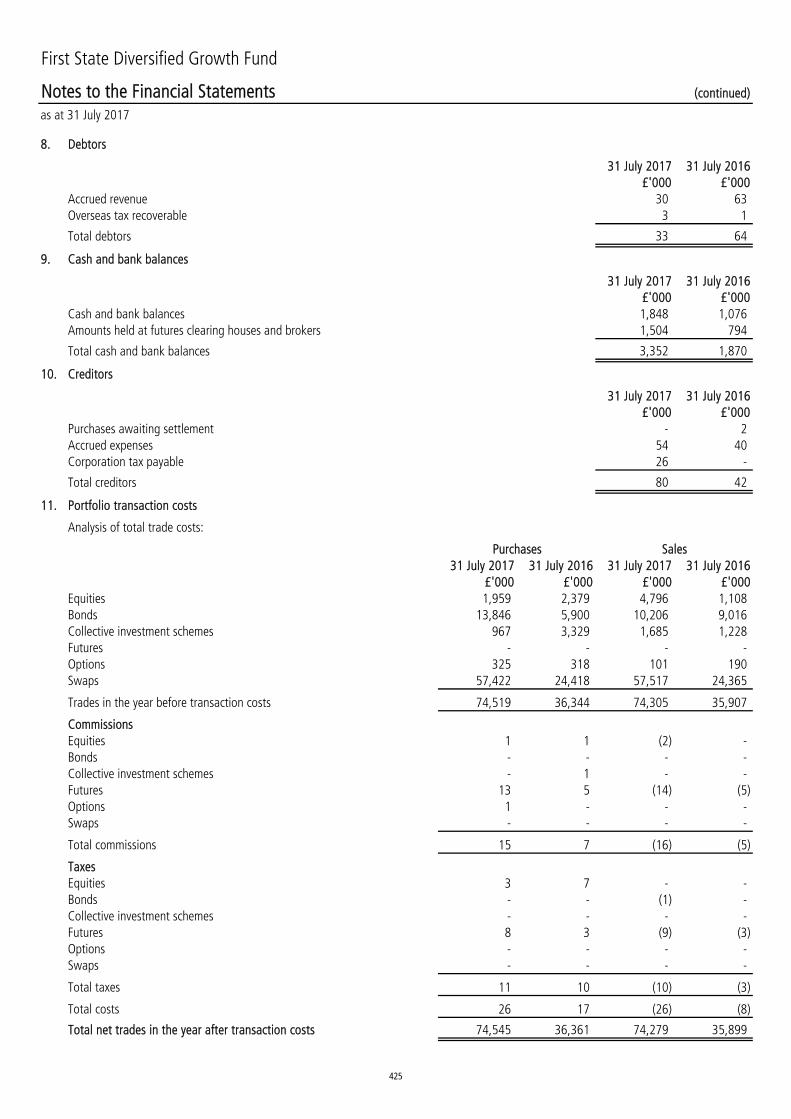
Notes to the Financial Statements (continued)
as at 31 July 2017
First State Diversified Growth Fund
8.
31 July 2017 31 July 2016£'000 £'000
30 633 1
33 64
9.
31 July 2017 31 July 2016£'000 £'0001,848 1,0761,504 794
3,352 1,870
10.
31 July 2017 31 July 2016£'000 £'000
- 254 4026 -
80 42
11.
31 July 2017 31 July 2016 31 July 2017 31 July 2016£'000 £'000 £'000 £'0001,959 2,379 4,796 1,108
13,846 5,900 10,206 9,016967 3,329 1,685 1,228
- - - -325 318 101 190
57,422 24,418 57,517 24,365
74,519 36,344 74,305 35,907
1 1 (2) -- - - -- 1 - -
13 5 (14) (5)1 - - -- - - -
15 7 (16) (5)
3 7 - -- - (1) -- - - -8 3 (9) (3)- - - -- - - -
11 10 (10) (3)
26 17 (26) (8)
74,545 36,361 74,279 35,899
Total taxes
Total costs
Total net trades in the year after transaction costs
Collective investment schemesFuturesOptionsSwaps
Total commissions
TaxesEquitiesBonds
Collective investment schemesFuturesOptionsSwaps
Trades in the year before transaction costs
CommissionsEquitiesBonds
Collective investment schemesFuturesOptionsSwaps
Analysis of total trade costs:
Purchases Sales
EquitiesBonds
Total creditors
Portfolio transaction costs
Purchases awaiting settlementAccrued expensesCorporation tax payable
Creditors
Amounts held at futures clearing houses and brokers
Total cash and bank balances
Total debtors
Cash and bank balances
Cash and bank balances
Overseas tax recoverableAccrued revenue
Debtors
425
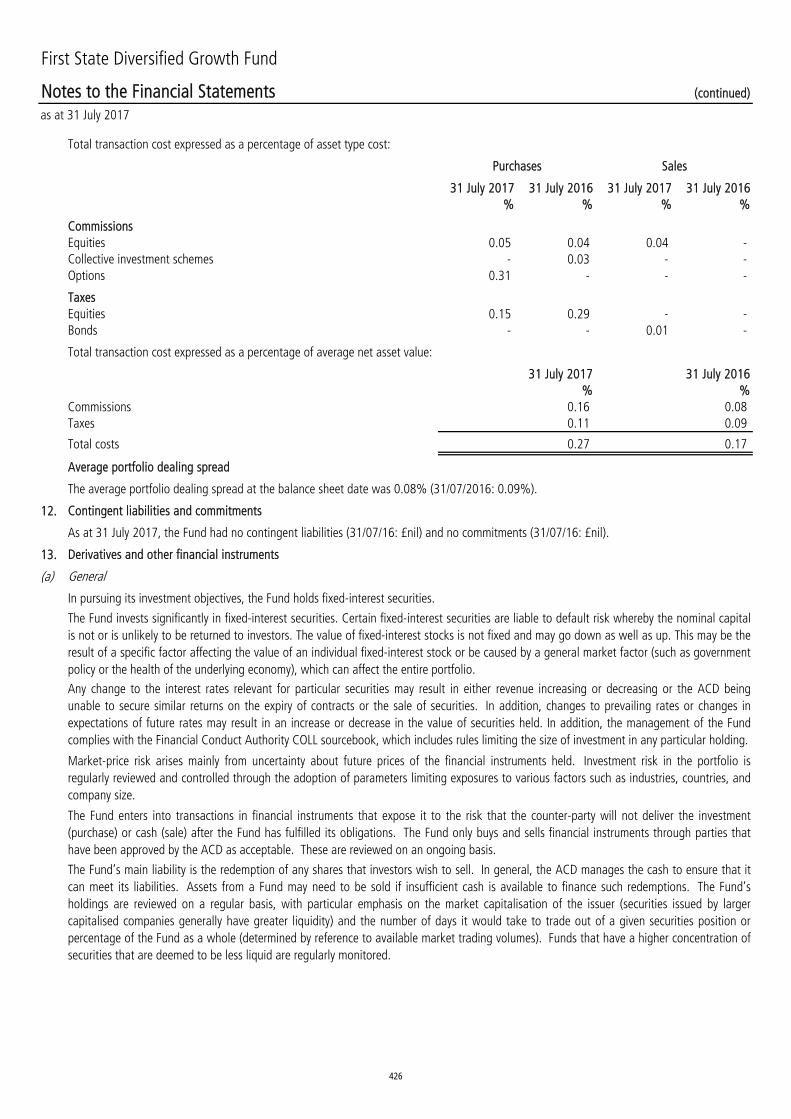
Notes to the Financial Statements (continued)
as at 31 July 2017
First State Diversified Growth Fund
31 July 2017 31 July 2016 31 July 2017 31 July 2016% % % %
0.05 0.04 0.04 -- 0.03 - -
0.31 - - -
0.15 0.29 - -- - 0.01 -
12.
13.
(a)
Market-price risk arises mainly from uncertainty about future prices of the financial instruments held. Investment risk in the portfolio isregularly reviewed and controlled through the adoption of parameters limiting exposures to various factors such as industries, countries, andcompany size.
The Fund enters into transactions in financial instruments that expose it to the risk that the counter-party will not deliver the investment(purchase) or cash (sale) after the Fund has fulfilled its obligations. The Fund only buys and sells financial instruments through parties thathave been approved by the ACD as acceptable. These are reviewed on an ongoing basis.
The Fund’s main liability is the redemption of any shares that investors wish to sell. In general, the ACD manages the cash to ensure that itcan meet its liabilities. Assets from a Fund may need to be sold if insufficient cash is available to finance such redemptions. The Fund’sholdings are reviewed on a regular basis, with particular emphasis on the market capitalisation of the issuer (securities issued by largercapitalised companies generally have greater liquidity) and the number of days it would take to trade out of a given securities position orpercentage of the Fund as a whole (determined by reference to available market trading volumes). Funds that have a higher concentration ofsecurities that are deemed to be less liquid are regularly monitored.
Derivatives and other financial instruments
General
In pursuing its investment objectives, the Fund holds fixed-interest securities.
The Fund invests significantly in fixed-interest securities. Certain fixed-interest securities are liable to default risk whereby the nominal capitalis not or is unlikely to be returned to investors. The value of fixed-interest stocks is not fixed and may go down as well as up. This may be theresult of a specific factor affecting the value of an individual fixed-interest stock or be caused by a general market factor (such as governmentpolicy or the health of the underlying economy), which can affect the entire portfolio.
Any change to the interest rates relevant for particular securities may result in either revenue increasing or decreasing or the ACD beingunable to secure similar returns on the expiry of contracts or the sale of securities. In addition, changes to prevailing rates or changes inexpectations of future rates may result in an increase or decrease in the value of securities held. In addition, the management of the Fundcomplies with the Financial Conduct Authority COLL sourcebook, which includes rules limiting the size of investment in any particular holding.
Contingent liabilities and commitments
As at 31 July 2017, the Fund had no contingent liabilities (31/07/16: £nil) and no commitments (31/07/16: £nil).
The average portfolio dealing spread at the balance sheet date was 0.08% (31/07/2016: 0.09%).
Total costs 0.27 0.17
Average portfolio dealing spread
Commissions 0.16 0.08Taxes 0.11 0.09
Total transaction cost expressed as a percentage of average net asset value:
31 July 2017 31 July 2016% %
EquitiesBonds
Taxes
CommissionsEquitiesCollective investment schemesOptions
Total transaction cost expressed as a percentage of asset type cost:
Purchases Sales
426
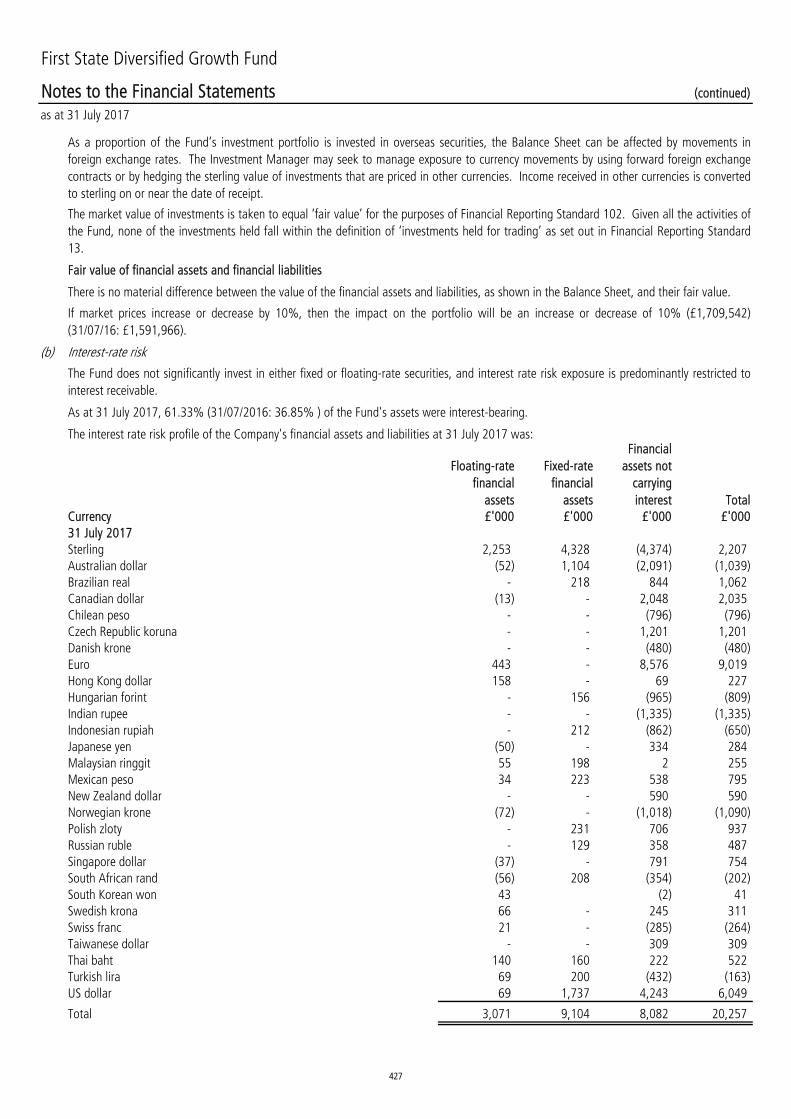
Notes to the Financial Statements (continued)
as at 31 July 2017
First State Diversified Growth Fund
(b)
Floating-rate financial
assets
Fixed-rate financial
assets
Financial assets not
carrying interest Total
Currency £'000 £'000 £'000 £'00031 July 2017Sterling 2,253 4,328 (4,374) 2,207Australian dollar (52) 1,104 (2,091) (1,039)Brazilian real - 218 844 1,062Canadian dollar (13) - 2,048 2,035Chilean peso - - (796) (796)Czech Republic koruna - - 1,201 1,201Danish krone - - (480) (480)Euro 443 - 8,576 9,019Hong Kong dollar 158 - 69 227Hungarian forint - 156 (965) (809)Indian rupee - - (1,335) (1,335)Indonesian rupiah - 212 (862) (650)Japanese yen (50) - 334 284Malaysian ringgit 55 198 2 255Mexican peso 34 223 538 795New Zealand dollar - - 590 590Norwegian krone (72) - (1,018) (1,090)Polish zloty - 231 706 937Russian ruble - 129 358 487Singapore dollar (37) - 791 754South African rand (56) 208 (354) (202)South Korean won 43 (2) 41Swedish krona 66 - 245 311Swiss franc 21 - (285) (264)Taiwanese dollar - - 309 309Thai baht 140 160 222 522Turkish lira 69 200 (432) (163)US dollar 69 1,737 4,243 6,049
Total 3,071 9,104 8,082 20,257
As at 31 July 2017, 61.33% (31/07/2016: 36.85% ) of the Fund's assets were interest-bearing.
The interest rate risk profile of the Company's financial assets and liabilities at 31 July 2017 was:
There is no material difference between the value of the financial assets and liabilities, as shown in the Balance Sheet, and their fair value.
If market prices increase or decrease by 10%, then the impact on the portfolio will be an increase or decrease of 10% (£1,709,542)(31/07/16: £1,591,966).
Interest-rate risk
The Fund does not significantly invest in either fixed or floating-rate securities, and interest rate risk exposure is predominantly restricted tointerest receivable.
As a proportion of the Fund’s investment portfolio is invested in overseas securities, the Balance Sheet can be affected by movements inforeign exchange rates. The Investment Manager may seek to manage exposure to currency movements by using forward foreign exchangecontracts or by hedging the sterling value of investments that are priced in other currencies. Income received in other currencies is convertedto sterling on or near the date of receipt.
The market value of investments is taken to equal ‘fair value’ for the purposes of Financial Reporting Standard 102. Given all the activities ofthe Fund, none of the investments held fall within the definition of ‘investments held for trading’ as set out in Financial Reporting Standard13.
Fair value of financial assets and financial liabilities
427

Notes to the Financial Statements (continued)
as at 31 July 2017
First State Diversified Growth Fund
Floating-rate financial
assets
Fixed-rate financial
assets
Financial assets not
carrying interest Total
Currency £'000 £'000 £'000 £'00031 July 2016Sterling 1,536 3,715 7,215 12,466Australian dollar 21 - 94 115Brazilian real - 348 572 920Canadian dollar (19) - 245 226Chilean peso - - 529 529Czech Republic koruna - - (59) (59)Danish krone - - (407) (407)Euro 2 - 699 701Hong Kong dollar 63 - 71 134Hungarian forint - - (573) (573)Indian rupee - - (61) (61)Indonesian rupiah - 285 (593) (308)Israeli new shekel - - 8 8Japanese yen (139) - 307 168Malaysian ringgit 28 270 276 574Mexican peso 10 224 268 502New Zealand dollar - - (83) (83)Norwegian krone (73) - 52 (21)Polish zloty - - 1,140 1,140Russian ruble - 142 (75) 67Singapore dollar (49) - (508) (557)South African rand (20) 239 465 684South Korean won 42 - (785) (743)Swedish krona (15) - (423) (438)Swiss franc (72) - (151) (223)Taiwanese dollar - - (333) (333)Thai baht 106 - 320 426Turkish lira 47 237 831 1,115US dollar (62) - 1,646 1,584
Total 1,406 5,460 10,687 17,553
(c)
The following summarises the sterling value of currencies of the Fund in which the investments, including cash, debtors and creditors, aredenominated.
Analysis of the Fund's currency exposure
428
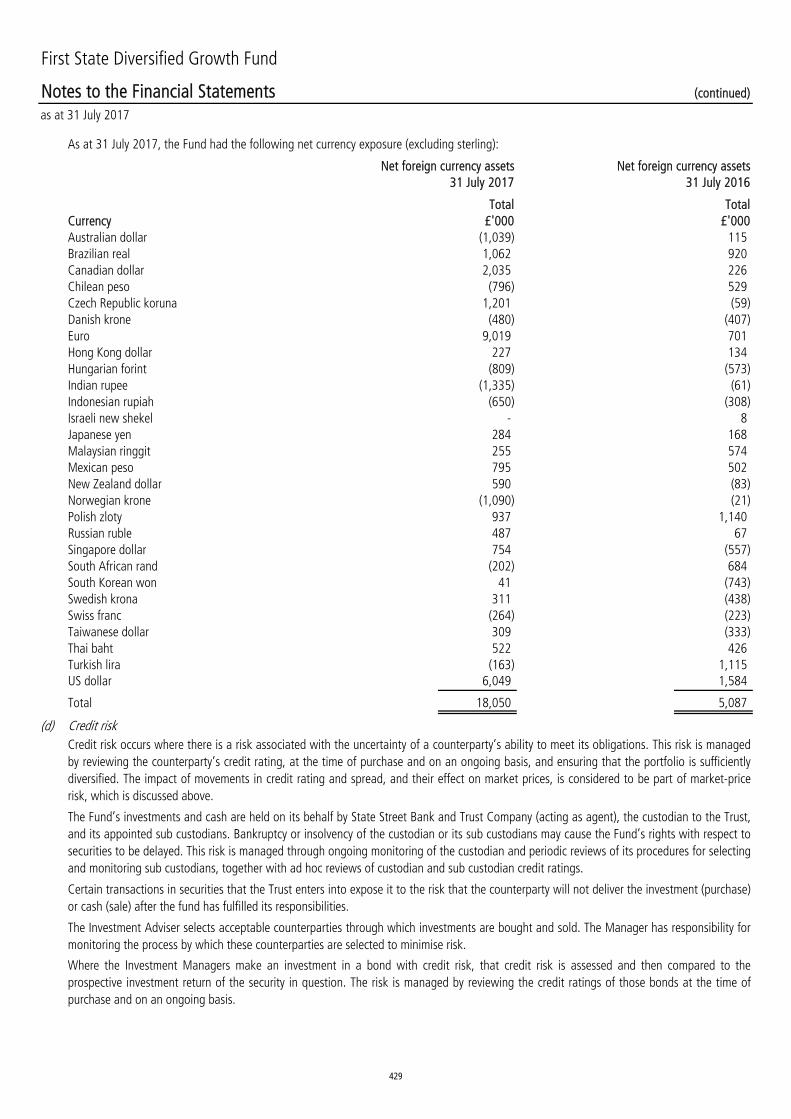
Notes to the Financial Statements (continued)
as at 31 July 2017
First State Diversified Growth Fund
Total TotalCurrency £'000 £'000Australian dollar (1,039) 115Brazilian real 1,062 920Canadian dollar 2,035 226Chilean peso (796) 529Czech Republic koruna 1,201 (59)Danish krone (480) (407)Euro 9,019 701Hong Kong dollar 227 134Hungarian forint (809) (573)Indian rupee (1,335) (61)Indonesian rupiah (650) (308)Israeli new shekel - 8Japanese yen 284 168Malaysian ringgit 255 574Mexican peso 795 502New Zealand dollar 590 (83)Norwegian krone (1,090) (21)Polish zloty 937 1,140Russian ruble 487 67Singapore dollar 754 (557)South African rand (202) 684South Korean won 41 (743)Swedish krona 311 (438)Swiss franc (264) (223)Taiwanese dollar 309 (333)Thai baht 522 426Turkish lira (163) 1,115US dollar 6,049 1,584
Total 18,050 5,087
(d) Credit riskCredit risk occurs where there is a risk associated with the uncertainty of a counterparty’s ability to meet its obligations. This risk is managedby reviewing the counterparty’s credit rating, at the time of purchase and on an ongoing basis, and ensuring that the portfolio is sufficientlydiversified. The impact of movements in credit rating and spread, and their effect on market prices, is considered to be part of market-pricerisk, which is discussed above.
Where the Investment Managers make an investment in a bond with credit risk, that credit risk is assessed and then compared to theprospective investment return of the security in question. The risk is managed by reviewing the credit ratings of those bonds at the time ofpurchase and on an ongoing basis.
The Fund’s investments and cash are held on its behalf by State Street Bank and Trust Company (acting as agent), the custodian to the Trust,and its appointed sub custodians. Bankruptcy or insolvency of the custodian or its sub custodians may cause the Fund’s rights with respect tosecurities to be delayed. This risk is managed through ongoing monitoring of the custodian and periodic reviews of its procedures for selectingand monitoring sub custodians, together with ad hoc reviews of custodian and sub custodian credit ratings.
Certain transactions in securities that the Trust enters into expose it to the risk that the counterparty will not deliver the investment (purchase)or cash (sale) after the fund has fulfilled its responsibilities.
The Investment Adviser selects acceptable counterparties through which investments are bought and sold. The Manager has responsibility formonitoring the process by which these counterparties are selected to minimise risk.
As at 31 July 2017, the Fund had the following net currency exposure (excluding sterling):
Net foreign currency assets Net foreign currency assets31 July 2017 31 July 2016
429
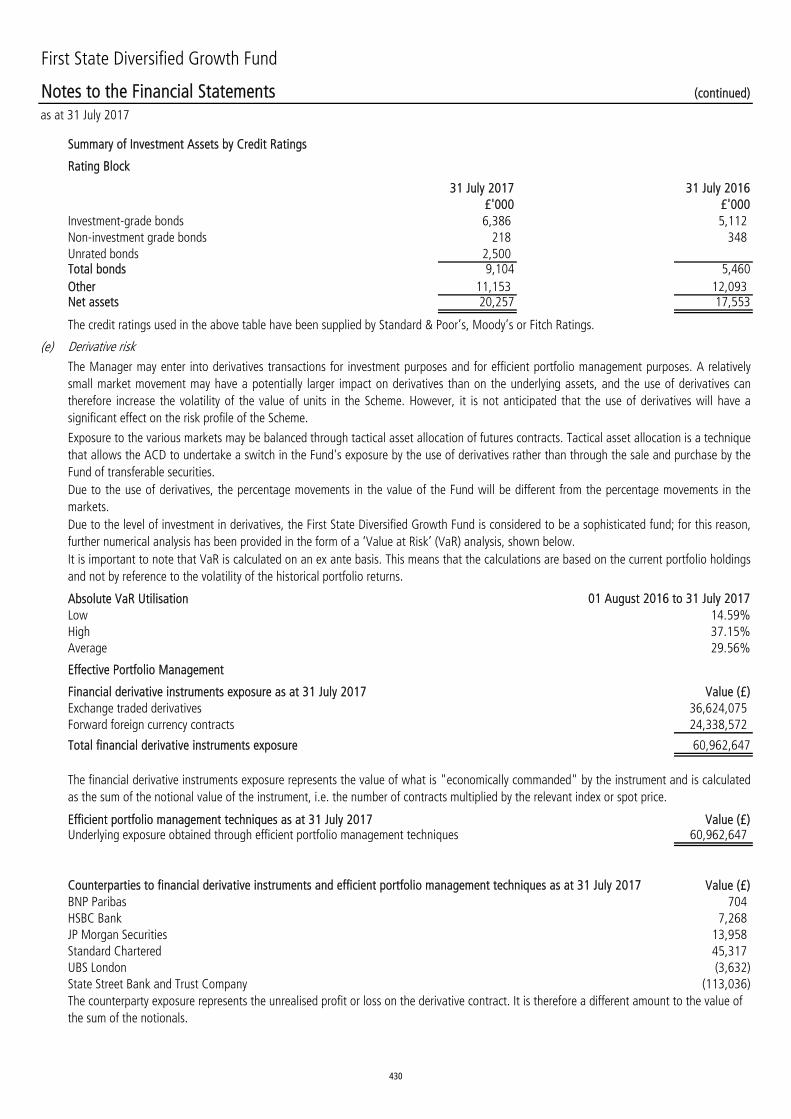
Notes to the Financial Statements (continued)
as at 31 July 2017
First State Diversified Growth Fund
Rating Block
31 July 2017 31 July 2016£'000 £'000
Investment-grade bonds 6,386 5,112Non-investment grade bonds 218 348Unrated bonds 2,500Total bonds 9,104 5,460Other 11,153 12,093Net assets 20,257 17,553
(e)
Absolute VaR UtilisationLow 14.59%High 37.15%Average 29.56%
Financial derivative instruments exposure as at 31 July 2017 Value (£)Exchange traded derivatives 36,624,075Forward foreign currency contracts 24,338,572
Total financial derivative instruments exposure 60,962,647
Efficient portfolio management techniques as at 31 July 2017 Value (£)Underlying exposure obtained through efficient portfolio management techniques 60,962,647
Value (£)BNP Paribas 704HSBC Bank 7,268JP Morgan Securities 13,958Standard Chartered 45,317UBS London (3,632)State Street Bank and Trust Company (113,036)
Effective Portfolio Management
Counterparties to financial derivative instruments and efficient portfolio management techniques as at 31 July 2017
The counterparty exposure represents the unrealised profit or loss on the derivative contract. It is therefore a different amount to the value of the sum of the notionals.
Derivative riskThe Manager may enter into derivatives transactions for investment purposes and for efficient portfolio management purposes. A relativelysmall market movement may have a potentially larger impact on derivatives than on the underlying assets, and the use of derivatives cantherefore increase the volatility of the value of units in the Scheme. However, it is not anticipated that the use of derivatives will have asignificant effect on the risk profile of the Scheme.
Exposure to the various markets may be balanced through tactical asset allocation of futures contracts. Tactical asset allocation is a techniquethat allows the ACD to undertake a switch in the Fund's exposure by the use of derivatives rather than through the sale and purchase by theFund of transferable securities.Due to the use of derivatives, the percentage movements in the value of the Fund will be different from the percentage movements in themarkets.
It is important to note that VaR is calculated on an ex ante basis. This means that the calculations are based on the current portfolio holdingsand not by reference to the volatility of the historical portfolio returns.
Summary of Investment Assets by Credit Ratings
The credit ratings used in the above table have been supplied by Standard & Poor’s, Moody’s or Fitch Ratings.
Due to the level of investment in derivatives, the First State Diversified Growth Fund is considered to be a sophisticated fund; for this reason,further numerical analysis has been provided in the form of a ‘Value at Risk’ (VaR) analysis, shown below.
01 August 2016 to 31 July 2017
The financial derivative instruments exposure represents the value of what is "economically commanded" by the instrument and is calculatedas the sum of the notional value of the instrument, i.e. the number of contracts multiplied by the relevant index or spot price.
430
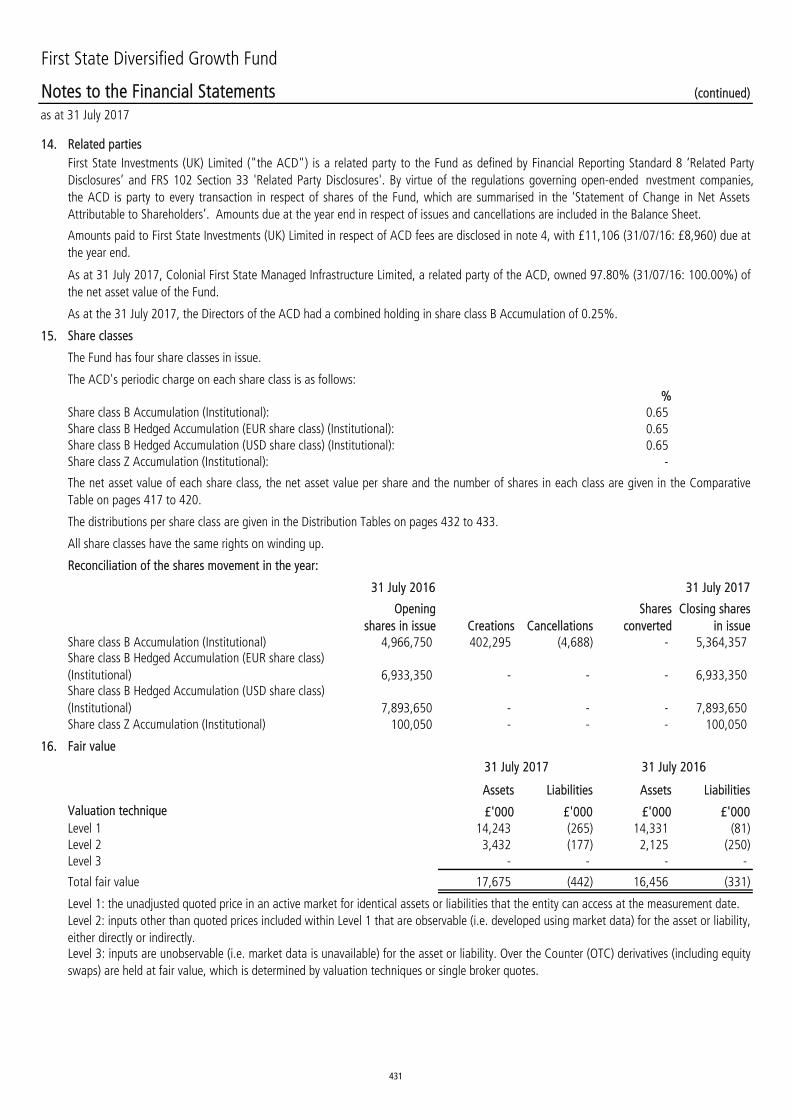
Notes to the Financial Statements (continued)
as at 31 July 2017
First State Diversified Growth Fund
14.
15.
%0.650.650.65
-
31 July 2016 31 July 2017
Opening shares in issue Creations Cancellations
Shares converted
Closing shares in issue
4,966,750 402,295 (4,688) - 5,364,357
6,933,350 - - - 6,933,350
7,893,650 - - - 7,893,650100,050 - - - 100,050
16.
Assets Liabilities Assets Liabilities
£'000 £'000 £'000 £'00014,243 (265) 14,331 (81)
3,432 (177) 2,125 (250)- - - -
17,675 (442) 16,456 (331)
Level 3: inputs are unobservable (i.e. market data is unavailable) for the asset or liability. Over the Counter (OTC) derivatives (including equityswaps) are held at fair value, which is determined by valuation techniques or single broker quotes.
Level 1Level 2Level 3
Total fair value
Level 1: the unadjusted quoted price in an active market for identical assets or liabilities that the entity can access at the measurement date. Level 2: inputs other than quoted prices included within Level 1 that are observable (i.e. developed using market data) for the asset or liability,either directly or indirectly.
Fair value
Valuation technique
31 July 2017 31 July 2016
Share class Z Accumulation (Institutional)
All share classes have the same rights on winding up.
Reconciliation of the shares movement in the year:
Share class B Accumulation (Institutional)Share class B Hedged Accumulation (EUR share class) (Institutional)Share class B Hedged Accumulation (USD share class) (Institutional)
The net asset value of each share class, the net asset value per share and the number of shares in each class are given in the ComparativeTable on pages 417 to 420.
The distributions per share class are given in the Distribution Tables on pages 432 to 433.
The ACD's periodic charge on each share class is as follows:
Share class B Accumulation (Institutional):Share class B Hedged Accumulation (EUR share class) (Institutional):Share class B Hedged Accumulation (USD share class) (Institutional):Share class Z Accumulation (Institutional):
As at 31 July 2017, Colonial First State Managed Infrastructure Limited, a related party of the ACD, owned 97.80% (31/07/16: 100.00%) ofthe net asset value of the Fund.
As at the 31 July 2017, the Directors of the ACD had a combined holding in share class B Accumulation of 0.25%.
Share classes
The Fund has four share classes in issue.
Amounts paid to First State Investments (UK) Limited in respect of ACD fees are disclosed in note 4, with £11,106 (31/07/16: £8,960) due atthe year end.
Related partiesFirst State Investments (UK) Limited ("the ACD") is a related party to the Fund as defined by Financial Reporting Standard 8 ‘Related Party Disclosures’ and FRS 102 Section 33 'Related Party Disclosures'. By virtue of the regulations governing open-ended investment companies, the ACD is party to every transaction in respect of shares of the Fund, which are summarised in the ‘Statement of Change in Net Assets Attributable to Shareholders’. Amounts due at the year end in respect of issues and cancellations are included in the Balance Sheet.
431
Share class B Accumulation
Netrevenue Equalisation
Distributions paid to/payable
30/09/2017
Distributions paid
30/09/2016Group 1 (p) (p) (p) (p)Interim 0.9781 - 0.9781 0.2793Final 1.1370 - 1.1370 0.9668Group 2 (p) (p) (p) (p)Interim 0.5099 0.4682 0.9781 0.2793Final 0.6152 0.5218 1.1370 0.9668
Share class B Hedged Accumulation (EUR share class)
Netrevenue Equalisation
Distributions paid to/payable
30/09/2017
Distributions paid
30/09/2016Group 1 (c) (c) (c) (c)Interim 0.9364 - 0.9364 0.2391Final 1.0799 - 1.0799 0.9160Group 2 (c) (c) (c) (c)Interim 0.9364 - 0.9364 0.2391Final 1.0799 - 1.0799 0.9160
Share class B Hedged Accumulation (USD share class)
Netrevenue Equalisation
Distributions paid to/payable
30/09/2017
Distributions paid
30/09/2016Group 1 (c) (c) (c) (c)Interim 0.9367 - 0.9367 0.2495Final 1.1189 - 1.1189 0.9187Group 2 (c) (c) (c) (c)Interim 0.9367 - 0.9367 0.2495Final 1.1189 - 1.1189 0.9187
Final - Shares purchased between 1 February 2017 and 31 July 2017Group 2 Interim - Shares purchased between 1 August 2016 and 31 January 2017
Final - Shares purchased prior to 1 February 2017
Distribution in pence and cents per share
First State Diversified Growth Fund
Distribution Tablesfor the year ended 31 July 2017
Group 1 Interim - Shares purchased prior to 1 August 2016
432

First State Diversified Growth Fund
Distribution Tables (continued)
for the year ended 31 July 2017
Share class Z Accumulation
Netrevenue Equalisation
Distributions paid to/payable
30/09/2017
Distributions paid
30/09/2016Group 1 (p) (p) (p) (p)Interim 1.2765 - 1.2765 0.5755Final 1.4476 - 1.4476 1.1796Group 2 (p) (p) (p) (p)Interim 1.2765 - 1.2765 0.5755Final 1.4476 - 1.4476 1.1796
Shareholders should consult their professional advisers for any advice regarding their tax position.
Final - 79.19% of the dividend is received as franked investment income.
Final - 15.97% of the dividend is received as an annual payment (non-foreign element) received after the deduction of income tax at the lower rateand is liable to corporation tax. The tax deemed to be deducted is treated as income tax.
Final - 4.84% of the dividend is received as an annual payment (foreign element) received after the deduction of income tax at the lower rate and isliable to corporation tax. It is treated as foreign income in the hands of the corporate investor and is liable to corporation tax. The associateddeemed tax is treated as foreign tax in the hands of the investor, who may be able to claim double tax relief. Investors cannot reclaim any of thisdeemed tax on the foreign element from HM Revenue & Customs.
Interim - 52.55% of the dividend is received as franked investment income.
Interim - 43.10% of the dividend is received as an annual payment (non-foreign element) received after the deduction of income tax at the lowerrate and is liable to corporation tax. The tax deemed to be deducted is treated as income tax.
Interim - 4.35% of the dividend is received as an annual payment (foreign element) received after the deduction of income tax at the lower rate andis liable to corporation tax. It is treated as foreign income in the hands of the corporate investor and is liable to corporation tax. The associateddeemed tax is treated as foreign tax in the hands of the investor, who may be able to claim double tax relief. Investors cannot reclaim any of thisdeemed tax on the foreign element from HM Revenue & Customs.
Corporate tax for all share classes (unaudited)
A shareholder liable to corporation tax receives this distribution, excluding equalisation, as follows:
433
Risks and reward profile
Lower Risk Higher Risk
Potentially Lower Rewards Potentially Higher Rewards
1 2 3 4 5 6 7
1 2 3 4 5 6 7
1 2 3 4 5 6 7
1 2 3 4 5 6 7
1 2 3 4 5 6 7
1 2 3 4 5 6 7
Performance
The Fund rose by 4.1% in sterling terms over the year and has provided cumulative returns of 32.2% and 53.1% over three and five yearsrespectively to 31 July 2017.
During this year, Sun Hung Kai Properties (Hong Kong: Diversified) and Hongkong Land Holdings (Singapore: Diversified) gained on their exposureto the robust Hong Kong Central office markets. New supply remains constrained, cap rate stays firm supporting stable rental and capital valuegrowth. Sumitomo Realty & Development (Japan: Diversified) rallied on solid earnings numbers on the back of improving office portfolio’soccupancy and better profit margin from the condominium segment.
Westfield Corp (Australia: Retail) underperformed on concerns that the US retail market – a key area of operations – faces a challenging operatingenvironment. Japan Rental Housing Investments REIT (Japan: Diversified) and Kenedix Retail REIT (Japan: Retail) also lagged.
For further information on risks, please refer to the Risk Factors section in the Company's prospectus.
Property securities risk: the Fund invests in the shares of companies that are involved in property (like real estate investment trusts) rather thanproperty itself. The value of these investments may fluctuate more than actual property.
Single-sector risk: investing in a single sector may be riskier than investing in a number of different sectors. Investing in a larger number of sectorshelps spread risk.
Emerging market risk: emerging markets may not provide the same level of investor protection as a developed market; they may involve a higherrisk than investing in developed markets.
• Even the lowest rating 1 does not mean a risk-free investment;
• On a scale of 1 (less risky) to 7 (more risky), this Fund has a rating of 6 due to its past performance and the nature of its investments. Shares witha rating of 6 might have higher risks, but also higher returns;
• Risk is taken in order to make a higher potential return; the more risk a Fund takes, the higher the potential return but the greater the risk of loss;and
• The value of the Fund and its return is not guaranteed and may fall as well as rise. You may get back less than you originally invested.
The Fund might also experience the following risks:
• The synthetic risk reward indicator (the SRRI) rating is not a measure of the risk of you losing your investment but describes how much the valueof the Fund went up and down in the past;
• The SRRI rating is based on historical data, which may not be a reliable indication of the future risks and rewards of the Fund;
• We cannot guarantee that the rating of the Fund will remain the same; it may change over time;
Share class A Accumulation (EUR share class)
Share class A Income (EUR share class)
Share class A Accumulation
Share class A Income
Share class B Accumulation
Share class B Income
The Fund aims to achieve a total investment return consistent with income and long-term capital growth.
The Fund primarily invests in a broad selection of Asian securities issued by real estate investment trusts or companies that own, develop or managereal property. The Fund may also invest in Australian and New Zealand securities of a similar type.
First State Asian Property Securities Fund
Authorised Fund Manager's Reportfor the year ended 31 July 2017
Investment Objective and Policy
434
First State Asian Property Securities Fund
Authorised Fund Manager's Reportfor the year ended 31 July 2017
Time 3 6 1 3 5 10 Sinceperiod mths mths yr yrs yrs yrs launch
1.9 2.8 4.1 32.2 53.1 37.2 78.31.1 1.9 2.2 31.3 60.6 79.1 110.41.5 3.5 5.8 22.5 46.3 31.2 46.5
1 3 3 2 2 2 2
12 mths to 12 mths to 12 mths to 12 mths to 12 mths to31/07/17 31/07/16 31/07/15 31/07/14 31/07/13
4.1 21.1 4.8 (2.6) 18.9
31 July 2017 31 July 2016% of Fund % of Fund
8.94 8.728.52 7.335.01 6.685.00 5.864.79 5.294.70 4.884.59 4.584.30 4.314.19 4.014.12 3.89
Types of sharesIncome and Accumulation.
Vicinity Centres REIT New South ResourcesJapan Rental Housing Investments REIT Kenedix Retail REITNational Storage REIT Mitsubishi Estate
Sumitomo Realty & Development Scentre Group REITCheung Kong Property Holdings Japan Rental Housing Investments REITMitsubishi Estate Hongkong Land Holdings
Mitsui Fudosan Mitsui FudosanKenedix Office Investment REIT Westfield REITWestfield REIT Sumitomo Realty & Development
Stock name Stock nameSun Hung Kai Properties Sun Hung Kai Properties
Past performance should not be used as a guide to future performance, which is not guaranteed.
Ten largest holdings
TimeperiodFund return %
Benchmark: FTSE EPRA/NAREIT Developed Asia Index. (Note:The benchmark changed from the UBS Global Asia Index to the above on 01/04/2015).Sector: IA Property.
Benchmark return %Sector return %Quartile ranking
Discrete performance as at 31 July 2017
Cumulative performance as at 31 July 2017
Fund return %
Outlook
The overall strategy is to maintain a balance between high-quality defensive names and stocks with strong growth potential. Around 40% of theFund’s assets are invested in Japan. Its holdings consist of large property developers with exposure to Tokyo’s healthy office market and smaller J-REITs with appealing investment cases.
The Fund has maintained a selective approach towards the Hong Kong and China property sector. We expect that government policies aimed atboosting land supply will help to maintain house price stability. Our holdings in this region consist primarily of stocks with healthy balance sheets,investment-grade property portfolios, stable earnings growth outlook and attractive valuations. Almost 30% of the Fund’s assets are currentlyinvested in Hong Kong.
Portfolio changes
A position was established in City Developments (Singapore: Diversified), a diversified real estate company with a global presence, which appearsattractive on a relative valuation basis. Henderson Land (Hong Kong: Diversified) was also introduced to the portfolio; the company is welldiversified with its prime investment portfolio in Hong Kong and China. It also owns a substantial land bank, enabling it to benefit from Hong KongGovernment policies aimed at increasing housing supply.
Holdings in GPT Group (Australia: Diversified) were sold following outperformance, driven by investor demand for exposure to its high-qualitySydney and Melbourne-focussed property portfolio. Japan Logistics Fund (Japan: Industrial) was also divested, as alternative investmentopportunities were identified.
435
Holdings
MarketValue£'000
TotalNet Assets
%
JAPAN (43.10%*) 4,318 39.3934 Daiwa Office Investment REIT** 127 1.16
274 GLP J-REIT** 227 2.0790 Ichigo Hotel REIT Investment REIT** 69 0.63
812 Japan Rental Housing Investments REIT** 459 4.19128 Kenedix Office Investment REIT** 549 5.01130 Kenedix Residential Investment REIT** 248 2.26190 Kenedix Retail REIT** 316 2.88
36,401 Mitsubishi Estate 503 4.5953,508 Mitsui Fudosan 934 8.52
114 Mitsui Fudosan Logistics Park REIT** 251 2.2914,200 NTT Urban Development 110 1.0022,812 Sumitomo Realty & Development 525 4.79
AUSTRALIA (23.63%*) 2,337 21.3235,854 Charter Hall Group REIT** 113 1.03
251,986 Mirvac Group REIT** 332 3.03499,392 National Storage REIT** 452 4.12167,589 Scentre Group REIT** 421 3.84282,931 Vicinity Centres REIT** 471 4.30117,522 Westfield REIT** 548 5.00
CHINA (1.54%*) 186 1.7076,000 China Resources Land 186 1.70
HONG KONG (24.08%*) 3,287 29.9983,500 Cheung Kong Property Holdings 515 4.70
113,000 Hang Lung Properties 214 1.9563,800 Henderson Land Development 281 2.5656,000 Hongkong Land Holdings 320 2.9238,038 Link REIT** 235 2.1583,121 Sun Hung Kai Properties 980 8.94
112,000 Swire Properties 295 2.6969,000 Wharf Holdings 447 4.08
SINGAPORE (6.18%*) 749 6.8457,000 City Developments 359 3.28
183,500 Frasers Logistics & Industrial Trust REIT** 112 1.02310,400 Mapletree Commercial Trust REIT** 278 2.54
Portfolio of investments 10,877 99.24
Net other assets 83 0.76
Total net assets 10,960 100.00
First State Asian Property Securities Fund
Portfolio Statementas at 31 July 2017
All investments held are listed, unless otherwise stated.
* Comparative figures shown in brackets relate to 31 July 2016.** Real estate investment trust (REIT).
For the purposes of the portfolio holdings analysis, securities are shown based on their country of listing.
436

Share class A Accumulation
Change in net assets per share
Opening net asset value per share
Return before operating charges*
Operating charges
Return after operating charges*
Distributions
Retained distributions on accumulation shares
Closing net asset value per share (p)
* after direct transaction costs of:
Performance
Return after charges (%)
Other information
Closing net asset value (£’000)
Closing number of shares
Operating charges
Direct transaction costs
Prices
Highest share price
Lowest share price 165.02 126.70 126.95
0.19% 0.18% 0.22%
184.93 173.19 159.90
2.02% 2.02% 2.02%
2,388 2,955 4,121
1,340,358 1,726,897 2,916,758
4.10% 21.10% 4.88%
178.14 171.12 141.30
0.33 0.26 0.32
4.93 4.07 (3.09)
7.02 29.82 6.57
(4.93) (4.07) 3.09
10.57 32.68 9.43
(3.55) (2.86) (2.86)
171.12 141.30 134.73
First State Asian Property Securities Fund
Comparative Tablefor the year ended 31 July 2017
Net Asset Value and Ongoing Charges Figure
Final 31 July 2017(p)
Final 31 July 2016(p)
Final 31 July 2015(p)
437

First State Asian Property Securities Fund
Comparative Table (continued)
for the year ended 31 July 2017
Net Asset Value and Ongoing Charges Figure
Share class A Income
Change in net assets per share
Opening net asset value per share
Return before operating charges*
Operating charges
Return after operating charges*
Distributions
Closing net asset value per share (p)
* after direct transaction costs of:
Performance
Return after charges (%)
Other information
Closing net asset value (£’000)
Closing number of shares
Operating charges
Direct transaction costs
Prices
Highest share price
Lowest share price 126.56 99.93 102.46
0.19% 0.18% 0.22%
140.09 134.68 127.84
2.08% 2.29% 1.95%
180 214 634
135,666 163,112 567,530
4.03% 20.50% 4.97%
132.88 131.35 111.66
0.25 0.20 0.26
5.29 22.89 5.40
(3.76) (3.20) (2.49)
8.07 25.41 7.62
(2.78) (2.52) (2.22)
131.35 111.66 108.75
Final 31 July 2017(p)
Final 31 July 2016(p)
Final 31 July 2015(p)
438

First State Asian Property Securities Fund
Comparative Table (continued)
for the year ended 31 July 2017
Net Asset Value and Ongoing Charges Figure
Share class B Accumulation
Change in net assets per share
Opening net asset value per share
Return before operating charges*
Operating charges
Return after operating charges*
Distributions
Retained distributions on accumulation shares
Closing net asset value per share (p)
* after direct transaction costs of:
Performance
Return after charges (%)
Other information
Closing net asset value (£’000)
Closing number of shares
Operating charges
Direct transaction costs
Prices
Highest share price
Lowest share price 180.56 138.13 137.39
0.19% 0.18% 0.22%
202.86 189.35 173.79
1.59% 1.66% 1.19%
7,332 6,601 4,351
3,748,157 3,528,011 2,826,067
4.56% 21.53% 5.74%
195.62 187.09 153.95
0.37 0.28 0.35
5.41 4.44 3.39
8.53 33.14 8.36
(5.41) (4.44) (3.39)
11.59 35.73 10.21
(3.06) (2.59) (1.85)
187.09 153.95 145.59
Final 31 July 2017(p)
Final 31 July 2016(p)
Final 31 July 2015(p)
439

First State Asian Property Securities Fund
Comparative Table (continued)
for the year ended 31 July 2017
Net Asset Value and Ongoing Charges Figure
Share class B Income
Change in net assets per share
Opening net asset value per share
Return before operating charges*
Operating charges
Return after operating charges*
Distributions
Closing net asset value per share (p)
* after direct transaction costs of:
Performance
Return after charges (%)
Other information
Closing net asset value (£’000)
Closing number of shares
Operating charges
Direct transaction costs
Prices
Highest share price
Lowest share price 136.39 106.85 108.63
0.19% 0.18% 0.22%
151.47 144.74 136.04
1.31% 1.43% 1.19%
1,008 865 575
700,280 612,819 482,602
4.81% 21.41% 5.75%
143.91 141.18 119.09
0.27 0.22 0.27
6.79 25.50 6.62
(4.06) (3.41) (2.65)
8.68 27.22 8.07
(1.89) (1.72) (1.45)
141.18 119.09 115.12
Final 31 July 2017(p)
Final 31 July 2016(p)
Final 31 July 2015(p)
440

First State Asian Property Securities Fund
Comparative Table (continued)
for the year ended 31 July 2017
Net Asset Value and Ongoing Charges Figure
Share class A Accumulation (EUR share class)
Change in net assets per share
Opening net asset value per share
Return before operating charges*
Operating charges
Return after operating charges*
Distributions
Retained distributions on accumulation shares
Closing net asset value per share (c)
* after direct transaction costs of:
Performance
Return after charges (%)
Other information
Closing net asset value (€’000)
Closing number of shares
Operating charges
Direct transaction costs
Prices
Highest share price
Lowest share price 130.41 111.82 107.82
0.19% 0.18% 0.22%
144.96 139.00 149.40
2.12% 2.20% 1.95%
28 46 50
20,500 33,751 36,648
(1.85)% 1.04% 18.05%
134.44 136.97 135.56
0.26 0.23 0.29
3.73 3.38 2.84
(2.53) 1.41 20.73
(3.73) (3.38) (2.84)
0.35 4.21 23.21
(2.88) (2.80) (2.48)
136.97 135.56 114.83
Final 31 July 2017(c)
Final 31 July 2016(c)
Final 31 July 2015(c)
441

First State Asian Property Securities Fund
Comparative Table (continued)
for the year ended 31 July 2017
Net Asset Value and Ongoing Charges Figure
Share class A Income (EUR share class)
Change in net assets per share
Opening net asset value per share
Return before operating charges*
Operating charges
Return after operating charges*
Distributions
Closing net asset value per share (c)
* after direct transaction costs of:
Performance
Return after charges (%)
Other information
Closing net asset value (€’000)
Closing number of shares
Operating charges
Direct transaction costs
Prices
Highest share price
Lowest share price 102.58 89.42 89.43
0.19% 0.18% 0.22%
112.97 111.95 122.56
2.07% 2.20% 1.97%
31 39 27
30,250 35,717 24,009
(1.83)% 0.85% 17.93%
103.19 108.14 109.96
0.20 0.19 0.24
(1.98) 0.94 17.07
(2.97) (2.76) (2.34)
0.25 3.20 19.19
(2.23) (2.26) (2.12)
108.14 109.96 95.23
Final 31 July 2017(c)
Final 31 July 2016(c)
Final 31 July 2015(c)
442
Notes £'000 £'000 £'000 £'000
Net capital gains 2 305 1,732
Revenue 3 361 314
4 (182) (164)
Interest payable and similar charges - -
179 150
5 (25) (21)
154 129
459 1,861
6 (307) (268)
152 1,593
£'000 £'000 £'000 £'000
10,707 9,734
2,267 2,131
(2,439) (2,984)
(172) (853)
1 3
152 1,593
272 230
10,960 10,707
Less: Amounts payable on cancellation of shares
Dilution adjustment
Change in net assets attributable to shareholders from investment activities
Retained distribution on accumulation shares
Closing net assets attributable to shareholders
Notes to the Financial Statements are on pages 445 to 449.
Amounts receivable on issue of shares
for the year ended 31 July 2017
31 July 2017 31 July 2016
Opening net assets attributable to shareholders
Statement of Change in Net Assets Attributable to Shareholders
Income
Expenses
Net revenue before taxation
Taxation
Net revenue after taxation
Total return before distributions
Distributions
Change in net assets attributable to shareholders from investment activities
31 July 2017 31 July 2016
First State Asian Property Securities Fund
Statement of Total Returnfor the year ended 31 July 2017
443

First State Asian Property Securities Fund
31 July 2017 31 July 2016Notes £'000 £'000
Investments 10,877 10,550
Current assets
8 323 65
113 241
11,313 10,856
Creditors
(19) (14)
Other creditors 9 (334) (135)
(353) (149)
10,960 10,707
Notes to the Financial Statements are on pages 445 to 449.
Distribution payable
Total liabilities
Net assets attributable to shareholders
Balance Sheetas at 31 July 2017
Assets
Fixed assets
Debtors
Cash and bank balances
Total assets
Liabilities
444
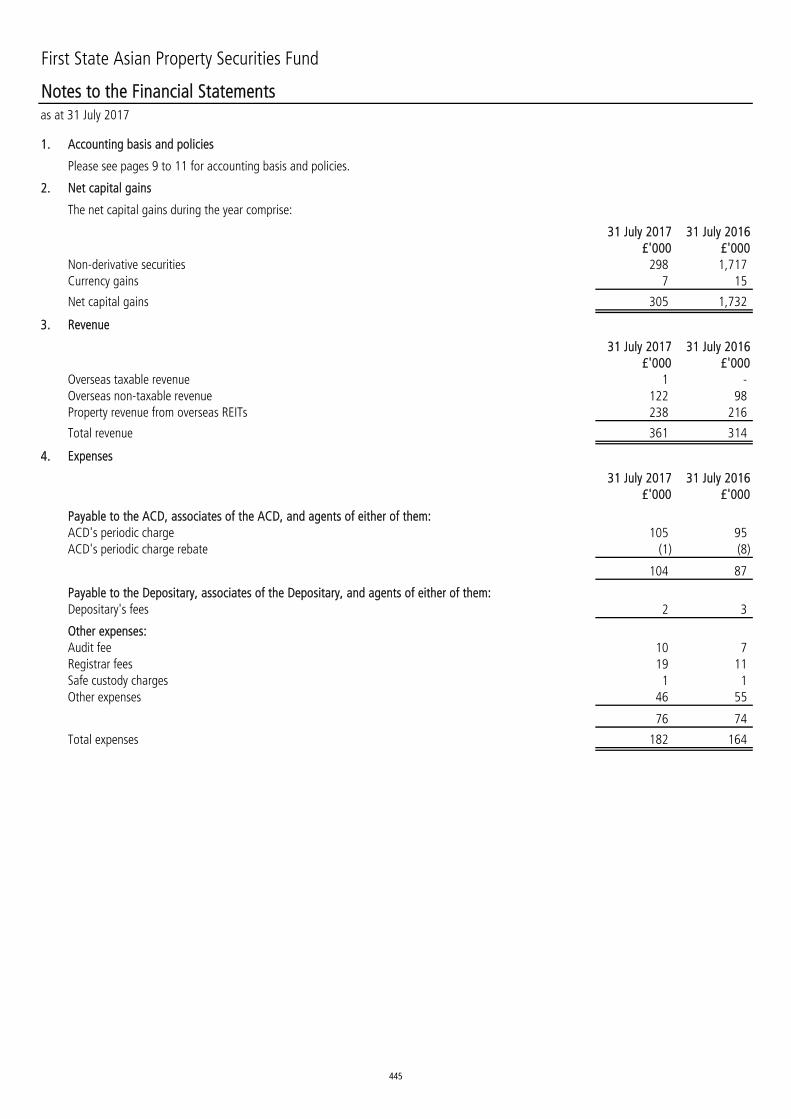
1.
2.
31 July 2017 31 July 2016£'000 £'000
298 1,7177 15
305 1,732
3.
31 July 2017 31 July 2016£'000 £'000
1 -122 98238 216
361 314
4.
31 July 2017 31 July 2016£'000 £'000
105 95(1) (8)
104 87
2 3
10 719 11
1 1Other expenses 46 55
76 74
182 164Total expenses
Audit feeRegistrar feesSafe custody charges
Other expenses:
ACD's periodic charge rebate
Payable to the Depositary, associates of the Depositary, and agents of either of them:Depositary's fees
Expenses
Payable to the ACD, associates of the ACD, and agents of either of them:ACD's periodic charge
Total revenue
Property revenue from overseas REITs
Overseas taxable revenueOverseas non-taxable revenue
Net capital gains
Revenue
Currency gains
Accounting basis and policies
Please see pages 9 to 11 for accounting basis and policies.
Net capital gains
The net capital gains during the year comprise:
Non-derivative securities
Notes to the Financial Statementsas at 31 July 2017
First State Asian Property Securities Fund
445

Notes to the Financial Statements (continued)
as at 31 July 2017
First State Asian Property Securities Fund
5.
31 July 2017 31 July 2016£'000 £'000
(a)
25 21
(b)
179 150
36 30
(24) (20)(8) (7)25 21(4) (3)
25 21
(c)
(d)
6.
31 July 2017 31 July 2016£'000 £'000
140 121166 138
306 25921 25
(20) (16)
307 268
7.
31 July 2017 31 July 2016£'000 £'000
154 129Expenses charged to capital 182 164Tax relief on expenses charged to capital (29) (25)
307 268Net distributions for the year
Details of the distributions per share are set out in the Distribution Tables on pages 450 to 451.
Movement between net revenue and net distributions
Net revenue after taxation
Add: revenue deducted on cancellation of sharesDeduct: revenue received on issue of shares
Net distributions for the year
Final distributionInterim distribution
Distributions
The distributions take account of revenue received on the issue of shares and revenue deducted on the cancellation of shares and comprise:
Factors that may affect future tax charges:
At the year end, after offset against revenue taxable on receipt, there is a potential deferred tax asset of £30,555 (31/07/16: £38,653); thisrelates to surplus management expenses. No deferred tax asset was recognised in the current year and prior year as it was consideredunlikely the Fund would generate sufficient taxable profits in the future to utilise these amounts.
Deferred taxation:
There is no provision required for deferred taxation at the balance sheet date in the current or prior year.
Total tax charge for year (note 5a)
OEICs are exempt from tax on capital gains. Therefore, any capital return is not included in the above reconciliation.
* As an authorised OEIC, these items are not subject to corporation tax.
Overseas tax expensed
Movement in excess management expensesIrrecoverable overseas tax
Overseas non-taxable revenue*
Net revenue before taxation
Corporation tax of 20% (2016: 20%)
Effects of:
Factors affecting current tax charge for the year:
The tax assessed for the year is lower than (2016: lower than) the standard rate of corporation tax in the UK for an open-ended investmentcompany of 20% (2016: 20%). The differences are explained below:
Irrecoverable overseas tax
Analysis of charge in year:
Taxation
446
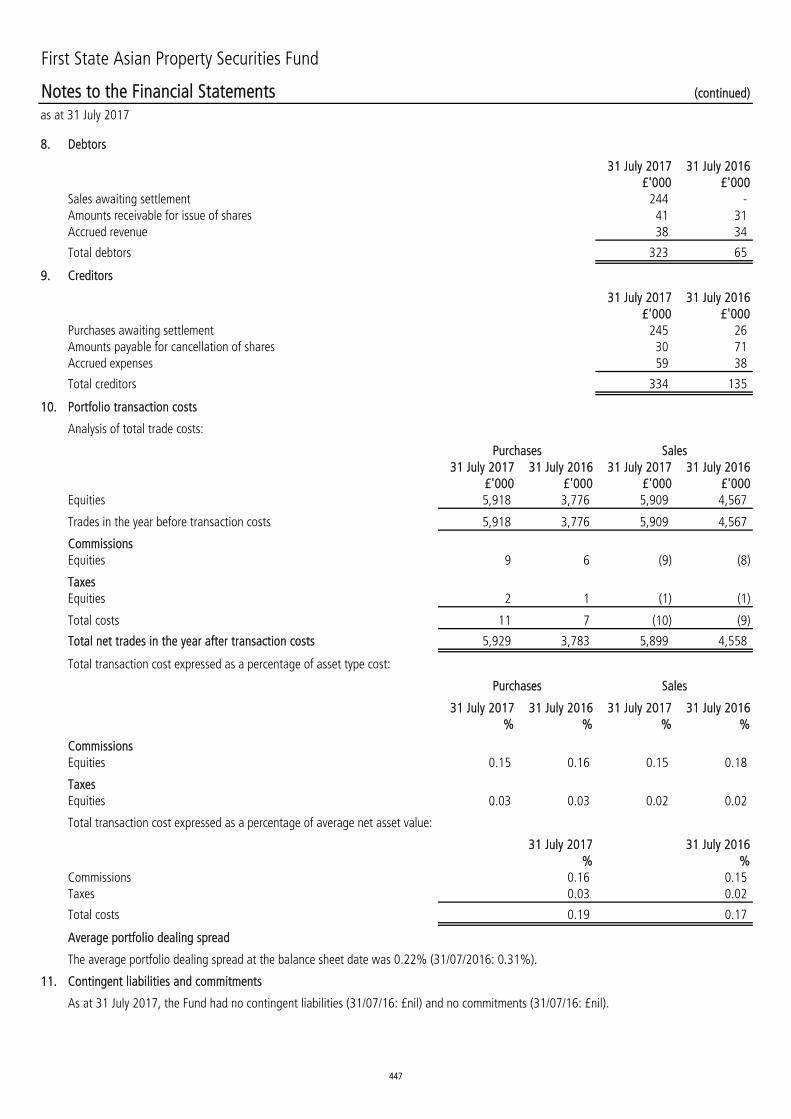
Notes to the Financial Statements (continued)
as at 31 July 2017
First State Asian Property Securities Fund
8.
31 July 2017 31 July 2016£'000 £'000
244 -41 3138 34
323 65
9.
31 July 2017 31 July 2016£'000 £'000
245 2630 7159 38
334 135
10.
31 July 2017 31 July 2016 31 July 2017 31 July 2016£'000 £'000 £'000 £'0005,918 3,776 5,909 4,567
5,918 3,776 5,909 4,567
9 6 (9) (8)
2 1 (1) (1)
11 7 (10) (9)
5,929 3,783 5,899 4,558
31 July 2017 31 July 2016 31 July 2017 31 July 2016% % % %
0.15 0.16 0.15 0.18
0.03 0.03 0.02 0.02
11. Contingent liabilities and commitments
As at 31 July 2017, the Fund had no contingent liabilities (31/07/16: £nil) and no commitments (31/07/16: £nil).
The average portfolio dealing spread at the balance sheet date was 0.22% (31/07/2016: 0.31%).
Total costs 0.19 0.17
Average portfolio dealing spread
Commissions 0.16 0.15Taxes 0.03 0.02
Total transaction cost expressed as a percentage of average net asset value:
31 July 2017 31 July 2016% %
EquitiesTaxes
CommissionsEquities
Total transaction cost expressed as a percentage of asset type cost:
Purchases Sales
Total costs
Total net trades in the year after transaction costs
TaxesEquities
Trades in the year before transaction costs
CommissionsEquities
Analysis of total trade costs:
Purchases Sales
Equities
Total creditors
Portfolio transaction costs
Purchases awaiting settlementAmounts payable for cancellation of sharesAccrued expenses
Creditors
Total debtors
Amounts receivable for issue of sharesAccrued revenue
Debtors
Sales awaiting settlement
447
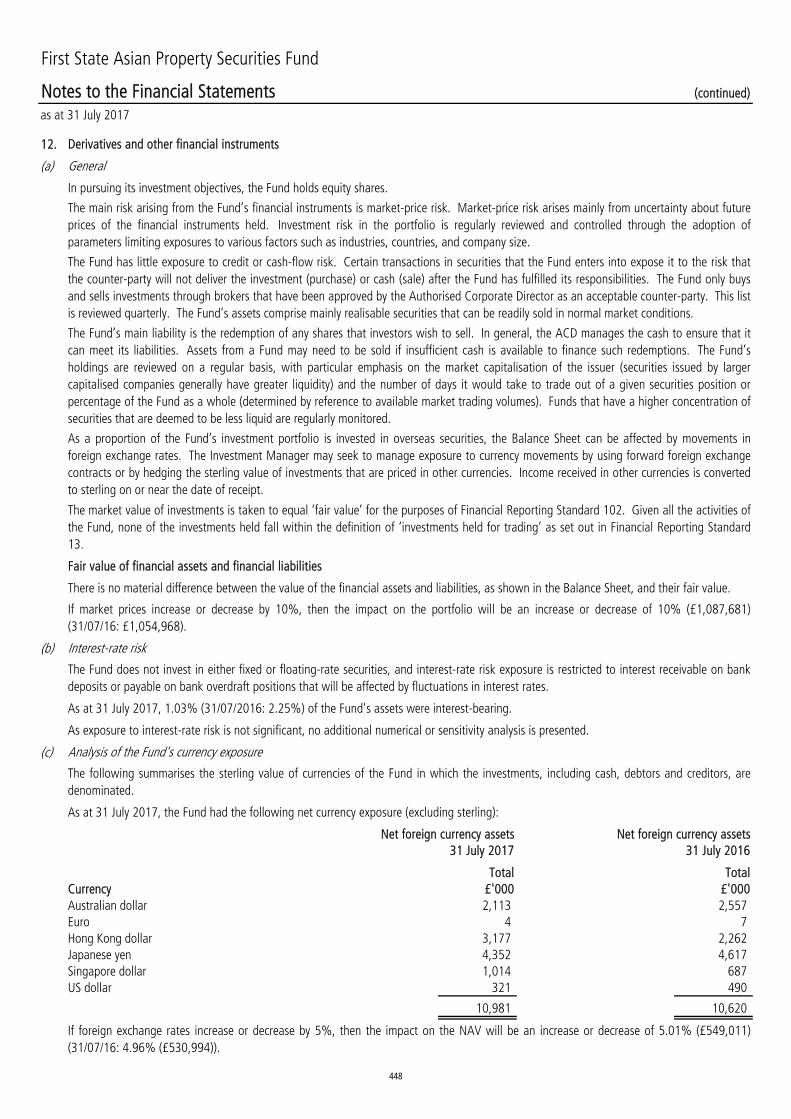
Notes to the Financial Statements (continued)
as at 31 July 2017
First State Asian Property Securities Fund
12.
(a)
(b)
(c)
Total TotalCurrency £'000 £'000Australian dollar 2,113 2,557Euro 4 7Hong Kong dollar 3,177 2,262Japanese yen 4,352 4,617Singapore dollar 1,014 687US dollar 321 490
10,981 10,620
If foreign exchange rates increase or decrease by 5%, then the impact on the NAV will be an increase or decrease of 5.01% (£549,011)(31/07/16: 4.96% (£530,994)).
The following summarises the sterling value of currencies of the Fund in which the investments, including cash, debtors and creditors, aredenominated.
As at 31 July 2017, the Fund had the following net currency exposure (excluding sterling):
Net foreign currency assets Net foreign currency assets31 July 2017 31 July 2016
As at 31 July 2017, 1.03% (31/07/2016: 2.25%) of the Fund's assets were interest-bearing.
As exposure to interest-rate risk is not significant, no additional numerical or sensitivity analysis is presented.
Analysis of the Fund's currency exposure
There is no material difference between the value of the financial assets and liabilities, as shown in the Balance Sheet, and their fair value.
If market prices increase or decrease by 10%, then the impact on the portfolio will be an increase or decrease of 10% (£1,087,681)(31/07/16: £1,054,968).
Interest-rate risk
The Fund does not invest in either fixed or floating-rate securities, and interest-rate risk exposure is restricted to interest receivable on bankdeposits or payable on bank overdraft positions that will be affected by fluctuations in interest rates.
The Fund’s main liability is the redemption of any shares that investors wish to sell. In general, the ACD manages the cash to ensure that itcan meet its liabilities. Assets from a Fund may need to be sold if insufficient cash is available to finance such redemptions. The Fund’sholdings are reviewed on a regular basis, with particular emphasis on the market capitalisation of the issuer (securities issued by largercapitalised companies generally have greater liquidity) and the number of days it would take to trade out of a given securities position orpercentage of the Fund as a whole (determined by reference to available market trading volumes). Funds that have a higher concentration ofsecurities that are deemed to be less liquid are regularly monitored.
As a proportion of the Fund’s investment portfolio is invested in overseas securities, the Balance Sheet can be affected by movements inforeign exchange rates. The Investment Manager may seek to manage exposure to currency movements by using forward foreign exchangecontracts or by hedging the sterling value of investments that are priced in other currencies. Income received in other currencies is convertedto sterling on or near the date of receipt.
The market value of investments is taken to equal ‘fair value’ for the purposes of Financial Reporting Standard 102. Given all the activities ofthe Fund, none of the investments held fall within the definition of ‘investments held for trading’ as set out in Financial Reporting Standard13.
Fair value of financial assets and financial liabilities
Derivatives and other financial instruments
General
In pursuing its investment objectives, the Fund holds equity shares.
The main risk arising from the Fund’s financial instruments is market-price risk. Market-price risk arises mainly from uncertainty about futureprices of the financial instruments held. Investment risk in the portfolio is regularly reviewed and controlled through the adoption ofparameters limiting exposures to various factors such as industries, countries, and company size.
The Fund has little exposure to credit or cash-flow risk. Certain transactions in securities that the Fund enters into expose it to the risk thatthe counter-party will not deliver the investment (purchase) or cash (sale) after the Fund has fulfilled its responsibilities. The Fund only buysand sells investments through brokers that have been approved by the Authorised Corporate Director as an acceptable counter-party. This listis reviewed quarterly. The Fund’s assets comprise mainly realisable securities that can be readily sold in normal market conditions.
448
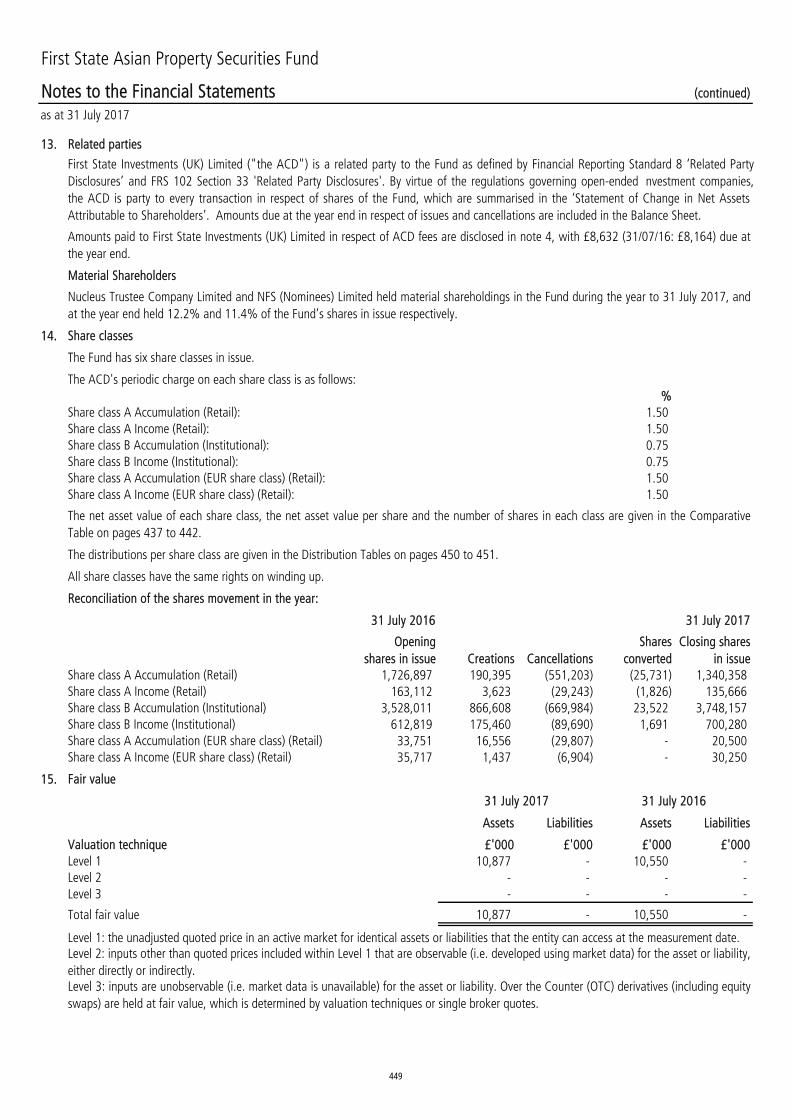
Notes to the Financial Statements (continued)
as at 31 July 2017
First State Asian Property Securities Fund
13.
14.
%1.501.500.750.751.501.50
31 July 2016 31 July 2017
Opening shares in issue Creations Cancellations
Shares converted
Closing shares in issue
1,726,897 190,395 (551,203) (25,731) 1,340,358163,112 3,623 (29,243) (1,826) 135,666
3,528,011 866,608 (669,984) 23,522 3,748,157612,819 175,460 (89,690) 1,691 700,280
33,751 16,556 (29,807) - 20,50035,717 1,437 (6,904) - 30,250
15.
Assets Liabilities Assets Liabilities
£'000 £'000 £'000 £'00010,877 - 10,550 -
- - - -- - - -
10,877 - 10,550 -
Level 3: inputs are unobservable (i.e. market data is unavailable) for the asset or liability. Over the Counter (OTC) derivatives (including equityswaps) are held at fair value, which is determined by valuation techniques or single broker quotes.
Level 1Level 2Level 3
Total fair value
Level 1: the unadjusted quoted price in an active market for identical assets or liabilities that the entity can access at the measurement date. Level 2: inputs other than quoted prices included within Level 1 that are observable (i.e. developed using market data) for the asset or liability,either directly or indirectly.
Fair value
Valuation technique
31 July 2017 31 July 2016
Share class B Income (Institutional)Share class A Accumulation (EUR share class) (Retail)Share class A Income (EUR share class) (Retail)
All share classes have the same rights on winding up.
Reconciliation of the shares movement in the year:
Share class A Accumulation (Retail)Share class A Income (Retail)Share class B Accumulation (Institutional)
The net asset value of each share class, the net asset value per share and the number of shares in each class are given in the ComparativeTable on pages 437 to 442.
The distributions per share class are given in the Distribution Tables on pages 450 to 451.
Share class A Accumulation (EUR share class) (Retail):Share class A Income (EUR share class) (Retail):
The ACD's periodic charge on each share class is as follows:
Share class A Accumulation (Retail):Share class A Income (Retail):Share class B Accumulation (Institutional):Share class B Income (Institutional):
Share classes
The Fund has six share classes in issue.
Amounts paid to First State Investments (UK) Limited in respect of ACD fees are disclosed in note 4, with £8,632 (31/07/16: £8,164) due atthe year end.
Material Shareholders
Nucleus Trustee Company Limited and NFS (Nominees) Limited held material shareholdings in the Fund during the year to 31 July 2017, andat the year end held 12.2% and 11.4% of the Fund’s shares in issue respectively.
Related parties
First State Investments (UK) Limited ("the ACD") is a related party to the Fund as defined by Financial Reporting Standard 8 ‘Related Party Disclosures’ and FRS 102 Section 33 'Related Party Disclosures'. By virtue of the regulations governing open-ended investment companies, the ACD is party to every transaction in respect of shares of the Fund, which are summarised in the ‘Statement of Change in Net Assets Attributable to Shareholders’. Amounts due at the year end in respect of issues and cancellations are included in the Balance Sheet.
449

Share class A Accumulation
Netrevenue Equalisation
Distributions paid to/payable
30/09/2017
Distributions paid
30/09/2016Group 1 (p) (p) (p) (p)Interim 2.2389 - 2.2389 1.8670Final 2.6917 - 2.6917 2.2076Group 2 (p) (p) (p) (p)Interim 0.8171 1.4218 2.2389 1.8670Final 1.1355 1.5562 2.6917 2.2076
Share class A Income
Netrevenue Equalisation
Distributions paid to/payable
30/09/2017
Distributions paid
30/09/2016Group 1 (p) (p) (p) (p)Interim 1.7252 - 1.7252 1.4765Final 2.0364 - 2.0364 1.7194Group 2 (p) (p) (p) (p)Interim 0.7928 0.9324 1.7252 1.4765Final 1.0873 0.9491 2.0364 1.7194
Share class B Accumulation
Netrevenue Equalisation
Distributions paid to/payable
30/09/2017
Distributions paid
30/09/2016Group 1 (p) (p) (p) (p)Interim 2.4605 - 2.4605 2.0368Final 2.9457 - 2.9457 2.4064Group 2 (p) (p) (p) (p)Interim 0.6911 1.7694 2.4605 2.0368Final 1.4188 1.5269 2.9457 2.4064
Share class B Income
Netrevenue Equalisation
Distributions paid to/payable
30/09/2017
Distributions paid
30/09/2016Group 1 (p) (p) (p) (p)Interim 1.8623 - 1.8623 1.5733Final 2.1939 - 2.1939 1.8379Group 2 (p) (p) (p) (p)Interim 0.3109 1.5514 1.8623 1.5733Final 1.1383 1.0556 2.1939 1.8379
Final - Shares purchased between 1 February 2017 and 31 July 2017Group 2 Interim - Shares purchased between 1 August 2016 and 31 January 2017
Final - Shares purchased prior to 1 February 2017
Distribution in pence and cents per share
First State Asian Property Securities Fund
Distribution Tablesfor the year ended 31 July 2017
Group 1 Interim - Shares purchased prior to 1 August 2016
450
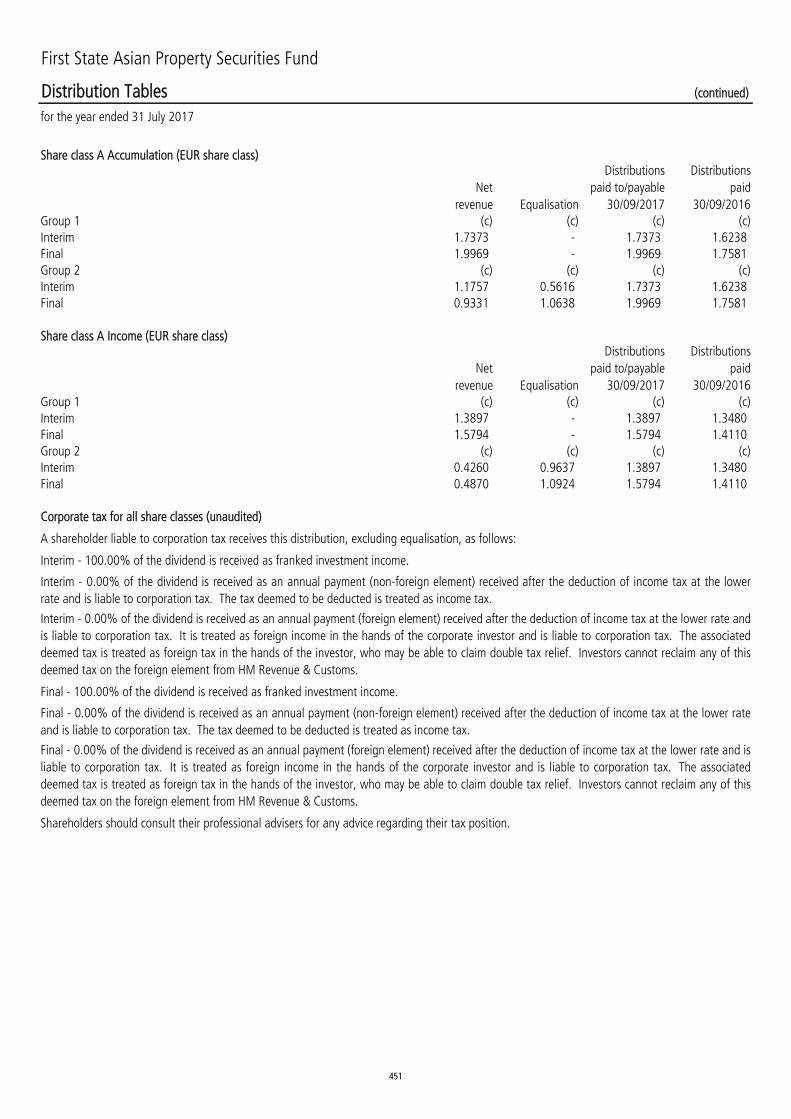
First State Asian Property Securities Fund
Distribution Tables (continued)
for the year ended 31 July 2017
Share class A Accumulation (EUR share class)
Netrevenue Equalisation
Distributions paid to/payable
30/09/2017
Distributions paid
30/09/2016Group 1 (c) (c) (c) (c)Interim 1.7373 - 1.7373 1.6238Final 1.9969 - 1.9969 1.7581Group 2 (c) (c) (c) (c)Interim 1.1757 0.5616 1.7373 1.6238Final 0.9331 1.0638 1.9969 1.7581
Share class A Income (EUR share class)
Netrevenue Equalisation
Distributions paid to/payable
30/09/2017
Distributions paid
30/09/2016Group 1 (c) (c) (c) (c)Interim 1.3897 - 1.3897 1.3480Final 1.5794 - 1.5794 1.4110Group 2 (c) (c) (c) (c)Interim 0.4260 0.9637 1.3897 1.3480Final 0.4870 1.0924 1.5794 1.4110
Shareholders should consult their professional advisers for any advice regarding their tax position.
Final - 100.00% of the dividend is received as franked investment income.
Final - 0.00% of the dividend is received as an annual payment (non-foreign element) received after the deduction of income tax at the lower rateand is liable to corporation tax. The tax deemed to be deducted is treated as income tax.
Final - 0.00% of the dividend is received as an annual payment (foreign element) received after the deduction of income tax at the lower rate and isliable to corporation tax. It is treated as foreign income in the hands of the corporate investor and is liable to corporation tax. The associateddeemed tax is treated as foreign tax in the hands of the investor, who may be able to claim double tax relief. Investors cannot reclaim any of thisdeemed tax on the foreign element from HM Revenue & Customs.
Interim - 100.00% of the dividend is received as franked investment income.
Interim - 0.00% of the dividend is received as an annual payment (non-foreign element) received after the deduction of income tax at the lowerrate and is liable to corporation tax. The tax deemed to be deducted is treated as income tax.
Interim - 0.00% of the dividend is received as an annual payment (foreign element) received after the deduction of income tax at the lower rate andis liable to corporation tax. It is treated as foreign income in the hands of the corporate investor and is liable to corporation tax. The associateddeemed tax is treated as foreign tax in the hands of the investor, who may be able to claim double tax relief. Investors cannot reclaim any of thisdeemed tax on the foreign element from HM Revenue & Customs.
Corporate tax for all share classes (unaudited)
A shareholder liable to corporation tax receives this distribution, excluding equalisation, as follows:
451
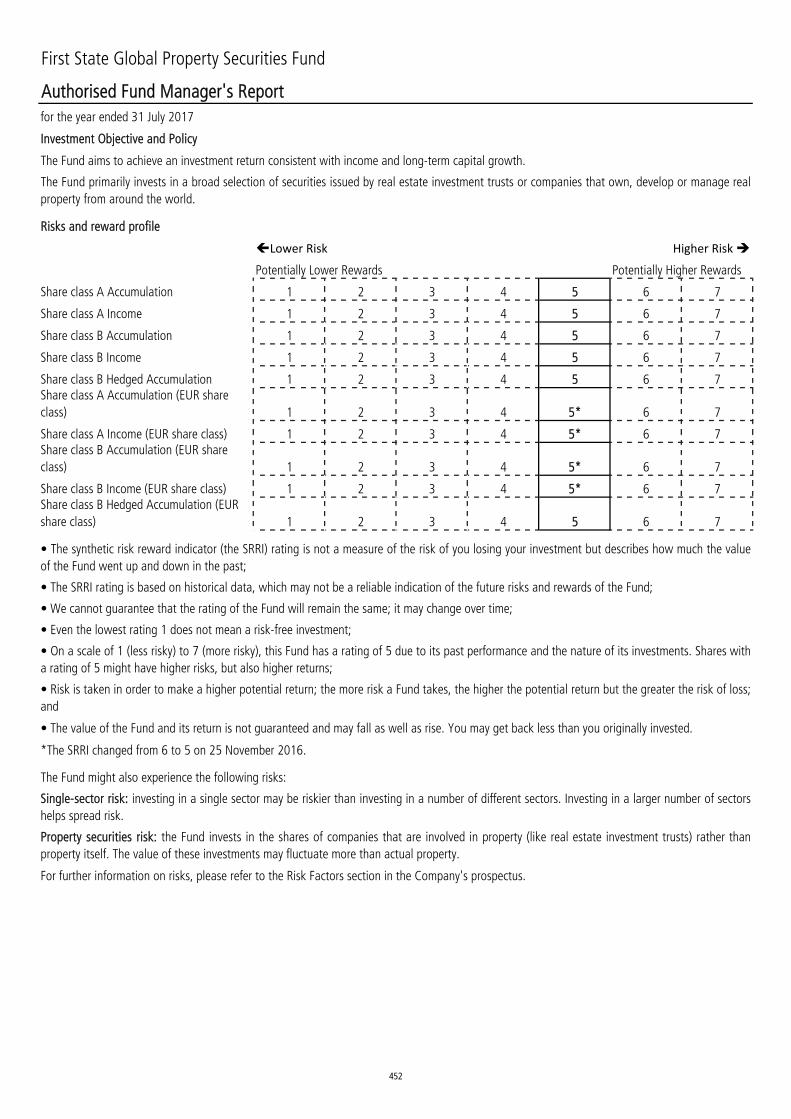
Risks and reward profile
Lower Risk Higher Risk
Potentially Lower Rewards Potentially Higher Rewards
1 2 3 4 5 6 7
1 2 3 4 5 6 7
1 2 3 4 5 6 7
1 2 3 4 5 6 7
1 2 3 4 5 6 7
1 2 3 4 5* 6 7
1 2 3 4 5* 6 7
1 2 3 4 5* 6 7
1 2 3 4 5* 6 7
1 2 3 4 5 6 7
*The SRRI changed from 6 to 5 on 25 November 2016.
For further information on risks, please refer to the Risk Factors section in the Company's prospectus.
Single-sector risk: investing in a single sector may be riskier than investing in a number of different sectors. Investing in a larger number of sectorshelps spread risk.
Property securities risk: the Fund invests in the shares of companies that are involved in property (like real estate investment trusts) rather thanproperty itself. The value of these investments may fluctuate more than actual property.
• Even the lowest rating 1 does not mean a risk-free investment;
• On a scale of 1 (less risky) to 7 (more risky), this Fund has a rating of 5 due to its past performance and the nature of its investments. Shares witha rating of 5 might have higher risks, but also higher returns;
• Risk is taken in order to make a higher potential return; the more risk a Fund takes, the higher the potential return but the greater the risk of loss;and
• The value of the Fund and its return is not guaranteed and may fall as well as rise. You may get back less than you originally invested.
The Fund might also experience the following risks:
• The synthetic risk reward indicator (the SRRI) rating is not a measure of the risk of you losing your investment but describes how much the valueof the Fund went up and down in the past;
• The SRRI rating is based on historical data, which may not be a reliable indication of the future risks and rewards of the Fund;
• We cannot guarantee that the rating of the Fund will remain the same; it may change over time;
Share class B Hedged AccumulationShare class A Accumulation (EUR share class)
Share class A Income (EUR share class)Share class B Accumulation (EUR share class)
Share class B Income (EUR share class)Share class B Hedged Accumulation (EUR share class)
Share class A Accumulation
Share class A Income
Share class B Accumulation
Share class B Income
The Fund aims to achieve an investment return consistent with income and long-term capital growth.
The Fund primarily invests in a broad selection of securities issued by real estate investment trusts or companies that own, develop or manage realproperty from around the world.
First State Global Property Securities Fund
Authorised Fund Manager's Reportfor the year ended 31 July 2017
Investment Objective and Policy
452
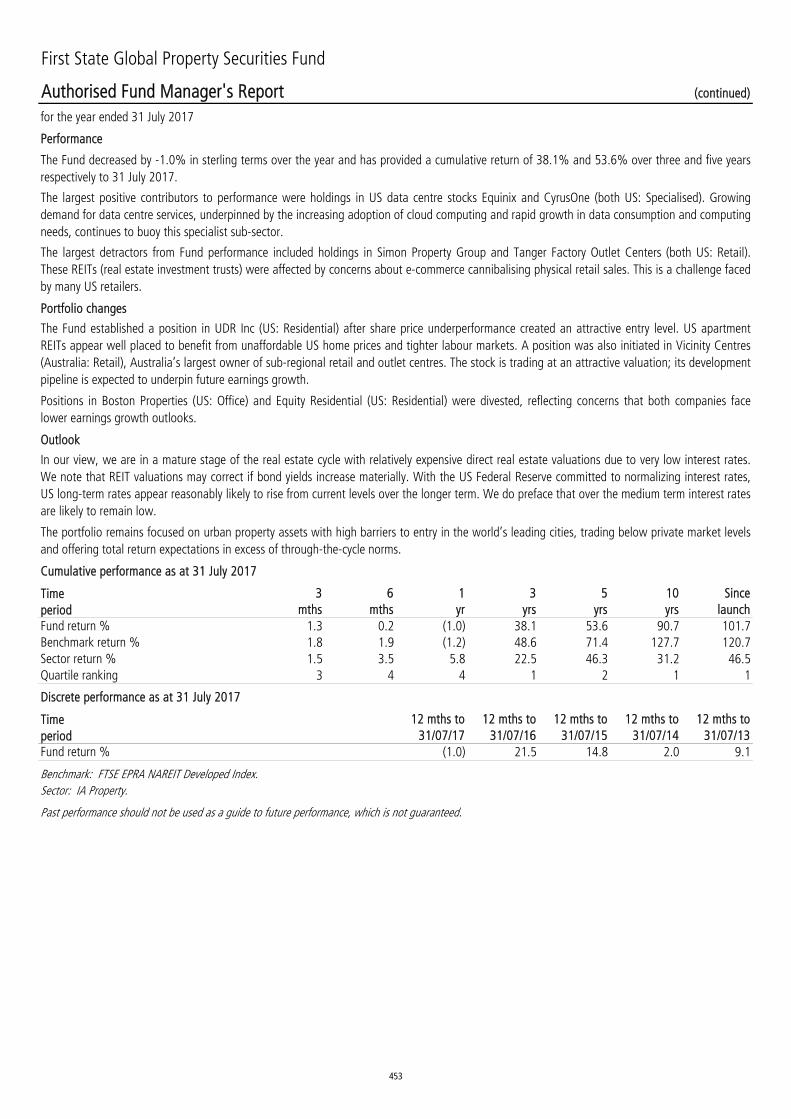
(continued)
First State Global Property Securities Fund
Authorised Fund Manager's Reportfor the year ended 31 July 2017
Time 3 6 1 3 5 10 Sinceperiod mths mths yr yrs yrs yrs launch
1.3 0.2 (1.0) 38.1 53.6 90.7 101.7 1.8 1.9 (1.2) 48.6 71.4 127.7 120.7 1.5 3.5 5.8 22.5 46.3 31.2 46.5
3 4 4 1 2 1 1
12 mths to 12 mths to 12 mths to 12 mths to 12 mths to31/07/17 31/07/16 31/07/15 31/07/14 31/07/13
(1.0) 21.5 14.8 2.0 9.1
Past performance should not be used as a guide to future performance, which is not guaranteed.
TimeperiodFund return %
Benchmark: FTSE EPRA NAREIT Developed Index.Sector: IA Property.
Benchmark return %Sector return %Quartile ranking
Discrete performance as at 31 July 2017
Cumulative performance as at 31 July 2017
Fund return %
Outlook
In our view, we are in a mature stage of the real estate cycle with relatively expensive direct real estate valuations due to very low interest rates.We note that REIT valuations may correct if bond yields increase materially. With the US Federal Reserve committed to normalizing interest rates,US long-term rates appear reasonably likely to rise from current levels over the longer term. We do preface that over the medium term interest ratesare likely to remain low.
The portfolio remains focused on urban property assets with high barriers to entry in the world’s leading cities, trading below private market levelsand offering total return expectations in excess of through-the-cycle norms.
Portfolio changes
The Fund established a position in UDR Inc (US: Residential) after share price underperformance created an attractive entry level. US apartmentREITs appear well placed to benefit from unaffordable US home prices and tighter labour markets. A position was also initiated in Vicinity Centres(Australia: Retail), Australia’s largest owner of sub-regional retail and outlet centres. The stock is trading at an attractive valuation; its developmentpipeline is expected to underpin future earnings growth.
Positions in Boston Properties (US: Office) and Equity Residential (US: Residential) were divested, reflecting concerns that both companies facelower earnings growth outlooks.
Performance
The Fund decreased by -1.0% in sterling terms over the year and has provided a cumulative return of 38.1% and 53.6% over three and five yearsrespectively to 31 July 2017.
The largest positive contributors to performance were holdings in US data centre stocks Equinix and CyrusOne (both US: Specialised). Growingdemand for data centre services, underpinned by the increasing adoption of cloud computing and rapid growth in data consumption and computingneeds, continues to buoy this specialist sub-sector.
The largest detractors from Fund performance included holdings in Simon Property Group and Tanger Factory Outlet Centers (both US: Retail).These REITs (real estate investment trusts) were affected by concerns about e-commerce cannibalising physical retail sales. This is a challenge facedby many US retailers.
453
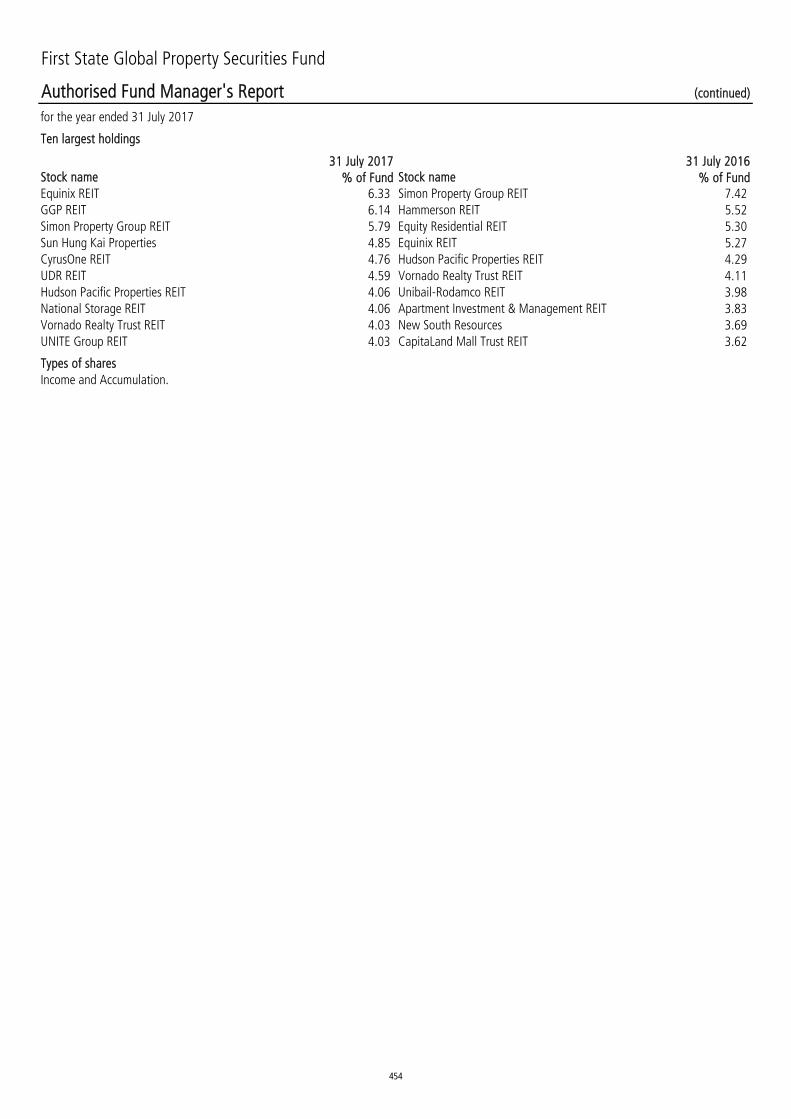
(continued)
First State Global Property Securities Fund
Authorised Fund Manager's Reportfor the year ended 31 July 2017
31 July 2017 31 July 2016% of Fund % of Fund
6.33 7.426.14 5.525.79 5.304.85 5.274.76 4.294.59 4.114.06 3.984.06 3.834.03 3.694.03 3.62
Types of sharesIncome and Accumulation.
National Storage REIT Apartment Investment & Management REITVornado Realty Trust REIT New South ResourcesUNITE Group REIT CapitaLand Mall Trust REIT
CyrusOne REIT Hudson Pacific Properties REITUDR REIT Vornado Realty Trust REITHudson Pacific Properties REIT Unibail-Rodamco REIT
GGP REIT Hammerson REITSimon Property Group REIT Equity Residential REITSun Hung Kai Properties Equinix REIT
Stock name Stock nameEquinix REIT Simon Property Group REIT
Ten largest holdings
454
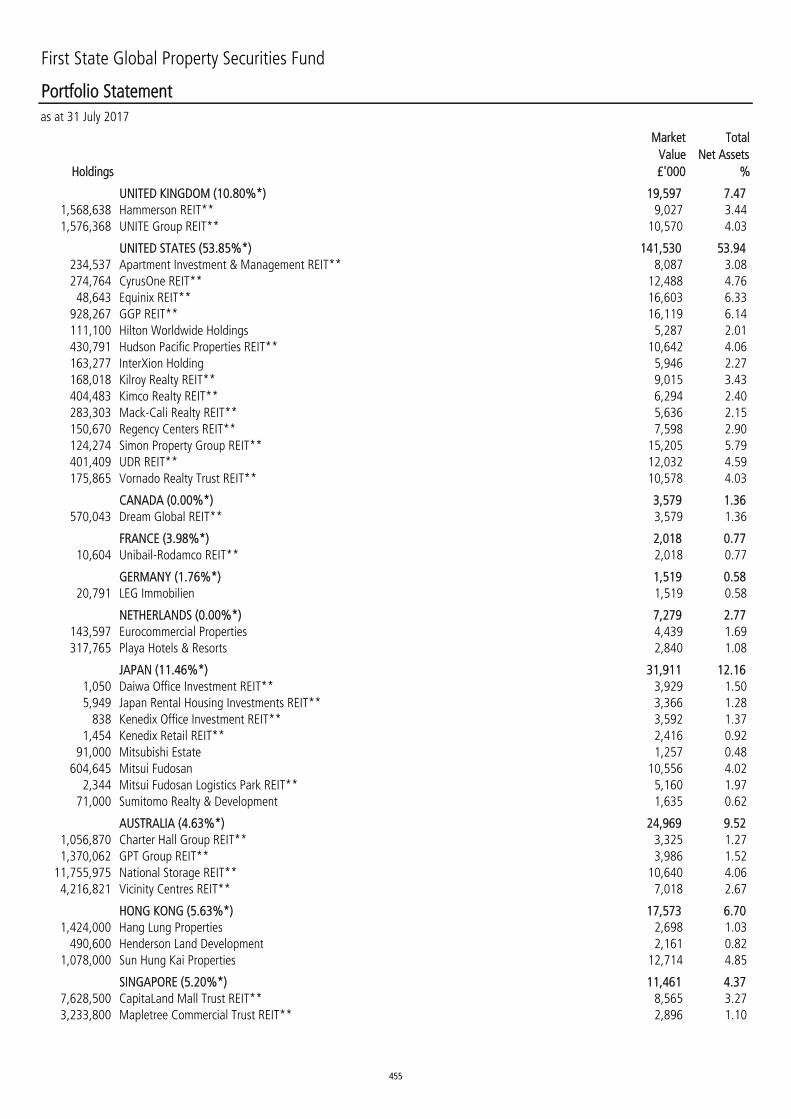
Holdings
MarketValue£'000
TotalNet Assets
%
UNITED KINGDOM (10.80%*) 19,597 7.471,568,638 Hammerson REIT** 9,027 3.441,576,368 UNITE Group REIT** 10,570 4.03
UNITED STATES (53.85%*) 141,530 53.94234,537 Apartment Investment & Management REIT** 8,087 3.08274,764 CyrusOne REIT** 12,488 4.76
48,643 Equinix REIT** 16,603 6.33928,267 GGP REIT** 16,119 6.14111,100 Hilton Worldwide Holdings 5,287 2.01430,791 Hudson Pacific Properties REIT** 10,642 4.06163,277 InterXion Holding 5,946 2.27168,018 Kilroy Realty REIT** 9,015 3.43404,483 Kimco Realty REIT** 6,294 2.40283,303 Mack-Cali Realty REIT** 5,636 2.15150,670 Regency Centers REIT** 7,598 2.90124,274 Simon Property Group REIT** 15,205 5.79401,409 UDR REIT** 12,032 4.59175,865 Vornado Realty Trust REIT** 10,578 4.03
CANADA (0.00%*) 3,579 1.36570,043 Dream Global REIT** 3,579 1.36
FRANCE (3.98%*) 2,018 0.7710,604 Unibail-Rodamco REIT** 2,018 0.77
GERMANY (1.76%*) 1,519 0.5820,791 LEG Immobilien 1,519 0.58
NETHERLANDS (0.00%*) 7,279 2.77143,597 Eurocommercial Properties 4,439 1.69317,765 Playa Hotels & Resorts 2,840 1.08
JAPAN (11.46%*) 31,911 12.161,050 Daiwa Office Investment REIT** 3,929 1.505,949 Japan Rental Housing Investments REIT** 3,366 1.28
838 Kenedix Office Investment REIT** 3,592 1.371,454 Kenedix Retail REIT** 2,416 0.92
91,000 Mitsubishi Estate 1,257 0.48604,645 Mitsui Fudosan 10,556 4.02
2,344 Mitsui Fudosan Logistics Park REIT** 5,160 1.9771,000 Sumitomo Realty & Development 1,635 0.62
AUSTRALIA (4.63%*) 24,969 9.521,056,870 Charter Hall Group REIT** 3,325 1.271,370,062 GPT Group REIT** 3,986 1.52
11,755,975 National Storage REIT** 10,640 4.064,216,821 Vicinity Centres REIT** 7,018 2.67
HONG KONG (5.63%*) 17,573 6.701,424,000 Hang Lung Properties 2,698 1.03
490,600 Henderson Land Development 2,161 0.821,078,000 Sun Hung Kai Properties 12,714 4.85
SINGAPORE (5.20%*) 11,461 4.377,628,500 CapitaLand Mall Trust REIT** 8,565 3.273,233,800 Mapletree Commercial Trust REIT** 2,896 1.10
First State Global Property Securities Fund
Portfolio Statementas at 31 July 2017
455
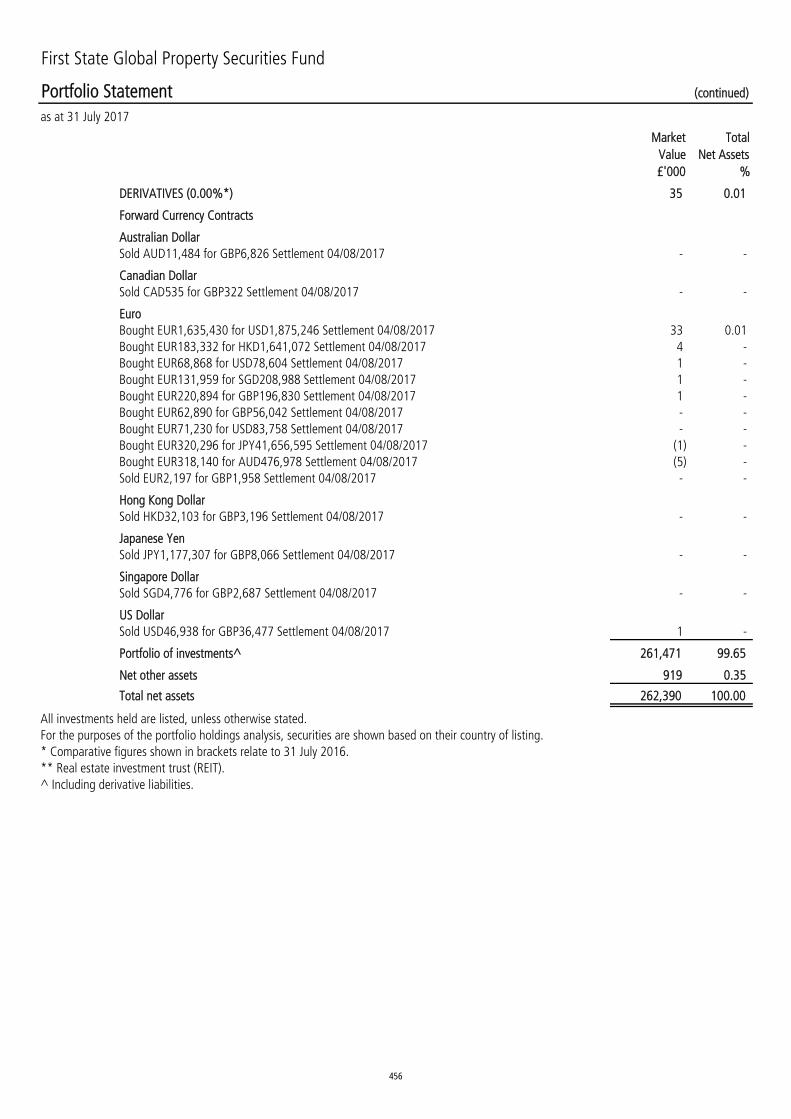
MarketValue£'000
TotalNet Assets
%
First State Global Property Securities Fund
Portfolio Statement (continued)
as at 31 July 2017
DERIVATIVES (0.00%*) 35 0.01
Forward Currency Contracts
Australian DollarSold AUD11,484 for GBP6,826 Settlement 04/08/2017 - -
Canadian DollarSold CAD535 for GBP322 Settlement 04/08/2017 - -
EuroBought EUR1,635,430 for USD1,875,246 Settlement 04/08/2017 33 0.01Bought EUR183,332 for HKD1,641,072 Settlement 04/08/2017 4 -Bought EUR68,868 for USD78,604 Settlement 04/08/2017 1 -Bought EUR131,959 for SGD208,988 Settlement 04/08/2017 1 -Bought EUR220,894 for GBP196,830 Settlement 04/08/2017 1 -Bought EUR62,890 for GBP56,042 Settlement 04/08/2017 - -Bought EUR71,230 for USD83,758 Settlement 04/08/2017 - -Bought EUR320,296 for JPY41,656,595 Settlement 04/08/2017 (1) -Bought EUR318,140 for AUD476,978 Settlement 04/08/2017 (5) -Sold EUR2,197 for GBP1,958 Settlement 04/08/2017 - -
Hong Kong DollarSold HKD32,103 for GBP3,196 Settlement 04/08/2017 - -
Japanese YenSold JPY1,177,307 for GBP8,066 Settlement 04/08/2017 - -
Singapore DollarSold SGD4,776 for GBP2,687 Settlement 04/08/2017 - -
US DollarSold USD46,938 for GBP36,477 Settlement 04/08/2017 1 -
Portfolio of investments^ 261,471 99.65
Net other assets 919 0.35
Total net assets 262,390 100.00
^ Including derivative liabilities.
All investments held are listed, unless otherwise stated.
* Comparative figures shown in brackets relate to 31 July 2016.** Real estate investment trust (REIT).
For the purposes of the portfolio holdings analysis, securities are shown based on their country of listing.
456

Share class A Accumulation
Change in net assets per share
Opening net asset value per share
Return before operating charges*
Operating charges
Return after operating charges*
Distributions
Retained distributions on accumulation shares
Closing net asset value per share (p)
* after direct transaction costs of:
Performance
Return after charges (%)
Other information
Closing net asset value (£’000)
Closing number of shares
Operating charges
Direct transaction costs
Prices
Highest share price
Lowest share price 188.91 154.53 142.13
0.27% 0.47% 0.25%
210.05 204.71 183.20
1.65% 1.65% 1.63%
28,888 38,993 50,719
14,332,691 19,154,906 30,274,712
(0.99)% 21.51% 14.83%
201.55 203.57 167.53
0.54 0.81 0.40
4.86 3.80 3.38
(2.02) 36.04 21.63
(4.86) (3.80) (3.38)
1.31 38.87 24.28
(3.33) (2.83) (2.65)
203.57 167.53 145.90
First State Global Property Securities Fund
Comparative Tablefor the year ended 31 July 2017
Net Asset Value and Ongoing Charges Figure
Final 31 July 2017(p)
Final 31 July 2016(p)
Final 31 July 2015(p)
457

First State Global Property Securities Fund
Comparative Table (continued)
for the year ended 31 July 2017
Net Asset Value and Ongoing Charges Figure
Share class A Income
Change in net assets per share
Opening net asset value per share
Return before operating charges*
Operating charges
Return after operating charges*
Distributions
Closing net asset value per share (p)
* after direct transaction costs of:
Performance
Return after charges (%)
Other information
Closing net asset value (£’000)
Closing number of shares
Operating charges
Direct transaction costs
Prices
Highest share price
Lowest share price 144.15 119.12 113.06
0.27% 0.47% 0.25%
159.71 157.82 144.14
1.52% 1.69% 1.77%
3,437 3,127 5,622
2,289,047 2,014,218 4,308,661
(0.90)% 21.24% 14.73%
150.15 155.25 130.49
0.41 0.63 0.32
(1.40) 27.72 17.09
(3.70) (2.96) (2.66)
0.92 29.96 19.37
(2.32) (2.24) (2.28)
155.25 130.49 116.06
Final 31 July 2017(p)
Final 31 July 2016(p)
Final 31 July 2015(p)
458

First State Global Property Securities Fund
Comparative Table (continued)
for the year ended 31 July 2017
Net Asset Value and Ongoing Charges Figure
Share class B Accumulation
Change in net assets per share
Opening net asset value per share
Return before operating charges*
Operating charges
Return after operating charges*
Distributions
Retained distributions on accumulation shares
Closing net asset value per share (p)
* after direct transaction costs of:
Performance
Return after charges (%)
Other information
Closing net asset value (£’000)
Closing number of shares
Operating charges
Direct transaction costs
Prices
Highest share price
Lowest share price 199.33 161.58 147.44
0.27% 0.47% 0.25%
222.16 215.53 190.97
0.87% 0.88% 0.90%
175,662 190,402 132,033
82,250,286 88,831,725 75,429,800
(0.36)% 22.45% 15.64%
213.57 214.34 175.04
0.58 0.85 0.42
5.15 4.01 3.47
(0.77) 39.30 23.68
(5.15) (4.01) (3.47)
1.09 40.90 25.23
(1.86) (1.60) (1.55)
214.34 175.04 151.36
Final 31 July 2017(p)
Final 31 July 2016(p)
Final 31 July 2015(p)
459

First State Global Property Securities Fund
Comparative Table (continued)
for the year ended 31 July 2017
Net Asset Value and Ongoing Charges Figure
Share class B Income
Change in net assets per share
Opening net asset value per share
Return before operating charges*
Operating charges
Return after operating charges*
Distributions
Closing net asset value per share (p)
* after direct transaction costs of:
Performance
Return after charges (%)
Other information
Closing net asset value (£’000)
Closing number of shares
Operating charges
Direct transaction costs
Prices
Highest share price
Lowest share price 157.09 129.27 121.30
0.27% 0.47% 0.25%
174.23 171.77 155.40
0.95% 1.00% 1.02%
33,810 25,963 20,729
20,589,704 15,366,187 14,697,657
(0.41)% 22.08% 15.55%
164.21 168.96 141.04
0.45 0.68 0.35
(0.70) 31.14 19.36
(4.05) (3.22) (2.84)
0.89 32.60 20.79
(1.59) (1.46) (1.43)
168.96 141.04 124.52
Final 31 July 2017(p)
Final 31 July 2016(p)
Final 31 July 2015(p)
460
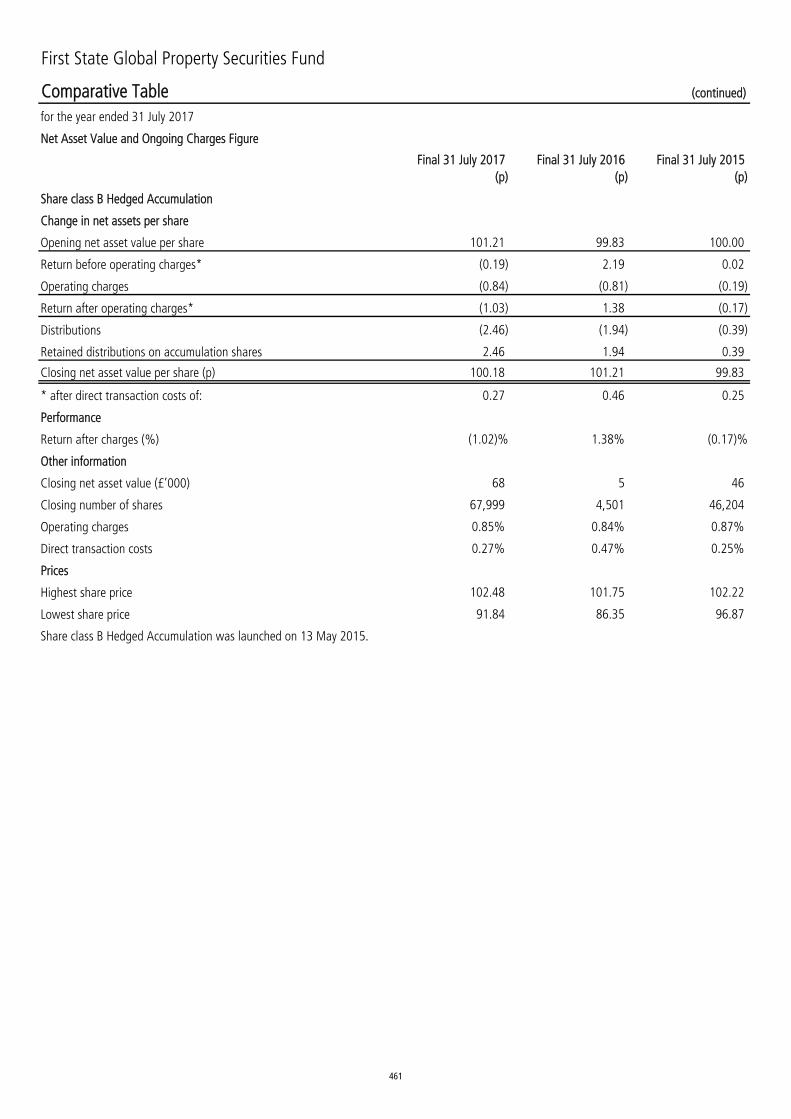
First State Global Property Securities Fund
Comparative Table (continued)
for the year ended 31 July 2017
Net Asset Value and Ongoing Charges Figure
Share class B Hedged Accumulation
Change in net assets per share
Opening net asset value per share
Return before operating charges*
Operating charges
Return after operating charges*
Distributions
Retained distributions on accumulation shares
Closing net asset value per share (p)
* after direct transaction costs of:
Performance
Return after charges (%)
Other information
Closing net asset value (£’000)
Closing number of shares
Operating charges
Direct transaction costs
Prices
Highest share price
Lowest share price
Share class B Hedged Accumulation was launched on 13 May 2015.
91.84 86.35 96.87
0.27% 0.47% 0.25%
102.48 101.75 102.22
0.85% 0.84% 0.87%
68 5 46
67,999 4,501 46,204
(1.02)% 1.38% (0.17)%
100.18 101.21 99.83
0.27 0.46 0.25
2.46 1.94 0.39
(1.03) 1.38 (0.17)
(2.46) (1.94) (0.39)
(0.19) 2.19 0.02
(0.84) (0.81) (0.19)
101.21 99.83 100.00
Final 31 July 2017(p)
Final 31 July 2016(p)
Final 31 July 2015(p)
461
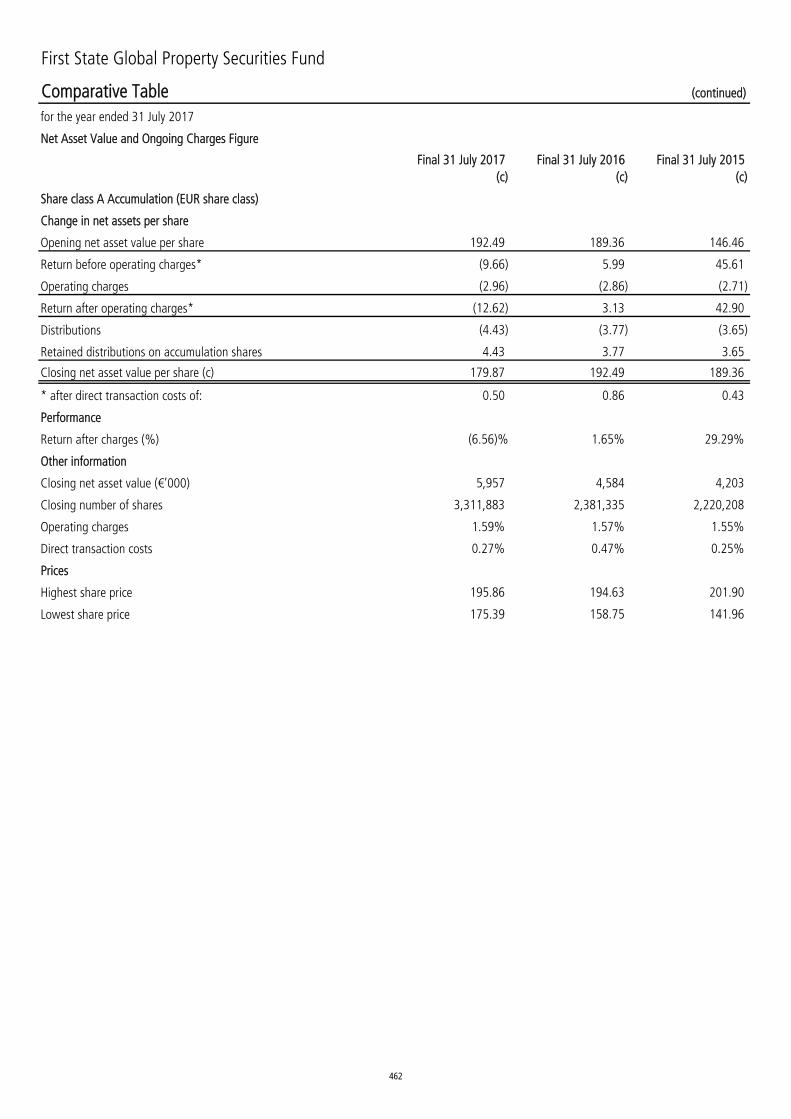
First State Global Property Securities Fund
Comparative Table (continued)
for the year ended 31 July 2017
Net Asset Value and Ongoing Charges Figure
Share class A Accumulation (EUR share class)
Change in net assets per share
Opening net asset value per share
Return before operating charges*
Operating charges
Return after operating charges*
Distributions
Retained distributions on accumulation shares
Closing net asset value per share (c)
* after direct transaction costs of:
Performance
Return after charges (%)
Other information
Closing net asset value (€’000)
Closing number of shares
Operating charges
Direct transaction costs
Prices
Highest share price
Lowest share price 175.39 158.75 141.96
0.27% 0.47% 0.25%
195.86 194.63 201.90
1.59% 1.57% 1.55%
5,957 4,584 4,203
3,311,883 2,381,335 2,220,208
(6.56)% 1.65% 29.29%
179.87 192.49 189.36
0.50 0.86 0.43
4.43 3.77 3.65
(12.62) 3.13 42.90
(4.43) (3.77) (3.65)
(9.66) 5.99 45.61
(2.96) (2.86) (2.71)
192.49 189.36 146.46
Final 31 July 2017(c)
Final 31 July 2016(c)
Final 31 July 2015(c)
462
First State Global Property Securities Fund
Comparative Table (continued)
for the year ended 31 July 2017
Net Asset Value and Ongoing Charges Figure
Share class A Income (EUR share class)
Change in net assets per share
Opening net asset value per share
Return before operating charges*
Operating charges
Return after operating charges*
Distributions
Closing net asset value per share (c)
* after direct transaction costs of:
Performance
Return after charges (%)
Other information
Closing net asset value (€’000)
Closing number of shares
Operating charges
Direct transaction costs
Prices
Highest share price
Lowest share price 140.11 128.82 118.64
0.27% 0.47% 0.25%
155.49 158.85 167.02
1.56% 1.56% 1.56%
187 7,877 16,525
132,962 5,098,377 10,652,726
(6.68)% 1.59% 29.24%
140.71 154.50 155.14
0.41 0.70 0.36
(10.32) 2.46 35.79
(3.47) (3.10) (3.05)
(7.94) 4.78 38.04
(2.38) (2.32) (2.25)
154.50 155.14 122.40
Final 31 July 2017(c)
Final 31 July 2016(c)
Final 31 July 2015(c)
463

First State Global Property Securities Fund
Comparative Table (continued)
for the year ended 31 July 2017
Net Asset Value and Ongoing Charges Figure
Share class B Accumulation (EUR share class)
Change in net assets per share
Opening net asset value per share
Return before operating charges*
Operating charges
Return after operating charges*
Distributions
Retained distributions on accumulation shares
Closing net asset value per share (c)
* after direct transaction costs of:
Performance
Return after charges (%)
Other information
Closing net asset value (€’000)
Closing number of shares
Operating charges
Direct transaction costs
Prices
Highest share price
Lowest share price 154.74 139.34 123.19
0.27% 0.47% 0.25%
173.26 171.42 176.07
0.80% 0.80% 0.80%
13,576 12,723 10,441
8,515,066 7,504,107 6,309,186
(5.95)% 2.44% 30.24%
159.45 169.54 165.50
0.45 0.75 0.38
3.91 3.32 3.18
(10.09) 4.04 38.43
(3.91) (3.32) (3.18)
(8.77) 5.32 39.65
(1.32) (1.28) (1.22)
169.54 165.50 127.07
Final 31 July 2017(c)
Final 31 July 2016(c)
Final 31 July 2015(c)
464
First State Global Property Securities Fund
Comparative Table (continued)
for the year ended 31 July 2017
Net Asset Value and Ongoing Charges Figure
Share class B Income (EUR share class)
Change in net assets per share
Opening net asset value per share
Return before operating charges*
Operating charges
Return after operating charges*
Distributions
Closing net asset value per share (c)
* after direct transaction costs of:
Performance
Return after charges (%)
Other information
Closing net asset value (€’000)
Closing number of shares
Operating charges
Direct transaction costs
Prices
Highest share price
Lowest share price
Share class B Income (EUR share class) is not paying any expenses since June 2016.
105.27 97.96 96.85
0.27% 0.47% 0.25%
116.61 131.01 137.09
0.80% 0.74% 0.77%
- - 3
51 50 2,000
(5.37)% (9.42)% 30.32%
106.10 114.85 127.65
0.30 0.56 0.29
(6.17) (12.02) 30.29
(2.58) (0.78) (2.53)
(5.28) (11.16) 31.20
(0.89) (0.86) (0.91)
114.85 127.65 99.89
Final 31 July 2017(c)
Final 31 July 2016(c)
Final 31 July 2015(c)
465
First State Global Property Securities Fund
Comparative Table (continued)
for the year ended 31 July 2017
Net Asset Value and Ongoing Charges Figure
Share class B Hedged Accumulation (EUR share class)
Change in net assets per share
Opening net asset value per share
Return before operating charges*
Operating charges
Return after operating charges*
Distributions
Retained distributions on accumulation shares
Closing net asset value per share (c)
* after direct transaction costs of:
Performance
Return after charges (%)
Other information
Closing net asset value (€’000)
Closing number of shares
Operating charges
Direct transaction costs
Prices
Highest share price
Lowest share price
Share class B Hedged Accumulation (EUR share class) was launched on 25 November 2015.
94.44 87.56
0.27% 0.47%
105.66 104.89
0.86% 0.86%
3,238 2,889
3,169,087 2,767,500
(2.13)% 4.39%
102.17 104.39
0.27 0.71
2.43 1.42
(2.22) 4.39
(2.43) (1.42)
(1.35) 4.98
(0.87) (0.59)
104.39 100.00
Final 31 July 2017(c)
Final 31 July 2016(c)
466
Notes £'000 £'000 £'000 £'000
Net capital (losses)/gains 2 (5,515) 49,707
Revenue 3 8,229 6,615
4 (2,732) (2,614)
Interest payable and similar charges (7) (7)
5,490 3,994
5 (1,065) (711)
4,425 3,283
(1,090) 52,990
6 (6,611) (5,546)
(7,701) 47,444
£'000 £'000 £'000 £'000
282,161 231,125
62,949 121,146
(80,826) (122,622)
(17,877) (1,476)
121 256
(7,701) 47,444
5,686 4,812
262,390 282,161
Less: Amounts payable on cancellation of shares
Dilution adjustment
Change in net assets attributable to shareholders from investment activities
Retained distribution on accumulation shares
Closing net assets attributable to shareholders
Notes to the Financial Statements are on pages 469 to 474.
Amounts receivable on issue of shares
for the year ended 31 July 2017
31 July 2017 31 July 2016
Opening net assets attributable to shareholders
Statement of Change in Net Assets Attributable to Shareholders
Income
Expenses
Net revenue before taxation
Taxation
Net revenue after taxation
Total return before distributions
Distributions
Change in net assets attributable to shareholders from investment activities
31 July 2017 31 July 2016
First State Global Property Securities Fund
Statement of Total Returnfor the year ended 31 July 2017
467
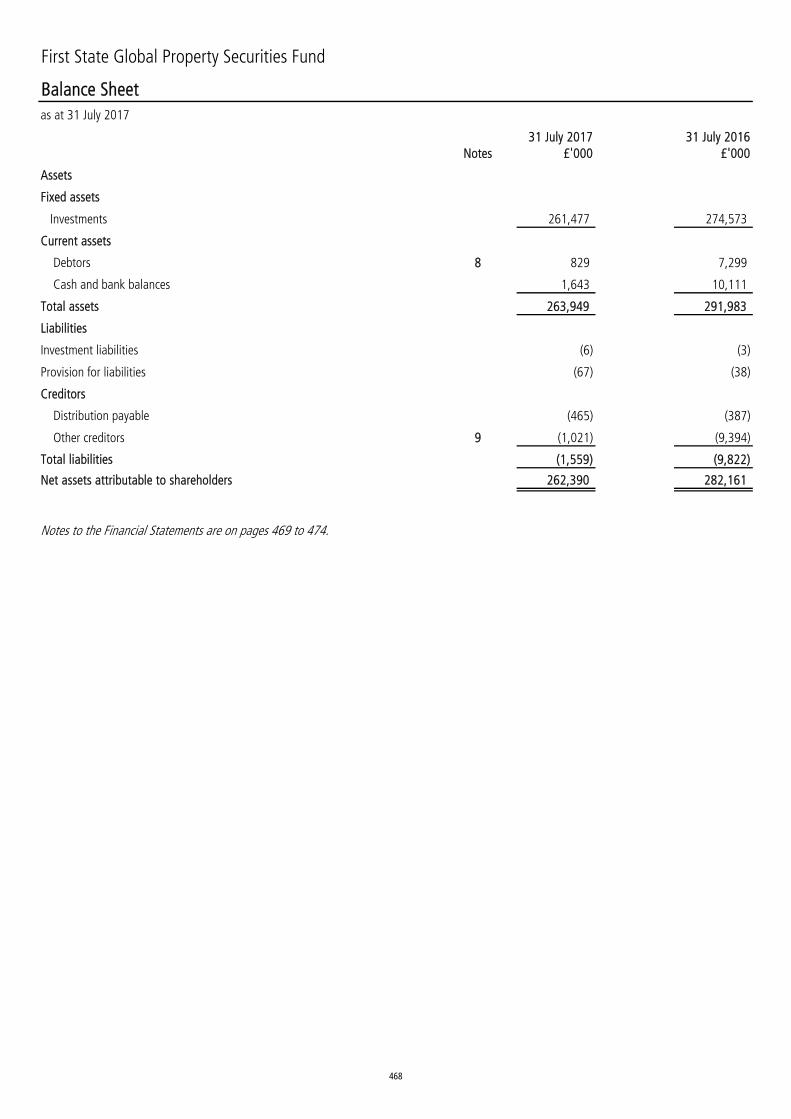
First State Global Property Securities Fund
31 July 2017 31 July 2016Notes £'000 £'000
Investments 261,477 274,573
Current assets
8 829 7,299
1,643 10,111
263,949 291,983
(6) (3)
Provision for liabilities (67) (38)
Creditors
(465) (387)
Other creditors 9 (1,021) (9,394)
(1,559) (9,822)
262,390 282,161
Notes to the Financial Statements are on pages 469 to 474.
Distribution payable
Total liabilities
Net assets attributable to shareholders
Investment liabilities
Balance Sheetas at 31 July 2017
Assets
Fixed assets
Debtors
Cash and bank balances
Total assets
Liabilities
468
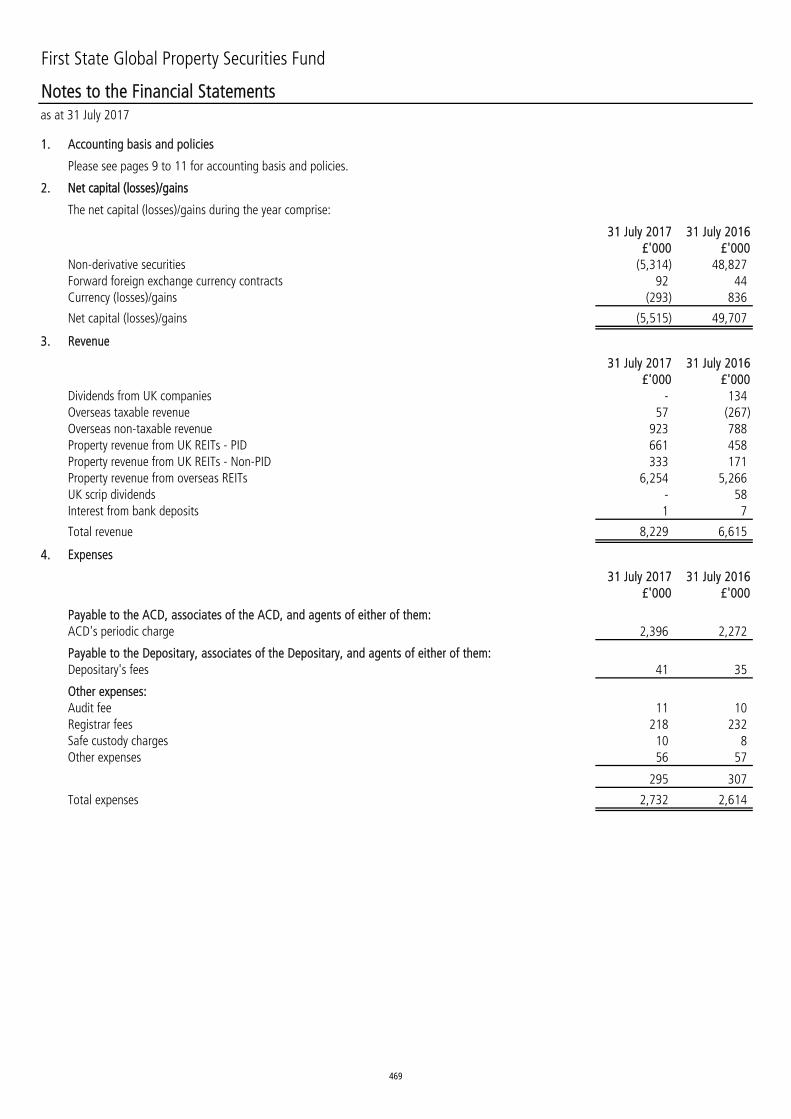
1.
2.
31 July 2017 31 July 2016£'000 £'000
(5,314) 48,82792 44
(293) 836
(5,515) 49,707
3.
31 July 2017 31 July 2016£'000 £'000
- 13457 (267)
923 788661 458333 171
6,254 5,266- 581 7
8,229 6,615
4.
31 July 2017 31 July 2016£'000 £'000
2,396 2,272
41 35
11 10218 232
10 856 57
295 307
2,732 2,614Total expenses
Audit feeRegistrar feesSafe custody chargesOther expenses
Other expenses:
Payable to the Depositary, associates of the Depositary, and agents of either of them:Depositary's fees
Expenses
Payable to the ACD, associates of the ACD, and agents of either of them:ACD's periodic charge
Total revenue
Interest from bank deposits
Property revenue from overseas REITsUK scrip dividends
Dividends from UK companiesOverseas taxable revenueOverseas non-taxable revenueProperty revenue from UK REITs - PIDProperty revenue from UK REITs - Non-PID
Net capital (losses)/gains
Revenue
Forward foreign exchange currency contractsCurrency (losses)/gains
Accounting basis and policies
Please see pages 9 to 11 for accounting basis and policies.
Net capital (losses)/gains
The net capital (losses)/gains during the year comprise:
Non-derivative securities
Notes to the Financial Statementsas at 31 July 2017
First State Global Property Securities Fund
469
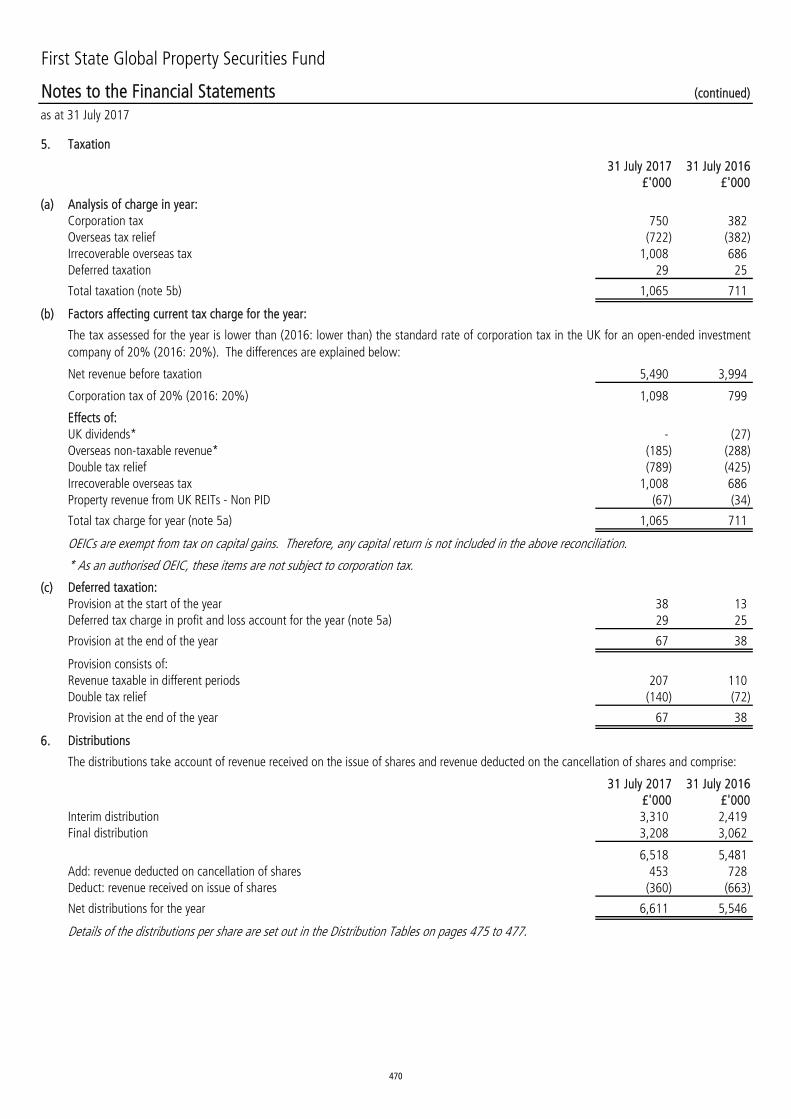
Notes to the Financial Statements (continued)
as at 31 July 2017
First State Global Property Securities Fund
5.
31 July 2017 31 July 2016£'000 £'000
(a)750 382
(722) (382)1,008 686
29 25
1,065 711
(b)
5,490 3,994
1,098 799
- (27)(185) (288)(789) (425)
1,008 686(67) (34)
1,065 711
(c)38 1329 25
67 38
207 110(140) (72)
67 38
6.
31 July 2017 31 July 2016£'000 £'0003,310 2,4193,208 3,062
6,518 5,481453 728
(360) (663)
6,611 5,546
Details of the distributions per share are set out in the Distribution Tables on pages 475 to 477.
Add: revenue deducted on cancellation of sharesDeduct: revenue received on issue of shares
Net distributions for the year
Final distributionInterim distribution
Distributions
The distributions take account of revenue received on the issue of shares and revenue deducted on the cancellation of shares and comprise:
Provision at the end of the year
Provision at the end of the year
Provision consists of:Revenue taxable in different periodsDouble tax relief
Deferred taxation:Provision at the start of the yearDeferred tax charge in profit and loss account for the year (note 5a)
Total tax charge for year (note 5a)
OEICs are exempt from tax on capital gains. Therefore, any capital return is not included in the above reconciliation.
* As an authorised OEIC, these items are not subject to corporation tax.
Property revenue from UK REITs - Non PIDIrrecoverable overseas tax
UK dividends*Overseas non-taxable revenue*Double tax relief
Net revenue before taxation
Corporation tax of 20% (2016: 20%)
Effects of:
Total taxation (note 5b)
Factors affecting current tax charge for the year:
The tax assessed for the year is lower than (2016: lower than) the standard rate of corporation tax in the UK for an open-ended investmentcompany of 20% (2016: 20%). The differences are explained below:
Deferred taxationIrrecoverable overseas tax
Analysis of charge in year:Corporation taxOverseas tax relief
Taxation
470

Notes to the Financial Statements (continued)
as at 31 July 2017
First State Global Property Securities Fund
7.
31 July 2017 31 July 2016£'000 £'0004,425 3,283
Expenses charged to capital 2,732 2,614Tax relief on expenses charged to capital (546) (351)
6,611 5,546
8.
31 July 2017 31 July 2016£'000 £'000
- 5,63253 1,142
657 406119 119
829 7,299
9.
31 July 2017 31 July 2016£'000 £'000
- 8,719586 393407 282
28 -
1,021 9,394
10.
31 July 2017 31 July 2016 31 July 2017 31 July 2016£'000 £'000 £'000 £'000
207,637 305,141 215,106 306,136
207,637 305,141 215,106 306,136
344 432 (344) (487)
39 238 (18) (25)
383 670 (362) (512)
208,020 305,811 214,744 305,624
Total costs
Total net trades in the year after transaction costs
TaxesEquities
Trades in the year before transaction costs
CommissionsEquities
Analysis of total trade costs:
Purchases Sales
Equities
Total creditors
Portfolio transaction costs
Purchases awaiting settlementAmounts payable for cancellation of sharesAccrued expensesCorporation tax payable
Creditors
Total debtors
Overseas tax recoverable
Amounts receivable for issue of sharesAccrued revenue
Debtors
Sales awaiting settlement
Net distributions for the year
Movement between net revenue and net distributions
Net revenue after taxation
471

Notes to the Financial Statements (continued)
as at 31 July 2017
First State Global Property Securities Fund
31 July 2017 31 July 2016 31 July 2017 31 July 2016% % % %
0.17 0.14 0.16 0.16
0.02 0.08 0.01 0.01
11.
12.
(a)
There is no material difference between the value of the financial assets and liabilities, as shown in the Balance Sheet, and their fair value.
If market prices increase or decrease by 10%, then the impact on the portfolio will be an increase or decrease of 10% (£26,143,601)(31/07/16: £27,456,416).
The Fund’s main liability is the redemption of any shares that investors wish to sell. In general, the ACD manages the cash to ensure that itcan meet its liabilities. Assets from a Fund may need to be sold if insufficient cash is available to finance such redemptions. The Fund’sholdings are reviewed on a regular basis, with particular emphasis on the market capitalisation of the issuer (securities issued by largercapitalised companies generally have greater liquidity) and the number of days it would take to trade out of a given securities position orpercentage of the Fund as a whole (determined by reference to available market trading volumes). Funds that have a higher concentration ofsecurities that are deemed to be less liquid are regularly monitored.
As a proportion of the Fund’s investment portfolio is invested in overseas securities, the Balance Sheet can be affected by movements inforeign exchange rates. The Investment Manager may seek to manage exposure to currency movements by using forward foreign exchangecontracts or by hedging the sterling value of investments that are priced in other currencies. Income received in other currencies is convertedto sterling on or near the date of receipt.
The market value of investments is taken to equal ‘fair value’ for the purposes of Financial Reporting Standard 102. Given all the activities ofthe Fund, none of the investments held fall within the definition of ‘investments held for trading’ as set out in Financial Reporting Standard13.
Fair value of financial assets and financial liabilities
Derivatives and other financial instruments
General
In pursuing its investment objectives, the Fund holds equity shares.
The main risk arising from the Fund’s financial instruments is market-price risk. Market-price risk arises mainly from uncertainty about futureprices of the financial instruments held. Investment risk in the portfolio is regularly reviewed and controlled through the adoption ofparameters limiting exposures to various factors such as industries, countries, and company size.
The Fund has little exposure to credit or cash-flow risk. Certain transactions in securities that the Fund enters into expose it to the risk thatthe counter-party will not deliver the investment (purchase) or cash (sale) after the Fund has fulfilled its responsibilities. The Fund only buysand sells investments through brokers that have been approved by the Authorised Corporate Director as an acceptable counter-party. This listis reviewed quarterly. The Fund’s assets comprise mainly realisable securities that can be readily sold in normal market conditions.
Contingent liabilities and commitments
As at 31 July 2017, the Fund had no contingent liabilities (31/07/16: £nil) and no commitments (31/07/16: £nil).
The average portfolio dealing spread at the balance sheet date was 0.12% (31/07/2016: 0.12%).
Total costs 0.27 0.47
Average portfolio dealing spread
Commissions 0.25 0.37Taxes 0.02 0.10
Total transaction cost expressed as a percentage of average net asset value:
31 July 2017 31 July 2016% %
EquitiesTaxes
CommissionsEquities
Total transaction cost expressed as a percentage of asset type cost:
Purchases Sales
472
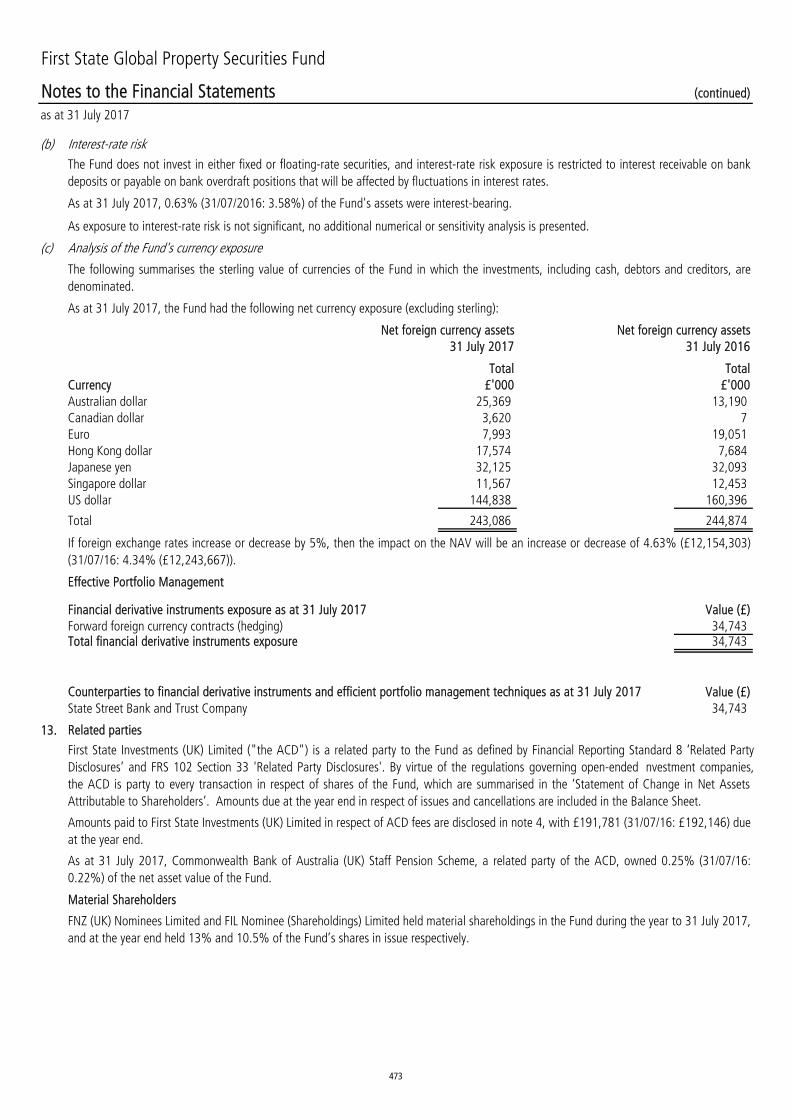
Notes to the Financial Statements (continued)
as at 31 July 2017
First State Global Property Securities Fund
(b)
(c)
Total TotalCurrency £'000 £'000Australian dollar 25,369 13,190Canadian dollar 3,620 7Euro 7,993 19,051Hong Kong dollar 17,574 7,684Japanese yen 32,125 32,093Singapore dollar 11,567 12,453US dollar 144,838 160,396
Total 243,086 244,874
Financial derivative instruments exposure as at 31 July 2017 Value (£)Forward foreign currency contracts (hedging) 34,743Total financial derivative instruments exposure 34,743
Value (£)State Street Bank and Trust Company 34,743
13.
Amounts paid to First State Investments (UK) Limited in respect of ACD fees are disclosed in note 4, with £191,781 (31/07/16: £192,146) due at the year end.
As at 31 July 2017, Commonwealth Bank of Australia (UK) Staff Pension Scheme, a related party of the ACD, owned 0.25% (31/07/16:0.22%) of the net asset value of the Fund.
Material Shareholders
FNZ (UK) Nominees Limited and FIL Nominee (Shareholdings) Limited held material shareholdings in the Fund during the year to 31 July 2017,and at the year end held 13% and 10.5% of the Fund’s shares in issue respectively.
Related parties
First State Investments (UK) Limited ("the ACD") is a related party to the Fund as defined by Financial Reporting Standard 8 ‘Related Party Disclosures’ and FRS 102 Section 33 'Related Party Disclosures'. By virtue of the regulations governing open-ended investment companies, the ACD is party to every transaction in respect of shares of the Fund, which are summarised in the ‘Statement of Change in Net Assets Attributable to Shareholders’. Amounts due at the year end in respect of issues and cancellations are included in the Balance Sheet.
Effective Portfolio Management
Counterparties to financial derivative instruments and efficient portfolio management techniques as at 31 July 2017
If foreign exchange rates increase or decrease by 5%, then the impact on the NAV will be an increase or decrease of 4.63% (£12,154,303)(31/07/16: 4.34% (£12,243,667)).
The following summarises the sterling value of currencies of the Fund in which the investments, including cash, debtors and creditors, aredenominated.
As at 31 July 2017, the Fund had the following net currency exposure (excluding sterling):
Net foreign currency assets Net foreign currency assets31 July 2017 31 July 2016
As at 31 July 2017, 0.63% (31/07/2016: 3.58%) of the Fund's assets were interest-bearing.
As exposure to interest-rate risk is not significant, no additional numerical or sensitivity analysis is presented.
Analysis of the Fund's currency exposure
Interest-rate riskThe Fund does not invest in either fixed or floating-rate securities, and interest-rate risk exposure is restricted to interest receivable on bankdeposits or payable on bank overdraft positions that will be affected by fluctuations in interest rates.
473
Notes to the Financial Statements (continued)
as at 31 July 2017
First State Global Property Securities Fund
14.
%1.501.500.750.750.751.501.500.750.750.75
31 July 2016 31 July 2017
Opening shares in issue Creations Cancellations
Shares converted
Closing shares in issue
19,154,906 3,776,805 (8,304,670) (294,350) 14,332,6912,014,218 4,262,064 (3,957,120) (30,115) 2,289,047
88,831,725 10,102,187 (16,897,771) 214,145 82,250,28615,366,187 6,549,441 (1,436,230) 110,306 20,589,704
4,501 65,133 (1,635) - 67,9992,381,335 1,581,716 (651,168) - 3,311,8835,098,377 1,686,104 (6,651,519) - 132,9627,504,107 7,904,772 (6,893,813) - 8,515,066
50 1 - - 512,767,500 656,357 (254,770) - 3,169,087
15.
Assets Liabilities Assets Liabilities
£'000 £'000 £'000 £'000261,436 - 274,564 -
41 (6) 9 (3)- - - -
261,477 (6) 274,573 (3)
Level 3: inputs are unobservable (i.e. market data is unavailable) for the asset or liability. Over the Counter (OTC) derivatives (including equityswaps) are held at fair value, which is determined by valuation techniques or single broker quotes.
Level 1Level 2Level 3
Total fair value
Level 1: the unadjusted quoted price in an active market for identical assets or liabilities that the entity can access at the measurement date. Level 2: inputs other than quoted prices included within Level 1 that are observable (i.e. developed using market data) for the asset or liability,either directly or indirectly.
Fair value
Valuation technique
31 July 2017 31 July 2016
Share class B Hedged Accumulation (EUR share class) (Institutional)
Share class B Income (Institutional)Share class B Hedged Accumulation (Institutional)Share class A Accumulation (EUR share class) (Retail)Share class A Income (EUR share class) (Retail)Share class B Accumulation (EUR share class) (Institutional)Share class B Income (EUR share class) (Institutional)
All share classes have the same rights on winding up.
Reconciliation of the shares movement in the year:
Share class A Accumulation (Retail)Share class A Income (Retail)Share class B Accumulation (Institutional)
The net asset value of each share class, the net asset value per share and the number of shares in each class are given in the ComparativeTable on pages 457 to 466.
The distributions per share class are given in the Distribution Tables on pages 475 to 477.
Share class B Hedged Accumulation (Institutional):Share class A Accumulation (EUR share class) (Retail):Share class A Income (EUR share class) (Retail):Share class B Accumulation (EUR share class) (Institutional):Share class B Income (EUR share class) (Institutional):Share class B Hedged Accumulation (EUR share class) (Institutional):
The ACD's periodic charge on each share class is as follows:
Share class A Accumulation (Retail):Share class A Income (Retail):Share class B Accumulation (Institutional):Share class B Income (Institutional):
Share classes
The Fund has ten share classes in issue.
474

Share class A Accumulation
Netrevenue Equalisation
Distributions paid to/payable
30/09/2017
Distributions paid
30/09/2016Group 1 (p) (p) (p) (p)Interim 2.4200 - 2.4200 1.6326Final 2.4396 - 2.4396 2.1664Group 2 (p) (p) (p) (p)Interim 1.2246 1.1954 2.4200 1.6326Final 1.4293 1.0103 2.4396 2.1664
Share class A Income
Netrevenue Equalisation
Distributions paid to/payable
30/09/2017
Distributions paid
30/09/2016Group 1 (p) (p) (p) (p)Interim 1.8599 - 1.8599 1.2681Final 1.8435 - 1.8435 1.6898Group 2 (p) (p) (p) (p)Interim 0.8559 1.0040 1.8599 1.2681Final 0.8430 1.0005 1.8435 1.6898
Share class B Accumulation
Netrevenue Equalisation
Distributions paid to/payable
30/09/2017
Distributions paid
30/09/2016Group 1 (p) (p) (p) (p)Interim 2.5399 - 2.5399 1.6797Final 2.6061 - 2.6061 2.3352Group 2 (p) (p) (p) (p)Interim 1.1739 1.3660 2.5399 1.6797Final 1.3924 1.2137 2.6061 2.3352
Share class B Income
Netrevenue Equalisation
Distributions paid to/payable
30/09/2017
Distributions paid
30/09/2016Group 1 (p) (p) (p) (p)Interim 2.0020 - 2.0020 1.3584Final 2.0434 - 2.0434 1.8571Group 2 (p) (p) (p) (p)Interim 0.9772 1.0248 2.0020 1.3584Final 1.0539 0.9895 2.0434 1.8571
Final - Shares purchased between 1 February 2017 and 31 July 2017Group 2 Interim - Shares purchased between 1 August 2016 and 31 January 2017
Final - Shares purchased prior to 1 February 2017
Distribution in pence and cents per share
First State Global Property Securities Fund
Distribution Tablesfor the year ended 31 July 2017
Group 1 Interim - Shares purchased prior to 1 August 2016
475
First State Global Property Securities Fund
Distribution Tables (continued)
for the year ended 31 July 2017
Share class B Hedged Accumulation
Netrevenue Equalisation
Distributions paid to/payable
30/09/2017
Distributions paid
30/09/2016Group 1 (p) (p) (p) (p)Interim 1.2290 - 1.2290 0.8880Final 1.2275 - 1.2275 1.0501Group 2 (p) (p) (p) (p)Interim 0.4368 0.7922 1.2290 0.8880Final 1.0775 0.1500 1.2275 1.0501
Share class A Accumulation (EUR share class)
Netrevenue Equalisation
Distributions paid to/payable
30/09/2017
Distributions paid
30/09/2016Group 1 (c) (c) (c) (c)Interim 2.2387 - 2.2387 1.6601Final 2.1935 - 2.1935 2.1055Group 2 (c) (c) (c) (c)Interim 1.1353 1.1034 2.2387 1.6601Final 1.1934 1.0001 2.1935 2.1055
Share class A Income (EUR share class)
Netrevenue Equalisation
Distributions paid to/payable
30/09/2017
Distributions paid
30/09/2016Group 1 (c) (c) (c) (c)Interim 1.8635 - 1.8635 1.5246Final 1.6031 - 1.6031 1.5777Group 2 (c) (c) (c) (c)Interim 1.1592 0.7043 1.8635 1.5246Final 0.6565 0.9466 1.6031 1.5777
Share class B Accumulation (EUR share class)
Netrevenue Equalisation
Distributions paid to/payable
30/09/2017
Distributions paid
30/09/2016Group 1 (c) (c) (c) (c)Interim 1.9556 - 1.9556 1.4817Final 1.9547 - 1.9547 1.8385Group 2 (c) (c) (c) (c)Interim 1.1467 0.8089 1.9556 1.4817Final 0.6341 1.3206 1.9547 1.8385
Share class B Income (EUR share class)
Netrevenue Equalisation
Distributions paid to/payable
30/09/2017
Distributions paid
30/09/2016Group 1 (c) (c) (c) (c)Interim 1.1918 - 1.1918 -Final 1.3850 - 1.3850 0.7800Group 2 (c) (c) (c) (c)Interim 1.1918 - 1.1918 -Final 1.3850 - 1.3850 0.7800
476
First State Global Property Securities Fund
Distribution Tables (continued)
for the year ended 31 July 2017
Share class B Hedged Accumulation (EUR share class)
Netrevenue Equalisation
Distributions paid to/payable
30/09/2017
Distributions paid
30/09/2016Group 1 (c) (c) (c) (c)Interim 1.1868 - 1.1868 0.2806Final 1.2467 - 1.2467 1.1381Group 2 (c) (c) (c) (c)Interim 0.5841 0.6027 1.1868 0.2806Final 0.5924 0.6543 1.2467 1.1381
Shareholders should consult their professional advisers for any advice regarding their tax position.
Final - 29.86% of the dividend is received as franked investment income.
Final - 0.00% of the dividend is received as an annual payment (non-foreign element) received after the deduction of income tax at the lower rateand is liable to corporation tax. The tax deemed to be deducted is treated as income tax.
Final - 70.14% of the dividend is received as an annual payment (foreign element) received after the deduction of income tax at the lower rate andis liable to corporation tax. It is treated as foreign income in the hands of the corporate investor and is liable to corporation tax. The associateddeemed tax is treated as foreign tax in the hands of the investor, who may be able to claim double tax relief. Investors cannot reclaim any of thisdeemed tax on the foreign element from HM Revenue & Customs.
Interim - 17.06% of the dividend is received as franked investment income.
Interim - 0.00% of the dividend is received as an annual payment (non-foreign element) received after the deduction of income tax at the lowerrate and is liable to corporation tax. The tax deemed to be deducted is treated as income tax.
Interim - 82.94% of the dividend is received as an annual payment (foreign element) received after the deduction of income tax at the lower rateand is liable to corporation tax. It is treated as foreign income in the hands of the corporate investor and is liable to corporation tax. Theassociated deemed tax is treated as foreign tax in the hands of the investor, who may be able to claim double tax relief. Investors cannot reclaimany of this deemed tax on the foreign element from HM Revenue & Customs.
Corporate tax for all share classes (unaudited)
A shareholder liable to corporation tax receives this distribution, excluding equalisation, as follows:
477
Essex CM14 9NH Essex CM14 9NH
Website: www.firststateinvestments.com
Investment AdvisersFirst State Investments (Hong Kong) Limited
Telephone: 0800 587 4141 and +44 131 525 8870
Colonial First State Asset Management (Australia) Limited
First State Investments (UK) Limited
C TurpinA Hilderly
First State Investment Management (UK) Limited
Email: [email protected]
Directors of the ACD:
R Wastcoat
First State Investments ICVC
The CompanyFirst State Investments ICVC
Corporate Directory
London EC2M 7EB23 St Andrew Square
K Lakhani
Dealing address:
Authorised and regulated by the Financial Conduct Authority.
First State Investments (UK) Limited First State Investments (UK) LimitedCorrespondence address:
London EC2M 7EB
Registered office:
F Johnson
Registered office: Principal place of business:
Edinburgh EH2 1BBFinsbury Circus House, 15 Finsbury Circus
Authorised Corporate Director (ACD)
PO Box 12089 PO Box 12089
Head office:23 St Andrew SquareEdinburgh EH2 1BB
Finsbury Circus House, 15 Finsbury Circus
Brentwood Brentwood
Contact details:
Investment Manager
Authorised and regulated by the Financial Conduct Authority.
23 St Andrew SquareRegistered office:
Edinburgh EH2 1BB
Registered office:
The Bank of New York Mellon (International) Limited†Depositary
Registered office:Level 29, 52 Martin PlaceSydney NSW 2000 Central, Hong Kong
Registered office:Level 25, One Exchange Square
Registered office:38 Beach Road06-11 South Beach Tower
London E14 5ALOne Canada Square
First State Investments (Singapore)
Singapore 189767
478
First State Investments ICVC
Corporate Directory
Custodian AdministratorThe Bank of New York Mellon (International) Limited† The Bank of New York Mellon (International) Limited†
Registered office:One Canada SquareLondon E14 5AL
EdinburghEH3 9SU
Principal place of business and location of the Register:Registered office:
The Bank of New York Mellon (International) Limited
2 Festival SquareOne Canada Square Capital House
Legal Advisers
London EC2Y 9SS
PricewaterhouseCoopers LLP
Registered Office:Level 4
* On 16 September 2016, the ACD Board passed a motion to retain Bank of New York Mellon (International) Limited as the Registrar.
Registered office Finsbury Circus House, 15 Finsbury Circus, London, EC2M 7EB.Entered on the FCA Register, registration number 143359.
† As at the annual financial reporting date of 31 July 2017, State Street Trustees Limited were Depositary, Custodian and Administrator of the FirstState Investments ICVC. The Bank of New York Mellon (International) Limited were appointed Depositary, Custodian and Administrator on 1August 2017.
London E14 5AL
Atria One144 Morrison Street
Simmons & Simmons LLP
Edinburgh EH3 8EX
One Ropemaker Street
Registered No. 2294743 England and Wales.
London E14 5AL
Independent Auditors
Authorised and regulated by the Financial Conduct Authority and a member of IA.
Registrar*
Registered office:One Canada Square
Issued by First State Investments (UK) Limited.
Registered Office:CityPoint
479
Issued by First State Investments (UK) Limited
Authorised and regulated by the Financial Conduct Authority and a member of IA
Registered No 2294743 England and Wales
Registered office Finsbury Circus House, 15 Finsbury Circus London EC2M 7EB
Entered on the FCA Register, registration number 143359


![First Sentier Investors ICVC · 2020. 9. 22. · [Type here] First Sentier Investors ICVC Prospectus Prospectus valid as at 22 September 2020 registered in England and Wales under](https://img.pdfslide.us/doc/110x75/60bcc8431f7c844a7a7fe4f7/first-sentier-investors-icvc-2020-9-22-type-here-first-sentier-investors.jpg)