Embed Size (px)
Citation preview
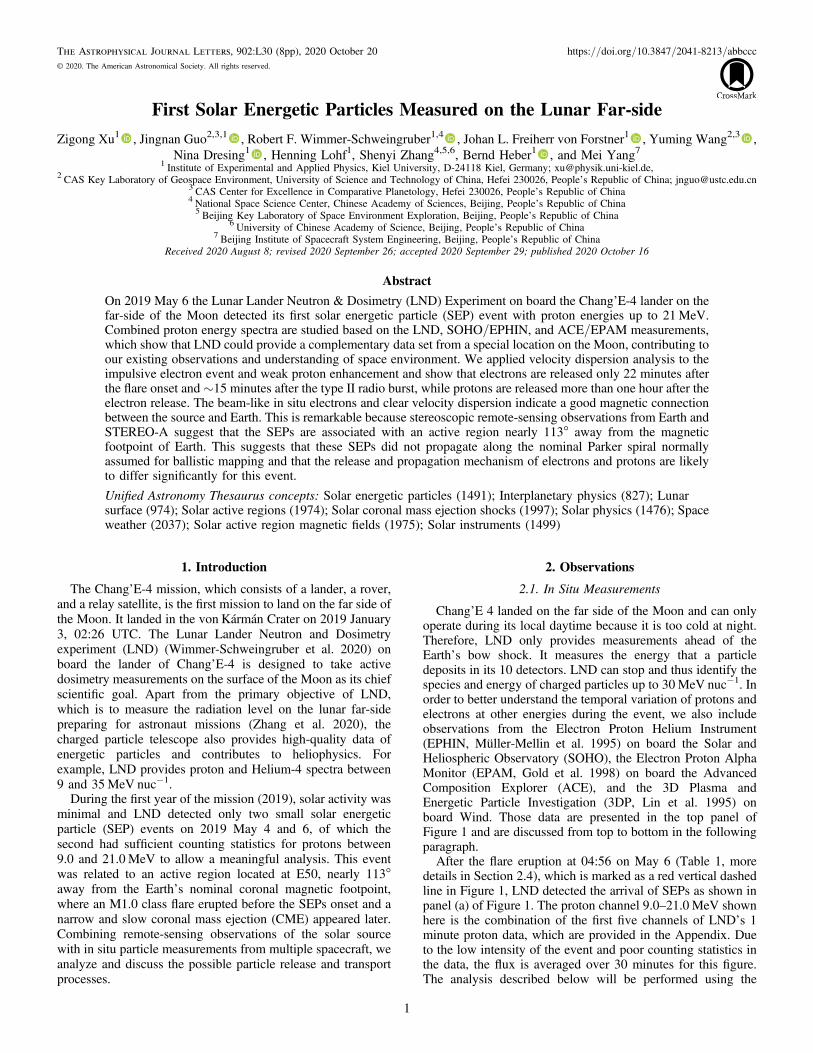
First Solar Energetic Particles Measured on the Lunar Far-side
Zigong Xu1 , Jingnan Guo2,3,1 , Robert F. Wimmer-Schweingruber1,4 , Johan L. Freiherr von Forstner1 , Yuming Wang2,3 ,Nina Dresing1 , Henning Lohf1, Shenyi Zhang4,5,6, Bernd Heber1 , and Mei Yang7
1 Institute of Experimental and Applied Physics, Kiel University, D-24118 Kiel, Germany; [email protected],2 CAS Key Laboratory of Geospace Environment, University of Science and Technology of China, Hefei 230026, People’s Republic of China; [email protected]
3 CAS Center for Excellence in Comparative Planetology, Hefei 230026, People’s Republic of China4 National Space Science Center, Chinese Academy of Sciences, Beijing, People’s Republic of China5 Beijing Key Laboratory of Space Environment Exploration, Beijing, People’s Republic of China
6 University of Chinese Academy of Science, Beijing, People’s Republic of China7 Beijing Institute of Spacecraft System Engineering, Beijing, People’s Republic of China
Received 2020 August 8; revised 2020 September 26; accepted 2020 September 29; published 2020 October 16
Abstract
On 2019 May 6 the Lunar Lander Neutron & Dosimetry (LND) Experiment on board the Chang’E-4 lander on thefar-side of the Moon detected its first solar energetic particle (SEP) event with proton energies up to 21MeV.Combined proton energy spectra are studied based on the LND, SOHO/EPHIN, and ACE/EPAM measurements,which show that LND could provide a complementary data set from a special location on the Moon, contributing toour existing observations and understanding of space environment. We applied velocity dispersion analysis to theimpulsive electron event and weak proton enhancement and show that electrons are released only 22 minutes afterthe flare onset and ∼15 minutes after the type II radio burst, while protons are released more than one hour after theelectron release. The beam-like in situ electrons and clear velocity dispersion indicate a good magnetic connectionbetween the source and Earth. This is remarkable because stereoscopic remote-sensing observations from Earth andSTEREO-A suggest that the SEPs are associated with an active region nearly 113° away from the magneticfootpoint of Earth. This suggests that these SEPs did not propagate along the nominal Parker spiral normallyassumed for ballistic mapping and that the release and propagation mechanism of electrons and protons are likelyto differ significantly for this event.
Unified Astronomy Thesaurus concepts: Solar energetic particles (1491); Interplanetary physics (827); Lunarsurface (974); Solar active regions (1974); Solar coronal mass ejection shocks (1997); Solar physics (1476); Spaceweather (2037); Solar active region magnetic fields (1975); Solar instruments (1499)
1. Introduction
The Chang’E-4 mission, which consists of a lander, a rover,and a relay satellite, is the first mission to land on the far side ofthe Moon. It landed in the von Kármán Crater on 2019 January3, 02:26 UTC. The Lunar Lander Neutron and Dosimetryexperiment (LND) (Wimmer-Schweingruber et al. 2020) onboard the lander of Chang’E-4 is designed to take activedosimetry measurements on the surface of the Moon as its chiefscientific goal. Apart from the primary objective of LND,which is to measure the radiation level on the lunar far-sidepreparing for astronaut missions (Zhang et al. 2020), thecharged particle telescope also provides high-quality data ofenergetic particles and contributes to heliophysics. Forexample, LND provides proton and Helium-4 spectra between9 and 35MeV nuc−1.
During the first year of the mission (2019), solar activity wasminimal and LND detected only two small solar energeticparticle (SEP) events on 2019 May 4 and 6, of which thesecond had sufficient counting statistics for protons between9.0 and 21.0 MeV to allow a meaningful analysis. This eventwas related to an active region located at E50, nearly 113°away from the Earth’s nominal coronal magnetic footpoint,where an M1.0 class flare erupted before the SEPs onset and anarrow and slow coronal mass ejection (CME) appeared later.Combining remote-sensing observations of the solar sourcewith in situ particle measurements from multiple spacecraft, weanalyze and discuss the possible particle release and transportprocesses.
2. Observations
2.1. In Situ Measurements
Chang’E 4 landed on the far side of the Moon and can onlyoperate during its local daytime because it is too cold at night.Therefore, LND only provides measurements ahead of theEarth’s bow shock. It measures the energy that a particledeposits in its 10 detectors. LND can stop and thus identify thespecies and energy of charged particles up to 30MeV nuc−1. Inorder to better understand the temporal variation of protons andelectrons at other energies during the event, we also includeobservations from the Electron Proton Helium Instrument(EPHIN, Müller-Mellin et al. 1995) on board the Solar andHeliospheric Observatory (SOHO), the Electron Proton AlphaMonitor (EPAM, Gold et al. 1998) on board the AdvancedComposition Explorer (ACE), and the 3D Plasma andEnergetic Particle Investigation (3DP, Lin et al. 1995) onboard Wind. Those data are presented in the top panel ofFigure 1 and are discussed from top to bottom in the followingparagraph.After the flare eruption at 04:56 on May 6 (Table 1, more
details in Section 2.4), which is marked as a red vertical dashedline in Figure 1, LND detected the arrival of SEPs as shown inpanel (a) of Figure 1. The proton channel 9.0–21.0 MeV shownhere is the combination of the first five channels of LND’s 1minute proton data, which are provided in the Appendix. Dueto the low intensity of the event and poor counting statistics inthe data, the flux is averaged over 30 minutes for this figure.The analysis described below will be performed using the
The Astrophysical Journal Letters, 902:L30 (8pp), 2020 October 20 https://doi.org/10.3847/2041-8213/abbccc© 2020. The American Astronomical Society. All rights reserved.
1
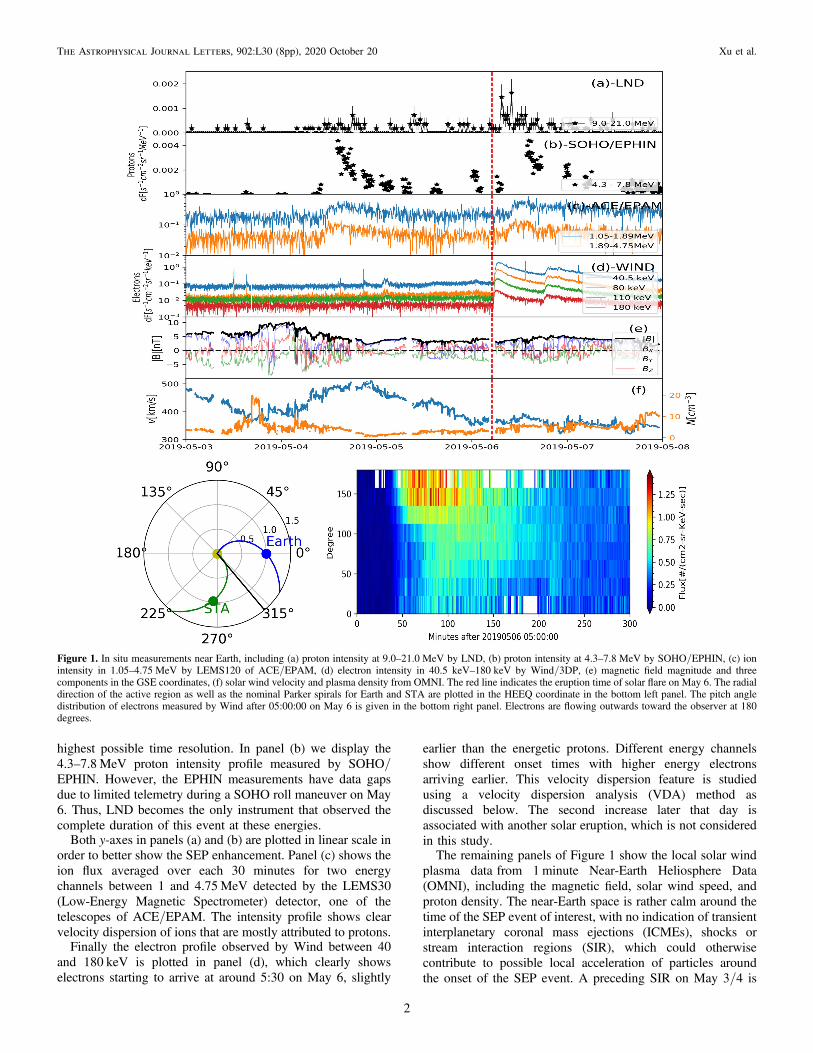
highest possible time resolution. In panel (b) we display the4.3–7.8 MeV proton intensity profile measured by SOHO/EPHIN. However, the EPHIN measurements have data gapsdue to limited telemetry during a SOHO roll maneuver on May6. Thus, LND becomes the only instrument that observed thecomplete duration of this event at these energies.
Both y-axes in panels (a) and (b) are plotted in linear scale inorder to better show the SEP enhancement. Panel (c) shows theion flux averaged over each 30 minutes for two energychannels between 1 and 4.75MeV detected by the LEMS30(Low-Energy Magnetic Spectrometer) detector, one of thetelescopes of ACE/EPAM. The intensity profile shows clearvelocity dispersion of ions that are mostly attributed to protons.
Finally the electron profile observed by Wind between 40and 180 keV is plotted in panel (d), which clearly showselectrons starting to arrive at around 5:30 on May 6, slightly
earlier than the energetic protons. Different energy channelsshow different onset times with higher energy electronsarriving earlier. This velocity dispersion feature is studiedusing a velocity dispersion analysis (VDA) method asdiscussed below. The second increase later that day isassociated with another solar eruption, which is not consideredin this study.The remaining panels of Figure 1 show the local solar wind
plasma datafrom 1 minute Near-Earth Heliosphere Data(OMNI), including the magnetic field, solar wind speed, andproton density. The near-Earth space is rather calm around thetime of the SEP event of interest, with no indication of transientinterplanetary coronal mass ejections (ICMEs), shocks orstream interaction regions (SIR), which could otherwisecontribute to possible local acceleration of particles aroundthe onset of the SEP event. A preceding SIR on May 3/4 is
Figure 1. In situ measurements near Earth, including (a) proton intensity at 9.0–21.0 MeV by LND, (b) proton intensity at 4.3–7.8 MeV by SOHO/EPHIN, (c) ionintensity in 1.05–4.75 MeV by LEMS120 of ACE/EPAM, (d) electron intensity in 40.5 keV–180 keV by Wind/3DP, (e) magnetic field magnitude and threecomponents in the GSE coordinates, (f) solar wind velocity and plasma density from OMNI. The red line indicates the eruption time of solar flare on May 6. The radialdirection of the active region as well as the nominal Parker spirals for Earth and STA are plotted in the HEEQ coordinate in the bottom left panel. The pitch angledistribution of electrons measured by Wind after 05:00:00 on May 6 is given in the bottom right panel. Electrons are flowing outwards toward the observer at 180degrees.
2
The Astrophysical Journal Letters, 902:L30 (8pp), 2020 October 20 Xu et al.
indicated by the increase of magnetic fields, enhanced protondensity and the slow rise of solar wind speed and was followedby a high-speed stream on May 4/5. We do not expect thispreceding structure to have any influence on the SEP eventreported here.
As shown in the bottom left panel of Figure 1, at the time ofthe SEP event under study, the longitudinal separation betweenthe active region and the magnetic footpoint of STA usingballistic back mapping is only 7°, which suggests that STAwould be a perfect observer for these energetic particles.However, STA was already experiencing an ongoing SEPevent at the time of the flare and no impulsive contribution isseen at STA. Thus all we can state is that the impulsive eventreported here was too small to be seen above the background ofthe preceding event at STA.
2.2. Determination of Onset and Release Times
The small intensity of the SEP event along with the limitedgeometry factor of LND require careful analysis of the data andlimit the accuracy of the determination of the event onset times.Therefore, we apply the Poisson-CUSUMmethod (Lucas 1985)and follow the procedure in Huttunen-Heikinmaa et al. (2005)to derive the onset time of each energy channel using LND’shighest time resolution of 1 minute. In the Appendix, wepresent the Poisson-CUSUM analysis on the different LNDenergy channels in more detail.
The onset times of the 9.0–10.6 and 10.7–12.7 MeVchannels are 08:00±7 and 07:32±21 minutes. The calcul-ation of the uncertainties is explained in the Appendix.Assuming protons traveling scatter-free along a 1.2 auinterplanetary magnetic field (IMF) line, which is calculatedfrom the solar wind speed averaged over 8 hr before the SEPevent, we derive that the 10.7–12.7MeV protons need about 63minutes to arrive at Earth and the release time is around06:29±21 minutes. The onset times for ACE/EPAM andWind/3DP are determined as the time when the flux exceeds3σ of the background signal. The latter is defined as the flux anhour before the SEP onset.
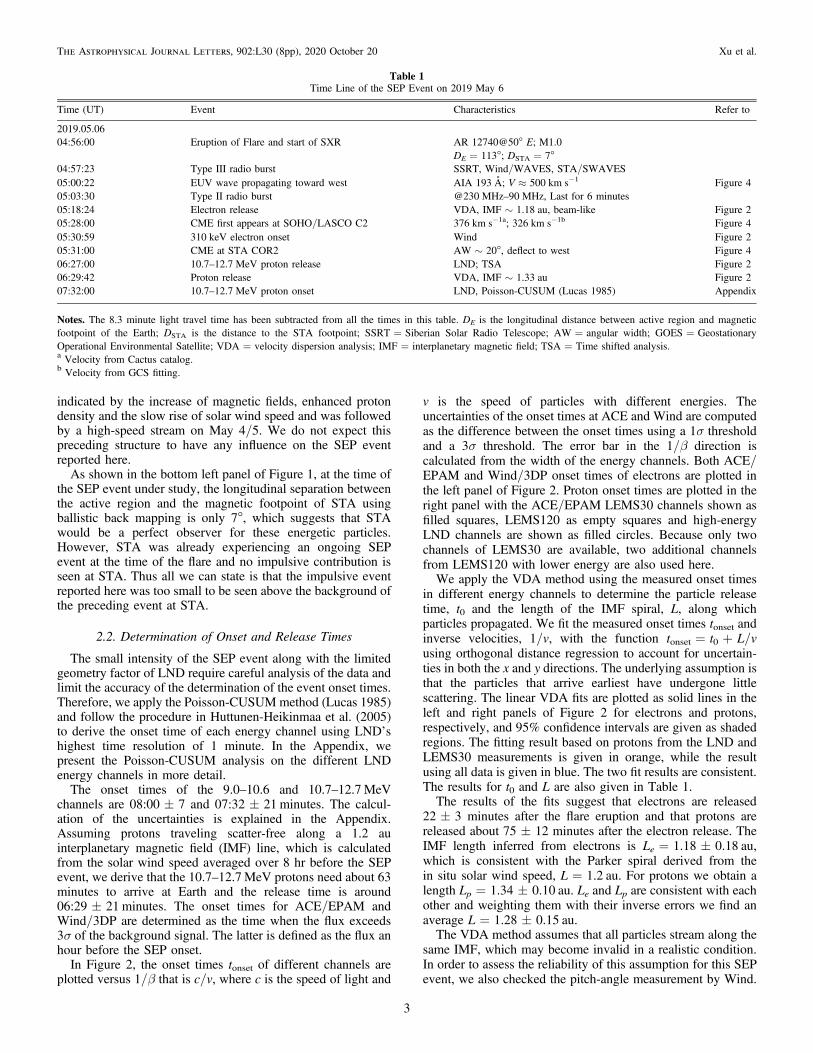
In Figure 2, the onset times tonset of different channels areplotted versus 1/β that is c/v, where c is the speed of light and
v is the speed of particles with different energies. Theuncertainties of the onset times at ACE and Wind are computedas the difference between the onset times using a 1σ thresholdand a 3σ threshold. The error bar in the 1/β direction iscalculated from the width of the energy channels. Both ACE/EPAM and Wind/3DP onset times of electrons are plotted inthe left panel of Figure 2. Proton onset times are plotted in theright panel with the ACE/EPAM LEMS30 channels shown asfilled squares, LEMS120 as empty squares and high-energyLND channels are shown as filled circles. Because only twochannels of LEMS30 are available, two additional channelsfrom LEMS120 with lower energy are also used here.We apply the VDA method using the measured onset times
in different energy channels to determine the particle releasetime, t0 and the length of the IMF spiral, L, along whichparticles propagated. We fit the measured onset times tonset andinverse velocities, 1/v, with the function tonset=t0+L/vusing orthogonal distance regression to account for uncertain-ties in both the x and y directions. The underlying assumption isthat the particles that arrive earliest have undergone littlescattering. The linear VDA fits are plotted as solid lines in theleft and right panels of Figure 2 for electrons and protons,respectively, and 95% confidence intervals are given as shadedregions. The fitting result based on protons from the LND andLEMS30 measurements is given in orange, while the resultusing all data is given in blue. The two fit results are consistent.The results for t0 and L are also given in Table 1.The results of the fits suggest that electrons are released
22±3 minutes after the flare eruption and that protons arereleased about 75±12 minutes after the electron release. TheIMF length inferred from electrons is Le=1.18±0.18 au,which is consistent with the Parker spiral derived from thein situ solar wind speed, L=1.2 au. For protons we obtain alength Lp=1.34±0.10 au. Le and Lp are consistent with eachother and weighting them with their inverse errors we find anaverage L=1.28±0.15 au.The VDA method assumes that all particles stream along the
same IMF, which may become invalid in a realistic condition.In order to assess the reliability of this assumption for this SEPevent, we also checked the pitch-angle measurement by Wind.
Table 1Time Line of the SEP Event on 2019 May 6
Time (UT) Event Characteristics Refer to
2019.05.0604:56:00 Eruption of Flare and start of SXR AR 12740@50° E; M1.0
DE=113°; DSTA=7°04:57:23 Type III radio burst SSRT, Wind/WAVES, STA/SWAVES05:00:22 EUV wave propagating toward west AIA 193 Å; V≈500 km s−1 Figure 405:03:30 Type II radio burst @230 MHz–90 MHz, Last for 6 minutes05:18:24 Electron release VDA, IMF∼1.18 au, beam-like Figure 205:28:00 CME first appears at SOHO/LASCO C2 376 km s−1a; 326 km s−1b Figure 405:30:59 310 keV electron onset Wind Figure 205:31:00 CME at STA COR2 AW∼20°, deflect to west Figure 406:27:00 10.7–12.7 MeV proton release LND; TSA Figure 206:29:42 Proton release VDA, IMF∼1.33 au Figure 207:32:00 10.7–12.7 MeV proton onset LND, Poisson-CUSUM (Lucas 1985) Appendix
Notes. The 8.3 minute light travel time has been subtracted from all the times in this table. DE is the longitudinal distance between active region and magneticfootpoint of the Earth; DSTA is the distance to the STA footpoint; SSRT=Siberian Solar Radio Telescope; AW=angular width; GOES=GeostationaryOperational Environmental Satellite; VDA=velocity dispersion analysis; IMF=interplanetary magnetic field; TSA=Time shifted analysis.a Velocity from Cactus catalog.b Velocity from GCS fitting.
3
The Astrophysical Journal Letters, 902:L30 (8pp), 2020 October 20 Xu et al.
At the beginning of the SEP event, electrons show a clearanisotropy (enhanced intensity at ∼180° pitch angle, bottomright panels of Figure 1) suggesting that electrons first arrivedalong the IMF (Table 1). Consequently, these particlesexperienced little scattering, in agreement with the requirementof the VDA method. Unfortunately, proton observations withmuch smaller statistics make it difficult to identify a significantanisotropy of protons from Wind.
2.3. Energy Spectra
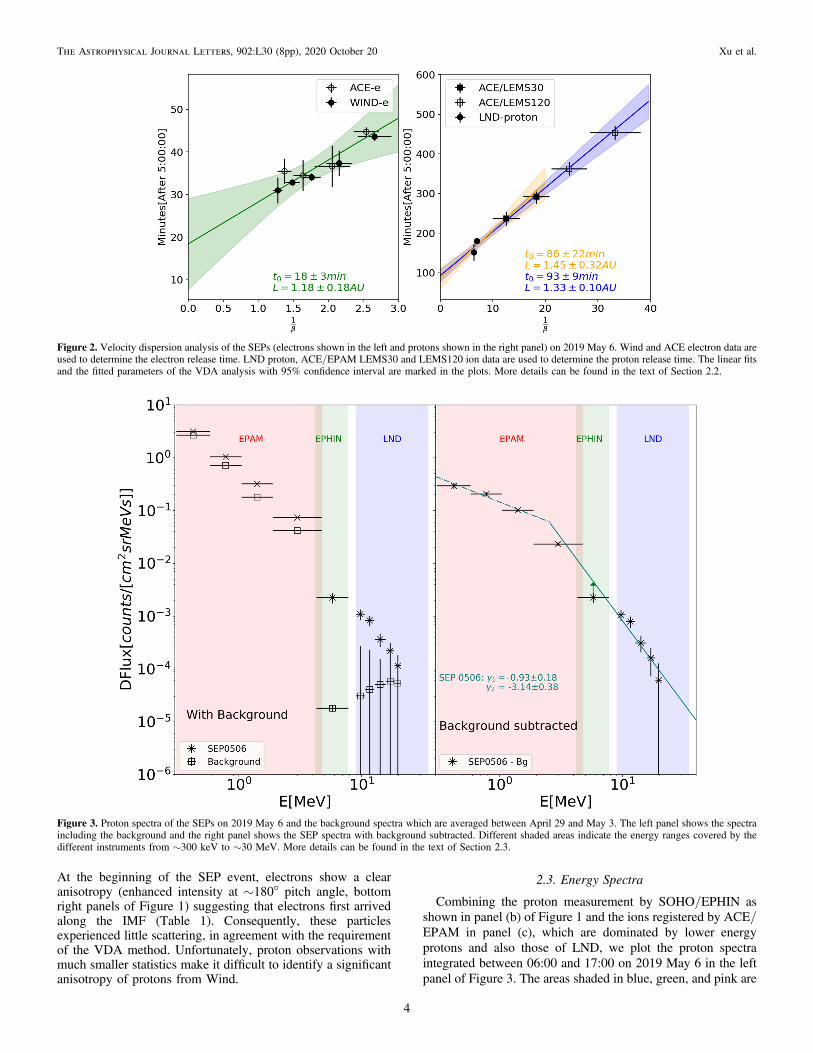
Combining the proton measurement by SOHO/EPHIN asshown in panel (b) of Figure 1 and the ions registered by ACE/EPAM in panel (c), which are dominated by lower energyprotons and also those of LND, we plot the proton spectraintegrated between 06:00 and 17:00 on 2019 May 6 in the leftpanel of Figure 3. The areas shaded in blue, green, and pink are
Figure 2. Velocity dispersion analysis of the SEPs (electrons shown in the left and protons shown in the right panel) on 2019 May 6. Wind and ACE electron data areused to determine the electron release time. LND proton, ACE/EPAM LEMS30 and LEMS120 ion data are used to determine the proton release time. The linear fitsand the fitted parameters of the VDA analysis with 95% confidence interval are marked in the plots. More details can be found in the text of Section 2.2.
Figure 3. Proton spectra of the SEPs on 2019 May 6 and the background spectra which are averaged between April 29 and May 3. The left panel shows the spectraincluding the background and the right panel shows the SEP spectra with background subtracted. Different shaded areas indicate the energy ranges covered by thedifferent instruments from ∼300 keV to ∼30 MeV. More details can be found in the text of Section 2.3.
4
The Astrophysical Journal Letters, 902:L30 (8pp), 2020 October 20 Xu et al.
the energy coverage of LND (9–35 MeV), SOHO/EPHIN(4.3–7.8 MeV), and ACE/EPAM (0.310–4.75 MeV), respec-tively. The background spectra are also plotted and they areaveraged between April 29 and May 3 (LND started workingon April 29 for its fifth lunar day measurement). The energeticproton spectra during the event are well above the backgroundas shown in the left panel of Figure 3, despite the largeuncertainty in the LND data due to the low number of counts.The right panel of the figure shows the SEP spectra where thebackground spectrum has been subtracted. Because of theEPHIN data gaps during the impulsive phase of the SEP eventas shown in Figure 1, the flux of the SEP event measured byEPHIN is likely to be larger than the derived one, as pointedout by the upward-pointing green arrow in the right panel.
Despite this event being of a more impulsive nature, we usea classic double power-law spectrum to fit the data. As can beseen in Figure 3, there is a break in the spectral slopes around2.5 MeV, a fit using a double power law gives power-lawindices of −0.93±0.18 and −3.14±0.38 for the spectrabelow and above this break energy, respectively. Interestingly,the break energy falls right between the values for large gradualevents (Mewaldt et al. 2012) and those determined for verysmall events by Joyce et al. (2020) using data from the ParkerSolar Probe (Fox et al. 2016).
2.4. Remote-sensing Observations
On 2019 May 6, an impulsive M1.0 flare erupted from activeregion (AR) 12470 located at N08E50. The soft X-ray (SXR)flare had an onset at 04:56:008 and lasted for ∼8 minutes asdetected by the solar X-ray Imager on the GOES satellite. Sincethis is the only visible eruptive source on the Sun seen fromEarth before the onset of the SEPs, we believe this is the solarcounterpart of the SEPs measured in situ near the Earth andMoon. At nearly the same time as the SXR emission, abroadband type III radio burst starting from 240 MHz wasobserved by not only the ground radio observatory Solar RadioTelescope (SSRT9) on Earth but also by the WAVESinstrument on board the Wind spacecraft at Earth L1 point aswell as by WAVES on board STEREO-A (STA). A type IIradio burst between 230 and 90 MHz indicating the existenceof a coronal shock was reported by the SSRT during05:03:30–05:09:30. The timeline of this event is given inTable 1.
At 05:00:20, an asymmetric EUV wave (500 km s−1) startedpropagating toward the northwestern hemisphere from thesource as observed in the 193Åband of the AtmosphericImaging Assembly (AIA) on board the Solar DynamicsObservatory. The outer edges of the wave front at differenttimes, i.e., at 05:00, 05:02, 05:07, 05:12, 05:17, and 05:22 onMay 6, are marked as colored dashed lines in the top panel ofFigure 4, which is explained in more detail below. After 05:22,the wave continued expanding across the solar surface as arather faint structure that does not contain a clear wave front.
About half an hour after the flare eruption, at 05:28, a CMEfirst appeared in the field of view of the Large Angle andSpectrometric Coronagraph Experiment (LASCO) C2 ofSOHO with a projected (plane of the sky) speed of 376km s−1 and an angular width of 20°, as reported in the
CACTUS CME catalog.10 Simultaneously, STA COR2 alsocaptured the same structure. We applied the GraduatedCylindrical Shell (GCS) model (Thernisien 2011) to thecoronagraph observations from two directions to obtain thevelocity and propagation direction of the CME. In the bottompanel of Figure 4, we give the CME observation and outline thefitted CME structure in green at 05:46 on May 6. The fittingresults show that the linear speed of the CME front was about326 km s−1 and the CME was deflected by about 10 degreesaway from the location of the flare to the west, consistent withthe direction of the EUV wave propagation.In the top panel of Figure 4, we show a magnetogram (in
gray shades) on which the results of a potential field source-surface (PFSS) model for this Carrington rotation 2217 havebeen overlaid.11 Open magnetic field lines (here with positivepolarity shown in green and negative polarity shown in red)that connect the photosphere and the PFSS source surface forthe solar wind are generally considered to be the main channelsfor SEP propagation in the solar corona. The polarity inversionline is shown in blue. The abovementioned active region AR12470 is in the right part of the plot and marked by a whitearrow. The radial projection points of STA and Earth on thesolar surface on May 6 are plotted as open circles in black andblue, respectively. The magnetic footpoints based on theballistic back mapping of the solar wind propagating at anaverage solar wind speed (about 360 km s−1 as observed in situat Earth) are marked as filled circles. We note that the magneticfootpoint of STA is only 7° away from the location of AR12470, which suggests STA is well connected to this activeregion. On the other hand, the longitudinal separation betweenthe flare and Earth’s footpoint is about 113° as displayed inFigure 4. Also, the wave does not appear to persist to theEarth’s footpoint.
3. Summary and Discussion
On 2019 May 6, an SEP event was observed by LND on thefar-side surface of the Moon. While it had only a low intensity,this is nevertheless the first SEP event with enough countingstatistics that is detected by LND. This event was also detectedby SOHO/EPHIN, which unfortunately only registered itsdecay phase, and also by Wind and ACE. The only possiblesolar source is a flare and its accompanying CME at AR 12470located on the east hemisphere (E50°). The type II radio burstindicates the existence of a shock in the lower corona and theCME speed was fitted as 326 km s−1 by the GCS model.The time profiles of electrons and protons clearly show
velocity dispersion. According to the VDA analysis, whichassumes that all particles propagate along the same IMF linearriving at Earth and based on the combined data of LND,Wind, and ACE, electrons were released about 22±3 minutesafter the flare and type III radio burst and about 8 minutes afterthe high frequency type II radio burst, while protons werereleased at least 70 minutes later. The in situ velocity dispersionand anisotropy of electrons suggest that a direct magneticconnection from the source to Earth was established for theseelectrons. However, the separation between the flare locationand the magnetic footpoint of Earth derived from the standardballistic mapping is as large as 113°. This wide separation isremarkable. In the classical scenario of particle transport during
8 The time for remote-sensing measurements in this study has subtracted the∼8.3 minute light travel time over 1 au distance.9 http://www.e-callisto.org/
10 http://sidc.oma.be/cactus/11 Source: Global Oscillation Network Group (GONG, https://gong.nso.edu).
5
The Astrophysical Journal Letters, 902:L30 (8pp), 2020 October 20 Xu et al.
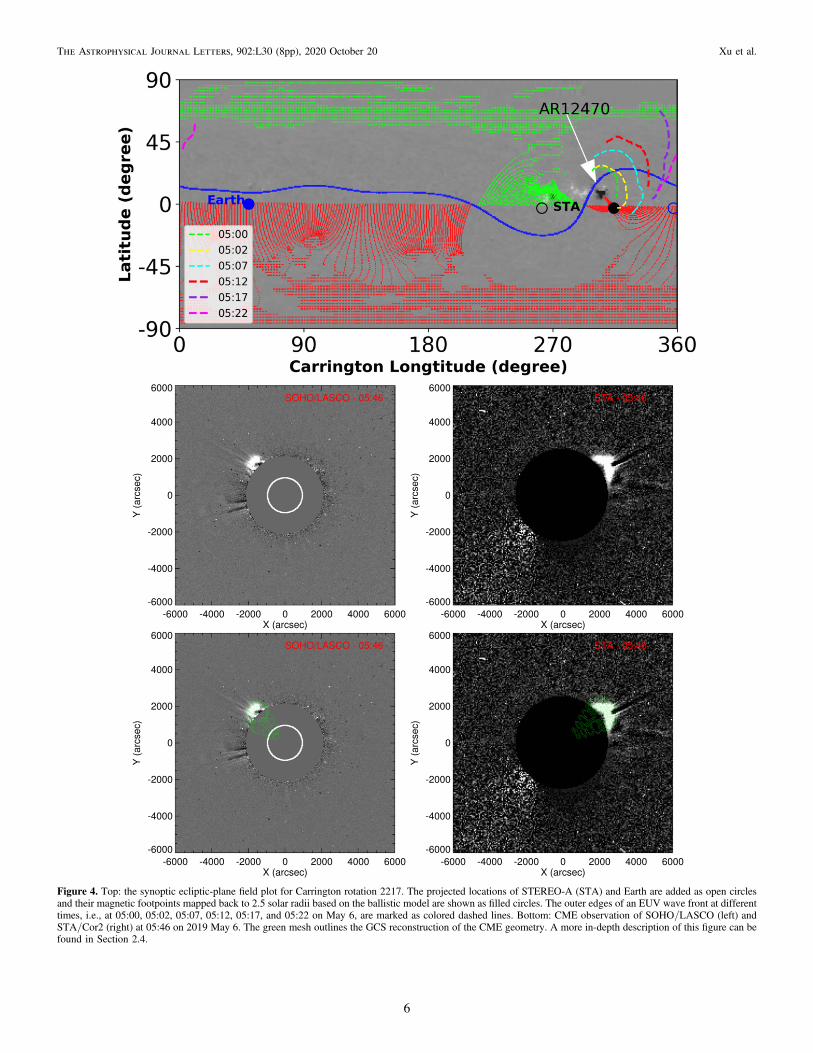
Figure 4. Top: the synoptic ecliptic-plane field plot for Carrington rotation 2217. The projected locations of STEREO-A (STA) and Earth are added as open circlesand their magnetic footpoints mapped back to 2.5 solar radii based on the ballistic model are shown as filled circles. The outer edges of an EUV wave front at differenttimes, i.e., at 05:00, 05:02, 05:07, 05:12, 05:17, and 05:22 on May 6, are marked as colored dashed lines. Bottom: CME observation of SOHO/LASCO (left) andSTA/Cor2 (right) at 05:46 on 2019 May 6. The green mesh outlines the GCS reconstruction of the CME geometry. A more in-depth description of this figure can befound in Section 2.4.
6
The Astrophysical Journal Letters, 902:L30 (8pp), 2020 October 20 Xu et al.
impulsive events (Reames 1999) accelerated particles streamalong an open IMF connecting the source and the observer withhigh-energy particles arriving earlier than lower energy ones.The in situ electron observation of this event at Earth(impulsive, velocity dispersion, and beam-like distribution)suggests a good connection to the flare, while the remote-sensing observation contradicts this explanation.
A possible explanation could be that particles are acceleratedby the coronal shock, which deviated westwards and reachedthe magnetic footpoint of Earth. For example, Rouillard et al.(2012) have found an association between EUV waves thattrack the lateral shock expansion (Veronig et al. 2010) andparticle release in wide-spread SEPs. As shown in the top panelof Figure 4, the EUV waves marked as colored dashed lines arepropagating westward. The GCS fitting of the CME alsoindicates a nonradial and westward-deflected propagationtoward the location of the Earth footpoint. However, thedeflection of the CME is only about 10° and the EUV wavebecame rather faint after 05:25 suggesting that the shock wasunlikely to reach Earth’s footpoint around the particle releasetime. Therefore, it is difficult to conclude that a deflected shockshould be responsible for the initial particle acceleration andrelease processes.
Klassen et al. (2018) proposed another scenario in whichelectrons accelerated by a flare can reach a distant magneticfootpoint (90° in their example found with STA) through anirregular magnetic field at the solar source. The PFSSextrapolation of the magnetic field (top panel of Figure 4)before this eruption does not show any direct connectionbetween the flare and the location of Earth’s footpoint. ThePFSS model, however, assumes a current-free field bydefinition, and is an idealized consideration of the solar corona,so the real magnetic configuration might be drasticallydifferent. Furthermore, solar eruptions often rearrange the solarmagnetic fields through, e.g., magnetic reconnection, and mighthave created a path for the particles to propagate over a largedistance in heliolongitude. Unfortunately, the available obser-vations do not show any evidence of a rearrangement of thesolar magnetic field due to eruptions.
Moreover, the Parker spiral model is also an oversimplified,nondisturbed IMF condition and some researchers suggest themeandering and random walk of IMF would affect the particlepropagation in the heliosphere (e.g., Mazur et al. 2000;Laitinen et al. 2016). In addition, the cross-field transport dueto pitch-angle scattering and diffusion also causes particles topropagate in longitude and be observed on field lines withfootpoints far away from the center of the solar eruption (e.g.,Wibberenz & Cane 2006). This means that one could observeparticle events on poorly connected field lines. However, thebeam-like nature of the first electrons to arrive does not supportsuch a cross-field transport model for this event.
Another observation about this event is the long delaybetween the electron and proton release times as derived fromthe VDA model, which indicates that different accelerationprocesses and/or release locations might be responsible forprotons and electrons. As protons are released much later, theymay be more likely accelerated by the shock that, however,cannot be confirmed to have reached Earth’s magneticfootpoint. This explanation would also be difficult to reconcilewith the common path lengths of electrons and protons, Le andLp. In their study of the delay between the electron and protononset times at STA, STB, and L1 for wide-spread events,
Richardson et al. (2014) found that this time delay and thelongitudinal separation between the flare location and back-mapped spacecraft footpoint were correlated. In Table 1 wereport a delay between the electron and protons release timesthat may contribute to the Richardson et al. (2014) results. Suchdelays are not uncommon.To summarize, we have presented various observations
related to the first SEP event ever detected on the Lunar far-sidesurface. (1) The energy spectra of LND are consistent withobservations from other spacecraft, though this is a weak eventrequiring large background subtractions. (2) The proton onsettime of LND is also consistent with observations from otherspacecraft, suggesting that the instrument response appears tobe consistent with expectations. (3) The observations showclear velocity dispersion. (4) The SEP event was associatedwith a widely separated (∼113°) flare at E50° relative to Earth.
The Lunar Lander Neutron and Dosimetry (LND) instrumentis supported by the German Space Agency, DLR, and its SpaceAdministration under grant 50 JR 1604 to the Christian-Albrechts-University (CAU) Kiel and supported by BeijingMunicipal Science and Technology Commission, grant No.Z181100002918003 and National Natural Science Foundationof China Grant: 41941001 to the National Space ScienceCenter (NSSC). The scientific data are provided by ChinaNational Space Administration. J.G. and Y.W. are supported bythe Strategic Priority Program of the Chinese Academy ofSciences (grant Nos. XDB41000000 and XDA15017300), andthe CNSA preresearch Project on Civil Aerospace Technolo-gies (grant No. D020104). N.D. was supported under grant50OC1302 by the Federal Ministry of Economics andTechnology on the basis of a decision by the GermanBundestag. We also would like to express our very greatappreciation to Patrick Kühl, Lars Berger, Andreas Klassen,and an anonymous referee for their valuable suggestions onthis work.
AppendixLND Measurement and Poisson-CUSUM Analysis
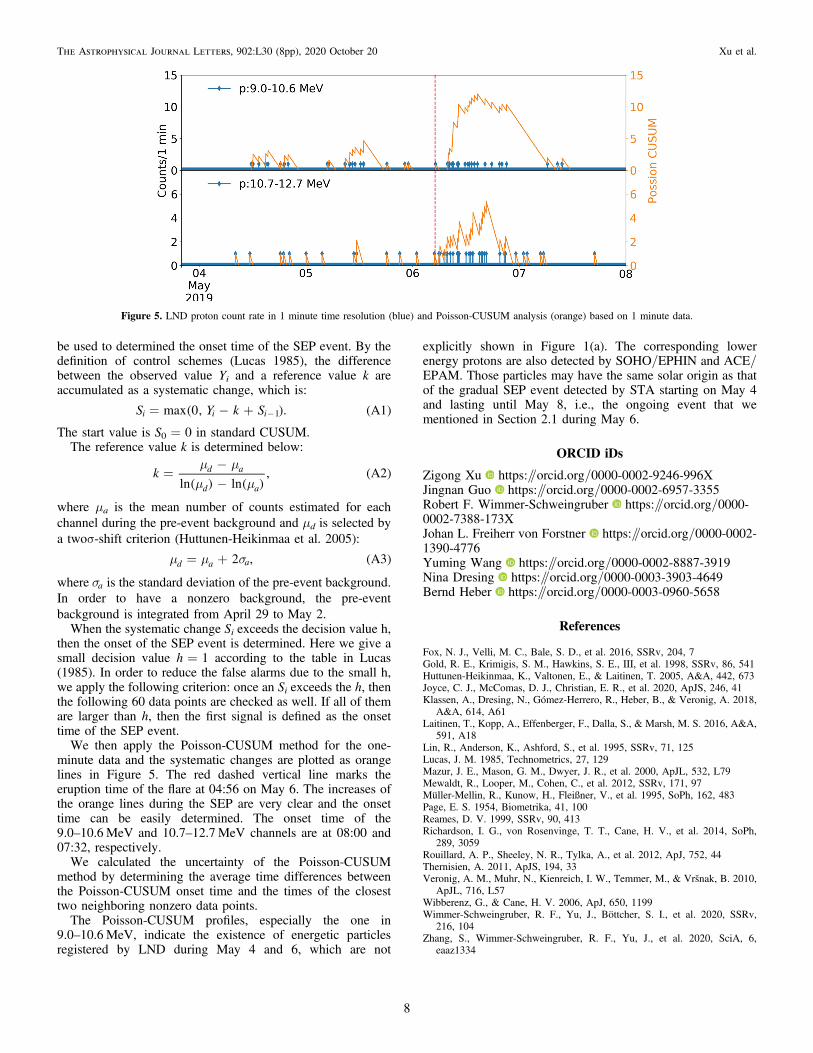
The charged particle telescope of LND measures protons in 1minute time resolution between 9.0 and 35MeV and theexplicit energy bins are given in Table6 of Wimmer-Schweingruber et al. (2020). Here, we present the 1 minuteproton count rates at 9.0–10.6 MeV and 10.7–12.7 MeV duringMay 4 and 8 in Figure 5. The blue curves are the LNDmeasurement in 1 minute time resolution. Most of the time,zero count is registered by LND, even during the SEP event.One reason is the small intensity of the SEP event and the otheris the small geometry factor of LND. Both of them cause thepoor statistics.In order to calculate the event onset time, the Poisson-
CUSUM method is applied and the results are plotted in anorange line for each channel. Cumulative sum (CUSUM)control schemes are widely used in industrial applicationsbecause they are designed to give an indication of when there isa change in a process (Page 1954). In our case, the change iswhen the SEPs rise above the background. The traditionalCUSUM schemes are applied to a normally distributedquantity. When the variable has a Poisson distribution, aPoisson-CUSUM should be used. In the measurement of LND,the number of counts in a fixed interval, for example, 1 minute,obey a Poisson distribution. Hence, the Poisson-CUSUM will
7
The Astrophysical Journal Letters, 902:L30 (8pp), 2020 October 20 Xu et al.
be used to determined the onset time of the SEP event. By thedefinition of control schemes (Lucas 1985), the differencebetween the observed value Yi and a reference value k areaccumulated as a systematic change, which is:
= - + -S Y k Smax 0, . A1i i i 1( ) ( )
The start value is S0=0 in standard CUSUM.The reference value k is determined below:
m mm m
=--
kln ln
, A2d a
d a( ) ( )( )
where μa is the mean number of counts estimated for eachchannel during the pre-event background and μd is selected bya twoσ-shift criterion (Huttunen-Heikinmaa et al. 2005):
m m s= + 2 , A3d a a ( )
where sa is the standard deviation of the pre-event background.In order to have a nonzero background, the pre-eventbackground is integrated from April 29 to May 2.
When the systematic change Si exceeds the decision value h,then the onset of the SEP event is determined. Here we give asmall decision value h=1 according to the table in Lucas(1985). In order to reduce the false alarms due to the small h,we apply the following criterion: once an Si exceeds the h, thenthe following 60 data points are checked as well. If all of themare larger than h, then the first signal is defined as the onsettime of the SEP event.
We then apply the Poisson-CUSUM method for the one-minute data and the systematic changes are plotted as orangelines in Figure 5. The red dashed vertical line marks theeruption time of the flare at 04:56 on May 6. The increases ofthe orange lines during the SEP are very clear and the onsettime can be easily determined. The onset time of the9.0–10.6 MeV and 10.7–12.7MeV channels are at 08:00 and07:32, respectively.
We calculated the uncertainty of the Poisson-CUSUMmethod by determining the average time differences betweenthe Poisson-CUSUM onset time and the times of the closesttwo neighboring nonzero data points.
The Poisson-CUSUM profiles, especially the one in9.0–10.6 MeV, indicate the existence of energetic particlesregistered by LND during May 4 and 6, which are not
explicitly shown in Figure 1(a). The corresponding lowerenergy protons are also detected by SOHO/EPHIN and ACE/EPAM. Those particles may have the same solar origin as thatof the gradual SEP event detected by STA starting on May 4and lasting until May 8, i.e., the ongoing event that wementioned in Section 2.1 during May 6.
ORCID iDs
Zigong Xu https://orcid.org/0000-0002-9246-996XJingnan Guo https://orcid.org/0000-0002-6957-3355Robert F. Wimmer-Schweingruber https://orcid.org/0000-0002-7388-173XJohan L. Freiherr von Forstner https://orcid.org/0000-0002-1390-4776Yuming Wang https://orcid.org/0000-0002-8887-3919Nina Dresing https://orcid.org/0000-0003-3903-4649Bernd Heber https://orcid.org/0000-0003-0960-5658
References
Fox, N. J., Velli, M. C., Bale, S. D., et al. 2016, SSRv, 204, 7Gold, R. E., Krimigis, S. M., Hawkins, S. E., III, et al. 1998, SSRv, 86, 541Huttunen-Heikinmaa, K., Valtonen, E., & Laitinen, T. 2005, A&A, 442, 673Joyce, C. J., McComas, D. J., Christian, E. R., et al. 2020, ApJS, 246, 41Klassen, A., Dresing, N., Gómez-Herrero, R., Heber, B., & Veronig, A. 2018,
A&A, 614, A61Laitinen, T., Kopp, A., Effenberger, F., Dalla, S., & Marsh, M. S. 2016, A&A,
591, A18Lin, R., Anderson, K., Ashford, S., et al. 1995, SSRv, 71, 125Lucas, J. M. 1985, Technometrics, 27, 129Mazur, J. E., Mason, G. M., Dwyer, J. R., et al. 2000, ApJL, 532, L79Mewaldt, R., Looper, M., Cohen, C., et al. 2012, SSRv, 171, 97Müller-Mellin, R., Kunow, H., Fleißner, V., et al. 1995, SoPh, 162, 483Page, E. S. 1954, Biometrika, 41, 100Reames, D. V. 1999, SSRv, 90, 413Richardson, I. G., von Rosenvinge, T. T., Cane, H. V., et al. 2014, SoPh,
289, 3059Rouillard, A. P., Sheeley, N. R., Tylka, A., et al. 2012, ApJ, 752, 44Thernisien, A. 2011, ApJS, 194, 33Veronig, A. M., Muhr, N., Kienreich, I. W., Temmer, M., & Vršnak, B. 2010,
ApJL, 716, L57Wibberenz, G., & Cane, H. V. 2006, ApJ, 650, 1199Wimmer-Schweingruber, R. F., Yu, J., Böttcher, S. I., et al. 2020, SSRv,
216, 104Zhang, S., Wimmer-Schweingruber, R. F., Yu, J., et al. 2020, SciA, 6,
eaaz1334
Figure 5. LND proton count rate in 1 minute time resolution (blue) and Poisson-CUSUM analysis (orange) based on 1 minute data.
8
The Astrophysical Journal Letters, 902:L30 (8pp), 2020 October 20 Xu et al.