Embed Size (px)
Citation preview
First results of recently performed scenario simulations for the Baltic Sea for 1961-2099
ECOSUPPORT co-workers
Annual General Assembly 15 Oct 2009
H.E. Markus Meier
Swedish Meteorological and Hydrological
Institute and Stockholm University
H.E. Markus Meier
Swedish Meteorological and Hydrological
Institute and Stockholm University
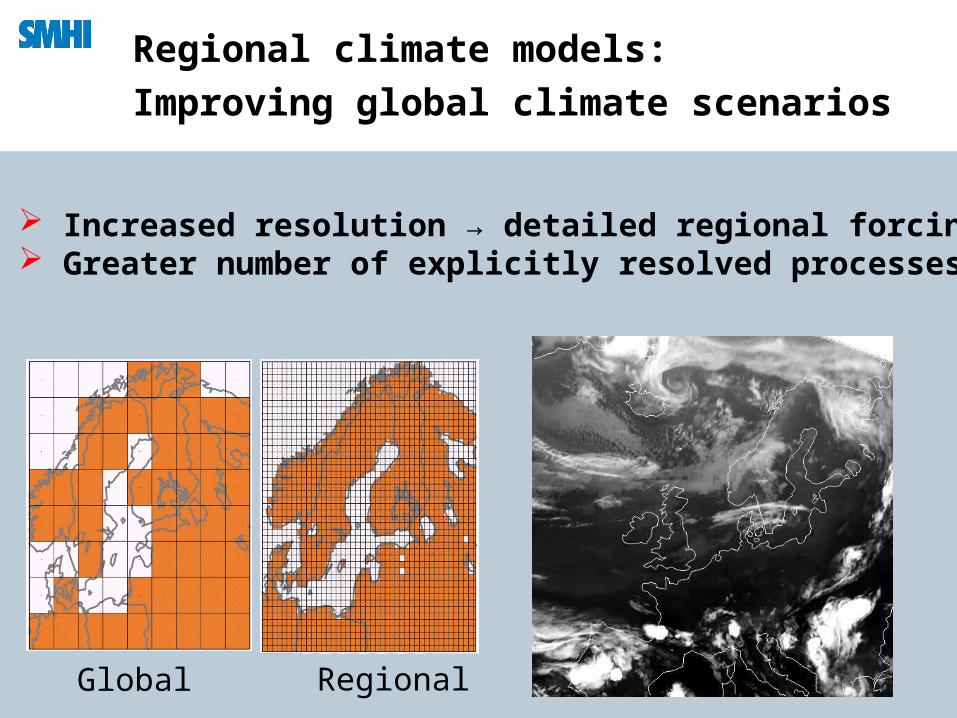
Regional climate models:
Improving global climate scenarios
Global Regional
Increased resolution → detailed regional forcing Greater number of explicitly resolved processes
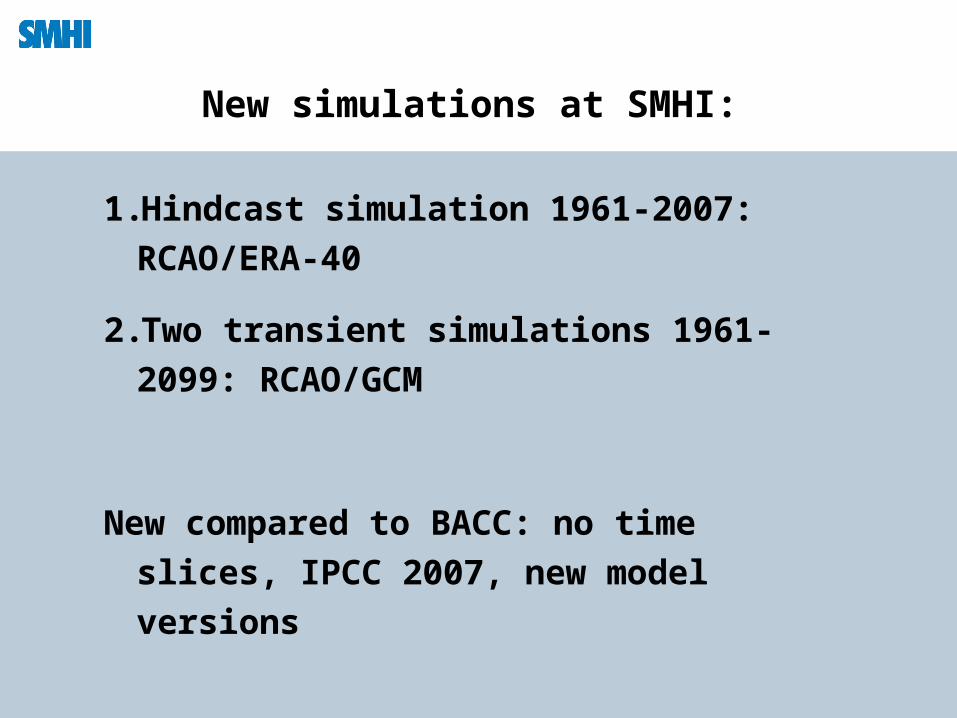
New simulations at SMHI:
1.Hindcast simulation 1961-2007:
RCAO/ERA-40
2.Two transient simulations 1961-2099:
RCAO/GCM
New compared to BACC: no time slices,
IPCC 2007, new model versions
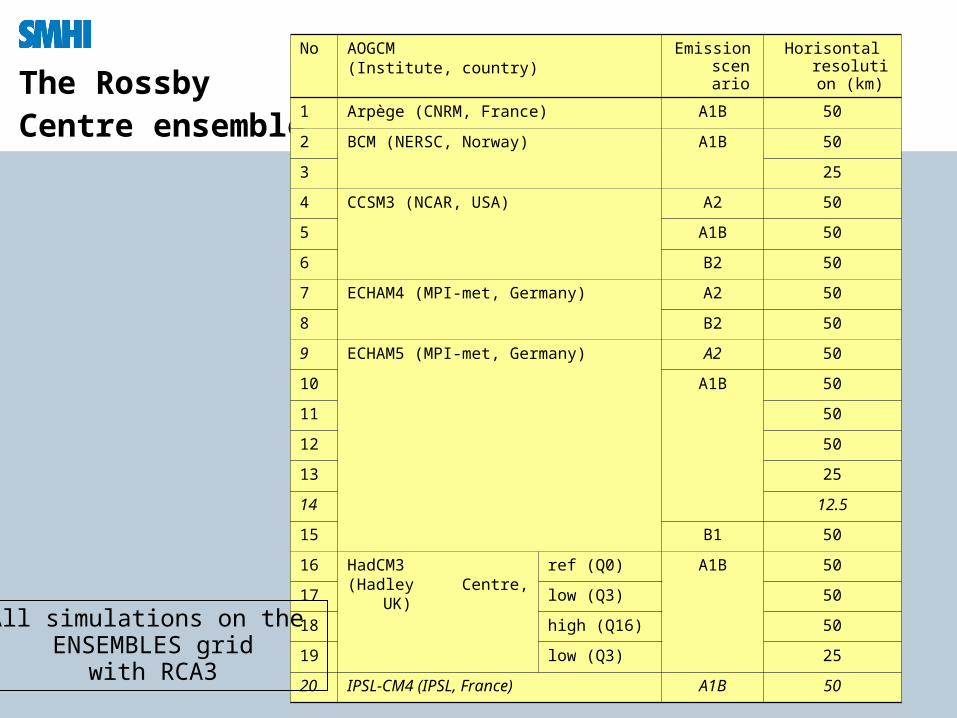
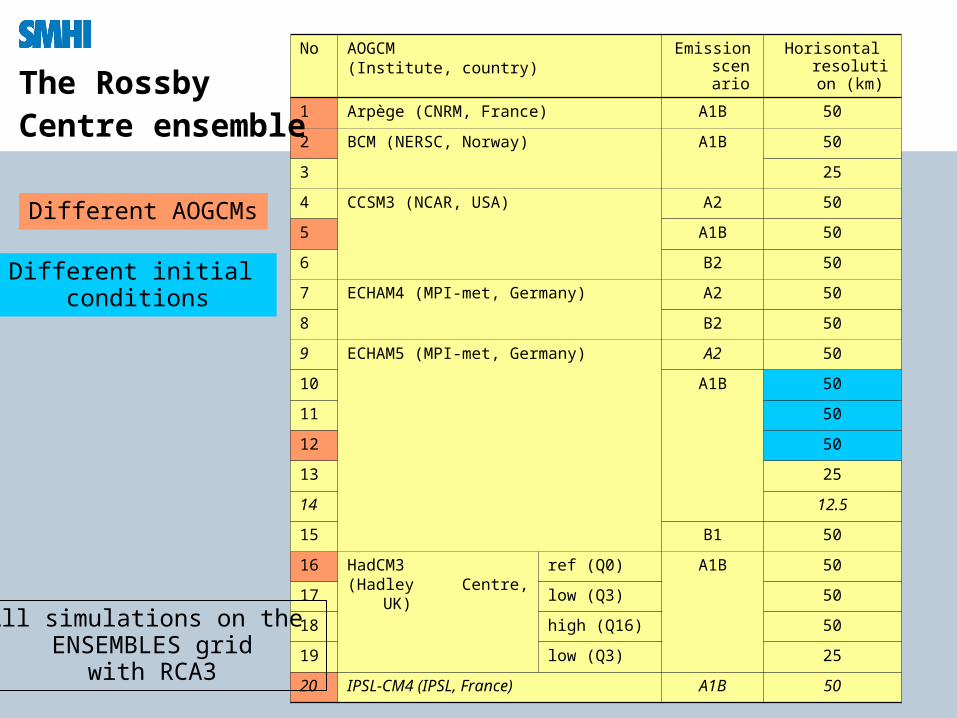
The RossbyCentre ensemble
No AOGCM (Institute, country)
Emission scenari
o
Horisontal resolution
(km)
1 Arpège (CNRM, France) A1B 50
2 BCM (NERSC, Norway) A1B 50
3 25
4 CCSM3 (NCAR, USA) A2 50
5 A1B 50
6 B2 50
7 ECHAM4 (MPI-met, Germany) A2 50
8 B2 50
9 ECHAM5 (MPI-met, Germany) A2 50
10 A1B 50
11 50
12 50
13 25
14 12.5
15 B1 50
16 HadCM3 (Hadley Centre, UK)
ref (Q0) A1B 50
17 low (Q3) 50
18 high (Q16) 50
19 low (Q3) 25
20 IPSL-CM4 (IPSL, France) A1B 50
All simulations on the ENSEMBLES grid
with RCA3
No AOGCM (Institute, country)
Emission scenari
o
Horisontal resolution
(km)
1 Arpège (CNRM, France) A1B 50
2 BCM (NERSC, Norway) A1B 50
3 25
4 CCSM3 (NCAR, USA) A2 50
5 A1B 50
6 B2 50
7 ECHAM4 (MPI-met, Germany) A2 50
8 B2 50
9 ECHAM5 (MPI-met, Germany) A2 50
10 A1B 50
11 50
12 50
13 25
14 12.5
15 B1 50
16 HadCM3 (Hadley Centre, UK)
ref (Q0) A1B 50
17 low (Q3) 50
18 high (Q16) 50
19 low (Q3) 25
20 IPSL-CM4 (IPSL, France) A1B 50
Different AOGCMs
All simulations on the ENSEMBLES grid
with RCA3
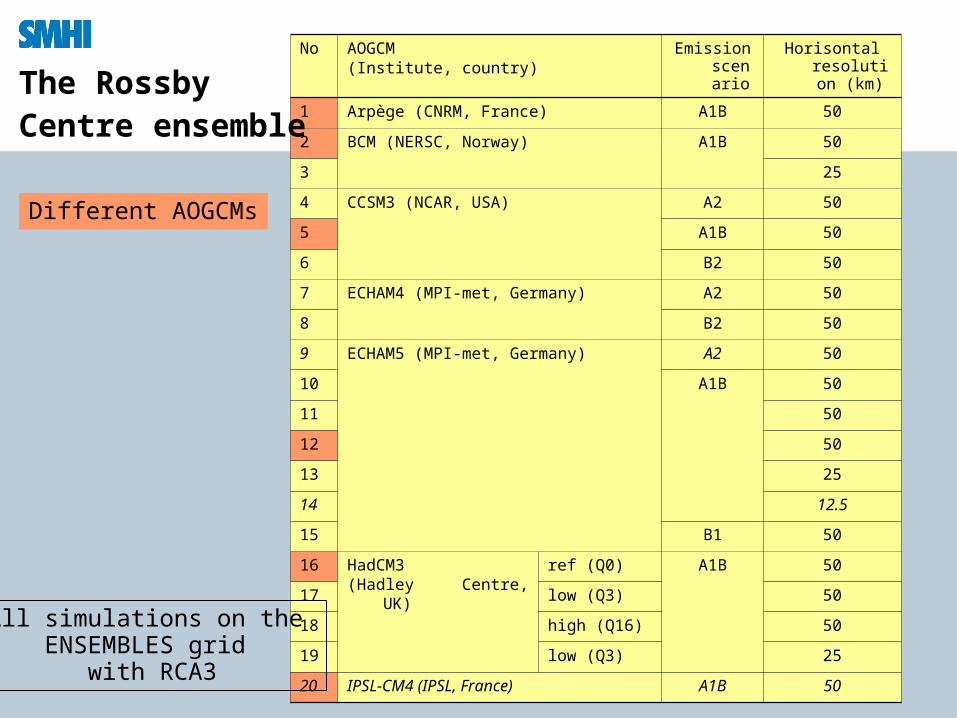
The RossbyCentre ensemble
No AOGCM (Institute, country)
Emission scenari
o
Horisontal resolution
(km)
1 Arpège (CNRM, France) A1B 50
2 BCM (NERSC, Norway) A1B 50
3 25
4 CCSM3 (NCAR, USA) A2 50
5 A1B 50
6 B2 50
7 ECHAM4 (MPI-met, Germany) A2 50
8 B2 50
9 ECHAM5 (MPI-met, Germany) A2 50
10 A1B 50
11 50
12 50
13 25
14 12.5
15 B1 50
16 HadCM3 (Hadley Centre, UK)
ref (Q0) A1B 50
17 low (Q3) 50
18 high (Q16) 50
19 low (Q3) 25
20 IPSL-CM4 (IPSL, France) A1B 50
Different AOGCMs
Different initial conditions
All simulations on the ENSEMBLES grid
with RCA3
The RossbyCentre ensemble
No AOGCM (Institute, country)
Emission scenari
o
Horisontal resolution
(km)
1 Arpège (CNRM, France) A1B 50
2 BCM (NERSC, Norway) A1B 50
3 25
4 CCSM3 (NCAR, USA) A2 50
5 A1B 50
6 B2 50
7 ECHAM4 (MPI-met, Germany) A2 50
8 B2 50
9 ECHAM5 (MPI-met, Germany) A2 50
10 A1B 50
11 50
12 50
13 25
14 12.5
15 B1 50
16 HadCM3 (Hadley Centre, UK)
ref (Q0) A1B 50
17 low (Q3) 50
18 high (Q16) 50
19 low (Q3) 25
20 IPSL-CM4 (IPSL, France) A1B 50
Different AOGCMs
Different initial conditions
Different modelformulation (GCM)
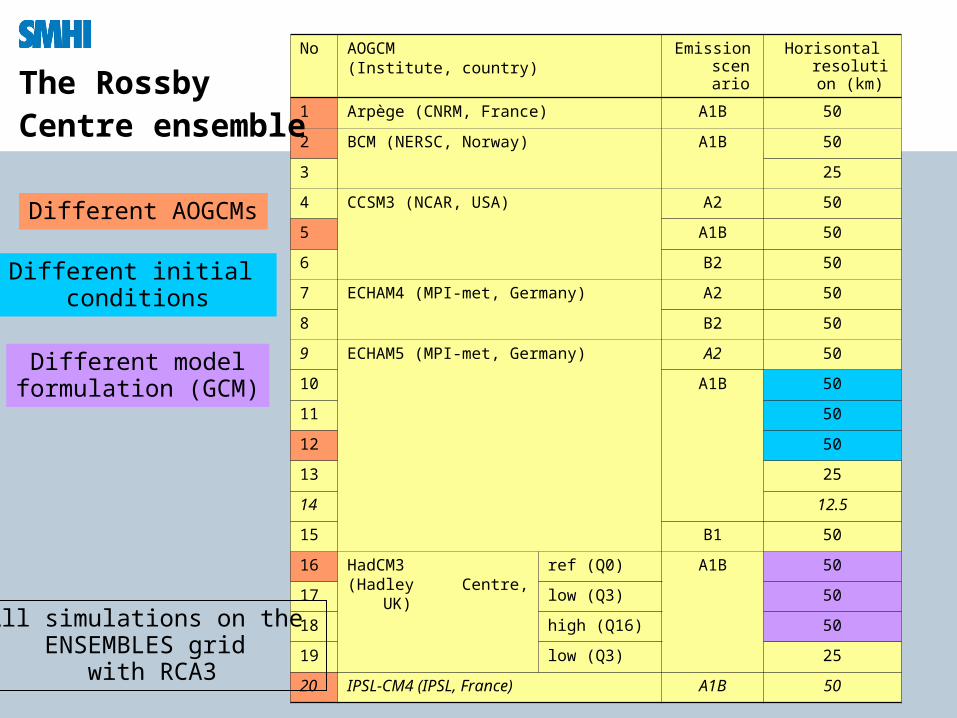
Different emissionscenarios
All simulations on the ENSEMBLES grid
with RCA3
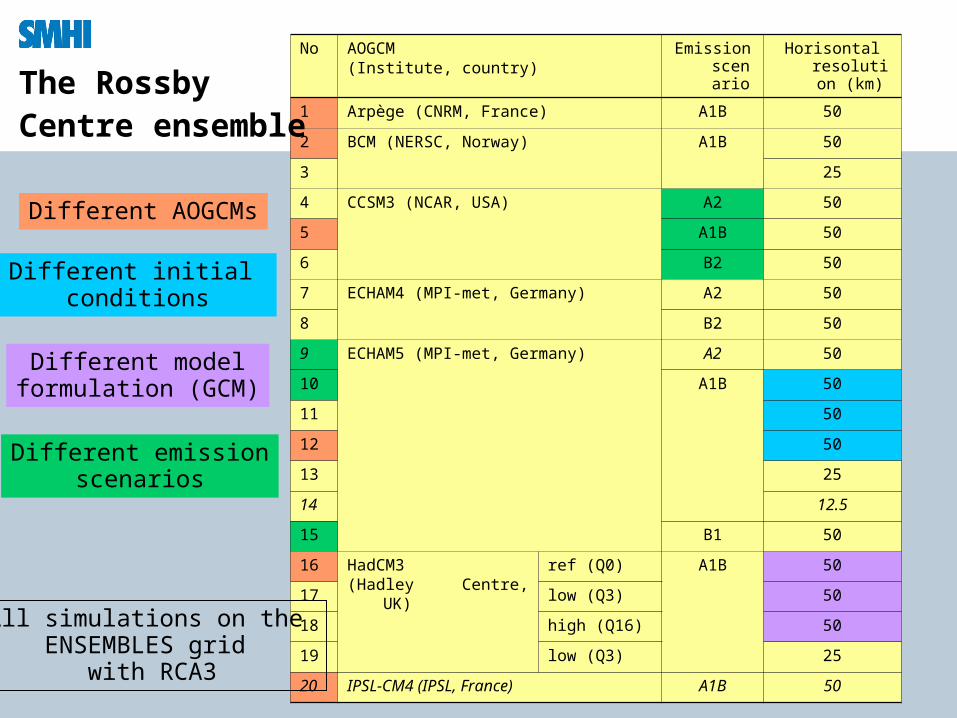
The RossbyCentre ensemble
No AOGCM (Institute, country)
Emission scenari
o
Horisontal resolution
(km)
1 Arpège (CNRM, France) A1B 50
2 BCM (NERSC, Norway) A1B 50
3 25
4 CCSM3 (NCAR, USA) A2 50
5 A1B 50
6 B2 50
7 ECHAM4 (MPI-met, Germany) A2 50
8 B2 50
9 ECHAM5 (MPI-met, Germany) A2 50
10 A1B 50
11 50
12 50
13 25
14 12.5
15 B1 50
16 HadCM3 (Hadley Centre, UK)
ref (Q0) A1B 50
17 low (Q3) 50
18 high (Q16) 50
19 low (Q3) 25
20 IPSL-CM4 (IPSL, France) A1B 50
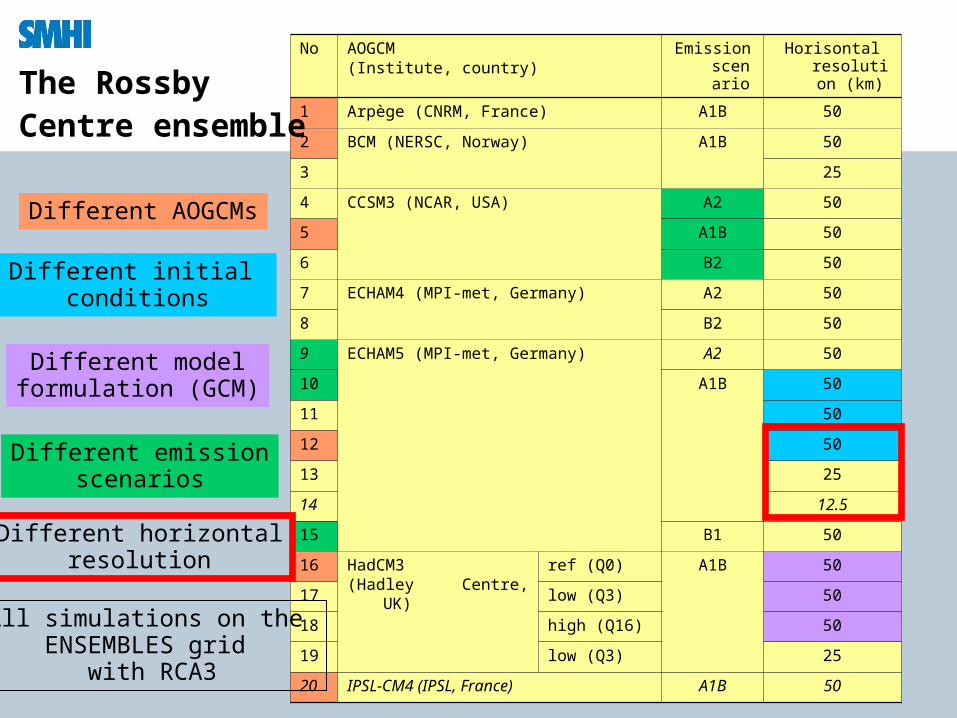
Different AOGCMs
Different initial conditions
Different modelformulation (GCM)
Different emissionscenarios
Different horizontalresolution
All simulations on the ENSEMBLES grid
with RCA3
The RossbyCentre ensemble
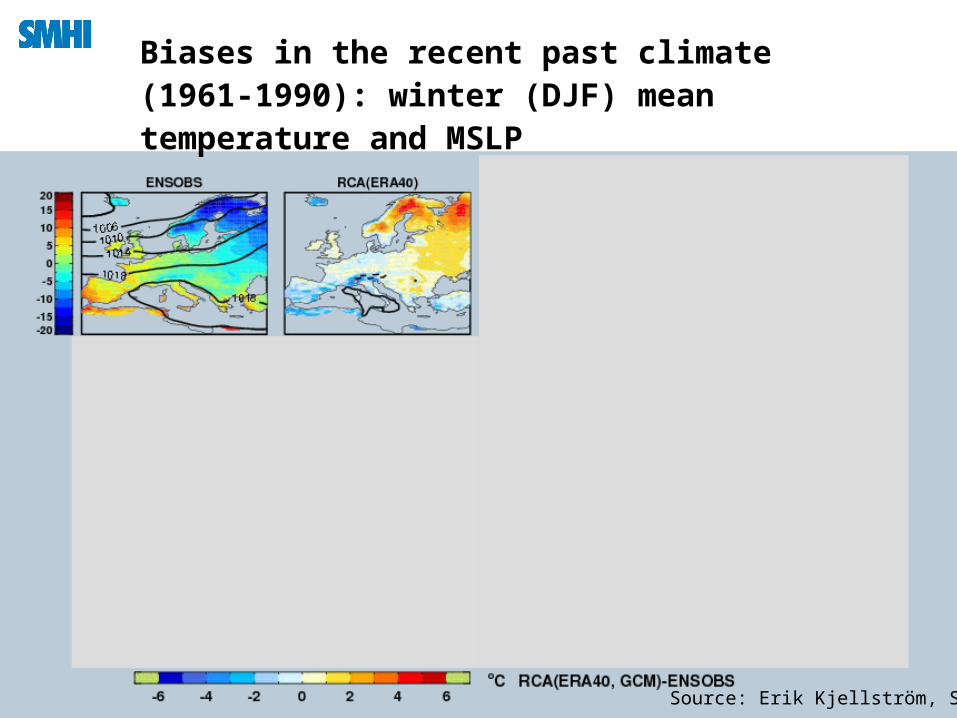
Biases in the recent past climate (1961-1990): winter (DJF) mean temperature and MSLP
Source: Erik Kjellström, SMHI
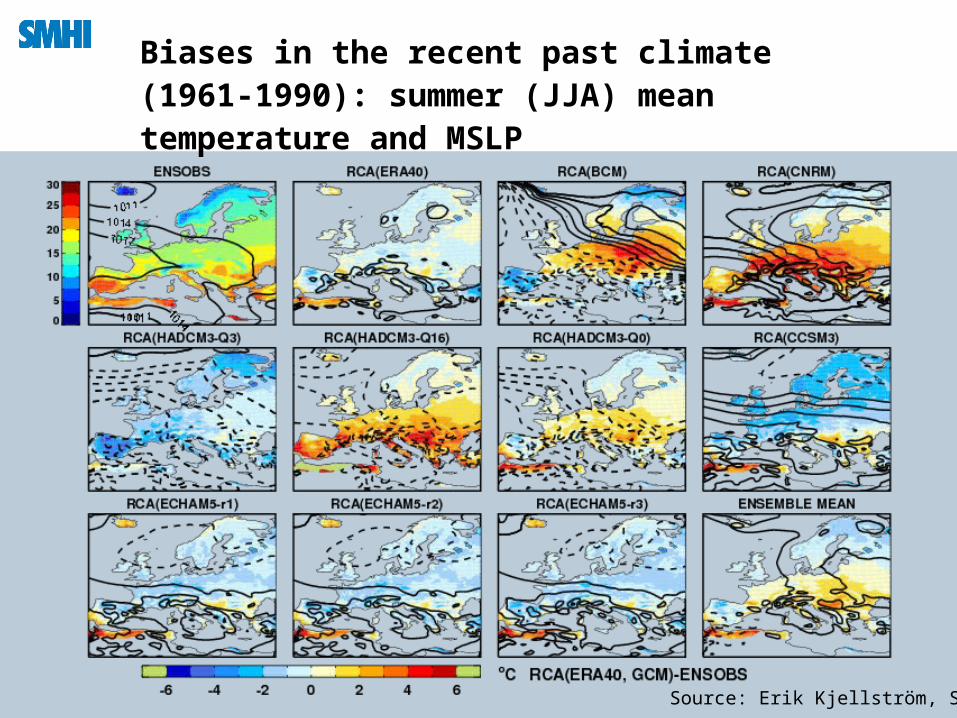
Biases in the recent past climate (1961-1990): summer (JJA) mean temperature and MSLP
Source: Erik Kjellström, SMHI
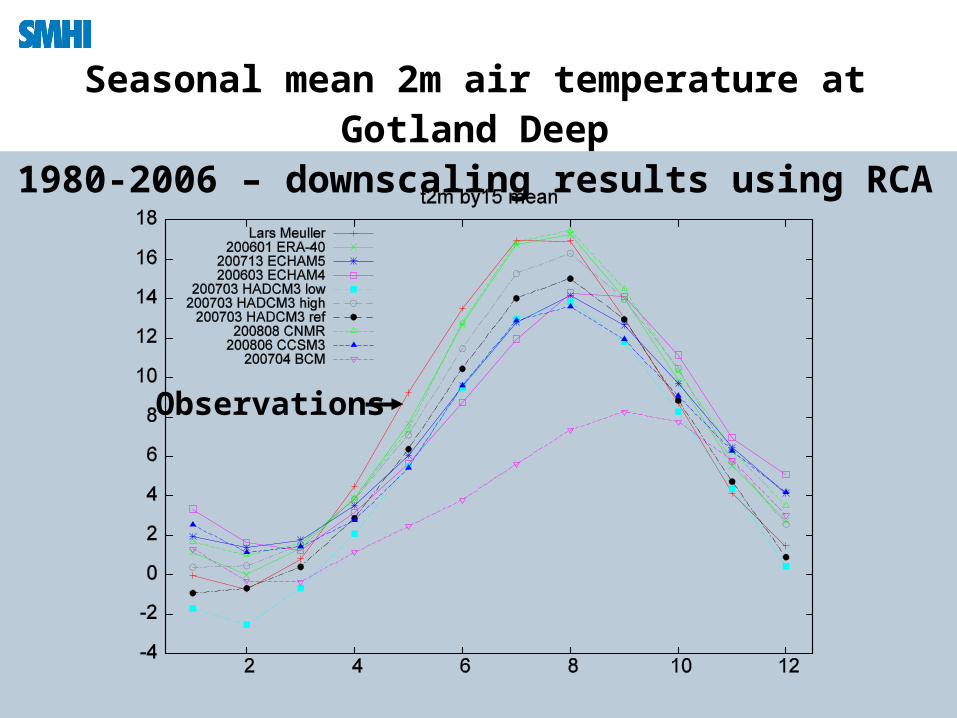
Seasonal mean 2m air temperature at Gotland Deep1980-2006 – downscaling results using RCA
Observations
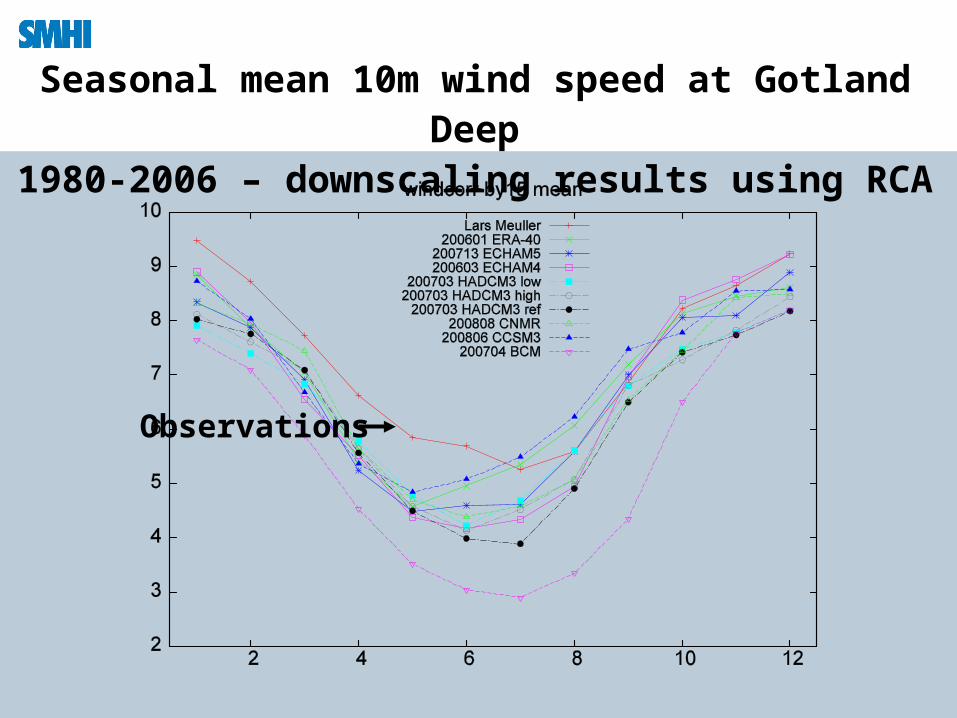
Seasonal mean 10m wind speed at Gotland Deep1980-2006 – downscaling results using RCA
Observations
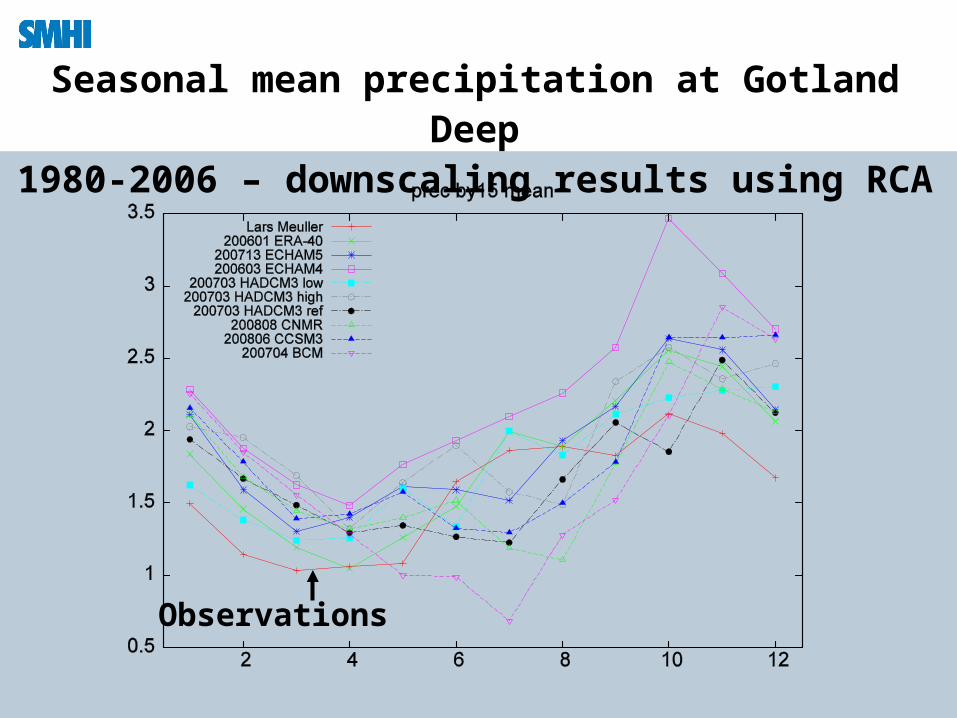
Seasonal mean precipitation at Gotland Deep1980-2006 – downscaling results using RCA
Observations
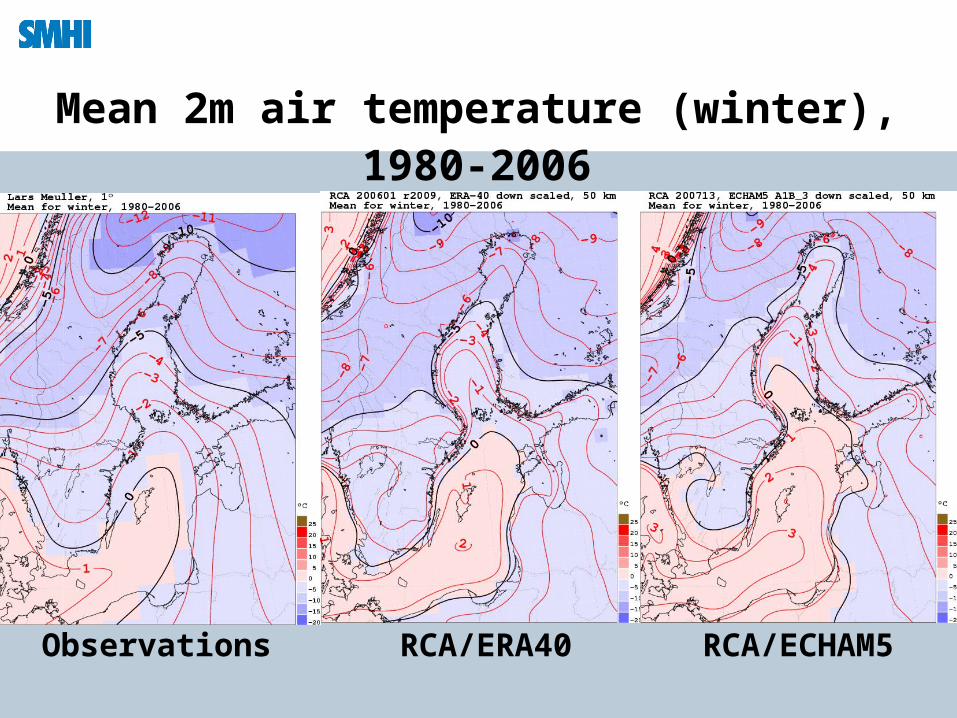
Mean 2m air temperature (winter), 1980-2006
Observations RCA/ERA40 RCA/ECHAM5
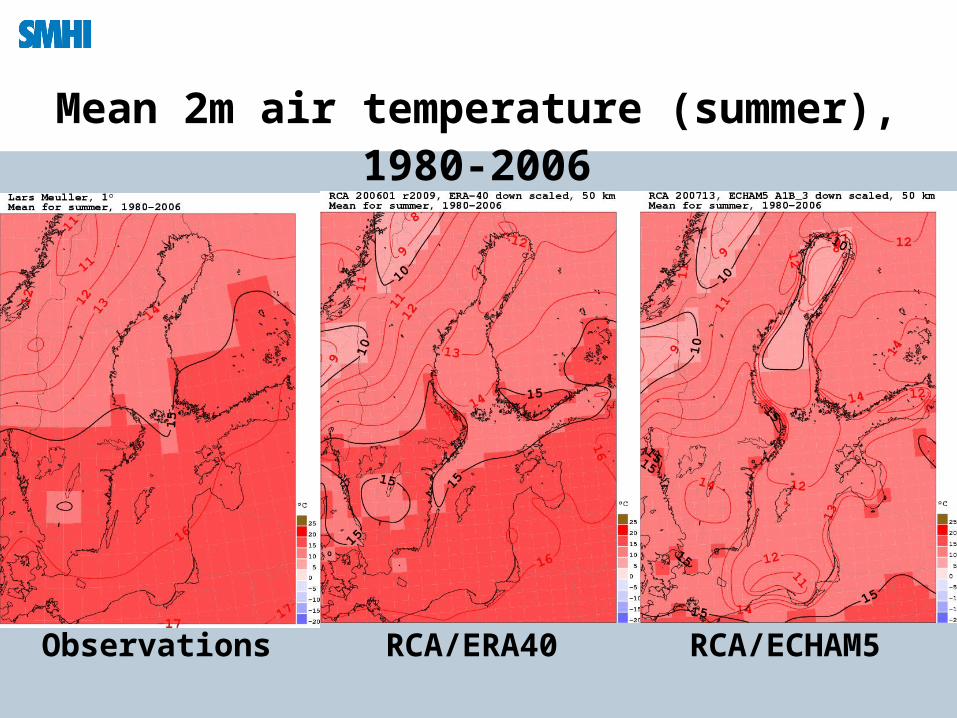
Mean 2m air temperature (summer), 1980-2006
Observations RCA/ERA40 RCA/ECHAM5
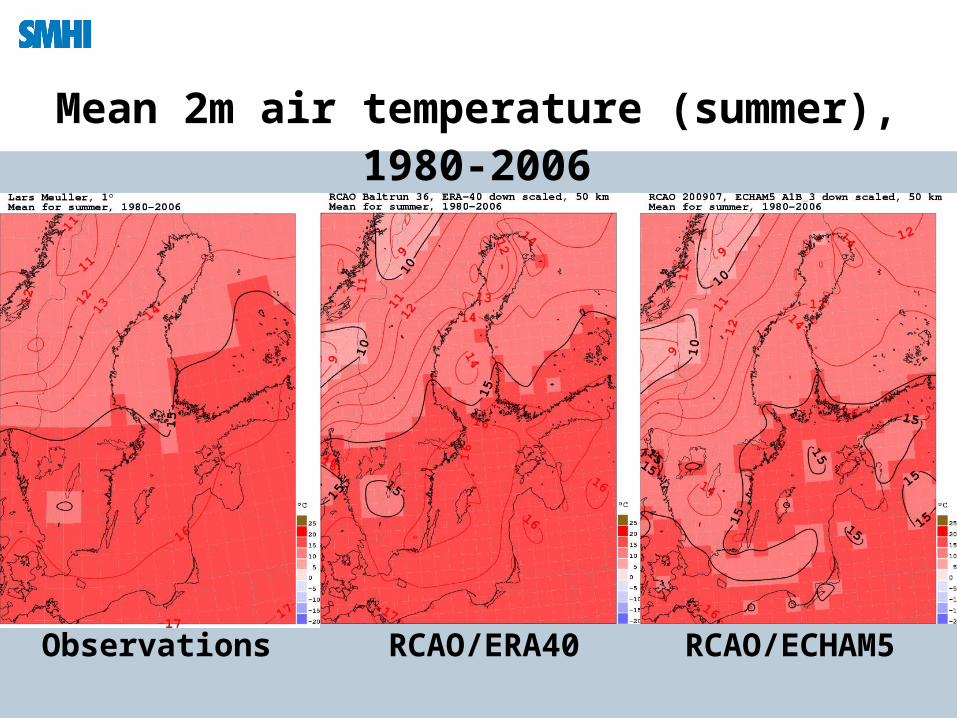
Mean 2m air temperature (summer), 1980-2006
Observations RCAO/ERA40 RCAO/ECHAM5
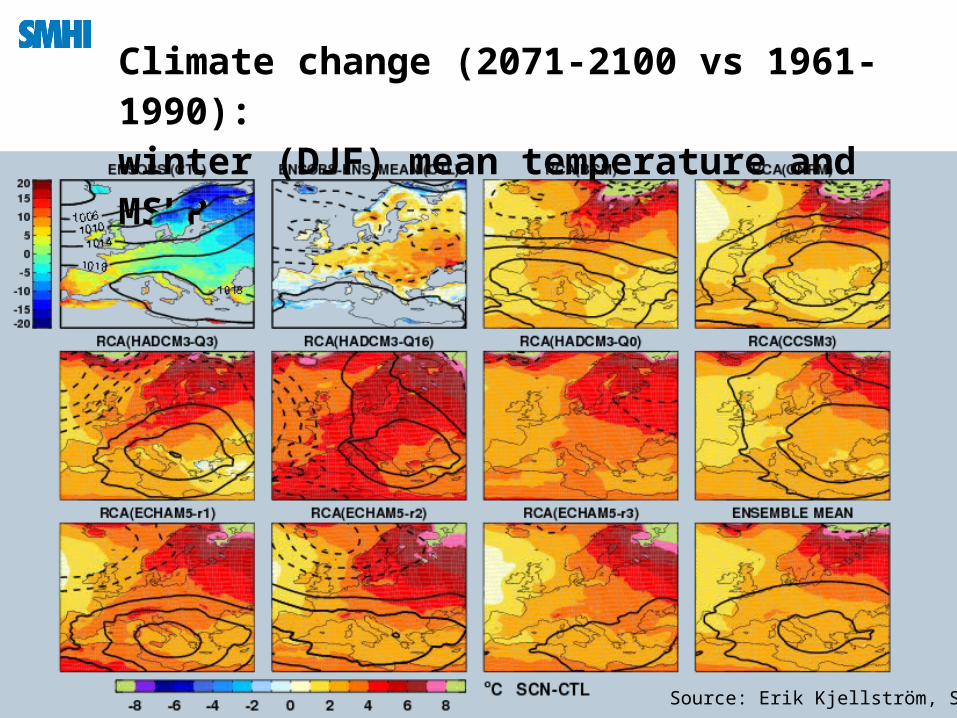
Climate change (2071-2100 vs 1961-1990): winter (DJF) mean temperature and MSLP
Source: Erik Kjellström, SMHI
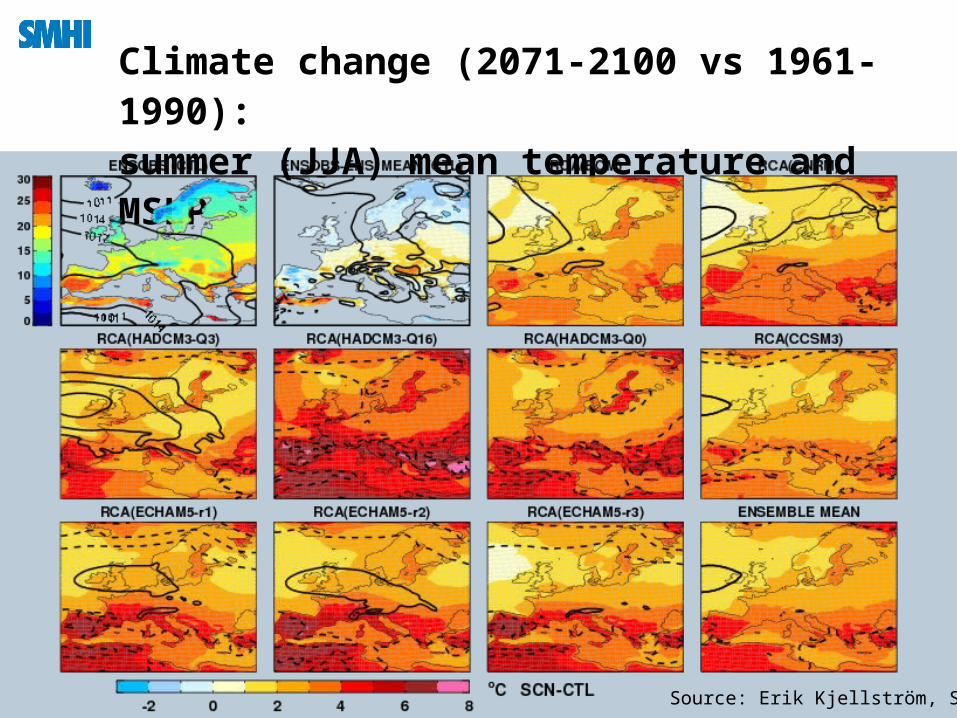
Climate change (2071-2100 vs 1961-1990): summer (JJA) mean temperature and MSLP
Source: Erik Kjellström, SMHI
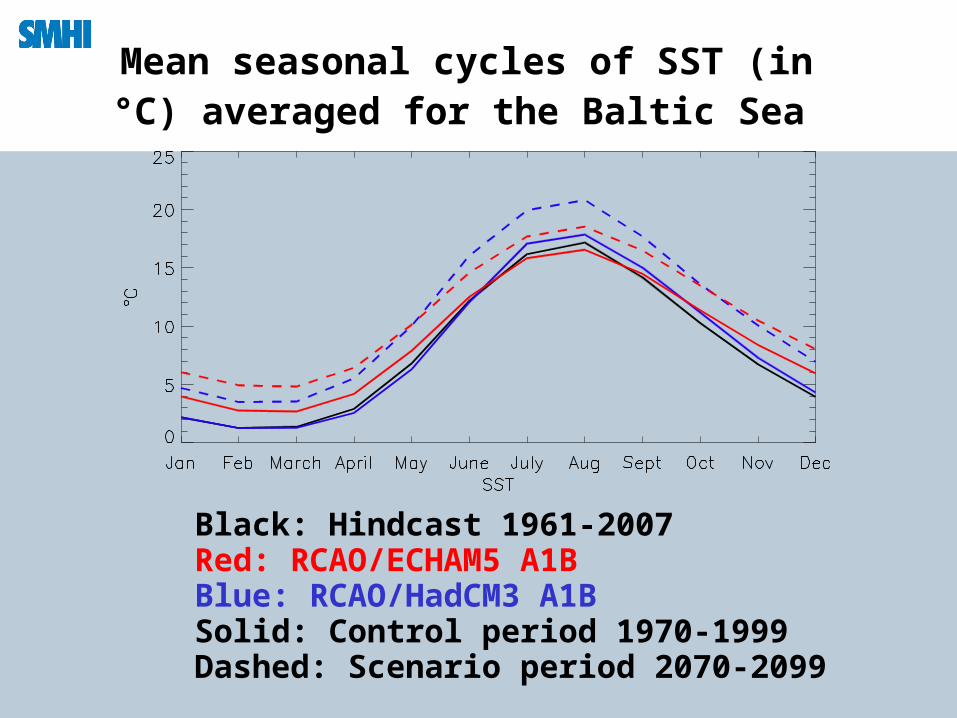
Mean seasonal cycles of SST (in °C) averaged for the Baltic Sea
Black: Hindcast 1961-2007Red: RCAO/ECHAM5 A1BBlue: RCAO/HadCM3 A1BSolid: Control period 1970-1999Dashed: Scenario period 2070-2099
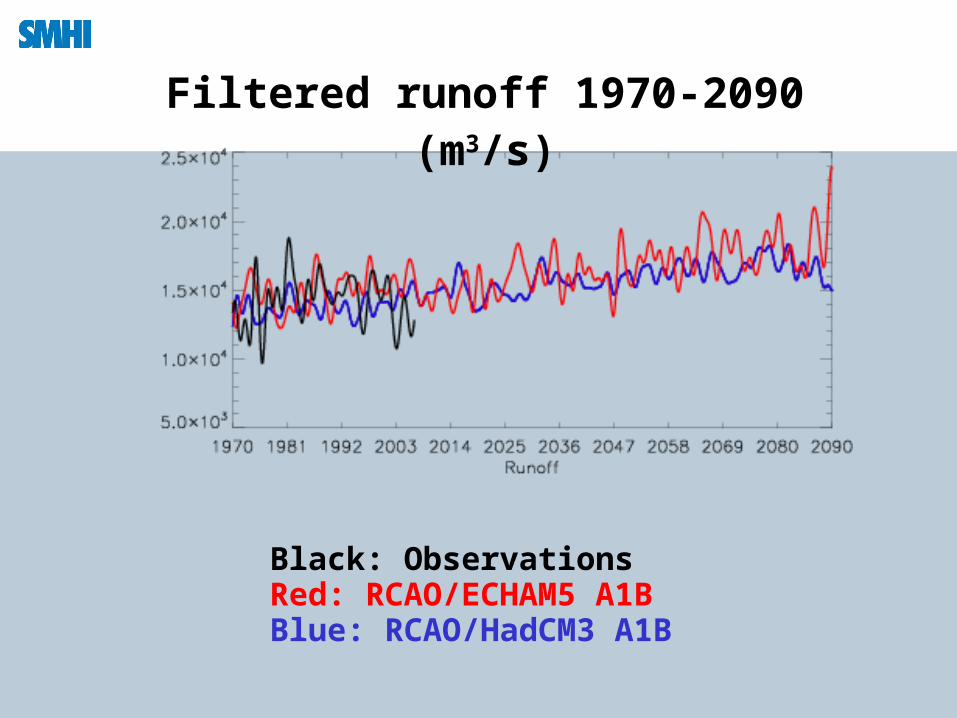
Filtered runoff 1970-2090 (m3/s)
Black: ObservationsRed: RCAO/ECHAM5 A1BBlue: RCAO/HadCM3 A1B
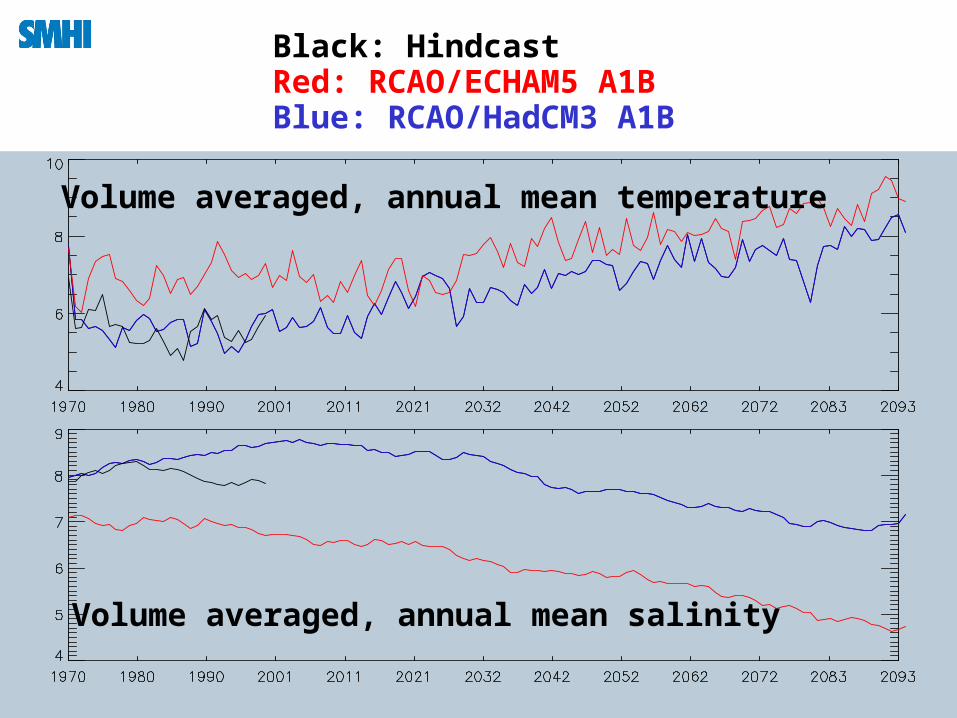
Volume averaged, annual mean temperature
Volume averaged, annual mean salinity
Black: HindcastRed: RCAO/ECHAM5 A1BBlue: RCAO/HadCM3 A1B
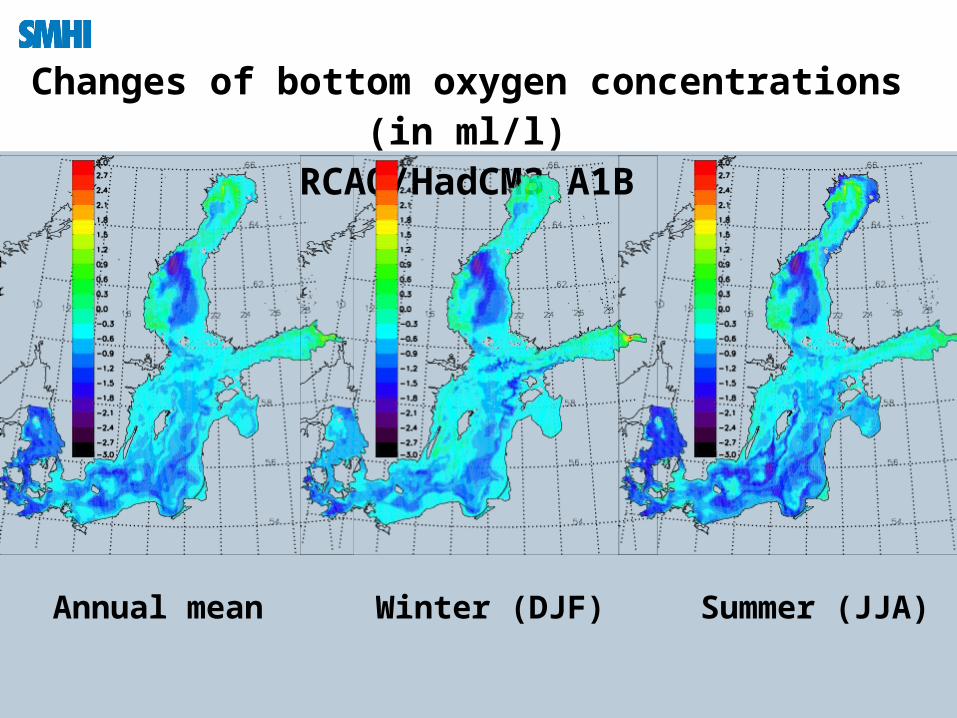
Changes of bottom oxygen concentrations (in ml/l)RCAO/HadCM3 A1B
Annual mean Winter (DJF) Summer (JJA)
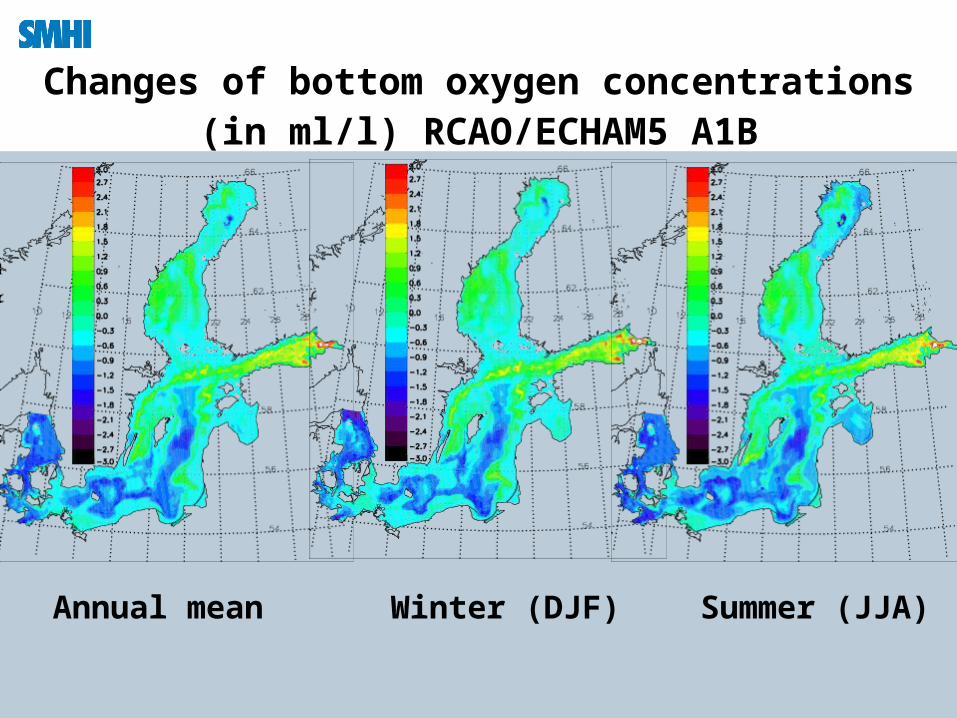
Annual mean Winter (DJF) Summer (JJA)
Changes of bottom oxygen concentrations (in ml/l) RCAO/ECHAM5 A1B
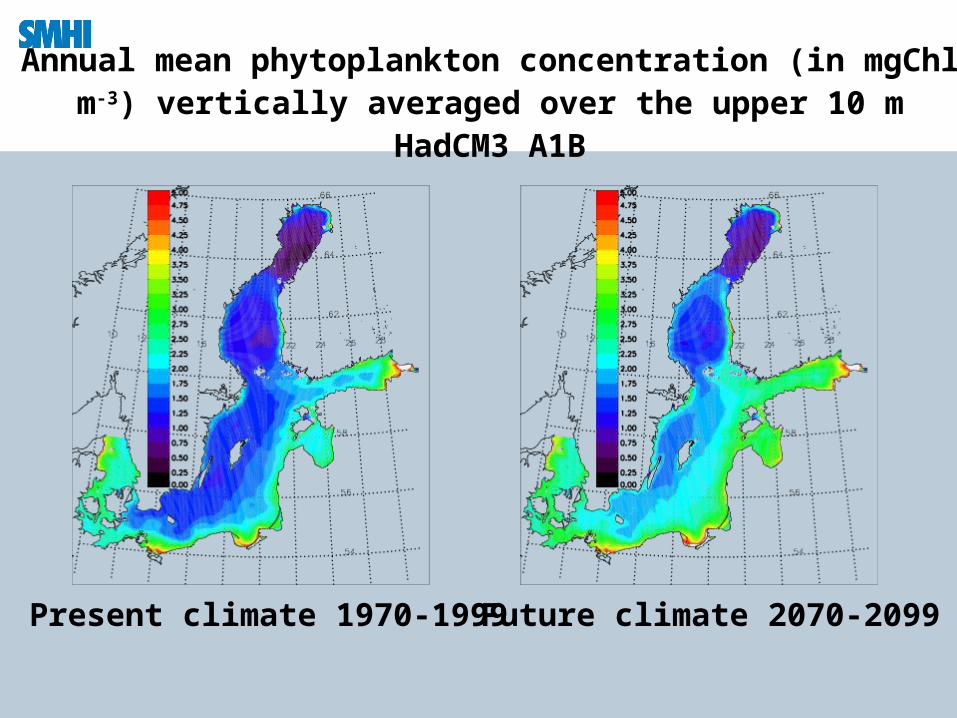
Annual mean phytoplankton concentration (in mgChl m-3) vertically averaged over the upper 10 m
HadCM3 A1B
Present climate 1970-1999 Future climate 2070-2099
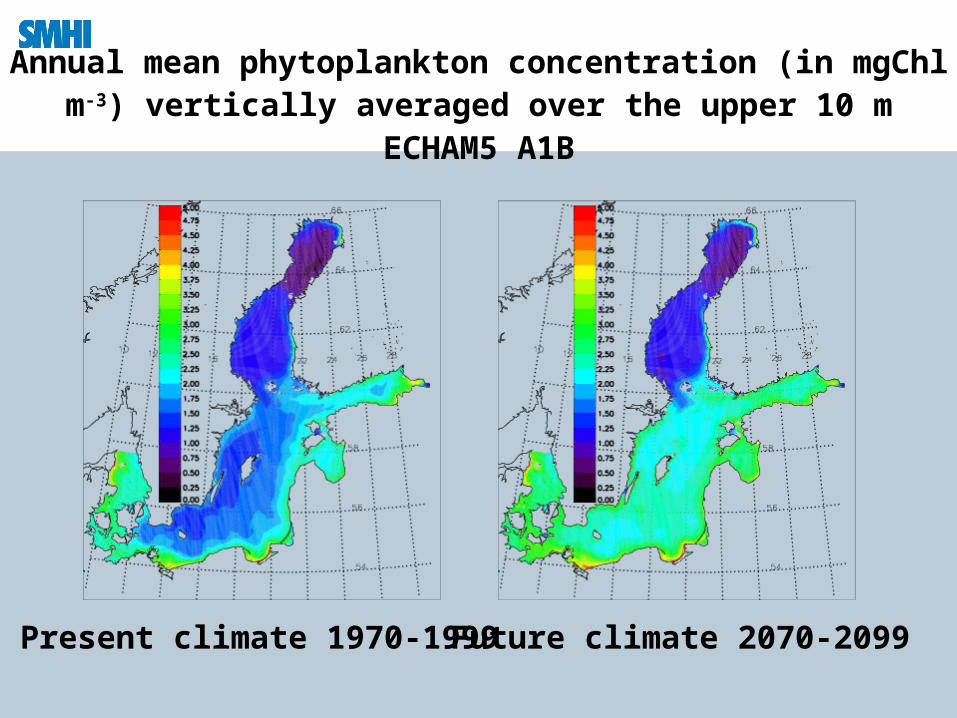
Annual mean phytoplankton concentration (in mgChl m-3) vertically averaged over the upper 10 m
ECHAM5 A1B
Present climate 1970-1999 Future climate 2070-2099
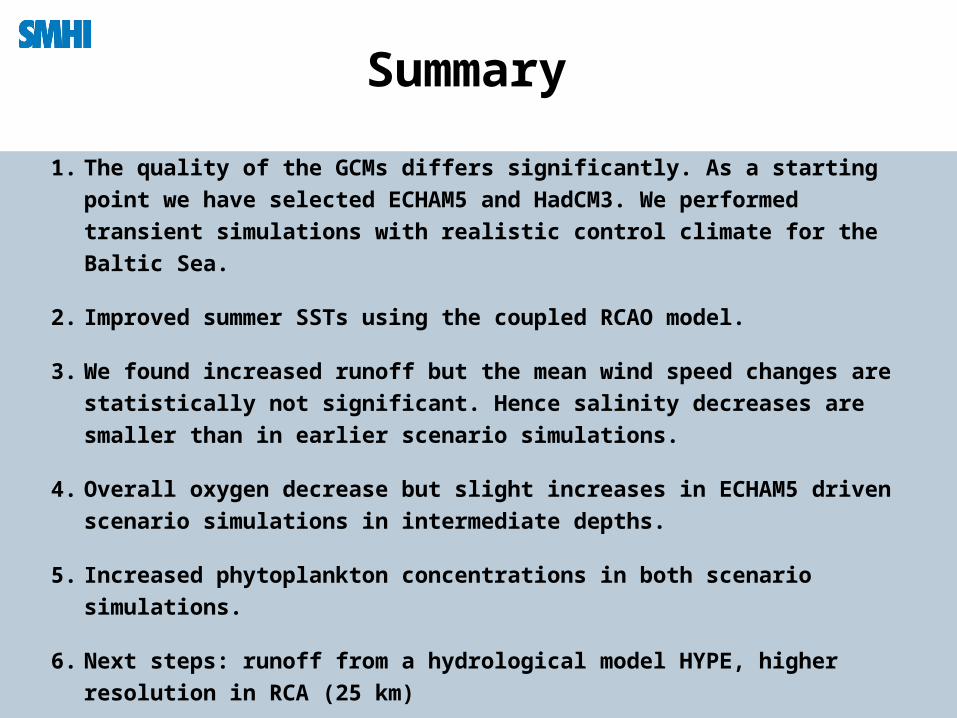
Summary
1. The quality of the GCMs differs significantly. As a starting point we have
selected ECHAM5 and HadCM3. We performed transient simulations with
realistic control climate for the Baltic Sea.
2. Improved summer SSTs using the coupled RCAO model.
3. We found increased runoff but the mean wind speed changes are
statistically not significant. Hence salinity decreases are smaller than in
earlier scenario simulations.
4. Overall oxygen decrease but slight increases in ECHAM5 driven scenario
simulations in intermediate depths.
5. Increased phytoplankton concentrations in both scenario simulations.
6. Next steps: runoff from a hydrological model HYPE, higher resolution in
RCA (25 km)
23-04-18
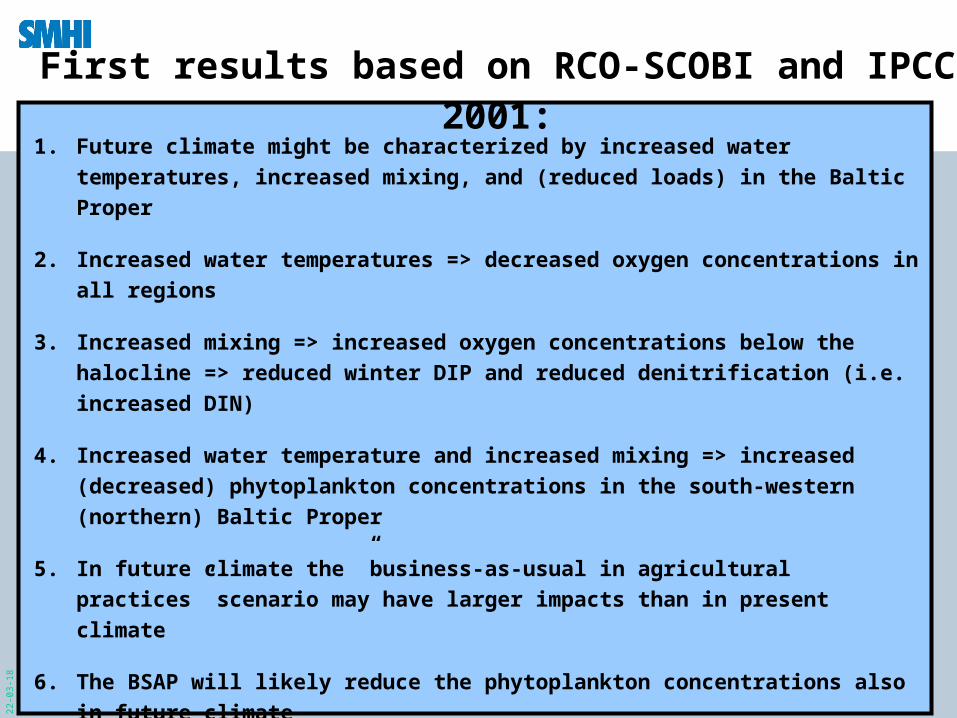
First results based on RCO-SCOBI and IPCC 2001:
1. Future climate might be characterized by increased water temperatures,
increased mixing, and (reduced loads) in the Baltic Proper
2. Increased water temperatures => decreased oxygen concentrations in all
regions
3. Increased mixing => increased oxygen concentrations below the halocline
=> reduced winter DIP and reduced denitrification (i.e. increased DIN)
4. Increased water temperature and increased mixing => increased
(decreased) phytoplankton concentrations in the south-western (northern)
Baltic Proper
5. In future climate the ”business-as-usual in agricultural practices” scenario
may have larger impacts than in present climate
6. The BSAP will likely reduce the phytoplankton concentrations also in
future climate